mesoscale convective systems observed during amma …. chem. phys., 11, 2503–2536, 2011...
TRANSCRIPT

Atmos. Chem. Phys., 11, 2503–2536, 2011www.atmos-chem-phys.net/11/2503/2011/doi:10.5194/acp-11-2503-2011© Author(s) 2011. CC Attribution 3.0 License.
AtmosphericChemistry
and Physics
Mesoscale convective systems observed during AMMA and theirimpact on the NOx and O3 budget over West Africa
H. Huntrieser1, H. Schlager1, M. Lichtenstern1, P. Stock1, T. Hamburger1, H. Holler1, K. Schmidt2, H.-D. Betz2,3,A. Ulanovsky4, and F. Ravegnani5
1Institut fur Physik der Atmosphare, Deutsches Zentrum fur Luft- und Raumfahrt (DLR), Oberpfaffenhofen, Germany2nowcast GmbH, Munchen, Germany3Physics Department, University of Munich, Germany4Central Aerological Observatory, Moscow, Russia5Institute of Atmospheric Sciences and Climate (CNR-ISAC), Bologna, Italy
Received: 12 August 2010 – Published in Atmos. Chem. Phys. Discuss.: 5 October 2010Revised: 23 February 2011 – Accepted: 7 March 2011 – Published: 17 March 2011
Abstract. During the “African Monsoon MultidisciplinaryAnalysis” (AMMA) field phase in August 2006, a variety ofmeasurements focusing on deep convection were performedover West Africa. The German research aircraftFalconbasedin Ouagadougou (Burkina Faso) investigated the chemicalcomposition in the outflow of large mesoscale convectivesystems (MCS). Here we analyse two different types of MCSoriginating north and south of the intertropical convergencezone (ITCZ,∼10◦ N), respectively. In addition to the air-borne trace gas measurements, stroke measurements fromthe Lightning Location Network (LINET), set up in NorthernBenin, are analysed. The main focus of the present study is(1) to analyse the trace gas composition (CO, O3, NO, NOx,NOy, and HCHO) in the convective outflow as a functionof distance from the convective core, (2) to investigate howdifferent trace gas compositions in the boundary layer (BL)and ambient air may influence the O3 concentration in theconvective outflow, and (3) to estimate the rate of lightning-produced nitrogen oxides per flash in selected thunderstormsand compare it to our previous results for the tropics. TheMCS outflow was probed at different altitudes (∼10–12 km)and distances from the convective core (<500 km). Trace gassignatures similar to the conditions in the MCS inflow regionwere observed in the outflow close to the convective core,due to efficient vertical transport. In the fresh MCS outflow,low O3 mixing ratios in the range of 35–40 nmol mol−1 were
Correspondence to:H. Huntrieser([email protected])
observed. Further downwind, O3 mixing ratios in the outflowrapidly increased with distance, due to mixing with the ambi-ent O3-rich air. After 2–3 h, O3 mixing ratios in the range of∼65 nmol mol−1 were observed in the aged outflow. Withinthe fresh MCS outflow, mean NOx (=NO+ NO2) mixingratios were in the range of∼0.3–0.4 nmol mol−1 (peaks∼1 nmol mol−1) and only slightly enhanced compared to thebackground. Both lightning-produced NOx (LNOx) and NOxtransported upward from the BL contributed about equally tothis enhancement. On the basis of Falcon measurements, themass flux of LNOx in the investigated MCS was estimatedto be∼100 g(N) s−1. The average stroke rate of the probedthunderstorms was 0.04–0.07 strokes s−1 (here only strokeswith peak currents≥10 kA contributing to LNOx were con-sidered). The LNOx mass flux and the stroke rate werecombined to estimate the LNOx production rate. For a bet-ter comparison with other published results, LNOx estimatesper LINET stroke were scaled to Lightning Imaging Sensor(LIS) flashes. The LNOx production rate per LIS flash wasestimated to 1.0 and 2.5 kg(N) for the MCS located southand north of the ITCZ, respectively. If we assume, that thesedifferent types of MCS are typical thunderstorms occurringglobally (LIS flash rate∼44 s−1), the annual global LNOxproduction rate was estimated to be∼1.4 and 3.5 Tg(N) a−1.
Published by Copernicus Publications on behalf of the European Geosciences Union.

2504 H. Huntrieser et al.: Mesoscale convective systems observed during AMMA
1 Introduction
Deep convection influences the chemical composition in theupper troposphere (UT) in many ways. Strong up- and down-drafts may redistribute trace gases within less than 1 h be-tween the boundary layer (BL) and the UT (Chatfield andCrutzen, 1984; Thompson et al., 1994). Furthermore, thenoninductive collisions between small and large ice parti-cles in the presence of supercooled liquid water may initi-ate lightning (Takahashi, 1978; Saunders et al., 1991). Inthe hot lightning channel, nitrogen oxide (NO) is one ofthe most prominent trace gases produced (Chameides et al.,1977; Bhetanabhotla et al., 1985). These processes signif-icantly contribute to change the composition of trace gasesin the UT. Within deep convective systems, polluted air-masses with enhanced NOx (=NO+ NO2) content can betransported upward from the BL and mix with airmasses pol-luted by lightning-produced NOx (LNOx) (Dickerson et al.,1987; Bertram et al., 2007). The main global source of NOxin the UT can be attributed to the latter source, exceedingalso the contributions from aircraft emissions and injectionsfrom the stratosphere. In a recent review article on LNOxby Schumann and Huntrieser (2007) (=SH07), the global ni-trogen production rate by lightning was given a most likelysource strength of 5±3 Tg(N) a−1.
In the presence of NOx, ozone (O3) may be producedby photochemical oxidation of hydrocarbons and carbonmonoxide (CO) (Crutzen, 1970; Fishman et al., 1979; Pick-ering et al., 1993; Jacob et al., 1996). In tropical regions,enhanced O3 production rates have been observed due tothe high solar irradiance (Thompson et al., 1997; Sauvageet al., 2005). Several model studies have investigated theoverall influence of convective transport on tropospheric O3and its precursors (Lelieveld and Crutzen, 1994; Lawrenceet al., 2003; Doherty et al., 2005). In tropical regions, theconvective uplift of O3-poor BL air tend to decrease the O3burden in the UT. Concurrently, the uplift and mixing of O3precursors may increase the O3 burden. Ozone plays an es-sential role in atmospheric chemistry since it determines theoxidizing capacity of the troposphere and acts as an impor-tant greenhouse gas. To achieve significant progress in themodelling of tropospheric ozone in the future, it is importantto better constrain the global and regional source strength ofLNOx emissions, especially in tropical regions (Martin et al.,2002). Recent observations and model results give some in-dications that values at the lower end of the range given bySH07 for the global LNOx source strength are more suitablefor certain tropical and maritime regions, whereas values inthe upper range are more suitable for subtropical and mid-latitude continental regions (Martin et al., 2006; Hudman etal., 2007; Huntrieser et al., 2009; Beirle et al., 2010; Bucselaet al., 2010; Jourdain et al., 2010; Ott et al., 2010). Fur-thermore, comprehensive model studies carried out by Tostet al. (2007) and Barret et al. (2010), on global as well asregional scales, show that large discrepancies between ob-
servations and simulations of lightning still exist. Due tothe important influence of NOx on the O3 production, es-pecially in tropical regions, further detailed investigations onLNOx in the tropics are needed, as stated recently by Bartheet al. (2010); Bucsela et al. (2010) and Ott et al. (2010).
It is known that most lightning is produced in the trop-ics (Christian et al., 2003; Zipser et al., 2006), howeveruntil recently measurements and quantifications of nitro-gen oxides in the fresh outflow of tropical deep convectionwere rare (e.g., Koike et al., 2007). In the last years, theDeutsches Zentrum fur Luft- und Raumfahrt (DLR) con-ducted (or participated in) several EU-funded airborne fieldexperiments in the tropics focusing on lightning-producedNOx, as the “Tropical Convection, Cirrus, and NitrogenOxides Experiment” (TROCCINOX) in Brazil in 2004 and2005, and “Stratospheric-Climate links with Emphasis on theUpper Troposphere and Lower Stratosphere” (SCOUT-O3)in Northern Australia in 2005 (Huntrieser et al., 2007, 2008,2009; Holler et al., 2009). Here we focus on the most recentone of these tropical field campaigns, the African MonsoonMultidisciplinary Analysis (AMMA) 2006 wet season exper-iment (Redelsperger et al., 2006). AMMA is an internationalresearch program that aims to improve our knowledge andunderstanding of the West African Monsoon (WAM), and in-vestigates its variability and influence on the regional waterresources. In the framework of AMMA, several multidisci-plinary field campaigns on multiscales were performed in thepast years (Lebel et al., 2009). These are the most detailedmeasurements of this kind ever performed in this region. Oneof the key issues was to investigate the largest mesoscale con-vective systems (MCS) (Houze, 1993, 2004) and their link-age to the WAM variability. The chemical composition of themiddle and upper troposphere connected to these deep con-vective events and their impact on the ozone budget and itsprecursors over West Africa was a further objective of inter-est (Ancellet et al., 2009; Bechara et al., 2010).
The DLR participated in the Special Operation Period inAugust 2006 (SOP-2a2), as reviewed by Reeves et al. (2010),and focused their measurements with the German DLRFal-con aircraft on atmospheric chemistry and aerosols in theUT. The main tasks of the DLR were to estimate (1) thechemical and aerosol composition in the outflow of deepconvection, and (2) the magnitude of NOx production bylightning in deep convection over West Africa. In this pa-per we focus on parts of these two tasks by analysing air-borne measurements in the fresh outflow (<12 h). Furtheranalyses of the aged outflow (>12 h) from deep convectionare in preparation (H. Schlager, DLR, personal communica-tion, 2010). The main focus of the present study is (1) toanalyse the trace gas composition (CO, O3, NO, NOx, NOy,and HCHO) in the convective outflow as a function of dis-tance from the convective core, (2) to investigate how differ-ent trace gas compositions in the BL and ambient air mayinfluence the O3 concentration in the convective outflow, and(3) to estimate the LNOx production rate per flash in selected
Atmos. Chem. Phys., 11, 2503–2536, 2011 www.atmos-chem-phys.net/11/2503/2011/

H. Huntrieser et al.: Mesoscale convective systems observed during AMMA 2505
thunderstorms and to compare it to our previous results forthe tropics. The measurements performed during AMMAare the first to our knowledge that investigate the NOx com-position in the outflow of West African MCS in more de-tail by airborne in situ measurements. Up to now, measure-ments over Africa from satellites and commercial airliners,e.g. within the framework of “Measurements of Ozone, watervapour, carbon monoxide and nitrogen oxides by in-serviceAirbus aircraft” (MOZAIC), have shown evidence of an im-portant NOx source from lightning in the UT (e.g., Richterand Burrows, 2002; Sauvage et al., 2005; Sioris et al., 2007).Over the tropical Atlantic and Africa a broad enhancementof 2–6×10¹⁴ molecules NO2 cm−2 has been observed fromspace and attributed to lightning (Martin et al., 2007).
In addition to theFalcon aircraft, we used the Rus-sian M55Geophysicaaircraft for trace gas measurementsabove the convective outflow in the tropical tropopause layer(=TTL, e.g., Highwood and Hoskins, 1998; Fueglistaler etal., 2009; Law et al., 2010). Both aircraft were based inOuagadougou (12.4◦ N, 1.5◦ W) in Burkina Faso during theAMMA SOP-2a2 experiment. Furthermore, the DLR light-ning location network (LINET) was set up in the neighbour-ing state Benin (centred around 10.0◦ N and 1.5◦ E). The setup of the airborne trace gas instrumentation and LINET wassimilar as during TROCCINOX and SCOUT-O3, see Sect. 2.The general meteorological situation during AMMA is de-scribed in more detail in Sect. 3, together with a flight sum-mary of two selected cases from 6 and 15 August 2006. InSect. 4 and in the Appendix A, the method used to analysethe measurements is introduced and discussed in more de-tail together with some results. The Falcon, Geophysica andLINET measurements are combined and scaled with Light-ning Imaging Sensor (LIS) measurements to estimate theLNOx production rate per LIS flash in the selected thunder-storms, andto estimate the global annualLNOx productionrate based on these different thunderstorms. The method,which combines the LNOx mass flux ratein the anvil out-flow and theLINET stroke rate, was already introduced anddescribed in a previous paper by Huntrieser et al. (2008)(=HH08). In Sect. 5, a discussion follows whether mixingwith the ambient air or O3 production changed the O3 com-position in the investigated MCS outflow. Finally, a synthesisof AMMA, SCOUT-O3 and TROCCINOX results concern-ing LNOx and recommendations for future LNOx parame-terisations are given in Sects. 6 and 7, respectively. Resultsfrom the present study are summarised in Sect. 8.
2 Data
2.1 The AMMA SOP-2a2 campaign
The AMMA project (http://amma-international.org/) was es-tablished on a French initiative, built by an internationalscientific group and supported by the European Commu-
nity (EC). The AMMA SOP-2a2 campaign, carried out from25 July to 31 August 2006, involved not only the GermanFalcon-20 and Russian M55Geophysicaresearch aircraftbased in Ouagadougou, but also the FrenchFalcon-20andATR-42aircraft, and the British Facility for Airborne Atmo-spheric Measurements (FAAM)BAe-146aircraft, all basedfurther northeast in Niamey (13.5◦ N, 2.1◦ E) in Niger (Mariet al., 2008; Ancellet et al., 2009; Saunois et al., 2009;Bechara et al., 2010; Law et al., 2010; Real et al., 2010;Reeves et al., 2010). Further downstream, in the Cape Verderegion off the coast of West Africa, the NASA-AMMA pro-gram (NAMMA) examined the interaction between AfricanEasterly waves (AEW) and the Saharan air layer (SAL) andtheir role in tropical cyclogenesis (Jenkins et al., 2008; Zipseret al, 2009; Cifelli et al., 2010). All of these measurementswere mainly performed in August, when the monsoon (wet)season is fully developed. This is the season when the occur-rence of large MCS is most prominent and provides most ofthe annual rainfall (80–90%) to the Sahel zone (10–18◦ N),located just south of the Sahara (Laurent et al., 1998; Lainget al., 1999; Mathon et al., 2002; Lebel et al., 2003; Zipser etal., 2006; Nieto Ferreira et al., 2009).
2.2 Airborne instrumentation on Falcon andGeophysica, and some trace gas characteristics
In the present study we analyse in situ trace gas measure-ments carried out by the GermanFalcon in the anvil outflowregion of MCS and by theGeophysicain the TTL above themain convective outflow. The airborne instrumentation usedfor this study and the accuracies are listed in Table 1 (seealso Andres-Hernandez et al., 2010). The measurements de-scribed below in the next subsections are used to investigatethe evolution of the trace gas composition in the anvil out-flow and to estimate the LNOx production rate in selectedthunderstorm systems in the course of this paper.
In the present study we mainly concentrate on measure-ments carried out with the Falcon up to∼12 km altitude. Theaircraft was equipped with instruments to measure HCHO(formaldehyde), CO, O3, NO and NOy mixing ratios and thephotolysis rateJ (NO2). The instrumentation has been usedduring several DLR field campaigns in the past (e.g., Baehret al., 2003; Huntrieser et al., 2005, 2007, 2009). All instru-ments (except HCHO) are capable of measuring at high tem-poral resolution (≤1 s) necessary for investigating the smallscale structures in the anvil outflow (Huntrieser et al., 1998,2002; Holler et al., 1999). The NO2 (and NOx) mixing ra-tios are calculated on the basis of the photostationary steadystate equation from the measurements of NO, O3, J (NO2),pressure and temperature (Volz-Thomas et al., 1996). Thetrace gases NO, NOx, and NOy were used to investigate boththe production by lightning and the convective transport fromthe BL. During the short timescales of convective transportfrom the BL to the UT, NOx is generally conserved but notNO or NO2 individually. The equilibrium between NO and
www.atmos-chem-phys.net/11/2503/2011/ Atmos. Chem. Phys., 11, 2503–2536, 2011

2506 H. Huntrieser et al.: Mesoscale convective systems observed during AMMA
Table 1. Airborne instrumentation during AMMA used for the present study.
Aircraft Species Technique Averaging Horizontal Accuracy Principal investigator(maximumaltitude,km)
time, s resolution, m
Falcon(12 km)
Wind (u, v, w)TemperatureHumidity
Rosemount flow angle sensorPT100/RosemountComposite of dewpoint mirror/ ca-pacitive sensor/Lyman Alpha ab-sorption instrument
111
∼200 1 m s−1 horizontal,0.3 m s−1 vertical0.5 K
Andreas Giez, DLR, Germany
O3 UV absorption 1 5% Hans Schlager, DLR, Germany
CO VUV fluorescence 1 10% Hans Schlager, DLR, Germany
NONOy
Chemiluminescence 11
±1 pmol mol−1
±5 pmol mol−1Hans Schlager, DLR, Germany
J (NO2) Filter radiometry 1 10% Hans Schlager, DLR, Germany
HCHO Hantzsch technique 60 15% Hans Schlager, DLR, Germany
Geophysica(20 km)
O3 FOZAN chemiluminescence 1 ∼150 ±10 nmol mol−1 F. Ravegnani, Consiglio Nazionaledelle Richerche (CNR), Bologna,Italy; A. Ulanovski, CAO, Russia
NO2 is shifted to more NO and less NO2 in the UT comparedto the BL, due to the stronger insolation in the UT. In theMCS outflow region, NO contributes to the major fractionof NOx with ∼90% and NO2 only contributes with∼10%.Compared to the BL, where the lifetime of NOx is very short(only a few hours), the lifetime in the UT increases to a valueof ∼2–3 days (Jacob et al., 1996). Furthermore, due to thehigh NOx mixing ratios in the MCS outflow compared to thebackground it is often possible to trace the MCS outflow fora period of a few days.
The most suitable of these tracers for BL transport is CO,with a lifetime of∼2–3 months in the troposphere (e.g., Xiaoet al., 2007). For fresh transport from the BL, O3, with a life-time in the order of days to months, and HCHO, with a shortlifetime of 5 h, can partly also be used as tracers (Arlanderet al., 1995; Stevenson et al., 2006). Our previous measure-ments in thunderstorms have shown that the mixing ratios oftracers in the mainoutflowregion can occasionally be in thesame range as measured at the top of the BL, which indicatesa very fast and undiluted vertical transport, a “mirroring” oftrace gas compositions (Huntrieser et al., 2002). The maininflow region was found to be located at the top of the BL.
In addition to the AMMA Falcon measurements, O3 mea-surements up to∼20 km altitude were obtained from thehigh-flying Geophysica aircraft (Stefanutti et al., 2004) andused as a general tracer to identify the convective outflowregion.
The Falcon aircraft probed the outflow from several, largeMCS in the Sahel zone in the vicinity of Burkina Faso. Datafrom the following MCS missions were selected for further
analyses: 1, 4, 6, 7, 11, 15, and 18 August 2006. (Duringthe transfer flights to/from Burkina Faso on 1 and 18 August,only the last/first part of the flights was considered.) Two ofthe selected flights were analysed in more detail. These werethe only flights with available LINET measurements; on 6August a huge MCS between Niamey and Ouagadougou wasprobed extensively, and on 15 August (b-flight, second flightof the day) a smaller MCS west of Benin was penetrated sev-eral times (see Sect. 3).
The two aircraft were equipped with standard meteoro-logical measurement systems to measure position, altitude,temperature, pressure, horizontal wind velocity and direc-tion. Further instruments on the Falcon measured the rela-tive humidity and the 3-dimensional wind vectors (u, v, w).All flight altitude values refer to pressure height and UTC(Universal Time Coordinated) time. Burkina Faso is locatedwithin the UTC time zone.
2.3 Meteorological, lightning, and satellite data
For meteorological analyses, wind and temperature fieldsbased on European Centre for Medium-Range Weather Fore-casts (ECMWF) data with a horizontal resolution of 1◦
×1◦
were used (see Sect. 3).For the observation of lightning, the six-sensors DLR
lightning location network LINET was installed in NorthernBenin, as described by Holler et al. (2009). This detectionsystem, operating in the very low frequency/low frequency(VLF/LF) (5–200 kHz) range, has been developed by theUniversity of Munich and described in detail by Betz etal. (2004, 2007, 2009), Schmidt et al. (2004, 2005) and
Atmos. Chem. Phys., 11, 2503–2536, 2011 www.atmos-chem-phys.net/11/2503/2011/

H. Huntrieser et al.: Mesoscale convective systems observed during AMMA 2507
Schmidt (2007). A brief description was recently given by usin HH08 and will therefore not be repeated here. Radiationemitted from both intra-cloud (IC) and cloud-to-ground (CG)sources (“strokes”) is detected and the IC emission height isdetermined. The lightning sensors were located within anarea extending from 9.0 to 10.3◦ N and from 1.1 to 2.7◦ E.The average distance to the next closest sensor was∼90 km.Peak currents down to 1–2 kA were measured within the in-ner region where the detection efficiency was highest; the so-called LINET centre area covering 9.5 to 10.5◦ N and 1.0 to2.0◦ E. However, a decreasing detection efficiency of strokeswith low peak currents (<10 kA) with increasing distancefrom the LINET detection centre has been observed (HH08;Holler et al., 2009). Therefore, for further studies comparingstroke characteristics in different thunderstorms (see Sect. 4)only strokes with peak currents exceeding 10 kA were con-sidered, as already discussed in HH08. In 2005, similarLINET arrays, as for AMMA, were set up in Brazil, Aus-tralia and Germany. Recently, the general characteristics ofdifferent thunderstorm systems in these three regions werecompiled and compared to West African systems (Holler etal., 2009). We also used data from the World Wide Light-ning Location Network, WWLLN (e.g. Lay et al., 2004)(http://wwlln.net), to complement the LINET data in a spe-cific case.
In addition, spaceborne measurements from LIS on boardthe Tropical Rainfall Measurement Mission (TRMM) satel-lite (Christian et al., 1999; Thomas et al., 2000; Boccip-pio et al., 2002; Christian and Petersen, 2005) were usedto estimate the total regional flash distribution (sum of CGand IC flashes) over the AMMA observation area. For anoverview of system characteristics seehttp://thunder.msfc.nasa.gov/lis/and a brief description was already given by usin HH08. Here LIS data for one overpass of 14 August 2006were compared with LINET data (see Sect. 4.5). Our LNOxestimates per LINET stroke were scaled to LNOx estimatesper LIS flash. Global LIS flash statistics can then be usedto provide an estimate of the global strength of the LNOxproduction rate.
The cloud development over West Africa was analysed byusing infrared (IR) images (see Sect. 3) from Meteosat Sec-ond Generation (MSG) operated by the European Organisa-tion for the Exploitation of Meteorological Satellites (EU-METSAT) (http://www.eumetsat.int/).
3 Observations during AMMA
3.1 General meteorological situation and brief chemicalcharacterisation
From July until mid August, the synoptic situation in theAMMA SOP-2a2 observation area was dominated by theWAM (Parker et al., 2005a; Nicholson, 2009). The WAMonset starts with an abrupt latitudinal shift of the intertrop-
ical convergence zone (ITCZ) from 5◦ to 10◦ N. A detailedmeteorological roadmap for the period of the AMMA fieldexperiment has been given by Janicot et al. (2008) and Cairoet al. (2010).
Due to the strong thermal gradient between the heatedtropical and subtropical mainland (heat low over the Sahara),and the cooler Gulf of Guinea and South Atlantic Ocean,a pronounced flow from the southwest develops. In August,this onshore monsoon flow reaches its northernmost extent(15–20◦ N) and displaces the Saharan Air Layer (SAL) at theground (Lebel et al., 2003). The confluence zone at the sur-face between this relatively cool, moist southwesterly flowand the hot, dry northeasterly flow from the Sahara (Har-mattan) is called the intertropical discontinuity (ITD) or in-tertropical front (ITF) (Thorncroft and Haile, 1995).
Along the upper transition zone between the monsoonlayer and the capping SAL, a pronounced thermal winddevelops due to the strong baroclinicity at 3–4 km (600–700 hPa). This midtropospheric jet is known as the AfricanEasterly Jet (AEJ) (Burpee, 1972; Thorncroft et al., 2003).In August, the jet core with 10–15 m s−1 is located south ofthe ITD at 10–15◦ N. The pronounced horizontal and verti-cal wind shear associated with this jet, as well as the merid-ional potential vorticity (PV) gradient are crucial parame-ters for the development and propagation of wave distur-bances at 3–4 km altitude (period 3–5 days), known as theAfrican Easterly Waves (AEW) (Burpee, 1972; Cifelli et al.,2010). Furthermore, the vertical shear of the AEJ is es-sential for the generation of organised long-lived MCS andsquall lines that form south of the ITD and propagate rapidly(>10 m s−1) westwards (Laing and Fritsch, 1993; Mathon etal., 2002). Only these large systems are energetic enough tobreak through the dry and hot SAL that inhibits convectionby capping the monsoon flow (Roca et al., 2005).
In addition to the AEJ, a further jet stream develops in theUT over West Africa in summer, when the ascending branchof the Hadley cell (ITCZ) is located north of the equator. Theupper level outflow moving southward to the equator, is inaddition enforced by the Coriolis force to move westward,forming the Tropical Easterly Jet (TEJ) (Nicholson, 2009).The jet core at∼13–14 km (∼150 hPa) with∼20 m s−1 is lo-cated around 5–10◦ N in August. Between the TEJ and AEJ(at ∼11◦ N in August) an extended core of strong ascent ispresent in the mid- and upper troposphere, which is associ-ated to the major rainbelt of the ITCZ generating long-livedMCS.
The large MCS in the Sahel zone are mainly orograph-ically triggered, preferable over the Jos Plateau in North-ern Nigeria (Hodges and Thorncroft, 1997; Laing et al.,2008). Many of the systems are well-organised and fallinto the category of mesoscale convective complexes (MCC)(Maddox, 1980). The cloud shields of these systems spreadvertically between 10 and 15 km altitude and horizontallyover 2–3× 10⁵ km2, and contain a large fraction of trail-ing stratiform precipitation in addition to the heavy rain in
www.atmos-chem-phys.net/11/2503/2011/ Atmos. Chem. Phys., 11, 2503–2536, 2011

2508 H. Huntrieser et al.: Mesoscale convective systems observed during AMMA
Discussion
Paper
|D
iscussionP
aper|
Discussion
Paper
|D
iscussionP
aper|
6 Aug. 200611:00 UTC
-10 0 10
1
Latit
ude
/°N
20
10
2
34
5
678
9-10 0 10Longitude /°E
Latit
ude
/°N
20
10
6 Aug. 200603:30 UTC
6 Aug. 200609:30 UTC
6 Aug. 200612:30 UTC
6 Aug. 200606:30 UTC
(a) (b)
(c) (d)
Fig. 1. Meteosat Second Generation (MSG) brightness temperatures over West Africa on 6August 2006 for 03:30 (a), 06:30 (b), 09:30 (c) and 12:30 UTC (d) (red 195 K, orange 210 K,yellow 225 K). Superimposed is the Falcon flight track from Ouagadougou in Burkina Faso(colour-coded according to UTC time). The position of the MSC during take-off is indicated in(c) and the position during landing in (d). Capital cities of Mali and Niger are indicated withblack dots (B=Bamako to the west, N=Niamey to the east)
74
Fig. 1. Meteosat Second Generation (MSG) brightness temperatures over West Africa on 6 August 2006 for 03:30(a), 06:30(b), 09:30(c)and 12:30 UTC(d) (red 195 K, orange 210 K, yellow 225 K). Superimposed is the Falcon flight track from Ouagadougou in Burkina Faso(colour-coded according to UTC time). The position of the MSC during take-off is indicated in(c) and the position during landing in(d).Capital cities of Mali and Niger are indicated with black dots (B= Bamako to the west, N= Niamey to the east).
the convective region. The lifting condensation level (LCL)is especially low during the monsoon season and located at∼0.5 km (Kollias et al., 2009). The average MCC lifetime isin the range of 12 h, however the largest sized systems maylast >24 h (Laing and Fritsch, 1993; Mathon and Laurent,2001). Global climatologies indicate that a major fractionof the MCS/MCC systems with extensive ice scattering de-velops over the Sahel zone, Central Africa, Argentina andSoutheastern United States (Mohr and Zipser, 1996; Laingand Fritsch, 1997; Houze, 2004).
The general chemical composition of the troposphere dur-ing AMMA has been summarised by Reeves et al. (2010).The average vertical profiles of O3 and CO exhibit “S” and“C”-shapes, respectively. Ozone mixing ratios are especiallylow in the BL due to photochemical destruction in the humid,monsoon influenced airmasses. Further southward between6◦ N and 12◦ N, also the rapid O3 deposition over forestedareas becomes more important. The rapid uplift of theseO3-poor BL airmasses in deep convection causes a second
O3 minimum in the UT (“S”-shape). Contrarily, O3 mix-ing ratios are frequently enhanced in the mid tropospheredue to intrusions of airmasses from the Southern Hemisphereimpacted by biomass burning and in addition photochemi-cal O3 production. CO mixing ratios are in comparison es-pecially high in the BL due to fresh urban pollution. Therapid uplift of these CO-rich BL airmasses in deep convec-tion causes a second CO maximum in the UT (“C”-shape).During AMMA, the convective uplift of trace gases was mostprominent between 12◦ N and 14◦ N, the region where largeMCS pass by. Large amounts of NOx, emitted from anthro-pogenic pollution and/or from soils in the Sahel zone by wet-ting from precipitation, may also reach the UT by transportwithin these MCS.
During convective uplift, the chemical composition in theUT is clearly influenced by the conditions in the BL and inaddition by the BL height (Sect. 2.2). Within the frame-work of AMMA, observations by Crumeyrolle et al. (2011)show that elevated BL heights in the range of∼1.5 km can
Atmos. Chem. Phys., 11, 2503–2536, 2011 www.atmos-chem-phys.net/11/2503/2011/

H. Huntrieser et al.: Mesoscale convective systems observed during AMMA 2509
Discussion
Paper
|D
iscussionP
aper
|D
iscussionP
aper|
Discussion
Paper
|
6 Aug. 200611:00 UTC
-10 0 10Longitude /°E
1
Latit
ude
/°N
20
10
2
34
5
678
9
Fig. 2. Meteosat Second Generation (MSG) brightness temperatures over West Africa on 6 Au-gust 2006 at 11:00 UTC (orange 210 K, yellow 225 K). Superimposed are the Falcon flight trackfrom Ouagadougou in Burkina Faso (colour-coded according to UTC time) and the sequenceswith elevated NO mixing ratios (≥0.3 nmol mol−1) labelled 1–9. Capital cities of Mali and Nigerare indicated with black dots (B=Bamako to the west, N=Niamey to the east). The white arrowindicates the direction of the storm motion and the yellow arrow the main wind direction in theanvil outflow (not scaled according to velocity).
75
Fig. 2. Meteosat Second Generation (MSG) brightness tempera-tures over West Africa on 6 August 2006 at 11:00 UTC (orange210 K, yellow 225 K). Superimposed are the Falcon flight trackfrom Ouagadougou in Burkina Faso (colour-coded according toUTC time) and the sequences with elevated NO mixing ratios(≥0.3 nmol mol−1) labelled 1–9. Capital cities of Mali and Nigerare indicated with black dots (B= Bamako to the west, N= Niameyto the east). The white arrow indicates the direction of the stormmotion and the yellow arrow the main wind direction in the anviloutflow (not scaled according to velocity).
be present slightly north of 10◦ N along the meridian fromNiamey to Cotonou. Towards the south, BL heights decreasewith decreasing latitude, due to the increasing fraction of for-est/shrub cover. South of 10◦ N, the top of the BL mainlyvaries between 1.0–1.2 km. These important differences inBL height will be discussed later in more detail.
3.2 Flight summary of 6 August 2006 and chemicalcomposition
On 6 August 2006, an extended, circular MCS passedNiamey from northeast in the early morning hours andproceeded rapidly southwestward (∼15 m s−1). The Oua-gadougou area was attained at noon. A series of MSG satel-lite images from 03:30–12:30 UTC indicates the temporaldevelopment of the convection before and during the missionflight (Fig. 1a–d). The Falcon flight track is superimposedin the satellite images. The aircraft started at 09:23 UTC inan easterly direction and first penetrated the southern part ofthe approaching MCS. Thereafter, the aircraft headed northalong the rear side of the MCS and finally it investigated thearea around the convective core with lightning. After pass-ing Niamey at∼08:30 UTC, the system was in a decayingstage and therefore easy to penetrate with the aircraft. Cloudtops reached up to∼13 km and the large MCS expanded ina north-south direction over∼500 km (12–17◦ N) and in aneast-west direction over∼300–400 km (around 0◦ E). Thesystem as a whole was investigated by the aircraft during
3.5 h. The main flight level was 10.0–11.6 km, well locatedwithin the main anvil outflow region (see Sect. 4.3). For moredetailed studies, single flight segments with enhanced NOmixing ratios compared to the background were selected. Inthese segments NO peak values exceeded 0.3 nmol mol−1,indicative of sources from lightning and/or from the BL. Onthe whole, 9 such flight segments were found, as indicated inFig. 2. Most of them were located at the edge of the MCS,however segment 5, 6, 8, and 9 were located closer to theconvective core.
In Fig. 3a–c, time series of trace gas measurements (NO,NOx, NOy, HCHO, CO, O3), and the wind velocity and di-rection are presented for the flight on 6 August. The Falconascent indicates that the AEJ was present in a layer between3 and 5 km, with wind velocities from the east up to 11–13 m s−1 controlling the proceeding of the MCS (Fig. 3a).ECMWF wind analyses indicate that the AEJ core (max.18 m s−1) was located slightly north of the MCS, between15–20◦ N and at pressure levels between 700 and 500 hPa(Fig. 4). Above 9 km (∼300 hPa) and south of 10–15◦ N,a pronounced TEJ (max. 30 m s−1) was present in the anal-yses. In agreement, elevated wind velocities from northeastin the range of 20–25 m s−1 were observed in the UT (∼9.5–11.5 km) just ahead of the MCS (Figs. 3a and 5b), indicatingthe presence of a strong outflow downwind of the MCS. Incontrast, on the rear (upwind) side of the MCS wind veloci-ties were low<5 m s−1, also mainly from the northeast. Inthis case, the prevailing easterly winds in the UT from theTEJ enhanced the outflow downwind of the MCS and re-duced the outflow on the upwind side, where mixing withthe ambient air already proceeded. According to ECMWFanalyses, this typical monsoon MCS was located within themain region with strong updrafts (rainbelt of the ITCZ) lo-cated just north of the TEJ and south of the AEJ, as describedin Sect. 3.1. The isothermes in Fig. 4 indicate that the heightof the cold point tropopause was located at 16 km.
For an overview of the chemical conditions in the MCSoutflow, the mean trace gas mixing ratios in the 9 selectedflight segments from 6 August are listed in Table 2a, togetherwith altitude, location and wind information. The distance tothe convective core was estimated from MSG satellite im-ages. The mean values of NO, NOy and the NO/NOy ratiowere 0.27, 0.87 nmol mol−1 and 0.30, respectively, indicativeof aged emissions. The mean CO, O3, and HCHO mixingratios were 102, 38, and 0.44 nmol mol−1, respectively, in-dicative of airmass transport from the top of the BL, as dis-cussed below. As discussed later in Sects. 4.2 and 5 in moredetail, the main MCS inflow region (=top of the BL) waslocated rather high on this day, at∼1.5 km altitude (see alsoSect. 2.2).
The NO mixing ratios were only slightly enhanced bya few tenth of nmol mol−1 in the selected flight segmentswithin the anvil outflow, compared to the background whichalready contained∼0.1–0.2 nmol mol−1 NO (Fig. 3b). Inall of the selected flight segments, rather similar mean NO
www.atmos-chem-phys.net/11/2503/2011/ Atmos. Chem. Phys., 11, 2503–2536, 2011

2510 H. Huntrieser et al.: Mesoscale convective systems observed during AMMA
Discussion
Pa
per|
Discussion
Paper
|D
iscussionP
aper|
Discussion
Paper
|
33000 35000 37000 39000 41000 43000 45000
win
d ve
loci
ty (
dire
ctio
n) /
m s
-1 (
0.1*
degr
ee)
0
10
20
30
NO
x m
ixin
g ra
tio /
nmol
mol
-1
0.0
0.5
1.0
1.5
F#2 060806
1 2 3 4 5 6 7 8 9
(a)
elapsed UTC time since midnight /s
33000 35000 37000 39000 41000 43000 45000
pres
sure
alti
tude
/km
0
2
4
6
8
10
12
14
16
18
NO
& N
Oy
mix
ing
rat
io /
nmo
l mol
-1
0.0
0.5
1.0
1.5
HC
HO
mix
ing
ra
tio /n
mo
l mo
l-1
0
1
2
3
(b)
1 2 3 4 5 6 7 8 9
F#2 060806
1 2 3 4 5 6 7 8 9
(c)
elapsed UTC time since midnight /s
33000 35000 37000 39000 41000 43000 45000
pres
sure
alti
tude
/km
0
2
4
6
8
10
12
14
16
18
CO
& O
3 m
ixin
g ra
tio /n
mo
l mo
l-1
0
40
80
120
160
NO
mix
ing
ra
tio /n
mo
l mo
l-1
0.0
0.5
1.0
1.5
Fig. 3. Time series of NOx, wind velocity and direction in (a), NO, NOy, HCHO, and pressurealtitude in (b), and NO, CO, O3, and pressure altitude in (c) for the Falcon flight on 6 August2006. Sequences with elevated NO mixing ratios (≥0.3 nmol mol−1) are labelled 1–9 in red.
76
Fig. 3. Time series of NOx, wind velocity and direction in(a), NO, NOy, HCHO, and pressure altitude in(b), and NO, CO, O3, and pressurealtitude in(c) for the Falcon flight on 6 August 2006. Sequences with elevated NO mixing ratios (≥0.3 nmol mol−1) are labelled 1–9 in red.
Fig. 4. ECMWF wind velocity and temperature (in K) analyses(vertical cross section foru-component) for 6 August 12:00 UTCalong 2◦ E.
mixing ratios were observed (range 0.21–0.36 nmol mol−1),with a tendency to higher values closer to the convectivecore. In flight segment 9, the highest mean NO mixingratio (0.36 nmol mol−1) and peak value (0.90 nmol mol−1)were observed. This flight segment was located close to theconvective core and it was the highest flight level (11.6 km)achieved within the MCS. The low ratios of NO to NOy(0.26–0.36) found in the selected flight segments in general,indicate that a large fraction of NO was already aged andnot produced by fresh lightning. Furthermore, a large frac-tion of the NOx enhancement in the anvil outflow probablycame from the BL, with NOx mixing ratios at the top of theBL (here∼1.5 km) in the range of∼0.15–0.20 nmol mol−1.In contrast, our results from the SCOUT-O3 campaign inDarwin in 2005 (Huntrieser et al., 2009) showed a strongcontribution from LNOx (≥90%) and only a minor contri-bution from the BL to the high mean NO mixing ratios(>2 nmol mol−1) observed in the outflow of a large MCSknown as Hector. Furthermore, the high ratio of NO to NOy(∼0.7–0.8) found in Hector indicates that NO was emittedrecently and most likely by lightning.
The HCHO mixing ratios during the flight on 6 Augustwere rather constant in the vicinity of the MCS, varying
Atmos. Chem. Phys., 11, 2503–2536, 2011 www.atmos-chem-phys.net/11/2503/2011/

H. Huntrieser et al.: Mesoscale convective systems observed during AMMA 2511
(a)(b) F#2 060806
wind velocity /m s-1
0 5 10 15 20 250
2
4
6
8
10
12
Falcon ascentFalcon descent
(c) F#2 060806
temperature /K
220 240 260 280 300 320
pre
ssu
re a
ltitu
de
/km
0
2
4
6
8
10
12
Falcon ascentFalcon descent
F#2 060806
(equivalent)-potential temperature /K
300 310 320 330 340 350 3600
2
4
6
8
10
12
Falcon ascent: ThetaFalcon descent: ThetaFalcon ascent: ThetaEFalcon descent: ThetaE
(d)
F#2 060806
CO /nmol mol-1
50 100 150 200 250
pres
sure
alti
tude
/km
0
2
4
6
8
10
12
O3 /nmol mol-1
0 10 20 30 40 50 60 70 80
NO & HCHO /nmol mol-10.0 0.5 1.0 1.5 2.0
COO3
NOHCHO
Fig. 5. Vertical profiles for CO, O3, HCHO, and NO(a), windvelocity(b), temperature(c), and (equivalent)-potential temperature(d) derived from Falcon measurements on 6 August 2006.
between∼0.4 and 0.5 nmol mol−1. The mixing ratios wererather independent of the distance to the convective core andonly slightly higher as the range∼0.3–0.4 nmol mol−1 ob-served in the ambient air (Fig. 3b). In contrast, mixing ra-tios were distinctly higher at the top of the BL, closer to thesources, and in the range of∼1.0–1.5 nmol mol−1. These ob-servations of only slightly enhanced HCHO mixing ratios inthe outflow also support the finding that the airmass transportfrom the BL to the UT was aged. HCHO is a very reactivetrace gas with a short lifetime of a few hours. Scavengingwithin the cloud further contributes to reduce HCHO mixingratios. Therefore, it is not expected to observe similar HCHOmixing ratios in the fresh MCS outflow as in the inflow re-gion (“mirror” effect, Sect. 2.2).
The CO mixing ratios observed within the MCSoutflow also show little variance (100± 5 nmol mol−1)(Fig. 3c). Slightly higher mixing ratios (peak values up to120 nmol mol−1) were observed close to the convective corebetween the flight segments 5 and 6, and 7 and 8, indicativeof direct transport from the MCS inflow region below, where
also mixing ratios in the range of 110–130 nmol mol−1 wereobserved. In contrast, slightly lower mixing ratios (down to90 nmol mol−1) were observed at the rear side of the MCSbetween flight segments 3 and 4, which is close to ambientmixing ratios.
In comparison to the other trace gases with strong sourcesin the BL, the O3 mixing ratios in the BL and within theMCS outflow were lower compared to the free troposphere(“S”-shaped vertical profile) and also showed little variancein the outflow region (∼40 nmol mol−1) (Fig. 3c). In flightsegments closer to the convective core, mean O3 mixing ra-tios reached down to 35 nmol mol−1. This value is how-ever not as low as the mixing ratios observed at the top ofthe BL (∼25 nmol mol−1), indicating that some mixing al-ready took place in the outflow. This observation agrees wellwith recent finding by Avery et al. (2010) in the convectiveoutflow of Central American thunderstorms during the TC4campaign. In a simple calculation taking the O3 productioninto account, their results indicate that mainly mixing withthe ambient air and not O3 production was responsible forthe O3 increase in the cloud outflow compared to the BL.Our AMMA-results for O3 are rather different to our obser-vations during SCOUT-O3, where a very efficient transportfrom the BL to the UT by deep convection was observed, ac-tually “mirroring” the O3-conditions in the BL (Huntrieser etal., 2009).
On the 6 August during AMMA, the highest O3 mixingratios were observed in the middle and upper troposphereoutside of convection and just below the main outflow re-gion. Within this ambient air, O3 mixing ratios reached val-ues between∼60–70 nmol mol−1), indicative of efficient O3production at these altitudes. This result is again very dif-ferent to the rather low O3 mixing ratios (∼40 nmol mol−1)observed within the same altitude range over Brazil duringTROCCINOX by Huntrieser et al. (2007) (=HH07), suggest-ing that West Africa has a much higher potential for O3 pro-duction in the middle and upper troposphere.
Besides the flight from 6 August, many other Falconflights focused on the trace gas composition in the monsoonMCS outflow (here only within≤500 km distance selected).These flights on 1(b), 4, 7, 11, 15(a) and 18 August willonly be discussed briefly (see Sect. 5), since rather similarbehaviour and mixing ratios as on 6 August were observed.From all of these flights, about 30 flight segments were se-lected, on the same basis as described before. The mean val-ues (±standard deviation) of NO, NOy and the NO/NOy ra-tio, carried out mainly in 10.3±1.0 km altitude range, were0.5±0.2, 1.3±0.5 nmol mol−1 and 0.35±0.05, respectively,indicative of aged emissions with some contribution fromlightning. The mean CO, O3, and HCHO mixing ratios were94±7, 48±5, and 0.46±0.11 nmol mol−1, respectively, in-dicative of aged airmass transport from the BL and subse-quent mixing with the ambient air.
The trace gas and wind regime signatures described aboveare also clearly visible in the vertical profiles (see Fig. 5a–d).
www.atmos-chem-phys.net/11/2503/2011/ Atmos. Chem. Phys., 11, 2503–2536, 2011

2512 H. Huntrieser et al.: Mesoscale convective systems observed during AMMA
Here also the temperature and equivalent-potential tempera-ture profiles have been added to give additional informationon the BL height. During the ascent, the monsoon layer withthe southwesterly flow (<6 m s−1) reached up to∼0.8 kmaltitude (Fig. 5b) and is also linked to an inversion layer(Fig. 5c and d). In the monsoon layer, the air was heavilypolluted and CO mixing ratios exceeded∼200 nmol mol−1,whereas O3 mixing ratios were very low (12–17 nmol mol−1)due to efficient O3 destruction mechanisms (Fig. 5a). Abovethe moist monsoon layer, a somewhat drier and cleaner tran-sition layer followed which reached up to∼1.4 km. Thenbetween 1.4 and 1.5 km (=top of the BL) the wind changedabruptly to northeasterly-easterly directions (Fig. 3a) and thedry SAL is prominent. The range given for the top of theBL is in accordance with the range given for BL heightsnorth of 10◦ N by Crumeyrolle et al. (2011), as discussedin Sect. 3.1. It seems that most of the air injected into theMCS originates from the bottom of the SAL at∼1.5 km(see further more detailed discussions in Sects. 4.2 and 5),since the SAL acts as a barrier to the polluted layers below(Sect. 3.1). The temperature at the lifting condensation levelwas calculated according to Bolton (1980) from the meantemperature and humidity values for the lowest 100 m layer(see also Huntrieser et al., 2007). The mean temperature(301 K) and relative humidity (66%) in this layer from theFalcon ascent and descent resulted in a lifting condensationlevel temperature of 292.5 K corresponding to a cloud baseheight of 1.4–1.5 km. Since also emissions from lightningwere not very prominent in this case, the NO/NOy ratio wasrather low indicating mainly aged emission transported fromthe top of the BL. The vertical profiles will be discussed inmore detail in Sect. 4.
3.3 Flight summary of 15 August 2006 and chemicalcomposition
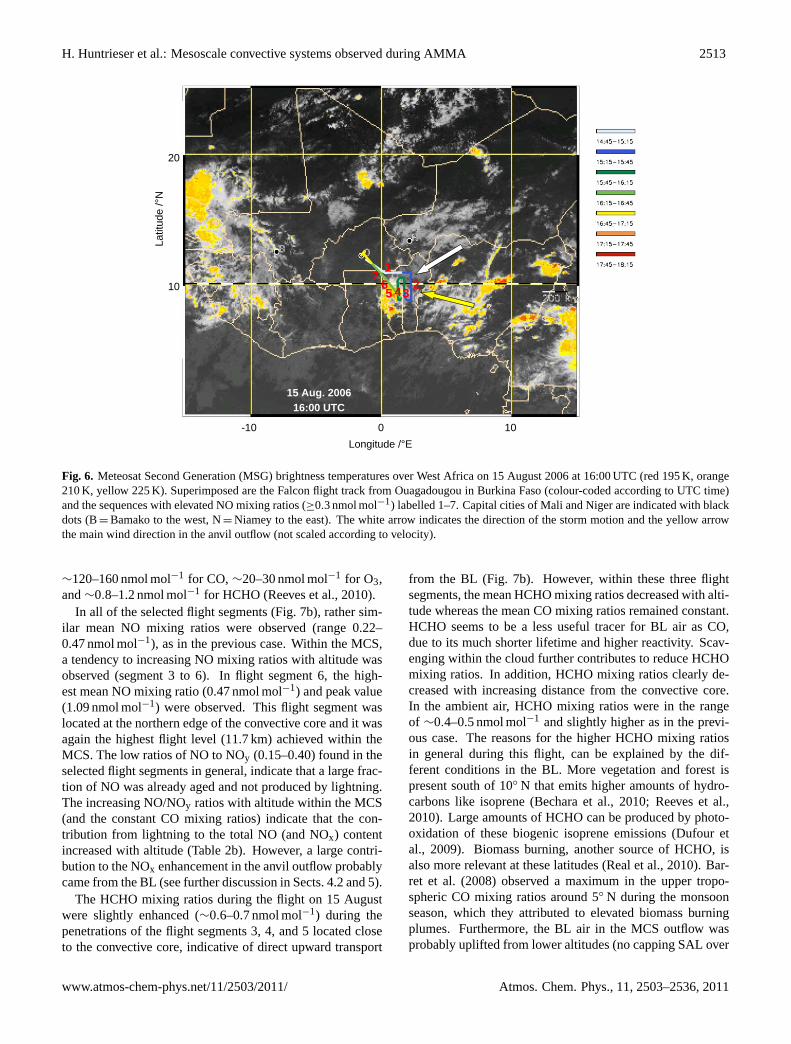
On 15 August 2006, two flights were performed with the Fal-con aircraft, however only the second one is discussed herein more detail (see Sect. 2.2). During this afternoon flight,a smaller MCS moving rapidly (∼18 m s−1) from Benin toTogo was investigated in detail (Fig. 6). The system origi-nated from a huge, circular MCS that passed over NorthernNigeria (∼11–14◦ N) already at midnight. Until 06:00 UTCthis system moved southwestward and almost dissipated.At 07:00 UTC, a new growing cell developed out of theremnants of this system and passed the border to Benin at09:00–10:00 UTC. This smaller MCS then proceeded southof 10◦ N, further equatorward than all other MCS investi-gated by the Falcon aircraft. In this region more vegetation ispresent, due to the vicinity to the equatorial, tropical rain for-est. The dimension of the MCS in north-south direction was∼150–250 km, in east-west direction∼50–100 km (around0◦ E) and cloud tops reached up to∼13 km. The main flightlevel was 10.1–11.9 km, again well located within the mainanvil outflow region (see Sect. 4.3).
The aircraft started at 14:37 UTC in a southeasterly direc-tion and first penetrated the northern edge of the MCS out-flow. Thereafter, the aircraft headed south along the rear sideof the MCS, approached the convective core from the back,performed some turns, and finally returned to Ouagadougouafter a short 2.5 h flight. For more detailed studies, singleflight segments with enhanced NO mixing ratios comparedto the background were selected, as described in the previ-ous case. On the whole, 7 such flight segments were found,as indicated in Fig. 6. Most of them were located at the edgeof the MCS, however segment 3, 4, and 5 were located closeto the convective core.
In Fig. 7a–c, time series of trace gas measurements (NO,NOx, NOy, HCHO, CO, O3), and the wind velocity and di-rection are presented for the flight on 15 August. The Fal-con ascent from Ouagadougou indicates that the AEJ wassomewhat more elevated on this day characterised by a meanwind velocity of 15 m s−1 in the layer between 3 and 6 km.The AEJ was especially pronounced at∼4.5 km altitude,with wind velocities from the east to northeast reaching upto 24 m s−1 (Fig. 7a). ECMWF wind analyses indicate thata strong AEJ core (max. 24 m s−1) was located slightly northof the MCS, between 10–15◦ N and at pressure levels be-tween 700 and 450 hPa (Fig. 8). Above 9 km (∼300 hPa)and between 5–10◦ N, no pronounced TEJ was present in theanalyses, as in the previous case. In accordance, wind ve-locities in the UT within the investigated MCS over Beninand Togo were in general lower compared to the first in-vestigated case from 6 August. The highest wind velocities(∼16 m s−1) were measured directly at the rear side of theMCS from easterly to southeasterly directions. The ambientair of the MCS came from the same direction, however thewind velocities were much lower and even reached down to∼5 m s−1. There are no indications of a nearby jet stream inthe UT in accordance with the decreasing monsoon activityafter mid August (see Sect. 3.1). The isothermes in Fig. 8indicate that the height of the cold point tropopause was lo-cated at 15.5–16 km.
For an overview of the chemical conditions in the MCSoutflow, the mean trace gas mixing ratios in the 7 selectedflight segments from 15 August are listed in Table 2b, to-gether with altitude, location and wind information. Over-all, the trace gas values were slightly higher compared tothe previous case discussed, indicative of stronger pollutiontransport from the BL. The mean values of NO, NOy and theNO/NOy ratio were 0.32, 1.03 nmol mol−1 and 0.32, respec-tively, indicative of aged emissions. The mean CO, O3, andHCHO mixing ratios were 125, 47, and 0.60 nmol mol−1,respectively, indicative of airmass transport from the BL,as discussed below and in Sects. 4.2 and 5 in more de-tail. Unfortunately, from this flight no information on thetrace gas composition in the BL directly below and ahead ofthe investigated MCS was available. However, from otherAMMA flights conducted by the BAe-146, it is known thatBL mixing ratios in this region (9–10◦ N) were in the range of
Atmos. Chem. Phys., 11, 2503–2536, 2011 www.atmos-chem-phys.net/11/2503/2011/
H. Huntrieser et al.: Mesoscale convective systems observed during AMMA 2513
Discussion
Paper
|D
iscussionP
aper|
Discussion
Paper
|D
iscussionP
aper|
15 Aug. 200616:00 UTC
-10 0 10Longitude /°E
1
20
10 2345
67
Latit
ude
/°N
Fig. 6. Meteosat Second Generation (MSG) brightness temperatures over West Africa on 15August 2006 at 16:00 UTC (red 195 K, orange 210 K, yellow 225 K). Superimposed are theFalcon flight track from Ouagadougou in Burkina Faso (colour-coded according to UTC time)and the sequences with elevated NO mixing ratios (≥0.3 nmol mol−1) labelled 1–7. Capitalcities of Mali and Niger are indicated with black dots (B=Bamako to the west, N=Niamey tothe east). The white arrow indicates the direction of the storm motion and the yellow arrow themain wind direction in the anvil outflow (not scaled according to velocity).
79
Fig. 6. Meteosat Second Generation (MSG) brightness temperatures over West Africa on 15 August 2006 at 16:00 UTC (red 195 K, orange210 K, yellow 225 K). Superimposed are the Falcon flight track from Ouagadougou in Burkina Faso (colour-coded according to UTC time)and the sequences with elevated NO mixing ratios (≥0.3 nmol mol−1) labelled 1–7. Capital cities of Mali and Niger are indicated with blackdots (B= Bamako to the west, N= Niamey to the east). The white arrow indicates the direction of the storm motion and the yellow arrowthe main wind direction in the anvil outflow (not scaled according to velocity).
∼120–160 nmol mol−1 for CO,∼20–30 nmol mol−1 for O3,and∼0.8–1.2 nmol mol−1 for HCHO (Reeves et al., 2010).
In all of the selected flight segments (Fig. 7b), rather sim-ilar mean NO mixing ratios were observed (range 0.22–0.47 nmol mol−1), as in the previous case. Within the MCS,a tendency to increasing NO mixing ratios with altitude wasobserved (segment 3 to 6). In flight segment 6, the high-est mean NO mixing ratio (0.47 nmol mol−1) and peak value(1.09 nmol mol−1) were observed. This flight segment waslocated at the northern edge of the convective core and it wasagain the highest flight level (11.7 km) achieved within theMCS. The low ratios of NO to NOy (0.15–0.40) found in theselected flight segments in general, indicate that a large frac-tion of NO was already aged and not produced by lightning.The increasing NO/NOy ratios with altitude within the MCS(and the constant CO mixing ratios) indicate that the con-tribution from lightning to the total NO (and NOx) contentincreased with altitude (Table 2b). However, a large contri-bution to the NOx enhancement in the anvil outflow probablycame from the BL (see further discussion in Sects. 4.2 and 5).
The HCHO mixing ratios during the flight on 15 Augustwere slightly enhanced (∼0.6–0.7 nmol mol−1) during thepenetrations of the flight segments 3, 4, and 5 located closeto the convective core, indicative of direct upward transport
from the BL (Fig. 7b). However, within these three flightsegments, the mean HCHO mixing ratios decreased with alti-tude whereas the mean CO mixing ratios remained constant.HCHO seems to be a less useful tracer for BL air as CO,due to its much shorter lifetime and higher reactivity. Scav-enging within the cloud further contributes to reduce HCHOmixing ratios. In addition, HCHO mixing ratios clearly de-creased with increasing distance from the convective core.In the ambient air, HCHO mixing ratios were in the rangeof ∼0.4–0.5 nmol mol−1 and slightly higher as in the previ-ous case. The reasons for the higher HCHO mixing ratiosin general during this flight, can be explained by the dif-ferent conditions in the BL. More vegetation and forest ispresent south of 10◦ N that emits higher amounts of hydro-carbons like isoprene (Bechara et al., 2010; Reeves et al.,2010). Large amounts of HCHO can be produced by photo-oxidation of these biogenic isoprene emissions (Dufour etal., 2009). Biomass burning, another source of HCHO, isalso more relevant at these latitudes (Real et al., 2010). Bar-ret et al. (2008) observed a maximum in the upper tropo-spheric CO mixing ratios around 5◦ N during the monsoonseason, which they attributed to elevated biomass burningplumes. Furthermore, the BL air in the MCS outflow wasprobably uplifted from lower altitudes (no capping SAL over
www.atmos-chem-phys.net/11/2503/2011/ Atmos. Chem. Phys., 11, 2503–2536, 2011

2514 H. Huntrieser et al.: Mesoscale convective systems observed during AMMA
Discussion
Paper
|D
iscussionP
aper|
Discussion
Paper
|D
iscussionP
aper|
53000 55000 57000 59000 61000
win
d ve
loci
ty (
dire
ctio
n) /
m s
-1 (
0.1*
degr
ee)
0
10
20
30
NO
x m
ixin
g ra
tio /
nmol
mo
l-1
0.0
0.5
1.0
1.5
F#7 150806b
1 2 3 4 5 6 7
(a)
elapsed UTC time since midnight /s
53000 55000 57000 59000 61000
pres
sure
alti
tude
/km
0
2
4
6
8
10
12
14
16
18
NO
& N
Oy
mix
ing
ratio
/n
mol
mol
-1
0.0
0.5
1.0
1.5
HC
HO
mix
ing
ra
tio /n
mo
l mo
l-1
0
1
2
3
(b)
1 2 3 4 5 6 7
F#7 150806b(c)
elapsed UTC time since midnight /s
53000 55000 57000 59000 61000
pres
sure
alti
tude
/km
0
2
4
6
8
10
12
14
16
18
CO
& O
3 m
ixin
g ra
tio /n
mo
l mol
-1
0
40
80
120
160
NO
mix
ing
ra
tio /n
mo
l mo
l-1
0.0
0.5
1.0
1.5
1 2 3 4 5 6 7
Fig. 7. Time series of NOx, wind velocity and direction in (a), NO, NOy, HCHO, and pressurealtitude in (b), and NO, CO, O3, and pressure altitude in (c) for the Falcon flight on 15 August2006. Sequences with elevated NO mixing ratios (≥0.3 nmol mol−1) are labelled 1–7 in red.
80
Fig. 7. Time series of NOx, wind velocity and direction in(a), NO, NOy, HCHO, and pressure altitude in(b), and NO, CO, O3, and pressurealtitude in(c) for the Falcon flight on 15 August 2006. Sequences with elevated NO mixing ratios (≥0.3 nmol mol−1) are labelled 1–7 inred.
Fig. 8. ECMWF wind velocity and temperature (in K) analyses(vertical cross section foru-component) for 15 August 18:00 UTCalong 1◦ E.
Benin-Togo) compared to the previous case and therefore itwas more strongly polluted (see below).
The CO mixing ratios observed within the MCS outflowon 15 August were distinctly enhanced, indicative of a largeramount of fresh emissions transported from the BL, com-pared to the previous case (Fig. 7c), see also detailed dis-cussions in Sect. 5. The highest mean mixing ratios wereobserved close to the convective core (∼135 nmol mol−1),whereas mixing ratios clearly decreased with increasing dis-tance from the convective core. At a distance of 100–150 kmfrom the core in northerly directions, the CO mixing ratioswere close to ambient mixing ratios observed north of 10◦ N.
In comparison to the previous case from 6 August, withonly slightly changing O3 mixing ratios in the anvil outflowregion, the O3 mixing ratios on 15 August showed a muchstronger tendency to increasing values with increasing dis-tance from the convective core (Fig. 7c, Table 2b). In flightsegments close to the convective core, mean O3 mixing ra-tios reached down to 34 nmol mol−1, which is however sim-ilar as in the previous case. During take-off and landingin Ouagadougou on 15 August, O3 and CO mixing ratioswithin a similar range (∼30–35 and∼120–160 nmol mol−1,
Atmos. Chem. Phys., 11, 2503–2536, 2011 www.atmos-chem-phys.net/11/2503/2011/

H. Huntrieser et al.: Mesoscale convective systems observed during AMMA 2515
respectively) were observed at the top of the BL, as in thefresh MCS outflow. In this case it is not known how rep-resentative these BL conditions are for the actual conditionsin the MCS inflow region south of 10◦ N over Benin-Togo,however these values agree rather well with the mixing ra-tios observed by the BAe-146 in the BL below 900 hPa, asgiven previously in this section (Reeves et al., 2010).
Within the three flight segments close to the convectivecore, rather constant CO and O3 mean mixing ratios were ob-served, 134–135 and 34–38 nmol mol−1, respectively, evenas the aircraft stepwise climbed from 10.1 to 11.3 km. Theseobservations are indicative of a rather undiluted transport oftrace gases from the top of the BL in these flight segments.At the northern edge of the MCS (flight segment 6), themean CO mixing ratio in the outflow was still unchangedwith 136 nmol mol−1, however the mean O3 mixing ratiosuddenly increased to 45 nmol mol−1. Rapid mixing withthe ambient CO- and O3-rich air (impacted by aged biomassburning plumes) probably caused this rapid O3 increase.About ∼50–100 km further upwind in flight segment 2, themean O3 mixing ratio even increased to 55 nmol mol−1. Onthe other hand, the mean CO mixing ratio slightly decreaseddown to 126 nmol mol−1, indicating further mixing with theambient air. Further away from the convective core, about100–150 km to the north, mixing with the ambient air con-tinued in flight segments 1 and 7 and the mean mixing ra-tios of O3 increased to 64 nmol mol−1 and of CO decreasedto 96 nmol mol−1. At this stage, the outflow mixed withthe ambient air located north of 10◦ N, which contained lessCO compared to further south (influenced by biomass burn-ing plumes). According to the velocity in the MCS out-flow, it takes at least 2–3 h for the MCS-processed airmassto reach this region. At this point, the airmass was alreadywell mixed, and O3 and CO mixing ratios reached ambientconditions in the UT north of 10◦ N, which were in the rangeof 60–70 and 80–100 nmol mol−1, respectively.
The trace gas and wind regime signatures described aboveare also clearly visible in the vertical profiles (see Fig. 9a–d). In addition, the temperature and equivalent-potential tem-perature profiles have been added that give information onthe BL height. During the ascent close to Ouagadougou,the monsoon layer with the southwesterly flow (<7 m s−1)reached up to∼1.2 km altitude (Fig. 9b) and was also linkedto an inversion layer (Fig. 9c–d), as in the previous case.In the monsoon layer, the air was heavily polluted and COmixing ratios exceeded∼200 nmol mol−1, whereas O3 mix-ing ratios were rather low (30–35 nmol mol−1), due to effi-cient O3 destruction mechanisms (Fig. 9a). Above the moistmonsoon layer, a somewhat drier and cleaner transition layerfollowed which reached up to∼1.9 km. Above 2.0 km thewind changed to northeasterly-easterly directions and the drySAL is prominent. It seems that most of the air injected intothe MCS over Benin-Togo originated directly from the heav-ily polluted monsoon layer, since the SAL is less prominentsouth of 10◦ N. We assume, based on the measurements car-
(a)(b) F#7 150806b
wind velocity /m s-1
0 5 10 15 20 250
2
4
6
8
10
12
Falcon ascentFalcon descent
(c) F#7 150806b
temperature /K
220 240 260 280 300 320
pre
ssu
re a
ltitu
de
/km
0
2
4
6
8
10
12
Falcon ascentFalcon descent
F#7 150806b
(equivalent)-potential temperature /K
300 310 320 330 340 350 3600
2
4
6
8
10
12
Falcon ascent: ThetaFalcon descent: ThetaFalcon ascent: ThetaEFalcon descent: ThetaE
(d)
F#7 150806b
CO /nmol mol-1
50 100 150 200 250
pres
sure
alti
tude
/km
0
2
4
6
8
10
12
O3 /nmol mol-1
0 10 20 30 40 50 60 70 80
NO & HCHO /nmol mol-10.0 0.5 1.0 1.5 2.0
COO3
NOHCHO
Fig. 9. Vertical profiles for CO, O3, HCHO, and NO(a), windvelocity(b), temperature(c), and (equivalent)-potential temperature(d) derived from Falcon measurements on 15 August 2006.
ried out close to Ouagadougou and from O3/CO correlationsdiscussed in Sect. 5, that the top of the BL in the Benin-Togoarea was located between∼0.8–1.2 km (Fig. 9a–d). Thisrange is in accordance with the range given for BL heightssouth of 10◦ N by Crumeyrolle et al. (2011), as discussed inSect. 3.1. The higher amount of O3 precursors in the MCSoutflow on 15 August, may promote the production of O3 ina later stage. This important issue will be discussed in moredetail in Sect. 5.
3.4 Spatial and temporal LINET stroke distributions
3.4.1 Case 6 August 2006
On 6 August 2006, the extended monsoon MCS betweenOuagadougou and Niamey was located along the northernperiphery of the LINET lightning location network, howeverjust within the range of coverage for stroke detection. Un-fortunately, the power supply of the LINET sensors was outof order in the morning of the 6 August. After 11:03 UTC,
www.atmos-chem-phys.net/11/2503/2011/ Atmos. Chem. Phys., 11, 2503–2536, 2011

2516 H. Huntrieser et al.: Mesoscale convective systems observed during AMMA
Table 2. Trace gas measurements in the anvil outflow of the MCS investigated on 6 and 15 August 2006.
Flight, Entry and exit Pressure Distance Wind Mean anvil Mean anvil NO/NOy Mean anvil Mean anvil Mean anvilanvil time (UTC), s altitude, from deep direction NO mixing NOy mixing CO mixing O3 mixing HCHO mixingpenetration km convective ratio, ratio, ratio, ratio, ratio,and field region, km nmol mol−1 nmol mol−1 nmol mol−1 nmol mol−1 nmol mol−1
experiment
(a)
060806aP1 AMMA 36 041–36 246 10.0 edge MCS NE 0.26 0.94 0.27 103 37 –060806aP2 36 853–37 157 10.1 edge MCS NE 0.23 0.72 0.31 102 36 0.50060806aP3 (<)37 468-(>)38 030 10.1 edge MCS E 0.26 0.78 0.31 98 42 0.49060806aP4 38 669-(>)38 870 10.7 edge MCS NE-E 0.24 0.89 0.27 94 47 0.45060806aP5 39 359–40 198 10.7 inside MCS NE-E 0.30 0.91 0.32 102 39 0.47060806aP6 40 236–40 465 10.7 inside MCS NE 0.28 0.94 0.29 105 36 0.45060806aP7 41 351–41 687 11.3 edge MCS NE 0.21 0.79 0.26 104 35 0.41060806aP8 41 822–42 230 11.3 inside MCS NE 0.25 0.86 0.28 109 35 0.41060806aP9 (<)42 508–43 452 11.6 inside MCS E 0.36 0.99 0.36 102 39 0.38mean 0.27 0.87 0.30 102 38 0.44
(b)
150806bP1 AMMA 53 945-(>)54 111 9.5 100–150 E-SE 0.23 1.58 0.15 96 64 0.54150806bP2 55 260-(>)55 786 10.1 50–100 E-SE 0.37 1.26 0.28 126 55 –150806bP3 56 620–56 740 10.1 inside MCS E 0.22 0.69 0.31 135 36 0.73150806bP4 57 959–58 094 10.7 inside MCS E-SE 0.26 0.70 0.36 134 38 0.67150806bP5 58 671–58 871 11.3 inside MCS E-SE 0.29 0.74 0.38 135 34 0.64150806bP6 58 998-(>)59 149 11.7 edge MCS E 0.47 1.15 0.40 136 45 0.58150806bP7 (<)59 487–59 877 11.7 ∼100 E 0.40 1.07 0.38 110 60 0.47mean 0.32 1.03 0.32 125 47 0.60
the system was operating normally again. At this time theaircraft just entered flight segment 5 close to the convectivecore. The spatial distribution of all LINET strokes with peakcurrents≥1 kA between 11:03 and 15:00 UTC (black dots)is shown in Fig. 10a together with the Falcon flight track andmeasured NO mixing ratios (coloured). The selected flightsegments are labelled as before. Since the MCS was locatedfar away from the LINET sensors, as indicated in Fig. 10a,the detection efficiency of the network for low peak currentswas reduced and only strokes with peak currents above 5 kAwere registered within the MCS (superimposed as coloureddots). From Fig. 10a it is obvious that the strokes originatedalong a line perpendicular to the wind direction from north-east. This type of organised systems is known as squall linemesoscale convective systems (SLMCS) (Rickenbach et al.,2009). The confluence of the monsoon layer and SAL, andthe resulting AEJ provides the necessary low level shear forthe initiation and maintenance of these squall lines (Rowelland Milford, 1993). Figure 10a also indicates that the high-est frequency of elevated NO mixing ratios along the flighttrack is observed close to the convective core with lightningand directly behind it. The temporal evolution of the strokes,indicated within the SLMCS in colour, shows a rather slowmovement southwestward (6–7 m s−1) since the system wasin a decaying stage.
A time series of LINET stroke rates for this case is pre-sented in Fig. 11a. For an adequate comparison of the strokerates in different storms, it was necessary to restrict compar-
isons to higher stroke peak currents (≥10 kA). These wereobserved with about the same detection efficiency, indepen-dent of their location within the LINET network, as dis-cussed in HH08 and in Huntrieser et al. (2009) (=HH09).The SLMCS of 6 August was mainly in a lightning decay-ing stage during the aircraft passage and stroke rates werelow but rather constant. The highest stroke rates within theSLMCS were observed around 11:25–11:30 UTC (betweenflight segment 6 and 7) and around 12:40–12:45 UTC with24 strokes (≥10 kA) per 5 min in both cases. This valueis very low compared to our previous observations in othertropical regions. For comparison, the highest stroke rates ob-served during TROCCINOX in a subtropical and in tropicalthunderstorms (HH08) were∼80 and 40 strokes per 5 min,respectively. During SCOUT-O3, even stroke rates up to al-most 400 strokes per 5 min were observed in Hector (HH09).
3.4.2 Case 15 August 2006
On 15 August 2006, the MCS between Benin and Togo waslocated within the centre of the LINET lightning locationnetwork with the highest detection efficiency. The spatialdistribution of all LINET strokes with peak currents≥1 kAbetween 11:00 and 18:00 UTC (black and coloured dots) isshown in Fig. 10b together with the Falcon flight track andmeasured NO mixing ratios (coloured). The selected flightsegments are labelled as before.
Atmos. Chem. Phys., 11, 2503–2536, 2011 www.atmos-chem-phys.net/11/2503/2011/

H. Huntrieser et al.: Mesoscale convective systems observed during AMMA 2517D
iscussionP
aper
|D
iscussionP
aper|
Discussion
Pa
per|
Discussion
Paper
|
LINET stroke distribution - 060806 - Burkina Faso MCS
Longitude /°E-4 -2 0 2 4 6 8
Latit
ude
/°N
9
11
13
15
17
all LINET strokes:11:03-15:00 UTCstrokes 11:03-11:20 UTC11:20-11:40 11:40-12:0012:00-12:2012:20-12:4012:40-13:0013:00-13:20 Falcon flight path0< NO <0.05 nmol mol-1
0.05<= NO <0.100.10<= NO <0.150.15<= NO <0.200.20<= NO <0.250.25<= NO <0.300.30<= NOLINET sensors
(a)
17 6
8
53
4
2
9
LINET stroke distribution - 150806 - Benin/Togo MCS
Longitude /°E-2 0 2 4 6 8 10
Latit
ude
/°N
6
8
10
12
14
all LINET strokes:11:00-18:00 UTCstrokes 11:00-12:00 UTC12:00-13:0013:00-14:00 14:00-15:0015:00-16:0016:00-17:0017:00-18:00 Falcon flight path0< NO <0.05 nmol mol-1
0.05<= NO <0.100.10<= NO <0.150.15<= NO <0.200.20<= NO <0.250.25<= NO <0.300.30<= NOLINET sensors
(b)
1
76
5 34
2
Fig. 10. Spatial and temporal LINET stroke distribution on 6 August 2006 at 11:03–15:00 UTC(a) and on 15 August 2006 at 11:00–18:00 UTC (b) (upper colour scale: only selected thunder-storm system). On 6 August, LINET data were not available before 11:03 UTC. The observedNO mixing ratio along the Falcon flight path is superimposed (lower colour scale). Sequenceswith enhanced NO mixing ratios were observed within the MCS outflow (labelled in red). Thered arrow indicates the direction of the storm motion and the green arrow the main wind di-rection in the anvil outflow (not scaled according to velocity). In addition, the positions of theLINET sensors are indicated (diamonds).
83
Fig. 10. Spatial and temporal LINET stroke distribution on 6 August 2006 at 11:03–15:00 UTC(a) and on 15 August 2006 at 11:00–18:00 UTC(b) (upper colour scale: only selected thunderstorm system). On 6 August, LINET data were not available before 11:03 UTC.The observed NO mixing ratio along the Falcon flight path is superimposed (lower colour scale). Sequences with enhanced NO mixing ratioswere observed within the MCS outflow (labelled in red). The red arrow indicates the direction of the storm motion and the green arrow themain wind direction in the anvil outflow (not scaled according to velocity). In addition, the positions of the LINET sensors are indicated(diamonds).
Discussion
Pa
per|
Discussion
Paper
|D
iscussionP
aper|
Discussion
Paper
|
LINET stroke distributions - 060806 - Burkina Faso MCS(>= 10 kA)
UTC11 12 13 14
num
ber
of L
INE
T s
trok
es (
5 m
in.)
-1
0
20
40
60
80
100
120
14011:03-11:20 UTC11:20-11:4011:40-12:0012:00-12:2012:20-12:4012:40-13:0013:00-13:2013:20-14:00
(a)
P5 P6 P8P7 P9
LINET stroke distributions - 150806 - Benin/Togo MCS(>= 10 kA)
UTC11 12 13 14 15 16 17 18
num
ber
of L
INE
T s
trok
es (
5 m
in.)
-1
0
20
40
60
80
100
120
14011:00-12:00 UTC12:00-13:00 13:00-14:00 14:00-15:00 15:00-16:00 16:00-17:00 17:00-18:00
P2
(b)
P5P6
Fig. 11. Time series of LINET stroke rates (colour-coded as in Fig. 10) determined for theselected thunderstorm systems on 6 August (a) and 15 August 2006 (b) (only strokes withpeak currents ≥10 kA considered). The times when the different anvil penetrations took placeare labelled in red below the time scale.
84
Fig. 11. Time series of LINET stroke rates (colour-coded as in Fig. 10) determined for the selected thunderstorm systems on 6 August(a)and 15 August 2006(b) (only strokes with peak currents≥10 kA considered). The times when the different anvil penetrations took place arelabelled in red below the time scale.
From Fig. 10b it is obvious that the strokes developed lessstructure compared to the previous case and also mergingof single cells took place. The movement of the MCS andthe wind direction in the anvil outflow region are indicatedwith arrows. In this case the system moved rather rapidlysouthwestward (12–13 m s−1), however the outflow was ad-vected rather slowly to the northwest since no jet stream waspresent in this area. Figure 10b also indicates that the high-est frequency of elevated NO mixing ratios along the flighttrack were observed along the northern edge of the MCS, justdownwind of the system.
A time series of LINET stroke rates for this case is pre-sented in Fig. 11b. As the aircraft approached the MCS,it was in a mature stage and thereafter the stroke rate de-creased. The highest stroke rates within the MCS were ob-served around 15:10–15:15 UTC with 136 strokes (≥10 kA)per 5 min, just before the penetration of flight segment 2 atthe rear side of the MCS. This value is slightly higher thanobserved in the investigated thunderstorms during TROCCI-NOX (HH08), however still distinctly lower compared to ob-servations in Hector during SCOUT-O3 (HH09).
www.atmos-chem-phys.net/11/2503/2011/ Atmos. Chem. Phys., 11, 2503–2536, 2011
2518 H. Huntrieser et al.: Mesoscale convective systems observed during AMMA
4 Estimate of the LNOx production rate per flash andper year
In this section, the measurements in the selected MCS of 6and 15 August 2006 are discussed in more detail and the re-sulting annual global nitrogen mass production rate by light-ning is determined. The values needed for the calculationsare estimated according to the equations below.
First the method used to estimate the annual global LNOxnitrogen mass production rateGLNOx (in Tg a−1) is brieflyintroduced. The same method was already applied in HH08and HH09. For an overview of the different steps, see Fig. 3in HH08. More details are also given later in Sect. 4. Themethod is based on the idea that most LNOx produced ina thunderstorm is transported into the anvil region, as indi-cated in many recent studies based on cloud-model simula-tions (e.g., Ott et al., 2010).
The horizontal LNOx mass fluxFLNOx (in nitrogen massper time, g s−1) is calculated from measurements during eachanvil penetration according to Chameides et al. (1987):
FLNOx = χLNOx ·MN
Mair·ρa(Va−Vs) ·1x ·1z (1)
whereχLNOx is the mean NOx volume mixing ratio producedby lightning (mol mol−1), MN andMair are the molar massesof nitrogen (14 g mol−1) and air (29 g mol−1), respectively,ρa is the air density (g m−3) calculated from measured tem-perature and pressure in the anvil, andVa−Vs is the differ-ence between the wind vectors in the anvil outflow and atthe steering level. In general, the wind at the steering level(∼700 hPa) determines the mean motion of a thunderstormcell (Keenan and Carbone, 1992). However, this parameterwas not available from every flight since this region was notprobed specifically. The storm motion (Vs) was instead de-termined from the spatial LINET stroke evolution based onhorizontal stroke distributions with a high temporal resolu-tion of 10 min. The last term1x·1z is the area (m2) of thevertical cross-section perpendicular to the wind direction inthe anvil outflow. The parameters in Eq. (1), except1x and1z, were calculated directly from Falcon measurements byaveraging the measured data over the time period when theanvil was penetrated.
For the estimate of the LNOx production ratePLNOx (ni-trogen mass per stroke, in g stroke−1) in a thunderstorm, thehorizontal LNOx mass fluxFLNOx (g s−1) is then divided bythe total (IC+CG) contributing LINET stroke rateRLINET(strokes s−1) according to HH08:
PLNOx =FLNOx
RLINET(2)
For comparison with other published results, thePLNOx es-timates per LINET stroke in Eq. (2) are scaled toPLNOx es-timates per LIS flash. Finally, it is multiplied with the num-ber of LIS flashes occurring globally, 44±5 flashes s−1 ac-cording to Christian and Petersen (2005), to achieve the an-
nual global LNOx nitrogen mass production rateGLNOx (inTg a−1).
This section is organised in the following subsections:The spatial and temporal distributions of LINET strokes pre-sented in Sect. 3.4 are used in Sect. 4.1 to associate the in-dividual anvil-NOx enhancements to corresponding LINETstrokes and representative stroke frequencies. The contri-bution of BL-NOx and LNOx to measured anvil-NOx is es-timated in Sect. 4.2. For the calculation of the horizontalLNOx mass flux rate, the mean depth of the anvil outflow isestimated in Sect. 4.3. The horizontal LNOx mass flux rateout of the anvils is calculated by means of estimated LNOxmixing ratios and horizontal outflow wind velocities from theflights combined with the size of the vertical cross-section ofthe anvils (Sect. 4.4). LNOx nitrogen mass flux rates (g s−1)and LINET stroke rates (strokes s−1) are then combined toestimate the production rate of LNOx (in g of nitrogen massor number of NOx molecules) per LINET stroke and per LISflash (Sect. 4.5). Finally, the annual global LNOx nitrogenmass production rateGLNOx in Tg a−1 is estimated.
4.1 Contribution from observed LINET strokes tomeasured anvil-NOx and resulting stroke rates
For the estimate of the LNOx production rate per stroke, itis important to know which of the registered LINET strokescontributed to the estimated LNOx enhancement in the anviloutflow. Presently, cloud-scale modelling is most suitablefor this task (e.g., Ott et al., 2007). For several TROC-CINOX, SCOUT-O3/ACTIVE and AMMA cases cloud-resolving model simulations are in preparation, but not readyyet (Huntemann et al., 2011; K. Pickering, NASA Goddard,personal communication, 2010). Here we use a rough ap-proximation to estimate the number of LINET strokes con-tributing to LNOx. Comparisons between this method ofadvecting strokes with the ambient wind measured by theaircraft and lightning tracer simulations with a Lagrangianparticle dispersion model (FLEXPART) in HH08 indicatedthat this method alternatively can be used. It is known fromcloud-model simulations that most LNOx produced in a thun-derstorm is transported into the anvil region (Skamarock etal., 2003; Fehr et al., 2004; Ott et al., 2010).
On 6 August, the power supply of the LINET networkwas out of order in the morning and started to operate nor-mally again after 11:03 UTC. At this time the aircraft alreadystarted to investigate the SLMCS and stayed within this sys-tem until 12:00 UTC. Within this given time period and area,the total number of strokes with peak currents≥10 kA was139, which gives a total stroke rate of 0.041 strokes s−1. Inthis case, we assume that all of these strokes contributedto the measured anvil-NOx in the flight segments along theSLMCS perpendicular to the wind direction (flight segments4 to 6 and 7 to 9).
The first selected penetration from this case in Table 3 (P5-6) lasted from 10:56–11:14 UTC. For further calculations
Atmos. Chem. Phys., 11, 2503–2536, 2011 www.atmos-chem-phys.net/11/2503/2011/

H. Huntrieser et al.: Mesoscale convective systems observed during AMMA 2519
Table 3. Estimates of horizontal LNOx mass fluxFLNOx , LINET stroke rateRLINET , LNOx production rate per LINET stroke and per LISflashPLNOx , and global LNOx production rate per yearGLNOx for selected AMMA thunderstorm penetrations.
Flight, Entry and exit Latitude (◦ N)/ Pressure Mean Mean |Va−Vs|3, ρa, 1x, km 1z, km F4
LNOx, R5
LINET , P 6LNOx
, P 7LNOx
, GLNOx ,
flight segment time (UTC), s longitude (◦ E) altitude, χ1BL-NOx
, χ2LNOx
, m s−1 kg m−3 g(N) s−1 (LINET g(N) g(N) Tg(N) a−1
and field km nmol mol−1 nmol mol−1 strokes) (LINET (LISexperiment s−1 stroke)−1 flash)−1
060806P5-6 39 359–40 458 +13 to 15/along+1 10.7 0.16 0.17 6.6 0.36 ∼220 ∼3 129 0.041 3139 2417 3.4(SLMCS) AMMA (48%)060806P8–9 42 019–43 452 +13 to 15/along+1 11.5 0.16 0.19 7.0 0.33 ∼220 ∼3 140 0.041 3411 2626 3.6(SLMCS) AMMA (10.1–11.9) (46%)150806bP5–6 58 671–59 149 +9 to 10/along+1 11.5 0.18 0.16 8.9 0.33 ∼150 ∼2.5 85 0.066 1289 993 1.4(MCS) AMMA (11.1–11.8) (53%)
relative ∼40% ∼50% ∼50% ∼40% ∼180% ∼60% ∼240% ∼290% 300%max. error
1 MeanNOx mixing ratio transported from the boundary layer (BL-NOx ) into the anvil outflow.2 MeanNOx mixing ratio produced by lightning (LNOx ) in the anvil outflow (difference between total measured anvil-NOx and the BL-NOx contribution).3 True horizontal anvil outflow velocity (difference between the wind vectors in the anvil outflow and at the steering level). See Appendix.4 The horizontalLNOx mass flux out of the anvil, see Eq. (1).5 Only LINET strokes with peak currents≥10kA contributing toLNOx were considered for an unbiased comparison between the different thunderstorms.6 TheLNOx production rate per LINET stroke, see Eq. (2).7 The LINET stroke to LIS flash ratio for AMMA was 0.77.
we used the LINET stroke rate between 11:00–12:00UTC (0.041 strokes s−1). We believe that this number isrepresentative for the selected penetrations in Table 3 (P5-6,P8-9) for several reasons. The satellite images show that themost active phase of the MCS was between midnight and08:00 UTC. Between 09:00–14:00 UTC the storm slowlydecayed. From Fig. 11a it is clear, that the stroke rate wasnot changing much between 11:00 and 14:00 UTC. Wetherefore do not expect a very different stroke rate at thebeginning of the flight between 10:00–11:00 UTC, whereno LINET stroke measurements were available. In addition,from the position and movement of the storm, we do notexpect to observe a lot of aged NO (from older strokes) inthe area where the penetrations took place. The analysesof WWLLN data for the region covered by the MCS(11–17◦ N, 0–6◦ E) indicate that the WWLLN stroke ratealso rapidly decreased in the morning (07:00–08:00/08:00–09:00/09:00–10:00/10:00–11:00/11:00–12:00/12:00–13:00UTC: 59/53/38/8/11/2 strokes s−1) (R. Buergesser, FaMAF,Universidad Nacional de Cordoba, personal communi-cation, 2011). Mainly the strokes between 10:00–12:00UTC (from position and timing) contributed to the NOenhancement observed. Since the WWLLN stroke rate wasalmost constant between 10:00–12:00 UTC, we may assumethat the selected LINET stroke rate between 11:00–12:00UTC (0.041 strokes s−1) is representative for our selectedpenetrations listed in Table 3.
On 15 August, we focus on the flight segments locatedclosest to the convective core with fresh lightning (flight seg-ments 5 to 6). Here the mean ambient wind velocity dur-ing 4 min before flight segment 5 and after flight segment 6was determined together with its standard deviation (σ ). Thewhole lifecycle of the stroke activity, until the selected flightsegments were probed, was then divided into 30-min inter-vals. For each of these intervals it was determined whichof the strokes, located upstream of the penetration, could be
advected with the mean ambient wind velocity±σ to the lo-cation of the penetration. Here again only strokes with peakcurrents≥10 kA were taken into account. With the meanambient wind velocity of 9±2 m s−1 it was estimated thatabout 951 strokes between 12:00 and 16:00 UTC, locatedwithin the area 1.1–2.7◦ E, could have contributed to themeasured anvil-NOx in flight segments 5 to 6. This gives anaverage stroke rate of 0.066 strokes s−1. Between 13:00 and14:30 UTC, the time period when most strokes contributed toanvil-NOx, the mean height of the IC strokes was estimatedto 8.2±2.9 km. The upper range∼8–11 km is partly locatedwithin the MCS outflow region investigated by the aircraft(∼10–12 km).
The stroke ratesRLINET estimated for these two selectedAMMA MCS on 6 and 15 August (∼0.04 and ∼0.07strokes s−1, respectively) are in a similar range as ob-served during TROCCINOX: 0.03 strokes s−1 for a sub-tropical thunderstorm and 0.05–0.06 strokes s−1 for selectedtropical thunderstorms, and during SCOUT-O3: 0.04 to0.11 strokes s−1 for selected tropical thunderstorms (exceptHector) and 0.13 strokes s−1 for a subtropical thunderstorm(HH08; HH09). In comparison, in Hector stroke rates up to0.24 strokes s−1 were observed.
For each of the selected MCS, the width1x of the LNOxplume perpendicular to the wind direction was estimatedfrom the horizontal extension of enhanced anvil-NOx andthe LINET stroke distribution in Fig. 10a and b. This valueis needed for further calculations according to Eq. (1). The1x values obtained are∼220 km for the SLMCS on 6 Au-gust, and∼150 km for the MCS on 15 August, as listedin Table 3. These values are much higher than observedduring TROCCINOX and SCOUT-O3 with1x values inthe range of∼30–60 km, except for Hector with∼100 km(HH08; HH09). For further calculations for AMMA, onlythe flight segments close to the convective core were selected(Table 3). For the 6 August case, no LINET strokes were
www.atmos-chem-phys.net/11/2503/2011/ Atmos. Chem. Phys., 11, 2503–2536, 2011

2520 H. Huntrieser et al.: Mesoscale convective systems observed during AMMA
recorded north of∼13.5◦ N within the MCS, since this areawas out of range of the detection system. Therefore, onlyflight segments influenced by the coloured LINET strokes inFig. 10a were considered.
4.2 Contribution of boundary layer (BL)-NO x toanvil-NOx
The NOx mixing ratio measured in the fresh MCS outflowis mainly a mixture of LNOx and NOx transported upwardfrom the BL with convection (BL-NOx). In our previousstudies (Huntrieser et al., 2002; HH08), the BL contributionto the NOx mixing ratio in the anvil was derived from thecorrelation between NOx and CO mixing ratios in the BLand in the anvil. It is assumed, that BL air is transported up-wards rapidly within strong, well-developed updrafts by theconvection, with little ambient mixing and without chemicalloss of NOx and CO in the first stage. In Sect. 5 we discussthis is more detail.
The vertical NOx profile obtained from the Falcon mea-surements on 6 August indicates that mixing ratios in therange of 0.1–0.2 nmol mol−1 were present at the top of theBL (here∼1.5 km altitude). Furthermore, we use the NOx-CO scatter correlation plot from the whole flight to estimatethe contribution from BL-NOx to the measured anvil-NOxin the outflow (not shown). During the selected flight seg-ments listed in Table 3, CO mixing ratios in the range of∼100–105 nmol mol−1 were measured (Table 2a). The aver-age BL-NOx mixing ratioχBL-NOx for this CO-range, if weexclude NOx mixing ratios above 0.25 nmol mol−1 (affectedby LNOx), is 0.16±0.05 nmol mol−1. This range is in accor-dance to our estimate from the vertical NOx profile.
For the selected flight on 15 August no observations ofNOx were available at the top of the BL (assumed 0.8–1.2 km). Measurements from other AMMA-flights in this re-gion at altitudes below 900 hPa generally indicate NOx mix-ing ratios<0.4 nmol mol−1 (Reeves et al., 2010). Here, weuse the NOx-CO scatter correlation plot from this flight to es-timate the contribution from BL-NOx to the measured anvil-NOx in the outflow (Fig. 12). During the selected flight seg-ments listed in Table 3, CO mixing ratios in the range of∼135–140 nmol mol−1 were measured (Table 2a). The aver-age BL-NOx mixing ratioχBL-NOx for this CO-range, if weexclude NOx mixing ratios above 0.30 nmol mol−1 (affectedby LNOx), is 0.18±0.04 nmol mol−1.
Average LNOx volume mixing ratiosχLNOx were de-termined by subtraction of the mean BL-NOx contribu-tion χBL-NOx (0.16 and 0.18 nmol mol−1, respectively) fromthe mean anvil-NOx values. The mean values for anvil-NOx varied between 0.33–0.35 nmol mol−1. As a result,χLNOx values from 0.16 to 0.19 nmol mol−1 were obtained,as listed in Table 3. TheseχLNOx values are distinctly lowercompared to results from TROCCINOX and SCOUT-O3,whereχLNOx values ranged from 0.1 to 1.1 and from 0.4 to2.4 nmol mol−1, respectively (HH08; HH09).
Discussion
Pa
per|
Discussion
Paper
|D
iscussionP
aper|
Discussion
Paper
|
F#7 150806b
NOx mixing ratio /nmol mol-10.0 0.2 0.4 0.6 0.8 1.0
CO
mix
ing
ratio
/nm
ol m
ol-1
60
80
100
120
140
160
BL-NOx
LNOx
FT-NOx
Fig. 12. NOx-CO correlation plot for the Falcon b-flight on 15 August 2006. The NOx contri-butions from the free troposphere (FT), boundary layer (BL) and from production by lightning(LNOx) are indicated. The red line indicates the changing NOx contribution from the BL and FTdepending on CO mixing ratios.
85
Fig. 12. NOx-CO correlation plot for the Falcon b-flight on 15 Au-gust 2006. The NOx contributions from the free troposphere (FT),boundary layer (BL) and from production by lightning (LNOx) areindicated. The red line indicates the changing NOx contributionfrom the BL and FT depending on CO mixing ratios.
Overall, the contribution of BL-NOx to anvil-NOx in theselected MCS of 6 and 15 August, was in the range of∼50%(Table 3). This range is distinctly higher, than the aver-age contributions found in European (EULINOX) thunder-storms with∼25 to 40% (Huntrieser et al., 1998, 2002), inBrazilian (TROCCINOX) thunderstorms with∼10 to 20%(HH08), and in Australian (SCOUT-O3) thunderstorms withless than 10% (HH09). During SCOUT-O3, the contribu-tion from LNOx clearly dominated the anvil-NOx budget(≥90%), which indicates that the Darwin region is especiallysuitable for investigations of LNOx.
4.3 Estimate of the mean depth of the anvil outflow
The mean depth of the anvil outflow1z is needed as thenext parameter for estimating the horizontal LNOx mass fluxin Eq. (1). For tropical regions it has been proposed, thatthe level of maximum anvil outflow and convective detrain-ment of O3-poor air from the BL is located where minimumO3 mixing ratios are observed (Folkins et al., 2002; Folkinsand Martin, 2005). The mean vertical O3 profile obtainedfrom all Geophysica flights during AMMA indicates that themain anvil outflow region, characterised by especially lowO3 mixing ratios, was located between 9 and 13 km altitude,with a minimum centered around 12 km (Fig. 13). In agree-ment, Cetrone and Houze (2009) reported that anvils origi-nating from MCS over West Africa are in general located at
Atmos. Chem. Phys., 11, 2503–2536, 2011 www.atmos-chem-phys.net/11/2503/2011/

H. Huntrieser et al.: Mesoscale convective systems observed during AMMA 2521
Discussion
Pa
per|
Discussion
Paper
|D
iscussionP
aper|
Discussion
Paper
|
O3 mixing ratio /nmol mol-1
0 20 40 60 80 100 120 140
pres
sure
alti
tude
/km
0
5
10
15
20
AMMA - FalconAMMA - GeophysicaSCOUT-O3 - GeophysicaTROCCINOX-2 - GeophysicaTROCCINOX-2 - Falcon
Fig. 13. Mean vertical O3 profiles derived from measurements with the Falcon (flights01b/04/06/07/11/13/15a-b/16/18a August 2006) and Geophysica (flights 04/07/08/11/13/16/17August 2006) during AMMA. Superimposed are mean vertical O3 profiles from SCOUT-O3 andTROCCINOX-2 (adapted from HH07; HH09). Mean values were calculated for every 250 maltitude bin.
86
Fig. 13.Mean vertical O3 profiles derived from measurements withthe Falcon (flights 01b/04/06/07/11/13/15a–b/16/18a August 2006)and Geophysica (flights 04/07/08/11/13/16/17 August 2006) duringAMMA. Superimposed are mean vertical O3 profiles from SCOUT-O3 and TROCCINOX-2 (adapted from HH07; HH09). Mean valueswere calculated for every 250 m altitude bin.
∼12 km altitude. Law et al. (2010) confined the altitude ofmaximum convective outflow in this region to 12.5 km basedon observations of the vertical distribution of the cloud pres-ence and by using the definition by Gettelman et al. (2004)based on the height of the 350 K level. In comparison, duringSCOUT-O3 the main anvil outflow region was located higherup, between 11 and 15 km, according to the Geophysica O3measurements (HH09).
To estimate the vertical dimensions1z of the anviloutflows, a combination of Falcon measurements includ-ing vertical profiles of the equivalent-potential temperature(2e), wind velocity, O3, and CO mixing ratios were used.For the computation of2e for a water-saturation pseudo-adiabatic process, the formula developed by Bolton (1980)was used for Falcon data (see also HH07). Furthermore,Dessler (2002) has used a combination of the latter twochemical indicators to infer the convective outflow in thetropics. During AMMA, the main convective outflow wasusually located at potential temperature levels up to∼350–360 K (13–14 km) according to Homan et al. (2010), coin-cident with the base of the TTL and the maximum level ofneutral buoyancy.
On 6 August, O3 mixing ratios distinctly decreased above∼9 km and reached values down to∼35–40 nmol mol−1 inthe main anvil outflow, however at the top of the BL evenlower mixing ratios in the range of∼25 nmol mol−1 wereobserved (Fig. 5a, Table 2a). The anvil outflow region is lessdistinct in the vertical CO profile. The CO mixing ratios areslightly enhanced above∼9 km and reach values in the rangeof ∼100–110 nmol mol−1, similar to the values at the top ofthe BL (1.5 km).
Since no other airborne measurements were availableabove 12 km for this day and for the 15 August (see be-low), the top of the anvil outflow region was estimated fromthe vertical2e profile. Highwood and Hoskins (1998) andFolkins et al. (2000) have suggested that the upper level ofthe outflow is located where the2e value is in the same rangeas observed at the top of the BL. The vertical2e profile from6 August indicates, that the maximum2e temperature ob-served at the top of the BL (∼350 K) is reached again in theUT at ∼12 km (Fig. 5d). Based on these observations, weassume that the mean depth of the main anvil outflow on 6August reached from∼9–12 km and1z is ∼3 km (Table 3).
On 15 August, the airborne measurements within the MCSalso indicate that outflow signatures were clearly visible firstabove 10 km, with a decrease in O3 mixing ratios down to∼30–40 nmol mol−1 and a distinct increase in CO mixingratios up to∼120–150 nmol mol−1 (Fig. 9a, Table 2b). Inthis case more the typical “mirroring” of trace gas conditions(CO and O3) in the BL and in the anvil outflow region wasobserved (Fig. 9a). An extrapolation of the vertical2e profilefrom 15 August indicates that the maximum2e temperatureobserved at the top of the BL (∼355 K) is reached again inthe UT at∼12.5 km (Fig. 9d). Based on these observations,we assume that the mean depth of the main anvil outflow on15 August reached from∼10.0–12.5 km and1z is ∼2.5 km(Table 3). In this region (up to 11 km) also a large part of theIC strokes were released, as mentioned in Sect. 4.1.
4.4 Estimate of the horizontal LNOx mass flux
For the final calculations of the horizontal LNOx mass flux,it is also important to know if the selected MCS were pen-etrated in a comparable and representative way. The anvilpenetrations listed in Table 3 provide only snapshots of theconditions at a certain level of the cloud at a certain time.These are, however, the only measurements available, andthe most representative anvil penetrations were selected forTable 3. Furthermore, in the previous sections it was shownthat the selected penetrations levels were located well withinthe main anvil outflow region and close to the region wheremost signals from IC strokes were registered.
Based on the parameters estimated in the previous sectionsand summarised in Table 3, the horizontal LNOx mass fluxFLNOx (in nitrogen mass per time, g s−1) was calculated ac-cording to Eq. (1) for the selected anvil penetrations. TheFLNOx values ranged from 85 to 140 g s−1, which is within
www.atmos-chem-phys.net/11/2503/2011/ Atmos. Chem. Phys., 11, 2503–2536, 2011

2522 H. Huntrieser et al.: Mesoscale convective systems observed during AMMA
the range estimated for TROCCINOX thunderstorms, 48–178 g s−1 (HH08). In comparison, for the Hector thunder-storm during SCOUT-O3 much higherFLNOx values up to∼700 g s−1 were estimated (HH09).
The fluxes given in Table 3 can be divided by the molarmass for nitrogen and the area of the vertical cross-section(1x ·1z) to estimate the flux in units of mol m−2 s−1. For theselected AMMA thunderstorms, these fluxes vary between1.4 and 1.6×10⁻⁸ mol m−2 s−1. This is a distinctly smallerrange than found for TROCCINOX and SCOUT-O3 thunder-storms with values between 3.3 and 7.1×10⁻⁸ mol m−2 s−1
and between 2.6 and 20.8×10⁻⁸ mol m−2 s−1, respectively(HH08; HH09). However, due to the small number ofthunderstorms available, it is not known how representa-tive these values are. The values can also be comparedto nitrogen mass fluxes simulated by Barth et al. (2007),who ran different cloud-scale models and achieved 2.7–13.0×10⁻⁸ mol m−2 s−1, and to Barthe et al. (2007), whosimulated 6×10⁻⁸ mol m−2 s−1 on average in the anvil out-flow of a STERAO storm.
The parameters listed in Table 3 have large uncertainties.The relative maximum error of theFLNOx estimate was there-fore calculated, defined as the sum of the single relative er-rors. The uncertainty forχLNOx is given by the standard devi-ation (on average∼40% of the mean value); forVa the stan-dard deviations indicate an uncertainty of∼30% and forVsthe uncertainty is∼2 m s−1 corresponding to∼20%; for1x
and1z the uncertainties were∼50–100 km and∼0.5–1 km,respectively, corresponding to uncertainties up to∼50% and∼40%. Summing up these uncertainties, the relative maxi-mum error of theFLNOx estimate is∼180%.
4.5 Estimate of the LNOx production rate per strokeand per year
For the estimate of the LNOx production ratePLNOx (ni-trogen mass per stroke, in g stroke−1), the horizontal LNOxmass fluxFLNOx (g s−1) is divided by the LINET stroke rateRLINET (strokes s−1) according to Eq. (2). Here only strongerLINET strokes with peak currents≥10 kA were consideredas mentioned before in Sect. 2.3.PLNOx estimates for theselected anvil penetrations resulted in values ranging from∼1.3 kg stroke−1 for the MCS on 15 August, located southof the ITCZ, and up to∼3.4 kg stroke−1 for the MCS on 6August, located north of the ITCZ (Table 3).
For comparison with other published results, thePLNOx
estimates per LINET stroke were scaled toPLNOx estimatesper LIS flash. We are aware of the fact that a LINET strokeis not directly comparable to a LIS flash. Here we onlyuse this LINET stroke – LIS flash relationship for scalingpurposes. During the AMMA field phase, during daytimeonly one TRMM satellite overpass on 14 August (13:12:51–13:14:44 UTC) provided a sufficient large set of coincidentLIS flash observations within the LINET domain. Lightningactivity between the LINET centre area and the northern pe-
Discussion
Pa
per|
Discussion
Paper
|D
iscussionP
aper|
Discussion
Paper
|
Comparison LINET / LIS - 140806(13:12:51-13:14:44 UTC)
Longitude /°E
0.0 0.5 1.0 1.5 2.0 2.5 3.0 3.5
Latit
ude
/°N
10.0
10.5
11.0
11.5
12.0
12.5
13.0
13.5LINET stroke (>=10 kA)LIS flashLINET sensornational border
Benin
Togo
Burkina Faso
Fig. 14. Horizontal distributions of LIS flashes (in red) and LINET strokes with peak currents≥10 kA (in yellow) during the LIS overpass over the LINET area on 14 August 2006. Close-bydetecting LINET sensors are superimposed (in cyan).
87
Fig. 14. Horizontal distributions of LIS flashes (in red) and LINETstrokes with peak currents≥10 kA (in yellow) during the LIS over-pass over the LINET area on 14 August 2006. Close-by detectingLINET sensors are superimposed (in cyan).
riphery, covering totally 10.2 to 12.6◦ N and 0.4 to 2.9◦ E,was suitable for comparison. During this selected overpassoverall 89 LIS flashes and 94 LINET strokes with peak cur-rents≥10 kA were registered in this area. For the selectedtime period, Fig. 14 shows the horizontal distributions of allavailable LINET strokes and LIS flashes for the area wherelightning occurred. The LIS detection efficiency for daytime(0.73) was taken into account for the LIS overpasses. Thisimplies a LINET/LIS ratio of about(94/89)× 0.73= 0.77for the selected overpass, considering only LINET strokeswith peak currents≥10 kA.
By means of this ratio, the mean value forPLNOx per LISflash for the MCS on 6 and 15 August was 2.5 and 1.0 kg,respectively (Table 3). This tendency to lower LNOx produc-tion rates in regions closer to the tropics was also observedduring TROCCINOX and SCOUT-O3 (HH08; HH09). Themean nitrogen production rates per LIS flash in tropical andsubtropical thunderstorms during TROCCINOX was 1.2 and2.2 kg, respectively. During SCOUT-O3, on average 1.5 kgwas observed in smaller tropical thunderstorms, however insubtropical thunderstorms and Hector values ranged up to∼4–5 kg. Possible reasons for these differences will be dis-cussed later in Sect. 7. These values obtained from AMMAare well within the range of values given in a review of pre-vious investigations, where SH07 derived a best-estimate of3.5 (range 0.5–10) kg of nitrogen per flash. The mean val-ues forPLNOx per LIS flash given in Table 3 correspond
Atmos. Chem. Phys., 11, 2503–2536, 2011 www.atmos-chem-phys.net/11/2503/2011/

H. Huntrieser et al.: Mesoscale convective systems observed during AMMA 2523
Table 4. Comparison of different parameters influencing LNOx based on results from the field campaigns AMMA (West Africa), TROCCI-NOX (Brazil) and SCOUT-O3 (North Australia), with values partly adapted from Huntrieser et al. (2007, 2008, 2009).
Fieldexperiment,flight/latitude
Mean O3mixing ratioin 7–8 km,nmol mol−1
R2LINET ,
(LINETstrokes) s−1
1x, km 1z, km Meanχ3
BL-NOx,
nmol mol−1
Meanχ4
LNOx,
nmol mol−1
RatioχBL-NOx toχLNOx , %
RatioNO/NOy
|Va−Vs|5,
m s−1F6
LNOx,
g(N) s−1
F6LNOx
,
×10−8 molm−2 s−1
P 7LNOx
,kg(N) (LISflash)−1
P 7LNOx
,
×1025
moleculesNO (LISflash)−1
G8LNOx
,
Tg(N) a−1
AMMA060806(13–15◦ N)
∼50–60 0.04 ∼220 ∼3 0.16 0.2 ∼50/50 0.3 7 135 1.4 2.5 10.8 3.5
AMMA150806b(9–10◦ N)
∼60–70 0.07 ∼150 ∼2–3 0.18 0.2 ∼50/50 0.3 9 85 1.6 1.0 4.3 1.4
SCOUT-O3(Hector)1
(11–15◦ S)
∼50–60 0.04–0.13(<0.24)
∼30–60(<95)
∼1–3 0.13 0.4–2.3(<2.4)
∼10/90 0.6–0.8(<0.8)
5–15 (<8) 30–426(<700)
2.6–20.3(<20.8)
1.3–5.4(<4.7)
5.6–23.2(<20.2)
1.8–7.6(<6.6)
TROCCINOX(19–22◦ S)
∼40–50 0.03–0.06 ∼30–50 ∼3–4 0.11 0.1–1.1 ∼20/80 0.3–0.8 6–20 48–178 3.3–7.1 1.0–2.8 4.3–12.0 1.3–3.9
mean tropical9 ∼2mean subtropical9 ∼4mean all (range) ∼3 (1–8)
1 For SCOUT-O3, values in brackets are given for the Hector thunderstorm.2 Only LINET strokes with peak currents≥10kA contributing toLNOx were considered for an unbiased comparison between the different thunderstorms.3 MeanNOx mixing ratio transported from the boundary layer (BL-NOx ) into the anvil outflow.4 MeanNOx mixing ratio produced by lightning (LNOx ) in the anvil outflow (difference between total measured anvil-NOx and the BL-NOx contribution).5 True horizontal anvil outflow velocity (difference between the wind vectors in the anvil outflow and at the steering level).6 The horizontalLNOx mass flux out of the anvil, see Eq. (1).7 TheLNOx production rate per LIS flash, see Eq. (2).8 The annual globalLNOx production rate, see Sect. 4.9 The mean for tropical and subtropical thunderstorms was estimated from all selected tropical and subtropical thunderstorm penetrations from TROCCINOX (as listed in HH08), from SCOUT-O3 (as listed in HH09), and from AMMA based on the060806 case (subtropical) and 150806b case (tropical) listed above.
to a total range of 4.3–10.8× 1025 molecules NO per LISflash. This range is very similar to the range observedduring TROCCINOX with 4.3–12.0× 1025 molecules NO(HH08). In comparison, during SCOUT-O3 a total range of5.6–23.2×1025 molecules NO was estimated, which impliesa factor∼2 higher production rates in thunderstorms in theDarwin region compared to AMMA and TROCCINOX (Ta-ble 4). SH07 concluded that a typical flash produces 15(2–40) × 1025 molecules NO. Our results from TROCCINOXand AMMA are located below this global mean value.
The different estimates for AMMA, SCOUT-O3 andTROCCINOX thunderstorms may be influenced by the dif-ferent LINET/LIS ratios obtained (∼0.8, 1.6, and 0.5,respectively) (HH08; HH09). It is not clear why theLINET/LIS ratios during AMMA, SCOUT-O3 and TROC-CINOX are so different. Since the LINET configuration wasabout the same on the investigated AMMA, SCOUT-O3 andTROCCINOX days (4–5 stations were active and the aver-age distance to the next closest sensor was∼80–90 km), weassume that the LINET detection efficiency was similar forpeak currents≥10 kA. However, we speculate that the num-ber of LINET strokes≥10 kA per LIS flash or the LIS detec-tion efficiency for IC and CG flashes may be different. Re-sults by Holler et al. (2009) indicate an elevated fraction ofLINET strokes≥10 kA for Australia compared to Brazil andBenin, which may explain our different LINET/LIS ratios.Furthermore, Petersen and Rutledge (1992) pointed out thatespecially high mean peak currents in negative CG flasheswere observed over Northern Australia compared to other re-gions.
The AMMA estimates forPLNOx per LIS flash were finallymultiplied with the number of LIS flashes occurring glob-ally, 44 flashes s−1. If we assume that the selected AMMAthunderstorms were representative for the globe, the impliedmean annual global LNOx production rateGLNOx basedon the two MCS on 6 and 15 August, would be 3.5 and1.4 Tg a−1, respectively (Table 3). This range is again sim-ilar to the mean values obtained for subtropical and tropicalthunderstorms during TROCCINOX, 3.1 and 1.6 Tg a−1, re-spectively (HH08). However, compared to the mean valuesobtained for different SCOUT-O3 thunderstorms (range 2.4–7.6 Tg a−1), these values are distinctly lower (HH09).
Finally, the relative maximum errors of thePLNOx andGLNOx estimates (Table 3) were calculated. The uncertaintyfor RLINET was estimated from the ratio between total strokesoccurring in the cell and the number of strokes considered tohave contributed to LNOx (uncertainty range∼60%). Fromthe estimates forFLNOx∼180% andRLINET∼60%, the rela-tive maximum error of thePLNOx estimate for LINET strokeswas∼240%. For thePLNOx estimate for LIS flashes, it wasassumed that the uncertainty in the conversion of LINETstrokes (≥10 kA) to LIS flashes was∼50% (depending onuncertainties in LIS and LINET detection efficiencies). Thisgives a relative maximum error of∼290%. For theGLNOx
estimate, the uncertainty in the global LIS flash rate wasgiven with ∼10%, which gives a final relative maximumerror of ∼300%. Considering this relative maximum error,GLNOx values listed in Table 3 may range up to∼14 Tg a−1,which is within the range of up to∼20 Tg a−1 given forGLNOx in previous assessments (e.g., WMO, 1999; SH07).
www.atmos-chem-phys.net/11/2503/2011/ Atmos. Chem. Phys., 11, 2503–2536, 2011

2524 H. Huntrieser et al.: Mesoscale convective systems observed during AMMADiscussion
Pa
per|
Discussion
Paper
|D
iscussionP
aper|
Discussion
Paper
|
AMMA - 0108b - 0408 - 0608 - 0708 - 1108 - 1508a - 1808a
CO mixing ratio /nmol mol-170 80 90 100 110 120 130 140 150 160
O3 m
ixin
g ra
tio /n
mol
mol
-1
20
30
40
50
60
70
80inside MCS50-150 km from MCS200-250 km from MCS300-500 km from MCSBLregression BLFT (7 km)regression FT (7 km)150806b: P1-P7
inside MCS50-150 km from MCS150806b: FT (7 km)
Fig. 15. CO-O3 correlations during single penetrations of MCS outflow on selected AMMAFalcon flights 2006 as indicated in the header and legend. Flights listed in the header are rep-resented by dots in different colours depending on the distance from the MCS. Superimposedare the correlations in the free troposphere (FT) and boundary layer (BL) for the selected flightsin the header and their regressions (dark and light grey squares). The flight listed in the legend(150806b) is represented by a black diamond superimposed by smaller coloured diamonds de-pending on the distance from the MCS. The grey diamond represents the correlation in the FTfor this flight.
88
Fig. 15. CO-O3 correlations during single penetrations of MCSoutflow on selected AMMA Falcon flights 2006 as indicated in theheader and legend. Flights listed in the header are represented bydots in different colours depending on the distance from the MCS.Superimposed are the correlations in the free troposphere (FT) andboundary layer (BL) for the selected flights in the header and theirregressions (dark and light grey squares). The flight listed in thelegend (150806b) is represented by a black diamond superimposedby smaller coloured diamonds depending on the distance from theMCS. The grey diamond represents the correlation in the FT for thisflight.
5 Production, destruction or mixing of O3 in the MCSoutflow?
In our selected AMMA cases, the observed O3 mixing ra-tios in the fresh MCS outflow were distinctly lower thanin the ambient air and attributed to direct airmass trans-port from the O3-poor BL (Sects. 3.2 and 3.3). In addi-tion, Bechara et al. (2010) observed O3 mixing ratios in therange of 45 nmol mol−1 within the fresh MCS outflow duringAMMA compared to 60 nmol mol−1 outside. As the MCSoutflow ages, the O3 composition in the MCS outflow maybe affected both by photochemical O3 production/destructionof uplifted precursors and mixing with the ambient air (Chat-field and Delany, 1990). For selected AMMA cases, Ancel-let et al. (2009) found that the chemical reactivity and O3production in the MCS outflow are related to the lifetimeof the MCS, the position and chemical composition of theingested airmasses. Ozone production rates in the range of1 nmol mol−1 per hour have been calculated for the outflowfrom MCS during AMMA (Andres-Hernandez et al., 2009).In convective outflow impacted by LNOx, ozone productionrates in the range of 5–10 nmol mol−1 per day have beenreported from previous campaigns in the tropics and midlat-itudes (Pickering et al., 1996; Fehr et al., 2004; DeCaria etal., 2005; Ott et al., 2007).
In Table 2a and b it was shown that the trace gas composi-tion observed in the fresh MCS outflow was rather differenton 6 and 15 August, with higher mixing ratios of CO and
Discussion
Paper
|D
iscussionP
aper|
Discussion
Paper
|D
iscussionP
aper|
Falcon CO distribution above 10 km - F#7 150806b
Longitude /°E-2 0 2 4 6
Latit
ude
/°N
8
10
12
14Falcon flight pathCO mixing ratio <90 nmol mol-1
90<= CO <100100<= CO <110110<= CO <120120<= CO <130130<= CO <140140<= CO <150
(a)
17
6
5 34
2
Falcon O3 distribution above 10 km - F#7 150806b
Longitude /°E-2 0 2 4 6
Latit
ude
/°N
8
10
12
14Falcon flight pathO3 mixing ratio <35 nmol mol-1
35<= O3 <4040<= O3 <4545<= O3 <5050<= O3 <5555<= O3 <6060<= O3 <65
(b)
17
6
5 34
2
Fig. 16. Distribution of CO (a) and O3 (b) mixing ratios along the Falcon flight path above 10 kmon 15 August 2006. The selected flight segments are labelled. The red arrow indicates thedirection of the storm motion and the green arrow the main wind direction in the anvil outflow(not scaled according to velocity).
89
Fig. 16. Distribution of CO(a) and O3 (b) mixing ratios along theFalcon flight path above 10 km on 15 August 2006. The selectedflight segments are labelled. The red arrow indicates the directionof the storm motion and the green arrow the main wind direction inthe anvil outflow (not scaled according to velocity).
HCHO for the latter flight. In addition, during the mixingwith the ambient air further downwind, O3 mixing ratios in-creased much faster in the aged MCS outflow on 15 August.In this section, we discuss these findings in more detail byanalysing the O3/CO correlation in different MCS outflowsas a function of distance from the convective core.
To achieve a clearer picture, all available penetrations inthe fresh and aged MCS outflow (within∼500 km distance)during the whole AMMA SOP-2a2 period were analysed.Data from the following flights were used: 1(b), 4, 6, 7, 11,15(a–b), and 18(a) August 2006. The mean CO and O3 mix-ing ratios were determined for all penetrations in the MCSoutflow. In addition, the distance to the convective core wasestimated from MSG satellite images. The data set was di-vided into 4 categories: inside MCS, in 50–150, 200–250,and 300–500 km distance from the convective core. Further-more, mean CO and O3 mixing ratios for the boundary layer(BL) and the free troposphere (FT) below the convective out-flow, here taken to be∼7 km, were determined for all the se-lected flights. The vertical O3 profiles (Fig. 13) indicate that
Atmos. Chem. Phys., 11, 2503–2536, 2011 www.atmos-chem-phys.net/11/2503/2011/

H. Huntrieser et al.: Mesoscale convective systems observed during AMMA 2525
the region above 8 km is affected by the convective outflowO3 mixing ratios decrease) and therefore not suitable as typ-ical background. In Fig. 15, the O3/CO correlation for thisselected data set (39 points in the MCS outflow) is shown to-gether with BL and FT conditions. The data from the 15 Au-gust b-flight was treated in a separate way, due to the differ-ent observations mentioned before and since it was the onlyflight investigating MCS south of the ITCZ (∼10◦ N).
The O3/CO correlations from all selected MCS outflows(flight 15b excluded) show a very similar picture (Fig. 15).The correlations obtained in the fresh (aged) outflow are lo-cated close to the conditions in the BL (FT), respectively.The data points are arranged along a rather straight mixingline between the BL and FT. With increasing distance fromthe convective core, CO and O3 mixing ratios in the MCSoutflow decrease and increase, respectively, in a way ex-pected from mixing with the ambient FT air. From this corre-lation plot it is hard to recognise if O3 production takes placein the aged MCS outflow (here within∼500 km distance).The mixing with the ambient FT air seems to be the mostprevailing process that changes the mixing ratios. At a dis-tance of 300–500 km from the core, CO mixing ratios in theoutflow almost achieve ambient FT conditions, however O3mixing ratios are still slightly lower (∼10 nmol mol−1), indi-cating perhaps even some O3 destruction at this early stage.
In comparison, for the b-flight from 15 August, wherea MCS south of the ITCZ was investigated, the conditionsare very different (Fig. 15). First of all, it is not known ifthe BL conditions in the Ouagadougou area are also repre-sentative for the BL below the investigated MCS over North-ern Benin-Togo. Therefore, no information on the BL con-ditions for this flight is given in Fig. 15. The FT conditionsfor this flight (from Ouagadougou ascent/descent), are withinthe range of the previous flights. As mentioned before, COmixing ratios were distinctly higher in the fresh MCS outflowon 15 August (b-flight) with∼135 nmol mol−1 compared tothe other selected fresh MCS outflows with a given range of∼90–110 nmol mol−1. Ozone mixing ratios were rather low(∼35–40 nmol mol−1) and located within the lower rangegiven from other fresh MCS outflows.
The observations in the aging outflow from the 15 August(b-flight), indicate a very steep increase in O3 mixing ratioswithout much change in CO mixing ratios in the first phase(Fig. 15). The increase in O3 mixing ratios with distance ishowever too strong to be attributed to O3 production alone.Instead, probably mixing with the ambient air south of 10◦ N(known to be impacted by aged biomass burning plumes richin O3 and CO) primarily caused this rapid O3 increase. In thiscase, perhaps also other important O3 precursors as isoprenewere transported upward from the polluted BL, since moreisoprene producing vegetation is prominent in this tropicalregion compared to the region north of the ITCZ (Becharaet al., 2010; Reeves et al., 2010). At a distance of 100–150 km from the convective core, the mean O3 mixing ra-tios reached∼60–65 nmol mol−1, which is distinctly higher
Discussion
Pa
per|
Discussion
Paper
|D
iscussionP
aper|
Discussion
Paper
|
F#2 060806a
CO mixing ratio /nmol mol-160 80 100 120 140 160 180 200 220 240
O3 m
ixin
g ra
tio /n
mol
mol
-1
10
20
30
40
50
60
70
80
900-2 km2-4 km4-6 km6-8 km8-10 km10-11 km11-12 km
(a)
F#7 150806b
CO mixing ratio /nmol mol-160 80 100 120 140 160 180 200 220 240
O3 m
ixin
g ra
tio /n
mol
mol
-1
10
20
30
40
50
60
70
80
900-2 km2-4 km4-6 km 6-8 km8-10 km10-11 km11-12 km
(b)
Fig. 17. CO-O3 correlation plot for the AMMA flights on 6 August 2006 (a) and 15 August (b)(pressure altitude colour-coded).
90
Fig. 17.CO-O3 correlation plot for the AMMA flights on 6 August2006(a) and 15 August(b) (pressure altitude colour-coded).
(∼10–15 nmol mol−1) compared to observations in the otherMCS aged outflows north of the ITCZ (∼45–55 nmol mol−1)at this distance.
In Fig. 16a and b the distributions of O3 and CO mixingratios along the flight path on 15 August above 10 km areshown. In the fresh outflow, close to the convective core(segment 3–5), CO and O3 mixing ratios are distinctly en-hanced and reduced, respectively, compared to the rest ofthe flight. In the aged convective outflow, along the rearside of the MCS, CO mixing ratios have slightly decreased,however O3 mixing ratios have increased dramatically. Pos-sible explanations for this increase were mentioned above.For the flight on 15 August, the aged outflow downwind ofthe MCS was probed in detail in flight segments 6 to 7 at∼11.7 km altitude (north of 10◦ N). The outflow was probedas far as∼130 km downwind of the MCS, thereafter the air-craft started to descend for landing. According to the ambi-ent wind velocity (∼10 m s−1) it was estimated that the mostaged outflow probed by the aircraft, left the MCS∼3–4 h ear-lier. In this aged outflow, signatures in NO were still clearlyenhanced in comparison to ambient mixing ratios, O3 mix-ing ratios remained high, however CO mixing ratios rapidlydecreased due to the successive mixing with the less pollutedairmass north of 10◦ N.
The differences in the trace gas composition between the6 and 15 August flights are also clearly visible in Fig. 17a, b,respectively. Here all O3/CO data points from the two flightsare plotted and coloured according to pressure altitude. In
www.atmos-chem-phys.net/11/2503/2011/ Atmos. Chem. Phys., 11, 2503–2536, 2011

2526 H. Huntrieser et al.: Mesoscale convective systems observed during AMMA
the UT (10–12 km), large differences in the O3/CO correla-tion are visible between the two flights, as mentioned before.On 6 August, mixing of the fresh MCS outflow (with highCO and low O3) with the ambient air is visible. With increas-ing age the data points move along the mixing line betweenthe BL and FT. On 6 August, the data points in the upperMCS outflow region, at 10–12 km, coincide with data pointslocated at∼2 km, which means that the MCS inflow regionwas rather elevated on this day (see Sect. 4.2). In compari-son, on 15 August the data points in 10–12 km altitude co-incide with data points located distinctly lower probably at∼1 km, which contain much more CO (Fig. 17b).
6 Brief synthesis of AMMA, SCOUT-O3 and TROCCI-NOX results concerning O3 and LNOx
The results from the AMMA field experiment concerning O3and LNOx, were partly compared to SCOUT-O3 and TROC-CINOX results in the course of this paper. For a betteroverview, these comparisons are summarised in Table 4.
First, the mean O3 mixing ratios in 7–8 km, located justbelow the main anvil outflow, were compared (see Table 4and Fig. 13). The highest ambient O3 mixing ratios inthe mid-upper troposphere (MUT) were observed duringAMMA, indicative of the highest O3 producing potential inthis region. Here frequent intrusions of airmasses impactedby biomass burning from the Southern Hemisphere followedby convective uplift may contribute to enhance MUT O3mixing ratios (Sauvage et al., 2005, 2007; Barret et al., 2008;Mari et al., 2008; Ancellet et al., 2009; Real et al., 2010;Reeves et al., 2010). During AMMA, one of these ele-vated fire plumes from the south was also penetrated by theaircraft as far north as∼5◦ N (Real et al., 2010). Mixingratios as high as 450 nmol mol−1 CO, 130 nmol mol−1 O3and 8 nmol mol−1 NOy were measured during this DLR Fal-con flight. In these elevated fire plumes, photochemical O3formation rates up to 7 nmol mol−1 per day have been es-timated during AMMA (Real et al., 2010). During otherseasons even values up to 15–35 nmol mol−1 per day havebeen reported (Jonquieres et al., 1998). In comparison, dur-ing TROCCINOX mean O3 mixing ratios in the MUT werein general much lower and we observed no indication ofa strong O3 potential at these altitudes.
Second, different parameters influencing LNOx were com-pared. As shown in Table 4, the range for the LINET strokerates was rather similar during all three campaigns, howeverwith a tendency to higher values during SCOUT-O3, espe-cially for the intense Hector thunderstorm. This thunder-storm type was also wider than most other thunderstormsin the tropics and falls into the category MCS. The largestMCS were however observed during AMMA, where alsothe BL was slightly more polluted and the ratio of BL-NOxto total anvil-NOx was highest. During AMMA, the low-est LNOx mixing ratios and NO/NOy ratios were observed,
indicative of only a minor contribution from LNOx to anvil-NOx. However, due to the large size of the AMMA-MCS,the LNOx mass flux (in g s−1) from these thunderstorms wasin a similar range as for TROCCINOX, however distinctlylower than for SCOUT-O3 thunderstorms. In comparison,for SCOUT-O3 thunderstorms the highest production rate ofnitrogen per LIS flash was determined. During AMMA, thelowest LNOx production rate per flash (PLNOx ) was observedin the MCS located south of the ITCZ in a more typicaltropical airmass, which agrees with our previous observa-tions during TROCCINOX and SCOUT-O3 (HH08; HH09).If we consider Hector thunderstorms to be typical globalthunderstorms, an annual global production rate of up to∼8 Tg(N) a−1 from lightning would be achieved. However,if we consider more typical tropical and subtropical thunder-storms observed during the three field campaigns, an annualglobal production rate of∼2 and∼4 Tg(N) a−1, respectively,is obtained. A general tendency to higher production rates inthe subtropics was observed. The influence from the higherwind shear in subtropical compared to the tropical regionswas discussed in detail in HH08 and HH09. Further impor-tant parameters influencing LNOx are discussed in the nextSect. 7. The overall mean for the annual global LNOx pro-duction rate based on results from the AMMA, SCOUT-O3and TROCCINOX field campaigns, was∼3 Tg(N) a−1, witha most likely range of∼1–8 Tg(N) a−1.
7 Recommendations for future LNOxparameterisations based on results from AMMA,SCOUT-O3, TROCCINOX and other studies
As mentioned in the introduction, the parameterisation ofLNOx in models still requires substantial improvements tobetter agree with observations of NOx and O3. In the lastyears, a number of publications have contributed to improveour knowledge about the different processes affecting theLNOx production that will be discussed briefly in this sec-tion. However, it is urgently needed to also incorporate thesenew findings into novel LNOx parameterisations.
To explain the differences inPLNOx observed duringAMMA, SCOUT-O3 and TROCCINOX, it would also beimportant to analyse additional parameters that might im-pact LNOx. For example, the thermodynamic surface condi-tions were different during these campaigns (see also HH07and HH09), with higher surface-2e temperatures duringSCOUT-O3 (∼355 K) compared to the other two campaigns(∼350 K) impacting the convective available potential en-ergy (CAPE). In the next paragraphs below, it is explainedwhy this and other parameters are crucial for LNOx esti-mates. In our future LNOx studies, we plan to focus moreclosely on the ice and graupel volume mass in thundercloudsand to use more detailed radar and lightning information asexplained below.
Atmos. Chem. Phys., 11, 2503–2536, 2011 www.atmos-chem-phys.net/11/2503/2011/

H. Huntrieser et al.: Mesoscale convective systems observed during AMMA 2527
One explanation for the high LNOx production rates ob-served in the Hector thunderstorm during SCOUT-O3 maybe related to the exceptional wide vertical extension of thevolume containing large ice and graupel particles in thecloud (radar reflectivity>35–40 dBZ), reaching up to∼12–16 km (HH09; Holler et al., 2009). The importance of thegraupel distribution and updraft velocities for lightning ini-tiation, structure and flash rates has been pointed out bye.g., Zipser (1994); Zipser and Lutz (1994); Toracinta etal. (2002); and Wiens et al. (2005). Deierling and Pe-tersen (2008) found that “large updraft volumes of “higher”updraft speeds are capable of producing more hydromete-ors in the mixed ice phase region and thus higher numberof collisions (between graupel and ice crystals) with subse-quent charge separation”. Lund et al. (2009) observed thatmost lightning in convective clouds over Oklahoma was initi-ated within the 35 dBZ radar contour containing graupel andwithin one of the two charge centres located between 3–6 km(positive/negative) or 7–10 km (positive/negative).
Observational, laboratory and model studies indicate thatdischarges preferably propagate into the cloud regions con-taining higher charge densities and that branching of the dis-charge increases in these regions, e.g. in the upper positivecharge region (Williams, 1985; Mansell et al., 2002; Wienset al., 2005; Cooray et al., 2009). For AMMA and TROCCI-NOX thunderstorms, the 35–40 dBZ radar reflectivity heightwas in general located lower compared to observations inHector (Holler et al., 2009). Due to the fact that the verticalextension of graupel and large ice particles may be reduced,we hypothesize that the branching of each discharge was alsoreduced. This type of reduced discharge extension has beenobserved by e.g., Bruning et al. (2007) in the initial thun-derstorm stage when cloud lightning only occurs within thelower positive and negative charge centre, before later flashesalso propagate into the upper charge centre.
It is known that the LNOx production per discharge is pro-portional to the channel length (Wang et al., 1998). Recentmodel studies by Cooray et al. (2009) indicate that the ma-jor contribution to NOx is produced by the electrical activitywithin the cloud (5–10 km altitude). Mainly slow dischargeprocesses play an important role for the NOx production asthe highly branched leaders (∼50% contribution), continuingcurrents, and M components (impulsive processes, that oc-cur during the continuing current following return strokes).The contribution to NOx from return strokes is in compar-ison almost negligible (<10%), as also observed from mea-surements in triggered lightning by Rahman et al. (2007). Wetherefore hypothesize, that due to the reduced vertical exten-sion of elevated radar reflectivity (>35–40 dBZ) observed inthe AMMA and TROCCINOX cases referred to above, theLNOx production per flash was also reduced in comparisonto e.g., Hector during SCOUT-O3. Reduced vertical exten-sion of elevated radar reflectivity has been observed in deepconvective clouds with reduced vertical velocity and reducedenvironmental CAPE (Rutledge et al., 1992; Williams et al.,
1992). During AMMA, it was observed that most MCS prop-agating along 8–16◦ N proceeded in an environment with rel-atively low CAPE, caused by the monsoon flow (Nieto Fer-reira et al., 2009).
For MCS hot spot regions, Zipser et al. (2006) observeda distinct difference in ice scattering signatures (85- and 37-GHz brightness temperatures) between the MCS in South-central United States, Southeast South America and the Sahelzone. Similar cloud top heights (85-GHz brightness temper-atures, generated by small precipitation sized ice, e.g., fewhundred microns) and 20-dBZ radar echo-top heights wereobserved in all three regions, however the 37-GHz brightnesstemperatures above MCS in the Sahel zone were in generalhigher compared to the other two regions. The 37-GHz sig-nal is attributed to the presence of larger (millimetre sized)graupel or frozen raindrops in convective cores (Toracintaet al., 2002). These observations indicate that 30- and 40-dBZ radar echo-top heights in Sahelian MCS were locatedlower (at higher temperatures) compared to the other twoMCS hot spot regions. Furthermore, radar measurementsfrom the Benin area carried out during AMMA confirm thatthe 40-dBZ level was in general observed at lower altitudes<5–6.5 km (Evaristo et al., 2010).
In the tropics in general, e.g., Toracinta et al. (2002) ob-served that for a given radar echo-top height of 20 dBZ, thevertical extension of the 30–40 dBZ layer is deeper in con-tinental convection compared to maritime convection. Dueto the influence of the monsoon, the radar features of theSahelian MCS seem to be in a mixed stage between typ-ical tropical continental convection and maritime convec-tion. During the monsoon season in the Amazon basin,Williams et al. (2002) even observed typical tropical mar-itime radar signatures in the deep continental convection andtermed the Amazon basin the “green ocean”. In deep con-vection in the Darwin area, Rutledge et al. (1992) also ob-served distinct differences in vertical radar reflectivity andlightning activity during the monsoon (more maritime type)and break periods (more continental type) even for cloudswith similar radar echo-tops. Recently, Futyan and Del Ge-nio (2007b) found a second order power-law relationship be-tween the lightning flash rate and the mean radar echo topheight above the 0◦C isotherm (valid both for the radar re-flectivity threshold>17 dBZ and>30 dBZ). This is the firstrelationship of its kind, which captures both the land-oceancontrast and regional differences in lightning occurrence, asbetween Africa, the Amazon, and the islands of the maritimecontinent.
In future studies to improve LNOx parameterisations, wetherefore highly recommend to incorporate the vertical ex-tent of the important ice charged cloud region. The exten-sion of the rainout zone and mixed phase zone in deep con-vection are important parameters that affect the microphysicsand determines the amount of supercooled liquid water andgraupel available in the upper part of the cloud (Rosenfeldand Lensky, 1998). Recently, Ott et al. (2010) distributed
www.atmos-chem-phys.net/11/2503/2011/ Atmos. Chem. Phys., 11, 2503–2536, 2011

2528 H. Huntrieser et al.: Mesoscale convective systems observed during AMMA
LNOx uniformly within the 20 dBZ contour computed fromsimulated hydrometeor fields in a cloud-scale model. Furtherimprovements may perhaps be achieved, if we focus more onthe vertical extension of the 35–40 dBZ region in the cloud,which has been found to affect the lightning activity substan-tially, as suggested by e.g., Toracinta et al. (2002) and Xu etal. (2010). Based on observations, Deierling et al. (2008)found a high correlation between lightning frequency andthe product of the downward mass flux of solid precipita-tion (graupel) and the upward mass flux if ice crystals, whichthey suggested to incorporate in future LNOx parameteri-sations. Furthermore, they suggested that “flash frequencythat isweighted by the flash lengthsor the power emitted byflashes may be more representative of the amount of chargeequalized by a flash and should be looked at in future re-search”. Recent findings by Cooray et al. (2009) indicate thatthe length of the lightning discharge channel inside the cloudis the most influencing parameter for the estimation of theglobal LNOx rate. In addition, HH08 and HH09 also pointedout the importance of this length as explanation for differentLNOx amounts per flash observed in different types of conti-nental thunderclouds (tropical/subtropical) during TROCCI-NOX and SCOUT-O3. Furthermore, in our previous analysesin tropical regions we also discussed the possible influencefrom the different stroke peak current distributions and meanstroke heights distributions (HH08, Holler et al., 2009).
Furthermore, parameters as CAPE, surface-2e, convec-tive inhibition (CIN), cloud base height (CBH), freezing level(0◦C), updraft velocity, wind shear and aerosol loading areall parameters that affect the intensity of the thunderstorm,lightning characteristics and finally LNOx, and that should be(and partly have been) considered in LNOx parameterisations(e.g., Zipser and LeMone, 1980; Szoke and Zipser, 1986;Szoke et al. 1986; Petersen and Rutledge, 1992; Rutledgeet al., 1992; Williams et al., 1992; Toracinta et al., 2002;Williams et al., 2002; Choi et al., 2005; Mushak et al., 2005;Pickering et al., 2009; Altaratz et al., 2010; Kelley et al.,2010). Up to recently, the majority of all LNOx parameter-isations were related toexternalcloud properties as convec-tive cloud top height (CTH), with different relationships forthe continent/ocean used to simulate the global lightning dis-tributions (Price and Rind, 1992). In the last years, improvedLNOx parameterisations have been proposed based on e.g.convective precipitation and upward convective mass flux(Allen et al., 2000; Grewe et al., 2001; Meijer et al., 2001;Allen and Pickering, 2002). Furthermore, Barthe and Pinty(2007) and Barthe et al. (2007) developed an explicit 3-Delectrical scheme for LNOx parameterisation in cloud resolv-ing models. Recently, Barthe et al. (2010) have conductedcloud resolving model simulations to examine the correlationbetween the observed flash rate and six model parameters(precipitation ice mass, ice water path, ice mass flux product,updraft volume, maximum vertical velocity, and cloud topheight). They found that the maximum vertical velocity andthe precipitation ice mass correlate best with the flash rate.
Good results were also achieved with the lightning poten-tial index (LPI) which is a function of the condensate mixingratios and the vertical velocity between 0 and−20◦ C (Yairet al., 2010). For future LNOx parameterisations, it wouldbe important to preferably consider microphysical processeswithin the cloud or parameters influencing these processes,as explained above. For many regional and global modelsthis is a challenge up to date.
Our results for the lightning-LNOx production rate, basedon field experiments in the tropics, are located at the lowerend of the values used in most regional and global modelstudies (see e.g. Hudman et al., 2007; Jourdain et al., 2010;Ott et al., 2010). In addition, our results are located at thelower end of Fig. 28 in the review article by SH07. However,Fig. 28 is mainly based on model results. We believe that themain reason for these differences between model studies andour studies is that the model studies are based on midlatitudestorm observations and our studies focus on thunderstormsin tropical regions. A recent study by Beirle et al. (2010),based on NO2 column densities from SCIAMACHY mea-surements, also indicate distinctly lower LNOx productionrates (less than 1 Tg(N) a−1) compared to model studies. Thelarge uncertainty range in the estimate of global LNOx pro-duction rate therefore still remains. From our point of view,we need more observations of LNOx in different types of re-gions. These regional estimates of LNOx production rate perflash may then be used in model studies to improve the re-gional and global estimates. For future observations of LNOxit would also be important to investigate more cases of vig-orous convection penetrating the tropopause, as frequentlyobserved over e.g., Central Africa (Congo) (Liu and Zipser,2005; Futyan and Del Genio, 2007a). Simultaneous mea-surements of radar reflectivity, lightning and NOx distribu-tions seem to be essential to achieve improvements in theparameterisation of LNOx.
8 Summary and conclusions
In this study we presented measurements carried out overWest Africa with the German research aircraftFalcon (andpartly Russian M55Geophysica) and with the LINET light-ning location network during the AMMA field phase in Au-gust 2006. In this season, the monsoon was fully developedand specific wind regimes were prominent, as the AfricanEasterly Jet (AEJ) in the lower and mid troposphere (∼3–5 km), and the Tropical Easterly Jet (TEJ) in the UT.
We focused our analyses on the chemical composition inthe outflow of two large MCS probed on 6 and 15 August,located north and south of the ITCZ (∼10◦ N), respectively.Both MCS contained rather low amounts of NOx producedby lightning (∼50% of total NOx in the fresh outflow) com-pared to our previous observations in tropical regions duringTROCCINOX and SCOUT-O3 (HH07; HH08; HH09). Inthe anvil outflow (∼10–12 km), the contribution from LNOxwas on average<0.2 nmol mol−1 (peak∼1 nmol mol−1) and
Atmos. Chem. Phys., 11, 2503–2536, 2011 www.atmos-chem-phys.net/11/2503/2011/

H. Huntrieser et al.: Mesoscale convective systems observed during AMMA 2529
the contribution from the BL was in a similar range. Thehighest LNOx mixing ratios were observed closest to the con-vective core and at the highest flight level (11.9 km). Abovethis level, much higher LNOx mixing ratios are not expected,since the clouds only extended up to∼13 km and the ma-jority of IC strokes were observed below 11 km. DuringAMMA, the TEJ (core∼13–14 km) probably prevented theclouds from growing higher.
In comparison to the huge extension of these MCS (sev-eral 100 km wide), the stroke rate (∼0.04–0.07 s−1) wasin the same range as observed in average tropical thunder-storms (∼30–50 km) during our previous campaigns (hereonly LINET strokes with peak currents≥10 kA contribut-ing to LNOx were considered for an unbiased comparisonwith the other thunderstorms). The LNOx mass flux (FLNOx )in the MCS outflow during AMMA was estimated to be inthe range of∼100 g(N) s−1. Combined with the stroke rate,the LNOx production rate per LINET stroke (PLNOx ) wasestimated to be∼1.3 and∼3.3 kg(N) for the MCS on 15and 6 August, respectively. For a better comparison withother studies, LINET strokes were scaled with LIS flashesand a factor of 0.77 LINET strokes per LIS flash was esti-mated. These values then correspond to∼1.0 and 2.5 kg(N)per LIS flash for the MCS on 15 and 6 August, respectively.If we assume, that our different MCS during AMMA are typ-ically global thunderstorms (LIS flash rate∼44 s−1), the an-nual global LNOx production rate (GLNOx ) was estimated tobe∼1.4 and 3.5 Tg(N) a−1 based on these two different MCS(factor 2.5 difference). The range of theGLNOx values esti-mated here is located at lower range of 5±3 Tg(N) a−1, asgiven in SH07 as best present estimate of the annual globalLNOx production rate. The overall mean forGLNOx esti-mated from selected AMMA, SCOUT-O3 and TROCCINOXthunderstorms was∼3 Tg(N) a−1, with the most likely rangeof ∼1–8 Tg(N) a−1. Especially the thunderstorms investi-gated during SCOUT-O3 (Northern Australia) produced highamounts of flashes and LNOx.
During AMMA, the lowest LNOx production rate per flash(PLNOx ) was observed in the MCS located south of the ITCZin a more typical tropical airmass, which agrees with ourprevious observations during TROCCINOX and SCOUT-O3(HH08; HH09). In our previous studies it was argued, thatthese differences inPLNOx may partly be caused by the dif-ferent vertical wind shear observed in tropical and subtropi-cal airmasses. It was shown thatPLNOx was in general posi-tively correlated with the wind shear. In contrast to our pre-vious observations in tropical and subtropical airmasses, theabsolute value of the wind velocity difference between theanvil region and the steering level was rather similar for bothpresented cases from AMMA, as a result of the prevailingAEJ. The single velocity values in the anvil and steering levelwere however very different, on 6 August the wind velocityincreased and on 15 August it decreased with altitude. Inthis case, the MCS with the higher wind velocity in the UT(located north of the ICTZ closer to the subtropics) also pro-
duced more LNOx per flash, a tendency also observed duringthe TC4 field experiment by Bucsela et al. (2010). Our pre-vious analyses also suggested that the different vertical windshear impacts the flash length and therefore the LNOx pro-duction rate per flash (HH08; HH09). Recently, Cooray etal. (2009) also found thatlength of the lightning dischargechannelis the most influencing parameter for estimating theglobal LNOx production rate.
To explain the differences inPLNOx observed duringAMMA, SCOUT-O3 and TROCCINOX it would also beimportant to analyse additional parameters that might im-pact LNOx. During AMMA, it was observed that mostMCS propagating along 8–16◦ N proceeded in an environ-ment with relatively low CAPE, caused by the monsoon flow(Nieto Ferreira et al., 2009). As a result, the 35–40 dBZ radarreflectivity height was in general located lower compared toobservations in Hector (Holler et al., 2009). Radar measure-ments from the Benin area carried out during AMMA con-firm that the 40-dBZ level was in general observed at loweraltitudes<5–6.5 km (Evaristo et al., 2010). In our futureLNOx studies, we plan to focus more closely on the ice andgraupel volume mass in thunderclouds and to use more de-tailed radar and lightning information. One explanation forthe high LNOx production rates observed in the Hector thun-derstorm during SCOUT-O3 may be connected to the excep-tional wide vertical extension of the volume containing largeice and graupel particles in the cloud, reaching up to∼12–16 km according to radar data (HH09; Holler et al., 2009).As a result, highly branched lightning channels may origi-nate, producing a high amount of LNOx per flash.
In this study the influence of MCS on both the NOx and O3distribution in the UT was studied in detail. It was shown thatthe dry Saharan air layer (SAL) located in∼3–5 km playsa crucial role for the chemical composition of trace gasesobserved in the MCS outflow. North of the ITCZ (∼10◦ N)this layer capped the subjacent monsoon layer and preventedfresh BL emissions from being ingested into the MCS on6 August. In comparison, the investigated MCS on 15 Au-gust was located south of the ITCZ over a different vegeta-tion zone with increasing forest/shrub cover and further awayfrom the SAL. In this case, the trace gas composition in theMCS outflow indicated that more fresh emissions were trans-ported upward directly from the BL (higher CO and HCOmixing ratios). In the fresh outflow, O3 mixing ratios werealmost as low as observed in the inflow region in both cases(∼35 nmol mol−1), due to efficient vertical transport withinthe MCS. As the outflow aged, mixing with the ambient airwas the most prominent feature during the first hours. Espe-cially, south of the ITCZ, where the free tropospheric compo-sition is largely impacted by aged biomass burning plumes,the mixing with these O3-rich airmasses enhanced O3 mix-ing ratios in the MCS outflow very rapidly from∼35 to65 nmol mol−1 within 2–3 h.
From the findings presented in this paper, we get furtherevidence that the conditions in the BL are essential for the
www.atmos-chem-phys.net/11/2503/2011/ Atmos. Chem. Phys., 11, 2503–2536, 2011

2530 H. Huntrieser et al.: Mesoscale convective systems observed during AMMA
chemical composition observed in the fresh and aged MCSoutflow region, and later for the production of O3. Fur-thermore, the injection height of the ingested emissions alsoseems to play an important role. For future field experi-ments we therefore recommend to also investigate the chem-ical composition in the MCSinflow region in more detail ifwe should learn more about the O3 production in the MCSoutflow. It would be important to find out more about whichtrace gases are most important for the O3 production in theMCS outflow. Regions with biomass burning seem to play animportant role. Furthermore, it would be important to followthe evolution of the trace gas composition in the aged MCSoutflow as long as possible and perhaps to use additional ar-tificial tracers for longer detection.
Appendix A
Vertical wind shear estimate
For the calculation of the horizontal LNOx mass flux inSect. 4.4, the difference between the wind vectors in theanvil outflow and at the steering levelVa−Vs must be es-timated. The values forVa were determined from the meanwind velocity in the anvil outflow for the selected flight seg-ments. The values forVs were determined from the spatialLINET stroke evolution based on horizontal stroke distri-butions with a high temporal resolution of 10 min. For theMCS on 6 August, the value forVa for the flight segments5–6 was 13.1 m s−1 from a northeasterly direction (∼70◦).For the flight segments 8–9 the value forVa was rather sim-ilar with 12.3 m s−1 from an easterly direction (∼95◦). Thevalue forVs was determined to be 6.5 m s−1 from a north-easterly direction (∼70◦). The resulting differencesVa−Vs(6.6 and 7.0 m s−1, respectively) for these two flight seg-ments are listed in Table 3. In comparison, for the MCSon 15 August the value forVa for the flight segments 5–6was slightly lower with 9.7 m s−1 from a southeasterly di-rection (∼105◦) and the value forVs was distinctly higherwith 12.5 m s−1 from a northeasterly direction (∼60◦). Inthis case, the wind velocity decreased with altitude and thewind direction changed more with altitude. The resulting dif-ferenceVa−Vs (8.9 m s−1) is again listed in Table 3.
Acknowledgements.Based on a French initiative, AMMA wasbuilt by an international scientific group and was funded by a largenumber of agencies, especially from France, the UK, the UnitedStates, and Africa. It has been a beneficiary of a major financialcontribution from the European Community Sixth FrameworkProgramme (AMMA-EU). Detailed information on scientificcoordination and funding is available on the AMMA Internationalwebsite athttp://www.amma-international.org. The measurementspresented here were partially also funded by the DLR (DeutschesZentrum fur Luft- und Raumfahrt) and other AMMA partners.We thank the Falcon and Geophysica pilots, the engineers andscientists of the flight departments for the excellent support duringthe field phase. The LINET system was installed in the Benin
area as a joint effort between DLR and the University AbomeyCalavi (E. Houngninou, E. Lezinme). We greatly acknowledgeL. Oswald (DLR) for making the LINET system operationspossible, M. Zich (nowcast GmbH) for the system support, the IRD(L’Institut de recherche pour le developpement) and AOC (AMMAoperation centre) staff in Cotonou for logistic help. We expressour gratitude to the lightning team at MSFC-NASA for the accessto the LIS data and Meteo France for the processing of the MSGdata (http://aoc.amma-international.org/observation/satellite/). Theauthors wish to thank the World Wide Lightning Location Network(http://wwlln.net), a collaboration among over 50 universitiesand institutions, for providing the lightning location data used inthis paper. ECMWF is acknowledged for permitting access totheir data archives. Finally, we thank Martin Dameris (DLR), thetwo anonymous reviewers and the editor for their comments andsuggestions, which greatly helped to improve the manuscript.
Edited by: C. Reeves
References
Allen, D., Pickering, K., Stenchikov, G., Thompson, A., andKondo, Y.: A three-dimensional total odd nitrogen (NOy)simulation during SONEX using a stretched-grid chemi-cal transport model, J. Geophys. Res., 105, 3851–3876,doi:10.1029/1999JD901029, 2000.
Allen, D. J. and Pickering, K. E.: Evaluation of lightning flash rateparameterizations for use in a global chemical-transport model, J.Geophys. Res., 107(D23), 4711,doi:10.1029/2002JD002066,2002.
Altaratz, O., Koren, I., Yair, Y., and Price, C.: Lightning response tosmoke from Amazonian fires, Geophys. Res. Lett., 37, L07801,doi:10.1029/2010GL042679, 2010.
Ancellet, G., Leclair de Bellevue, J., Mari, C., Nedelec, P., Kukui,A., Borbon, A., and Perros, P.: Effects of regional-scale and con-vective transports on tropospheric ozone chemistry revealed byaircraft observations during the wet season of the AMMA cam-paign, Atmos. Chem. Phys., 9, 383–411,doi:10.5194/acp-9-383-2009, 2009.
Andres-Hernandez, M. D., Kartal, D., Reichert, L., Burrows, J. P.,Meyer Arnek, J., Lichtenstern, M., Stock, P., and Schlager, H.:Peroxy radical observations over West Africa during AMMA2006: photochemical activity in the outflow of convective sys-tems, Atmos. Chem. Phys., 9, 3681–3695,doi:10.5194/acp-9-3681-2009, 2009.
Andres-Hernandez, M. D., Stone, D., Brookes, D. M., Commane,R., Reeves, C. E., Huntrieser, H., Heard, D. E., Monks, P. S.,Burrows, J. P., Schlager, H., Kartal, D., Evans, M. J., Floquet, C.F. A., Ingham, T., Methven, J., and Parker, A. E.: Peroxy rad-ical partitioning during the AMMA radical intercomparison ex-ercise, Atmos. Chem. Phys., 10, 10621–10638,doi:10.5194/acp-10-10621-2010, 2010.
Arlander, D. W., Bruning, D., Schmidt, U., and Ehhalt, D. H.: Thetropospheric distribution of formaldehyde during TROPOZ II, J.Atmos. Chem., 22, 251–268, 1995.
Avery, M., Twohy, C., McCabe, D., Joiner, J., Severance, K., At-las, E., Blake, D., Bui, T. P., Crounse, J., Dibb, J., Diskin,G., Lawson, P., McGill, M., Rogers, D., Sachse, G., Scheuer,E., Thompson, A. M., Trepte, C., Wennberg, P., and Ziemke,
Atmos. Chem. Phys., 11, 2503–2536, 2011 www.atmos-chem-phys.net/11/2503/2011/

H. Huntrieser et al.: Mesoscale convective systems observed during AMMA 2531
J.: Convective distribution of tropospheric ozone and trac-ers in the Central American ITCZ region: Evidence fromobservations during TC4, J. Geophys. Res., 115, D00J21,doi:10.1029/2009JD013450, 2010.
Baehr, J., Schlager, H., Ziereis, H., Stock, P., van Velthoven, P.,Busen, R., Strom, J., and Schumann, U.: Aircraft observationsof NO, NOy, CO, and O3 in the upper troposphere from 60◦ N to60◦ S – Interhemispheric differences at midlatitudes, Geophys.Res. Lett., 30, 1598,doi:10.1029/2003GL016935, 2003.
Barret, B., Ricaud, P., Mari, C., Attie, J.-L., Bousserez, N., Josse,B., Le Flochmoen, E., Livesey, N. J., Massart, S., Peuch, V.-H., Piacentini, A., Sauvage, B., Thouret, V., and Cammas, J.-P.: Transport pathways of CO in the African upper troposphereduring the monsoon season: a study based upon the assimilationof spaceborne observations, Atmos. Chem. Phys., 8, 3231–3246,doi:10.5194/acp-8-3231-2008, 2008.
Barret, B., Williams, J. E., Bouarar, I., Yang, X., Josse, B., Law, K.,Pham, M., Le Flochmoen, E., Liousse, C., Peuch, V. H., Carver,G. D., Pyle, J. A., Sauvage, B., van Velthoven, P., Schlager,H., Mari, C., and Cammas, J.-P.: Impact of West African Mon-soon convective transport and lightning NOx production uponthe upper tropospheric composition: a multi-model study, At-mos. Chem. Phys., 10, 5719–5738,doi:10.5194/acp-10-5719-2010, 2010.
Barth, M. C., Kim, S.-W., Wang, C., Pickering, K. E., Ott, L. E.,Stenchikov, G., Leriche, M., Cautenet, S., Pinty, J.-P., Barthe,Ch., Mari, C., Helsdon, J. H., Farley, R. D., Fridlind, A. M., Ack-erman, A. S., Spiridonov, V., and Telenta, B.: Cloud-scale modelintercomparison of chemical constituent transport in deep con-vection, Atmos. Chem. Phys., 7, 4709–4731,doi:10.5194/acp-7-4709-2007, 2007.
Barthe, C. and Pinty, J.-P.: Simulation of a supercellular stormusing a three-dimensional mesoscale model with an explicitlightning flash scheme, J. Geophys. Res., 112, D06210,doi:10.1029/2006JD007484, 2007.
Barthe, C., Pinty, J.-P., and Mari, C.: Lightning-produced NOx in anexplicit electrical scheme tested in a Stratosphere-TroposphereExperiment: radiation, aerosols, and ozone case study, J. Geo-phys. Res., 112, D04302,doi:10.1029/2006JD007402, 2007.
Barthe, C., Deierling, W., and Barth, M. C.: Estimation oftotal lightning from various storm parameters: A cloud-resolving model study, J. Geophys. Res., 115, D24202,doi:10.1029/2010JD014405, 2010.
Bechara, J., Borbon, A., Jambert, C., Colomb, A., and Perros, P. E.:Evidence of the impact of deep convection on reactive VolatileOrganic Compounds in the upper tropical troposphere during theAMMA experiment in West Africa, Atmos. Chem. Phys., 10,10321–10334,doi:10.5194/acp-10-10321-2010, 2010.
Beirle, S., Huntrieser, H., and Wagner, T.: Direct satellite obser-vation of lightning-produced NOx, Atmos. Chem. Phys., 10,10965–10986,doi:10.5194/acp-10-10965-2010, 2010.
Bertram, T. H., Perring, A. E., Wooldridge, P. J., Crounse, J. D.,Kwan, A. J., Wennberg, P. O., Scheuer, E., Dibb, J., Avery, M.,Sachse, G., Vay., S. A., Crawford, J. H., McNaughton, C. S.,Clarke, A., Pickering, K. E., Fuelberg, H., Huey, G., Blake, D.R., Singh, H. B., Hall, S. R., Shetter, R. E., Fried, A., Heikes,B. G., and Cohen, R. C.: Direct measurements of the convectiverecycling of the upper troposphere, Science, 315, 816–820, 2007.
Betz, H.-D., Schmidt, K., Oettinger, W. P., and Wirz, M.:
Lightning detection with 3-D-discrimination of intracloud andcloud-to-ground discharges, Geophys. Res. Lett., 31, L11108,doi:10.1029/2004GL019821, 2004.
Betz, H.-D., Schmidt, K., Fuchs, B., Oettinger, W. P. and Holler, H.:Cloud lightning: Detection and utilization for total lightningmeasured in the VLF/LF regime, J. Lightning Res., 2, 1–17,http://www.jolr.org/, 2007.
Betz, H.-D., Schmidt, K., Laroche, P., Blanchet, P., Oettinger, W. P.,Defer, E., Dziewit, Z., and Konarski, J.: LINET – An interna-tional lightning detection network in Europe, Atmos. Res., 91,564–573, 2009.
Bhetanabhotla, M. N., Crowell, B. A., Coucouvinos, A., Hill, R. D.,and Rinker, R. G.: Simulation of trace species production bylightning and corona discharge in moist air, Atmos. Environ., 19,1391–1397, 1985.
Boccippio, D. J., Koshak, W. J., and Blakeslee, R. J.: Performanceassessment of the tropical transient detector and lightning imag-ing sensor. Part I: Predicted diurnal variability, J. Atmos. OceanicTechnol., 19, 1318–1332, 2002.
Bolton, D.: The computation of equivalent potential temperature,Mon. Weather Rev., 108, 1046–1053, 1980.
Bruning, E. C., Rust, W. D., Schuur, T. J., MacGorman, D. R., Kre-hbiel, P. R., and Rison, W.: Electrical and polarimetric radar ob-servations of a multicell storm in TELEX, Mon. Weather Rev.,135, 2525–2544, 2007.
Bucsela, E. J., Pickering, K. E., Huntemann, T. L., Cohen, R. C.,Perring, A., Gleason, J. F., Blakeslee, R. J., Albrecht, R. I.,Holzworth, R., Cipriani, J. P., Vargas-Navarro, D., Mora-Segura,I., Pacheco-Hernandez, A., and Laporte-Molina, S.: Lightning-generated NOx seen by OMI during NASA’s TC4 experiment, J.Geophys. Res., 115, D00J10,doi:10.1029/2009JD013118, 2010.
Burpee, R.: The origin and structure of easterly waves in the lowertroposphere of North Africa, J. Atmos. Sci., 29, 77–90, 1972.
Cairo, F., Pommereau, J. P., Law, K. S., Schlager, H., Garnier,A., Fierli, F., Ern, M., Streibel, M., Arabas, S., Borrmann, S.,Berthelier, J. J., Blom, C., Christensen, T., D’Amato, F., Di Don-francesco, G., Deshler, T., Diedhiou, A., Durry, G., Engelsen,O., Goutail, F., Harris, N. R. P., Kerstel, E. R. T., Khaykin, S.,Konopka, P., Kylling, A., Larsen, N., Lebel, T., Liu, X., MacKen-zie, A. R., Nielsen, J., Oulanowski, A., Parker, D. J., Pelon, J.,Polcher, J., Pyle, J. A., Ravegnani, F., Riviere, E. D., Robinson,A. D., Rockmann, T., Schiller, C., Simes, F., Stefanutti, L., Stroh,F., Some, L., Siegmund, P., Sitnikov, N., Vernier, J. P., Volk, C.M., Voigt, C., von Hobe, M., Viciani, S., and Yushkov, V.: An in-troduction to the SCOUT-AMMA stratospheric aircraft, balloonsand sondes campaign in West Africa, August 2006: rationale androadmap, Atmos. Chem. Phys., 10, 2237–2256,doi:10.5194/acp-10-2237-2010, 2010.
Cetrone, J. and Houze, R. A.: Anvil clouds of tropical mesoscaleconvective systems in monsoon regions, Q. J. Roy. Meteor. Soc.,135, 305–317,doi:10.1002/qj.389, 2009.
Chameides, W. L., Stedman, D. H., Dickerson, R. R., Rusch, D. W.,and Cicerone, R. J.: NOx production in lightning, J. Atmos. Sci.,34, 143–149, 1977.
Chameides, W. L., Davis, D. D., Bradshaw, J., Rodgers, M., Sand-holm, S., and Bai, D. B.: An estimate of the NOx productionrate in electrified clouds based on NO observations from theGTE/CITE 1 fall 1983 field operation, J. Geophys. Res., 92,2153–2156, 1987.
www.atmos-chem-phys.net/11/2503/2011/ Atmos. Chem. Phys., 11, 2503–2536, 2011

2532 H. Huntrieser et al.: Mesoscale convective systems observed during AMMA
Chatfield, R. B. and Crutzen, P. J.: Sulfur dioxide in remote oceanicair: Cloud transport of reactive precursors, J. Geophys. Res., 89,7111–7132, 1984.
Chatfield, R. and Delany, A.: Convection links biomass burning toincreased tropical ozone: however, models will tend to overpre-dict O3, J. Geophys. Res., 95(D11), 18473–18488, 1990.
Choi, Y., Wang, Y., Zeng, T., Martin, R. V., Kurosu, T. P., andChance, K.: Evidence of lightning NOx and convective trans-port of pollutants in satellite observations over North America,Geophys. Res. Lett., 32, L02805,doi:10.1029/2004GL021436,2005.
Christian, H. J., Blakeslee, R. J., Goodman, S. J., Mach, D. A.,Stewart, M. F., Buechler, D. E., Koshak, W. J., Hall, J. M.,Boeck, W. L., Driscoll, K. T., and Bocippio, D. J.: The Light-ning Imaging Sensor, Proceedings of the 11th International Con-ference on Atmospheric Electricity, Guntersville, Alabama, 7–11June 1999, 746–749, 1999.
Christian, H. J., Blakeslee, R. J., Boccippio, D. J., Boeck, W. L.,Buechler, D. E., Driscoll, K. T., Goodman, S. J., Hall, J. M.,Koshak, W. J., Mach, D. M., and Stewart, M. F.: Global fre-quency and distribution of lightning as observed from space bythe Optical Transient Detector, J. Geophys. Res., 108, 4005,doi:10.1029/2002JD002347, 2003.
Christian, H. J. and Petersen, W.: Global lightning activity, Con-ference on Meteorological Applications of Lightning Data, 85thAMS Annual Meeting, San Diego, CA, 10–12 January, 2005.
Cifelli, R., Lang, T., Rutledge, S. A., Guy, N., Zipser, E. J., Zawis-lak, J., and Holzworth, R.: Characteristics of an african easterlywave observed during NAMMA, J. Atmos. Sci., 67, 3–25, 2010.
Cooray, V., Rahman, M., and Rakov, V.: On the NOx productionby laboratory electrical discharges and lightning, J. Atmos. Sol.-Terr. Phys., 71, 1877–1889, 2009.
Crumeyrolle, S., Tulet, P., Gomes, L., Garcia-Carreras, L., Flamant,C., Parker, D. J., Matsuki, A., Formenti, P., and Schwarzenboeck,A.: Transport of dust particles from the Bodl region to the mon-soon layer - AMMA case study of the 9-14 June 2006 period, At-mos. Chem. Phys., 11, 479–494,doi:10.5194/acp-11-479-2011,2011.
Crutzen, P. J.: The influence of nitrogen oxides on the atmosphericozone content, Q. J. Roy. Meteor. Soc., 96, 320–327, 1970.
DeCaria, A. J., Pickering, K. E., Stenchikov, G. L., andOtt, L. E.: Lightning-generated NOx and its impact on tropo-spheric ozone production: A three-dimensional modeling studyof a Stratosphere-Troposphere Experiment: Radiation, Aerosolsand Ozone (STERAO-A) thunderstorm, J. Geophys. Res., 110,D14303,doi:10.1029/2004JD005556, 2005.
Deierling, W. and Petersen, W. A.: Total lightning activity as an in-dicator of updraft characteristics, J. Geophys. Res., 113, D16210,doi:10.1029/2007JD009598, 2008.
Deierling, W., Petersen, W. A., Latham, J., Ellis, S., and Chris-tian, H. J.: The relationship between lightning activity andice fluxes in thunderstorms, J. Geophys. Res., 113, D15210,doi:10.1029/2007JD009700, 2008.
Dessler, A. E.: The effect of deep tropical convection on thetropical tropopause layer, J. Geophys. Res., 107(D3), 4033,doi:10.1029/2001JD000511, 2002.
Dickerson, R. R., Huffman, G. J., Luke, W. T., Nunnermacker, L.J., Pickering, K. E., Leslie, A. C. D., Lindsey, C. G., Slinn, W.G. N., Kelly, T. J., Daum, P. H., Delany, A. C., Greenberg, J. P.,
Zimmerman, P. R., Boatman, J. F., Ray, J. D. and Stedman, D.H.: Thunderstorms: An important mechanism in the transport ofair pollutants, Science, 235, 460–465, 1987.
Doherty, R. M., Stevenson, D. S., Collins, W. J., and Sanderson,M. G.: Influence of convective transport on tropospheric ozoneand its precursors in a chemistry-climate model, Atmos. Chem.Phys., 5, 3205–3218,doi:10.5194/acp-5-3205-2005, 2005.
Dufour, G., Wittrock, F., Camredon, M., Beekmann, M., Richter,A., Aumont, B., and Burrows, J. P.: SCIAMACHY formalde-hyde observations: constraint for isoprene emission esti-mates over Europe?, Atmos. Chem. Phys., 9, 1647–1664,doi:10.5194/acp-9-1647-2009, 2009.
Evaristo, R., Scialom, G., Viltard, N., and Lemaıtre, Y.: Po-larimetric signatures and hydrometeor classification of WestAfrican squall lines, Q. J. Roy. Meteor. Soc., 136(s1), 272–288,doi:10.1002/qj.561, 2010.
Fehr, T., Holler, H., and Huntrieser, H.: Model study on pro-duction and transport of lightning-produced NOx in an EU-LINOX supercell storm, J. Geophys. Res., 109, D09102,doi:10.1029/2003JD003935, 2004.
Fishman, J., Solomon, S., and Crutzen, P. J.: Observational and the-oretical evidence in support of a significant in situ photochemicalsource of tropospheric ozone, Tellus, 31, 432–446, 1979.
Folkins, I., Oltmans, S. J., and Thompson, A. M.: Tropical convec-tive outflow and near surface equivalent potential temperatures,Geophys. Res. Lett., 27, 2549–2552, 2000.
Folkins, I., Braun, C., Thompson, A. M., and Witte, J.: Tropicalozone as an indicator of deep convection, J. Geophys. Res., 107,4184,doi:10.1029/2001JD001178, 2002.
Folkins, I. and Martin, R. V.: The vertical structure of tropical con-vection and its impact on the budgets of water vapor and ozone, J.Atmos. Sci., 62, 1560–1573, 2005.
Fueglistaler, S., Dessler, A. E., Dunkerton, T. J., Folkins, I., Fu, Q.,Mote, P. W.: The tropical tropopause layer, Rev. Geophys., 47,RG1004,doi:10.1029/2008RG000267, 2009.
Futyan, J. M. and Del Genio, A. D.: Deep convective system evolu-tion over Africa and the tropical Atlantic, J. Climate, 20, 5041–5060, 2007a.
Futyan, J. M. and Del Genio, A. D.: Relationships between light-ning and properties of convective cloud clusters, Geophys. Res.Lett., 34, L15705,doi:10.1029/2007GL030227, 2007b.
Gettelman, A., Forster, P. M. deF., Fujiwara, M., Fu, Q., Vomel,H., Gohar, L. K., Johanson, C., and Ammerman, M.: Radiationbalance of the tropical tropopause layer, J. Geophys. Res., 109,D07103,doi:10.1029/2003JD004190, 2004.
Grewe, V., Brunner, D., Dameris, M., Grenfell, J. L., Hein, R., Shin-dell, D., and Staehelin, J: Origin and variability of upper tropo-spheric nitrogen oxides and ozone at northern mid-latitudes, At-mos. Environ., 35, 3421–3433, 2001.
Highwood, E. J. and Hoskins, B. J.: The tropical tropopause, Q. J.Roy. Meteor. Soc., 124, 1579–1604, 1998.
Hodges, K. I. and Thorncroft, C. D.: Distribution and statistics ofafrican mesoscale convective weather systems based on the IS-CCP meteosat imagery, Mon. Weather Rev., 125, 2821–2837,1997.
Holler, H., Finke, U., Huntrieser, H., Hagen, M., and Feigl, C.:Lightning produced NOx (LINOX) – experimental design andcase study results, J. Geophys. Res., 104, 13911–13922, 1999.
Holler, H., Betz, H.-D., Schmidt, K., Calheiros, R. V., May, P.,
Atmos. Chem. Phys., 11, 2503–2536, 2011 www.atmos-chem-phys.net/11/2503/2011/

H. Huntrieser et al.: Mesoscale convective systems observed during AMMA 2533
Houngninou, E., and Scialom, G.: Lightning characteristics ob-served by a VLF/LF lightning detection network (LINET) inBrazil, Australia, Africa and Germany, Atmos. Chem. Phys., 9,7795–7824,doi:10.5194/acp-9-7795-2009, 2009.
Homan, C. D., Volk, C. M., Kuhn, A. C., Werner, A., Baehr, J., Vi-ciani, S., Ulanovski, A., and Ravegnani, F.: Tracer measurementsin the tropical tropopause layer during the AMMA/SCOUT-O3 aircraft campaign, Atmos. Chem. Phys., 10, 3615–3627,doi:10.5194/acp-10-3615-2010, 2010.
Houze, R. A.: Cloud Dynamics, Academic, San Diego, California,573 pp., 1993.
Houze, R. A.: Mesoscale convective systems, Rev. Geophys., 42,RG4003,doi:10.1029/2004RG000150, 2004.
Hudman, R. C., Jacob, D. J., Turquety, S., Leibensperger, E. M.,Murray, L. T., Wu, S., Gilliland, A. B., Avery, M., Bertram,T. H., Brune, W., Cohen, R. C., Dibb, J. E., Flocke, F. M.,Fried, A., Holloway, J., Neuman, J. A., Orville, R., Perring, A.,Ren, X., Ryerson, T. B., Sachse, G. W., Singh, H. B., Swan-son, A., and Wooldridge, P. J.: Surface and lightning sourcesof nitrogen oxides in the United States: Magnitudes, chem-ical evolution, and outflow, J. Geophys. Res., 112, D12S05,doi:10.1029/2006JD007912, 2007.
Huntemann, T. and Pickering, K.: Cloud-resolving simulations ofHector during SCOUT-O3/ACTIVE: case 16 November 2005, inpreparation, 2011.
Huntrieser, H., Schlager, H., Feigl, C., and Holler, H.: Transportand production of NOx in electrified thunderstorms: Survey ofprevious studies and new observations at mid-latitudes, J. Geo-phys. Res., 103, 28247–28264, 1998.
Huntrieser, H., Feigl, C., Schlager, H., Schroder, F., Gerbig, C.,van Velthoven, P., Flatøy, F., Thery, C., Petzold, A., Holler, H.,and Schumann, U.: Airborne measurements of NOx, tracerspecies and small particles during the European Lightning Ni-trogen Oxides Experiment, J. Geophys. Res., 107(D11), 4113,doi:10.1029/2000JD000209, ACH5-1–ACH5-24, 2002.
Huntrieser, H., Heland, J., Schlager, H., Forster, C., Stohl, A.,Aufmhoff, H., Arnold, F., Scheel, E., Campana, M., Gilge,S., Eixmann, R., and Cooper, O.: Intercontinental air pollutiontransport from North America to Europe: experimental evidencefrom airborne measurements and surface observations, J. Geo-phys. Res., 110, D01305,doi:10.1029/2004JD005045, 2005.
Huntrieser, H., Schlager, H., Roiger, A., Lichtenstern, M., Schu-mann, U., Kurz, C., Brunner, D., Schwierz, C., Richter, A., andStohl, A.: Lightning-produced NOx over Brazil during TROC-CINOX: airborne measurements in tropical and subtropical thun-derstorms and the importance of mesoscale convective systems,Atmos. Chem. Phys., 7, 2987–3013,doi:10.5194/acp-7-2987-2007, 2007.
Huntrieser, H., Schumann, U., Schlager, H., Holler, H., Giez, A.,Betz, H.-D., Brunner, D., Forster, C., Pinto Jr., O., and Calheiros,R.: Lightning activity in Brazilian thunderstorms during TROC-CINOX: implications for NOx production, Atmos. Chem. Phys.,8, 921–953,doi:10.5194/acp-8-921-2008, 2008.
Huntrieser, H., Schlager, H., Lichtenstern, M., Roiger, A., Stock,P., Minikin, A., Holler, H., Schmidt, K., Betz, H.-D., Allen, G.,Viciani, S., Ulanovsky, A., Ravegnani, F., and Brunner, D.: NOxproduction by lightning in Hector: first airborne measurementsduring SCOUT-O3/ACTIVE, Atmos. Chem. Phys., 9, 8377–8412,doi:10.5194/acp-9-8377-2009, 2009.
Jacob, D. J., Heikes, B. G., Fan, S.-M., Logan, J. A., Mauzerall,D. L., Bradshaw, J. D., Talbot, R. W., Blake, D. R., and Sachse,G. W.: Origin of ozone and NOx in the tropical troposphere:A photochemical analysis of aircraft observations over the SouthAtlantic basin, J. Geophys. Res., 101(D19), 24235–24250, 1996.
Janicot, S., Thorncroft, C. D., Ali, A., Asencio, N., Berry, G., Bock,O., Bourles, B., Caniaux, G., Chauvin, F., Deme, A., Kergoat, L.,Lafore, J.-P., Lavaysse, C., Lebel, T., Marticorena, B., Mounier,F., Nedelec, P., Redelsperger, J.-L., Ravegnani, F., Reeves, C.E., Roca, R., de Rosnay, P., Schlager, H., Sultan, B., Tomasini,M., Ulanovsky, A., and ACMAD forecasters team: Large-scaleoverview of the summer monsoon over West Africa during theAMMA field experiment in 2006, Ann. Geophys., 26, 2569–2595,doi:10.5194/angeo-26-2569-2008, 2008.
Jenkins G. S. and Pratt, A.: Saharan dust, lightning and tropical cy-clones in the eastern tropical Atlantic during NAMMA-06, Geo-phys. Res. Lett., 35, L12804,doi:10.1029/2008GL033979, 2008.
Jonquieres, I., Marenco, A., Maalej, A., and Rohrer, F.: Study ofozone formation and trans-atlantic transport from biomass burn-ing emissions over West Africa during the airborne campaignsTROPOZ I and TROPOZ II, J. Geophys. Res., 103(D15), 19059–19073, 1998.
Jourdain, L., Kulawik, S. S., Worden, H. M., Pickering, K. E.,Worden, J., and Thompson, A. M.: Lightning NOx emis-sions over the USA constrained by TES ozone observations andthe GEOS-Chem model, Atmos. Chem. Phys., 10, 107–119,doi:10.5194/acp-10-107-2010, 2010.
Keenan, T. D. and Carbone, R. E.: A preliminary morphology ofprecipitation systems in tropical Northern Australia, Q. J. Roy.Meteor. Soc., 118, 283–326, 1992.
Kelley, O. A., Stout, J., Summers, M., and Zipser, E. J.: Do thetallest convective cells over the tropical ocean have slow up-drafts?, Mon. Weather Rev., 138, 1651–1672, 2010.
Koike, M., Kondo, Y., Kita, K., Takegawa, N., Nishi, N., Kashihara,T., Kawakami, S., Kudoh, S., Blake, D., Shirai, T., Liley,B., Ko, M., Miyazaki, Y., Kawasaki, Z., and Ogawa, T.:Measurements of reactive nitrogen produced by tropical thun-derstorms during BIBLE-C, J. Geophys. Res., 112, D18304,doi:10.1029/2006JD008193, 2007.
Kollias P., Miller, M. A., Johnson, K. L., Jensen, M. P., andTroyan, D. T.: Cloud, thermodynamic, and precipitation ob-servations in West Africa during 2006, J. Geophys. Res., 114,D00E08,doi:10.1029/2008JD010641, 2009.
Laing, A. G. and Fritsch, J. M.: Mesoscale Convective Complexesin Africa, Mon. Weather Rev., 121, 2254–2263, 1993.
Laing, A. G. and Fritsch, J. M.: The global population of mesoscaleconvective complexes, Q. J. Roy. Meteor. Soc., 123, 389–405,doi:10.1002/qj.49712353807, 1997.
Laing, A. G., Fritsch, J. M., and Negri, A. J.: Contribution ofMesoscale Convective Complexes to rainfall in Sahelian Africa:estimates from geostationary infrared and passive microwavedata, J. Appl. Meteorol., 38, 957–964, 1999.
Laing, A. G., Carone, R., Levizzani, V., and Tuttle, J.: Thepropagation and diurnal cycles of deep convection in North-ern Tropical Africa, Q. J. Roy. Meteor. Soc., 134, 93–109,doi:10.1002/qj.194, 2008.
Laurent, H., D’Amato, N., and Lebel, T.: How important is the con-tribution of the mesoscale convective complexes to the Sahelianrainfall?, Phys. Chem. Earth, 23, 629–633, 1998.
www.atmos-chem-phys.net/11/2503/2011/ Atmos. Chem. Phys., 11, 2503–2536, 2011

2534 H. Huntrieser et al.: Mesoscale convective systems observed during AMMA
Law, K. S., Fierli, F., Cairo, F., Schlager, H., Borrmann, S., Streibel,M., Real, E., Kunkel, D., Schiller, C., Ravegnani, F., Ulanovsky,A., D’Amato, F., Viciani, S., and Volk, C. M.: Air mass originsinfluencing TTL chemical composition over West Africa during2006 summer monsoon, Atmos. Chem. Phys., 10, 10753–10770,doi:10.5194/acp-10-10753-2010, 2010.
Lawrence, M. G., von Kuhlmann, R., and Salzmann, M.: The bal-ance of effects of deep convective mixing on tropospheric ozone,Geophys. Res. Lett., 30(18), 1940,doi:10.1029/2003GL017644,2003.
Lay, E. H., Holzworth, R. H., Rodger, C. J., Thomas, J. N., Pinto,O., Jr., Dowden, R. L.: WWLL global lightning detection sys-tem: Regional validation study in Brazil, Geophys. Res. Lett.,31, L03102,doi:10.1029/2003GL018882, 2004.
Lebel, T., Diedhiou, A., and Laurent, H.: Seasonal cy-cle and interannual variability of the Sahelian rainfallat hydrological scales, J. Geophys. Res., 108(D8), 8389,doi:10.1029/2001JD001580, 2003.
Lebel, T., Parker, D. J., Flamant, C., Bourles, B., Marticorena,B., Mougin, E., Peugeot, C., Diedhiou, A., Haywood, J. M.,Ngamini, J. B., Polcher, J., Redelsperger, J.-L., and Thorncroft,C. D.: The AMMA field campaigns: multiscale and multidisci-plinary observations in the West African region, Q. J. Roy. Me-teor. Soc., 136(S1), 8–33,doi:10.1002/qj.486, 2009.
Lelieveld, J. and Crutzen, P. J.: Role of deep cloud convection inthe ozone budget of the troposphere, Science, 264, 1759–1761,1994.
Liu, C. and Zipser, E. J.: Global distribution of convection pene-trating the tropical tropopause, J. Geophys. Res., 110, D23104,doi:10.1029/2005JD006063, 2005.
Lund, N. R., MacGorman, D. R., Schuur, T. J., Biggerstaff, M. I.,and Rust, W. D.: Relationships between lightning location andpolarimetric radar signatures in a small mesoscale convectivesystem, Mon. Weather Rev., 137, 4151–4170, 2009.
Maddox, R. A.: Mesoscale convective complexes, B. Am. Meteo-rol. Soc., 61, 1374–1387, 1980.
Mansell, E. R., MacGorman, D. R., Ziegler, C. L., andStraka, J. M.: Simulated three-dimensional branched lightningin a numerical thunderstorm model, J. Geophys. Res., 107, 4075,doi:10.1029/2000JD000244, 2002.
Mari, C. H., Cailley, G., Corre, L., Saunois, M., Attie, J.L., Thouret, V., and Stohl, A.: Tracing biomass burningplumes from the Southern Hemisphere during the AMMA 2006wet season experiment, Atmos. Chem. Phys., 8, 3951–3961,doi:10.5194/acp-8-3951-2008, 2008.
Martin, R. V., Jacob, D. J., Logan, J. A., Bey, I., Yantosca,R. M., Staudt, A. C., Li, Q., Fiore, A. M., Duncan, B.N., Liu, H., Ginoux, P., and Thouret, V.: Interpretation ofTOMS observations of tropical tropospheric ozone with a globalmodel and in situ observations, J. Geophys. Res., 107, 4351,doi:10.1029/2001JD001480, 2002.
Martin, R. V., Sioris, C. E., Chance, K., Ryerson, T. B., Bertram,T. H., Wooldridge, P. J., Cohen, R. C., Neuman, J. A., Swanson,A., and Flocke, F. M.: Evaluation of space-based constraints onglobal nitrogen oxide emissions with regional aircraft measure-ments over and downwind of Eastern North America, J. Geo-phys. Res., 111, D15308,doi:10.1029/2005JD006680, 2006.
Martin, R. V., Sauvage, B., Folkins, I., Sioris, C. E., Boone, C.,Bernath, P., and Ziemke, J.: Space-based constraints on the
production of nitric oxide by lightning, J. Geophys. Res., 112,D09309,doi:10.1029/2006JD007831, 2007.
Mathon, V. and Laurent, H.: Life cycle of Sahelian mesoscale con-vective cloud systems, Q. J. Roy. Meteor. Soc., 127, 377–406,doi:10.1002/qj.49712757208, 2001.
Mathon, V., Laurent, H., and Lebel, T.: Mesoscale convective sys-tem rainfall in the Sahel. J. Appl. Meteorol., 41, 1081–1092,2002.
Meijer, E. W., van Velthoven, P. F. J., Brunner, D. W.,Huntrieser, H., and Kelder, H.: Improvement and evaluation ofthe parameterisation of nitrogen oxide production by lightning,Phys. Chem. Earth, 26, 577–583, 2001.
Mohr, K. I. and Zipser, E. J.: Mesoscale convective systems definedby their 85-GHz ice scattering signature: size and intensity com-parison over tropical oceans and continents, Mon. Weather Rev.,124, 2417–2437, 1996.
Mushtak, V. C., Williams, E. R., and Boccippio, D. J.: Latitudinalvariations of cloud base height and lightning parameters in thetropics, Atmos. Res., 76, 222–230, 2005.
Nicholson, S. E.: A revised picture of the structure of the “mon-soon” and land ITCZ over West Africa, Clim. Dynam., 32, 1155–1171, 2009.
Nieto Ferreira, R., Rickenbach, T., Guy, N., and Williams, E.: Radarobservations of convective system variability in relationship toAfrican easterly waves during the 2006 AMMA Special Observ-ing Period, Mon. Weather Rev., 137, 4136–4150, 2009.
Ott, L. E., Pickering, K. E., Stenchikov, G. L., Huntrieser, H.,and Schumann, U.: Effects of lightning NOx productionduring the July 21 European Lightning Nitrogen OxidesProject storm studied with a three-dimensional cloud-scalechemical transport model, J. Geophys. Res., 112, D05307,doi:10.1029/2006JD007365, 2007.
Ott, L. E., Pickering, K. E., Stenchikov, G. L., Allen, D., De-Caria, A., Ridley, B., Lin, R.-F., Lang, S., and Tao, W.-K.: Production of lightning NOx and its vertical distribu-tion calculated from three-dimensional cloud-scale chemicaltransport model simulations, J. Geophys. Res., 115, D04301,doi:10.1029/2009JD011880, 2010.
Parker, D. J., Burton, R. R., Diongue-Niang, A., Ellis, R. J., Fel-ton, M., Taylor, C. M., Thorncroft, C. D., Bessemoulin, P.,and Tompkins, A. M.: The diurnal cycle of the West Africanmonsoon circulation, Q. J. Roy. Meteor. Soc., 131, 2839–2860,2005a.
Petersen, W. A. and Rutledge, S. A.: Some characteristics of cloud-to-ground lightning in tropical Northern Australia, J. Geophys.Res., 97, 11553–11560, 1992.
Pickering, K. E., Thompson, A. M., Tao, W.-K., and Kucsera, T. L.:Upper tropospheric ozone production following mesoscale con-vection during STEP/EMEX, J. Geophys. Res., 98, 8737–8749,1993.
Pickering, K. E., Thompson, A. E., Wang, Y., Tao, W.-K., McNa-mara, D. P., Kirchhoff, V. W. J. H., Heikes, B. G., Sachse, G.W., Bradshaw, J. D., Gregory, G. L., and Blake, D. R.: Convec-tive transport of biomass burning emissions over Brazil duringTRACE-A, J. Geophys. Res., 101, 23993–24012, 1996.
Pickering, K. E., Huntrieser, H. and Schumann, U.: Lightning andNOx production in global models, In: Lightning: Principles, In-struments and Applications, Review of Modern Lightning Re-search, edited by: Betz, H. D., Schumann, U., and Laroche, P.,
Atmos. Chem. Phys., 11, 2503–2536, 2011 www.atmos-chem-phys.net/11/2503/2011/

H. Huntrieser et al.: Mesoscale convective systems observed during AMMA 2535
Springer Verlag, 551–571, ISBN:978-1-4020-9078-3, 2009.Price, C. and Rind, D.: A simple lightning parameterization for
calculating global lightning distributions, J. Geophys. Res., 97,9919–9933, 1992.
Rahman, M., Corray, V., Rakov, V. A., Uman, M. A., Liyanage, P.,DeCarlo B. A., Jerauld, J., and Olsen III, R. C.: Measurementsof NOx produced by rocket-triggered lightning, Geophys. Res.Lett., 34, L03816,doi:10.1029/2006GL027956, 2007.
Real, E., Orlandi, E., Law, K. S., Fierli, F., Josset, D., Cairo, F.,Schlager, H., Borrmann, S., Kunkel, D., Volk, C. M., McQuaid,J. B., Stewart, D. J., Lee, J., Lewis, A. C., Hopkins, J. R., Raveg-nani, F., Ulanovski, A., and Liousse, C.: Cross-hemispherictransport of central African biomass burning pollutants: impli-cations for downwind ozone production, Atmos. Chem. Phys.,10, 3027–3046,doi:10.5194/acp-10-3027-2010, 2010.
Redelsperger, J. L., Thorncroft, C. D., Diedhiou, A., Lebel, T.,Parker, D. J., and Polcher, J.: African monsoon multidisciplinaryanalysis: an international research project and field campaign,B. Am. Meteorol. Soc., 87(12), 1739–1746,doi:10.1175/BAMS-87-12-1739, 2006.
Reeves, C. E., Formenti, P., Afif, C., Ancellet, G., Attie, J.-L.,Bechara, J., Borbon, A., Cairo, F., Coe, H., Crumeyrolle, S.,Fierli, F., Flamant, C., Gomes, L., Hamburger, T., Jambert, C.,Law, K. S., Mari, C., Jones, R. L., Matsuki, A., Mead, M. I.,Methven, J., Mills, G. P., Minikin, A., Murphy, J. G., Nielsen,J. K., Oram, D. E., Parker, D. J., Richter, A., Schlager, H.,Schwarzenboeck, A., and Thouret, V.: Chemical and aerosolcharacterisation of the troposphere over West Africa during themonsoon period as part of AMMA, Atmos. Chem. Phys., 10,7575–7601,doi:10.5194/acp-10-7575-2010, 2010.
Richter, A. and Burrows, J. P.: Retrieval of tropospheric NO2 fromGOME measurements, Adv. Space Res., 29, 1673–1683, 2002.
Rickenbach, T., Nieto Ferreira, R., Guy, N., and Williams, E.:Radar-observed squall line propagation and the diurnal cycle ofconvection in Niamey, Niger, during the 2006 African Monsoonand Multidisciplinary Analyses Intensive Observing Period, J.Geophys. Res., 114, D03107,doi:10.1029/2008JD010871, 2009.
Roca, R., Lafore, J.-P., Piriou, C., and Redelsperger, J.-L.: Extrat-ropical dry-air intrusions into the West African monsoon midtro-posphere: An important factor for the convective activity overthe Sahel, J. Atmos. Sci., 62, 390–407, 2005.
Rosenfeld, D. and Lensky, I. M.: Spaceborne sensed insights intoprecipitation formation processes in continental and maritimeclouds, B. Am. Meteorol. Soc., 79, 2457–2476, 1998.
Rowell, D. P. and Milford, J. R.: On the generation of African squalllines, J. Climate, 6, 1181–1193, 1993.
Rutledge, S. A., Williams, E. R., and Keenan, T. D.: TheDown-Under Doppler and Electricity Experiment (DUNDEE):overview and preliminary results, B. Am. Meteorol. Soc., 73, 3–16, 1992.
Saunders, C. P. R., Keith, W. D., and Mitzeva, R. P.: The effectof liquid water on thunderstorm charging, J. Geophys. Res., 96,11007–11017, 1991.
Saunois, M., Reeves, C. E., Mari, C. H., Murphy, J. G., Stewart, D.J., Mills, G. P., Oram, D. E., and Purvis, R. M.: Factors control-ling the distribution of ozone in the West African lower tropo-sphere during the AMMA (African Monsoon MultidisciplinaryAnalysis) wet season campaign, Atmos. Chem. Phys., 9, 6135–6155,doi:10.5194/acp-9-6135-2009, 2009.
Sauvage, B., Thouret, V., Cammas, J.-P., Gheusi, F., Athier, G., andNedelec, P.: Tropospheric ozone over Equatorial Africa: regionalaspects from the MOZAIC data, Atmos. Chem. Phys., 5, 311–335,doi:10.5194/acp-5-311-2005, 2005.
Sauvage, B., Gheusi, F., Thouret, V., Cammas, J.-P., Duron, J., Es-cobar, J., Mari, C., Mascart, P., and Pont, V.: Medium-range mid-tropospheric transport of ozone and precursors over Africa: twonumerical case studies in dry and wet seasons, Atmos. Chem.Phys., 7, 5357–5370,doi:10.5194/acp-7-5357-2007, 2007.
Schmidt, K., Betz, H.-D., Oettinger, W. P., Wirz, M., and Diendor-fer, G.: A new lightning detection network in Southern Germany,27th International Conference on Lightning Protection (ICLP),September 2004, Avignon, France, 2004.
Schmidt, K., Betz, H.-D., Oettinger, W. P., Wirz, M., Pinto Jr., O.,Naccarato, K. P., Holler, H., Fehr, T., and Held, G.: A com-parative analysis of lightning data during the EU-Brazil TROC-CINOX/TroCCiBras campaign, VIII International Symposiumon Lightning Protection (SIPDA), 21–25 Nov 2005, Sao Paulo,Brazil, 2005.
Schmidt, K.: Ortung und Analyse von Blitzentladungen mittelsRegistrierung von VLF-Atmospherics innerhalb eines Mess-netzes, Ph.D. thesis, Ludwig-Maximilians-Universitat, Munich,Germany, 2007.
Schumann, U. and Huntrieser, H.: The global lightning-inducednitrogen oxides source, Atmos. Chem. Phys., 7, 3823–3907,doi:10.5194/acp-7-3823-2007, 2007.
Sioris, C. E., McLinden, C. A., Martin, R. V., Sauvage, B., Ha-ley, C. S., Lloyd, N. D., Llewellyn, E. J., Bernath, P. F.,Boone, C. D., Brohede, S., and McElroy, C. T.: Vertical pro-files of lightning-produced NO2 enhancements in the upper tro-posphere observed by OSIRIS, Atmos. Chem. Phys., 7, 4281–4294,doi:10.5194/acp-7-4281-2007, 2007.
Skamarock, W. C., Dye, J. E., Defer, E., Barth, M. C.,Stith, J. L., Ridley, B. A., and, Baumann, K.: Observational-and modelling-based budget of lightning-produced NOx ina continental thunderstorm, J. Geophys. Res., 108, 4305,doi:10.1029/2002JD002163, 2003.
Stefanutti, L., MacKenzie, A. R., Santacesaria, V., Adriani, A.,Balestri, S., Borrmann, S., Khattatov, V., Mazzinghi, P., Mitev,V., Rudakov, V., Schiller, C., Toci, G., Volk, C. M., Yushkov,V., Flentje, H., Kiemle, C., Redaelli, G., Carslaw, K. S., Noone,K., and Peter, Th.: The APE-THESEO tropical campaign: anoverview, J. Atmos. Chem., 48, 1–33, 2004.
Stevenson, D. S., Dentener, F. J., Schultz, M. G., Ellingsen, K.,van Noije, T. P. C., Wild, O., Zeng, G., Amann, M., Ather-ton, C. S., Bell, N., Bergmann, D. J., Bey, I., Butler, T., Co-fala, J., Collins, W. J., Derwent, R. G., Doherty, R. M., Drevet,J., Eskes, H. J., Fiore, A. M., Gauss, M., Hauglustaine, D. A.,Horowitz, L. W., Isaksen, I. S. A., Krol, M. C., Lamarque, J.-F., Lawrence, M. G., Montanaro, V., Mueller, J.-F., Pitari, G.,Prather, M. J., Pyle, J. A., Rast, S., Rodriguez, J. M., Sander-son, M. G., Savage, N. H., Shindell, D. T., Strahan, S. E., Sudo,K., and Szopa, S.: Multimodel ensemble simulations of present-day and near-future tropospheric ozone, J. Geophys. Res., 111,D08301,doi:10.1029/2005JD006338, 2006.
Szoke, E. J. and Zipser, E. J.: A radar study of convective cellsin mesoscale systems in GATE. Part II: Life cycle of convectivecells, J. Atmos. Sci., 43, 199–218, 1986.
Szoke, E. J., E. J. Zipser, and D. P. Jorgensen: A radar study of
www.atmos-chem-phys.net/11/2503/2011/ Atmos. Chem. Phys., 11, 2503–2536, 2011

2536 H. Huntrieser et al.: Mesoscale convective systems observed during AMMA
convective cells in mesoscale systems in GATE. Part I: Verticalprofile statistics and comparison with hurricanes, J. Atmos. Sci.,43, 182–198, 1986.
Takahashi, T.: Riming electrification as a charge generation mech-anism in thunderstorms, J. Atmos. Sci., 35, 1536–1548, 1978.
Thomas, R. J., Krehbiel, P. R., Rison, W., Hamlin, T., Boccip-pio, D. J., Goodman, S. J., and Christian, H. J.: Comparisonof ground-based 3-dimensional lightning mapping observationswith satellite-based LIS observations in Oklahoma, Geophys.Res. Lett., 27, 1703–1706, 2000.
Thompson, A. M., Pickering, K. E., Dickerson, R. R., Ellis,Jr., W. G., Jacob, D. J., Scala, J. R., Tao, W. K., McNamara, D. P.,and Simpson, J.: Convective transport over the central UnitedStates and its role in regional CO and ozone budgets, J. Geophys.Res., 99, 18703–18711, 1994.
Thompson, A. M., Tao, W. K., Pickering, K. E., Scala, J. R., andSimpson, J.: Tropical deep convection and ozone formation, B.Am. Meteorol. Soc., 78, 1043–1054, 1997.
Thorncroft, C. and Haile, M.: The mean dynamical and thermody-namic fields for July 1989 over tropical North Africa and their re-lationship to convective storm activity, Mon. Weather Rev., 123,3016–3031, 1995.
Thorncroft, C. D., Parker, D. J., Burton, R. R., Diop, M., Hayers,J. H., Barjat, H., Dumelow, R., Kindred, D. R., Price, N. M.,Taylor, C. M., and Tompkins, A. M.: The JET2000 Project: air-craft observations of the african easterly jet and african easterlywaves, B. Am. Meteorol. Soc., 84, 337–351, 2003.
Toracinta, E. R., Cecil, D. J., Zipser, E. J., and Nesbitt, S. W.: Radar,passive microwave, and lightning characteristics of precipitatingsystems in the tropics, Mon. Weather Rev., 130, 802–824, 2002.
Tost, H., Jockel, P., and Lelieveld, J.: Lightning and convec-tion parameterisations – uncertainties in global modelling, At-mos. Chem. Phys., 7, 4553–4568,doi:10.5194/acp-7-4553-2007,2007.
Volz-Thomas, A., Lerner, A., Patz, H.-W., Schultz, M.,McKenna, D. S., Schmitt, R., Madronich, S., and Roth, E. P.:Airborne measurements of the photolysis frequency of NO2, J.Geophys. Res., 101, 18613–18627, 1996.
Wang, Y., DeSilva, A. W., and Goldenbaum, G. C.: Nitric oxideproduction by simulated lightning: Dependence on current, en-ergy, and pressure, J. Geophys. Res., 103, 19149–19159, 1998.
Wiens, K. C., Rutledge, S. A., and Tessendorf, S. A.: The 29 June2000 supercell observed during STEPS. Part II: Lightning andcharge structure, J. Atmos. Sci., 62, 4151–4177, 2005.
Williams, E. R.: Electrical discharge propagation in and aroundspace charge clouds, J. Geophys. Res., 90, 6059–6070, 1985.
Williams, E. R., Rutledge, S. A., Geotis, S. G., Renno, N., Ras-mussen, E., and Rickenbach, T.: A radar end electrical study oftropical “hot towers”, J. Atmos. Sci., 49, 1386–1395, 1992.
Williams, E., Rosenfeld, D., Madden, N., Gerlach, J., Gears, N.,Atkinson, L., Dunnemann, N., Frostrom, G., Antonio, M., Bi-azon, B., Camargo, R., Franca, H., Gomes, A., Lima, M.,Machado, R., Manhaes, S., Nachtigall, L., Piva, H., Quintiliano,W., Machado, L., and Artaxo, P.: Contrasting convective regimesover the Amazon: implications for cloud electrification, J. Geo-phys. Res., 107, 8082,doi:10.1029/2001JD000380, 2002.
WMO: Scientific Assessment of Ozone Depletion: 1998, WorldMeteorological Organisation, Geneva, Switzerland, 1999.
Xiao, Y., Jacob, D. J., and Turquety, S.: Atmospheric acetylene andits relationship with CO as an indicator of air mass age, J. Geo-phys. Res., 112, D12305,doi:10.1029/2006JD008268, 2007.
Xu, W., Zipser, E. J., Liu, C., and Jiang, H.: On the relationshipsbetween lightning frequency and thundercloud parameters of re-gional precipitation systems, J. Geophys. Res., 115, D12203,doi:10.1029/2009JD013385, 2010.
Yair, Y., Lynn, B., Price, C., Kotroni, V., Lagouvardos, K., Morin,E., Mugnai, A., and del Carmen Llasat, M.: Predicting thepotential for lightning activity in Mediterranean storms basedon the Weather Research and Forecasting (WRF) model dy-namic and microphysical fields, J. Geophys. Res., 115, D04205,doi:10.1029/2008JD10868, 2010.
Zipser, E. J.: Deep cumulonimbus cloud systems in the tropicswith and without lightning, Mon. Weather Rev., 122, 1837–1851,1994.
Zipser, E. J. and LeMone, M. A.: Cumulonimbus Vertical VelocityEvents in GATE. Part II: Synthesis and Model Core Structure, J.Atmos. Sci., 37, 2458–2469, 1980.
Zipser, E. J. and Lutz, K. R.: The vertical profile of radar reflec-tivity of convective cells: A strong indicator of storm intensityand lightning probability?, Mon. Weather Rev., 122, 1751–1759,1994.
Zipser, E. J., Cecil, D. J., Liu, C., Nesbitt, S. W., and Yorty, D. P.:Where are the most intense thunderstorms on Earth? B. Am.Meteorol. Soc., 87, 1057–1071, 2006.
Zipser, E. J., Twohy, C. H., Tsay, S. C., Thornhill, K. L., Tanelli, S.,Ross, R., Krishnamurti, T. N., Ji, Q., Jenkins, G., Ismail, S., Hsu,N. C., Hood, R., Heymsfield, G. M., Halverson, J., Goodman, H.M., Ferrare, R., DUNION, J. P., Douglas, M., Cifelli, R., Chen,G., Browell, E. V., and Anderson, B.: The Saharan air layer andthe fate of African easterly waves – NASA’s AMMA field studyof tropical cyclogenesis, B. Am. Meteorol. Soc., 90, 1137–1156,2009.
Atmos. Chem. Phys., 11, 2503–2536, 2011 www.atmos-chem-phys.net/11/2503/2011/