messages autos & auto parts initiate coverage with seven important … · 2013-12-16 · japan...
TRANSCRIPT

Japan | Industrials
Autos & Auto Parts 21 November 2013
Autos & Auto PartsInitiate Coverage with Seven ImportantMessages
EQU
ITY R
ESEARC
H JA
PAN
Auto OEMs Sector: OperatingIncome Estimates
Source: Jefferies estimates
(¥bn) Operating IncomeCompany TSE FY3/14E FY3/15EToyota Motor 7203 2,450.0 2,510.0Honda Motor 7267 825.0 975.0Nissan Motor 7201 500.0 600.0Mazda 7261 180.0 210.0Suzuki 7269 180.0 197.0FHI 7270 315.0 315.0Daihatsu Motor 7262 145.0 130.0Yamaha Motor 7272 54.0 67.0
Investment Rating and PriceTargets
Source: Jefferies
Ratings TargetToyota Motor Hold 6,700 9%Honda Motor Buy 4,700 17%Nissan Motor Hold 950 6%Mazda Buy 530 17%Suzuki Hold 2,600 7%Fuji Heavy Industries Hold 3,000 9%Daihatsu Motor Hold 1,700 -4%Yamaha Motor Hold 1450 -5%
Jefferies PriceCompanyExpected
Total Return
Takaki Nakanishi *Equity Analyst
* Jefferies (Japan) Limited
Key Takeaway
Japanese automobile sector revival has put it on course to reach record profits,but the jury is still out on whether a golden age is due to return. What we cansay with some confidence is that margins certainly appear somewhat overdonein view of the companies' intrinsic global competitiveness, and they will likelyfind it hard to maintain this unless managements take appropriate directions.We offer 7 important messages as we initiate coverage.
Sector stance is "Neutral": We rate the sector “Neutral” for four reasons: (1) earningsrecovery looks set to hit a plateau; (2) reduced forex sensitivity will mean the weaker yenis no longer a significant share price driver; (3) we recognize the risk that valuations willdecline; and (4) restoration of the global competitiveness of Japanese OEMs is still a work-in-progress.
Investment Strategy for 2014: Strategically speaking, we think the right approach is astaged reduction in weightings in highly forex-sensitive names whose share prices have risensharply, whereas companies which can establish global competitive strength and deliverhigh top-line growth are promising, regardless of how sensitive they are to forex. Our toppick in the sector is Honda Motor (7267), which we rate Buy with a ¥4,700 price target.Among second-tier names we rate Mazda (7261) Buy with a ¥530 price target. Our order ofpreference among the J3 (descending) is 1. Honda, 2. Toyota, 3. Nissan.
Restoring global competitiveness still work-in-progress: The Japanese OEMs haverecovered world-leading earnings power, but the process of restoring real competitivenessis still only half-done, and margins are not backed by robust competitive strength. Weidentify four key elements which we think are important for the automobile industry'scompetitiveness through to 2020: (1) new architecture breakthroughs delivering superiorcosts and performance; (2) innovations which overcome significant scale and complexity;(3) management capabilities on both the strategic and "soft" fronts; and (4) brands andpremium strategies.
Projections for Manufacturing Free Cash Flows
Source: Company data and Jefferies estimates
Jefferies does and seeks to do business with companies covered in its research reports. As a result, investors should be aware that Jefferies may have aconflict of interest that could affect the objectivity of this report. Investors should consider this report as only a single factor in making their investmentdecision. Please see analyst certifications, important disclosure information, and information regarding the status of non-US analysts on pages 45 to 47of this report.
Executive Summary
Investment conclusions
Our stance on the Japan Autos OEM sector is ‚Neutral‛ because (1) sector earnings
recovery looks set to a plateau; (2) reduced forex sensitivity will mean the weaker yen is
no longer a significant share price driver; (3) we recognize the risk that valuations will
decline; and (4) restoration of the global competitiveness of Japanese OEMs is still a work-
in-progress. Our judgement for now is that further improvement in Japanese OEMs sector
profitability is more unlikely to come to reality.
Our top pick in the sector is Honda Motor (7267), which we rate Buy with a ¥4,700 price
target. Among second-tier firms we recommend Mazda (7261) as a Buy with a ¥530 price
target. We rate all the remaining six companies Hold (Toyota Motor, Nissan Motor, Fuji
Heavy Industries, Suzuki Motor, Daihatsu Motor, and Yamaha Motor).
We have not rated any of the companies Underperform for now. However, we think
appropriate care should be taken over companies which are close to the top end of their
DCF-based theoretical share price ranges, given increasingly challenging competition in
emerging markets and smaller weaker yen sensitivity to earnings.
From a portfolio strategy point of view, we believe weightings in highly forex-sensitive
companies whose share prices have risen sharply should be reduced over time, whereas
weightings should be actively increased in Honda and Mazda, which we believe can
improve comparative competitive positions on the global markets and deliver higher top-
line growth, regardless of their relative forex sensitivity.
There are two important anti-consensus views which we try to address in the note. First,
we are downbeat on Toyota’s improving financial leverage hypothesis. Second, we are
thinking that the weaker yen is no longer a significant share price driver for the sector,
similar to the period between CY2001and CY2004 where as Japanese OEMs’ forex
sensitivity cut below 2% and provided the lowest point of their valuations.
We feel Toyota could remain a promising investment if it opts for a switch in its financial
strategy towards increased financial leverage, such as lifting its dividend payout ratio or
actively implementing share buy-backs. However, our anti-consensus view is that Toyota
will not substantially change its financial policy anytime soon, and indeed, we believe it
will belatedly turn around and begin rather stronger capex and future growth aimed
spending. This is an important point in our Hold thesis on the company.
In this note, we tried to analyse the reduced forex sensitivity (i.e. below the 2% mark) of
Japanese Auto OEMs and the potential risk for valuations to decline. In short, we are now
getting more convinced to say that ‚the weaker yen is no longer a significant share price
driver for the sector,‛ except for a couple of names which are still highly sensitive such as
Yamaha Motor and Fuji Heavy.
Fundamentals conclusions
Our estimates are based on the following assumptions.
1. Exchange rates: ¥100/$ and ¥130/€.
2. US SAAR: Gradual growth from 15.6 million units in CY2013 to 16 million units in
CY2014
3. Japanese SAAR: 5.51 million units (up 5.8% YoY) in FY3/14, 5.17 million units (down
6.1% YoY) in FY3/15. As a risk scenario, sales could fall well below 5 million units if
the acquisition tax is not lowered, or if other vehicle automobile related taxes are
increased, even if the acquisition tax is cut.
The automobile sector is likely to achieve record profit in FY3/14. We expect the total
operating profit of the eight companies we cover will be ¥4,649.0 billion (up 62.6% YoY),
topping the ¥4,563.7 billion in FY3/08 for the first time in six years.
Industrials
Autos & Auto Parts
21 November 2013
page 2 of 47 , Equity Analyst, [email protected] Nakanishi
Please see important disclosure information on pages 45 - 47 of this report.

We expect that the total sector operating profit for FY3/15 will be ¥5,004.0 billion (up 8%
YoY). Four companies, namely Honda, Nissan, Mazda and Yamaha, whose earnings
recovery has been delayed, are likely to see their earnings achieve double-digit growth,
while Toyota and FHI, which have enjoyed a relatively stronger recovery to date, are likely
to see their growth slow.
Daihatsu, which has a high domestic sales ratio, is likely to see a fall in earnings. There is a
large difference between our forecasts and the market consensus. Our forecasts for
Daihatsu and Yamaha are anti-consensus calls, as ours are more than 10% lower than the
consensus. Our forecasts for Toyota and Nissan are 5% and 9% lower than the consensus,
respectively.
Industrials
Autos & Auto Parts
21 November 2013
page 3 of 47 , Equity Analyst, [email protected] Nakanishi
Please see important disclosure information on pages 45 - 47 of this report.

Chapter 1: Sector investment opinion
and investment thesis
Seven Important Messages
Chart 1: Japanese Auto Sector: Investment rating and valuation
Note: Yamaha Motor's fiscal year end is December. Source: Jefferies estimates, company data
In this report we have the following seven important messages to convey as we initiate
coverage of the eight main companies in Japan's auto OEMs sector.
1. Our stance on the Japan Autos OEM sector is ‚Neutral‛. We envisage the average
sector price to rise around 7% over the coming 12 months (note: an average of the
expected changes to our price targets for companies we cover), which might
possibly struggle to outperform TOPIX. There are four reasons for our Neutral
stance: (1) sector earnings recovery looks set to a plateau; (2) reduced forex
sensitivity will mean the weaker yen is no longer a significant share price driver; (3)
we recognize the risk that valuations will decline; and (4) restoration of global
competitiveness of Japanese OEMs is still a work-in-progress.
2. We rate two companies Buy, namely Honda Motor and Mazda Motor, and all the
remaining six companies Hold (Toyota Motor, Nissan Motor, Fuji Heavy Industries,
Suzuki Motor, Daihatsu Motor, and Yamaha Motor).
3. Our top pick in the sector is Honda Motor (7267), which we rate Buy with a ¥4,700
price target. Among second-tier firms we recommend Mazda (7261) as a Buy with a
¥530 price target.
4. Our recommended order among the J3 is (1) Honda, (2) Toyota, (3) Nissan. We
think investors should gradually shift portfolio weightings from Toyota to Honda.
5. Valuations are low across the board, and we see no risk of a large fall in share prices,
in the absence of any untoward downturn in earnings, and we have thus not rated
any of the companies Underperform. However, we think appropriate care should be
taken over companies which are close to the top end of their DCF-based theoretical
share price ranges, given increasingly challenging competition in emerging markets
and smaller weaker yen sensitivity to earnings.
6. From a portfolio strategy point of view, we believe weightings in highly forex-
sensitive companies whose share prices have risen sharply should be reduced over
time, whereas weightings should be actively increased in Honda and Mazda, which
we believe can improve comparative competitive positions on the global markets
and deliver higher top-line growth, regardless of their relative forex sensitivity.
7. We feel Toyota could remain a promising investment if it opts for a switch in its
financial strategy towards increased financial leverage, such as lifting its dividend
TSE Company Rating Price (¥) Price Target Expected PER (x) PBR (x) Core EV/EBITDA (x) E
P2013/11/19 (¥) Returns FY3/13 A FY3/14 E FY3/15 E FY3/13 A FY3/14 E FY3/15 E FY3/13 A FY3/14 E FY3/15 E
7203 Toyota Motor Hold 6,300 6,700 9% 20.7 10.9 11.0 1.6 1.4 1.3 7.6 4.6 4.3
7267 Honda Motor Buy 4,095 4,700 17% 20.1 12.2 10.5 1.5 1.3 1.2 7.7 5.4 4.7
7201 Nissan Motor Hold 926 950 6% 11.3 10.6 9.3 1.0 0.9 0.9 3.8 4.0 3.4
7261 Mazda Buy 452 530 17% 39.4 13.1 9.7 2.7 2.2 1.8 14.1 7.4 6.0
7262 Daihatsu Motor Hold 1,823 1,700 -4% 9.5 9.6 10.6 1.6 1.4 1.3 4.3 4.0 4.2
7269 Suzuki Hold 2,471 2,600 7% 17.2 13.2 12.5 1.2 1.1 1.0 4.9 4.0 3.7
7270 Fuji Heavy Ind. Hold 2,804 3,000 9% 18.3 9.5 11.1 3.7 2.7 2.2 12.5 5.9 5.5
7272 Yamaha Motor Hold 1,550 1,450 -5% 72.2 16.1 13.9 1.8 1.5 1.4 8.0 4.5 3.7
Following seven important messages
to convey…
Industrials
Autos & Auto Parts
21 November 2013
page 4 of 47 , Equity Analyst, [email protected] Nakanishi
Please see important disclosure information on pages 45 - 47 of this report.

payout ratio or actively implementing share buy-backs. Such a decision could be an
important catalyst not only for Toyota shares but also in terms of stimulating the
Japanese stock market overall. However, our view is that Toyota will not
substantially change its financial policy anytime soon, and indeed, we believe it will
belatedly turn around and begin capex expansion. This is an important point in our
Hold thesis on the company.
Earnings recovery looks set to hit a plateau We think earnings growth in FY3/15 will have a diminishing rate, with aggregated
operating profit for the 8 companies in our coverage rising only 7%. We estimate that
sector profits will plateau at a high level from 2H FY3/14, and that factors driving
improved earnings will start to dry up. Indeed, the demerits of the weaker yen and the
cost-push associated with high wages and imported material prices is set to come through
after a time-lag while sales volume growth slows, expansion halts in Asia and in Japan,
and the country mix worsens as well. Competition in global markets continues to escalate,
and there are almost no markets where prospects look bright. The only bright spot is
margin improvement in North America. N. American profitability, centering on US
margins, has disappointingly lagged behind the rest, but we expect eventually the
intrinsic earnings power of Japanese OEMs to start to rebuild, thanks to significant efforts
of business reforms and rebuilding more attractive products.
Chart 2: Autos OEM sector Operating Profit, OP margins
Source: Jefferies estimates and company data
We estimate that sector profits will
plateau.
Industrials
Autos & Auto Parts
21 November 2013
page 5 of 47 , Equity Analyst, [email protected] Nakanishi
Please see important disclosure information on pages 45 - 47 of this report.

Paradoxically, reduced forex sensitivity will mean the weaker yen is no longer a significant share price driver We estimate auto sector yen-dollar rate sensitivity (the theoretical change in operating
profit caused by a 1% change in the yen) will drop below 2% in FY3/15 for the first time
since FY3/01. Even if we lift our forex assumption from ¥100/$ to ¥105/$, profit sensitivity
of a mere 10% would no longer lead immediately to a change in investment opinions.
Chart 3: Long-term trend in yen-dollar rate sensitivity
Source: Jefferies Note: Yen-dollar rate sensitivity is the theoretical change in operating profit caused by a 1% change in the yen
From foreign investors' perspective, a 1% fall in the yen delivers only a 1% benefit, even if
profits rise by 2%, currency depreciation offsets 1%. The appeal of such small benefits
from yen depreciation is thus likely to diminish for foreign investors, who are the major
shareholders. The story might be different if the yen weakens by, say, ¥20, but we do not
believe such a scenario looks realistic, while the picture for the global and Japanese
economy would perhaps have worsened to a degree that hardly bears thinking about in
this event.
Chart 4: Simulation of earnings and valuation based on Forex sensitivity
Source: Jefferies estimates and company data
Concerns that valuations could be marked down Automobile sector valuations are arguably low compared with other domestic sectors, but
they are not heavily discounted on a global comparison. P/Es based on FY3/15 forecasts
are 10.2x for the Japanese OEMs (J3), 8.8x for the US auto-makers, 9.3x for European firms
(excluding structurally loss-making PSA), and 6.1x for Korean manufacturers. The
Japanese OEMs used to carry high premiums, because of (1) accounting factors, mainly
their accelerated depreciation methods, (2) growth prospects in global markets, mainly
FY3/15E FY3/15E FY3/15E
OP (¥bn) EPS (¥) P/E (x)
US$ 95 100 105 110 95 100 105 110 95 100 105 110
Euro 124 130 137 143 124 130 137 143 124 130 137 143
Toyota 2,240.0 2,510.0 2,780.0 3,050.0 521.2 574.1 626.9 679.8 12.1 11.0 10.0 9.3
Nissan 532.5 600.0 667.5 735.0 89.7 99.7 109.7 119.7 10.3 9.3 8.4 7.7
Honda 907.5 975.0 1,042.5 1,110.0 368.5 391.7 414.9 438.2 11.1 10.5 9.9 9.3
Mazda 174.0 210.0 246.0 282.0 37.8 46.8 55.9 64.9 12.0 9.7 8.1 7.0
Suzuki (1) 172.2 197.0 221.7 246.5 180.1 197.9 215.7 233.4 13.7 12.5 11.5 10.6
Fuji Heavy 269.0 315.0 361.0 407.0 215.9 252.4 289.0 325.5 13.0 11.1 9.7 8.6
Daihatsu 136.8 143.0 149.3 155.5 162.2 171.3 180.4 189.5 11.2 10.6 10.1 9.6
Yamaha Motor 55.5 67.0 78.5 90.0 90.9 111.3 131.7 152.2 17.1 13.9 11.8 10.2
Total 4,487.5 5,017.0 5,546.5 6,076.0 -- -- -- -- 12.6 11.1 9.9 9.0
…and the power of the stock driver
from sensitivity is thus likely to
diminish.
The sector yen-dollar rate sensitivity
is now approaching the lowest ever
in the history…
Industrials
Autos & Auto Parts
21 November 2013
page 6 of 47 , Equity Analyst, [email protected] Nakanishi
Please see important disclosure information on pages 45 - 47 of this report.

the US and Asia, (3) a premium for the Japanese OEMs' exceptionally strong global
competitiveness, and (4) upbeat expectations of earnings growth inherent in high forex
sensitivity.
Factors supporting a high P/E premium in Japan's auto sector are now evaporating, and
although we do not expect a discount to accrue, we think the reduced valuation gap is
broadly fair. We note that Japanese auto sector P/Es have plunged to about 8x in the past.
Earnings reached elevated levels in FY2001–04, but the J3's P/Es were marked down,
stalling at 8–10x for a prolonged period. Interestingly, yen-dollar sensitivity fell below 2%
at that time.
Chart 5: J3 1-year Forward P/E
Source: Jefferies estimate, Bloomberg
Japanese OEMs yet to restore global competitiveness The Japanese OEMs have recovered world-leading earnings power, but we do not believe
these margins are the results of robust competitive strength. If current earnings are not
supported by genuine competitiveness, it will not be easy to maintain their earnings
power, in our view. The companies have steadily reaped the rewards from strategic
restructuring since the financial crisis (so-called Lehman Shock in Japan), but rivals have
also evolved quickly. The gap cannot easily be closed, evidenced by the fact Japanese
brands' global market shares are not recovering to the same degree as hoped. We identify
four key elements that we think are important for the automobile industry's
competitiveness through to 2020: (1) new architecture breakthroughs delivering superior
costs and performance; (2) innovations which overcome significant scale and complexity;
(3) management capabilities on both the strategic and "soft" fronts; and (4) brands and
premium strategies. We address global competitiveness analysis in more detail in Chapter
2.
Japanese OEMs’ Fundamentals Snap Views The total operating profit in 2Q (Jul-Sept) of the eight companies we cover was ¥1,081.1
billion (up 52% YoY). Nissan Motor announced significantly lower operating profit than
the consensus in 2Q, and its substantial downward revision to the full-year earnings
forecast and the shakeup of the management structure announced at the same time
became the largest negative surprise. Meanwhile, FHI revised significantly upwards its full-
year operating profit forecast, from ¥198.0 billion to ¥278.0 billion, but this was within
the scope of the consensus.
As there was no major surprise except for Nissan, there were no sharp movements in the
market. With respect to the earnings forecasts of each company, they are talking about
their estimates with a great deal of caution in preparation for pay-raise negotiations in the
spring wage round. Although they have raised their exchange rate assumptions for the
FY2001–04, the J3's P/Es were
marked down, stalling at 8–10x for a
prolonged period. Interestingly, yen-
dollar sensitivity fell below 2% at
that time.
Industrials
Autos & Auto Parts
21 November 2013
page 7 of 47 , Equity Analyst, [email protected] Nakanishi
Please see important disclosure information on pages 45 - 47 of this report.

second half from ¥90/US$ to ¥95/US$, further surprises on the upside are very likely, as
their exchange rate assumptions are still cautious, given the current exchange rates.
Chart 6: FY3/14 Quarterly OP estimates (unit: ¥bn)
(¥bn) 1QA YoY% 2QA YoY% 3QE YoY% 4QE YoY FY3/14E YoY
Toy ota Motor 663.4 88% 592.1 74% 584.3 368% 610.2 21% 2,450.0 85%
Honda Motor 185.0 5% 171.5 70% 228.5 73% 240.1 77% 825.0 51%
Nissan Motor 108.1 -10% 113.8 -32% 125.5 102% 152.6 -12% 500.0 -4%
Mazda 36.5 1929% 37.4 287% 37.8 363% 68.2 99% 180.0 234%
Suzuki 44.1 24% 46.2 52% 44.0 65% 45.7 -12% 180.0 25%
FHI 69.6 302% 81.1 213% 82.0 172% 82.3 75% 315.0 162%
Daihatsu Motor 43.2 14% 27.0 -25% 32.9 67% 41.8 6% 145.0 9%
Yamaha Motor (1) 16.4 95% 11.9 497% 11.8 NM 20.1 45% 54.0 190%
Total 1,166.3 55% 1,081.1 52% 1,146.9 187% 1,261.0 26.2% 4,649.0 63%
Note: (1) Yamaha Motor figures are 2Q, 3Q, 4Q of FY12/13E, 1Q FY 12/14E and FY12/13E since fiscal year end is December. Source: Company data and Jefferies estimates
Medium-term fundamentals forecasts Our estimates are based on the following assumptions.
1. Exchange rates: ¥100/$ and ¥130/€
2. US SAAR: Gradual growth from 15.6 million units in 2013 to 16 million units in 2014
3. Japanese SAAR: 5.51 million units (up 5.8% YoY) in FY3/14, 5.17 million units (down
6.1% YoY) in FY3/15.
4. Japan’s mini-vehicles SAAR: Estimates of 2.2mn units for FY3/14 (up 11.5% year on
year) and 2.01mn units for FY3/15 (down 8.4% YoY). If a stepwise reduction in the
acquisition tax is put off or the mini-vehicle road tax increases, demand may
deteriorate further.
Our current forecasts have factored in the emergence of last-minute demand for
approximately 200,000 units in the second half (Oct-Mar) of the current fiscal year and
the arrival of a period of pay-back fall in the first half (Apr-Sept) of the next fiscal year. In
our risk scenario, there is a risk that domestic demand for new vehicles may fall
significantly below 5mn units if the reduction in the automobile acquisition tax is
postponed or if other automobile related taxes such as road taxes are raised even if the
acquisition tax is reduced. Even if some of this negative impact can be offset by higher
exports, it seems difficult to avoid lower earnings. As the basic policy for these tax
revisions is likely to be concluded by the end of the year in the Research Commission on
the Tax System of the Liberal Democratic Party, we will need to monitor this carefully.
Although sector earnings are
expected to increase gradually from
3Q to 4Q with the addition of the
last-minute-demand in Japan, it is
difficult to be too optimistic, given
the risk during the period of a
reactionary fall.
Industrials
Autos & Auto Parts
21 November 2013
page 8 of 47 , Equity Analyst, [email protected] Nakanishi
Please see important disclosure information on pages 45 - 47 of this report.

Chart 7: FY3/14 earnings forecasts summary
Note: (1) Yamaha Motor figures are FY12/13E since fiscal year end is December. Total shows total of eight companies, including Yamaha Motor. Source: Company data and Jefferies estimates
Chart 8: FY3/15 earnings forecasts summary
Note: (1) Yamaha Motor figures are FY12/14E since fiscal year end is December. Total shows total of eight companies, including Yamaha Motor. Source: Company data and Jefferies estimates
While the domestic market could be rough, we expect Japanese OEM’s global sales
volume will increase steadily to 23.6mn units (up 7% YoY) in FY3/14 and 24.71mn units
(up 5% YoY) in FY3/15. We expect sales volume will bottom out in Western Europe and
Russia and that stable growth in the United States and China will offset negative growth in
Japan. However, differences among companies are fairly large. While the sales volume is
expected to grow only 2% YoY in FY3/15 for Toyota and FHI, above-average sales volume
is likely to be recorded at Honda, Nissan and Mazda. Chart 76 shows details of our sales
volume forecasts by company.
The automobile sector is likely to achieve a record profit in FY3/14. We expect that the
total operating profit of the eight companies we cover will be ¥4,649.0 billion (up 62.6%
YoY), topping the ¥4,563.7 billion in FY3/08 for the first time in six years. While FHI and
Daihatsu are likely to set consecutive record highs, Suzuki, Mazda and Toyota are likely to
achieve record profits. Honda, Nissan and Yamaha are expected to start out late.
Although sector earnings are expected to increase gradually from 3Q to 4Q with the
addition of the last-minute-demand in Japan, it is difficult to be too optimistic, given the
risk during the period of a reactionary fall. Consequently, it is unlikely to receive a higher
evaluation from the market. As sector earnings are generally approaching their peak, it is
Jefferies estimate CoE Bloomberg Jefferies estimate CoE Bloomberg
New YoY % Deviation% Deviation% New YoY Deviation% Deviation%
Toyota Motor 2,450.0 85% 2,200.0 11.4% 2,439.6 0% 578.8 91% 467.1 23.9% 578.5 0%
Honda Motor 825.0 51% 780.0 5.8% 835.7 -1% 336.2 65% 321.8 4.5% 341.3 -1%
Nissan Motor 500.0 -4% 480.0 4.2% 561.4 -11% 87.3 7% 100.2 -12.9% 93.6 -7%
Mazda 180.0 234% 160.0 12.5% 178.8 1% 34.5 201% 23.4 47.4% 35.5 -3%
Suzuki 180.0 25% 170.0 5.9% 178.9 1% 187.2 31% 178.3 5.0% 188.7 -1%
FHI 315.0 162% 278.0 13.3% 290.8 8% 294.7 92% 155.0 90.1% 248.2 19%
Daihatsu Motor 145.0 9% 137.0 5.8% 148.4 -2% 190.4 0% 192.4 -1.0% 205.4 -7%
Yamaha Motor (1) 54.0 190% 55.0 -1.8% 57.3 -6% 96.5 349% 97.4 -1.0% 101.0 -4%
Total (1) 4,649.0 63% NA NA 4,690.9 -1% 1,805.7 63% NA NA 1,792.2 1%
Operating profit estimate in FY3/14 (¥bn) EPS estimate in FY3/14(¥)
Jefferies estimate CoE Bloomberg Jefferies estimate CoE Bloomberg
New YoY % Deviation% Deviation% New YoY Deviation% Deviation%
Toyota Motor 2,510.0 2% NA NA 2,655.0 -5% 574.1 -1% NA NA 622.3 -8%
Honda Motor 975.0 18% NA NA 948.3 3% 391.7 17% NA NA 393.0 0%
Nissan Motor 600.0 20% NA NA 657.4 -9% 99.7 14% NA NA 111.6 -11%
Mazda 210.0 17% NA NA 214.8 -2% 46.8 36% NA NA 51.3 -9%
Suzuki 197.0 9% NA NA 188.2 5% 197.9 6% NA NA 198.4 0%
FHI 315.0 0% NA NA 315.7 0% 252.4 -14% NA NA 258.1 -2%
Daihatsu Motor 130.0 -10% NA NA 146.1 -11% 171.3 -10% NA NA 201.6 -15%
Yamaha Motor (1) 67.0 24% NA NA 76.6 -13% 111.3 15% NA NA 140.3 -21%
Total (1) 5,004.0 8% NA NA 5,202.1 -4% 1,845.3 2% NA NA 1,976.7 -7%
Operating profit estimate in FY3/15 (¥bn) EPS estimate in FY3/15(¥)
Industrials
Autos & Auto Parts
21 November 2013
page 9 of 47 , Equity Analyst, [email protected] Nakanishi
Please see important disclosure information on pages 45 - 47 of this report.

difficult to anticipate significant growth unless there is any change in our assumptions for
exchange rates and sales volumes.
We expect that the total sector operating profit for FY3/15 will be ¥5,004.0 billion (up 8%
YoY). Four companies, namely Honda, Nissan, Mazda and Yamaha, whose earnings
recovery has been delayed, are likely to see their earnings achieve double-digit growth,
while Toyota and FHI, which have enjoyed a relatively stronger recovery to date, are likely
to see their growth slow down. Daihatsu, which has a high domestic sales ratio, is likely to
see a fall in earnings. There is a large difference between our forecasts and the market
consensus. Our forecasts for Daihatsu and Yamaha are an anti-consensus call, as ours are
more than 10% lower than the consensus. Our forecasts for Toyota and Nissan are 5%
and 9% lower than the consensus, respectively.
Share price implications We note the following five implications.
1. Although Daihatsu’s share price does not appear to have a large downside risk as it
seems to have already factored in sluggish earnings, we think that the delay in the
relative performance will be extended. Even if earnings of Yamaha do not reach the
consensus, we don’t think the share price will fall significantly as the market seems
to look at the rate of change, the summer rally, and the long-term recovery cycle of
leisure demand in the developed markets.
2. The slower growth of Toyota is likely to disappoint the market. However, as the
weak yen and expectations of a dividend increase are able to be maintained, the
share price could be stable. Caution will be needed when the policy shift to increase
capital outflow to investments becomes evident in the future.
3. Although our forecasts for Honda and Mazda are not that different from the
consensus, the conviction of the market does not seem to be particularly strong. If
confidence in the consensus figure strengthens as quarterly results progress, it will
be possible to expect a positive impact on their share prices.
4. The outlook for Nissan is uncertain. Depending on the new management structure
to be determined by April 2014 and the details of measures to bring back earnings,
it should be possible to anticipate changes in the outlook.
5. Even though the overall forex sensitivity of the sector to the US dollar has fallen
below 2%, changes in exchange rates will have a relative impact on earnings. Our
point is that the power of this as a share price driver will weaken. While J3, whose
forex sensitivity has fallen below 2%, will be less sensitive to exchange rates, FHI and
Yamaha, which still have high forex sensitivity to the US dollar, will continue to be
affected by fluctuations in exchange rates.
Investment recommendations and thesis Toyota Motor (7203 JP, Hold)
Investment thesis: Key arguments in our Hold rating are as follows: (1) three-year
operating profit CAGR of 4% in FY3/15–FY3/17 looks mediocre, well below the sector
average of 7%; (2) Toyota is unlikely to lift its 30% benchmark payout ratio anytime soon,
so expectations of higher dividends are overblown, creating the risk of disappointment;
(3) we take the view that the company’s business reform benefit would not give full
ability until 2015 or beyond, creating mediocre medium-term product competitiveness,
production capacity shortages hampering volume growth, and a cost-push stemming
from soaring investments for the future.
Price target: We initiate coverage with a Hold rating. Our price target for the coming 12
months is ¥6,700, calculated as a P/E of 12x based on our FY3/15 EPS estimate. This
represents a 10% premium to the sector average of around 11x to reflect Toyota's high
level of cash on hand and to pay out dividends.
Our forecasts for Daihatsu and
Yamaha are an anti-consensus call.
Based on our fundamentals outlook,
there are five key implications to the
share price movements including…
Industrials
Autos & Auto Parts
21 November 2013
page 10 of 47 , Equity Analyst, [email protected] Nakanishi
Please see important disclosure information on pages 45 - 47 of this report.
Valuation/Risks: Our DCF model using a discount rate of 7.0–7.5% and terminal
growth of 0–1% yields a theoretical share price range of some ¥6,000–6,800. Our price
target is near the top of this range, but we believe this can be supported by opportunities
from the weaker yen and the FY3/14 prospective dividend yield (around 2.7%).
Foreseeable risks are changes in operating profit of just over 2% for a 1% move in forex,
and just under 2% for a 1% variation in sales volume. Developments with domestic
consumption tax and automobile taxes represent major risks for the company.
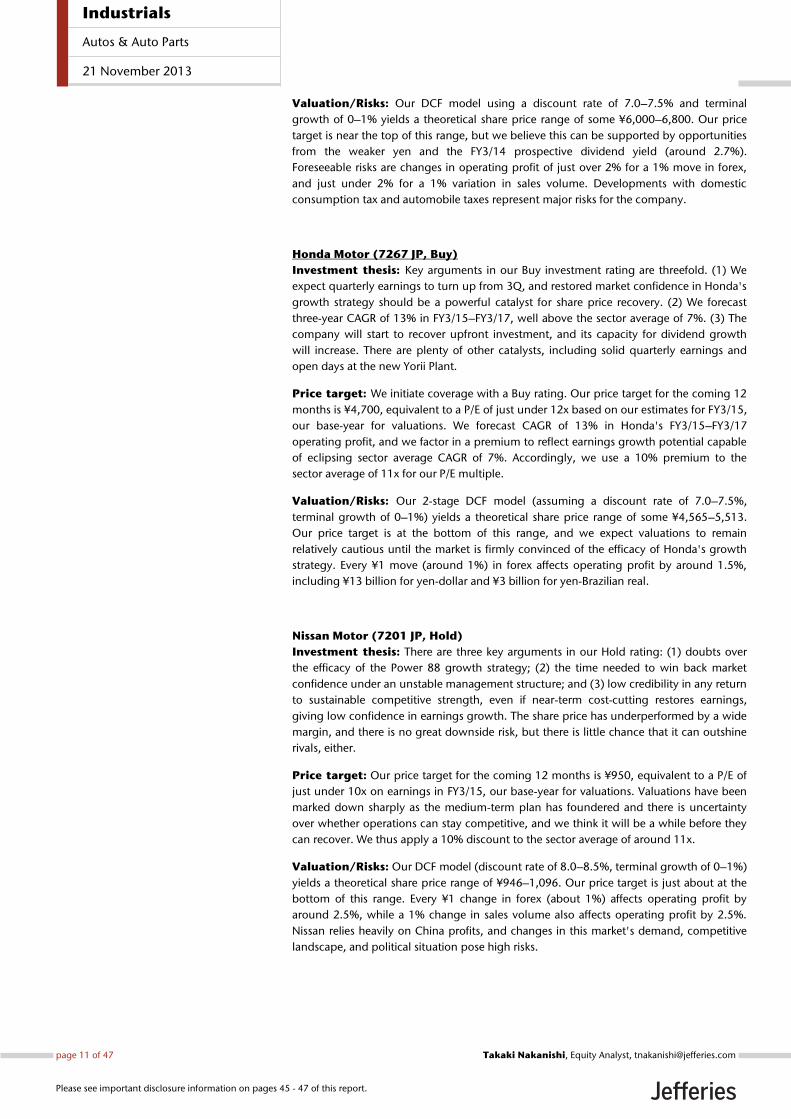
Honda Motor (7267 JP, Buy)
Investment thesis: Key arguments in our Buy investment rating are threefold. (1) We
expect quarterly earnings to turn up from 3Q, and restored market confidence in Honda's
growth strategy should be a powerful catalyst for share price recovery. (2) We forecast
three-year CAGR of 13% in FY3/15–FY3/17, well above the sector average of 7%. (3) The
company will start to recover upfront investment, and its capacity for dividend growth
will increase. There are plenty of other catalysts, including solid quarterly earnings and
open days at the new Yorii Plant.
Price target: We initiate coverage with a Buy rating. Our price target for the coming 12
months is ¥4,700, equivalent to a P/E of just under 12x based on our estimates for FY3/15,
our base-year for valuations. We forecast CAGR of 13% in Honda's FY3/15–FY3/17
operating profit, and we factor in a premium to reflect earnings growth potential capable
of eclipsing sector average CAGR of 7%. Accordingly, we use a 10% premium to the
sector average of 11x for our P/E multiple.
Valuation/Risks: Our 2-stage DCF model (assuming a discount rate of 7.0–7.5%,
terminal growth of 0–1%) yields a theoretical share price range of some ¥4,565–5,513.
Our price target is at the bottom of this range, and we expect valuations to remain
relatively cautious until the market is firmly convinced of the efficacy of Honda's growth
strategy. Every ¥1 move (around 1%) in forex affects operating profit by around 1.5%,
including ¥13 billion for yen-dollar and ¥3 billion for yen-Brazilian real.
Nissan Motor (7201 JP, Hold)
Investment thesis: There are three key arguments in our Hold rating: (1) doubts over
the efficacy of the Power 88 growth strategy; (2) the time needed to win back market
confidence under an unstable management structure; and (3) low credibility in any return
to sustainable competitive strength, even if near-term cost-cutting restores earnings,
giving low confidence in earnings growth. The share price has underperformed by a wide
margin, and there is no great downside risk, but there is little chance that it can outshine
rivals, either.
Price target: Our price target for the coming 12 months is ¥950, equivalent to a P/E of
just under 10x on earnings in FY3/15, our base-year for valuations. Valuations have been
marked down sharply as the medium-term plan has foundered and there is uncertainty
over whether operations can stay competitive, and we think it will be a while before they
can recover. We thus apply a 10% discount to the sector average of around 11x.
Valuation/Risks: Our DCF model (discount rate of 8.0–8.5%, terminal growth of 0–1%)
yields a theoretical share price range of ¥946–1,096. Our price target is just about at the
bottom of this range. Every ¥1 change in forex (about 1%) affects operating profit by
around 2.5%, while a 1% change in sales volume also affects operating profit by 2.5%.
Nissan relies heavily on China profits, and changes in this market's demand, competitive
landscape, and political situation pose high risks.
Industrials
Autos & Auto Parts
21 November 2013
page 11 of 47 , Equity Analyst, [email protected] Nakanishi
Please see important disclosure information on pages 45 - 47 of this report.
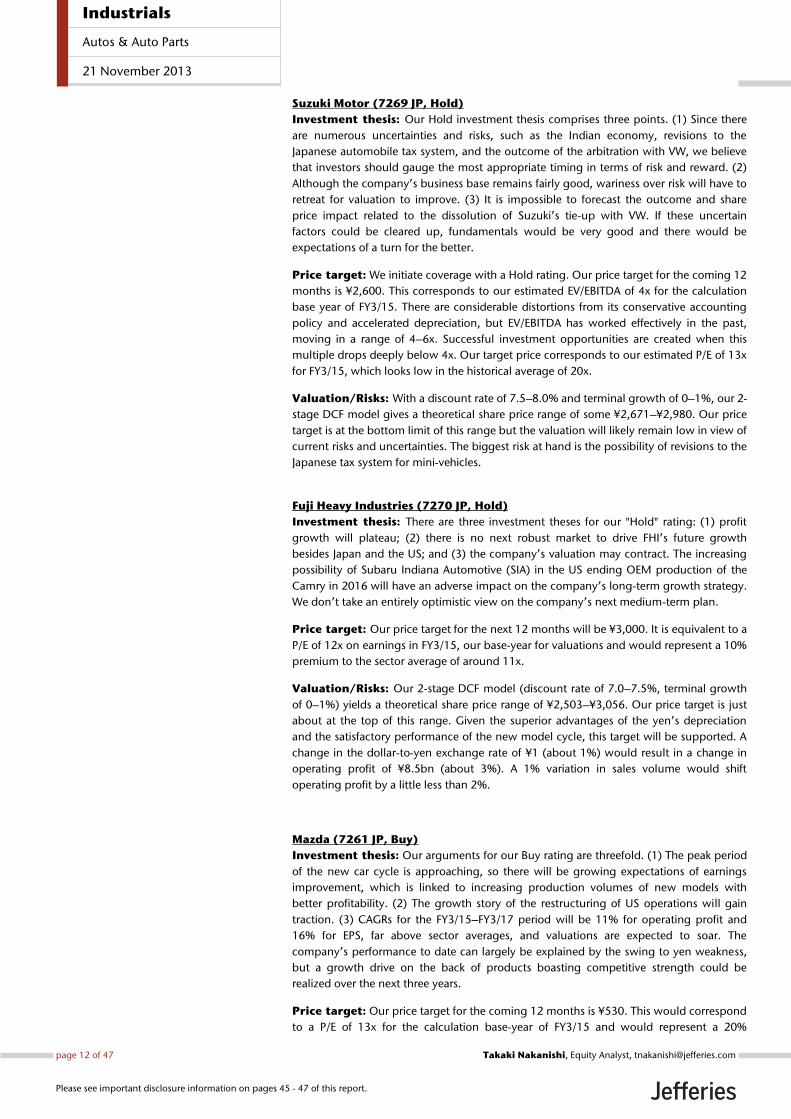
Suzuki Motor (7269 JP, Hold)
Investment thesis: Our Hold investment thesis comprises three points. (1) Since there
are numerous uncertainties and risks, such as the Indian economy, revisions to the
Japanese automobile tax system, and the outcome of the arbitration with VW, we believe
that investors should gauge the most appropriate timing in terms of risk and reward. (2)
Although the company’s business base remains fairly good, wariness over risk will have to
retreat for valuation to improve. (3) It is impossible to forecast the outcome and share
price impact related to the dissolution of Suzuki’s tie-up with VW. If these uncertain
factors could be cleared up, fundamentals would be very good and there would be
expectations of a turn for the better.
Price target: We initiate coverage with a Hold rating. Our price target for the coming 12
months is ¥2,600. This corresponds to our estimated EV/EBITDA of 4x for the calculation
base year of FY3/15. There are considerable distortions from its conservative accounting
policy and accelerated depreciation, but EV/EBITDA has worked effectively in the past,
moving in a range of 4–6x. Successful investment opportunities are created when this
multiple drops deeply below 4x. Our target price corresponds to our estimated P/E of 13x
for FY3/15, which looks low in the historical average of 20x.
Valuation/Risks: With a discount rate of 7.5–8.0% and terminal growth of 0–1%, our 2-
stage DCF model gives a theoretical share price range of some ¥2,671–¥2,980. Our price
target is at the bottom limit of this range but the valuation will likely remain low in view of
current risks and uncertainties. The biggest risk at hand is the possibility of revisions to the
Japanese tax system for mini-vehicles.
Fuji Heavy Industries (7270 JP, Hold)
Investment thesis: There are three investment theses for our "Hold" rating: (1) profit
growth will plateau; (2) there is no next robust market to drive FHI’s future growth
besides Japan and the US; and (3) the company’s valuation may contract. The increasing
possibility of Subaru Indiana Automotive (SIA) in the US ending OEM production of the
Camry in 2016 will have an adverse impact on the company’s long-term growth strategy.
We don’t take an entirely optimistic view on the company’s next medium-term plan.
Price target: Our price target for the next 12 months will be ¥3,000. It is equivalent to a
P/E of 12x on earnings in FY3/15, our base-year for valuations and would represent a 10%
premium to the sector average of around 11x.
Valuation/Risks: Our 2-stage DCF model (discount rate of 7.0–7.5%, terminal growth
of 0–1%) yields a theoretical share price range of ¥2,503–¥3,056. Our price target is just
about at the top of this range. Given the superior advantages of the yen’s depreciation
and the satisfactory performance of the new model cycle, this target will be supported. A
change in the dollar-to-yen exchange rate of ¥1 (about 1%) would result in a change in
operating profit of ¥8.5bn (about 3%). A 1% variation in sales volume would shift
operating profit by a little less than 2%.
Mazda (7261 JP, Buy)
Investment thesis: Our arguments for our Buy rating are threefold. (1) The peak period
of the new car cycle is approaching, so there will be growing expectations of earnings
improvement, which is linked to increasing production volumes of new models with
better profitability. (2) The growth story of the restructuring of US operations will gain
traction. (3) CAGRs for the FY3/15–FY3/17 period will be 11% for operating profit and
16% for EPS, far above sector averages, and valuations are expected to soar. The
company’s performance to date can largely be explained by the swing to yen weakness,
but a growth drive on the back of products boasting competitive strength could be
realized over the next three years.
Price target: Our price target for the coming 12 months is ¥530. This would correspond
to a P/E of 13x for the calculation base-year of FY3/15 and would represent a 20%
Industrials
Autos & Auto Parts
21 November 2013
page 12 of 47 , Equity Analyst, [email protected] Nakanishi
Please see important disclosure information on pages 45 - 47 of this report.

premium to the sector average of around 11x. Our view is that Mazda will have an
operating profit CAGR of 11% in FY3/15–FY3/17, higher than the sector average, that its
16.8% average ROE for the same period will stand out, and that Mazda can maintain a
relatively high P/E in terms of the ROE-PBR relationship.
Valuation/Risks: Our 2-stage DCF model using a discount rate of 7.0–7.5% and
terminal growth of 0–1% yields a theoretical share price range of some ¥400–¥530. Our
price target is at the top of this range. The largest calculable risks are exchange rate
changes: a ¥1 move in developed market currencies would change operating profit by
approximately 3.4%. A 1% variation in sales volume would shift operating profit by about
3.5%.
Daihatsu Motors (7262 JP, Hold)
Investment thesis: The following three points underpin our Hold investment rating: (1)
a low possibility of profit growth; (2) no catalyst for a revaluation; and (3) uncertainty in
taxations and regulation changes is rather high. The risk of a decline in profits will arise in
FY3/15. There is a material difference between our estimates and the Bloomberg
consensus. However, the FY3/14 P/E has declined 9x, and the market apparently is
reflecting a considerable deterioration in the company’s earnings in coming years.
Price target: We are setting our price target for the next 12 months at ¥1,700. This is
equivalent to 10 times the estimated P/E for FY3/15, our base-year for valuations. We
apply a 10% discount to the sector average of around 11x.
Valuation/Risks: Our 2-stage DCF model (discount rate of 6.5–7.0%, terminal growth
of 0–1%) yields a theoretical share price range of some ¥1,624–¥1,958. Our price target is
in the lower level of the range. Due to harsh external conditions, this is likely to float
around the lower level for the moment. Risks are high, due to factors such as the
Indonesian economy, fluctuations in Rupiah exchange rates, and the potential tax
changes for mini-vehicles in Japan. A ¥1 change in the dollar-to-yen rate would result in a
¥1.3bn change in operating profit with a relatively low sensitivity.
Yamaha Motor (7272 JP, Hold)
Investment thesis: Our investment thesis rests on the following three points: (1) we
aren’t confident on a recovery in the company’s business in developed countries; (2)
more time is needed for its platform strategy for leading cost competitiveness in emerging
nations to take effect; and (3) the company is unattractively valued.
Price target: We initiate coverage of Yamaha Motor with a Hold rating, setting our price
target for the next 12 months at ¥1,450. As our calculation basis, we assigned a 20%
premium to the average sector P/E of some 11x to correspond to the estimated PER of 13x
for FY12/14, our base-year for valuations. We took into consideration a growth cycle that
remained close to a trough and a high growth rate compared with the mean reversion for
the business. At 18%, the average operating profit growth rate for FY12/13 to FY12/15 is
prominently high in the sector.
Valuation/Risks: The theoretical share price for the company ranges from about
¥1,007–¥1,719, based on our 20-stage DCF model, assuming a discount rate of 5.5%–
6.0% and a terminal growth rate of 0%–1.0%. Our price target is located in the middle of
this range. The company’s theoretical share price, suggested by our SOTP-based buildup
method, also stands at ¥1,425. The risk of foreign exchange fluctuations is extremely high.
Every ¥1 fluctuation (approximately 1%) affects operating profit by ¥1.6bn for US$ and
¥0.4bn for euro. Such exchange fluctuations would cause operating profit to fluctuate by
approximately 3.4%.
Industrials
Autos & Auto Parts
21 November 2013
page 13 of 47 , Equity Analyst, [email protected] Nakanishi
Please see important disclosure information on pages 45 - 47 of this report.

Chart 9: Toyota Motor – 1-Year P/E Band Chart
Source: Jefferies estimate, Bloomberg
Chart 10: Honda Motor – 1-Year P/E Band Chart
Source: Jefferies estimate, Bloomberg
Chart 11: Nissan Motor – 1-Year P/E Band Chart
Source: Jefferies estimate, Bloomberg
Chart 12: Suzuki Motor – 1-Year P/E Band Chart
Source: Jefferies estimate, Bloomberg
Chart 13: FHI – 1-Year P/E Band Chart
Source: Jefferies estimate, Bloomberg
Chart 14: Mazda Motor – 1-Year P/E Band Chart
Source: Jefferies estimate, Bloomberg
Chart 15: Daihatsu Motors – 1-Year P/E Band Chart
Source: Jefferies estimate, Bloomberg
Chart 16: Yamaha Motor – 1-Year P/E Band Chart
Source: Jefferies estimate, Bloomberg
Industrials
Autos & Auto Parts
21 November 2013
page 14 of 47 , Equity Analyst, [email protected] Nakanishi
Please see important disclosure information on pages 45 - 47 of this report.

Chart 17: Toyota Motor – 1-Year P/B Band Chart
Source: Jefferies estimate, Bloomberg
Chart 18: Honda Motor – 1-Year P/B Band Chart
Source: Jefferies estimate, Bloomberg
Chart 19: Nissan Motor – 1-Year P/B Band Chart
Source: Jefferies estimate, Bloomberg
Chart 20: Suzuki Motor – 1-Year P/B Band Chart
Source: Jefferies estimate, Bloomberg
Chart 21: FHI – 1-Year P/B Band Chart
Source: Jefferies estimate, Bloomberg
Chart 22: Mazda Motor – 1-Year P/B Band Chart
Source: Jefferies estimate, Bloomberg
Chart 23: Daihatsu Motors – 1-Year P/B Band Chart
Source: Jefferies estimate, Bloomberg
Chart 24: Yamaha Motor – 1-Year P/B Band Chart
Source: Jefferies estimate, Bloomberg
Industrials
Autos & Auto Parts
21 November 2013
page 15 of 47 , Equity Analyst, [email protected] Nakanishi
Please see important disclosure information on pages 45 - 47 of this report.
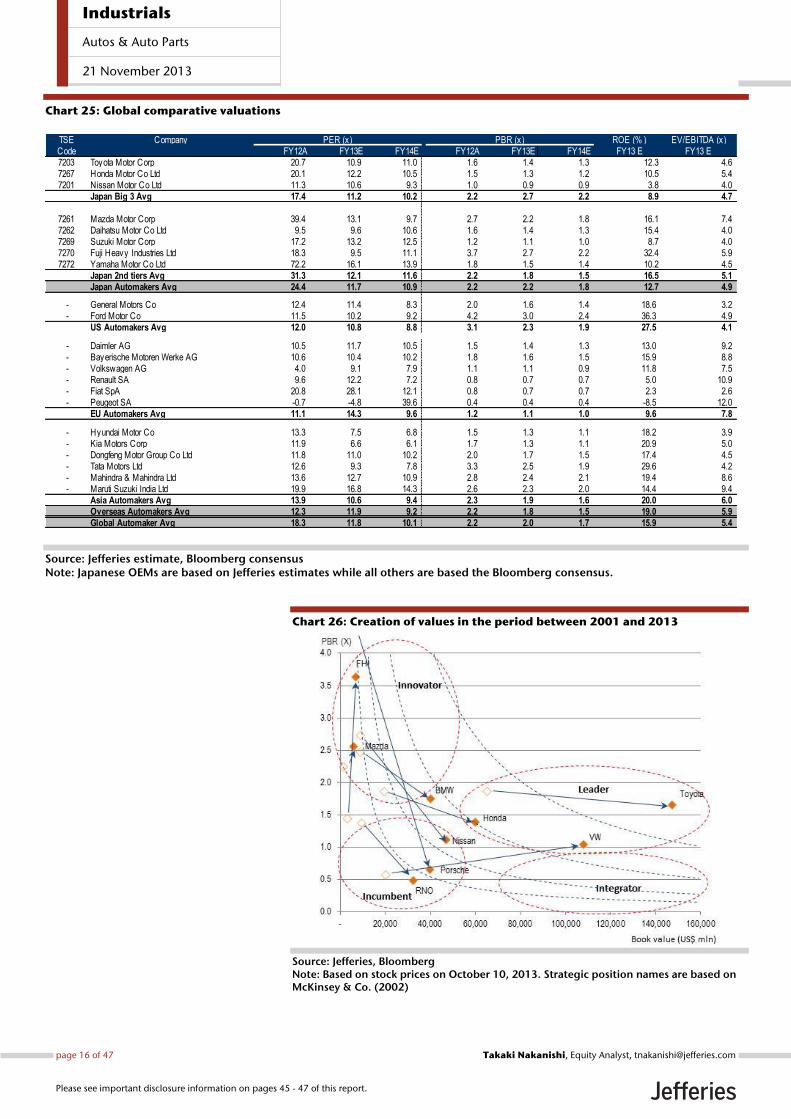
Chart 25: Global comparative valuations
Source: Jefferies estimate, Bloomberg consensus Note: Japanese OEMs are based on Jefferies estimates while all others are based the Bloomberg consensus.
Chart 26: Creation of values in the period between 2001 and 2013
Source: Jefferies, Bloomberg Note: Based on stock prices on October 10, 2013. Strategic position names are based on McKinsey & Co. (2002)
TSE Company ROE (% ) EV/EBITDA (x)Code FY12A FY13E FY14E FY12A FY13E FY14E FY13 E FY13 E7203 Toyota Motor Corp 20.7 10.9 11.0 1.6 1.4 1.3 12.3 4.67267 Honda Motor Co Ltd 20.1 12.2 10.5 1.5 1.3 1.2 10.5 5.47201 Nissan Motor Co Ltd 11.3 10.6 9.3 1.0 0.9 0.9 3.8 4.0
Japan Big 3 Avg 17.4 11.2 10.2 2.2 2.7 2.2 8.9 4.7
7261 Mazda Motor Corp 39.4 13.1 9.7 2.7 2.2 1.8 16.1 7.47262 Daihatsu Motor Co Ltd 9.5 9.6 10.6 1.6 1.4 1.3 15.4 4.07269 Suzuki Motor Corp 17.2 13.2 12.5 1.2 1.1 1.0 8.7 4.07270 Fuji Heavy Industries Ltd 18.3 9.5 11.1 3.7 2.7 2.2 32.4 5.97272 Yamaha Motor Co Ltd 72.2 16.1 13.9 1.8 1.5 1.4 10.2 4.5
Japan 2nd tiers Avg 31.3 12.1 11.6 2.2 1.8 1.5 16.5 5.1Japan Automakers Avg 24.4 11.7 10.9 2.2 2.2 1.8 12.7 4.9
- General Motors Co 12.4 11.4 8.3 2.0 1.6 1.4 18.6 3.2- Ford Motor Co 11.5 10.2 9.2 4.2 3.0 2.4 36.3 4.9
US Automakers Avg 12.0 10.8 8.8 3.1 2.3 1.9 27.5 4.1
- Daimler AG 10.5 11.7 10.5 1.5 1.4 1.3 13.0 9.2- Bayerische Motoren Werke AG 10.6 10.4 10.2 1.8 1.6 1.5 15.9 8.8- Volkswagen AG 4.0 9.1 7.9 1.1 1.1 0.9 11.8 7.5- Renault SA 9.6 12.2 7.2 0.8 0.7 0.7 5.0 10.9- Fiat SpA 20.8 28.1 12.1 0.8 0.7 0.7 2.3 2.6- Peugeot SA -0.7 -4.8 39.6 0.4 0.4 0.4 -8.5 12.0
EU Automakers Avg 11.1 14.3 9.6 1.2 1.1 1.0 9.6 7.8
- Hyundai Motor Co 13.3 7.5 6.8 1.5 1.3 1.1 18.2 3.9- Kia Motors Corp 11.9 6.6 6.1 1.7 1.3 1.1 20.9 5.0- Dongfeng Motor Group Co Ltd 11.8 11.0 10.2 2.0 1.7 1.5 17.4 4.5- Tata Motors Ltd 12.6 9.3 7.8 3.3 2.5 1.9 29.6 4.2- Mahindra & Mahindra Ltd 13.6 12.7 10.9 2.8 2.4 2.1 19.4 8.6- Maruti Suzuki India Ltd 19.9 16.8 14.3 2.6 2.3 2.0 14.4 9.4
Asia Automakers Avg 13.9 10.6 9.4 2.3 1.9 1.6 20.0 6.0Overseas Automakers Avg 12.3 11.9 9.2 2.2 1.8 1.5 19.0 5.9Global Automaker Avg 18.3 11.8 10.1 2.2 2.0 1.7 15.9 5.4
PER (x) PBR (x)
Industrials
Autos & Auto Parts
21 November 2013
page 16 of 47 , Equity Analyst, [email protected] Nakanishi
Please see important disclosure information on pages 45 - 47 of this report.

Chart 27: Earnings Outlook for the OEMs in Japan
Revenues Operating income Recurring income Net income EPS DPS
(¥bn) YoY (%) (¥bn) YoY (%) (¥bn) YoY (%) (¥bn) YoY (%) (¥) (¥)
Toyota Motor
FY3/12A 18,583.7 -2.2% 355.6 -24.1% 432.9 -23.2% 283.6 -30.5% 90.2 50.0
FY3/13A 22,064.2 18.7% 1,320.9 271.4% 1,403.6 224.3% 962.2 239.3% 303.8 90.0
FY3/14E 25,281.4 14.6% 2,450.0 85.5% 2,592.4 84.7% 1,833.0 90.5% 578.8 170.0
FY3/15E 26,299.5 4.0% 2,510.0 2.4% 2,646.0 2.1% 1,818.0 -0.8% 574.1 170.0
FY3/16E 27,585.8 4.9% 2,590.0 3.2% 2,736.0 3.4% 1,889.0 3.9% 596.5 180.0
FY3/17E 29,135.4 5.6% 2,730.0 5.4% 2,886.0 5.5% 1,994.0 5.6% 629.6 190.0
Honda Motor
FY3/12A 7,948.1 -11.1% 231.4 -59.4% 257.4 -59.2% 211.5 -60.4% 117.3 60.0
FY3/13A 9,877.9 24.3% 544.8 135.5% 488.9 89.9% 367.0 73.5% 203.6 76.0
FY3/14E 12,105.5 22.6% 825.0 51.4% 809.7 65.6% 606.0 65.1% 336.2 88.0
FY3/15E 13,508.6 11.6% 975.0 18.2% 955.0 17.9% 706.0 16.5% 391.7 110.0
FY3/16E 14,523.4 7.5% 1,090.0 11.8% 1,070.0 12.0% 781.0 10.6% 433.3 130.0
FY3/17E 15,650.4 7.8% 1,195.0 9.6% 1,175.0 9.8% 850.0 8.8% 471.6 140.0
Nissan Motor
FY3/12A 9,409.0 7.2% 545.8 1.6% 535.1 -0.5% 341.4 7.0% 81.6 20.0
FY3/13A 9,629.6 2.3% 523.5 -4.1% 529.3 -1.1% 342.4 0.3% 81.7 25.0
FY3/14E 10,000.3 3.8% 500.0 -4.5% 530.0 0.1% 366.0 6.9% 87.3 30.0
FY3/15E 10,719.6 7.2% 600.0 20.0% 661.0 24.7% 418.0 14.2% 99.7 35.0
FY3/16E 11,603.5 8.2% 720.0 20.0% 792.0 19.8% 504.0 20.6% 120.2 40.0
FY3/17E 12,416.6 7.0% 800.0 11.1% 887.0 12.0% 568.0 12.7% 135.5 55.0
Mazda Motor
FY3/12A 2,033.1 -12.6% -38.7 NM -36.8 NM -107.7 NM -57.8 0.0
FY3/13A 2,205.3 8.5% 53.9 NM 33.1 NM 34.3 NM 11.5 0.0
FY3/14E 2,696.0 22.3% 180.0 233.7% 136.1 311.2% 103.2 200.8% 34.5 0.0
FY3/15E 2,916.8 8.2% 210.0 16.7% 208.2 53.0% 140.0 35.7% 46.8 3.0
FY3/16E 3,058.6 4.9% 230.0 9.5% 228.2 9.6% 153.0 9.3% 51.2 5.0
FY3/17E 3,218.5 5.2% 245.0 6.5% 243.2 6.6% 163.0 6.5% 54.5 5.0
Suzuki Motor
FY3/12A 2,512.2 -3.7% 119.3 11.6% 130.6 6.6% 53.9 19.4% 88.4 15.0
FY3/13A 2,578.3 2.6% 144.6 21.2% 155.6 19.2% 80.4 49.1% 143.3 18.0
FY3/14E 2,912.3 13.0% 180.0 24.5% 190.0 22.1% 105.0 30.6% 187.2 22.0
FY3/15E 3,181.3 9.2% 197.0 9.4% 207.0 8.9% 111.0 5.7% 197.9 26.0
FY3/16E 3,422.4 7.6% 230.0 16.8% 240.0 15.9% 128.0 15.3% 228.2 30.0
FY3/17E 3,576.8 4.5% 240.0 4.3% 250.0 4.2% 132.0 3.1% 235.3 34.0
Daihatsu
FY3/12A 1,631.3 4.6% 115.5 11.6% 128.2 14.3% 65.1 23.9% 152.9 45.0
FY3/13A 1,765.0 8.2% 133.0 15.2% 148.2 15.6% 81.4 25.0% 191.0 56.0
FY3/14E 1,826.1 3.5% 145.0 9.0% 160.4 8.3% 81.1 -0.3% 190.4 56.0
FY3/15E 1,786.9 -2.1% 130.0 -10.3% 143.0 -10.8% 73.0 -10.0% 171.3 50.0
FY3/16E 1,838.8 2.9% 149.0 14.6% 162.2 13.4% 83.0 13.7% 194.8 50.0
FY3/17E 1,854.6 0.9% 150.0 0.7% 163.3 0.7% 87.0 4.8% 204.2 50.0
Yamaha Motor
FY12/11A 1,276.1 -1.4% 53.4 4.1% 63.5 -4.0% 27.0 47.3% 77.2 15.5
FY12/12A 1,207.7 -5.4% 18.6 -65.2% 27.3 -57.0% 7.5 -72.2% 21.5 10.0
FY12/13E 1,400.8 16.0% 54.0 190.3% 57.2 109.8% 34.0 353.6% 96.5 20.0
FY12/14E 1,521.6 8.6% 67.0 24.1% 69.4 21.3% 39.0 14.7% 111.3 20.0
FY12/15E 1,587.6 4.3% 75.0 11.9% 77.4 11.5% 44.0 12.8% 126.0 30.0
FY12/16E 1,714.5 8.0% 88.0 17.3% 90.4 16.8% 51.0 15.9% 146.1 36.0
Fuji Heavy
FY3/12A 1,517.0 -4.0% 44.0 -47.8% 37.3 -54.7% 38.5 -23.6% 49.3 9.0
FY3/13A 1,913.0 26.1% 120.4 173.9% 100.6 169.9% 119.6 211.0% 153.2 10.0
FY3/14E 2,399.5 25.4% 315.0 161.6% 310.3 208.4% 230.0 92.3% 294.7 45.0
FY3/15E 2,562.8 6.8% 315.0 0.0% 310.4 0.0% 197.0 -14.3% 252.4 50.0
FY3/16E 2,630.7 2.6% 285.0 -9.5% 280.4 -9.7% 177.0 -10.2% 226.8 55.0
FY3/17E 2,747.1 4.4% 295.0 3.5% 290.4 3.6% 184.0 4.0% 235.8 60.0
Industry Total
FY3/12A 44,910.5 -2.5% 1,426.2 -26.7% 1,548.1 -28.1% 913.2 -33.2% -- --
FY3/13A 51,241.0 14.1% 2,859.8 100.5% 2,886.6 86.5% 1,994.8 118.4% -- --
FY3/14E 58,621.9 14.4% 4,649.0 62.6% 4,786.1 65.8% 3,358.3 68.4% -- --
FY3/15E 62,497.2 6.6% 5,004.0 7.6% 5,200.0 8.6% 3,502.0 4.3% -- --
FY3/16E 66,250.6 6.0% 5,369.0 7.3% 5,586.2 7.4% 3,759.0 7.3% -- --
FY3/17E 70,313.9 6.1% 5,743.0 7.0% 5,985.3 7.1% 4,029.0 7.2% -- --
Source: Company data and Jefferies
Industrials
Autos & Auto Parts
21 November 2013
page 17 of 47 , Equity Analyst, [email protected] Nakanishi
Please see important disclosure information on pages 45 - 47 of this report.
Chapter 2: Discussion of Key
Fundamentals Issues in Japan Autos
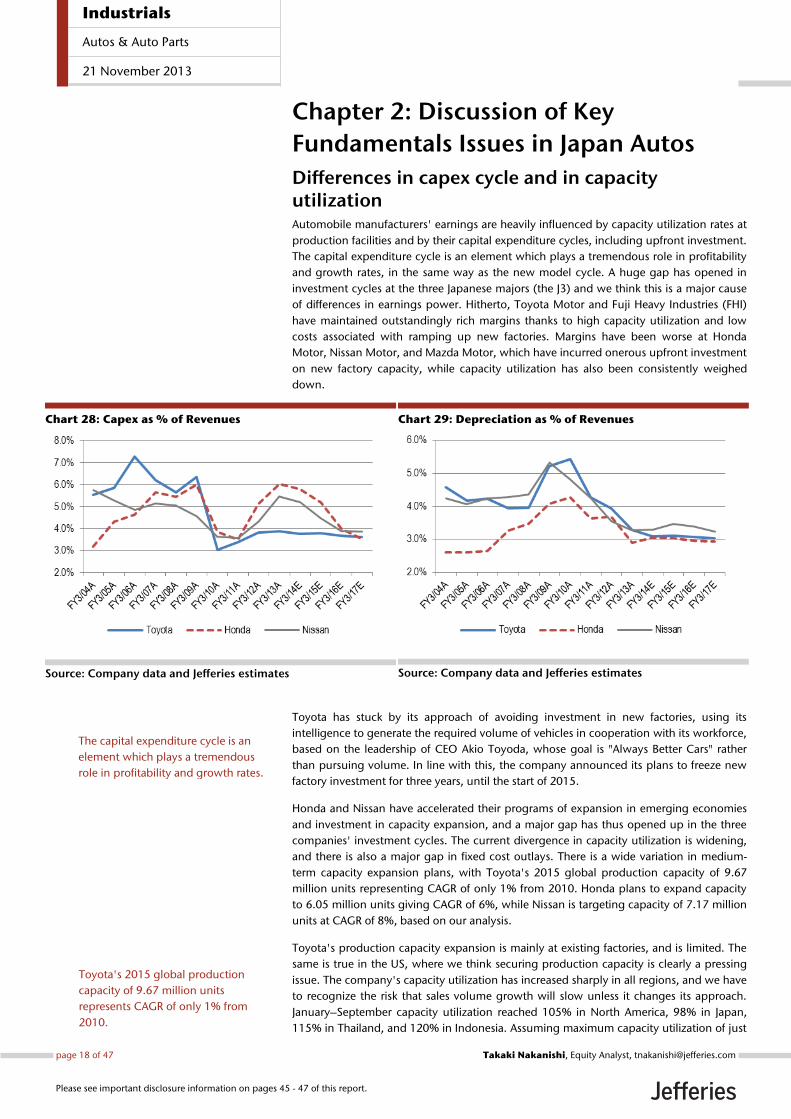
Differences in capex cycle and in capacity utilization Automobile manufacturers' earnings are heavily influenced by capacity utilization rates at
production facilities and by their capital expenditure cycles, including upfront investment.
The capital expenditure cycle is an element which plays a tremendous role in profitability
and growth rates, in the same way as the new model cycle. A huge gap has opened in
investment cycles at the three Japanese majors (the J3) and we think this is a major cause
of differences in earnings power. Hitherto, Toyota Motor and Fuji Heavy Industries (FHI)
have maintained outstandingly rich margins thanks to high capacity utilization and low
costs associated with ramping up new factories. Margins have been worse at Honda
Motor, Nissan Motor, and Mazda Motor, which have incurred onerous upfront investment
on new factory capacity, while capacity utilization has also been consistently weighed
down.
Chart 28: Capex as % of Revenues
Source: Company data and Jefferies estimates
Chart 29: Depreciation as % of Revenues
Source: Company data and Jefferies estimates
Toyota has stuck by its approach of avoiding investment in new factories, using its
intelligence to generate the required volume of vehicles in cooperation with its workforce,
based on the leadership of CEO Akio Toyoda, whose goal is "Always Better Cars" rather
than pursuing volume. In line with this, the company announced its plans to freeze new
factory investment for three years, until the start of 2015.
Honda and Nissan have accelerated their programs of expansion in emerging economies
and investment in capacity expansion, and a major gap has thus opened up in the three
companies' investment cycles. The current divergence in capacity utilization is widening,
and there is also a major gap in fixed cost outlays. There is a wide variation in medium-
term capacity expansion plans, with Toyota's 2015 global production capacity of 9.67
million units representing CAGR of only 1% from 2010. Honda plans to expand capacity
to 6.05 million units giving CAGR of 6%, while Nissan is targeting capacity of 7.17 million
units at CAGR of 8%, based on our analysis.
Toyota's production capacity expansion is mainly at existing factories, and is limited. The
same is true in the US, where we think securing production capacity is clearly a pressing
issue. The company's capacity utilization has increased sharply in all regions, and we have
to recognize the risk that sales volume growth will slow unless it changes its approach.
January–September capacity utilization reached 105% in North America, 98% in Japan,
115% in Thailand, and 120% in Indonesia. Assuming maximum capacity utilization of just
The capital expenditure cycle is an
element which plays a tremendous
role in profitability and growth rates.
Toyota's 2015 global production
capacity of 9.67 million units
represents CAGR of only 1% from
2010.
Industrials
Autos & Auto Parts
21 November 2013
page 18 of 47 , Equity Analyst, [email protected] Nakanishi
Please see important disclosure information on pages 45 - 47 of this report.
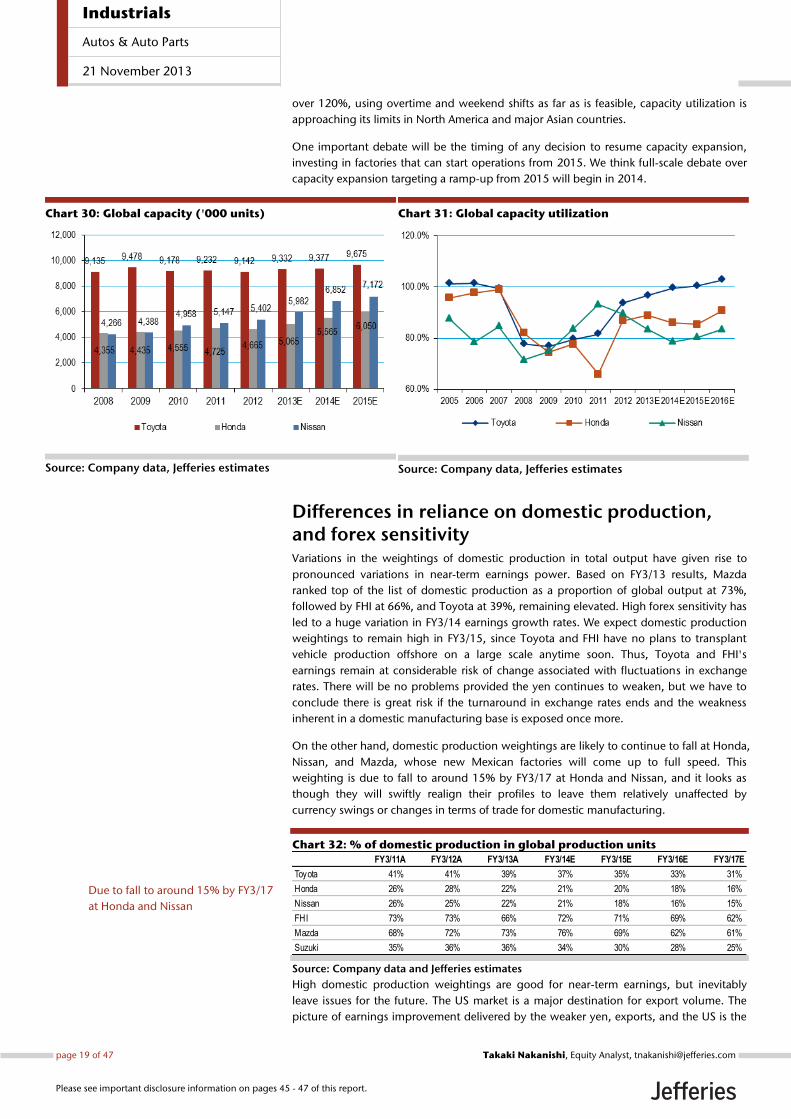
over 120%, using overtime and weekend shifts as far as is feasible, capacity utilization is
approaching its limits in North America and major Asian countries.
One important debate will be the timing of any decision to resume capacity expansion,
investing in factories that can start operations from 2015. We think full-scale debate over
capacity expansion targeting a ramp-up from 2015 will begin in 2014.
Chart 30: Global capacity ('000 units)
Source: Company data, Jefferies estimates
Chart 31: Global capacity utilization
Source: Company data, Jefferies estimates
Differences in reliance on domestic production, and forex sensitivity Variations in the weightings of domestic production in total output have given rise to
pronounced variations in near-term earnings power. Based on FY3/13 results, Mazda
ranked top of the list of domestic production as a proportion of global output at 73%,
followed by FHI at 66%, and Toyota at 39%, remaining elevated. High forex sensitivity has
led to a huge variation in FY3/14 earnings growth rates. We expect domestic production
weightings to remain high in FY3/15, since Toyota and FHI have no plans to transplant
vehicle production offshore on a large scale anytime soon. Thus, Toyota and FHI's
earnings remain at considerable risk of change associated with fluctuations in exchange
rates. There will be no problems provided the yen continues to weaken, but we have to
conclude there is great risk if the turnaround in exchange rates ends and the weakness
inherent in a domestic manufacturing base is exposed once more.
On the other hand, domestic production weightings are likely to continue to fall at Honda,
Nissan, and Mazda, whose new Mexican factories will come up to full speed. This
weighting is due to fall to around 15% by FY3/17 at Honda and Nissan, and it looks as
though they will swiftly realign their profiles to leave them relatively unaffected by
currency swings or changes in terms of trade for domestic manufacturing.
Chart 32: % of domestic production in global production units
Source: Company data and Jefferies estimates
High domestic production weightings are good for near-term earnings, but inevitably
leave issues for the future. The US market is a major destination for export volume. The
picture of earnings improvement delivered by the weaker yen, exports, and the US is the
FY3/11A FY3/12A FY3/13A FY3/14E FY3/15E FY3/16E FY3/17E
Toyota 41% 41% 39% 37% 35% 33% 31%
Honda 26% 28% 22% 21% 20% 18% 16%
Nissan 26% 25% 22% 21% 18% 16% 15%
FHI 73% 73% 66% 72% 71% 69% 62%
Mazda 68% 72% 73% 76% 69% 62% 61%
Suzuki 35% 36% 36% 34% 30% 28% 25%
Due to fall to around 15% by FY3/17
at Honda and Nissan
Industrials
Autos & Auto Parts
21 November 2013
page 19 of 47 , Equity Analyst, [email protected] Nakanishi
Please see important disclosure information on pages 45 - 47 of this report.

Japanese OEMs' erstwhile structure when they flourished in the 2000s. Even if profitability
improves temporarily on the back of this structure, we have to recognize the risk that this
may not prove sustainable. Indeed, there is the risk that over-performing under this old
structure will delay the necessary response to change.
Chart 33: FY3/15Forex sensitivity to operating income
Source: Jefferies based on companies data. Yamaha Motor based on FY12/14 since its fiscal year ends December. Note: Theoretical impact on FY3/15 operating income per ¥1 change against foreign currencies. (1) Suzuki's total sensitivity includes Indian Rupee (¥6.5bn per ¥0.1/INR)
Comparative study of regional growth strategies The Japanese OEMs' strategic business profile road-maps broadly run along the same lines,
albeit with differences in degree. There are five major points.
1. Reconstruct developed market business: The companies need to enhance rich
contents to polish up the product appeal and value-for-money on which Japanese
brands were founded, and to establish competitive strength in areas such as fuel
consumption and safety features.
2. Establish business models for emerging markets: The firms urgently need to
establish manufacturing capabilities and cost-competitive strength corresponding to
emerging nations' local product quality requirements. They will need to come up
with the best-possible products for emerging economies, and build up production
capacity.
3. Improve internal combustion engine (ICE) performance: The Japanese
OEMs need to go beyond just gearing up their already excellent hybrid technology,
and push forward the transition to direct injection gasoline engines and turbo-
charged low-emission engines (downsizing turbo), cranking up ICE-related
performance with an eye on the Chinese market.
4. Raise overseas production capacity and local procurement ratios: They
need to establish local operations that are unaffected by changes in forex and
Japan's terms of trade. While localizing front-end processes such as design and
development is also an important issue, it will be increasingly important to build up
management capabilities and staff training to push forward comprehensive
localization, including sales and services.
5. Create new architecture: The companies need to build innovative architecture to
reduce costs and manage growing complexity in both developed and emerging
markets, and pursue platform strategies which make full use of such architecture.
There is a considerable difference in individual companies' attitudes for each of these.
Below we summarize the J3's approach. We are convinced that Honda well start to reap
the rewards from its drive to strengthen products and lift capacity from 2014, and we
envisage a major upturn in fundamentals. We think prospects for delivering attractive
growth are improving, in light of the impact of new models already on the market. Over
the near term Toyota's margins are likely to recover conspicuously thanks to its strategy of
OP Sensitiv ity per ¥1 change (¥bn) FY3/15E OP OP Sensitiv ity
US$ Euro CAD AUD Total ¥bn US$ Euro Total
Toyota 45.0 4.0 1.0 4.0 54.0 2,510.0 1.8% 0.2% 2.2%
Nissan 12.0 0.0 1.0 0.5 13.5 600.0 2.0% 0.0% 2.2%
Honda 13.0 0.5 0.0 0.0 13.5 975.0 1.3% 0.1% 1.4%
Mazda 2.5 1.5 1.2 2.0 7.2 210.0 1.2% 0.7% 3.4%
Suzuki (1) 0.5 0.7 0.1 0.2 5.0 197.0 0.3% 0.4% 2.5%
Fuji Heavy 8.6 0.3 0.3 -- 9.2 315.0 2.7% 0.1% 2.9%
Daihatsu 1.3 0.0 0.0 0.0 1.3 143.0 0.9% 0.0% 0.9%
Yamaha Motor 1.6 0.4 0.0 0.0 2.3 67.0 2.4% 0.6% 3.4%
Total 87.1 8.4 4.1 8.5 111.5 5,017.0 1.7% 0.2% 2.2%
Strategic business profile road-maps
broadly run along the same 5 key
points.
Industrials
Autos & Auto Parts
21 November 2013
page 20 of 47 , Equity Analyst, [email protected] Nakanishi
Please see important disclosure information on pages 45 - 47 of this report.

returning to its roots, but we feel its long-term capacity for growth is very unstable.
Nissan's upbeat medium-term plan has foundered, and we think it urgently needs to
rebuild the framework of its plan.
Toyota Motor — hybrids are its biggest focus Toyota is running a strategy which puts more emphasis on its own unique approach
rather than pursuing growth. Although we feel that returning to its roots is probably the
wise option for Toyota, which has suffered deeply, putting a foot wrong could accelerate
the progression towards maturation. It is hard to forecast whether or not the company
will succeed over the long term, but this is at least likely to hamper growth over the
medium term. Five-year CAGR in production capacity from 2010 through 2015 is running
at an extremely low level of 1%. High capacity utilization can drive profitability up to a
certain point, but after this it becomes inefficient, and can even impair growth potential.
Supply shortages look likely to hamper Toyota's top-line growth if global demand
continues to expand steadily.
Strengthening products on a regional axis lies at the heart of the product strategy.
Manufacturing vehicles under the Always Better Cars slogan seeks to reform the
traditional head-office-led approach to development and design, and transfer authority for
product development to the regional level. Within this context, the company has
established new architecture (TNGA), looking to simultaneously strengthen products'
intrinsic appeal and reduce costs. TNGA can be seen as the basic platform for Toyota's
structural realignment, simultaneously achieving greater localization, cost-savings, and
enhanced product muscle in terms of design. Conceptually this is very close to the
"integrated planning" and "common architecture" drawn up by Mazda several years ago.
This program is to embrace three platforms: ‚New M/C Platform‛, ‚K-Platform‛, and
‚New NBC Platform.‛ Total volume for the three platforms will amount to about 5mn
units, allowing the company to plan nearly 50% of its total production in a unified
program, modularizing functions and evolving a procurement structure that transcends
the framework of its existing group suppliers. We believe the new Prius due in 2015 is
likely to be the first in line. This is likely to be followed by the next-generation Camry in
2016, with the program completed via the next Yaris/Vitz in 2017. Thus, the full rollout of
TNGA is not until 2015, so it will likely take a really long time to genuinely strengthen
product profiles.
Chart 34: Production volumes of Toyota from each platform
Source : Jefferies, Fourin
Toyota plans to continue to focus on growth in emerging markets, but it does not appear
to have any powerful, decisive products at this stage, in our view. In 2013 Toyota
overhauled its organizational structure, splitting into "Toyota No. 1" to cover developed
markets, and "Toyota No. 2" in charge of emerging markets, looking to speedily deploy
products tailored to the respective needs, ensuring growth. At the point global sales of
TNGA will deliver more than 5
million units of vehicles in by 2017
and onward.
Industrials
Autos & Auto Parts
21 November 2013
page 21 of 47 , Equity Analyst, [email protected] Nakanishi
Please see important disclosure information on pages 45 - 47 of this report.
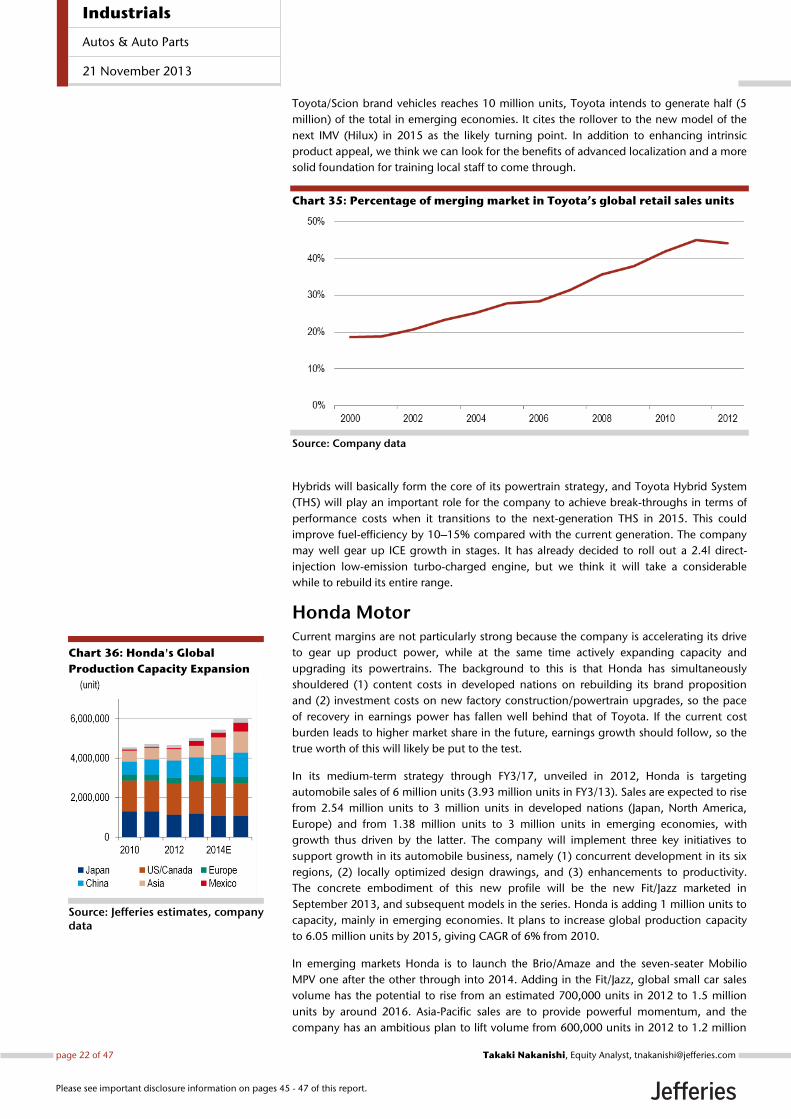
Toyota/Scion brand vehicles reaches 10 million units, Toyota intends to generate half (5
million) of the total in emerging economies. It cites the rollover to the new model of the
next IMV (Hilux) in 2015 as the likely turning point. In addition to enhancing intrinsic
product appeal, we think we can look for the benefits of advanced localization and a more
solid foundation for training local staff to come through.
Chart 35: Percentage of merging market in Toyota’s global retail sales units
Source: Company data
Hybrids will basically form the core of its powertrain strategy, and Toyota Hybrid System
(THS) will play an important role for the company to achieve break-throughs in terms of
performance costs when it transitions to the next-generation THS in 2015. This could
improve fuel-efficiency by 10–15% compared with the current generation. The company
may well gear up ICE growth in stages. It has already decided to roll out a 2.4l direct-
injection low-emission turbo-charged engine, but we think it will take a considerable
while to rebuild its entire range.
Honda Motor Current margins are not particularly strong because the company is accelerating its drive
to gear up product power, while at the same time actively expanding capacity and
upgrading its powertrains. The background to this is that Honda has simultaneously
shouldered (1) content costs in developed nations on rebuilding its brand proposition
and (2) investment costs on new factory construction/powertrain upgrades, so the pace
of recovery in earnings power has fallen well behind that of Toyota. If the current cost
burden leads to higher market share in the future, earnings growth should follow, so the
true worth of this will likely be put to the test.
In its medium-term strategy through FY3/17, unveiled in 2012, Honda is targeting
automobile sales of 6 million units (3.93 million units in FY3/13). Sales are expected to rise
from 2.54 million units to 3 million units in developed nations (Japan, North America,
Europe) and from 1.38 million units to 3 million units in emerging economies, with
growth thus driven by the latter. The company will implement three key initiatives to
support growth in its automobile business, namely (1) concurrent development in its six
regions, (2) locally optimized design drawings, and (3) enhancements to productivity.
The concrete embodiment of this new profile will be the new Fit/Jazz marketed in
September 2013, and subsequent models in the series. Honda is adding 1 million units to
capacity, mainly in emerging economies. It plans to increase global production capacity
to 6.05 million units by 2015, giving CAGR of 6% from 2010.
In emerging markets Honda is to launch the Brio/Amaze and the seven-seater Mobilio
MPV one after the other through into 2014. Adding in the Fit/Jazz, global small car sales
volume has the potential to rise from an estimated 700,000 units in 2012 to 1.5 million
units by around 2016. Asia-Pacific sales are to provide powerful momentum, and the
company has an ambitious plan to lift volume from 600,000 units in 2012 to 1.2 million
Chart 36: Honda's Global
Production Capacity Expansion
Source: Jefferies estimates, company data
Industrials
Autos & Auto Parts
21 November 2013
page 22 of 47 , Equity Analyst, [email protected] Nakanishi
Please see important disclosure information on pages 45 - 47 of this report.
units in 2016. It is targeting volume of 300,000 units (26% share) in Thailand, 300,000
units (20%) in Indonesia, and 300,000 units (5%) in India.
The drive to enhance its engines in line with its Earth Dreams Technology strategy is
already in full swing. It has already developed direct injection versions of its core 1.3-1.5l,
1.8-2.0l, and 2.4l engines. In hybrid systems it has already launched new 1-, 2-, and 3-
motor systems, fully closing the performance gap with Toyota. It will start to fit turbo-
charged low-emission engines from 2015, rapidly building up its line-up with 1.0l, 1.5l,
and 2.0l turbo-charged units. It will establish an extensive range, from electrified engines
through to low-emission turbos.
Chart 37: Honda Motor’s Mobilio in Indonesia
Source: Honda Motor
Chart 38: Honda Motor’s LCGC Brio Satio in Indonesia
Source: Honda Motor
Nissan Motor The Power 88 medium-term plan targets global market share of 8% and a consolidated
operating profit margin of 8% by 2016, and consists of two stages. Step 1 involves inter-
regional integration of global core models, and improved efficiency and margins in its
developed nation business by rebuilding North American operations, achieved through
2013. Step 2 was to consist of reinvesting the efficiency and profitability acquired through
the former in its emerging market business, seeking to simultaneously achieve volume
and margin growth.
However, the performance of global core models and North American business — the
basis for the plan's framework — are not living up to expectations at this juncture. It looks
very much as though new products are not sufficiently competitive, and operational
disruption in the North American business has yet to be completely resolved. Accordingly,
the company had to revise down its FY3/14 profit guidance. Nissan's management team
does not believe it has come adrift from the basic Power 88 roadmap, and aims to come
up with countermeasures to get back on track, but we are highly skeptical. We believe
prospects for achieving this plan have receded.
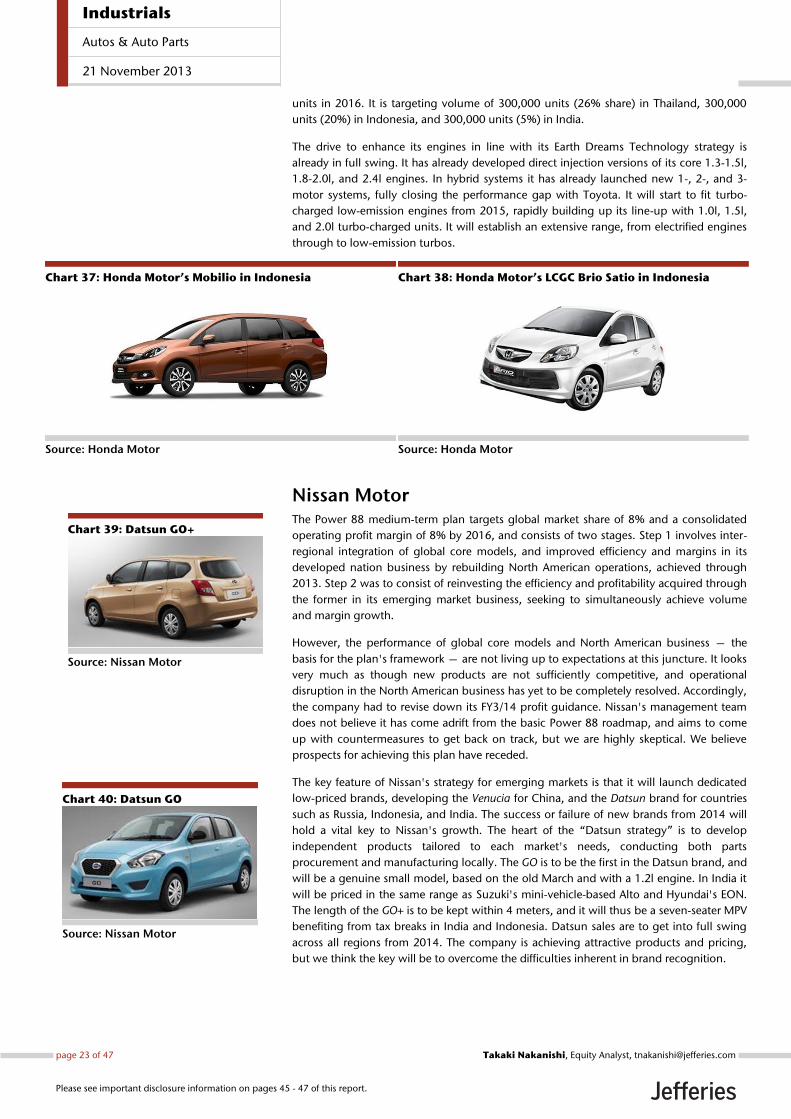
The key feature of Nissan's strategy for emerging markets is that it will launch dedicated
low-priced brands, developing the Venucia for China, and the Datsun brand for countries
such as Russia, Indonesia, and India. The success or failure of new brands from 2014 will
hold a vital key to Nissan's growth. The heart of the ‚Datsun strategy‛ is to develop
independent products tailored to each market's needs, conducting both parts
procurement and manufacturing locally. The GO is to be the first in the Datsun brand, and
will be a genuine small model, based on the old March and with a 1.2l engine. In India it
will be priced in the same range as Suzuki's mini-vehicle-based Alto and Hyundai's EON.
The length of the GO+ is to be kept within 4 meters, and it will thus be a seven-seater MPV
benefiting from tax breaks in India and Indonesia. Datsun sales are to get into full swing
across all regions from 2014. The company is achieving attractive products and pricing,
but we think the key will be to overcome the difficulties inherent in brand recognition.
Chart 39: Datsun GO+
Source: Nissan Motor
Chart 40: Datsun GO
Source: Nissan Motor
Industrials
Autos & Auto Parts
21 November 2013
page 23 of 47 , Equity Analyst, [email protected] Nakanishi
Please see important disclosure information on pages 45 - 47 of this report.
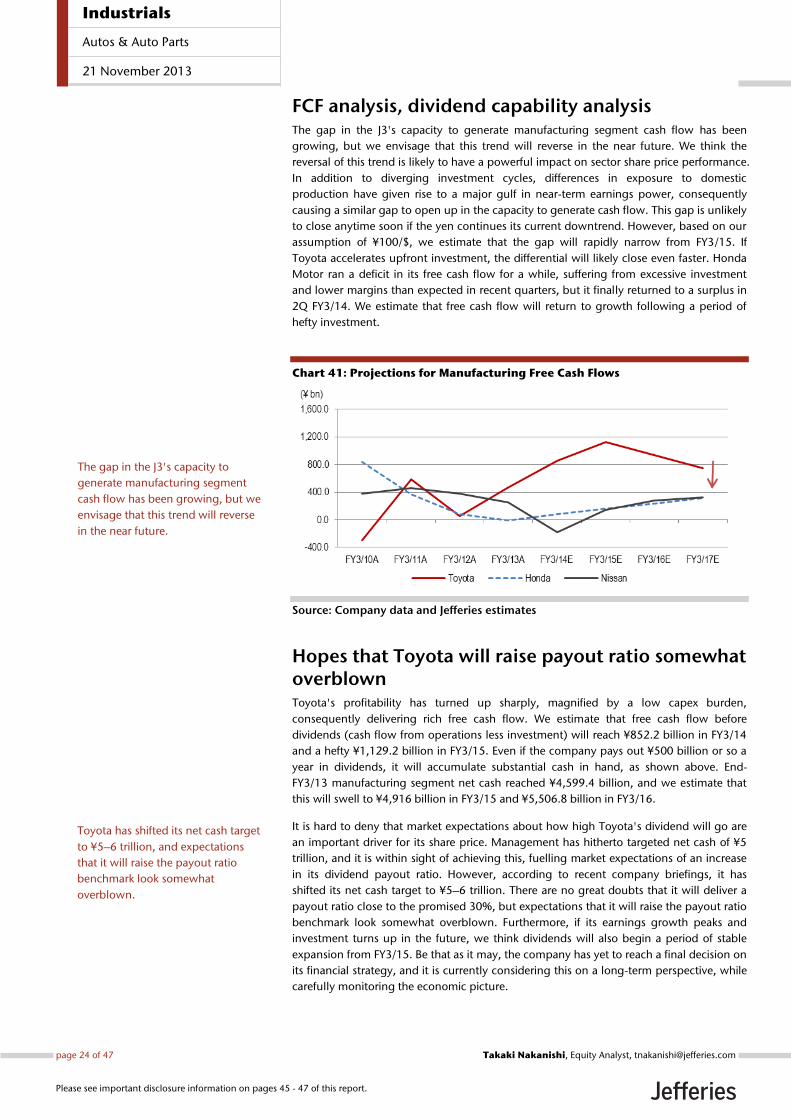
FCF analysis, dividend capability analysis The gap in the J3's capacity to generate manufacturing segment cash flow has been
growing, but we envisage that this trend will reverse in the near future. We think the
reversal of this trend is likely to have a powerful impact on sector share price performance.
In addition to diverging investment cycles, differences in exposure to domestic
production have given rise to a major gulf in near-term earnings power, consequently
causing a similar gap to open up in the capacity to generate cash flow. This gap is unlikely
to close anytime soon if the yen continues its current downtrend. However, based on our
assumption of ¥100/$, we estimate that the gap will rapidly narrow from FY3/15. If
Toyota accelerates upfront investment, the differential will likely close even faster. Honda
Motor ran a deficit in its free cash flow for a while, suffering from excessive investment
and lower margins than expected in recent quarters, but it finally returned to a surplus in
2Q FY3/14. We estimate that free cash flow will return to growth following a period of
hefty investment.
Chart 41: Projections for Manufacturing Free Cash Flows
Source: Company data and Jefferies estimates
Hopes that Toyota will raise payout ratio somewhat overblown Toyota's profitability has turned up sharply, magnified by a low capex burden,
consequently delivering rich free cash flow. We estimate that free cash flow before
dividends (cash flow from operations less investment) will reach ¥852.2 billion in FY3/14
and a hefty ¥1,129.2 billion in FY3/15. Even if the company pays out ¥500 billion or so a
year in dividends, it will accumulate substantial cash in hand, as shown above. End-
FY3/13 manufacturing segment net cash reached ¥4,599.4 billion, and we estimate that
this will swell to ¥4,916 billion in FY3/15 and ¥5,506.8 billion in FY3/16.
It is hard to deny that market expectations about how high Toyota's dividend will go are
an important driver for its share price. Management has hitherto targeted net cash of ¥5
trillion, and it is within sight of achieving this, fuelling market expectations of an increase
in its dividend payout ratio. However, according to recent company briefings, it has
shifted its net cash target to ¥5–6 trillion. There are no great doubts that it will deliver a
payout ratio close to the promised 30%, but expectations that it will raise the payout ratio
benchmark look somewhat overblown. Furthermore, if its earnings growth peaks and
investment turns up in the future, we think dividends will also begin a period of stable
expansion from FY3/15. Be that as it may, the company has yet to reach a final decision on
its financial strategy, and it is currently considering this on a long-term perspective, while
carefully monitoring the economic picture.
The gap in the J3's capacity to
generate manufacturing segment
cash flow has been growing, but we
envisage that this trend will reverse
in the near future.
Toyota has shifted its net cash target
to ¥5–6 trillion, and expectations
that it will raise the payout ratio
benchmark look somewhat
overblown.
Industrials
Autos & Auto Parts
21 November 2013
page 24 of 47 , Equity Analyst, [email protected] Nakanishi
Please see important disclosure information on pages 45 - 47 of this report.

Chart 42: Toyota Motor: Outlook of manufacturing net debt
(cash)
Company data and Jefferies estimate
Chart 43: Toyota Motor: DPS and Dividends payout ratio
Company data and Jefferies estimate
Industrials
Autos & Auto Parts
21 November 2013
page 25 of 47 , Equity Analyst, [email protected] Nakanishi
Please see important disclosure information on pages 45 - 47 of this report.
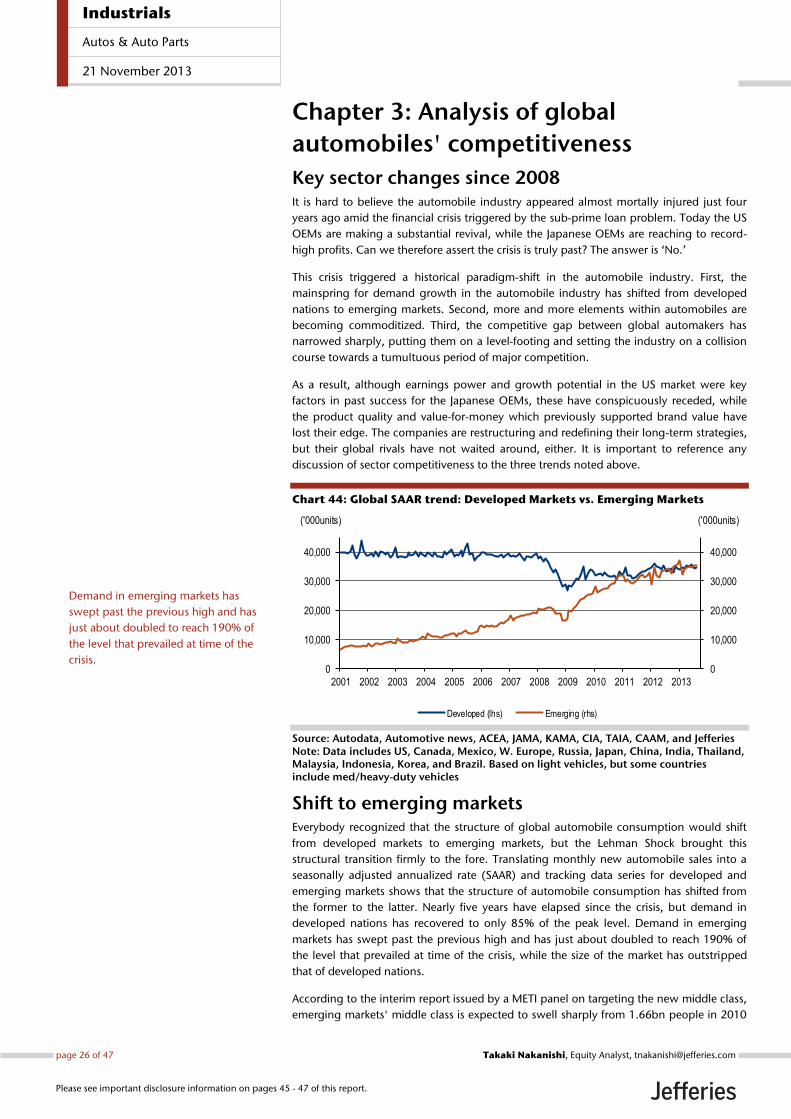
Chapter 3: Analysis of global
automobiles' competitiveness
Key sector changes since 2008 It is hard to believe the automobile industry appeared almost mortally injured just four
years ago amid the financial crisis triggered by the sub-prime loan problem. Today the US
OEMs are making a substantial revival, while the Japanese OEMs are reaching to record-
high profits. Can we therefore assert the crisis is truly past? The answer is ‘No.’
This crisis triggered a historical paradigm-shift in the automobile industry. First, the
mainspring for demand growth in the automobile industry has shifted from developed
nations to emerging markets. Second, more and more elements within automobiles are
becoming commoditized. Third, the competitive gap between global automakers has
narrowed sharply, putting them on a level-footing and setting the industry on a collision
course towards a tumultuous period of major competition.
As a result, although earnings power and growth potential in the US market were key
factors in past success for the Japanese OEMs, these have conspicuously receded, while
the product quality and value-for-money which previously supported brand value have
lost their edge. The companies are restructuring and redefining their long-term strategies,
but their global rivals have not waited around, either. It is important to reference any
discussion of sector competitiveness to the three trends noted above.
Chart 44: Global SAAR trend: Developed Markets vs. Emerging Markets
0
10,000
20,000
30,000
40,000
0
10,000
20,000
30,000
40,000
2001 2002 2003 2004 2005 2006 2007 2008 2009 2010 2011 2012 2013
Developed (lhs) Emerging (rhs)
('000units) ('000units)
Source: Autodata, Automotive news, ACEA, JAMA, KAMA, CIA, TAIA, CAAM, and Jefferies Note: Data includes US, Canada, Mexico, W. Europe, Russia, Japan, China, India, Thailand, Malaysia, Indonesia, Korea, and Brazil. Based on light vehicles, but some countries include med/heavy-duty vehicles
Shift to emerging markets Everybody recognized that the structure of global automobile consumption would shift
from developed markets to emerging markets, but the Lehman Shock brought this
structural transition firmly to the fore. Translating monthly new automobile sales into a
seasonally adjusted annualized rate (SAAR) and tracking data series for developed and
emerging markets shows that the structure of automobile consumption has shifted from
the former to the latter. Nearly five years have elapsed since the crisis, but demand in
developed nations has recovered to only 85% of the peak level. Demand in emerging
markets has swept past the previous high and has just about doubled to reach 190% of
the level that prevailed at time of the crisis, while the size of the market has outstripped
that of developed nations.
According to the interim report issued by a METI panel on targeting the new middle class,
emerging markets' middle class is expected to swell sharply from 1.66bn people in 2010
Demand in emerging markets has
swept past the previous high and has
just about doubled to reach 190% of
the level that prevailed at time of the
crisis.
Industrials
Autos & Auto Parts
21 November 2013
page 26 of 47 , Equity Analyst, [email protected] Nakanishi
Please see important disclosure information on pages 45 - 47 of this report.

to 2.15bn in 2020 and 2.36bn in 2030. Three countries — China, India, and Indonesia —
account for 80% of the new middle class. Assuming the upper-middle class starts to buy
new vehicles, growth in emerging markets has only just begun, and their role as an
engine of demand is set to become even more powerful going forwards.
The era of large-scale expansion in emerging markets will likely require the automobile
manufacturers to control scale and proliferating complexity to a degree they have never
experienced. What is worrying is the scenario already visible under which the
performance required of cars in developed nations and emerging markets respectively in
terms of road-handling, the environment, and safety will converge towards 2020. It will
be increasingly important for managements to be able to deliver in terms of both costs
and performance. The US market formed the heart of the business model that gave the
Japanese OEMs their competitive edge, so this market's sudden decline and the rapid
transition of power to emerging markets completely wrong-footed the Japanese industry.
Japanese OEMs are right in the midst of implementing structural reforms.
Commoditization Automobile demand in developed nations has started to become increasingly marked by
commoditization, and it has become very hard to generate earnings simply through the
past approach of pushing out vehicles with an array of functions. The main source of
purchasing is shifting from baby-boomers, who favored large, high-emission and multi-
function vehicles, to younger buyers who prefer small, fuel-efficient cars. There are also
endless requirements for safety and environmental features for automobiles.
Requirements for collision avoidance systems and other safety features are escalating,
while environmental restrictions such as on CO2 emissions are being tightened up sharply,
and costs are being driven relentlessly higher. It has started to become very difficult to
recover such costs through prices.
The struggle is even more intense in emerging markets, where purchasing power is lower
than in developed markets. At this juncture, mass-sales models in emerging economies
have not completely escaped the realms of "low prices regardless of quality," but we
envisage that build and performance will converge to a degree which will render
discussion of the boundaries between emerging markets and developed nations
meaningless by 2020, and we think companies will have to provide products at nearly-
equal standards to those in developed nations but at significantly lower prices. We expect
this tendency to be particularly pronounced in China, the largest emerging market. It is
unlikely to be easy to control costs while maintaining large-scale volume growth without
radical changes to manufacturing concepts and product planning. Companies will also
need to build a global strategy across the whole range of R&D, design, procurement, and
manufacturing.
Build and performance will converge
to a degree which will render
discussion of the boundaries
between emerging markets and
developed nations meaningless by
2020.
Industrials
Autos & Auto Parts
21 November 2013
page 27 of 47 , Equity Analyst, [email protected] Nakanishi
Please see important disclosure information on pages 45 - 47 of this report.

Chart 45: CO2 emission regulations by the key country
Source: ICCT
Competitive gap to narrow Great changes are taking place in the global automobile industry's competitive landscape,
affected by the 2008 Lehman Shock and Japanese/US manufacturers' fading competitive
advantages. It is clear that manufacturers in the 2nd tier are rapidly closing the gap with
GM and Toyota, which used to tower over the industry. The hierarchy revolving around
US brands has broken down, and the world's top five manufacturers are intermingled,
locked in fierce competition. Looking at global sales rankings in 2012, growth was
lackluster at Toyota and GM, which formerly boasted an overwhelming advantage in
terms of scale, against growth of 45% from 2007 at VW, 20% at fourth-ranked
Renault/Nissan, and 70% at fifth-ranked Hyundai Group.
We attribute the narrowing gap between rival firms to maturing basic automobile
technology, which reduces the scope for product differentiation, as well as to the
prevailing trends of the times, whereby European manufacturers' increasing use of
components from mega-suppliers to overcome manufacturing and product quality
domains in which they struggle is allowing them to open up their business models and
pursue multi-brand strategies in a new approach, delivering greater benefits effectively.
We think this pattern will likely continue for a while longer. Among the laggard second-
tier companies, we flag the possibility that Ford and Honda could crank up their strategic
fight back going forwards, likely stoking even more intense competition.
Chart 46: Global Retail Sales Units by OEMs
Source: 2002-2007 Automotive News, 2008-2012 FOURIN
CO2 emissions are being tightened
up sharply, and they all are similar
by 2020.
Industrials
Autos & Auto Parts
21 November 2013
page 28 of 47 , Equity Analyst, [email protected] Nakanishi
Please see important disclosure information on pages 45 - 47 of this report.

Analysis of global competitiveness Tokyo University’s Professor Fujimoto divides competitive strength in the automobile
industry into three layers, namely "deep-layer competitiveness", "surface-layer
competitiveness," and "earnings power." The visible elements of product strength,
performance, and price which appeal directly to the customer constitute "surface-layer
competitiveness." The resulting financial performance is "earnings power." Factors such as
strategic positioning, management power, QCD (quality, cost, delivery), efficiency, and
productivity which are not visible on the surface make up "deep-layer competitiveness,"
but this is hard to measure. Looking at these in terms of duration, earnings power
fluctuates near-term on a quarterly basis, while surface-layer competitiveness may rise and
fall within model cycles, deep-layer competitiveness is highly stable, and can be explained
as broadly correlating with "organizational capabilities for manufacturing," so long as
there is no major transformation in product architecture.
Surface-layer approach
Chart 47: Japanese Brand’s Market Share Gains/Losses between 2007 and 2012
Note: Gains and losses of market share between 2007 and 2012 for the 55 countries Source: Jefferies based on MarkLines’ data
The global-level competitive strength formerly enjoyed by Japanese-branded vehicles has
visibly eroded, and there is an inescapable perception that the edge given by surface-layer
competitiveness in terms of product attributes, design, and product quality has been
dilluted. The fall in Japanese brands' global market share is plain to see, down from 31.1%
in 2007 to an abnormal figure of 26.8% in 2011 in the wake of the catastrophic
earthquake, but then remaining weak at around 29% even in 2012, close to the level of
the low-point immediately after the Lehman Shock.
Chart 48: Japanese brands' market shares and volume CAGRs
Source: Jefferies, company data Note: The size of circle represents Japanese brands' sales volumes of the each region
-40%
-30%
-20%
-10%
0%
10%
20%
Iran
Indo
nesi
aM
exic
oP
akis
tan
Mal
aysi
aP
olan
dR
oman
iaB
razi
lS
aud
i Ara
bia
Ven
ezue
laS
pain
Slo
vaki
aS
outh
Afr
ica
Col
umbi
aS
outh
Kor
eaU
.S.
Bel
arus
Uzb
ekis
tan
Japa
nF
ranc
eP
hilip
pine
sB
elgi
umE
gypt
Uru
guay UK
Italy
Arg
entin
aS
wed
enC
zech
Tai
wan
Rus
sia
Can
ada
Ger
man
yA
ustr
alia
Ukr
aine
Cro
atia
Net
herla
nds
Indi
aV
ietn
amC
hina
New
Zea
land
Tur
key
Tha
iland
Den
mar
kS
witz
erla
ndA
ustr
iaP
ortu
gal
Nor
way
Fin
land
Gre
ece
Irel
and
Chi
leU
AE
Isra
elS
inga
pore
Industrials
Autos & Auto Parts
21 November 2013
page 29 of 47 , Equity Analyst, [email protected] Nakanishi
Please see important disclosure information on pages 45 - 47 of this report.
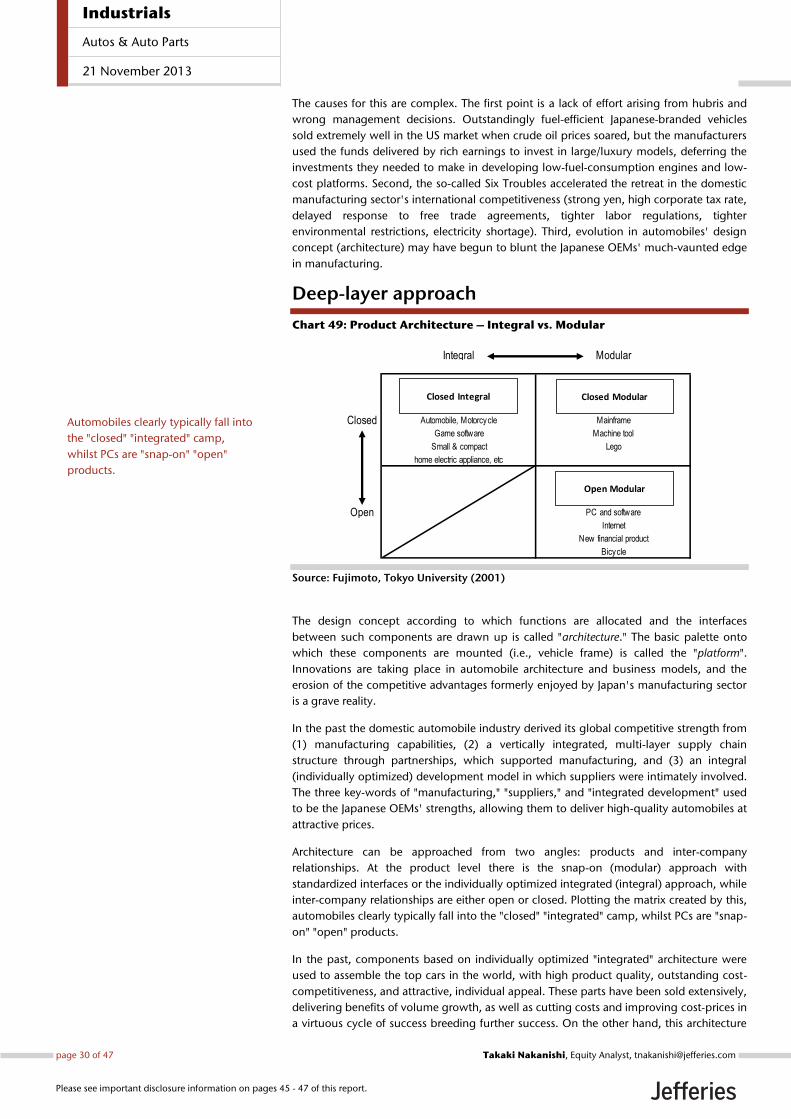
The causes for this are complex. The first point is a lack of effort arising from hubris and
wrong management decisions. Outstandingly fuel-efficient Japanese-branded vehicles
sold extremely well in the US market when crude oil prices soared, but the manufacturers
used the funds delivered by rich earnings to invest in large/luxury models, deferring the
investments they needed to make in developing low-fuel-consumption engines and low-
cost platforms. Second, the so-called Six Troubles accelerated the retreat in the domestic
manufacturing sector's international competitiveness (strong yen, high corporate tax rate,
delayed response to free trade agreements, tighter labor regulations, tighter
environmental restrictions, electricity shortage). Third, evolution in automobiles' design
concept (architecture) may have begun to blunt the Japanese OEMs' much-vaunted edge
in manufacturing.
Deep-layer approach
Chart 49: Product Architecture – Integral vs. Modular
Source: Fujimoto, Tokyo University (2001)
The design concept according to which functions are allocated and the interfaces
between such components are drawn up is called "architecture." The basic palette onto
which these components are mounted (i.e., vehicle frame) is called the "platform".
Innovations are taking place in automobile architecture and business models, and the
erosion of the competitive advantages formerly enjoyed by Japan's manufacturing sector
is a grave reality.
In the past the domestic automobile industry derived its global competitive strength from
(1) manufacturing capabilities, (2) a vertically integrated, multi-layer supply chain
structure through partnerships, which supported manufacturing, and (3) an integral
(individually optimized) development model in which suppliers were intimately involved.
The three key-words of "manufacturing," "suppliers," and "integrated development" used
to be the Japanese OEMs' strengths, allowing them to deliver high-quality automobiles at
attractive prices.
Architecture can be approached from two angles: products and inter-company
relationships. At the product level there is the snap-on (modular) approach with
standardized interfaces or the individually optimized integrated (integral) approach, while
inter-company relationships are either open or closed. Plotting the matrix created by this,
automobiles clearly typically fall into the "closed" "integrated" camp, whilst PCs are "snap-
on" "open" products.
In the past, components based on individually optimized "integrated" architecture were
used to assemble the top cars in the world, with high product quality, outstanding cost-
competitiveness, and attractive, individual appeal. These parts have been sold extensively,
delivering benefits of volume growth, as well as cutting costs and improving cost-prices in
a virtuous cycle of success breeding further success. On the other hand, this architecture
Integral Modular
Closed Automobile, Motorcycle Mainframe
Game software Machine tool
Small & compact Lego
home electric appliance, etc
Open PC and software
Internet
New financial product
Bicycle
Closed Integral Closed Modular
Open Modular
Automobiles clearly typically fall into
the "closed" "integrated" camp,
whilst PCs are "snap-on" "open"
products.
Industrials
Autos & Auto Parts
21 November 2013
page 30 of 47 , Equity Analyst, [email protected] Nakanishi
Please see important disclosure information on pages 45 - 47 of this report.

lends itself to insular components, divorced from the ongoing global trend towards open,
standardized development. In other words, it easily falls prey to the Galapagos Effect. This
is an impediment to emerging market business, which needs low-cost, localized
procurement.
At present, individual optimization is running into the limits of resources as the
automobile industry sees explosive growth in volumes and regional coverage, and it is
proving increasingly challenging to run complex process-management based on
individual optimization. The domestic manufacturing sector's virtuous cycle of the past
has started to turn into a vicious circle. The sector needs to overhaul Japan's mother-shop
role, which formerly delivered competitiveness at the development, procurement, and
production stages, respectively, and the necessary structural realignment needs to be
pushed through without delay.
Financial approach So what about earnings power, which is the financial performance resulting from
competitiveness? This shows remarkably good results, and today's Japanese OEMs have
started to establish their strongest-ever competitiveness in terms of earnings. It is worth
noting that the upturn in financial competitiveness — running counter to surface- and
deep-layer competitiveness, in which they are losing their strengths — could be
overstated, resulting from the coincidence of their investment cycles and exchange rate
fluctuations. The Japanese firms are well-placed to surpass the record-high profits of
FY3/08. Whether or not this earnings power is genuine hinges on whether it is supported
by intrinsic competitiveness.
Regardless of surface- and deep-layer competitiveness, any assessment of competitive
strength is distorted more by forex and external factors than the underlying picture.
Appraisal of the Japanese OEMs was at rock-bottom from 2008, but this was clearly
because the downturn was over-accentuated by external factors, and the underlying
picture was not as bad as was implied. The current picture is a quasi-reversal of this, with
overheads and investment reined in sharply in accounting terms, and upfront
development and preparation for the future being deferred, leaving costs extremely low.
Cooperative parts pricing from suppliers agreed during the period of yen strength also
persists. It is clear that a sharp fall in the yen under such circumstances is bound to deliver
a profit bonanza. The true test of the Japanese OEMs will be whether they can maintain
their current earnings power while also delivering the sustained development and
investment needed to lift their surface-layer and deep-layer competitiveness.
Chart 50: EBIT margin trend by Global OEMs
Source: Company data, Jefferies estimates and Bloomberg consensus Note: Japanese EBIT margin is based on Jefferies estimates. All the others are based on Bloomberg consensus.
The Japanese firms surpass record-
high profits.
Industrials
Autos & Auto Parts
21 November 2013
page 31 of 47 , Equity Analyst, [email protected] Nakanishi
Please see important disclosure information on pages 45 - 47 of this report.
The requisite shape of competitiveness from now We identify the following four points defining the automobile industry's competitiveness
through to 2020.
1. New architecture breakthroughs delivering superior costs and performance,
2. Innovations which overcome significant scale and complexity,
3. Management capabilities on both the strategic and "soft" fronts, and
4. Brands and premium strategies
The basic architecture for automobiles remains essentially unchanged, even more than
100 years after the first car was born. We are unlikely to see the same kind of revolutionary
changes evident in the electronics industry, even looking ahead. However, it is irrefutable
that the traditional gentle pace of evolution is starting to bring challenges. The industry is
moving into an era of massive competition bringing disruption on a global scale. The era
of large-scale expansion in emerging markets will require the automobile manufacturers
to control scale and proliferating complexity to a degree they have never experienced. The
performance attributes required of cars in developed nations and emerging markets are
likely to converge, and there is a pressing need for break-through to deliver superior costs
and performance.
The automobile industry needs to come up with innovations which transcend scale and
complexity. Technological reforms and new business models are needed to provide fresh
innovations in order to appropriately manage costs, volumes, and the environmental
burden. In the past the idea of global sales volume of 10mn units appeared to be a whole
new order of magnitude. Now 10mn units is merely seen as a new starting line, and
unless companies can find a way to manage both product portfolios inflated by this scale
and globalized operations, thereby securing earnings, they will be unable to flourish on a
permanent basis.
Brands and premium strategies will likely become significantly more important.
Automobiles' functions and product attributes are becoming increasingly commoditized,
implying that elements which govern relative competitiveness are shifting from product
quality/technology to prices/costs. Building capabilities to manage marketing, design,
brands, and other elements of the "soft" aspect of the business may take on an even more
important role than in the past.
The horizontal distribution of work may evolve in comparative terms, while inter-
company relationships may also progress to a relatively open structure. It will likely
become increasingly important to strategically identify in which areas companies can
make a profit. This is not a time to seek to beat the competition just through
manufacturing. The auto-makers could find themselves paupers amid plenty unless they
can strategically build business models with a clear framework to determine where and
how they can generate profits, in addition to their manufacturing capabilities. We think
the need for management capabilities on both the business model and "soft" front will
become significantly more important.
The automobile industry needs to
come up with innovations which
transcend scale and complexity.
Industrials
Autos & Auto Parts
21 November 2013
page 32 of 47 , Equity Analyst, [email protected] Nakanishi
Please see important disclosure information on pages 45 - 47 of this report.

Chapter 4: Abreast of markets and
Japanese OEMs' positioning
Japan — tax reforms could play a major role
Outlook for tax system reforms Not only is the impact of the April 2014 consumption tax hike unclear (from 5% to 8%),
but it is also hard to tell how overall automobile tax system reforms will take shape, and
the outlook for domestic automobile sales is uncertain.
The main scenario we envisage is a follows.
1. The LDP's Tax System Reform Committee is set to decide by December on tax levies
on automobile bodies in its broad framework for the tax system in FY3/15. In the
main scenario we envisage four points: (1) a cut in acquisition tax (from 5% to 2%
for registered vehicles, from 3% to 0% for mini-vehicles — stepwise cut); (2) the
rejection of the plan put forward by Ministry of Internal Affairs and Communications
(MIC) to increase the tax on mini-vehicles; (3) covering a staged cut in the
acquisition tax in FY3/15 by sourcing funds temporarily from elsewhere (for example,
the automobile weight tax); and (4) deferral of any radical reforms until the broad
framework for the tax system in FY3/16.
2. Accordingly, we expect the demand rush ahead of the tax hike to be mitigated to
some degree, but we think this will still amount to around 200,000 units in
October–March. The corresponding pullback will come through in April–September
2014.
3. Looking ahead to the October 2015 consumption tax hike (from 8% to 10%), radical
reforms to taxes levied on vehicle bodies will constitute a topic for the discussions in
the run-up to the broad framework for the FY3/16 tax system, and there will be a
long-term debate while monitoring market activity after the consumption tax hike.
4. We estimate that FY3/14 domestic vehicle sales will rise 5.8% YoY to 5.51 million
units. We then forecast a decline of 6.1% YoY to 5.17 million units in FY3/15. As a
risk scenario, there could be a double-figure drop in sales to below 5 million units in
the event of an automobile related tax hike.
Chart 51: Trend "Eco-car subsidies" covered vehicle unit
composition ratio
Note: Based on "New Eco-car subsidies" system from April 2012 Source: JAMA
Chart 52: Trend of Automobile Related Tax Revenues
Source: Ministry of Internal Affairs and Communications
The main scenario we envisage is…
Industrials
Autos & Auto Parts
21 November 2013
page 33 of 47 , Equity Analyst, [email protected] Nakanishi
Please see important disclosure information on pages 45 - 47 of this report.

Chart 53 gives details for automobile related taxes. When an automobile is purchased,
consumption tax and automobile acquisition tax are levied as national taxes, while vehicle
ownership requires automobile road tax (registered vehicles) and mini-vehicle road tax
(mini-vehicles) as local taxes, and automobile weight tax as a state/local tax. Scrapping
the roughly ¥180 billion in acquisition tax would leave local authorities short of funds, so
the MIC, which oversees local tax funding, has suggested a hike in automobile/mini-
vehicle taxes within the various local tax sources. The fact that the argument of funding
has not extended to include the bigger pool of state taxes under the Ministry of Finance's
auspices is a regrettable consequence of Japan's over-compartmentalized administrative
system, and is likely to be hard to understand from overseas investors' perspective.
The eco-car tax cut currently extends to more than 80% of domestic sales volume, while
50% are effectively tax-exempt. As shown in Chart 52, acquisition and weight taxes have
already been slashed, leading to a reduction of over ¥500 billion per fiscal year.
Substantial tax breaks already apply to HEVs (tax-exempt) and to mini-vehicles (almost all
of which are also tax-exempt). Even if the acquisition tax is cut at the same time the
consumption is raised, the burden from the consumption tax will rise in real terms. We
believe the rising tax rate is likely to deal a body blow to domestic new automobile sales,
leading to a consistent gradual downtrend. However, we do not currently envisage any
sharp fall in domestic production volume. The impact of the correction in the strong yen
is gradually improving conditions for exports, and it looks as though previous concerns of
plummeting export volumes were unfounded. We think that the decline in domestic
production will be relatively gentle, and violent changes do not form part of our main
scenario.
Chart 53: Automobile Related Tax Revenues
Source: JAMA
Tax Revenue
(¥ bn)Original Tax Rate Current Tax Rate
On acquisition Registration vehicles 3% Registration vehicles 5%
Mini-vehicles 3% Mini-vehicles 3%
Consumption tax 696.2 5% 5%-->8%(Apr., 2014)-->10%(Oct., 2015)
During
ownershipWeight tax 650.9
¥2,500/0.5t per year (Registered vehicles for private
use)
¥4,100/0.5t per year (Registered vehicles for
private use)
Automobile road tax 1,549.7 Passenger cars (for private use) Passenger cars (for private use)
‐ Up to 1,000cc ¥29,500 / year ‐ Up to 1,000cc ¥29,500 / year
1,001 to 1,500cc ¥34,500 / year 1,001 to 1,500cc ¥34,500 / year
1,501 to 2,000cc ¥39,500 / year 1,501 to 2,000cc ¥39,500 / year
2,001 to 2,500cc ¥45,000 / year 2,001 to 2,500cc ¥45,000 / year
2,501 to 3,000cc ¥51,000 / year 2,501 to 3,000cc ¥51,000 / year
3,001 to 3,500cc ¥58,000 / year 3,001 to 3,500cc ¥58,000 / year
3,501 to 4,000cc ¥66,500 / year 3,501 to 4,000cc ¥66,500 / year
4,001 to 4,500cc ¥76,500 / year 4,001 to 4,500cc ¥76,500 / year
4,501 to 6,000cc ¥88,000 / year 4,501 to 6,000cc ¥88,000 / year
‐Over 6,001cc ¥111,000 / year ‐Over 6,001cc ¥111,000 / year
Mini-vehicle road tax 185.2 Mini-vehicles (for private use) Mini-vehicles (for private use)
Passenger cars ¥7,200 / year Passenger cars ¥7,200 / year
Total 3,272.0
Taxes on
Automobiles
Acquisition tax 190.0
Industrials
Autos & Auto Parts
21 November 2013
page 34 of 47 , Equity Analyst, [email protected] Nakanishi
Please see important disclosure information on pages 45 - 47 of this report.
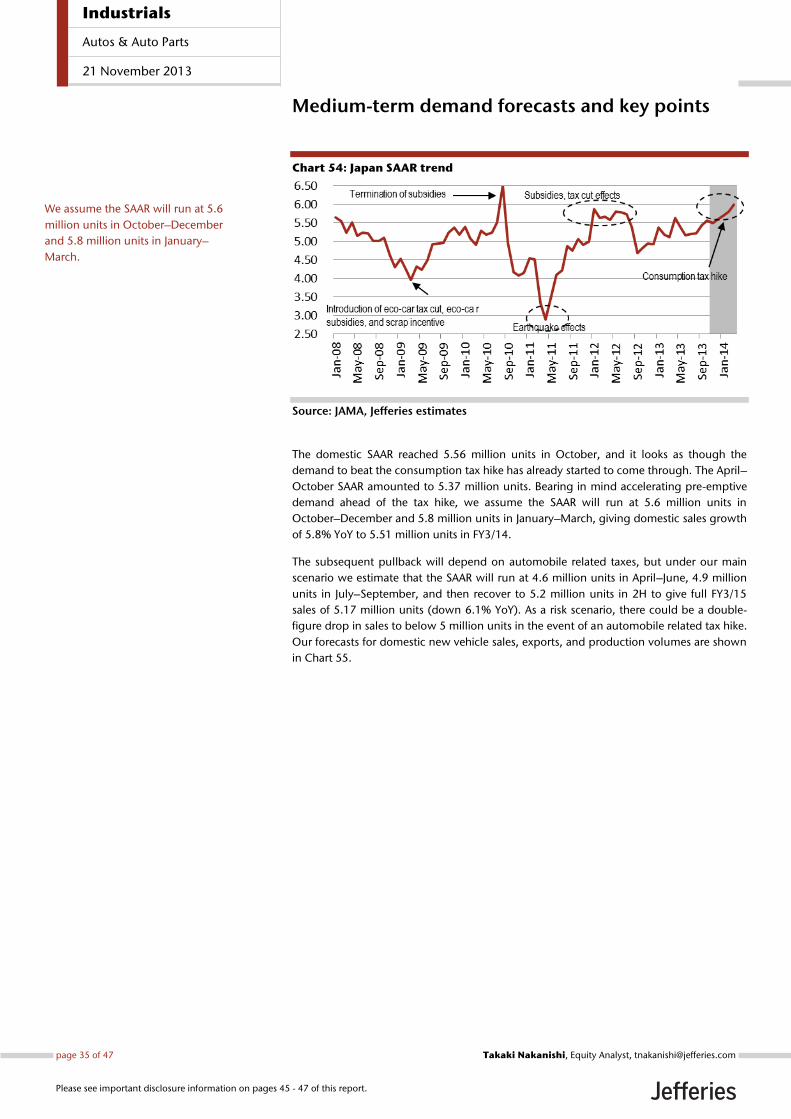
Medium-term demand forecasts and key points
Chart 54: Japan SAAR trend
Source: JAMA, Jefferies estimates
The domestic SAAR reached 5.56 million units in October, and it looks as though the
demand to beat the consumption tax hike has already started to come through. The April–
October SAAR amounted to 5.37 million units. Bearing in mind accelerating pre-emptive
demand ahead of the tax hike, we assume the SAAR will run at 5.6 million units in
October–December and 5.8 million units in January–March, giving domestic sales growth
of 5.8% YoY to 5.51 million units in FY3/14.
The subsequent pullback will depend on automobile related taxes, but under our main
scenario we estimate that the SAAR will run at 4.6 million units in April–June, 4.9 million
units in July–September, and then recover to 5.2 million units in 2H to give full FY3/15
sales of 5.17 million units (down 6.1% YoY). As a risk scenario, there could be a double-
figure drop in sales to below 5 million units in the event of an automobile related tax hike.
Our forecasts for domestic new vehicle sales, exports, and production volumes are shown
in Chart 55.
We assume the SAAR will run at 5.6
million units in October–December
and 5.8 million units in January–
March.
Industrials
Autos & Auto Parts
21 November 2013
page 35 of 47 , Equity Analyst, [email protected] Nakanishi
Please see important disclosure information on pages 45 - 47 of this report.
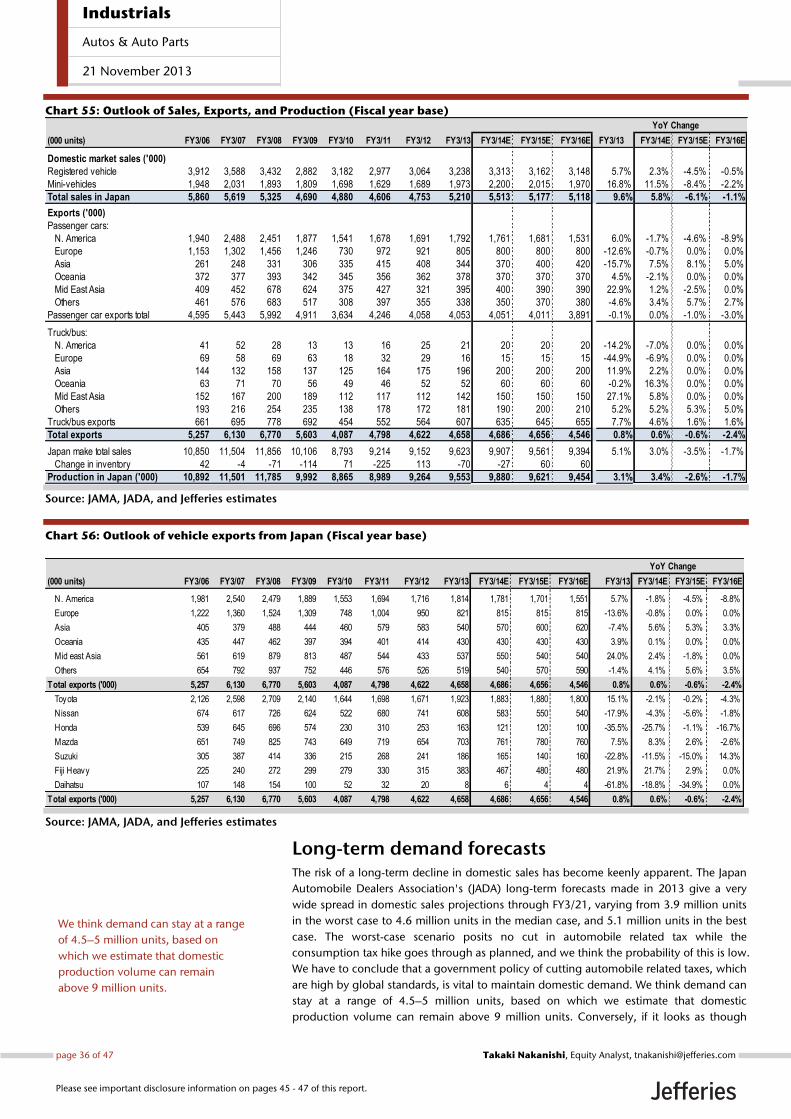
Chart 55: Outlook of Sales, Exports, and Production (Fiscal year base)
Source: JAMA, JADA, and Jefferies estimates
Chart 56: Outlook of vehicle exports from Japan (Fiscal year base)
Source: JAMA, JADA, and Jefferies estimates
Long-term demand forecasts The risk of a long-term decline in domestic sales has become keenly apparent. The Japan
Automobile Dealers Association's (JADA) long-term forecasts made in 2013 give a very
wide spread in domestic sales projections through FY3/21, varying from 3.9 million units
in the worst case to 4.6 million units in the median case, and 5.1 million units in the best
case. The worst-case scenario posits no cut in automobile related tax while the
consumption tax hike goes through as planned, and we think the probability of this is low.
We have to conclude that a government policy of cutting automobile related taxes, which
are high by global standards, is vital to maintain domestic demand. We think demand can
stay at a range of 4.5–5 million units, based on which we estimate that domestic
production volume can remain above 9 million units. Conversely, if it looks as though
YoY Change
(000 units) FY3/06 FY3/07 FY3/08 FY3/09 FY3/10 FY3/11 FY3/12 FY3/13 FY3/14E FY3/15E FY3/16E FY3/13 FY3/14E FY3/15E FY3/16E
Domestic market sales ('000)
Registered vehicle 3,912 3,588 3,432 2,882 3,182 2,977 3,064 3,238 3,313 3,162 3,148 5.7% 2.3% -4.5% -0.5%
Mini-vehicles 1,948 2,031 1,893 1,809 1,698 1,629 1,689 1,973 2,200 2,015 1,970 16.8% 11.5% -8.4% -2.2%
Total sales in Japan 5,860 5,619 5,325 4,690 4,880 4,606 4,753 5,210 5,513 5,177 5,118 9.6% 5.8% -6.1% -1.1%
Exports ('000)
Passenger cars:
N. America 1,940 2,488 2,451 1,877 1,541 1,678 1,691 1,792 1,761 1,681 1,531 6.0% -1.7% -4.6% -8.9%
Europe 1,153 1,302 1,456 1,246 730 972 921 805 800 800 800 -12.6% -0.7% 0.0% 0.0%
Asia 261 248 331 306 335 415 408 344 370 400 420 -15.7% 7.5% 8.1% 5.0%
Oceania 372 377 393 342 345 356 362 378 370 370 370 4.5% -2.1% 0.0% 0.0%
Mid East Asia 409 452 678 624 375 427 321 395 400 390 390 22.9% 1.2% -2.5% 0.0%
Others 461 576 683 517 308 397 355 338 350 370 380 -4.6% 3.4% 5.7% 2.7%
Passenger car exports total 4,595 5,443 5,992 4,911 3,634 4,246 4,058 4,053 4,051 4,011 3,891 -0.1% 0.0% -1.0% -3.0%
Truck/bus:
N. America 41 52 28 13 13 16 25 21 20 20 20 -14.2% -7.0% 0.0% 0.0%
Europe 69 58 69 63 18 32 29 16 15 15 15 -44.9% -6.9% 0.0% 0.0%
Asia 144 132 158 137 125 164 175 196 200 200 200 11.9% 2.2% 0.0% 0.0%
Oceania 63 71 70 56 49 46 52 52 60 60 60 -0.2% 16.3% 0.0% 0.0%
Mid East Asia 152 167 200 189 112 117 112 142 150 150 150 27.1% 5.8% 0.0% 0.0%
Others 193 216 254 235 138 178 172 181 190 200 210 5.2% 5.2% 5.3% 5.0%
Truck/bus exports 661 695 778 692 454 552 564 607 635 645 655 7.7% 4.6% 1.6% 1.6%
Total exports 5,257 6,130 6,770 5,603 4,087 4,798 4,622 4,658 4,686 4,656 4,546 0.8% 0.6% -0.6% -2.4%
Japan make total sales 10,850 11,504 11,856 10,106 8,793 9,214 9,152 9,623 9,907 9,561 9,394 5.1% 3.0% -3.5% -1.7%
Change in inventory 42 -4 -71 -114 71 -225 113 -70 -27 60 60
Production in Japan ('000) 10,892 11,501 11,785 9,992 8,865 8,989 9,264 9,553 9,880 9,621 9,454 3.1% 3.4% -2.6% -1.7%
YoY Change
(000 units) FY3/06 FY3/07 FY3/08 FY3/09 FY3/10 FY3/11 FY3/12 FY3/13 FY3/14E FY3/15E FY3/16E FY3/13 FY3/14E FY3/15E FY3/16E
N. America 1,981 2,540 2,479 1,889 1,553 1,694 1,716 1,814 1,781 1,701 1,551 5.7% -1.8% -4.5% -8.8%
Europe 1,222 1,360 1,524 1,309 748 1,004 950 821 815 815 815 -13.6% -0.8% 0.0% 0.0%
Asia 405 379 488 444 460 579 583 540 570 600 620 -7.4% 5.6% 5.3% 3.3%
Oceania 435 447 462 397 394 401 414 430 430 430 430 3.9% 0.1% 0.0% 0.0%
Mid east Asia 561 619 879 813 487 544 433 537 550 540 540 24.0% 2.4% -1.8% 0.0%
Others 654 792 937 752 446 576 526 519 540 570 590 -1.4% 4.1% 5.6% 3.5%
Total exports ('000) 5,257 6,130 6,770 5,603 4,087 4,798 4,622 4,658 4,686 4,656 4,546 0.8% 0.6% -0.6% -2.4%
Toyota 2,126 2,598 2,709 2,140 1,644 1,698 1,671 1,923 1,883 1,880 1,800 15.1% -2.1% -0.2% -4.3%
Nissan 674 617 726 624 522 680 741 608 583 550 540 -17.9% -4.3% -5.6% -1.8%
Honda 539 645 696 574 230 310 253 163 121 120 100 -35.5% -25.7% -1.1% -16.7%
Mazda 651 749 825 743 649 719 654 703 761 780 760 7.5% 8.3% 2.6% -2.6%
Suzuki 305 387 414 336 215 268 241 186 165 140 160 -22.8% -11.5% -15.0% 14.3%
Fiji Heavy 225 240 272 299 279 330 315 383 467 480 480 21.9% 21.7% 2.9% 0.0%
Daihatsu 107 148 154 100 52 32 20 8 6 4 4 -61.8% -18.8% -34.9% 0.0%
Total exports ('000) 5,257 6,130 6,770 5,603 4,087 4,798 4,622 4,658 4,686 4,656 4,546 0.8% 0.6% -0.6% -2.4%
We think demand can stay at a range
of 4.5–5 million units, based on
which we estimate that domestic
production volume can remain
above 9 million units.
Industrials
Autos & Auto Parts
21 November 2013
page 36 of 47 , Equity Analyst, [email protected] Nakanishi
Please see important disclosure information on pages 45 - 47 of this report.

domestic demand could fall below 4.5 million units, domestic production would likely fall
below 9 million units, while factory capacity utilization would drop under 80%, returning
the industry to crisis mode. It will be vital to monitor the LDP's Tax System Reform
Committee's thinking very closely.
Chart 57: New Vehicle Sales Units Outlook in Japan
Source: JADA
Chart 58: Passenger Car Ownership Outlook in Japan
Source: JADA
Chart 59: Production capacity in Japan
Source: Source: Companies data and Jefferies estimates
Chart 60: Capacity utilization rates (%)
Source: Companies data and Jefferies estimates
Chart 61: Outlook of vehicle production in Japan (Fiscal year base)
Source: JAMA, JADA, and Jefferies estimates
YoY Change
(000 units) FY3/06 FY3/07 FY3/08 FY3/09 FY3/10 FY3/11 FY3/12 FY3/13 FY3/14E FY3/15E FY3/16E FY3/13 FY3/14E FY3/15E FY3/16E
Toyota 3,863 4,185 4,265 3,393 3,207 3,004 3,120 3,369 3,362 3,254 3,175 8.0% -0.2% -3.2% -2.4%
Nissan 1,365 1,192 1,263 1,050 1,025 1,073 1,199 1,060 1,066 989 977 -11.6% 0.5% -7.2% -1.2%
Honda 1,243 1,348 1,297 1,148 902 912 870 876 966 975 936 0.6% 10.2% 1.0% -4.0%
Mitsubishi 706 776 876 670 514 663 586 486 615 632 623 -17.0% 26.4% 2.8% -1.5%
Mazda 904 967 1,047 899 828 864 847 879 954 966 943 3.8% 8.5% 1.3% -2.4%
Suzuki 1,133 1,212 1,219 1,139 959 994 1,020 1,044 979 913 929 2.3% -6.3% -6.7% 1.7%
Fuji Heavy 467 484 490 474 453 459 468 585 662 683 670 24.9% 13.2% 3.1% -1.9%
Daihatsu 722 816 785 771 673 619 690 757 777 717 705 9.8% 2.5% -7.7% -1.7%
Production in Japan ('000) 10,892 11,501 11,785 9,992 8,865 8,989 9,264 9,553 9,880 9,621 9,454 3.1% 3.4% -2.6% -1.7%
Industrials
Autos & Auto Parts
21 November 2013
page 37 of 47 , Equity Analyst, [email protected] Nakanishi
Please see important disclosure information on pages 45 - 47 of this report.
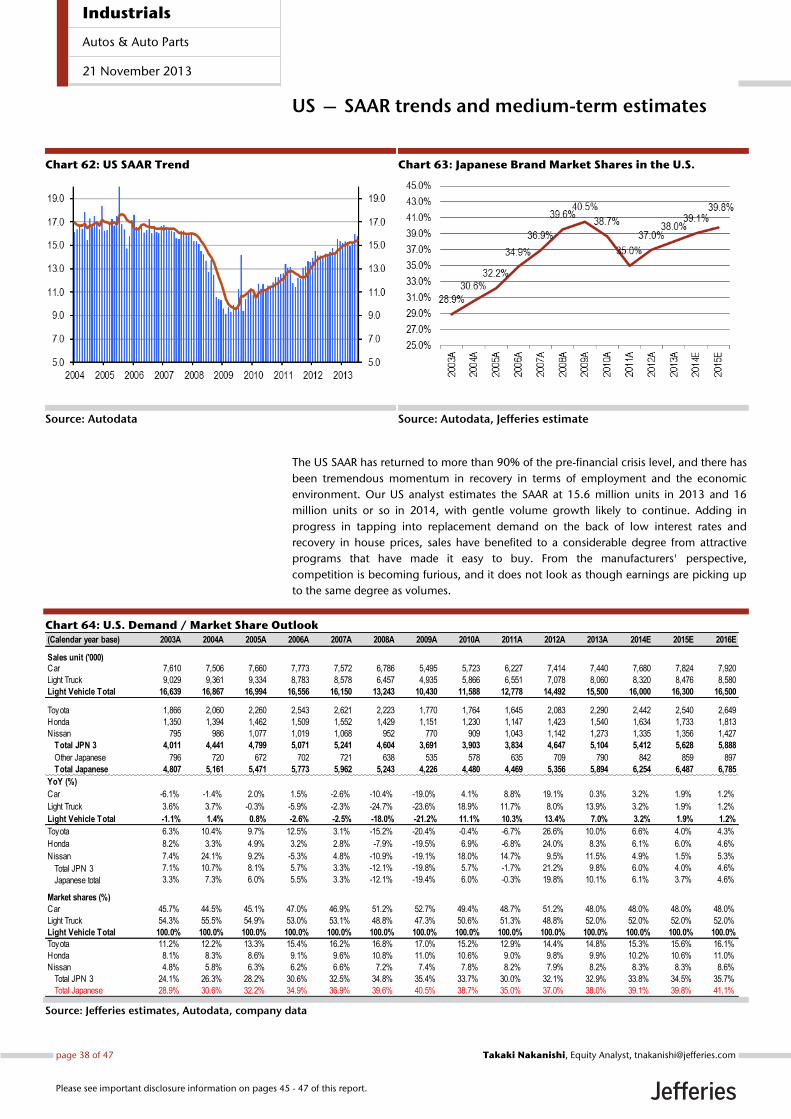
US — SAAR trends and medium-term estimates
Chart 62: US SAAR Trend
Source: Autodata
Chart 63: Japanese Brand Market Shares in the U.S.
Source: Autodata, Jefferies estimate
The US SAAR has returned to more than 90% of the pre-financial crisis level, and there has
been tremendous momentum in recovery in terms of employment and the economic
environment. Our US analyst estimates the SAAR at 15.6 million units in 2013 and 16
million units or so in 2014, with gentle volume growth likely to continue. Adding in
progress in tapping into replacement demand on the back of low interest rates and
recovery in house prices, sales have benefited to a considerable degree from attractive
programs that have made it easy to buy. From the manufacturers' perspective,
competition is becoming furious, and it does not look as though earnings are picking up
to the same degree as volumes.
Chart 64: U.S. Demand / Market Share Outlook
Source: Jefferies estimates, Autodata, company data
(Calendar year base) 2003A 2004A 2005A 2006A 2007A 2008A 2009A 2010A 2011A 2012A 2013A 2014E 2015E 2016E
Sales unit ('000)Car 7,610 7,506 7,660 7,773 7,572 6,786 5,495 5,723 6,227 7,414 7,440 7,680 7,824 7,920
Light Truck 9,029 9,361 9,334 8,783 8,578 6,457 4,935 5,866 6,551 7,078 8,060 8,320 8,476 8,580
Light Vehicle Total 16,639 16,867 16,994 16,556 16,150 13,243 10,430 11,588 12,778 14,492 15,500 16,000 16,300 16,500
Toyota 1,866 2,060 2,260 2,543 2,621 2,223 1,770 1,764 1,645 2,083 2,290 2,442 2,540 2,649
Honda 1,350 1,394 1,462 1,509 1,552 1,429 1,151 1,230 1,147 1,423 1,540 1,634 1,733 1,813
Nissan 795 986 1,077 1,019 1,068 952 770 909 1,043 1,142 1,273 1,335 1,356 1,427
Total JPN 3 4,011 4,441 4,799 5,071 5,241 4,604 3,691 3,903 3,834 4,647 5,104 5,412 5,628 5,888
Other Japanese 796 720 672 702 721 638 535 578 635 709 790 842 859 897
Total Japanese 4,807 5,161 5,471 5,773 5,962 5,243 4,226 4,480 4,469 5,356 5,894 6,254 6,487 6,785
YoY (%)
Car -6.1% -1.4% 2.0% 1.5% -2.6% -10.4% -19.0% 4.1% 8.8% 19.1% 0.3% 3.2% 1.9% 1.2%
Light Truck 3.6% 3.7% -0.3% -5.9% -2.3% -24.7% -23.6% 18.9% 11.7% 8.0% 13.9% 3.2% 1.9% 1.2%
Light Vehicle Total -1.1% 1.4% 0.8% -2.6% -2.5% -18.0% -21.2% 11.1% 10.3% 13.4% 7.0% 3.2% 1.9% 1.2%
Toyota 6.3% 10.4% 9.7% 12.5% 3.1% -15.2% -20.4% -0.4% -6.7% 26.6% 10.0% 6.6% 4.0% 4.3%
Honda 8.2% 3.3% 4.9% 3.2% 2.8% -7.9% -19.5% 6.9% -6.8% 24.0% 8.3% 6.1% 6.0% 4.6%
Nissan 7.4% 24.1% 9.2% -5.3% 4.8% -10.9% -19.1% 18.0% 14.7% 9.5% 11.5% 4.9% 1.5% 5.3%
Total JPN 3 7.1% 10.7% 8.1% 5.7% 3.3% -12.1% -19.8% 5.7% -1.7% 21.2% 9.8% 6.0% 4.0% 4.6%
Japanese total 3.3% 7.3% 6.0% 5.5% 3.3% -12.1% -19.4% 6.0% -0.3% 19.8% 10.1% 6.1% 3.7% 4.6%
Market shares (%)
Car 45.7% 44.5% 45.1% 47.0% 46.9% 51.2% 52.7% 49.4% 48.7% 51.2% 48.0% 48.0% 48.0% 48.0%
Light Truck 54.3% 55.5% 54.9% 53.0% 53.1% 48.8% 47.3% 50.6% 51.3% 48.8% 52.0% 52.0% 52.0% 52.0%
Light Vehicle Total 100.0% 100.0% 100.0% 100.0% 100.0% 100.0% 100.0% 100.0% 100.0% 100.0% 100.0% 100.0% 100.0% 100.0%
Toyota 11.2% 12.2% 13.3% 15.4% 16.2% 16.8% 17.0% 15.2% 12.9% 14.4% 14.8% 15.3% 15.6% 16.1%
Honda 8.1% 8.3% 8.6% 9.1% 9.6% 10.8% 11.0% 10.6% 9.0% 9.8% 9.9% 10.2% 10.6% 11.0%
Nissan 4.8% 5.8% 6.3% 6.2% 6.6% 7.2% 7.4% 7.8% 8.2% 7.9% 8.2% 8.3% 8.3% 8.6%
Total JPN 3 24.1% 26.3% 28.2% 30.6% 32.5% 34.8% 35.4% 33.7% 30.0% 32.1% 32.9% 33.8% 34.5% 35.7%
Total Japanese 28.9% 30.6% 32.2% 34.9% 36.9% 39.6% 40.5% 38.7% 35.0% 37.0% 38.0% 39.1% 39.8% 41.1%
Industrials
Autos & Auto Parts
21 November 2013
page 38 of 47 , Equity Analyst, [email protected] Nakanishi
Please see important disclosure information on pages 45 - 47 of this report.

Japanese brands' share is past the worst, and they continue to make solid progress in
winning back lost ground. We think their market share will rise steadily from 38% in 2013
to 39% in 2014. It looks as though it will be 2016 at the earliest before they can top their
record-high of 40.5%. Japanese brands continue to raise their tarnished brand
propositions and product power, but rivals' competitiveness has also improved sharply,
making it hard to open up a competitive gap. Harrowing competitive pressure is
spreading.
Analysis of Japanese brands' competitiveness and profitability The Japanese OEMs' US new vehicle earnings have not improved as much as had been
expected. We think margins on models exported from Japan are rising steeply thanks to
forex, but such benefits are concentrated into firms with high export ratios (Toyota, FHI,
Mazda), as well as leading to improvements in Japan segments. Honda and Nissan have
high local production ratios, and are suffering.
Splitting up North American segmental operating profit into financial services and
automotive segments, Toyota, Honda, and Nissan are set to generate automotive
segment operating profit margins of a mere 2.4% in FY3/14. Excluding profits from high-
margin genuine parts sales, pure new vehicle profits are likely to stall at the break-even
line. We believe the fact margins on new vehicle sales remain lackluster despite the
rollover to new models and a fall in incentives is proof that (1) upfront costs have risen
sharply (= contents costs) due to enrichment to equipment and engine performance as
the companies seek to rebuild brand propositions, and (2) US consumers are still very
committed to seeking deals (= prices).
Chart 65: N. America Segment OP - Breakdown of
Automotive and financial services
Source: Company data and Jefferies estimates Note: Including Toyota, Honda and Nissan
Chart 66: N. America Segment: Mfg. Business Operating
Margin
Source: Company data and Jefferies estimates
Industrials
Autos & Auto Parts
21 November 2013
page 39 of 47 , Equity Analyst, [email protected] Nakanishi
Please see important disclosure information on pages 45 - 47 of this report.

Global sales forecasts
Chart 67: Global Vehicle Demand Projections (000 unit) 2005 A 2006 A 2007 A 2008 A 2009 A 2010 A 2011 A 2012 A 2013 E 2014 E 2015E
USA 16,948 16,505 16,090 13,195 10,402 11,555 12,734 14,492 15,500 16,000 16,300
Canada 1,580 1,612 1,651 1,634 1,459 1,555 1,582 1,677 1,761 1,849 1,942
Mexico 1,125 1,133 1,093 1,020 753 819 904 988 1,088 1,142 1,165
North America 19,653 19,250 18,833 15,849 12,613 13,928 15,221 17,157 18,349 18,992 19,407
YoY % Change 1% -2% -2% -16% -20% 10% 9% 13% 7% 4% 2%
China 5,765 7,210 8,784 9,371 13,635 18,042 18,533 19,303 21,462 23,075 24,901
Japan 5,852 5,740 5,354 5,082 4,609 4,956 4,210 5,370 5,280 5,287 5,143
India 1,440 1,751 1,993 1,980 2,264 3,039 3,293 3,333 3,446 3,628 3,973
Korea 1,143 1,164 1,219 1,154 1,394 1,465 1,570 1,533 1,533 1,533 1,533
Thailand 703 682 631 614 549 786 796 1,435 1,250 1,150 1,250
Indonesia 534 319 434 608 486 765 894 1,116 1,140 1,140 1,368
Malaysia 551 489 487 548 537 605 600 628 627 646 659
Other 1,831 1,737 1,835 1,664 1,544 1,681 1,689 1,637 1,680 1,753 1,805
Asia/Pacific 17,818 19,093 20,738 21,022 25,019 31,339 31,586 34,354 36,417 38,211 40,632
YoY % Change 5% 7% 9% 1% 19% 25% 1% 9% 6% 5% 6%
France 2,489 2,441 2,526 2,510 2,666 2,669 2,634 2,280 2,143 2,229 2,318
Germany 3,539 3,677 3,382 3,318 3,982 3,110 3,403 3,302 3,176 3,303 3,369
Italy 2,459 2,568 2,739 2,388 2,339 2,128 1,920 1,615 1,486 1,545 1,607
Spain 1,917 1,910 1,890 1,327 1,060 1,098 912 776 776 807 839
UK 2,769 2,678 2,750 2,430 2,192 2,261 2,207 2,283 2,512 2,512 2,612
Other 3,344 3,442 3,567 3,407 2,749 3,164 3,299 3,264 2,946 3,034 3,141
Western Europe 16,518 16,715 16,853 15,379 14,989 14,430 14,375 13,521 13,039 13,430 13,887
YoY % Change 0% 1% 1% -9% -3% -4% 0% -6% -4% 3% 3%
Eastern Europe 3,814 4,314 5,342 5,644 3,301 3,836 4,708 4,901 5,101 5,311 5,528
YoY % Change 7% 13% 24% 6% -42% 16% 23% 4% 4% 4% 4%
South Americal (1) 2,647 3,111 3,996 4,220 4,178 4,975 5,431 5,358 5,465 5,629 5,798
YoY % Change 16% 18% 28% 6% -1% 19% 9% -1% 2% 3% 3%
Middle East 1,035 1,203 1,297 1,372 1,544 1,762 1,766 1,052 1,087 1,102 1,135
Africa/Other 3,577 4,268 4,715 3,737 4,120 4,739 5,009 5,382 5,651 5,821 5,995
Global total 65,062 67,954 71,775 67,224 65,763 75,009 78,095 81,725 85,111 88,495 92,382
YoY % Change 4% 4% 6% -6% -2% 14% 4% 5% 4% 4% 4%
Source: JDPower, Autodata, CNW, MarkLines, KAMA, CAAM, JAMA, AIAM, GAIKINDO, Toyota Thailand, and Jefferies estimates Note: Figures for Japan, China and India are based on total vehicle base, other figures are based on light vehicle base. Those estimates are aimed at assumptions for Japanese OEMs’ earnings forecasts and may be different from Jefferies' economists and country analysts' official estimates.
Chart 67 sets out the global vehicle sales volume forecasts we use in our earnings
forecasts for the Japanese automobile sector. We assume stable growth of around 4% in
2013 through 2015, supported by steady expansion in the US and China, and bottoming
sales in Western Europe. We forecast global retail sales for the Japanese OEMs of 23.6
million units (up 7% YoY) in FY3/14, 24.71 million units (up 5% YoY) in FY3/15, and 26.35
million units (up 7% YoY) in FY3/16, outstripping market growth rates, mainly in
emerging markets, and continuing to win back global market share, which has fallen,
albeit only gently. However, sales volume is set to decline in high-margin Southeast Asia
and Japan, so it looks as though any uplift to earnings power will be meager.
Our assessment is that it is important to identify advantages at manufacturers with secular
growth stories. There are two key turning points to recognize in FY3/15: (1) performance
at Toyota and FHI has shone through FY3/14, but growth at these two is to slow to
around 2%; and (2) there will be comparatively strong momentum in growth at Honda,
Mazda, and Nissan as their new Mexican factories contribute.
Industrials
Autos & Auto Parts
21 November 2013
page 40 of 47 , Equity Analyst, [email protected] Nakanishi
Please see important disclosure information on pages 45 - 47 of this report.

Chart 68: Trend of SAAR: US
4
8
12
16
20
2008 2009 2010 2011 2012 2013
SAAR 6 month MA
(mn units)
Source: Autodata
Chart 69: Trend of SAAR: EU
4
8
12
16
20
2008 2009 2010 2011 2012 2013
SAAR 6 month MA
(mn units)
Source: ACEA
Chart 70: Trend of SAAR: Japan
2
3
4
5
6
7
8
2008 2009 2010 2011 2012 2013
SAAR 6 month MA
(mn units)
Source: JAMA
Chart 71: Trend of SAAR: China
4
8
12
16
20
24
2008 2009 2010 2011 2012 2013
SAAR 6 month MA
(mn units)
Source: Marklines
Chart 72: Trend of SAAR: India
1.0
2.0
3.0
4.0
5.0
2008 2009 2010 2011 2012 2013
SAAR 6 month MA
(mn units)
Source: Marklines
Chart 73: Trend of SAAR: ASEAN 3 (Thailand, Indonesia,
and Malaysia)
0.0
1.0
2.0
3.0
4.0
2008 2009 2010 2011 2012 2013
SAAR 6 month MA
(mn units)
Source:GAIKINDO, Toyota Motor Thailand, and Marklines
Industrials
Autos & Auto Parts
21 November 2013
page 41 of 47 , Equity Analyst, [email protected] Nakanishi
Please see important disclosure information on pages 45 - 47 of this report.
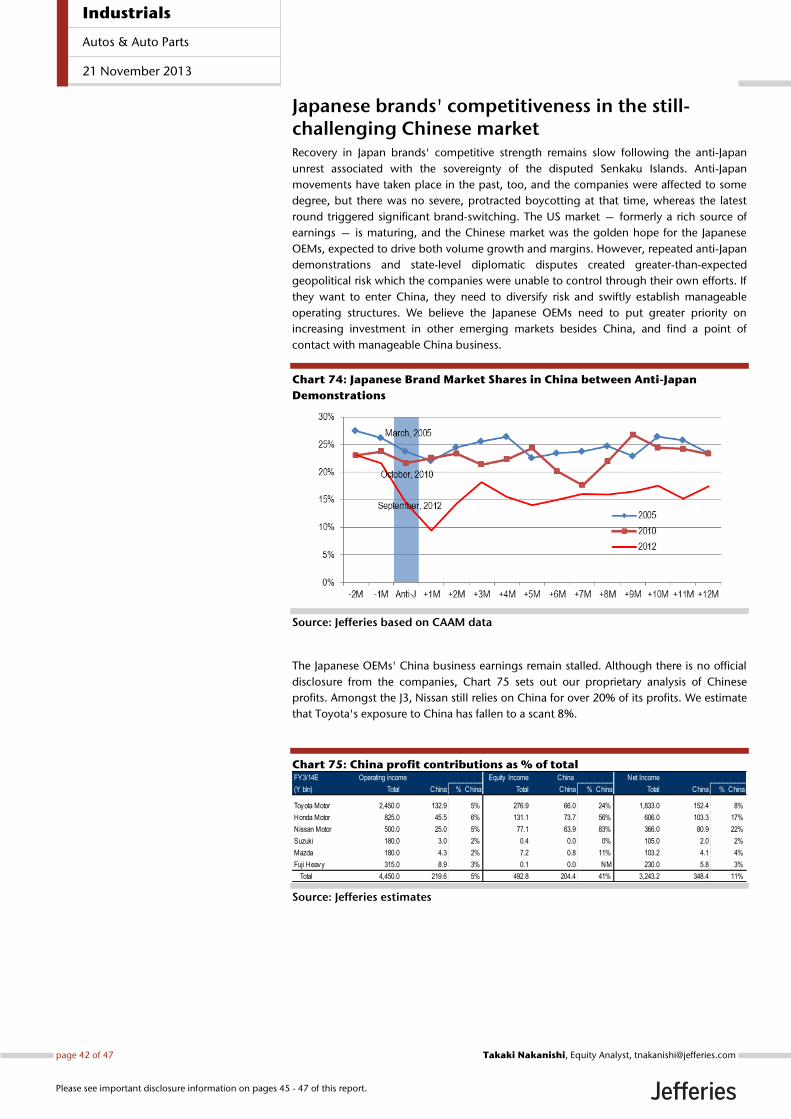
Japanese brands' competitiveness in the still-challenging Chinese market Recovery in Japan brands' competitive strength remains slow following the anti-Japan
unrest associated with the sovereignty of the disputed Senkaku Islands. Anti-Japan
movements have taken place in the past, too, and the companies were affected to some
degree, but there was no severe, protracted boycotting at that time, whereas the latest
round triggered significant brand-switching. The US market — formerly a rich source of
earnings — is maturing, and the Chinese market was the golden hope for the Japanese
OEMs, expected to drive both volume growth and margins. However, repeated anti-Japan
demonstrations and state-level diplomatic disputes created greater-than-expected
geopolitical risk which the companies were unable to control through their own efforts. If
they want to enter China, they need to diversify risk and swiftly establish manageable
operating structures. We believe the Japanese OEMs need to put greater priority on
increasing investment in other emerging markets besides China, and find a point of
contact with manageable China business.
Chart 74: Japanese Brand Market Shares in China between Anti-Japan
Demonstrations
Source: Jefferies based on CAAM data
The Japanese OEMs' China business earnings remain stalled. Although there is no official
disclosure from the companies, Chart 75 sets out our proprietary analysis of Chinese
profits. Amongst the J3, Nissan still relies on China for over 20% of its profits. We estimate
that Toyota's exposure to China has fallen to a scant 8%.
Chart 75: China profit contributions as % of total
Source: Jefferies estimates
FY3/14E Operating income Equity Income China Net Income
(Y bln) Total China % China Total China % China Total China % China
Toyota Motor 2,450.0 132.9 5% 276.9 66.0 24% 1,833.0 152.4 8%
Honda Motor 825.0 45.5 6% 131.1 73.7 56% 606.0 103.3 17%
Nissan Motor 500.0 25.0 5% 77.1 63.9 83% 366.0 80.9 22%
Suzuki 180.0 3.0 2% 0.4 0.0 0% 105.0 2.0 2%
Mazda 180.0 4.3 2% 7.2 0.8 11% 103.2 4.1 4%
Fuji Heavy 315.0 8.9 3% 0.1 0.0 NM 230.0 5.8 3%
Total 4,450.0 219.6 5% 492.8 204.4 41% 3,243.2 348.4 11%
Industrials
Autos & Auto Parts
21 November 2013
page 42 of 47 , Equity Analyst, [email protected] Nakanishi
Please see important disclosure information on pages 45 - 47 of this report.

Chart 76: Japanese Auto OEMs: Trend in Global Retail Sales
Source: Jefferies estimates, company data
000 units FY3/10A FY3/11A FY3/12A FY3/13A FY3/14E FY3/15E FY3/16E FY3/17E
Toyota Motor Domestic 1,534 1,406 1,412 1,610 1,607 1,484 1,485 1,510 US 2,081 2,053 1,870 2,351 2,618 2,744 2,853 2,975 Europe 858 812 789 795 831 851 864 898 China 768 886 900 826 929 1,022 1,103 1,214 Asia 889 1,106 1,157 1,479 1,460 1,465 1,561 1,643 Others 1,149 1,293 1,286 1,625 1,702 1,798 1,905 2,002 Global Retail Sales 7,280 7,556 7,413 8,685 9,147 9,363 9,771 10,242 YoY -2% 4% -2% 17% 5% 2% 4% 5%
Honda Motor Domestic 661 609 601 717 850 855 836 794 US 1,358 1,470 1,327 1,652 1,842 1,889 1,991 2,090 Europe 277 257 180 179 172 189 216 242 China 612 655 608 603 725 783 877 964 Asia 352 398 252 543 609 756 925 1,106 Others 229 165 152 232 252 272 291 312 Global Retail Sales 3,490 3,553 3,120 3,929 4,453 4,744 5,136 5,508 YoY -2% 2% -12% 26% 13% 7% 8% 7%
Nissan Motor Domestic 630 600 655 647 690 639 609 591 US 1,066 1,245 1,402 1,466 1,633 1,697 1,751 1,831 Europe 517 607 709 660 650 725 854 982 China 756 1,024 1,247 1,182 1,252 1,352 1,487 1,636 Asia 223 238 296 486 437 556 704 774 Others 321 471 535 474 477 539 577 619 Global Retail Sales 3,514 4,185 4,845 4,914 5,138 5,507 5,983 6,432 YoY 3% 19% 16% 1% 5% 7% 9% 8%
Suzuki Domestic 616 584 596 672 684 633 629 604 US 41 33 32 30 2 - - - Europe 281 243 223 197 195 209 223 235 China 262 290 296 254 232 255 281 303 Asia 1,016 1,335 1,254 1,334 1,399 1,556 1,769 1,900 Others 133 140 140 174 181 197 214 233 Global Retail Sales 2,349 2,625 2,541 2,661 2,693 2,851 3,116 3,275 YoY 2% 12% -3% 5% 1% 6% 9% 5%
Mazda Domestic 221 206 206 216 228 211 209 203 US 307 342 371 373 418 444 471 484 Europe 239 212 183 174 193 206 223 242 China 196 236 223 175 184 208 229 256 Asia - - - - - - - - Others 230 277 263 297 293 313 334 375 Global Retail Sales 1,193 1,273 1,246 1,236 1,316 1,381 1,466 1,560 YoY -6% 7% -2% -1% 6% 5% 6% 6%
Fuji Heavy Industries Domestic 178 165 178 169 195 188 174 177 US 257 297 307 385 473 501 515 553 Europe 47 60 52 61 52 54 59 62 China 49 57 56 43 44 53 58 64 Asia - - - - - - - - Others 66 72 53 60 89 77 80 82 Global Retail Sales 597 651 646 719 853 872 885 938 YoY 5% 9% -1% 11% 19% 2% 1% 6%
Major Japanese OEMs Total Domestic 3,840 3,570 3,647 4,031 4,253 4,010 3,942 3,880 US 5,111 5,440 5,309 6,257 6,986 7,273 7,582 7,933 Europe 2,220 2,191 2,136 2,066 2,094 2,234 2,439 2,662 China 2,642 3,148 3,330 3,083 3,365 3,672 4,034 4,437 Asia 2,480 3,077 2,959 3,842 3,905 4,333 4,959 5,423 Others 2,129 2,417 2,429 2,865 2,997 3,197 3,402 3,622 Global Retail Sales 18,423 19,842 19,810 22,143 23,600 24,718 26,358 27,956 YoY 0% 8% 0% 12% 7% 5% 7% 6%
Industrials
Autos & Auto Parts
21 November 2013
page 43 of 47 , Equity Analyst, [email protected] Nakanishi
Please see important disclosure information on pages 45 - 47 of this report.

Chart 77: Japanese Auto OEMs: Trend in Global Production Units
Source: Jefferies estimates, company data
000 units FY3/10A FY3/11A FY3/12A FY3/13A FY3/14E FY3/15E FY3/16E FY3/17E
Toyota Motor Domestic 3,207 3,004 3,120 3,369 3,362 3,254 3,175 3,145 US 1,446 1,428 1,352 1,776 1,905 2,025 2,146 2,225 Europe 546 448 472 439 493 470 560 590 China 722 759 821 713 902 1,022 1,103 1,229 Asia 1,027 1,309 1,364 1,822 1,820 1,945 2,105 2,265 Others 331 352 400 445 542 615 625 700 Global Production 7,279 7,301 7,529 8,564 9,024 9,330 9,714 10,154 YoY 2% 0% 3% 14% 5% 3% 4% 5%
Honda Motor Domestic 902 912 870 173 148 160 160 160 US 1,151 1,244 1,235 1,155 1,443 1,571 1,885 2,069 Europe 99 139 105 598 803 823 917 1,004 China 653 697 636 76 91 150 200 220 Asia 340 397 199 234 210 140 180 200 Others 159 148 76 1,810 1,757 1,947 1,824 1,841 Global Production 3,304 3,537 3,121 4,046 4,452 4,791 5,166 5,495 YoY -8% 7% -12% 30% 10% 8% 8% 6%
Nissan Motor Domestic 1,025 1,073 1,199 1,060 1,066 975 930 929 US 837 1,073 1,221 1,344 1,448 1,574 1,635 1,635 Europe 445 571 647 643 668 705 795 875 China 547 714 858 794 924 1,053 1,173 1,290 Asia 152 353 409 535 480 641 671 881 Others 277 366 462 460 405 439 554 606 Global Production 3,282 4,150 4,797 4,836 4,991 5,386 5,758 6,215 YoY 8% 26% 16% 1% 3% 8% 7% 8%
Suzuki Domestic 959 994 1,020 1,044 979 913 929 882 US - - - - - - - - Europe 180 164 174 151 164 180 180 180 China 272 292 289 252 222 255 281 303 Asia 1,134 1,427 1,319 1,430 1,481 1,678 1,930 2,094 Others (0) - (1) - - - - - Global Production 2,545 2,877 2,802 2,877 2,845 3,026 3,319 3,459 YoY 2% 13% -3% 3% -1% 6% 10% 4%
Mazda Domestic 828 864 847 879 954 944 919 944 US 39 45 18 19 - 125 240 240 Europe - - - - - - - - China 196 236 235 154 192 208 229 256 Asia 40 89 76 110 91 90 100 120 Others 39 45 - 42 16 - - - Global Production 1,142 1,279 1,175 1,205 1,253 1,366 1,488 1,560 YoY 1% 12% -8% 3% 4% 9% 9% 5%
Fuji Heavy Industries Domestic 453 459 468 505 592 626 613 588 US 99 159 171 184 164 193 213 315 Europe - - - - - - - - China - - - - - - - - Asia - - - - - - - - Others (0) - - - - - - - Global Production 552 618 639 689 756 819 826 903 YoY 0% 12% 3% 8% 10% 8% 1% 9%
Major Japanese OEMs Total Domestic 7,373 7,306 7,524 7,030 7,100 6,872 6,726 6,649 US 3,572 3,950 3,996 4,479 4,960 5,487 6,118 6,484 Europe 1,270 1,322 1,398 1,831 2,128 2,178 2,452 2,649 China 2,389 2,698 2,840 1,989 2,331 2,687 2,986 3,298 Asia 2,692 3,575 3,366 4,131 4,082 4,494 4,985 5,559 Others 806 910 938 2,757 2,720 3,002 3,004 3,147 Global Production 18,104 19,762 20,063 22,217 23,321 24,719 26,270 27,787 YoY 1% 9% 2% 11% 5% 6% 6% 6%
Industrials
Autos & Auto Parts
21 November 2013
page 44 of 47 , Equity Analyst, [email protected] Nakanishi
Please see important disclosure information on pages 45 - 47 of this report.

Analyst CertificationI, Takaki Nakanishi, certify that all of the views expressed in this research report accurately reflect my personal views about the subject security(ies) andsubject company(ies). I also certify that no part of my compensation was, is, or will be, directly or indirectly, related to the specific recommendationsor views expressed in this research report.Registration of non-US analysts: Takaki Nakanishi is employed by Jefferies (Japan) Limited, a non-US affiliate of Jefferies LLC and is not registered/qualified as a research analyst with FINRA. This analyst(s) may not be an associated person of Jefferies LLC, a FINRA member firm, and therefore maynot be subject to the NASD Rule 2711 and Incorporated NYSE Rule 472 restrictions on communications with a subject company, public appearancesand trading securities held by a research analyst.
As is the case with all Jefferies employees, the analyst(s) responsible for the coverage of the financial instruments discussed in this report receivescompensation based in part on the overall performance of the firm, including investment banking income. We seek to update our research asappropriate, but various regulations may prevent us from doing so. Aside from certain industry reports published on a periodic basis, the large majorityof reports are published at irregular intervals as appropriate in the analyst's judgement.
For Important Disclosure information on companies recommended in this report, please visit our website at https://javatar.bluematrix.com/sellside/Disclosures.action or call 212.284.2300.
Meanings of Jefferies RatingsBuy - Describes stocks that we expect to provide a total return (price appreciation plus yield) of 15% or more within a 12-month period.Hold - Describes stocks that we expect to provide a total return (price appreciation plus yield) of plus 15% or minus 10% within a 12-month period.Underperform - Describes stocks that we expect to provide a total negative return (price appreciation plus yield) of 10% or more within a 12-monthperiod.The expected total return (price appreciation plus yield) for Buy rated stocks with an average stock price consistently below $10 is 20% or more withina 12-month period as these companies are typically more volatile than the overall stock market. For Hold rated stocks with an average stock priceconsistently below $10, the expected total return (price appreciation plus yield) is plus or minus 20% within a 12-month period. For Underperformrated stocks with an average stock price consistently below $10, the expected total return (price appreciation plus yield) is minus 20% within a 12-month period.NR - The investment rating and price target have been temporarily suspended. Such suspensions are in compliance with applicable regulations and/or Jefferies policies.CS - Coverage Suspended. Jefferies has suspended coverage of this company.NC - Not covered. Jefferies does not cover this company.Restricted - Describes issuers where, in conjunction with Jefferies engagement in certain transactions, company policy or applicable securitiesregulations prohibit certain types of communications, including investment recommendations.Monitor - Describes stocks whose company fundamentals and financials are being monitored, and for which no financial projections or opinions onthe investment merits of the company are provided.
Valuation MethodologyJefferies' methodology for assigning ratings may include the following: market capitalization, maturity, growth/value, volatility and expected totalreturn over the next 12 months. The price targets are based on several methodologies, which may include, but are not restricted to, analyses of marketrisk, growth rate, revenue stream, discounted cash flow (DCF), EBITDA, EPS, cash flow (CF), free cash flow (FCF), EV/EBITDA, P/E, PE/growth, P/CF,P/FCF, premium (discount)/average group EV/EBITDA, premium (discount)/average group P/E, sum of the parts, net asset value, dividend returns,and return on equity (ROE) over the next 12 months.
Conviction List Methodology
1. The aim of the conviction list is to publicise the best individual stock ideas from Jefferies Global Research2. Only stocks with a Buy or Underperform rating are allowed to be included in the recommended list.3. Stocks are screened for minimum market capitalisation and adequate daily turnover. Furthermore, a valuation, correlation and style screen
is used to ensure a well-diversified portfolio.4. Stocks are sorted to a maximum of 30 stocks with the maximum country exposure at around 50%. Limits are also imposed on a sector basis.5. Once a month, analysts are invited to recommend their best ideas. Analysts’ stock selection can be based on one or more of the following:
non-Consensus investment view, difference in earnings relative to Consensus, valuation methodology, target upside/downside % relativeto the current stock price. These are then assessed against existing holdings to ensure consistency. Stocks that have either reached theirtarget price, been downgraded over the course of the month or where a more suitable candidate has been found are removed.
6. All stocks are inserted at the last closing price and removed at the last closing price. There are no changes to the conviction list duringthe month.
7. Performance is calculated in US dollars on an equally weighted basis and is compared to MSCI World AC US$.8. The conviction list is published once a month whilst global equity markets are closed.9. Transaction fees are not included.
10. All corporate actions are taken into account.
Risk which may impede the achievement of our Price TargetThis report was prepared for general circulation and does not provide investment recommendations specific to individual investors. As such, thefinancial instruments discussed in this report may not be suitable for all investors and investors must make their own investment decisions basedupon their specific investment objectives and financial situation utilizing their own financial advisors as they deem necessary. Past performance of
Industrials
Autos & Auto Parts
21 November 2013
page 45 of 47 , Equity Analyst, [email protected] Nakanishi
Please see important disclosure information on pages 45 - 47 of this report.
the financial instruments recommended in this report should not be taken as an indication or guarantee of future results. The price, value of, andincome from, any of the financial instruments mentioned in this report can rise as well as fall and may be affected by changes in economic, financialand political factors. If a financial instrument is denominated in a currency other than the investor's home currency, a change in exchange rates mayadversely affect the price of, value of, or income derived from the financial instrument described in this report. In addition, investors in securities suchas ADRs, whose values are affected by the currency of the underlying security, effectively assume currency risk.
Other Companies Mentioned in This Report• Daihatsu Motor (7262 JP: ¥1,824, HOLD)• Ford Motor Co. (F: $16.92, BUY)• Fuji Heavy Industries (7270 JP: ¥2,790, HOLD)• General Motors Company (GM: $37.69, HOLD)• Honda Motor (7267 JP: ¥4,100, BUY)• Mazda Motor (7261 JP: ¥450, BUY)• Nissan Motor (7201 JP: ¥923, HOLD)• Suzuki Motor (7269 JP: ¥2,477, HOLD)• Toyota Motor (7203 JP: ¥6,290, HOLD)• Yamaha Motor (7272 JP: ¥1,534, HOLD)
Distribution of RatingsIB Serv./Past 12 Mos.
Rating Count Percent Count Percent
BUY 829 47.78% 186 22.44%HOLD 763 43.98% 121 15.86%UNDERPERFORM 143 8.24% 1 0.70%
Other Important Disclosures
Jefferies Equity Research refers to research reports produced by analysts employed by one of the following Jefferies Group LLC (“Jefferies”) groupcompanies:
United States: Jefferies LLC which is an SEC registered firm and a member of FINRA.
United Kingdom: Jefferies International Limited, which is authorized and regulated by the Financial Conduct Authority; registered in England andWales No. 1978621; registered office: Vintners Place, 68 Upper Thames Street, London EC4V 3BJ; telephone +44 (0)20 7029 8000; facsimile +44 (0)207029 8010.
Hong Kong: Jefferies Hong Kong Limited, which is licensed by the Securities and Futures Commission of Hong Kong with CE number ATS546; locatedat Suite 2201, 22nd Floor, Cheung Kong Center, 2 Queen’s Road Central, Hong Kong.
Singapore: Jefferies Singapore Limited, which is licensed by the Monetary Authority of Singapore; located at 80 Raffles Place #15-20, UOB Plaza 2,Singapore 048624, telephone: +65 6551 3950.
Japan: Jefferies (Japan) Limited, Tokyo Branch, which is a securities company registered by the Financial Services Agency of Japan and is a memberof the Japan Securities Dealers Association; located at Hibiya Marine Bldg, 3F, 1-5-1 Yuraku-cho, Chiyoda-ku, Tokyo 100-0006; telephone +813 52516100; facsimile +813 5251 6101.
India: Jefferies India Private Limited, which is licensed by the Securities and Exchange Board of India as a Merchant Banker (INM000011443) and aStock Broker with Bombay Stock Exchange Limited (INB011491033) and National Stock Exchange of India Limited (INB231491037) in the Capital MarketSegment; located at 42/43, 2 North Avenue, Maker Maxity, Bandra-Kurla Complex, Bandra (East) Mumbai 400 051, India; Tel +91 22 4356 6000.
This material has been prepared by Jefferies employing appropriate expertise, and in the belief that it is fair and not misleading. The information setforth herein was obtained from sources believed to be reliable, but has not been independently verified by Jefferies. Therefore, except for any obligationunder applicable rules we do not guarantee its accuracy. Additional and supporting information is available upon request. Unless prohibited by theprovisions of Regulation S of the U.S. Securities Act of 1933, this material is distributed in the United States ("US"), by Jefferies LLC, a US-registeredbroker-dealer, which accepts responsibility for its contents in accordance with the provisions of Rule 15a-6, under the US Securities Exchange Act of1934. Transactions by or on behalf of any US person may only be effected through Jefferies LLC. In the United Kingdom and European EconomicArea this report is issued and/or approved for distribution by Jefferies International Limited and is intended for use only by persons who have, or havebeen assessed as having, suitable professional experience and expertise, or by persons to whom it can be otherwise lawfully distributed. JefferiesInternational Limited has adopted a conflicts management policy in connection with the preparation and publication of research, the details of whichare available upon request in writing to the Compliance Officer. Jefferies International Limited may allow its analysts to undertake private consultancywork. Jefferies International Limited’s conflicts management policy sets out the arrangements Jefferies International Limited employs to manage anypotential conflicts of interest that may arise as a result of such consultancy work. For Canadian investors, this material is intended for use only byprofessional or institutional investors. None of the investments or investment services mentioned or described herein is available to other personsor to anyone in Canada who is not a "Designated Institution" as defined by the Securities Act (Ontario). In Singapore, Jefferies Singapore Limited isregulated by the Monetary Authority of Singapore. For investors in the Republic of Singapore, this material is provided by Jefferies Singapore Limitedpursuant to Regulation 32C of the Financial Advisers Regulations. The material contained in this document is intended solely for accredited, expert orinstitutional investors, as defined under the Securities and Futures Act (Cap. 289 of Singapore). If there are any matters arising from, or in connectionwith this material, please contact Jefferies Singapore Limited, located at 80 Raffles Place #15-20, UOB Plaza 2, Singapore 048624, telephone: +656551 3950. In Japan this material is issued and distributed by Jefferies (Japan) Limited to institutional investors only. In Hong Kong, this report isissued and approved by Jefferies Hong Kong Limited and is intended for use only by professional investors as defined in the Hong Kong Securities andFutures Ordinance and its subsidiary legislation. In the Republic of China (Taiwan), this report should not be distributed. The research in relation to
Industrials
Autos & Auto Parts
21 November 2013
page 46 of 47 , Equity Analyst, [email protected] Nakanishi
Please see important disclosure information on pages 45 - 47 of this report.

this report is conducted outside the PRC. This report does not constitute an offer to sell or the solicitation of an offer to buy any securities in the PRC.PRC investors shall have the relevant qualifications to invest in such securities and shall be responsible for obtaining all relevant approvals, licenses,verifications and/or registrations from the relevant governmental authorities themselves. In India this report is made available by Jefferies India PrivateLimited. In Australia this information is issued solely by Jefferies International Limited and is directed solely at wholesale clients within the meaning ofthe Corporations Act 2001 of Australia (the "Act") in connection with their consideration of any investment or investment service that is the subject ofthis document. Any offer or issue that is the subject of this document does not require, and this document is not, a disclosure document or productdisclosure statement within the meaning of the Act. Jefferies International Limited is authorised and regulated by the Financial Conduct Authorityunder the laws of the United Kingdom, which differ from Australian laws. Jefferies International Limited has obtained relief under Australian Securitiesand Investments Commission Class Order 03/1099, which conditionally exempts it from holding an Australian financial services licence under theAct in respect of the provision of certain financial services to wholesale clients. Recipients of this document in any other jurisdictions should informthemselves about and observe any applicable legal requirements in relation to the receipt of this document.
This report is not an offer or solicitation of an offer to buy or sell any security or derivative instrument, or to make any investment. Any opinion orestimate constitutes the preparer's best judgment as of the date of preparation, and is subject to change without notice. Jefferies assumes no obligationto maintain or update this report based on subsequent information and events. Jefferies, its associates or affiliates, and its respective officers, directors,and employees may have long or short positions in, or may buy or sell any of the securities, derivative instruments or other investments mentioned ordescribed herein, either as agent or as principal for their own account. Upon request Jefferies may provide specialized research products or servicesto certain customers focusing on the prospects for individual covered stocks as compared to other covered stocks over varying time horizons orunder differing market conditions. While the views expressed in these situations may not always be directionally consistent with the long-term viewsexpressed in the analyst's published research, the analyst has a reasonable basis and any inconsistencies can be reasonably explained. This materialdoes not constitute a personal recommendation or take into account the particular investment objectives, financial situations, or needs of individualclients. Clients should consider whether any advice or recommendation in this report is suitable for their particular circumstances and, if appropriate,seek professional advice, including tax advice. The price and value of the investments referred to herein and the income from them may fluctuate. Pastperformance is not a guide to future performance, future returns are not guaranteed, and a loss of original capital may occur. Fluctuations in exchangerates could have adverse effects on the value or price of, or income derived from, certain investments. This report has been prepared independently ofany issuer of securities mentioned herein and not in connection with any proposed offering of securities or as agent of any issuer of securities. Noneof Jefferies, any of its affiliates or its research analysts has any authority whatsoever to make any representations or warranty on behalf of the issuer(s).Jefferies policy prohibits research personnel from disclosing a recommendation, investment rating, or investment thesis for review by an issuer priorto the publication of a research report containing such rating, recommendation or investment thesis. Any comments or statements made herein arethose of the author(s) and may differ from the views of Jefferies.
This report may contain information obtained from third parties, including ratings from credit ratings agencies such as Standard & Poor’s. Reproductionand distribution of third party content in any form is prohibited except with the prior written permission of the related third party. Third party contentproviders do not guarantee the accuracy, completeness, timeliness or availability of any information, including ratings, and are not responsible forany errors or omissions (negligent or otherwise), regardless of the cause, or for the results obtained from the use of such content. Third party contentproviders give no express or implied warranties, including, but not limited to, any warranties of merchantability or fitness for a particular purpose oruse. Third party content providers shall not be liable for any direct, indirect, incidental, exemplary, compensatory, punitive, special or consequentialdamages, costs, expenses, legal fees, or losses (including lost income or profits and opportunity costs) in connection with any use of their content,including ratings. Credit ratings are statements of opinions and are not statements of fact or recommendations to purchase, hold or sell securities. Theydo not address the suitability of securities or the suitability of securities for investment purposes, and should not be relied on as investment advice.
Jefferies research reports are disseminated and available primarily electronically, and, in some cases, in printed form. Electronic research issimultaneously available to all clients. This report or any portion hereof may not be reprinted, sold or redistributed without the written consent ofJefferies. Neither Jefferies nor any officer nor employee of Jefferies accepts any liability whatsoever for any direct, indirect or consequential damagesor losses arising from any use of this report or its contents.
For Important Disclosure information, please visit our website at https://javatar.bluematrix.com/sellside/Disclosures.action or call 1.888.JEFFERIES
© 2013 Jefferies Group LLC
Industrials
Autos & Auto Parts
21 November 2013
page 47 of 47 , Equity Analyst, [email protected] Nakanishi
Please see important disclosure information on pages 45 - 47 of this report.