meta-review of long-term energy & carbon prices
TRANSCRIPT

ESCOConsulting SoftwareEngineering
Meta-review of long-term energy & carbon prices
ECI - Creara Workshop / 2017
2
• Introduction: Objective and Methodology
• Energy Vectors: Price Forecasts
• Summary
• Discussion
• Annex
Agenda

3
INTRODUCTION
Objective and Methodology of the Study
• The objective of this Study is to perform a meta study on future energy and carbon costs, by
reviewing existing scenarios of the energy transition
- Coal, oil, gas, electricity, and carbon future prices are included (throughout this study referred to as
“energy vectors”)
- Facts and trends impacting future prices are identified, but not analyzed
- EU countries with available information and in different stages of the energy transition are included
• The methodology includes 3 main steps:
Source: RFQ; CREARA Analysis
1 2 3REVISION of views
Near 100% RES
Enerdata
Other sources
Coal Oil Gas Electricity Carbon
“horizontal analysis” “vertical analysis”
EXTRACTION of views for each energy vector TAKEAWAYS
• FUTURE PRICES
• TRENDS, e.g.:Supply
Demand

4
Author Title (year) Coal Oil Gas Electricity Carbon
1 Ecofys / WWF The Energy Report (2011)
2European
CommissionEnergy Roadmap 2050 (2012)
3DNV GL / Imperial
College / NERA
Integration of Renewable Energy in Europe
(2014)
4 Eurelectric Power Choices (2013)
5European Climate
FoundationRoadmap 2050 (2010)
6 McKinseyTransformation of Europe's power system
(2010)
7 EWI / Energynautics Roadmap 2050 (2011)
8 Greenpeace Energy [R]evolution (2012)
9 Greenpeace Powe[r] 2030 (2014)
10 Energynautics European Grid Study 2030/2050 (2011)
11 Fraunhofer ISITangible ways towards climate protection in
the European Union (2011)
12 Jacobson, M. et al.A roadmap for repowering California for all
purposes with wind, water, and sunlight (2014)
13 Jacobson, M. et al.Examining the feasibility of converting New
York State’s all-purpose energy… (2013)
✓ ✓ ✓ ✓
✓✓ ✓✓ ✓
✓ ✓ ✓ ✓ ✓
✓ ✓ ✓ ✓ ✓
✓ ✓ ✓
✓ ✓
✓ ✓ ✓ ✓
✓ ✓ ✓ ✓
✓ ✓ ✓✓
✓
✓ ✓ ✓ ✓
✓
✓ ✓
Main documents reviewed with relevant data for the meta study
Σ=10 Σ=10 Σ=11 Σ=6 Σ=7Note: (x) indicates other document on which values are based
Source: CREARA Analysis
INTRODUCTION1 2 3
(8)
(2)
(2)
(5)
(8)
(2)
(8) (8)
5
INTRODUCTION
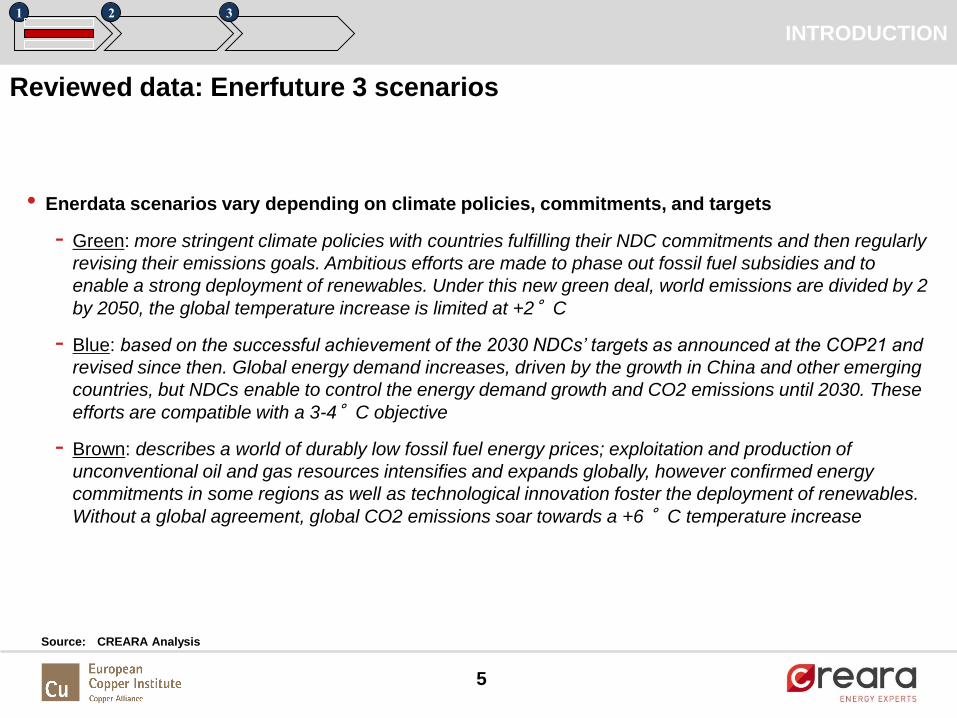
Reviewed data: Enerfuture 3 scenarios
Source: CREARA Analysis
• Enerdata scenarios vary depending on climate policies, commitments, and targets
- Green: more stringent climate policies with countries fulfilling their NDC commitments and then regularly
revising their emissions goals. Ambitious efforts are made to phase out fossil fuel subsidies and to
enable a strong deployment of renewables. Under this new green deal, world emissions are divided by 2
by 2050, the global temperature increase is limited at +2°C
- Blue: based on the successful achievement of the 2030 NDCs’ targets as announced at the COP21 and
revised since then. Global energy demand increases, driven by the growth in China and other emerging
countries, but NDCs enable to control the energy demand growth and CO2 emissions until 2030. These
efforts are compatible with a 3-4°C objective
- Brown: describes a world of durably low fossil fuel energy prices; exploitation and production of
unconventional oil and gas resources intensifies and expands globally, however confirmed energy
commitments in some regions as well as technological innovation foster the deployment of renewables.
Without a global agreement, global CO2 emissions soar towards a +6 °C temperature increase
1 2 3

6
• Introduction: Objective and Methodology
• Energy Vectors: Price Forecasts
• Summary
• Discussion
• Annex
Agenda
7
FUTURE PRICES
Source: Reviewed documents; CREARA Analysis
Coal prices are expected to follow the trend of oil and the rest of fossil
fuels but remaining at a much lower level
• Overall, there is no upturn forecasted for global coal demand, with lower demand in higher income countries and higher demand
elsewhere
• On the one hand, efforts towards a strong reduction of greenhouse gas emissions will take place, which has a negative impact
on the demand for fossil fuels (Fraunhofer, 2011)
- The decarbonization scenarios are based on "global climate action" price trajectories for oil, gas and coal reflecting that global
action on decarbonization will reduce fossil fuel demand worldwide and will therefore have a downward effect on fossil fuel prices
(DNV GL / Imperial College / NERA, 2014)
- The EU will make large strides in displacing coal with lower carbon alternatives (coal demand in the EU falls by over 60% towards
2040 according to WEO 2016)
• On the other hand, the increase in coal price in the medium-term is driven by high demand in emerging countries (Eurelectric,
2009, WEO 2016)
- Import demand in Asia, especially in China and India, is projected to rise in the future which will support firm trade market prices.
However, it is unlikely that prices rise strongly, as coal production costs are relatively low compared to production costs of other
fossil fuels and the amount of reserves will be sufficient to meet the increasing demand (Energynautics, 2011)
• The search for market equilibrium depends on cuts to supply capacity, mainly in China and the United States (WEO 2016)
- China is administering a number of measures to cut mining capacity, a move that has already pushed coal prices higher in 2016
(after four straight years of decline)
• Most of the studies (e.g. Eurelectric) expect coal prices to increase at far lower rates than gas prices. A slight decoupling can be
observed in most of the scenario studies.
- Alongside measures to increase coal-plant efficiency and reduce pollutant emissions, the long-term future of coal is increasingly
tied to the commercial availability of carbon capture and storage, as only abated coal use is compatible with deep decarbonisation
1 2 3
Coal

8
FUTURE PRICES
Source: EC; Ecofys; Energynautics; Eurelectric; Enerdata; Greenpeace; IEA; CREARA Analysis
CAGR
(2020-2050)
Enerdata UK3, Blue, Ind.
(EUR 2005)
3.94%2
Enerdata UK, Brown, Ind.
(EUR 2005)
1.80%2
Energynautics (EUR 2010) 0.29%
Greenpeace [R]evolution
(EUR 2009)
0.53%
EC - Roadmap 2050
Current Policy Initiatives
(EUR 2008)
0.53%
Eurelectric (EUR 2008) 0.40%
EC - Roadmap 2050
Decarbonization
Scenarios (EUR 2008)
-0.52%
Ecofys (EUR 2005) 0.96%
IEA – 450 Scenario -0.64%2
Most scenarios expect coal prices will remain virtually flat, with yearly
price increases that are lower than those of other fossil fuels
Note: 1Except for Enerdata scenarios, which are final user prices; 2CAGR is calculated for 2020-2040; 3UK was chosen because it better
reflects wholesale prices; Green Scenario has not been plotted since it is considered an outlier within the sample’s projections
1 2 3
Coal
0
50
100
150
200
250
300
2020 2025 2030 2035 2040 2045 2050
EU
R /
to
n o
f co
al
Coal prices in different scenarios, 2020-2050

9
• There is consensus in that oil will become scarcer in the future
- IEA assumes production from known oil and gas reserves will fall by around 40-60 per cent by 2030, and there is significant
uncertainty about the volume of undiscovered conventional oil reserves
- Supplies of cheap, conventional oil and gas are declining while our energy demands continue to increase
- Technological improvements may play a role: technology improvements may delay the price increases that would result from
the eventual depletion of coal, oil, natural gas, and uranium resources
• However, the reviewed scenarios assume efforts will be made to decrease GHG emissions (increasing energy efficiency in
energy demand combined with de-carbonisation of the energy system), which has a negative impact on oil demand
• This will create a “paradigm shift in demand”, where oil will be increasingly replaced by other technologies, leading to
relatively oversupply
- The Roadmap to 2050 (…) aims to introduce profound changes in passenger and freight transport patterns, resulting in a
competitive transport sector which allows increased mobility and cuts CO2 emissions
- Oil and gas will be replaced by efficient electric technologies (road transport and household heating). Electricity-powered air-
and ground-source heat pumps, heat exchangers, and back up electric resistance heaters will replace natural gas and oil for
home heating and air conditioning. As such, electricity requirements will increase, but the use of oil and gas for transportation
and heating/cooling will decrease
- In WEO 2016, over the longer term, oil demand concentrates in freight, aviation and petrochemicals, areas where alternatives
are scarce, while oil supply – despite a strong outlook for US tight oil – increasingly concentrates in the Middle East. There are
few substitutes for oil products as a fuel for trucks and planes and as a feedstock for the chemicals industry; these three
sectors account for all of the growth in global oil consumption
• Other trends that will affect future prices include economic growth (GDP) and technological improvements (for instance for
shale gas extraction)
1 2 3
Oil
Oil prices will be affected by limited supply and a decreasing demand
Source: Reviewed documents; CREARA Analysis
FUTURE PRICES

10
1 2 3
Oil
Most scenarios project a moderate growth of oil real prices from 2020 to
2050, except for particular extreme cases (Enerdata green scenario)
Note: 1 Enerdata prices are heavy fuel oil for industries and include taxes; max is Sweden in the green scenario and min UK in brown scenario
Source: Documents as indicated; CREARA Analysis
CAGR 20-50
0
50
100
150
200
250
300
350
400
450
2020 2030 2040 2050
Enerdata max1 (EUR05/boe)
EWI/Energynautics (EUR10/boe)
Jacobson (EUR09/boe)
Greenpeace (EUR10/bbl)
EU Commission (EUR08/bbl)
ECOFYS (EUR05/boe)
EU Climate foundation (EUR/bbl)
Enerdata min1 (EUR05/boe)
Fraunhofer ISI (EUR05/boe)
6.1%
0.5%
n.a.
1.0%
1.2%
2.3%
0.0%
3.1%
-1.6%
FUTURE PRICES
Oil Prices in different scenarios 2020-20501

11
• Most projections forecast a more flexible global market, linked by a doubling of trade in liquefied natural gas (LNG)
- It is expected that an effective gas market will develop using the existing global distribution network for liquid gas via tankers
and loading terminals. With greater competitiveness regards price fixing, it is expected that the oil and gas prices will no
longer be linked. Having more liquid gas in the energy mix (currently around 10 % of overall gas consumption) significantly
increases supply security, e.g. reducing the risks of supply interruptions associated with international pipeline networks.
(Greenpeace Energy [R]evolution, 2012)
• Gas consumption increases almost everywhere, but gas exporters have to work hard to control costs in the face of strong
competition from other fuels, especially in the power sector (WEO 2016)
- In the mid-2020s, in gas-importing countries in Asia, new gas plants would be a cheaper option than new coal plants for
baseload generation only if coal prices were $150/tonne (double the anticipated 2025 price)
- The space for gasfired generation is also squeezed by the rising deployment and falling costs of renewables
- The higher oil prices result in substitution of oil for gas in markets where the two fuels compete. The reduction in oil
discoveries also implies a reduction in future reserves of associated gas. On the other hand gas price increases are
moderated by an increasing share of unconventional gas from shales, as technology improves and the interest in its potential
spreads beyond North America. (European Commission, 2010)
• Future rise in discoveries of natural gas reserves will moderate the increase of natural gas prices
- It is assumed that 130 trillion cubic meters of gas will be discovered to 2050, compared to 170 trillion cubic meters of gas
reserves known today. This volume of gas includes tight gas and coal-bed gas exploited today or expected to be exploited in
North America but not unconventional gas, such as hydrates. (Eurelectric, 2011)
• The reviewed studies forecast an increment in natural gas power plants as a backup technology due to the increased
amount of RES in the system
Natural gas demand is projected to increase, but price increases will be
moderated by abundant global supply
Source: Reviewed documents; CREARA Analysis
1 2 3
Gas FUTURE PRICES
12
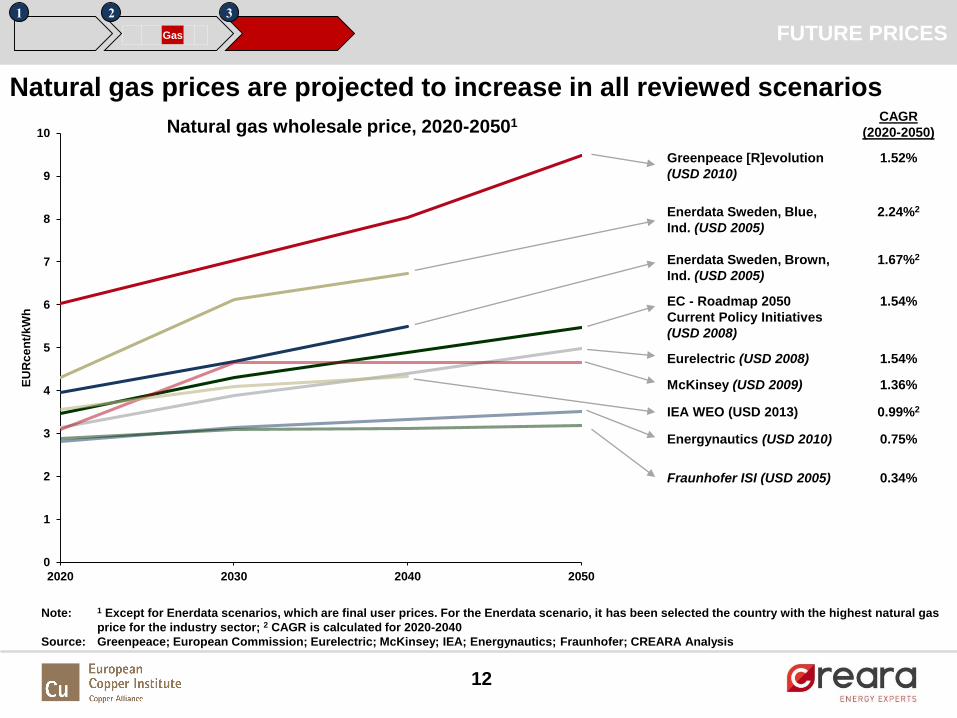
Natural gas wholesale price, 2020-20501
1 2 3
Gas
Natural gas prices are projected to increase in all reviewed scenarios
Note: 1 Except for Enerdata scenarios, which are final user prices. For the Enerdata scenario, it has been selected the country with the highest natural gas
price for the industry sector; 2 CAGR is calculated for 2020-2040
Source: Greenpeace; European Commission; Eurelectric; McKinsey; IEA; Energynautics; Fraunhofer; CREARA Analysis
CAGR
(2020-2050)
Greenpeace [R]evolution
(USD 2010)
1.52%
Enerdata Sweden, Blue,
Ind. (USD 2005)
2.24%2
Enerdata Sweden, Brown,
Ind. (USD 2005)
1.67%2
EC - Roadmap 2050
Current Policy Initiatives
(USD 2008)
1.54%
Eurelectric (USD 2008) 1.54%
McKinsey (USD 2009) 1.36%
IEA WEO (USD 2013) 0.99%2
Energynautics (USD 2010) 0.75%
Fraunhofer ISI (USD 2005) 0.34%
FUTURE PRICES
0
1
2
3
4
5
6
7
8
9
10
2020 2030 2040 2050
EU
Rc
en
t/k
Wh

13
• Most scenarios estimate that average electricity prices will rise and that demand for electricity will increase with a
considerable shift towards RES with a strong increase in wind
• Increasing RES penetration will lead to renewables-based generation being competitive without any subsidies.
- The rapid deployment of technologies with low short-run costs, such as most renewables, increases the likelihood of
sustained periods of very low wholesale electricity prices
• End user prices are projected to increase in the shorter term (until 2025-2030), driven by the 3 main trends (European
Commission, 2010)
- The increase in world fossil fuel prices (which is projected to take place during the period of recovery of world economic
growth)
- The carbon price within the ETS
- The additional costs of power generation induced by carbon emission reductions and RES policies
• With declining costs and an anticipated rise in end-user electricity prices, by the 2030s global subsidies to renewables are
on a declining trend (WEO 2016)
• In the longer term, it is expected that electricity prices will stabilize
- Beyond 2025, electricity prices are projected to remain rather stable, as fossil fuel prices increase at a slower pace and
technology performance in power generation succeeds in offsetting the fuel price effects (Eurelectric, 2011)
- The techno-economic improvements of various power generation technologies that limit the effects of higher input fuel prices
and CO2 prices (European Commission, 2010)
Industrial electricity prices are projected to increase in the short term and
then stabilize towards 2050
Source: Reviewed documents; CREARA Analysis
1 2 3
Elec FUTURE PRICES

14
Industry electricity price in Europe, 2020-20501
Note: 1For the Enerdata scenario, it has been selected the country with the highest and lowest electricity price for the industry sector; 2CAGR is
calculated for 2030-2050; 3CAGR is calculated for 2030-2040;
Source: Eurelectric; Enerdata; European Commission; IEA; CREARA Analysis
CAGR (2020-
2050)
Enerdata Germany, Green (EUR
2005)
1.85%
Eurelectric – Baseline scenario
(EUR 2005)
0.19%
Eurelectric – Power choice
scenario (EUR 2005)
0.09%
EC - Roadmap 2050 – Scenario 6
(Low nuclear) (EUR 2008)
0.02%2
EC - Roadmap 2050 – Reference
scenario (EUR 2008)
-0.13%2
Enerdata Sweden, Brown, (EUR
2005)
-0.96%
1 2 3
Elec
Industrial electricity prices rise under scenarios with higher RES
FUTURE PRICES
0
50
100
150
200
250
2020 2030 2040 2050
EU
R /
MW
h
15
FUTURE PRICES
Source: Reviewed documents; CREARA Analysis
CO2 prices will increase and will shift the profitability of carbon intensive
technologies towards less carbon intensive ones
• Carbon price directly affects energy costs, having a major impact on the generation mix of conventional generation
technologies
• Most of the considered scenarios forecast a decrease in fuel consumption, a trend which is reinforced by increasing
carbon prices
- High carbon prices would lead to a further reduction in CO2 emissions in 2030, due to a major shift form coal to natural gas
• It is assumed that beyond a certain transition period all countries and sectors will operate in an ideal market for carbon
allowances clearing at a single carbon price
- It is assumed that developing countries will start participating with gradually increasing commitments and achieve full
participation after 2025
• Between 2015 and 2020 only ETS sectors pay for carbon emissions, whilst consumers in non ETS sectors are not subject
to direct emission constraints but rather reduce emissions as a result of bottom-up policies; after 2020, carbon prices
apply on a uniform way for all sectors and countries
• WEO 2016 forecasts higher and more widespread CO2 prices in the 450 scenario, which raises the market value of
renewables in most cases
- CO2 price raise average market prices by as much as 50% to 2030
- after 2030, even higher CO2 prices have a diminishing impact on average market prices over time, as the power mix
becomes almost completely decarbonised
- Increasing CO2 prices and extended policy support to low-carbon generation facilitate additional reduction of emissions
intensity
1 2 3
Carbon

16
FUTURE PRICES
Source: EC; Energynautics; Eurelectric; Greenpeace; CREARA Analysis
CAGR
(2020-2050)
DNV GL / Imperial College
/ NERA (EUR 2010)
7.6%1
Fraunhofer (EUR 2005) 3.95%
Greenpeace [R]evolution
(EUR 2010)
3.73%
EC - Roadmap 2050
(EUR 2005)
3.77%
Eurelectric (EUR 2008) 1.77%
All considered scenarios project a strong yearly growth of carbon prices
Note: 1 CAGR is calculated for 2020-2030
10
20
30
40
50
60
70
80
90
2020 2025 2030 2035 2040 2045 2050
EU
R /
to
n o
f C
O2
Summary of projections for CO2 price
1 2 3
Carbon
IEA WEO 2016 (450) , EUR2015

17
• Introduction: Objective and Methodology
• Energy Vectors: Price Forecasts
• Summary
• Discussion
• Annex
Agenda

18
Source: Reviewed documents; CREARA Analysis
EXECUTIVE SUMMARY
Coal prices will be moderated by cuts to supply capacity and less demand
in the EU (in contrast to increasing demand from emerging countries)
CAGR
(2020-2050)
Max 0.33%
Min 0.96%
Note: 1Upper range is the Greenpeace [R]evolution scenario in EUR 2009; lower range is the Ecofys scenario (EUR’05); assuming 2% annual inflation, 2005
values can be translated to 2009 values by multiplying prices times 1.08; Only average EU prices are plotted (Enerdata country forecasts are
excluded); IEA 450 scenario has not been plotted since it does not include projections to 2050
It is expected that real price increases will be
moderate, driven by demand from emerging
countries and possibly supply cuts
154 159164
170
6469
80 85
0
20
40
60
80
100
120
140
160
180
2020 2030 2040 2050
EU
R /
to
n o
f co
al
Range of projected hard coal prices in EUR/ton1
• Overall, there is no upturn forecasted for global
coal demand
• On the one hand, efforts towards a strong
reduction of greenhouse gas emissions will take
place, which has a negative impact on the
demand for fossil fuels (Fraunhofer, 2011)
- Coal demand in the EU falls by over 60%
towards 2040 according to WEO 2016
• On the other hand, the increase in coal price in
the medium-term is driven by high demand in
emerging countries
• The search for market equilibrium depends on
cuts to supply capacity, mainly in China and the
United States (WEO 2016)
• Most of the studies expect coal prices to
increase at far lower rates than gas prices
• The future of coal largely depends on plant
efficiency to reduce pollutant emissions, and the
commercial availability of carbon capture and
storage
COAL

0
50
100
150
200
250
300
350
20% 30% 40% 50% 60% 70% 80% 90% 100%
Co
al
pri
ce (
EU
R /
to
n)
RES penetration in 2050
2020 2030 2040 2050
19
Ecofys
EWI / Energynautics
Eurelectric
EC – Roadmap 205
Greenpeace
Fraunhofer
Enerdata, UK, Blue
(industrial)
Enerdata, UK, Brown
(industrial)
Coal prices are not correlated with RES penetration; large price increases
are only expected in particular markets under extreme scenarios
IEA – 450 Scenario
(steam coal)
Source: Reviewed documents; CREARA Analysis
Note: For Enerdata scenarios, UK industrial price is chosen as it resembles EU wholesale prices; IEA – 450 Scenario is lower than the other ones as it
reflects prices for steam coal rather than hard coal
EXECUTIVE SUMMARY
Wholesale hard coal prices (unless indicated) and RES penetration (%) per reviewed scenario (2020-2050)
COAL
20
215
239248 252
7974
56 49
0
50
100
150
200
250
300
2020 2030 2040 2050
EU
R /
bb
l
Real oil prices could remain fairly flat (or even
decrease) in the long run, mainly due to the expected
decline in demand
Note: 1 Upper range is EWI/Energynautics (EUR10/boe); lower Fraunhofer (EUR05/boe); assuming 2% annual inflation, 2005 values can be translated to
2010 by multiplying prices times 1.1; Only EU averages have been plotted (Enerdata scenarios are excluded; to consult country forecasts see Annex)
Source: Reviewed documents; CREARA Analysis
Range of oil prices 2020-2050 in EUR/bbl1
EU Averages • The reviewed scenarios assume efforts will be made
to decrease GHG emissions
- Oil (and coal) demand will fall in countries making
the transition to low-carbon energy systems
- Worldwide, in the following decades, it is expected
that fossil fuels, in particular natural gas and oil,
will continue to be a bedrock of the global energy
system (WEO 2016)
• Progress in the transition will create a “paradigm shift
in demand”, where oil will be increasing replaced by
other technologies, leading to a relative oversupply
- Oil and gas will be replaced by efficient electric
technologies (road transport and household
heating)
- As such, electricity requirements will increase, but
the use of oil and gas for transportation and
heating/cooling will decrease
• Over the long term, oil demand according to WEO
2016 concentrates in freight, aviation and
petrochemicals (areas with few substitutes), while oil
supply increasingly concentrates in the Middle East
EXECUTIVE SUMMARY
Oil projections show uncertainty regarding demand and supply matching,
but ultimately only sectors with few oil substitutes will drive demand
CAGR
(2020-2050)
Max 0.5%
Min -1.6%
OIL
0
50
100
150
200
250
300
350
400
450
20% 30% 40% 50% 60% 70% 80% 90% 100%
Oil p
rice (
EU
R / b
oe)
RES penetration in 2050
2020 2030 2040 2050
21
There is no correlation between projected oil prices and RES penetration
Enerdata, UK, Brown
Enerdata, Sweden, Green
IEA – 450 Scenario
EWI / Energynautics
European Climate Foundation
Fraunhofer Ecofys
Greenpeace
EC – Roadmap 2050
Source: Reviewed documents; CREARA Analysis
Note: Enerdata scenarios only include the maximum and minimum prices within the sample
EXECUTIVE SUMMARY
Oil prices and RES penetration (%) per reviewed scenario (2020-2050)
OIL

22
Real gas prices are projected to increase, but the rate
of increase is moderated by the rise in gas supply
Note: 1 Upper range is Greenpeace Energy [R]evolution (USD’2010); lower range is Fraunhofer (EUR’2005); assuming 2% annual inflation, 2005 values can
be translated to 2010 values by multiplying prices times 1.1; Only EU wholesale averages have been plotted
Source: Reviewed documents; CREARA Analysis
Max
Min
CAGR
(2020-2050)
1.52%
0.42%
Range of wholesale natural gas prices 2020-2050 in
EURcent/kWh1 (EU averages)
EXECUTIVE SUMMARY
Natural gas prices show an increasing trend in the EU, as a result of a
strong demand, albeit moderated by expected abundant supply
• Most projections forecast a more flexible
global market, linked by a doubling of trade in
liquefied natural gas (LNG)
• Gas consumption increases almost
everywhere, but gas exporters have to work
hard to control costs in the face of strong
competition from other fuels, especially in the
power sector (WEO 2016)
- High carbon prices would lead to a major
shift form coal to natural gas
• Future rise in discoveries of natural gas
reserves will moderate the increase of natural
gas prices
• The reviewed studies forecast an increment in
natural gas power plants as a backup
technology due to the increased amount of
RES in the system
6,0
7,0
8,0
9,5
2,83,1 3,1 3,2
0
1
2
3
4
5
6
7
8
9
10
2020 2030 2040 2050
EU
R c
en
t / kW
hNATURAL GAS
0
5
10
15
20
25
20% 30% 40% 50% 60% 70% 80% 90% 100%
Gas p
rice (
EU
R c
en
t /
kW
h)
RES penetration in 2050
2020 2030 2040 2050
23
There is no correlation between assumed RES penetration and future gas
prices; future wholesale prices show much less dispersion than industrial
Enerdata, Sweden, Brown
(industrial)
Eurelectric
Enerdata, Sweden, Green
(industrial)
IEA – 450 Scenario EWI / Energynautics
Fraunhofer
Greenpeace
EC – Roadmap 2050
Source: Reviewed documents; CREARA Analysis
Note: Enerdata scenarios only include the maximum and minimum prices within the sample and show industrial prices (inc. taxes)
EXECUTIVE SUMMARY
Wholesale gas prices (except where indicated) and RES penetration (%) per reviewed scenario (2020-2050)
Enerdata, Sweden, Blue
NATURAL GAS

24
It is expected that real electricity prices will increase and then
stabilize, as techno-economic improvements limit the effects
of higher input fuel prices and CO2 prices
Note: 1 Upper range is Enerdata Green scenario for Germany and lower range is Enerdata brown scenario for Sweden, both in EUR 2005
Source: Reviewed documents; CREARA Analysis
EXECUTIVE SUMMARY
It is expected that end-user electricity prices will rise driven by fossil fuel
prices, carbon prices, and increasing generation costs from RES
CAGR
(2020-2050)
Max 1.27%
Min -0.96%
Range of industrial electricity prices in Europe
(max: Germany; low: Sweden) in EUR/MWh1
• Most scenarios estimate that average end-user
electricity prices will rise and that demand will
increase with a considerable shift towards RES
- With declining RES costs and an anticipated
rise in end-user electricity prices, global
subsidies to renewables are on a declining
trend (WEO 2016)
• Industrial prices are projected to increase in the
shorter term driven by the 3 main trends
- The increase in world fossil fuel prices
- The carbon price within the ETS
- The additional costs of power generation
induced by carbon emission reductions and
RES policies
• Wholesale electricity prices, on the other hand,
could remain low, as a result of the rapid
deployment of RES
• In the longer term, it is expected that electricity
prices will stabilize, as fossil fuel prices increase
at a slower pace and technology performance in
power generation succeeds in offsetting the fuel
price effects (Eurelectric, 2011; WEO 2016)
140
160
199 205
86
60 64 64
0
50
100
150
200
250
2020 2030 2040 2050
EU
R /
MW
h
ELECTRICITY

0
50
100
150
200
250
20% 30% 40% 50% 60% 70% 80% 90% 100%
Ele
ctr
icit
y w
ho
lesale
pri
ce
(EU
R c
en
t /
kW
h)
RES penetration in 2050
2020 2030 2040 2050
25
Enerdata, Sweden, Brown
(industrial)
Enerdata, Germany, Green
(industrial)
IEA - WEO 2014
Eurelectric
(average price)
Source: Reviewed documents; CREARA Analysis
Note: Enerdata scenarios show the maximum and minimum values within the analyzed sample
EXECUTIVE SUMMARY
Wholesale electricity prices (unless indicated) and RES penetration (%) per reviewed scenario (2020-2050)
EC – Roadmap 2050
DNV GL / Imperial College / NERA
Ecofys
It is expected that industrial prices will increase with RES penetration,
while wholesale prices could remain fairly flat
ELECTRICITY
26
Source: Reviewed documents; CREARA Analysis
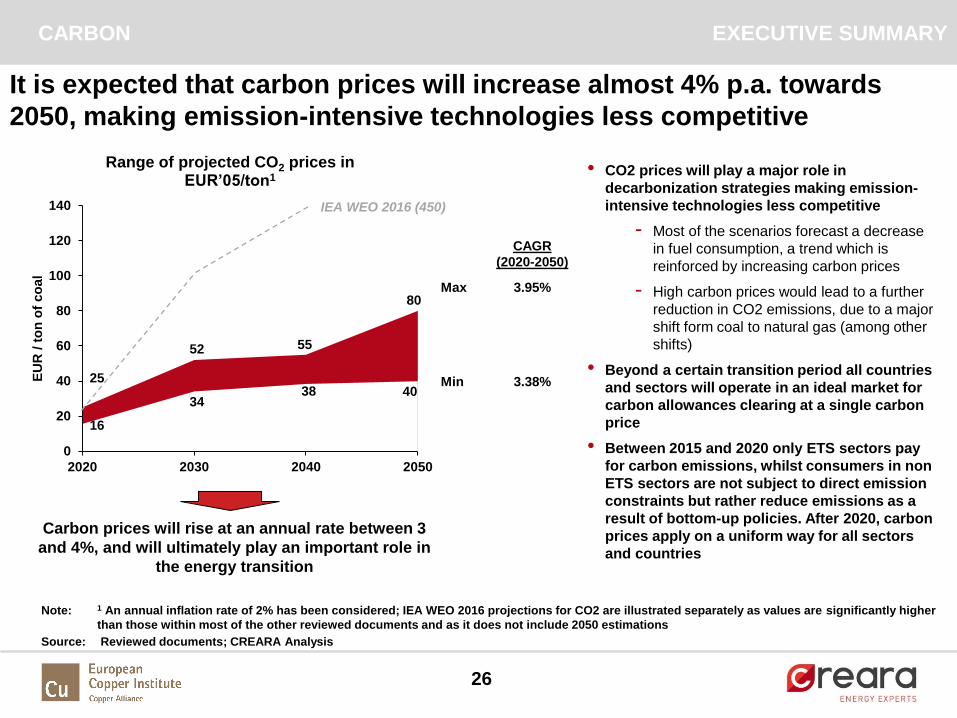
EXECUTIVE SUMMARY
It is expected that carbon prices will increase almost 4% p.a. towards
2050, making emission-intensive technologies less competitive
25
52 55
80
16
3438 40
0
20
40
60
80
100
120
140
2020 2030 2040 2050
EU
R /
to
n o
f co
al
Range of projected CO2 prices in EUR’05/ton1
CAGR
(2020-2050)
Max 3.95%
Min 3.38%
Note: 1 An annual inflation rate of 2% has been considered; IEA WEO 2016 projections for CO2 are illustrated separately as values are significantly higher
than those within most of the other reviewed documents and as it does not include 2050 estimations
Carbon prices will rise at an annual rate between 3
and 4%, and will ultimately play an important role in
the energy transition
• CO2 prices will play a major role in
decarbonization strategies making emission-
intensive technologies less competitive
- Most of the scenarios forecast a decrease
in fuel consumption, a trend which is
reinforced by increasing carbon prices
- High carbon prices would lead to a further
reduction in CO2 emissions, due to a major
shift form coal to natural gas (among other
shifts)
• Beyond a certain transition period all countries
and sectors will operate in an ideal market for
carbon allowances clearing at a single carbon
price
• Between 2015 and 2020 only ETS sectors pay
for carbon emissions, whilst consumers in non
ETS sectors are not subject to direct emission
constraints but rather reduce emissions as a
result of bottom-up policies. After 2020, carbon
prices apply on a uniform way for all sectors
and countries
IEA WEO 2016 (450)
CARBON
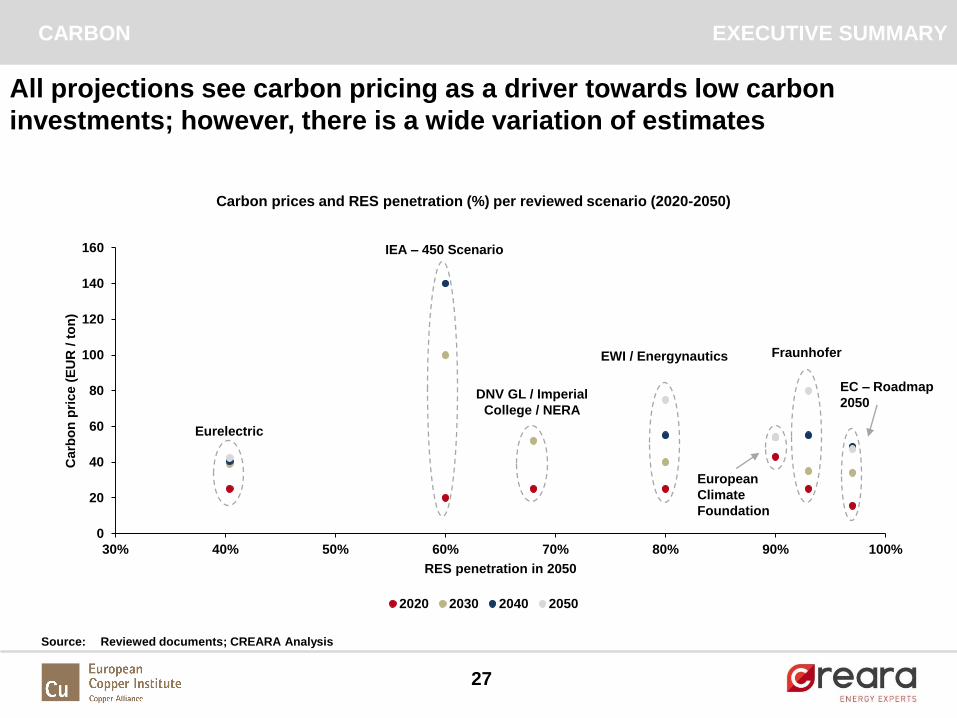
27
0
20
40
60
80
100
120
140
160
30% 40% 50% 60% 70% 80% 90% 100%
Carb
on
pri
ce (
EU
R /
to
n)
RES penetration in 2050
2020 2030 2040 2050
Eurelectric
IEA – 450 Scenario
DNV GL / Imperial
College / NERA
EWI / Energynautics
European
Climate
Foundation
Fraunhofer
EC – Roadmap
2050
All projections see carbon pricing as a driver towards low carbon
investments; however, there is a wide variation of estimates
Source: Reviewed documents; CREARA Analysis
Carbon prices and RES penetration (%) per reviewed scenario (2020-2050)
EXECUTIVE SUMMARYCARBON

28
• Introduction: Objective and Methodology
• Energy Vectors: Price Forecasts
• Summary
• Discussion
• Annex
Agenda

29
Discussion around key questions
For instance…
• …Which trends can we expect from this overview?
• …How will long-term energy prices affect industry’s long-term energy strategy?
• …Does electrification make sense for energy-intensive industry?

30
• Introduction: Objective and Methodology
• Energy Vectors: Price Forecasts
• Summary
• Discussion
• Annex
Agenda
31
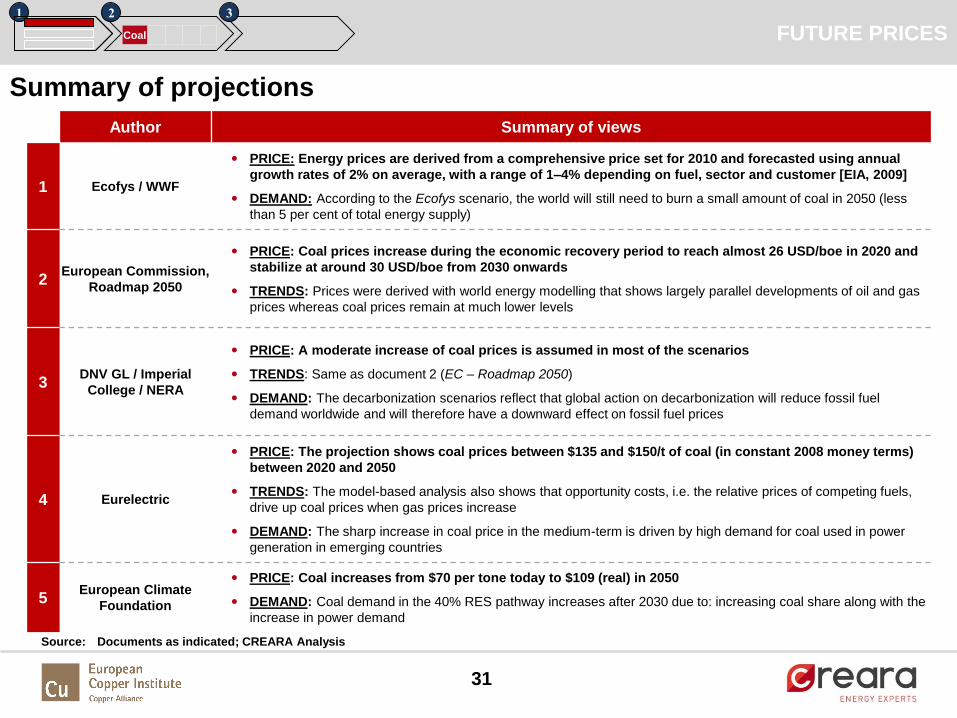
Author Summary of views
1 Ecofys / WWF
• PRICE: Energy prices are derived from a comprehensive price set for 2010 and forecasted using annual
growth rates of 2% on average, with a range of 1–4% depending on fuel, sector and customer [EIA, 2009]
• DEMAND: According to the Ecofys scenario, the world will still need to burn a small amount of coal in 2050 (less
than 5 per cent of total energy supply)
2European Commission,
Roadmap 2050
• PRICE: Coal prices increase during the economic recovery period to reach almost 26 USD/boe in 2020 and
stabilize at around 30 USD/boe from 2030 onwards
• TRENDS: Prices were derived with world energy modelling that shows largely parallel developments of oil and gas
prices whereas coal prices remain at much lower levels
3DNV GL / Imperial
College / NERA
• PRICE: A moderate increase of coal prices is assumed in most of the scenarios
• TRENDS: Same as document 2 (EC – Roadmap 2050)
• DEMAND: The decarbonization scenarios reflect that global action on decarbonization will reduce fossil fuel
demand worldwide and will therefore have a downward effect on fossil fuel prices
4 Eurelectric
• PRICE: The projection shows coal prices between $135 and $150/t of coal (in constant 2008 money terms)
between 2020 and 2050
• TRENDS: The model-based analysis also shows that opportunity costs, i.e. the relative prices of competing fuels,
drive up coal prices when gas prices increase
• DEMAND: The sharp increase in coal price in the medium-term is driven by high demand for coal used in power
generation in emerging countries
5European Climate
Foundation
• PRICE: Coal increases from $70 per tone today to $109 (real) in 2050
• DEMAND: Coal demand in the 40% RES pathway increases after 2030 due to: increasing coal share along with the
increase in power demand
FUTURE PRICES
Source: Documents as indicated; CREARA Analysis
Summary of projections
1 2 3
Coal
32
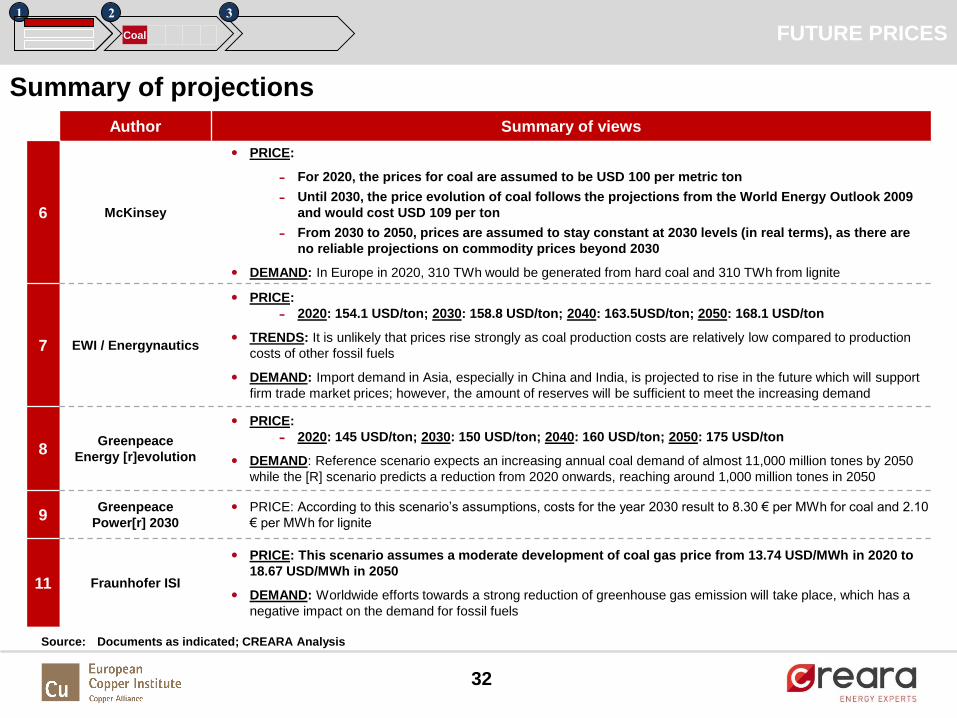
Author Summary of views
6 McKinsey
• PRICE:
- For 2020, the prices for coal are assumed to be USD 100 per metric ton
- Until 2030, the price evolution of coal follows the projections from the World Energy Outlook 2009
and would cost USD 109 per ton
- From 2030 to 2050, prices are assumed to stay constant at 2030 levels (in real terms), as there are
no reliable projections on commodity prices beyond 2030
• DEMAND: In Europe in 2020, 310 TWh would be generated from hard coal and 310 TWh from lignite
7 EWI / Energynautics
• PRICE:
- 2020: 154.1 USD/ton; 2030: 158.8 USD/ton; 2040: 163.5USD/ton; 2050: 168.1 USD/ton
• TRENDS: It is unlikely that prices rise strongly as coal production costs are relatively low compared to production
costs of other fossil fuels
• DEMAND: Import demand in Asia, especially in China and India, is projected to rise in the future which will support
firm trade market prices; however, the amount of reserves will be sufficient to meet the increasing demand
8Greenpeace
Energy [r]evolution
• PRICE:
- 2020: 145 USD/ton; 2030: 150 USD/ton; 2040: 160 USD/ton; 2050: 175 USD/ton
• DEMAND: Reference scenario expects an increasing annual coal demand of almost 11,000 million tones by 2050
while the [R] scenario predicts a reduction from 2020 onwards, reaching around 1,000 million tones in 2050
9Greenpeace
Power[r] 2030• PRICE: According to this scenario’s assumptions, costs for the year 2030 result to 8.30 € per MWh for coal and 2.10
€ per MWh for lignite
11 Fraunhofer ISI
• PRICE: This scenario assumes a moderate development of coal gas price from 13.74 USD/MWh in 2020 to
18.67 USD/MWh in 2050
• DEMAND: Worldwide efforts towards a strong reduction of greenhouse gas emission will take place, which has a
negative impact on the demand for fossil fuels
FUTURE PRICES1 2 3
Coal
Summary of projections
Source: Documents as indicated; CREARA Analysis
33
Author Summary of views
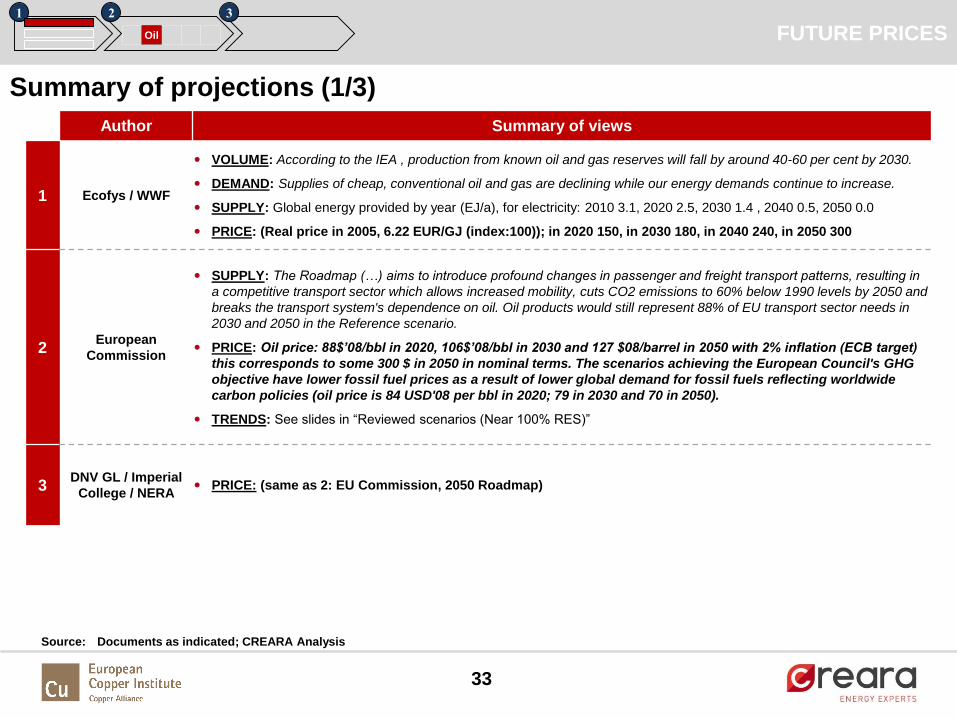
1 Ecofys / WWF
• VOLUME: According to the IEA , production from known oil and gas reserves will fall by around 40-60 per cent by 2030.
• DEMAND: Supplies of cheap, conventional oil and gas are declining while our energy demands continue to increase.
• SUPPLY: Global energy provided by year (EJ/a), for electricity: 2010 3.1, 2020 2.5, 2030 1.4 , 2040 0.5, 2050 0.0
• PRICE: (Real price in 2005, 6.22 EUR/GJ (index:100)); in 2020 150, in 2030 180, in 2040 240, in 2050 300
2European
Commission
• SUPPLY: The Roadmap (…) aims to introduce profound changes in passenger and freight transport patterns, resulting in
a competitive transport sector which allows increased mobility, cuts CO2 emissions to 60% below 1990 levels by 2050 and
breaks the transport system's dependence on oil. Oil products would still represent 88% of EU transport sector needs in
2030 and 2050 in the Reference scenario.
• PRICE: Oil price: 88$’08/bbl in 2020, 106$’08/bbl in 2030 and 127 $08/barrel in 2050 with 2% inflation (ECB target)
this corresponds to some 300 $ in 2050 in nominal terms. The scenarios achieving the European Council's GHG
objective have lower fossil fuel prices as a result of lower global demand for fossil fuels reflecting worldwide
carbon policies (oil price is 84 USD'08 per bbl in 2020; 79 in 2030 and 70 in 2050).
• TRENDS: See slides in “Reviewed scenarios (Near 100% RES)”
3DNV GL / Imperial
College / NERA • PRICE: (same as 2: EU Commission, 2050 Roadmap)
FUTURE PRICES1 2 3
Oil
Summary of projections (1/3)
Source: Documents as indicated; CREARA Analysis

34
Author Summary of views
4 Eurelectric
• DEMAND/PRICE/IMPORTS: A paradigm shift on the demand side: oil and gas replaced by efficient electric
technologies (road transport and household heating). Increasing energy efficiency in energy demand combined with de-
carbonization of the energy system could lead to a relative oversupply of fossil fuels at World level. If that is the case, oil
prices would collapse to values close to their historical lows when the World acts in unison .
• Oil import requirements by 2050 are, in the Power Choices scenario, 52% below their level in 2005; this is a remarkable
disengagement by the energy system from oil. For the whole period after 2010, the Power Choices scenario exhibits a
steady decrease in net oil imports, which has important consequences also in terms of reducing oil import dependency.
• VOLUME: There is significant uncertainty about the volume of undiscovered conventional oil reserves. The expectations
accepted for the projection are that undiscovered conventional oil will deliver close to 750 billion barrels of oil to 2050;
this compares to around 1350 billion barrels of oil in known reserves of conventional oil
• PRICE (same as 2): Fossil fuel Prices as imported to the EU ($’2008), 2010: 71.9, 2015: 72.6, 2020:88.4, 2025:
101.6, 2030: 105.9, 2035: 111.2, 2040: 116.2, 2045: 120.4, 2050: 126.8 Source: Prometheus model (E3MLab)
5European Climate
Foundation
• PRICE: The 450 scenario assumes an increase in oil price to $87 per barrel in 2015 and to $115 in 2030 (all numbers in
real terms). Beyond 2030 prices are assumed flat in real terms (i.e., increasing at the general inflation rate)
• VOLUME: This is likely conservative as a baseline assumption, as it assumes that none of the three primary fossil fuels
used will become significantly scarcer in the two decades beyond 2030
• DEMAND: A rough estimate shows that the demand for oil and coal would reduce by about 60% (by 2050)
7 EWI / Energynautics
• PRICE: After the price of oil peaked at 125 USD/barrel in 2008 it rapidly came down to values well below 70
USD/barrel. Since then the oil price has been subject to increase and is now at about 100 USD/barrel. In the LT,
the oil price is expected to significantly increase until 2020 and at moderate rates from then on, such that it
reaches 116 EUR10/MWh (see slides in “Reviewed scenarios (Near 100% RES)” for values in BOE)
FUTURE PRICES1 2 3
Oil
Summary of projections (2/3)
Source: Documents as indicated; CREARA Analysis
35
Author Summary of views
8Greenpeace
([R]evolution)
• PRICE: The recent dramatic fluctuations in global oil prices have resulted in slightly higher forward price
projections for fossil fuels. Under the 2004 ‘high oil and gas price’ scenario from the European Commission, for
example, an oil price of just € 28 per barrel (/bbl) as assumed in 2030. More recent projections of oil prices by
2035 in the IEA’s WEO 2011 range from € 80/bbl in the 450 ppm scenario up to € 116/bbl in current policies
scenario. Since the first Energy [R]evolution study was published in 2007, however, the actual price of oil has
reached over € 83/bbl for the first time, and in July 2008 reached a record high of more than € 116/bbl. Although
oil prices fell back to € 83/bbl in September 2008 and around € 66/bbl in April 2010, prices have increased to
more than € 91/bbl in early 2012. Taking into account the growing global demand for oil we have assumed a
price development path for fossil fuels slightly higher than the IEA WEO 2011 “Current Policies” case
extrapolated forward to 2050 (see slides in “Reviewed scenarios (Near 100% RES)”; in 2050 prices are expected
to reach 126 EUR10 per barrel)
9Greenpeace
(Powe[r] 2030) • PRICE: Same as nº8
11 Fraunhofer ISI
• PRICE: Source: Schade & Jochem (2009) and own calculations, in EUR/MWh 2008 50.23, 2020 48.31, 2030 45.22,
2040 34.31, and 2050 30.15
• DEMAND: The moderate development of coal and gas prices and the decline in oil prices is surprising at first sight. This
development can be explained by the underlying assumption in the ADAM scenario that worldwide efforts towards a
strong reduction of greenhouse gas emission will take place, which has a negative impact on the demand for fossil fuels
13 Jacobson, M. et al.
• DEMAND: Electricity-powered air-and ground-source heat pumps, heat exchangers, and back up electric resistance
heaters will replace natural gas and oil for home heating and air conditioning. As such, electricity requirements will
increase, but the use of oil and gas for transportation and heating/cooling will decrease to zero
• VOLUME: Due to the eventual depletion of coal, oil, natural gas, and uranium resources, their prices should ultimately
rise although technology improvements may delay this rise
• PRICE: Gasoline, all grades (2009 dollars/MMBTU), 2009: $19.30 2030 $40.39 109% (Percent change 2009-2030)
FUTURE PRICES1 2 3
Oil
Summary of projections (3/3)
Source: Documents as indicated; CREARA Analysis

36
Author Summary of views
1 Ecofys / WWF
• VOLUME: According to the IEA , production from known oil and gas reserves will fall by around 40-60 per cent by 2030.
• DEMAND: Supplies of cheap, conventional oil and gas are declining while our energy demands continue to increase.
• SUPPLY: Global energy provided by year (EJ/a), for electricity: 2010 14.0, 2020 25.6, 2030 28.3 , 2040 20.1, 2050 0.0
• PRICE: (Real price in 2005, 3.15 EUR/GJ (index:100)); in 2020 160, in 2030 200, in 2040 300, in 2050 380
2European
Commission
• SUPPLY: The power generation and capacity from solids decrease throughout the projection period due to increasing
carbon prices that reduce the competitiveness of this technology; gas power generation capacity increases, also as peak
load activated during backup periods due to the increased amount of RES in the system
• DEMAND: The decarbonisation scenarios are based on "global climate action" price trajectories for oil, gas and coal
reflecting that global action on decarbonisation will reduce fossil fuel demand worldwide and will therefore have a
downward effect on fossil fuel prices. Oil, gas and coal prices are therefore lower than in the Reference scenario and
Current Policy Initiative scenario.
• PRICE: Gas prices follow a trajectory similar to oil prices reaching 62$’08/boe in 2020, 77$’08/boe in 2030 and 98
$(08)/boe in 2050 (...). The price development to 2050 is expected to take place in a context of economic recovery
and resuming GDP growth without decisive climate action in any world region. Prices were derived with world
energy modelling that shows largely parallel developments of oil and gas prices whereas coal prices remain at
much lower levels. (...) The higher oil prices result in substitution of oil for gas in markets where the two fuels
compete. The reduction in oil discoveries also implies a reduction in future reserves of associated gas. On the
other hand gas price increases are moderated by an increasing share of unconventional gas from shales, as
technology improves and the interest in its potential spreads beyond North America.
3DNV GL /
Imperial College
/ NERA• PRICE: (same as 2: EU Commission, 2050 Roadmap)
FUTURE PRICES1 2 3
Gas
Summary of projections (1/3)
Source: Documents as indicated; CREARA Analysis

37
Author Summary of views
4 Eurelectric
• DEMAND/PRICE/IMPORTS: A paradigm shift on the demand side: oil and gas replaced by efficient electric technologies
(road transport and household heating). Increasing energy efficiency in energy demand combined with de-carbonisation of
the energy system could lead to a relative oversupply of fossil fuels at World level. If that is the case, gas prices would tend
to hold in the medium term but tend to be lower in the longer term.
• VOLUME: It is assumed that 130 trillion cubic meters of gas will be discovered to 2050, compared to 170 trillion cubic
meters of gas reserves known today. This volume of gas includes tight gas and coal-bed gas exploited today or expected
to be exploited in North America but not unconventional gas, such as hydrates.
• PRICE (same as 2): Fossil fuel Prices as imported to the EU ($’2008/MBTU), 2010: 7.7, 2015: 8.1, 2020: 10.1, 2025:
12.2, 2030: 12.5, 2035: 13.4, 2040: 14.2, 2045: 15.0, 2050: 16.1 Source: Prometheus model (E3MLab)
5European
Climate
Foundation
• PRICE: Fossil fuel prices are modeled as per the IEA WEO 2009 “450 Scenario” (which projects lower future
prices than the WEO 2009 “Reference” scenario due to the assumption of lower future demand). The WEO 2009
projections carry out to 2030, after which prices have been assumed to stay flat in real terms through 2050 (...)
Natural gas increases from $8.90 to $14.80 per mmBtu (...) This study assumes that the fossil fuel prices in the
baseline are the same as in the decarbonized pathways, even though Europe will use less fossil fuel in the latter
situation.
6 McKinsey
• PRICE: For 2020, the price for coal and natural gas are assumed to be USD 100 per metric ton and, and USD 10
per million British thermal units (MMBtu), respectively (all numbers in real terms). Until 2030, the price evolution
of coal, and natural gas follows the projections from the World Energy Outlook 2009, i.e. in 2030, coal would cost
USD 109 per ton, and natural gas USD 15 per MMBtu in the European market. From 2030 to 2050, prices are
assumed to stay constant at levels 2030 (in real terms), as there are no reliable projections on commodity prices
beyond 2030
7EWI /
Energynautics
• PRICE: The price of natural gas was historically closely linked to the oil price due to its substitutional
relationship. However, it is expected that in the future gas markets will be more competitive and prices will be less
influenced by oil price movements. Due to its characteristic of being a scarce resource, prices are assumed to
increase from 28 EUR2010/MWhth to 35 EUR2010/MWhth in the long term
– Price of gas for generation (EUR’2010/MWhth): in 2008 25.1, in 2020 28.1, in 2030 31.3, in 2040 33.2, in 2050 35.2
FUTURE PRICES1 2 3
Gas
Summary of projections (2/3)
Source: Documents as indicated; CREARA Analysis

38
Author Summary of views
8
Greenpeace
Energy
[R]evolution
• DEMAND: Demand is expected to grow in Europe from 89 PJ/a in 2009 to 125 PJ/a in 2015, 131 PJ/a in 2020, 175 PJ/a in
2030, 222 in PJ/a in 2040 and 227 PJ/a in 2050
• PRICE: As the supply of natural gas is limited by the availability of pipeline infrastructure, there is no world
market price for gas. In most regions of the world the gas price is directly tied to the price of oil. Gas prices are
therefore assumed to increase to $24-30/GJ by 2050
– Energy [R] evolution 2012 ($’2010/GJ): in 2010 7.91, in 2015 14.22, in 2020 16.78, in 2025 18.22, in 2030 19.54, in
2035 20.91, in 2040 22.29, in 2050 26.37
It is expected that an effective gas market will develop using the existing global distribution network for liquid gas
via tankers and loading terminals. With greater competitiveness regards price fixing, it is expected that the oil and
gas prices will no longer be linked. Having more liquid gas in the energy mix (currently around 10 % of overall gas
consumption) significantly increases supply security, e.g. reducing the risks of supply interruptions associated
with international pipeline networks.
9Greenpeace
Powe[r] 2030• PRICE: 21.60 €/MWh in 2030 (based on the 2020 and 2030 assumptions of the Energy [R]evolution for EU 27 report
published in December 2012)
11 Fraunhofer ISI
• PRICE: The moderate development of coal and gas prices and the decline in oil prices is surprising at first sight.
This development can be explained by the underlying assumption in the ADAM scenario that worldwide efforts
towards a strong reduction of greenhouse gas emission will take place, which has a negative impact on the
demand for fossil fuels.
– Input prices for natural gas (€/MWh): in 2008 27.11, in 2020 28.74, 2030 30.84, 2040 31.07, 2050 31.82.
Source: Schade & Jochem (2009) and own calculations
13Jacobson, M. et
al.
• PRICE: Projected unit costs of natural gas over the period 2009-2030 in New York State. Source: New York State
Energy Planning Board, 2009)
– Natural gas – electric ($’2009/MMBtu): in 2009 19.30, in 2030 40.39
– Natural gas – residential ($’2009/MMBtu): in 2009 13.58, in 2030 16.19
– Natural gas – commercial ($’2009/MMBtu): in 2009 10.27, in 2030 13.06
– Natural gas – industrial ($’2009/MMBtu): in 2009 8.73, in 2030 11.98
FUTURE PRICES1 2 3
Gas
Summary of projections (3/3)
Source: Documents as indicated; CREARA Analysis

39
Author Summary of views
1 Ecofys / WWF • PRICE: (Wholesale real price in 2005, 0.03 EUR/kWh (index:100)); in 2020 160, in 2030 200, in 2040 300, in 2050 380
2European
Commission
• SUPPLY: The demand for electricity continues rising and there is a considerable shift towards RES with a strong increase
in wind.
• DEMAND: Electricity demand is particularly sensitive to variations in economic activity. With limited possibilities for
electricity imports this translates into a similar requirement on the generation of electricity in the EU. In the high economic
growth case with 15% higher GDP in 2050, gross electricity generation exceeds the 2050 reference case level by 9.2%.
Similarly, 14.7% lower economic activity in 2050 entails 10.2% less electricity generation in 2050.
• PRICE: Average electricity prices rise up to 2030 and stabilize thereafter. The price increase up to 2030 is due to
three main elements: RES supporting policies, ETS carbon price and high fuel prices due to the world recovery
after the economic crisis. Thereafter electricity prices remain stable because of the techno-economic
improvements of various power generation technologies that limit the effects of higher input fuel prices and CO2
prices.
– Reference Scenario (EUR/MWhe): Industry: in 2005 74.7, in 2030 107.0, in 2050 104.2; Household: in 2005
140.7, in 2030 207.2, in 2050 201.3; Services: in 2005 131.3, in 2030 173.1, in 2050 166.3
– Scenario 6 – Low nuclear scenario (EUR/MWhe): Industry: in 2030 118.8, in 2050 119.2; Household: in 2030
218.4, in 2050 208.3; Services: in 2030 180.9, in 2050 171.6
Effects on cost components allow for a decrease in electricity prices between 2030 and 2050 in all
decarbonisation scenarios, except for the High RES scenario. This is in stark contrast to the period up to 2030, in
which electricity prices increase due notably to increases in capital cost, grid costs and auctioning payments. The
High RES case is an exception from other cases because of the very high investment requirements combined
with stronger requirements on the electricity grid extension, which is not fully compensated by savings in fuel
and other variable costs.
3DNV GL /
Imperial College
/ NERA
• PRICE: Average wholesale electricity price (EUR/MWh):
– Scenario 1: 60, 75 and 75 in 2020, 2025 and 2030
– Scenario 2: 60, 75 and 82 in 2020, 2025 and 2030
– Scenario 3: 58, 81 and 98 in 2020, 2025 and 2030
FUTURE PRICES1 2 3
Elec
Summary of projections (1/2)
Source: Documents as indicated; CREARA Analysis

40
Author Summary of views
4 Eurelectric
• DEMAND: Electricity accounted for 20% of total final energy demand in 2005. Business-as-usual projections, such as the
Baseline 2009, show an increase of electricity’s share up to 28-29% of total final energy demand by 2050.
• PRICE: The average price of electricity is projected to remain at a similar level in both Power choices and the
Baseline 2009 scenarios. Prices strongly increase until 2025, driven by the increase in world fossil fuel prices
(which is projected to take place during the period of recovery of world economic growth), carbon price within the
ETS and the additional costs of power generation induced by carbon emission reductions and RES policies.
Beyond 2025, electricity prices are projected to remain rather stable, as fossil fuel prices increase at a slower pace
and technology performance in power generation succeeds in offsetting the fuel price effects.
– Baseline 2009 scenario - average energy prices (EUR/MWh): in 2000 95, in 2015 125, in 2020 137, in 2030
145, in 2040 144, in 2050 145
– Power Choice scenario - average energy prices (EUR/MWh): in 2000 95, in 2015 130, in 2020 140, in 2030
146, in 2040 140, in 2050 144
10EWI /
Energynautics• PRICE: According to the advanced E[R] scenario, the aggregated electricity price in 2030 will be approximately 10
cents/kWh.
12Jacobson, M. et
al.• PRICE: Assumes a 2.85% increase in electricity cost per year from 2011 to 2030 for conventional generators,
which is the average all-sector price increase in electricity in California from 2000 to 2012.
FUTURE PRICES1 2 3
Elec
Summary of projections (2/2)
Source: Documents as indicated; CREARA Analysis
41
Author Summary of views
2European Commission,
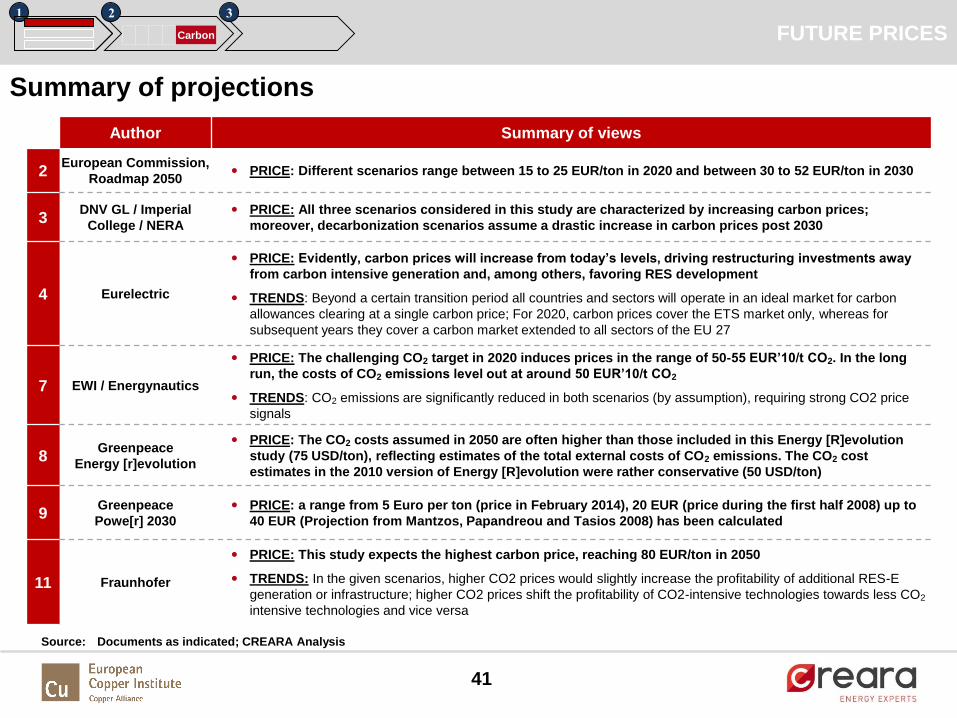
Roadmap 2050 • PRICE: Different scenarios range between 15 to 25 EUR/ton in 2020 and between 30 to 52 EUR/ton in 2030
3DNV GL / Imperial
College / NERA• PRICE: All three scenarios considered in this study are characterized by increasing carbon prices;
moreover, decarbonization scenarios assume a drastic increase in carbon prices post 2030
4 Eurelectric
• PRICE: Evidently, carbon prices will increase from today’s levels, driving restructuring investments away
from carbon intensive generation and, among others, favoring RES development
• TRENDS: Beyond a certain transition period all countries and sectors will operate in an ideal market for carbon
allowances clearing at a single carbon price; For 2020, carbon prices cover the ETS market only, whereas for
subsequent years they cover a carbon market extended to all sectors of the EU 27
7 EWI / Energynautics
• PRICE: The challenging CO2 target in 2020 induces prices in the range of 50-55 EUR’10/t CO2. In the long
run, the costs of CO2 emissions level out at around 50 EUR’10/t CO2
• TRENDS: CO2 emissions are significantly reduced in both scenarios (by assumption), requiring strong CO2 price
signals
8Greenpeace
Energy [r]evolution
• PRICE: The CO2 costs assumed in 2050 are often higher than those included in this Energy [R]evolution
study (75 USD/ton), reflecting estimates of the total external costs of CO2 emissions. The CO2 cost
estimates in the 2010 version of Energy [R]evolution were rather conservative (50 USD/ton)
9Greenpeace
Powe[r] 2030• PRICE: a range from 5 Euro per ton (price in February 2014), 20 EUR (price during the first half 2008) up to
40 EUR (Projection from Mantzos, Papandreou and Tasios 2008) has been calculated
11 Fraunhofer
• PRICE: This study expects the highest carbon price, reaching 80 EUR/ton in 2050
• TRENDS: In the given scenarios, higher CO2 prices would slightly increase the profitability of additional RES-E
generation or infrastructure; higher CO2 prices shift the profitability of CO2-intensive technologies towards less CO2
intensive technologies and vice versa
FUTURE PRICES1 2 3
Carbon
Summary of projections
Source: Documents as indicated; CREARA Analysis

42
Author Country 2020E 2030E 2040ECAGR
10-20E
CAGR
20-30E
CAGR
30-40E
Enerdata
Bituminous Coal
Households
(incl. taxes)
($05/t)
United Kingdom 516.8 1,713.7 2,824.3 0.5% 12.7% 5.1%
France 594.4 1,916.6 3,175.1 -0.3% 12.4% 5.2%
Industry
(incl. taxes)
($05/t)
United Kingdom 188.4 876.8 1,757.9 4.6% 16.6% 7.2%
France 227.5 1134.4 2,295.0 6.3% 17.4% 7.3%
Sweden 280.7 1,185.8 2,344.2 5.1% 15.5% 7.1%
Germany 238.2 1,163.0 2,346.4 5.2% 17.2% 7.3%
Electricity
production
(incl. taxes)
($05/t)
France 137.2 736.2 1,502.8 3.8% 18.3% 7.4%
Germany 134.8 740.0 1,514.6 2.8% 18.6% 7.4%
United Kingdom 142.2 801.8 1,646.0 3.7% 18.9% 7.5%
Sweden 203.2 1,108.4 2,266.8 5.1% 18.5% 7.4%
Enerdata coal projections under Green Scenario
FUTURE PRICES1 2 3
Coal
Note: Maximum values per year are coloured in red and minimum in green
Source: Enerdata Global Energy & CO2 Database, POLES Global energy forecasting model

43
Author Country 2020E 2030E 2040ECAGR
10-20E
CAGR
20-30E
CAGR
30-40E
Enerdata
Bituminous Coal
Households
(incl. taxes)
($05/t)
United Kingdom 540.9 909.1 950.7 1.0% 5.3% 0.4%
France 588.1 946.4 990.4 -0.4% 4.9% 0.5%
Industry
(incl. taxes)
($05/t)
United Kingdom 133.6 256.3 289.4 1.0% 6.7% 1.2%
France 132.5 273.1 311.2 0.7% 7.5% 1.3%
Germany 141.4 284.8 323.6 -0.1% 7.3% 1.3%
Sweden 185.9 326.3 364.2 0.9% 5.8% 1.1%
Electricity
production
(incl. taxes)
($05/t)
France 90.7 203.8 234.4 -0.4% 8.4% 1.4%
Germany 88.1 203.9 235.2 -1.5% 8.8% 1.4%
United Kingdom 91.7 219.9 254.6 -0.8% 9.1% 1.5%
Sweden 108.4 248.8 286.7 -1.3% 8.7% 1.4%
Enerdata coal projections under Blue Scenario
FUTURE PRICES1 2 3
Coal
Note: Maximum values per year are coloured in red and minimum in green
Source: Enerdata Global Energy & CO2 Database, POLES Global energy forecasting model

44
Author Country 2020E 2030E 2040ECAGR
10-20E
CAGR
20-30E
CAGR
30-40E
Enerdata
Bituminous Coal
Households
(incl. taxes)
($05/t)
United Kingdom 490.2 555.7 585.5 0.0% 1.3% 0.5%
France 502.4 569.6 600.2 -2.0% 1.3% 0.5%
Industry
(incl. taxes)
($05/t)
United Kingdom 133.7 165.0 191.0 1.0% 2.1% 1.5%
France 127.6 162.8 192.1 0.4% 2.5% 1.7%
Germany 138.4 174.3 204.1 -0.3% 2.3% 1.6%
Sweden 182.4 217.5 246.7 0.7% 1.8% 1.3%
Electricity
production
(incl. taxes)
($05/t)
Germany 88.5 118.4 143.3 -1.4% 3.0% 1.9%
France 91.5 121.4 146.3 -0.3% 2.9% 1.9%
United Kingdom 92.1 125.2 152.8 -0.7% 3.1% 2.0%
Sweden 104.9 140.0 169.2 -1.6% 2.9% 1.9%
Enerdata coal projections under Brown Scenario
FUTURE PRICES1 2 3
Coal
Note: Maximum values per year are coloured in red and minimum in green
Source: Enerdata Global Energy & CO2 Database, POLES Global energy forecasting model
45
Author Country 2020E 2030E 2040ECAGR
10-20E
CAGR
20-30E
CAGR
30-40E
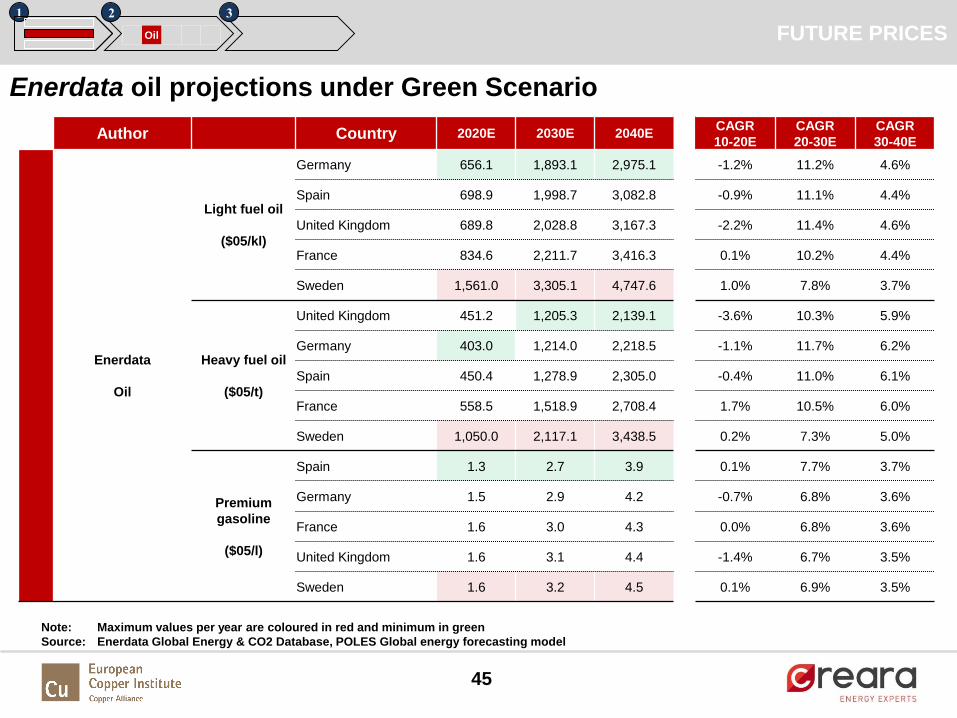
Enerdata
Oil
Light fuel oil
($05/kl)
Germany 656.1 1,893.1 2,975.1 -1.2% 11.2% 4.6%
Spain 698.9 1,998.7 3,082.8 -0.9% 11.1% 4.4%
United Kingdom 689.8 2,028.8 3,167.3 -2.2% 11.4% 4.6%
France 834.6 2,211.7 3,416.3 0.1% 10.2% 4.4%
Sweden 1,561.0 3,305.1 4,747.6 1.0% 7.8% 3.7%
Heavy fuel oil
($05/t)
United Kingdom 451.2 1,205.3 2,139.1 -3.6% 10.3% 5.9%
Germany 403.0 1,214.0 2,218.5 -1.1% 11.7% 6.2%
Spain 450.4 1,278.9 2,305.0 -0.4% 11.0% 6.1%
France 558.5 1,518.9 2,708.4 1.7% 10.5% 6.0%
Sweden 1,050.0 2,117.1 3,438.5 0.2% 7.3% 5.0%
Premium
gasoline
($05/l)
Spain 1.3 2.7 3.9 0.1% 7.7% 3.7%
Germany 1.5 2.9 4.2 -0.7% 6.8% 3.6%
France 1.6 3.0 4.3 0.0% 6.8% 3.6%
United Kingdom 1.6 3.1 4.4 -1.4% 6.7% 3.5%
Sweden 1.6 3.2 4.5 0.1% 6.9% 3.5%
Enerdata oil projections under Green Scenario
FUTURE PRICES1 2 3
Oil
Note: Maximum values per year are coloured in red and minimum in green
Source: Enerdata Global Energy & CO2 Database, POLES Global energy forecasting model

46
Author Country 2020E 2030E 2040ECAGR
10-20E
CAGR
20-30E
CAGR
30-40E
Enerdata
Oil
Light fuel oil
($05/kl)
Germany 728.4 1,223.2 1,387.7 -0.2% 5.3% 1.3%
United Kingdom 766.7 1,330.4 1,505.6 -1.1% 5.7% 1.2%
Spain 763.9 1,369.0 1,545.6 0.0% 6.0% 1.2%
France 912.7 1,458.2 1,639.5 1.0% 4.8% 1.2%
Sweden 1,579.9 2,287.3 2,493.7 1.1% 3.8% 0.9%
Heavy fuel oil
($05/t)
Germany 355.6 571.5 692.0 -2.4% 4.9% 1.9%
United Kingdom 404.8 601.3 711.1 -4.6% 4.0% 1.7%
Spain 400.6 618.6 740.4 -1.5% 4.4% 1.8%
France 499.7 750.7 890.9 0.5% 4.2% 1.7%
Sweden 979.8 1,250.3 1,401.4 -0.5% 2.5% 1.1%
Premium
gasoline
($05/l)
Spain 1.4 2.0 2.1 0.5% 3.8% 0.8%
Germany 1.6 2.1 2.3 -0.2% 2.9% 0.7%
France 1.6 2.2 2.3 0.5% 2.9% 0.7%
United Kingdom 1.7 2.3 2.4 -1.0% 3.0% 0.7%
Sweden 1.7 2.3 2.5 0.6% 3.2% 0.7%
FUTURE PRICES1 2 3
Oil
Enerdata oil projections under Blue Scenario
Note: Maximum values per year are coloured in red and minimum in green
Source: Enerdata Global Energy & CO2 Database, POLES Global energy forecasting model

47
Author Country 2020E 2030E 2040ECAGR
10-20E
CAGR
20-30E
CAGR
30-40E
Enerdata
Oil
Light fuel oil
($05/kl)
Germany 628.0 871.8 1,135.7 -1.6% 3.3% 2.7%
Spain 691.8 929.9 1,187.6 -1.0% 3.0% 2.5%
United Kingdom 672.2 925.6 1,199.8 -2.4% 3.3% 2.6%
France 792.1 1,041.2 1,310.8 -0.4% 2.8% 2.3%
Sweden 1,311.7 1,525.3 1,756.4 -0.8% 1.5% 1.4%
Heavy fuel oil
($05/t)
United Kingdom 399.0 546.4 729.2 -4.8% 3.2% 2.9%
Spain 401.4 574.4 788.9 -1.5% 3.6% 3.2%
Germany 387.1 598.7 861.1 -1.5% 4.5% 3.7%
France 499.9 698.1 943.9 0.5% 3.4% 3.1%
Sweden 937.6 1,095.2 1,290.6 -1.0% 1.6% 1.7%
Premium
gasoline
($05/l)
Spain 1.3 1.4 1.6 -0.2% 1.3% 1.2%
Germany 1.5 1.6 1.8 -1.1% 1.1% 1.0%
France 1.5 1.7 1.9 -0.4% 1.2% 1.1%
United Kingdom 1.6 1.7 1.9 -1.7% 1.1% 1.0%
Sweden 1.6 1.8 2.0 -0.1% 1.1% 1.0%
FUTURE PRICES1 2 3
Oil
Enerdata oil projections under Brown Scenario
Note: Maximum values per year are coloured in red and minimum in green
Source: Enerdata Global Energy & CO2 Database, POLES Global energy forecasting model

48
Author Country 2020E 2030E 2040ECAGR
10-20E
CAGR
20-30E
CAGR
30-40E
Enerdata
Natural Gas
Household
(USc05/kWh)
Spain 6.5 16.8 24.4 0.5% 10.0% 3.8%
France 6.2 18,0 27.2 -0.4% 11.2% 4.2%
UK 6.0 18.6 28.1 0.3% 11.9% 4.2%
Germany 7.0 19.8 29.8 -0.4% 10.9% 4.2%
Sweden 12.4 27.0 37.8 0.2% 8.1% 3.4%
Industry
(USc05/kWh)
UK 3.2 9.5 17.0 1.0% 11.4% 6.0%
Spain 3.2 9.5 17.0 1.4% 11.4% 6.0%
Germany 4.1 11.7 20.7 0.5% 11.0% 5.9%
France 4.7 12.5 21.8 2.7% 10.2% 5.7%
Sweden 5.5 13.3 22.7 0.1% 9.2% 5.5%
Electricity
production
(USc05/kWh)
Germany 3.5 11.1 20.1 1.0% 12.1% 6.2%
Spain 3.5 11.3 20.6 5.3% 12.4% 6.2%
UK 22.1 31.3 31.5 1.6% 3.5% 0.1%
FUTURE PRICES1 2 3
Gas
Enerdata gas projections under Green Scenario
Note: Maximum values per year are coloured in red and minimum in green
Source: Enerdata Global Energy & CO2 Database, POLES Global energy forecasting model

49
Author Country 2020E 2030E 2040ECAGR
10-20E
CAGR
20-30E
CAGR
30-40E
Enerdata
Natural Gas
Household
(USc05/kWh)
France 7.1 11.9 12.7 0.9% 5.3% 0.6%
Spain 7.1 12.0 12.7 1.4% 5.4% 0.6%
UK 6.9 12.3 13.1 1.7% 6.0% 0.6%
Germany 7.9 13.1 14.0 0.8% 5.2% 0.6%
Sweden 12.9 19.0 19.9 0.5% 4.0% 0.4%
Industry
(USc05/kWh)
UK 2.7 4.4 5.0 -0.6% 4.9% 1.2%
Spain 2.8 4.4 5.0 -0.2% 4.9% 1.2%
Germany 3.4 5.3 6.0 -1.4% 4.6% 1.2%
France 4.0 6.0 6.6 1.0% 4.1% 1.1%
Sweden 4.7 6.7 7.4 -1.3% 3.6% 1.0%
Electricity
production
(USc05/kWh)
UK 1.9 3.3 3.8 -2.0% 5.7% 1.4%
Germany 2.8 4.7 5.4 -1.3% 5.4% 1.3%
Spain 2.8 4.7 5.4 2.9% 5.5% 1.3%
FUTURE PRICES1 2 3
Gas
Enerdata gas projections under Blue Scenario
Note: Maximum values per year are coloured in red and minimum in green
Source: Enerdata Global Energy & CO2 Database, POLES Global energy forecasting model

50
Author Country 2020E 2030E 2040ECAGR
10-20E
CAGR
20-30E
CAGR
30-40E
Enerdata
Natural Gas
Household
(USc05/kWh)
UK 5.9 7.0 8.0 0.2% 1.7% 1.3%
France 6.0 7.1 8.0 -0.7% 1.6% 1.2%
Spain 6.7 7.6 8.4 0.8% 1.3% 1.0%
Germany 6.8 8.0 9.0 -0.7% 1.6% 1.2%
Sweden 12.0 13.2 14.2 -0.1% 0.9% 0.7%
Industry
(USc05/kWh)
UK 2.3 3.1 3.9 -2.1% 2.8% 2.4%
Germany 2.8 3.6 4.5 -3.2% 2.5% 2.2%
France 3.5 4.3 5.2 -0.4% 2.1% 1.9%
Sweden 4.3 5.2 6.1 -2.2% 1.7% 1.6%
Spain 4.3 5.2 6.1 -2.2% 1.7% 1.6%
Electricity
production
(USc05/kWh)
UK 1.6 2.2 2.9 -3.9% 3.4% 2.8%
Spain 2.1 2.9 3.8 0.2% 3.3% 2.7%
Germany 2.2 3.0 3.9 -3.6% 3.1% 2.6%
FUTURE PRICES1 2 3
Gas
Enerdata gas projections under Brown Scenario
Note: Maximum values per year are coloured in red and minimum in green
Source: Enerdata Global Energy & CO2 Database, POLES Global energy forecasting model
51
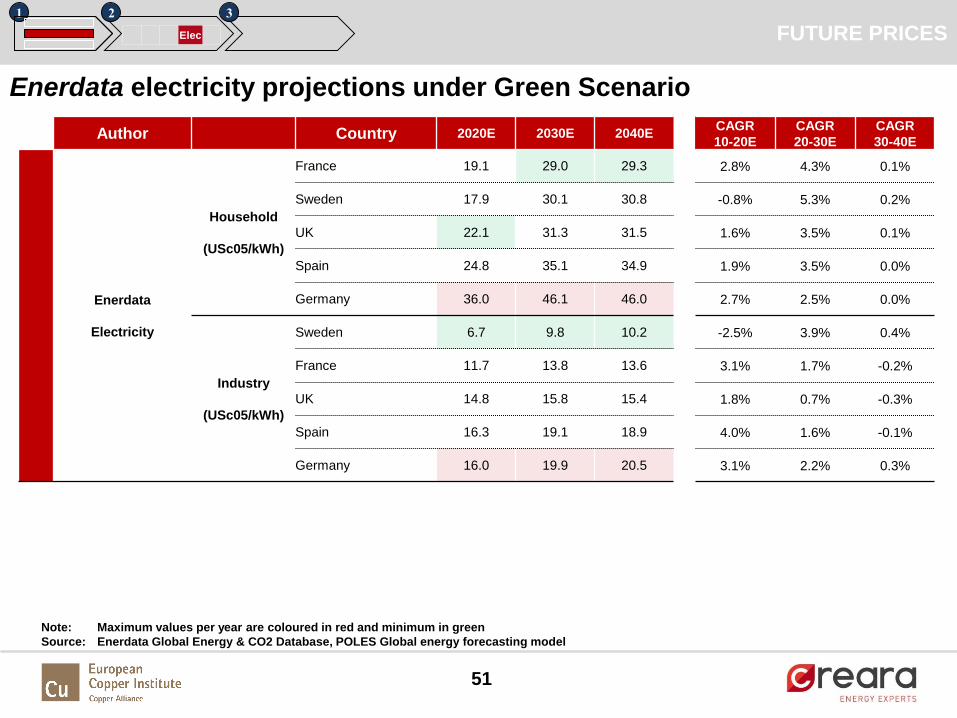
Author Country 2020E 2030E 2040ECAGR
10-20E
CAGR
20-30E
CAGR
30-40E
Enerdata
Electricity
Household
(USc05/kWh)
France 19.1 29.0 29.3 2.8% 4.3% 0.1%
Sweden 17.9 30.1 30.8 -0.8% 5.3% 0.2%
UK 22.1 31.3 31.5 1.6% 3.5% 0.1%
Spain 24.8 35.1 34.9 1.9% 3.5% 0.0%
Germany 36.0 46.1 46.0 2.7% 2.5% 0.0%
Industry
(USc05/kWh)
Sweden 6.7 9.8 10.2 -2.5% 3.9% 0.4%
France 11.7 13.8 13.6 3.1% 1.7% -0.2%
UK 14.8 15.8 15.4 1.8% 0.7% -0.3%
Spain 16.3 19.1 18.9 4.0% 1.6% -0.1%
Germany 16.0 19.9 20.5 3.1% 2.2% 0.3%
FUTURE PRICES1 2 3
Elec
Enerdata electricity projections under Green Scenario
Note: Maximum values per year are coloured in red and minimum in green
Source: Enerdata Global Energy & CO2 Database, POLES Global energy forecasting model

52
Author Country 2020E 2030E 2040ECAGR
10-20E
CAGR
20-30E
CAGR
30-40E
Enerdata
Electricity
Household
(USc05/kWh)
France 20.4 24.7 23.1 3.5% 1.9% -0.7%
Sweden 18.6 24.8 23.4 -0.4% 2.9% -0.6%
UK 22.6 26.7 25.1 1.8% 1.7% -0.6%
Spain 24.8 29.9 28.5 1.9% 1.9% -0.5%
Germany 35.9 40.3 38.6 2.6% 1.2% -0.4%
Industry
(USc05/kWh)
Sweden 6.4 7.7 7.7 -2.9% 1.9% 0.0%
France 11.3 11.8 11.0 2.8% 0.4% -0.7%
UK 14.0 13.1 11.9 1.2% -0.6% -1.0%
Spain 15.7 15.9 14.7 3.6% 0.2% -0.8%
Germany 15.0 15.7 14.8 2.4% 0.5% -0.6%
FUTURE PRICES1 2 3
Elec
Enerdata electricity projections under Blue Scenario
Note: Maximum values per year are coloured in red and minimum in green
Source: Enerdata Global Energy & CO2 Database, POLES Global energy forecasting model

53
Author Country 2020E 2030E 2040ECAGR
10-20E
CAGR
20-30E
CAGR
30-40E
Enerdata
Electricity
Household
(USc05/kWh)
Sweden 16.5 16.1 15.4 -1.6% -0.2% -0.5%
France 17.7 16.8 16.1 2.1% -0.5% -0.5%
UK 20.4 19.8 19.1 0.8% -0.3% -0.4%
Spain 22.7 21.2 20.6 1.0% -0.7% -0.3%
Germany 33.0 32.4 31.7 1.8% -0.2% -0.2%
Industry
(USc05/kWh)
Sweden 6.0 6.4 6.4 -3.6% 0.6% 0.1%
France 10.3 9.6 9.5 1.8% -0.7% -0.1%
UK 12.4 11.3 10.6 0.0% -0.9% -0.7%
Spain 15.1 14.0 13.3 3.2% -0.7% -0.5%
Germany 13.8 13.6 13.6 1.6% -0.1% 0.0%
FUTURE PRICES1 2 3
Elec
Enerdata electricity projections under Brown Scenario
Note: Maximum values per year are coloured in red and minimum in green
Source: Enerdata Global Energy & CO2 Database, POLES Global energy forecasting model
54
INTRODUCTION
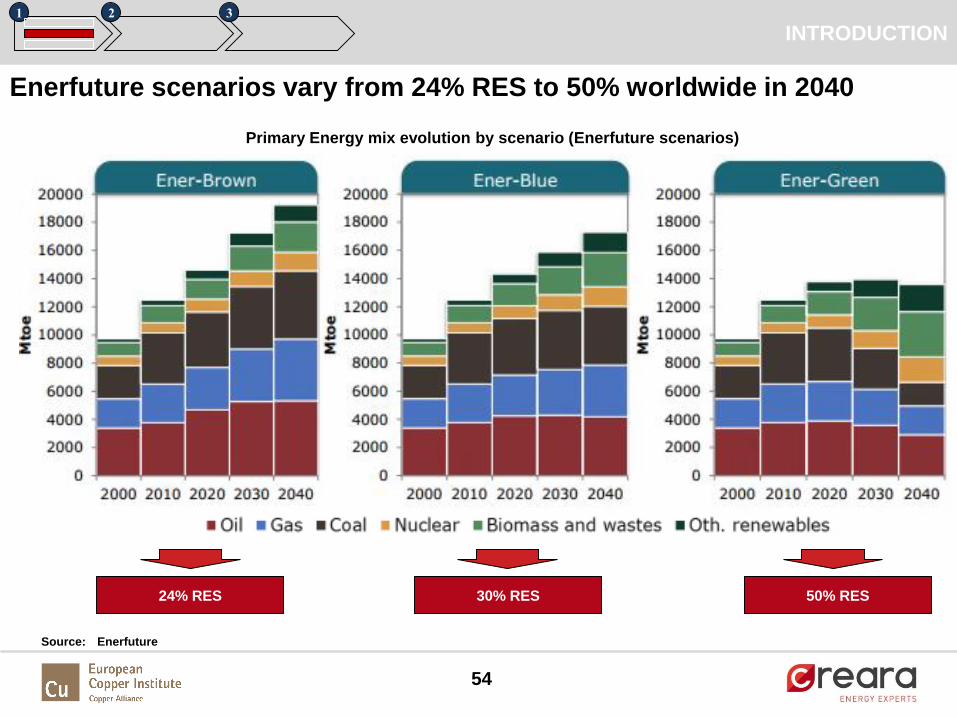
Enerfuture scenarios vary from 24% RES to 50% worldwide in 2040
Source: Enerfuture
1 2 3
24% RES 50% RES30% RES
Primary Energy mix evolution by scenario (Enerfuture scenarios)

55
WEO 2016 was published recently by the IEA and provides an updated
baseline for comparison with the reviewed projections
Source: IEA World Energy Outlook 2016, Chapter 1
1 2 3
• The New Policies Scenario (main scenario)
incorporates existing energy policies as well as an
assessment of the results likely to stem from the
implementation of announced intentions (COP21)
- Assumed that all net-importing regions phase out
fossil-fuel subsidies completely within ten years
• The Current Policies Scenario includes only those
policies firmly enacted as of mid-2016
- Although during the recent period of lower oil prices
many countries have signalled intent to remove
fossil-fuel subsidies, their removal is not assumed in
the Current Policies Scenario unless a formal
programme is already in place
• The 450 Scenario demonstrates a pathway to limit long-
term global warming to 2 °C above preindustrial levels
- All subsidies are removed within ten years in net-
importing regions, and in all net-exporting regions,
except the Middle East, within 20 years
• Another influential policy variation between the
scenarios is the scope and level of carbon pricing
WEO 2016

56
• Policies and market forces underpin the
closure of mines that are unable to recoup
their costs, which leads to a reduction of
excess capacity and supports a balancing
of supply and demand by the early 2020s,
with the profitability of the industry by-and
large restored
• Global coal demand growth of 0.2% per
year, in combination with gradual depletion
of existing mines, partially absorbs
overcapacity and requires investments in
coal supply of $45 billion per year in the
New Policies Scenario
• Geological conditions are worsening, new
mines are deeper or further away from
markets and coal quality is deteriorating;
all of these factors put modest upward
pressure on costs that cannot be fully
offset by productivity gains
• Current exchange rates remain unchanged,
while cyclically low input prices for steel,
tyres and fuel trend upwards in the long
term
WEO 2016 price projections for coal show a recovery from current lows
but long-term values remain below previous highs
Source: IEA World Energy Outlook 2016
1 2 3
Coal WEO 2016

57
The IMF and the World Bank have made projections for commodity prices
where prices for coal and copper can be compared
Source: International Monetary Fund (May 2017); World Bank (April 2017); CREARA Analysis
4.500
4.700
4.900
5.100
5.300
5.500
5.700
5.900
6.100
6.300
0
10
20
30
40
50
60
70
80
90
2016 2017 2018 2019 2020 2021 2022 2023 2024 2025 2026 2027 2028 2029 2030
EU
R /
to
n o
f co
pp
er
EU
R /
to
n o
f co
al
International Monetary Fund & World Bank Projections (Constant USD 2017)
Coal (IMF)
Coal (WB)
Copper (WB)
Copper (IMF)
1 2 3
Coal OTHER SOURCES

58
• Higher demand in the Current
Policies Scenario means a
higher call on oil from costly
fields in non-OPEC countries
• Conversely, in the 450
Scenario, more aggressive
policy action to curb demand
means that a market
equilibrium can be found at a
lower price
WEO 2016 price projections for oil vary widely by scenario, depending on
the level of projected demand
Source: IEA World Energy Outlook 2016
• Assumptions that impact oil demand, include:
- Economic growth; phase out of fossil-fuel consumption subsidies; resilience among some non-OPEC sources of supply to a lower
price environment; commitment by OPEC countries to give priority to market share and to a price that limits substitution away from
oil; ability of the main oil-producing regions to weather the storm of lower hydrocarbon revenues
1 2 3
Oil WEO 2016
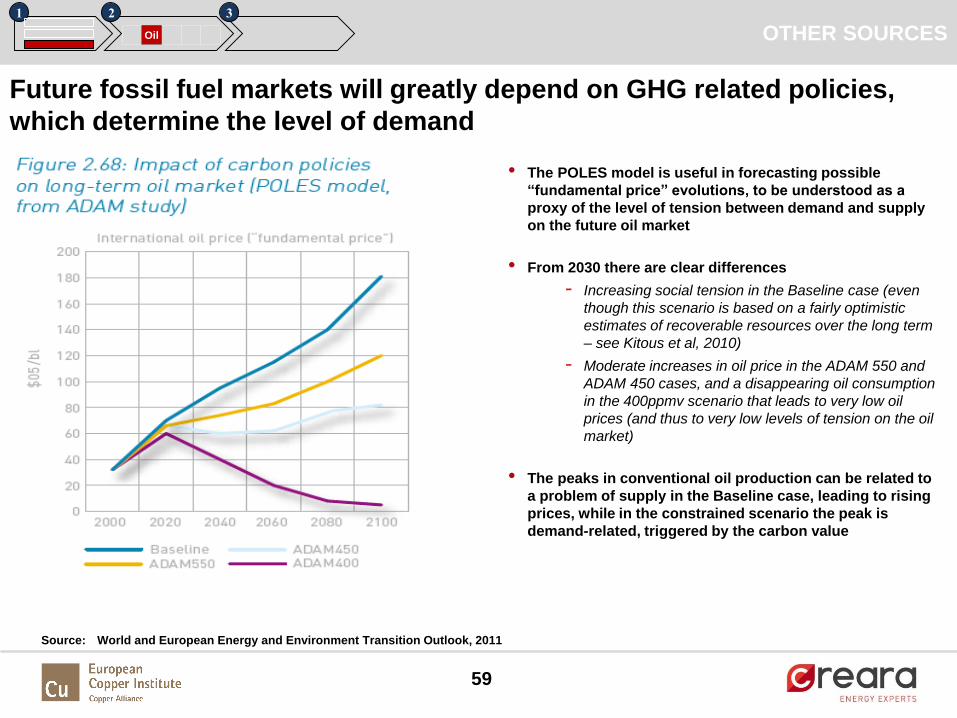
59
• The POLES model is useful in forecasting possible
“fundamental price” evolutions, to be understood as a
proxy of the level of tension between demand and supply
on the future oil market
• From 2030 there are clear differences
- Increasing social tension in the Baseline case (even
though this scenario is based on a fairly optimistic
estimates of recoverable resources over the long term
– see Kitous et al, 2010)
- Moderate increases in oil price in the ADAM 550 and
ADAM 450 cases, and a disappearing oil consumption
in the 400ppmv scenario that leads to very low oil
prices (and thus to very low levels of tension on the oil
market)
• The peaks in conventional oil production can be related to
a problem of supply in the Baseline case, leading to rising
prices, while in the constrained scenario the peak is
demand-related, triggered by the carbon value
Future fossil fuel markets will greatly depend on GHG related policies,
which determine the level of demand
1 2 3
Oil
Source: World and European Energy and Environment Transition Outlook, 2011
OTHER SOURCES
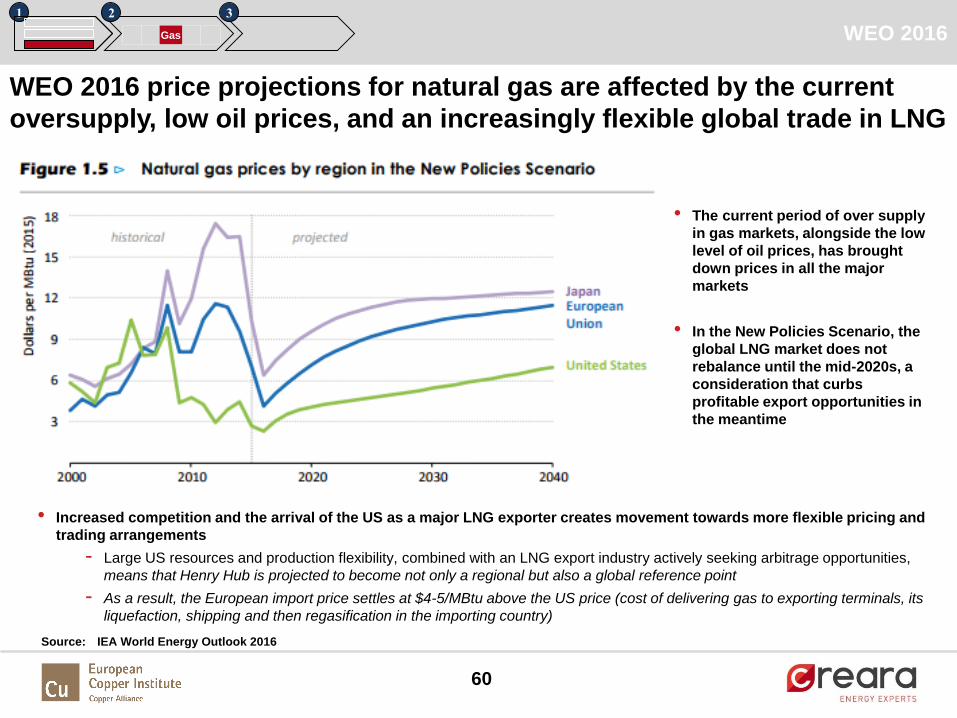
60
• The current period of over supply
in gas markets, alongside the low
level of oil prices, has brought
down prices in all the major
markets
• In the New Policies Scenario, the
global LNG market does not
rebalance until the mid-2020s, a
consideration that curbs
profitable export opportunities in
the meantime
WEO 2016 price projections for natural gas are affected by the current
oversupply, low oil prices, and an increasingly flexible global trade in LNG
Source: IEA World Energy Outlook 2016
• Increased competition and the arrival of the US as a major LNG exporter creates movement towards more flexible pricing and
trading arrangements
- Large US resources and production flexibility, combined with an LNG export industry actively seeking arbitrage opportunities,
means that Henry Hub is projected to become not only a regional but also a global reference point
- As a result, the European import price settles at $4-5/MBtu above the US price (cost of delivering gas to exporting terminals, its
liquefaction, shipping and then regasification in the importing country)
1 2 3
Gas WEO 2016

61
1 2 3
Elec
• Reform of wholesale markets will be necessary if
prices are to rise to the price levels that would allow
for full recovery of fixed variables costs
- Such an increase would result in higher end-user
prices in Europe
• Wholesale prices and future trends vary across the
EU; prices are projected to increase by almost 50%
in the New Policies Scenario
- Current wholesale price levels, of around
$70/MWh, are not sufficient to fully cover the fixed
costs of all power plants in the system
• Electricity prices for industrial consumers in the EU
are expected to increase by another 10% by the end
of 2040
• Residential consumers' expenditure on electricity is
expected to increase by 25% between 2013 and
2040, although prices decline in the long-run, after
peaking in the late 2020s
Source: IEA World Energy Outlook 2014; CREARA Analysis
IEA estimates wholesale electricity and end-user prices will increase
mainly to cover the increasing costs of the energy system
Industrial electricity spending including taxes and savings
New Policies Scenario (2013 and 2040)
WEO 2014
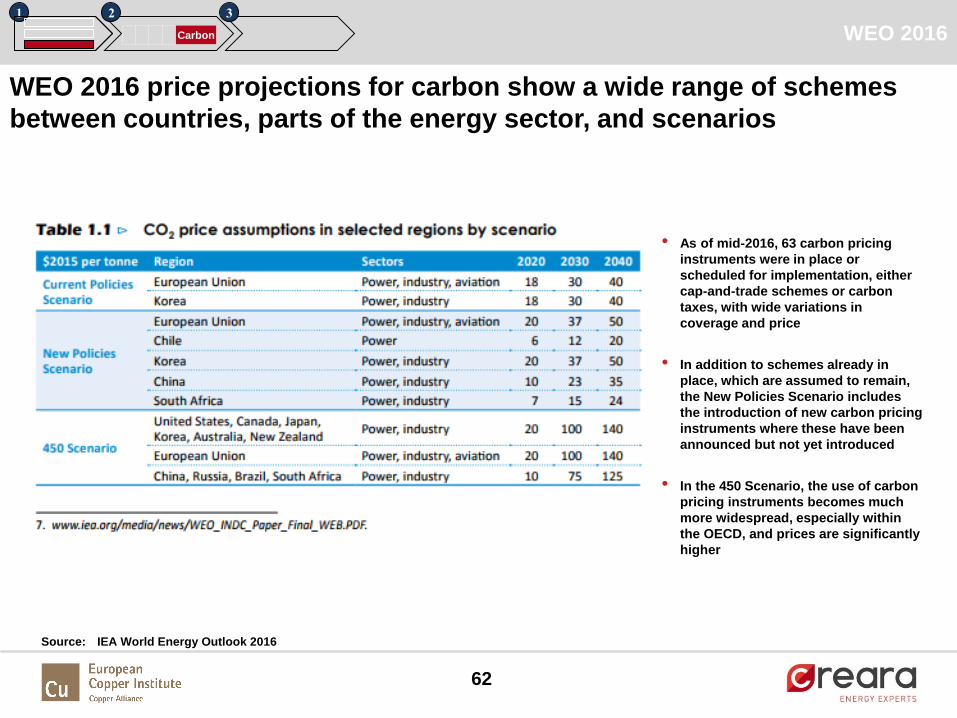
62
• As of mid-2016, 63 carbon pricing
instruments were in place or
scheduled for implementation, either
cap-and-trade schemes or carbon
taxes, with wide variations in
coverage and price
• In addition to schemes already in
place, which are assumed to remain,
the New Policies Scenario includes
the introduction of new carbon pricing
instruments where these have been
announced but not yet introduced
• In the 450 Scenario, the use of carbon
pricing instruments becomes much
more widespread, especially within
the OECD, and prices are significantly
higher
WEO 2016 price projections for carbon show a wide range of schemes
between countries, parts of the energy sector, and scenarios
Source: IEA World Energy Outlook 2016
1 2 3
Carbon WEO 2016

63
Conversion of units
• 1 EUR = 1.1 USD
• 1 GJ = 0.170604 boe
• 1 boe = 0.13642 toe
• 1 toe = 7.3529 bbl
• 1 MWh = 0.6142 boe
• 1 MMBtu = 0.180136 boe
• 1 ton of coal equivalent = 4.79 boe
Abbreviations and Acronyms
• CAGR: Compound Annual Growth Rate
• ETS: European Trading Scheme
• EUR: Euro
• GDP: Gross Domestic Product
• IMF: International Monetary Fund
• LNG: Liquefied Natural Gas
• RES: Renewable Energy Sources
• USD: US dollar
• WB: World Bank
• WEO: World Energy Outlook
Annex
UNITS, ABBREVIATIONS

ESCOConsulting SoftwareEngineering