meta scheduling for market-oriented grid and utility computing
TRANSCRIPT
Meta Scheduling for Market-Oriented Grid and Utility Computing
by
Saurabh Kumar Garg
Submitted in total fulfilment ofthe requirements for the degree of
Doctor of Philosophy
Department of Computer Science and Software EngineeringThe University of Melbourne, Australia
June 2010

Meta Scheduling for Market-Oriented Grid and Utility Computing
Saurabh Kumar Garg
Supervisor: Professor Rajkumar Buyya
Abstract
Grid computing enables the sharing and aggregation of autonomous IT resources todeliver them as computing utilities to end users. The management of the Grid environ-ment is a complex task as resources are geographically distributed, heterogeneous andautonomous in nature, and their users are self-interested. In utility-oriented Grids, usersdefine their application requirements and compete to access the most efficient and cheap-est resources. Traditional resource management systems and algorithms are based onsystem-centric approaches which do not take into account individual requirements andinterests. To this end, market-oriented scheduling is an adequate way to solve the prob-lem. But current market-oriented systems generally, either try to maximise one user’sutility or one provider’s utility. Such approaches fail to solve the problem of contentionfor cheap and efficient resources which may lead to unnecessary delays in job executionand underutilisation of resources.
To address these problems, this thesis proposes a market-oriented meta-schedulercalled “Meta-Broker”, which not only coordinates the resource demand but also allocatesthe best resources to users in terms of monetary and performance costs. The thesis resultsdemonstrate that considerable cost reduction and throughput can be gained by adoptingour proposed approach. The meta-broker has a semi-decentralised architecture, whereonly scheduling decisions are made by the meta-broker while job submission, executionand monitoring are delegated to user and provider middleware.
This thesis also investigates market-oriented meta-scheduling algorithms which aimto maximise the utility of participants. The market-oriented algorithms consider Qual-ity of Service (QoS) requirements of multiple users to map jobs against autonomous andheterogeneous resources. This thesis also presents a novel Grid Market Exchange archi-tecture which provides the flexibility to users in choosing their own negotiation protocolfor resource trading. The key research findings and contributions of this thesis are:
• The consideration of QoS requirements of all users is necessary for maximisingusers’ utility and utilisation of resources. The uncoordinated scheduling of appli-cations by personalised user-brokers leads to overloading of cheap and efficientresources.
• It is important to exploit the heterogeneity between different resource sites/datacenters while scheduling jobs to maximise the provider’s utility. This considerationnot only reduce energy cost of computing infrastructure by 33% on average, butalso enhance the efficiency of resources in terms of carbon emissions.
• By considering both system metrics and market parameters, we can enable more ef-fective scheduling which maximises the utility of both users and resource providers.


This is to certify that
(i) the thesis comprises only my original work,
(ii) due acknowledgement has been made in the text to all other material used,
(iii) the thesis is less than 100,000 words in length, exclusive of table, maps, bibliogra-phies, appendices and footnotes.
Signature
Date

ACKNOWLEDGMENTS
This thesis is the story of a journey throughout which I received help from many people,some of them helped me from outside and others gave me unforgettable internal motiva-tion.
First, I would like to thank my supervisor, Professor Rajkumar Buyya for his intellec-tual guidance and continuous encouragement which ensure the successful completion ofthis thesis. He always gave me freedom to think broadly and deeply into my research. Theregular meetings conducted by him made me work more regularly and systematically. Hisendless amount of energy is really an inspiration for me to do better research.
I am thankful to CLOUDS Lab group members including Srikumar Venugopal, CheeShin Yeo, Marcos Assuncao, Mukaddim Pathan, Marco Netto, Mustafizur Rahman, JamesBroberg, Suraj Pandey, Adam Barker, Christian Vecchiola, William Voorsluys, MohsenAmini, and Rajiv Ranjan for their patience and tolerance in helping me. I am extremelygrateful to Chee Shin, Marco, Srikumar and Marcos for proof-reading, discussion andtheir comments on my work. Their critical comments helped me to improve my writingskills.
I would also like to thank my collaborators: Pramod Kumar Konugurthi (Indian SpaceResearch Organisation, Hyderabad, India), Arun Anandasivam (Universitt Karlsruhe, Ger-many), and Professor Howard Jay Siegel (Colorado State University, USA). I would liketo thank Professor Rao Kotagiri for being my PhD committee member. I am grateful toDr. Jemal Abawajy for going through my thesis and giving many serious comments. Iwould like to thank administrative staff members in the Computer Science and SoftwareEngineering (CSSE) Department especially Pinoo Bharucha for her support and help.
I thank sponsors of the CLOUDS Laboratory, in particular the Australian ResearchCouncil (ARC), and Australian Department of Innovation, Industry, Science and Research(DIISR) for funding the research in this thesis. Along with CLOUDS Lab, the CSSE de-partment and Melbourne University provide the infrastructure for my research and travelsupport to international conferences.
I would like to thank my friends particularly Chee Shin and XiaoFeng for toleratingmy long discussions on all type of topics. I am immensely grateful to my teachers fortheir exemplary lives which always inspired me to become a responsible genuine intel-lectual. Last but never the least, I would like to thank my family for their love, patienceand support at all times. Every week, my mother used to ask me when I will complete thethesis and visit home.
Saurabh Kumar GargMelbourne, AustraliaOctober 2010.
v

CONTENTS
1 Introduction 11.1 Grid and Utility Computing . . . . . . . . . . . . . . . . . . . . . . . . . 21.2 Limitations of Existing Scheduling Mechanisms . . . . . . . . . . . . . . 31.3 Problem Statement and Objectives . . . . . . . . . . . . . . . . . . . . . 51.4 Proposed Solution . . . . . . . . . . . . . . . . . . . . . . . . . . . . . . 61.5 Thesis Contributions . . . . . . . . . . . . . . . . . . . . . . . . . . . . 81.6 Thesis Organisation . . . . . . . . . . . . . . . . . . . . . . . . . . . . . 9
2 Taxonomy of Market-Oriented Scheduling Mechanisms 132.1 Overview of Utility Grids and Preliminaries . . . . . . . . . . . . . . . . 132.2 Requirements . . . . . . . . . . . . . . . . . . . . . . . . . . . . . . . . 14
2.2.1 Consumer Requirements . . . . . . . . . . . . . . . . . . . . . . 152.2.2 Resource Provider Requirements . . . . . . . . . . . . . . . . . . 162.2.3 Market Exchange (ME) Requirements . . . . . . . . . . . . . . . 17
2.3 Utility Grid Infrastructural Components . . . . . . . . . . . . . . . . . . 192.4 Taxonomy of Market-Oriented Scheduling . . . . . . . . . . . . . . . . . 21
2.4.1 Market Model . . . . . . . . . . . . . . . . . . . . . . . . . . . . 212.4.2 Allocation Decision . . . . . . . . . . . . . . . . . . . . . . . . 262.4.3 Participant Focus . . . . . . . . . . . . . . . . . . . . . . . . . . 262.4.4 Application Type . . . . . . . . . . . . . . . . . . . . . . . . . . 272.4.5 Allocation Objective . . . . . . . . . . . . . . . . . . . . . . . . 27
2.5 Survey of Grid Resource Management Systems . . . . . . . . . . . . . . 282.5.1 Survey of Market-Oriented Systems . . . . . . . . . . . . . . . . 282.5.2 System-Oriented Schedulers . . . . . . . . . . . . . . . . . . . . 36
2.6 Discussion and Gap analysis . . . . . . . . . . . . . . . . . . . . . . . . 412.6.1 Scheduling Mechanisms . . . . . . . . . . . . . . . . . . . . . . 422.6.2 Market-Oriented Systems . . . . . . . . . . . . . . . . . . . . . 43
2.7 Summary . . . . . . . . . . . . . . . . . . . . . . . . . . . . . . . . . . 44
3 Market-Oriented Meta-Scheduler Architecture 453.1 Motivation . . . . . . . . . . . . . . . . . . . . . . . . . . . . . . . . . . 453.2 Meta-Broker Architecture . . . . . . . . . . . . . . . . . . . . . . . . . . 45
3.2.1 Architectural Components . . . . . . . . . . . . . . . . . . . . . 463.3 Resource Allocation by the Meta-Broker . . . . . . . . . . . . . . . . . . 503.4 Meta-Broker’s Internal Control Flow . . . . . . . . . . . . . . . . . . . . 503.5 Comparison between Personalised and Meta-Broker . . . . . . . . . . . . 513.6 Performance Results . . . . . . . . . . . . . . . . . . . . . . . . . . . . 533.7 Summary . . . . . . . . . . . . . . . . . . . . . . . . . . . . . . . . . . 54
vii
4 Meta-Scheduling to Minimise User Spending 554.1 Problem Definition . . . . . . . . . . . . . . . . . . . . . . . . . . . . . 55
4.1.1 Problem Formulation . . . . . . . . . . . . . . . . . . . . . . . . 564.2 Proposed Algorithms . . . . . . . . . . . . . . . . . . . . . . . . . . . . 57
4.2.1 Linear Programming-based Algorithm for Scheduling MGN Jobs 574.2.2 Linear Programming-based Algorithm for Scheduling SGN Jobs . 58
4.3 Performance Evaluation . . . . . . . . . . . . . . . . . . . . . . . . . . . 624.3.1 Simulation Methodology . . . . . . . . . . . . . . . . . . . . . . 624.3.2 Performance Results . . . . . . . . . . . . . . . . . . . . . . . . 65
4.4 Related Work . . . . . . . . . . . . . . . . . . . . . . . . . . . . . . . . 684.5 Summary . . . . . . . . . . . . . . . . . . . . . . . . . . . . . . . . . . 69
5 Meta-Scheduling to Minimise Time and Cost for Users 715.1 Motivation . . . . . . . . . . . . . . . . . . . . . . . . . . . . . . . . . . 715.2 Meta-Broker System . . . . . . . . . . . . . . . . . . . . . . . . . . . . 715.3 Meta-Scheduling Algorithms . . . . . . . . . . . . . . . . . . . . . . . . 72
5.3.1 Problem Statement . . . . . . . . . . . . . . . . . . . . . . . . . 725.3.2 Min-Min Cost Time Trade-off (MinCTT) Heuristics . . . . . . . 745.3.3 Max-Min Cost Time Trade-off (MaxCTT Heuristics) . . . . . . . 745.3.4 Sufferage Cost Time Tradeoff (SuffCTT Heuristics) . . . . . . . 755.3.5 Time Complexity . . . . . . . . . . . . . . . . . . . . . . . . . . 75
5.4 Simulation Setup . . . . . . . . . . . . . . . . . . . . . . . . . . . . . . 765.5 Analysis of Results . . . . . . . . . . . . . . . . . . . . . . . . . . . . . 79
5.5.1 CASE 1: Trade-off Factor Set by Meta-broker . . . . . . . . . . . 795.5.2 CASE 2: Trade-off Factor Set by User . . . . . . . . . . . . . . . 81
5.6 Related Work . . . . . . . . . . . . . . . . . . . . . . . . . . . . . . . . 865.7 Summary . . . . . . . . . . . . . . . . . . . . . . . . . . . . . . . . . . 88
6 Meta-Scheduling to Maximise Provider’s Utility 916.1 Motivation . . . . . . . . . . . . . . . . . . . . . . . . . . . . . . . . . . 916.2 Meta-scheduling Model . . . . . . . . . . . . . . . . . . . . . . . . . . . 93
6.2.1 Data Center Energy Model . . . . . . . . . . . . . . . . . . . . . 946.2.2 Relation between Execution Time and CPU Frequency . . . . . . 966.2.3 Problem Description . . . . . . . . . . . . . . . . . . . . . . . . 96
6.3 Meta-Scheduling Policies . . . . . . . . . . . . . . . . . . . . . . . . . . 996.3.1 Mapping Phase (Across Many Data Centers) . . . . . . . . . . . 996.3.2 Scheduling Phase (Within a Data Center) . . . . . . . . . . . . . 1016.3.3 Lower Bound and Upper Bound . . . . . . . . . . . . . . . . . . 102
6.4 Performance Evaluation . . . . . . . . . . . . . . . . . . . . . . . . . . . 1046.5 Analysis of Results . . . . . . . . . . . . . . . . . . . . . . . . . . . . . 107
6.5.1 Evaluation without Data Transfer Cost . . . . . . . . . . . . . . . 1076.5.2 Evaluation with Data Transfer Cost . . . . . . . . . . . . . . . . 116
6.6 Summary . . . . . . . . . . . . . . . . . . . . . . . . . . . . . . . . . . 118
7 Meta-Scheduling to Enhance All Grid Players’ Utility 1217.1 Motivation . . . . . . . . . . . . . . . . . . . . . . . . . . . . . . . . . . 1217.2 System Model . . . . . . . . . . . . . . . . . . . . . . . . . . . . . . . . 1227.3 Double Auction-Inspired Meta-scheduling (DAM) . . . . . . . . . . . . 122
7.3.1 Valuation Mechanism . . . . . . . . . . . . . . . . . . . . . . . . 1247.3.2 The Meta-Scheduling Algorithm . . . . . . . . . . . . . . . . . . 1267.3.3 Queueing Theory Based Model for Meta-scheduling . . . . . . . 128
7.4 Performance Evaluation . . . . . . . . . . . . . . . . . . . . . . . . . . . 1347.4.1 Experimental Configuration . . . . . . . . . . . . . . . . . . . . 1347.4.2 Analysis of Results . . . . . . . . . . . . . . . . . . . . . . . . . 137
7.5 Summary . . . . . . . . . . . . . . . . . . . . . . . . . . . . . . . . . . 142
8 Market Exchange and Meta-Broker Implementation 1438.1 Motivation . . . . . . . . . . . . . . . . . . . . . . . . . . . . . . . . . . 1438.2 Market Exchange Requirements . . . . . . . . . . . . . . . . . . . . . . 144
8.2.1 Infrastructure Requirements . . . . . . . . . . . . . . . . . . . . 1448.2.2 Market Requirements . . . . . . . . . . . . . . . . . . . . . . . . 145
8.3 Mandi Architecture and Design . . . . . . . . . . . . . . . . . . . . . . . 1468.3.1 Design Considerations and Solutions . . . . . . . . . . . . . . . 1468.3.2 Architectural Components . . . . . . . . . . . . . . . . . . . . . 1478.3.3 High Level Description . . . . . . . . . . . . . . . . . . . . . . . 1498.3.4 User Interaction Phases . . . . . . . . . . . . . . . . . . . . . . . 1508.3.5 Implementation Details . . . . . . . . . . . . . . . . . . . . . . . 151
8.4 Prototype and Performance Evaluation . . . . . . . . . . . . . . . . . . . 1558.4.1 System Details . . . . . . . . . . . . . . . . . . . . . . . . . . . 1568.4.2 Performance Evaluation . . . . . . . . . . . . . . . . . . . . . . 1568.4.3 Discussion . . . . . . . . . . . . . . . . . . . . . . . . . . . . . 159
8.5 Summary . . . . . . . . . . . . . . . . . . . . . . . . . . . . . . . . . . 160
9 Conclusions and Future Directions 1619.1 Summary . . . . . . . . . . . . . . . . . . . . . . . . . . . . . . . . . . 1619.2 Lessons Learned and Significance . . . . . . . . . . . . . . . . . . . . . 1629.3 Future Directions . . . . . . . . . . . . . . . . . . . . . . . . . . . . . . 165
9.3.1 Resources with Different Pricing Models . . . . . . . . . . . . . 1659.3.2 Scheduling with Pre-emption . . . . . . . . . . . . . . . . . . . . 1659.3.3 Network and Data-Aware Application Meta-scheduling . . . . . . 1669.3.4 SLA based Meta-Scheduling in Cloud Computing Environments . 1669.3.5 Energy-efficient Meta-Scheduling . . . . . . . . . . . . . . . . . 1669.3.6 Scalable Meta-Broker Architecture . . . . . . . . . . . . . . . . 1679.3.7 Mixed Application Model with QoS Requirements . . . . . . . . 167
References 168

LIST OF FIGURES
1.1 A view of market-oriented Grid pushing Grid into mainstream computing 31.2 Market-Oriented Meta-Scheduling Scenario . . . . . . . . . . . . . . . . 71.3 Thesis Organisation . . . . . . . . . . . . . . . . . . . . . . . . . . . . . 10
2.1 A Grid Market Exchange Managing Self-Interested Entities (Providersand Consumers) . . . . . . . . . . . . . . . . . . . . . . . . . . . . . . 14
2.2 Utility Grid Component . . . . . . . . . . . . . . . . . . . . . . . . . . . 202.3 Taxonomy of Market-based Mechanisms . . . . . . . . . . . . . . . . . . 22
3.1 Meta-Broker Architectural Components . . . . . . . . . . . . . . . . . . 463.2 Bag-of-Task Application Scheduling . . . . . . . . . . . . . . . . . . . . 483.3 Parallel Application Scheduling . . . . . . . . . . . . . . . . . . . . . . 483.4 Meta-Broker Protocol . . . . . . . . . . . . . . . . . . . . . . . . . . . . 513.5 Effect of Tight Deadline on Users . . . . . . . . . . . . . . . . . . . . . 523.6 Effect of Medium Deadline on Users . . . . . . . . . . . . . . . . . . . . 533.7 Effect of Relax Deadline on Users . . . . . . . . . . . . . . . . . . . . . 53
4.1 Effect on User Applications with Tight Deadline . . . . . . . . . . . . . . 664.2 Effect on User Applications with Medium Deadline . . . . . . . . . . . . 664.3 Effect on User applications with Relaxed Deadline . . . . . . . . . . . . 674.4 Comparison of Number of Iterations in HGA and LPGA . . . . . . . . . 67
5.1 Overall Average Cost of Execution . . . . . . . . . . . . . . . . . . . . . 795.2 Overall Makespan . . . . . . . . . . . . . . . . . . . . . . . . . . . . . . 805.3 Different ETC and Resource Pricing Configurations . . . . . . . . . . . 825.4 User Application Distribution on Resources in Different Configurations . 845.5 Effect of Scheduling Interval in HICC Configuration . . . . . . . . . . . 855.6 Effect of DTC on Cost and Time . . . . . . . . . . . . . . . . . . . . . . 855.7 Effect of Change in Application Submitted on Cost . . . . . . . . . . . . 865.8 Effect of Change in Application Submitted on Overall Makespan . . . . . 87
6.1 Computer Power Consumption Index (Source: [73]) . . . . . . . . . . . . 926.2 Effect of Mapping Policy and DVS . . . . . . . . . . . . . . . . . . . . . 1086.3 Exploiting Local Minima in DVS . . . . . . . . . . . . . . . . . . . . . . 1106.4 Comparison of Lower Bound and Upper Bound . . . . . . . . . . . . . . 1116.5 Impact of Urgency and Arrival Rate of Applications . . . . . . . . . . . . 1126.6 Impact of Carbon Emission Rate . . . . . . . . . . . . . . . . . . . . . . 1136.7 Impact of Electricity Price . . . . . . . . . . . . . . . . . . . . . . . . . 1156.8 Impact of Data Center Efficiency . . . . . . . . . . . . . . . . . . . . . . 1166.9 Impact of Data Transfer Cost . . . . . . . . . . . . . . . . . . . . . . . . 117
7.1 Double Auction based Meta-Scheduling Protocol . . . . . . . . . . . . . 123
xi
7.2 Comparison of Multiplicative and Additive forms of Valuation Metrics . . 1257.3 Available Queue Slots . . . . . . . . . . . . . . . . . . . . . . . . . . . . 1267.4 Queuing Theory View of Meta-scheduling . . . . . . . . . . . . . . . . . 1297.5 Comparison of DAM with analytical results . . . . . . . . . . . . . . . . 1377.6 Benefit for Users . . . . . . . . . . . . . . . . . . . . . . . . . . . . . . 1397.7 Variation in Load across Resources . . . . . . . . . . . . . . . . . . . . . 141
8.1 Mandi Architecture . . . . . . . . . . . . . . . . . . . . . . . . . . . . . 1488.2 Mandi Class Design Diagram . . . . . . . . . . . . . . . . . . . . . . . . 1528.3 Registration Process . . . . . . . . . . . . . . . . . . . . . . . . . . . . . 1548.4 Scheduling Sequence . . . . . . . . . . . . . . . . . . . . . . . . . . . . 1548.5 Reservation Process . . . . . . . . . . . . . . . . . . . . . . . . . . . . . 1558.6 The Topology of Testbed . . . . . . . . . . . . . . . . . . . . . . . . . . 1578.7 Performance of Mandi for 50,000 clearance requests . . . . . . . . . . . 158
LIST OF TABLES
2.1 Market-Oriented Scheduling Systems . . . . . . . . . . . . . . . . . . . 322.2 System-Oriented Schedulers . . . . . . . . . . . . . . . . . . . . . . . . 39
4.1 Total Cost Spent by Users for MGN Jobs . . . . . . . . . . . . . . . . . . 65
5.1 Lublin Workload Model Parameter Values . . . . . . . . . . . . . . . . . 775.2 Simulated EDG Testbed Resources. . . . . . . . . . . . . . . . . . . . . 77
6.1 Comparison of Related Work . . . . . . . . . . . . . . . . . . . . . . . . 936.2 Parameters of a Data Center i . . . . . . . . . . . . . . . . . . . . . . . . 966.3 Characteristics of Data Centers . . . . . . . . . . . . . . . . . . . . . . . 1056.4 Summary of Heuristics with Comparison Results . . . . . . . . . . . . . 118
7.1 Workload Characteristics . . . . . . . . . . . . . . . . . . . . . . . . . . 1357.2 Simulated EDG Testbed Resources . . . . . . . . . . . . . . . . . . . . . 136
8.1 Overhead due to Interactions of Mandi . . . . . . . . . . . . . . . . . . . 159
xiii

Chapter 1
Introduction
“As of now, computer networks are still in their infancy, but as they grow up and becomesophisticated, we will probably see the spread of computer utilities, which, like presentelectric and telephone utilities, will service individual homes and offices across the coun-try”.(Kleinrock 1969)
In 1969, Leonard Kleinrock, the chief scientist of the original Advanced ResearchProject Agency (ARPA) project, predicted that the use of computer networks would be sowide spread that computing would be used as a “utility” [99]. From 1969 till today, In-formation and Communication Technology (ICT) has made key advances in various areasto make this vision a reality [27]. The advances in high performance processors (such asmulti-core technology) and networked computing environments have transformed com-puting to a model consisting of services that can be commoditised and delivered in amanner similar to utilities such as water, electricity, gas, and telephony [26]. In the utilitymodel, users can access services on-demand based on their requirements, without regardto where the services are hosted.
The utility computing model can offer great opportunities and benefits to InformationTechnology (IT) users [65]. The most prominent advantage of the utility computing is thereduction of IT-related operational costs and complexities. Users from different domains,such as health care, life sciences, software development, digital media, manufacturingand petroleum, no longer need to invest heavily or encounter difficulties in building andmaintaining IT infrastructure. Furthermore, the utility computing can benefit many smallbusinesses, which lack the working capital to purchase IT infrastructure required to meettheir business objectives. Hence, instead of maintaining expensive infrastructure them-selves, companies will be able to submit their tasks to utility computing providers. Inshort, utility computing promises to provide businesses with greater flexibility and re-silience, and at the same time, more efficient utilisation of resources at lower operatingand maintenance costs.
1
2 Chapter 1. INTRODUCTION
Many computing paradigms [27] such as the Web, Data Centers, Service Comput-ing/Web Services, Grid Computing, P2P Computing and Cloud Computing have emergedto support such a utility model for IT services. Among these, Grid computing is one ofthe most promising paradigms, which can supply computing as a utility, and thus providean on-demand service. Grids enable the sharing, selection, and aggregation of a widevariety of autonomous and geographically distributed resources including supercomput-ers, storage systems, data sources, and specialised devices. However, the management ofresources and applications; scheduling in such a large-scale distributed environment is acomplex undertaking. Grid users and resource providers have different goals, objectives,strategies, and requirements, which need to be matched. Therefore, this thesis addressesthese resource management challenges in Grids using market-oriented approach.
In the following section, a brief introduction to Grid computing is presented, describ-ing the motivation and challenges, in the context of resource allocation, that lead to theevolution of utility-oriented Grids. The resource allocation in utility Grids will be dis-cussed by identifying gaps in the existing research. In the end of this chapter, the corecontributions of this thesis are summarised and an outline of its organisation is presented.
1.1 Grid and Utility Computing
Grid computing infrastructure promises to provide us with the ability to dynamicallylink together resources, as an ensemble to support the execution of large-scale, resource-intensive, and distributed applications in science, engineering, and commerce [65]. Thus,it offers a common, shared platform on which applications can be executed in a flexi-ble way, facilitating more effective utilisation of computing resources across conventionalorganisational and data center boundaries. Furthermore, this platform can be easily man-aged and dynamically scaled using new on-demand utility services provided by a rangeof industry suppliers [22]. The distributed infrastructure, such as TeraGrid [29] and LHC-Grid [82], are the examples of Grids that are deployed around the world in both academicand commercial settings.
The widespread interest in Grid computing from commercial organisations in recenttimes is pushing it towards the mainstream, thus enhancing Grid services and enablingthem to become valuable economic commodities. Most of the leading IT service compa-nies have announced initiatives in the area of utility computing services under differentbusiness names. For example, Sun Microsoft has proposed the “Sun Grid Engine” [71],while IBM is offering “On-demand business” [81]. Many Resource Management Sys-tems (RMSs) and meta-schedulers, such as GridWay [85] and Gridbus broker [163], havebeen extended to include market-oriented scheduling and resource allocation, and thuscontributing to the advancement of utility Grids.
1.2. LIMITATIONS OF EXISTING SCHEDULING MECHANISMS 3
The utility Grid environment can be considered as a market where competition occursbetween both consumers and providers. The main participants of this market are:
• Resource consumers who have varying resource requirements to run applications.
• Resource providers who lease resources such as CPUs and storage on-demand, inexchange for some reward.
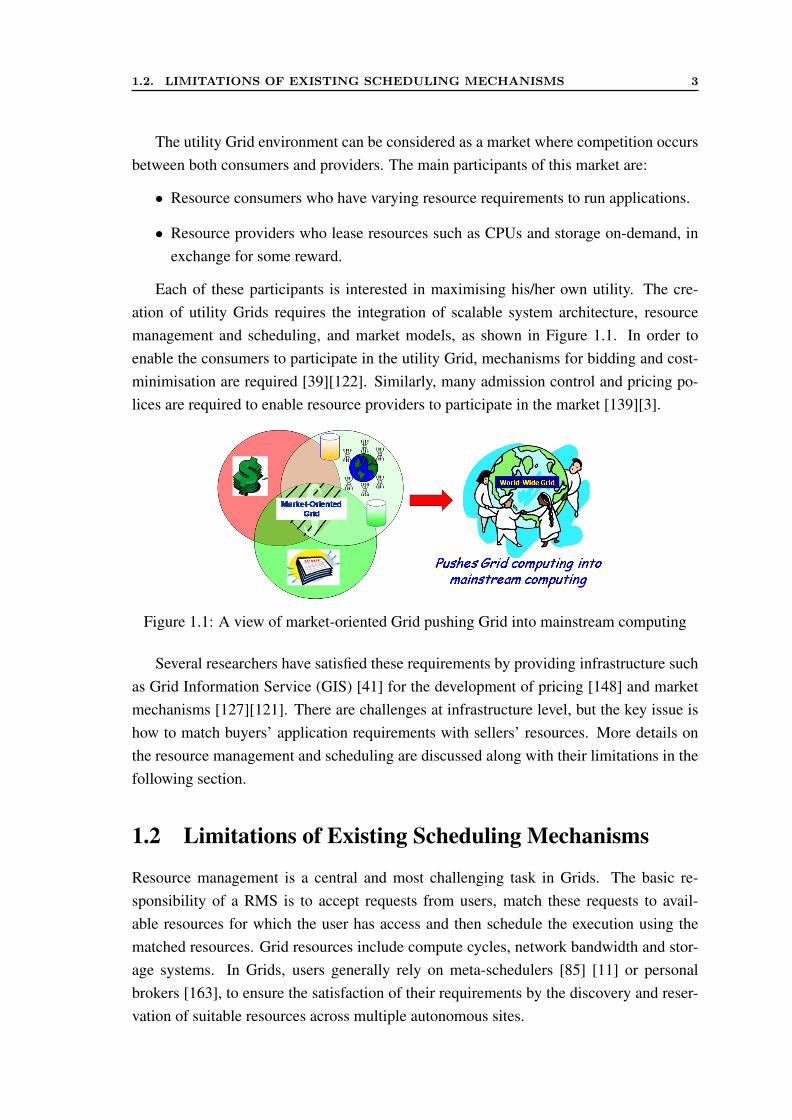
Each of these participants is interested in maximising his/her own utility. The cre-ation of utility Grids requires the integration of scalable system architecture, resourcemanagement and scheduling, and market models, as shown in Figure 1.1. In order toenable the consumers to participate in the utility Grid, mechanisms for bidding and cost-minimisation are required [39][122]. Similarly, many admission control and pricing po-lices are required to enable resource providers to participate in the market [139][3].
Figure 1.1: A view of market-oriented Grid pushing Grid into mainstream computing
Several researchers have satisfied these requirements by providing infrastructure suchas Grid Information Service (GIS) [41] for the development of pricing [148] and marketmechanisms [127][121]. There are challenges at infrastructure level, but the key issue ishow to match buyers’ application requirements with sellers’ resources. More details onthe resource management and scheduling are discussed along with their limitations in thefollowing section.
1.2 Limitations of Existing Scheduling Mechanisms
Resource management is a central and most challenging task in Grids. The basic re-sponsibility of a RMS is to accept requests from users, match these requests to avail-able resources for which the user has access and then schedule the execution using thematched resources. Grid resources include compute cycles, network bandwidth and stor-age systems. In Grids, users generally rely on meta-schedulers [85] [11] or personalbrokers [163], to ensure the satisfaction of their requirements by the discovery and reser-vation of suitable resources across multiple autonomous sites.
4 Chapter 1. INTRODUCTION
The efficient resource management and scheduling in Grids continue to be a complexand difficult undertaking [22]. One of the problems is dealing with geographically dis-tributed autonomous resources with different usage policies, cost models, varying loads,and availability patterns. The Grid service providers (resource owners) and consumers(resource users) have different goals, objectives, strategies, and requirements. Resourcesharing becomes further complicated in utility Grids due to the self-interested nature ofusers. The traditional resource management techniques for Grids focus on system-centricmetrics such as maximising throughput, minimising mean waiting time and slowdown. Incontrast, most of these resource management techniques need to be extended to includethe competitive nature of participants with conflicting Quality of Service (QoS) require-ments in utility Grids.
The participants in a utility Grid are more interested in maximising their profit ratherthan optimising performance metrics such as global resource utilisation, without receivingany direct reward [16]. Thus, in a shared infrastructure such as Grids, the self-interestednature of users can lead to problems, such as “Tragedy of Commons” [77], where everyuser acquires as many resources as possible because there is no incentive for users to backoff during times of high demand. The self-interested users, in turn, over exploit the serviceby degrading the system’s ability to deliver the required service to all users. Therefore,in Grids, resource management and scheduling need to be market-oriented, which canregulate the supply and demand of resources at peak usage time. The resource managersand schedulers should also provide feedback in terms of economic incentives for bothGrid consumers and providers, and promote QoS-based resource allocation mechanismsthat differentiate resource requests based on their utilities.
In order to meet the above requirements, most researchers have proposed either mech-anisms considering a one-sided market (involving one provider or consumer) such asVickery, First Price and Second Price auction [16]; or a two-sided market (involving mul-tiple providers and consumers) such as Double auction. Most of these mechanisms areinspired by the trading methodologies used in the real world markets [21], for instance,auction mechanisms. The one-sided markets mostly aim to maximise the utility of oneparticipant, while the two-sided mechanisms aim to maximise the utility of both partici-pants (i.e. consumers and providers).
The one-sided mechanisms overcome many limitations of traditional scheduling ap-proaches by making users pay for their usage, but there are many unresolved issues in thisapproach. In general, the one-sided markets favour monopolistic sellers or monopolisticbuyers. They assume a completely decentralised system where each user can negotiatewith any provider on a one-to-one basis. With respect to the applicability of markets inGrids, Nakai et a. [117] have pointed out that a completely decentralised system is infea-sible, and can lead to inefficiency and even underutilisation of resources. The competition
1.3. PROBLEM STATEMENT AND OBJECTIVES 5
among concurrent users with different requirements can exacerbate the contention for ef-ficient and cheap resources. This contention can cause long delays in the scheduling ofuser applications.
To overcome these shortcomings, market-based mechanisms such as proportional share[104] have been proposed to allocate resources to bidders (Grid users) on the basis of rel-ative share. While these approaches distribute resources fairly and reduce the responsetime, they limit the ability of customers to express fine-grained preferences. Moreover,these mechanisms can only be applied within a single resource site. In addition, theself-interested and strategic nature of users makes the valuation of their requirements andresources a challenging task.
Market mechanisms, such as combinatorial [179] and Double auction [92], have beenproposed to match multiple users and providers in order to maximise utility of all partici-pants. However, the practical usage of these mechanisms has remained limited since theyselect the auction winner based on user valuations (bids). This can lead to the starvation oflow budget user applications, and thus monopolisation of the market by the rich users. Theproblem is critical since one user can buy all of the efficient resources, therefore resultingin a scarcity of resources for other users. Furthermore, since the major commercial re-source providers, such as Amazon [6] and Sun [71], have adopted the commodity marketmodel, these auction mechanisms cannot be applied practically in the current scenario.
Existing mechanisms [25][174][88] in the context of commodity markets also allo-cate resources without taking into account the effect of one user’s requirements on otherusers. Therefore, these mechanisms also end up in similar problems, where one acceptedtransaction can affect more than just the immediate resource consumer or provider.
Thus, in order to schedule applications from competitive users while maximisingtheir utility, this thesis proposes a market-oriented meta-scheduler and mechanisms forefficient, coordinated and cost-effective allocation of distributed computational Grid re-sources, especially in the commodity market.
1.3 Problem Statement and Objectives
This thesis focuses on the following problem:
Designing algorithms for efficient and cost-effective scheduling of multiple applica-tions from competing users in utility Grids to distributed and heterogeneous resourcesunder different autonomous administrative domains.
The previous section discussed many challenges in designing mechanisms which en-sure efficient usage of available resources, and satisfy the requirements of multiple users.First, users, through their personalised brokers [163], compete for cheap and efficient re-sources, which can lead to disproportionate distribution of load. Moreover, Grid resources
6 Chapter 1. INTRODUCTION
are typically controlled within self-interested autonomous administrative domains. Thus,the conflict of interests between users and providers is inevitable. This conflict betweencompeting parties needs to be reconciled in order to maximise the utility of all the partic-ipants. Other than heterogeneity at the resource level, the challenge from the users is tomeet their complex requirements, which include both monetary and performance costs.Finally, this is a combinatorial resource allocation problem which is well-known to be NP-hard [118]. Therefore, in order to handle the resource demands from competing users, therequirements of both users and resource providers need to be considered, when designingefficient and cost-effective scheduling mechanisms.
Based on the issues described above, we identified the following objectives:
• To investigate the architectural model for market-oriented meta-scheduler to coor-dinate resource demands.
• To design meta-scheduling algorithms and mechanisms that can reconcile resourcedemands from users with conflicting requirements.
• To investigate how to reduce the impact on the utiity of all participants, while con-sidering other system-centric metrics such as response time.
1.4 Proposed Solution
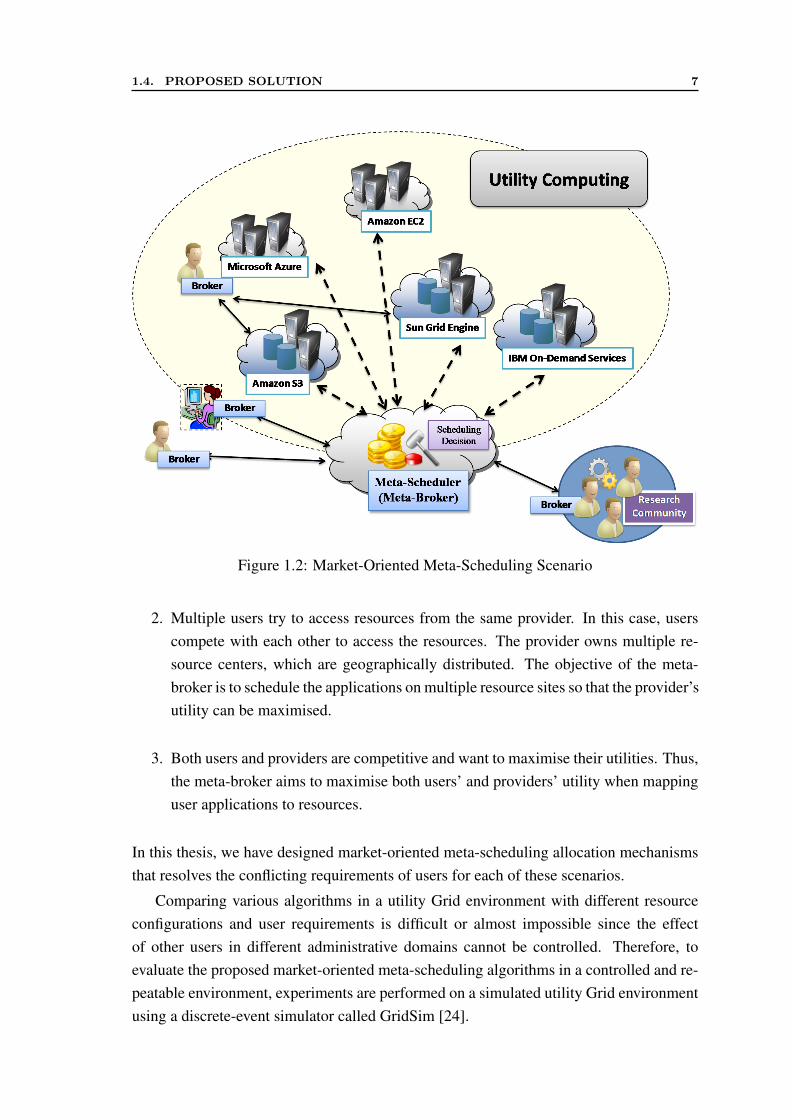
To solve the problem of allocating resources to competing users, this thesis proposesa market-oriented meta-scheduler called “Meta-Broker”, which coordinates the resourcedemand from users. The meta-broker facilitates the scheduling of multiple applications ondistributed autonomous resources using market-oriented techniques. To enable this, themeta-broker (Figure 1.2) periodically interacts with user brokers and local schedulers ofresource sites. The meta-broker acts as a matchmaker, an information provider, a coordi-nator, negotiator and aggregator. Its goal is to maximise the utilities of the participants i.e.users and resource providers. The key difference between the architecture of meta-brokerand meta-schedulers such as GridWay [85] is that the meta-broker only deals with match-making of jobs and resources, while the actual job submission is done by user brokers.In terms of scheduling mechanisms, the key difference is that the meta-broker considersboth monetary and performance QoS requirements from all the applications in order todecide resource allocations.
In utility Grids, there are three possible scenarios that can occur with regard to themapping of multiple user applications to multiple resource sites:
1. A community of users access multiple resources in utility Grids. In this scenario,users are cooperative and providers are competitive. Thus, the meta-broker tries tomaximise users’ utility while satisfying their QoS requirements.
1.4. PROPOSED SOLUTION 7
Figure 1.2: Market-Oriented Meta-Scheduling Scenario
2. Multiple users try to access resources from the same provider. In this case, userscompete with each other to access the resources. The provider owns multiple re-source centers, which are geographically distributed. The objective of the meta-broker is to schedule the applications on multiple resource sites so that the provider’sutility can be maximised.
3. Both users and providers are competitive and want to maximise their utilities. Thus,the meta-broker aims to maximise both users’ and providers’ utility when mappinguser applications to resources.
In this thesis, we have designed market-oriented meta-scheduling allocation mechanismsthat resolves the conflicting requirements of users for each of these scenarios.
Comparing various algorithms in a utility Grid environment with different resourceconfigurations and user requirements is difficult or almost impossible since the effectof other users in different administrative domains cannot be controlled. Therefore, toevaluate the proposed market-oriented meta-scheduling algorithms in a controlled and re-peatable environment, experiments are performed on a simulated utility Grid environmentusing a discrete-event simulator called GridSim [24].
8 Chapter 1. INTRODUCTION
1.5 Thesis Contributions
This thesis contributes towards the advancement of market-based meta-scheduling of mul-tiple user applications on resources in a utility Grid environment. The contributions areas follows:
1. This thesis provides a comprehensive taxonomy of market-based scheduling mech-anisms that cover various aspects, such as market model, application model, partic-ipant focus, allocation decision and objectives. The taxonomy is intended to helpresearchers to make cooperative efforts towards the goal of utility-oriented Grids,by providing insights to key issues that are still outstanding. Based on the taxon-omy, a survey of the most relevant market-oriented systems and traditional resourcemanagement systems is presented with a comprehensive comparison. The surveygives the insights which are helpful in extending and reusing components of exist-ing Grid middleware. Therefore, the taxonomy and survey also highlight variousresearch gaps to enhance the state-of-the-art of market-oriented systems in utilityGrids.
2. This thesis presents the design and development of a market-oriented meta-scheduleri.e. “Meta-Broker”, which coordinates concurrent users and performs schedulingon multiple resources. It investigates the benefit of central coordination over com-pletely decentralised scheduling by personalised user brokers.
3. This thesis models the meta-scheduling problem to maximise users’ utility using aLinear Programming/Integer Programming (LP/IP) model. It investigates the prob-lem for two different types of users’ utility functions: a) minimisation of monetarycost, and b) simultaneously minimisation of the monetary cost and response time.In the first case, this thesis designed a hybrid meta-scheduling algorithm, whichcombines the advantages of LP and genetic algorithms, for searching the cheapestresource allocation. In the second case, users need to manage the trade-off betweenthe monetary and performance costs. Thus, this thesis analyses the problem usinga trade-off metric, and presented the heuristics to minimise both monetary cost andresponse time.
4. This thesis investigates how to maximise provider’s profit (utility) while reducingthe carbon emissions by energy-aware meta-scheduling of applications on globallydistributed data centers. To achieve this objective, this thesis identifies various es-sential factors such as energy cost, CO2 emission rate, compute-intensive workload,and CPU power efficiency. A novel analytical model, with dual objectives of profitand carbon emission, is presented based on these factors. The near-optimal energy-efficient scheduling policies not only minimise the CO2 emissions and maximise
1.6. THESIS ORGANISATION 9
the profit of the provider, but also can be readily implemented without much infras-tructure changes, such as the relocation of existing data centers.
5. This thesis investigates how market-based meta-scheduling can be used to max-imise the utility of both the participants of Grid. It analyses the problem in termsof system metrics, such as slowdown and waiting time, by using a queuing the-ory based analytical model. It then presents a meta-scheduling mechanism whichtakes advantages of both market based and system based approaches, in order tomaximise both users’ and resource providers’ utility. This is demonstrated via val-uation metrics that commodify the resource share available and users’ applicationrequirements so that they can be compared and matched.
6. A single Grid market protocol for physical resources such as CPU and memory isinsufficient to ensure the successful adoption of Grid computing across organisa-tional boundaries. Instead a set or catalogue of different market places is neededto satisfy the diverse needs of different market segments. Thus, this thesis presentsthe design and architecture of a market exchange, and its requirements to ensure thesimultaneous existence of various negotiation protocols similar to a real market.
1.6 Thesis Organisation
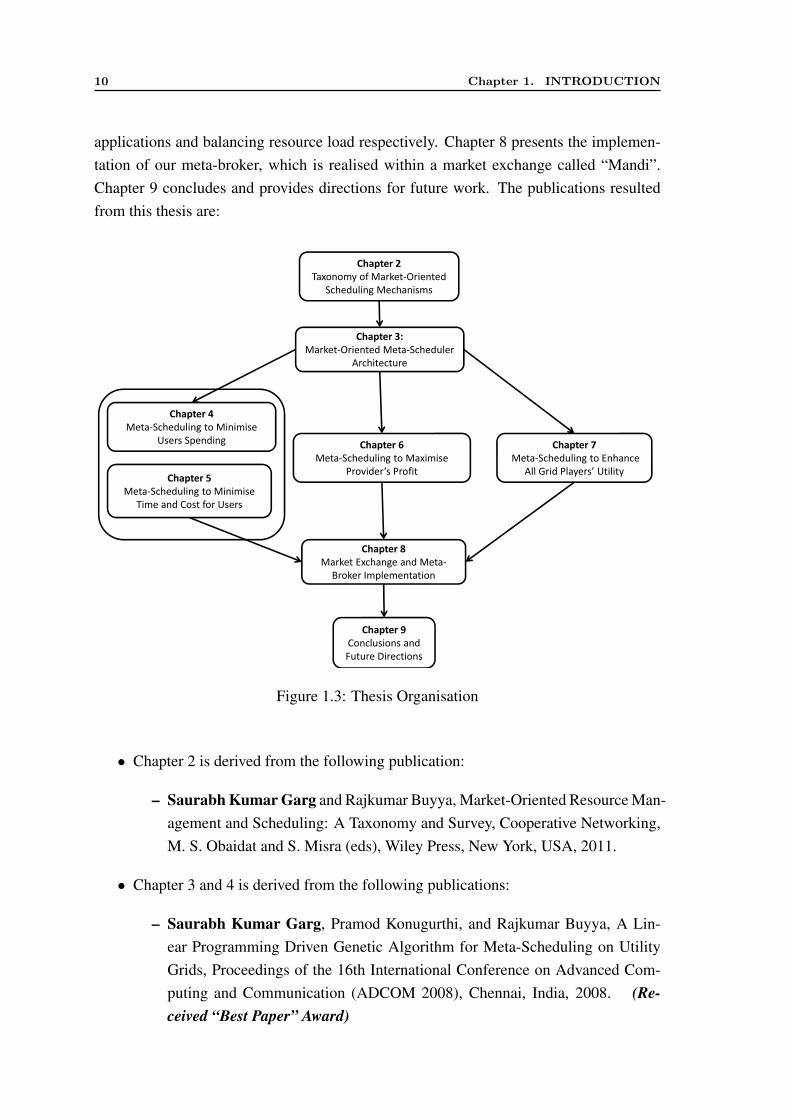
The rest of the thesis is organised (Figure 1.3) as follows: Chapter 2 presents the surveyand taxonomy of market-oriented scheduling systems and mechanisms. This chapter of-fers the literature background for the remaining part of this thesis by highlighting researchgaps in the utility Grid area. Chapter 3 describes the architecture of our market-orientedmeta-scheduler (aka Meta-Broker) with the details of our system model which is used inthis thesis. In this chapter, we evaluate our proposed meta-broker architecture with per-sonalised user brokers to show its benefits. Chapter 4 and 5 propose the meta-schedulingalgorithms in the context of the first scenario, i.e., to minimise users’ expenses. Chapter4 presents the meta-scheduling algorithm to minimise the user spending in execution ofjobs with QoS constraints such as budget and deadline. Chapter 5 analyses the trade-offbetween performance and monetary costs while scheduling the user applications in a util-ity Grid environment. Chapter 6 describes how to model the meta-scheduling problem inthe second scenario. It presents meta-scheduling algorithms that maximise the provider’sutility by reducing the energy cost of the infrastructure. This chapter also analyses theperformance of our algorithms in terms of its impact on global carbon emissions andprovider’s profit. Then, Chapter 7 discusses the meta-scheduling problem in the contextof the third scenario. In this chapter, we present an auction based meta-scheduling algo-rithm which benefits both users and providers by maximising the number of scheduled
10 Chapter 1. INTRODUCTION
applications and balancing resource load respectively. Chapter 8 presents the implemen-tation of our meta-broker, which is realised within a market exchange called “Mandi”.Chapter 9 concludes and provides directions for future work. The publications resultedfrom this thesis are:
Chapter 2
Taxonomy of Market-Oriented
Scheduling Mechanisms
Chapter 3:
Market-Oriented Meta-Scheduler
Architecture
Chapter 4
Meta-Scheduling to Minimise
Users Spending Chapter 6
Meta-Scheduling to Maximise
Chapter 7
Meta-Scheduling to Enhance Meta-Scheduling to Maximise
Provider’s Profit
Meta-Scheduling to Enhance
All Grid Players’ UtilityChapter 5
Meta-Scheduling to Minimise
Time and Cost for Users
Chapter 8
Market Exchange and Meta-
Broker Implementation
Chapter 9
Conclusions and
Future Directions
Figure 1.3: Thesis Organisation
• Chapter 2 is derived from the following publication:
– Saurabh Kumar Garg and Rajkumar Buyya, Market-Oriented Resource Man-agement and Scheduling: A Taxonomy and Survey, Cooperative Networking,M. S. Obaidat and S. Misra (eds), Wiley Press, New York, USA, 2011.
• Chapter 3 and 4 is derived from the following publications:
– Saurabh Kumar Garg, Pramod Konugurthi, and Rajkumar Buyya, A Lin-ear Programming Driven Genetic Algorithm for Meta-Scheduling on UtilityGrids, Proceedings of the 16th International Conference on Advanced Com-puting and Communication (ADCOM 2008), Chennai, India, 2008. (Re-ceived “Best Paper” Award)
1.6. THESIS ORGANISATION 11
– Saurabh Kumar Garg, Pramod Konugurthi, and Rajkumar Buyya, GeneticAlgorithms-based Heuristics for Meta-Scheduling on Utility Grids, Interna-tional Journal of Parallel, Emergent and Distributed Systems, ISSN: 1744-5760, Taylor & Francis Publication, UK, 2011.
• Chapter 5 is derived from the following publications:
– Saurabh Kumar Garg, Rajkumar Buyya, Howard Jay Siegel, SchedulingParallel Applications on Utility Grids: Time and Cost Trade-off Management,Proceedings of the 32th Australasian Computer Science Conference (ACSC2009), Wellington, New Zealand, 2009. (Received “Best Paper” and “BestStudent Paper” Award)
– Saurabh Kumar Garg, Rajkumar Buyya, and Howard Jay Siegel, Time andCost Trade-off Management for Scheduling Parallel Applications on UtilityGrids, Future Generation Computer Systems, vol-26, no. 8, ISSN: 0167-739X, doi:10.1016/j.future.2009.07.003, Elsevier Science, Amsterdam, TheNetherlands, 2010.
• Chapter 6 is derived from the following publications:
– Saurabh Kumar Garg and Rajkumar Buyya, Exploiting Heterogeneity inGrid Computing for Energy-Efficient Resource Allocation, Proceedings of the17th International Conference on Advanced Computing and Communications(ADCOM 2009), Bengaluru, India, 2009.
– Saurabh Kumar Garg, Chee Shin Yeo, Arun Anandasivam, and RajkumarBuyya, Environment-Conscious Scheduling of HPC Applications on DistributedCloud-oriented Data Centers, Journal of Parallel and Distributed Computing(JPDC), ISSN: 0743-7315, doi:10.1016/j.jpdc.2010.04.004, Elsevier Press, Am-sterdam, The Netherlands, 2010.
• Chapter 7 is derived from the following publications:
– Saurabh Kumar Garg, Srikumar Venugopal, James Broberg and RajkumarBuyya, Double Auction based Meta-Scheduling of Parallel Applications onGlobal GridsTechnical Report, CLOUDS-TR-2009-9, Cloud Computing andDistributed Systems Laboratory, The University of Melbourne, Australia, Sept.3, 2009.
• Chapter 8 is derived from the following publication:

12 Chapter 1. INTRODUCTION
– Saurabh Kumar Garg, Christian Vecchiola, and Rajkumar Buyya, Mandi: AMarket Exchange for Trading Utility Computing Services, Technical Report,CLOUDS-TR-2009-13, Cloud Computing and Distributed Systems Labora-tory, The University of Melbourne, Australia, Nov. 17, 2009.
Chapter 2
Taxonomy of Market-OrientedScheduling Mechanisms
The shift of Grids from providing compute power on a sharing basis to commercial pur-poses, even though it has not fully unfolded and it is still mostly limited to research, hasled to various technical advancements which have paved a way to make utility Grids areality. These advancements favour the application of market-oriented mechanisms forGrid systems by providing various pre-requisites, such as hardware virtualisation, on thetechnical and economic sides. This chapter summarises the recent advances toward thevision of utility Grids. First, it specifies all the requirements of a utility Grid and presentsan abstract model to conceptualise essential infrastructure needed to support this vision.Then, a taxonomy and survey of the current market-oriented and system-oriented sched-ulers is provided, examining the contribution and the outstanding issues of each systemin terms of utility Grid’s requirements. This survey is intended to present the state-of-artand identify strength and weakness in the field [175][23].
2.1 Overview of Utility Grids and Preliminaries
A utility Grid imitates a market scenario consisting of the two key players (i.e. GridService Consumers (GSCs) and Grid Service Providers (GSPs)). Each of these playersis generally self-interested and wants to maximise their utility (Figure 2.1). Consumersare users who have resource requirements to execute their applications. The resource re-quirement varies depending on the application model. For instance, parallel applicationsdemand multiple CPUs at the same time with equal configuration, and similar networkbandwidth between resources. The consumers are willing to compensate a providersfor using their resources in the form of real money or barter [16]. On the other hand,providers are the owners of resources (i.e. disk, CPU) which satisfy consumer needs.
13
14 Chapter 2. TAXONOMY OF MARKET-ORIENTED SCHEDULING MECHANISMS
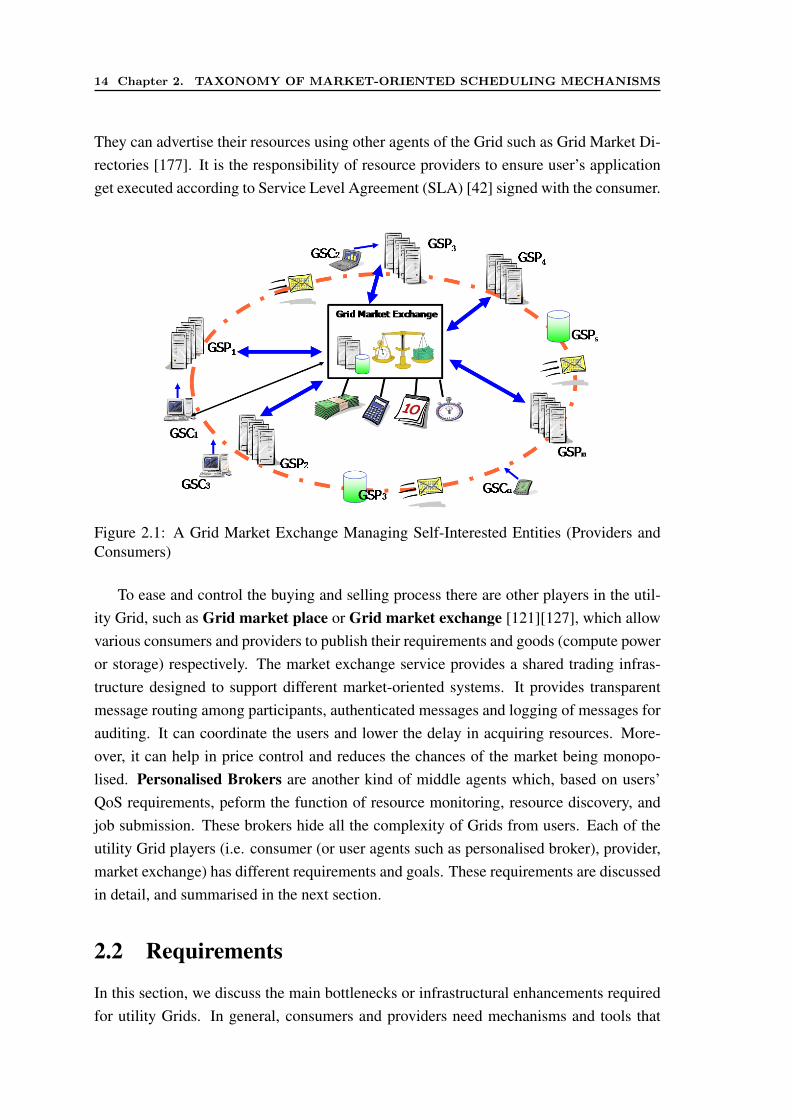
They can advertise their resources using other agents of the Grid such as Grid Market Di-rectories [177]. It is the responsibility of resource providers to ensure user’s applicationget executed according to Service Level Agreement (SLA) [42] signed with the consumer.
Figure 2.1: A Grid Market Exchange Managing Self-Interested Entities (Providers andConsumers)
To ease and control the buying and selling process there are other players in the util-ity Grid, such as Grid market place or Grid market exchange [121][127], which allowvarious consumers and providers to publish their requirements and goods (compute poweror storage) respectively. The market exchange service provides a shared trading infras-tructure designed to support different market-oriented systems. It provides transparentmessage routing among participants, authenticated messages and logging of messages forauditing. It can coordinate the users and lower the delay in acquiring resources. More-over, it can help in price control and reduces the chances of the market being monopo-lised. Personalised Brokers are another kind of middle agents which, based on users’QoS requirements, peform the function of resource monitoring, resource discovery, andjob submission. These brokers hide all the complexity of Grids from users. Each of theutility Grid players (i.e. consumer (or user agents such as personalised broker), provider,market exchange) has different requirements and goals. These requirements are discussedin detail, and summarised in the next section.
2.2 Requirements
In this section, we discuss the main bottlenecks or infrastructural enhancements requiredfor utility Grids. In general, consumers and providers need mechanisms and tools that
2.2. REQUIREMENTS 15
facilitate the description of their requirements and decision making to achieve their goals,such as minimisation of monetary cost while meeting QoS requirements.
2.2.1 Consumer Requirements
User-centric Brokers: These brokers are user agents which discover and schedule jobson to resources according to the user priorities and application’s QoS requirements suchas budget, deadline, and number of CPU required [163]. These brokers hide the hetero-geneity and complexity of resources available in the Grid. On behalf of users, user-centricbrokers provide functionalities such as application description, submission and schedul-ing; resource discovery and matching; and job monitoring. The user broker can also per-form negotiation and bidding in an auction conducted by a market exchange or providerfor acquiring resources.
Bidding/Valuation Mechanism: In the utility Grid, a variety of market models canexist simultaneously such as a commodity and auction market. To participate in both ofthe market model, users need to know the valuation of their applications in the form ofbudget which estimates the user’s requirements. For example, in an auction market, usersneed to bid in order to grab a resource, and in such cases, budget or valuation can helpbrokers to bid on behalf of the users. In summary, consumers need utility models to allowthem to specify resource requirements and constraints.
Market-Oriented Scheduling Mechanisms: In traditional Grids, generally users wantto schedule their applications on the resources which can provide the minimum responsetime, and satisfy other QoS requirements in terms of memory and bandwidth. In utilityGrids, one additional factor comes into the picture i.e. monetary cost, which requires newmechanisms as a user may relax some of her other requirements to save on monetary cost.Thus, one of the objectives of new scheduling mechanisms will be to execute the userapplication on the cheapest resource which can satisfy the user’s QoS requirements. Themarket-oriented mechanisms can vary depending on the market model, user’s objective(such as reduce time or cost), and application model (require multiple types of resources).
Allocation of Multiple Resources: Depending on the application model, consumersmay want to run their applications on multiple resources, provided by more than oneresource provider. For example, scheduling of a large parameter sweep across a num-ber of providers, performing distributed queries across multiple databases, or creating adistributed multi-site workflow. Thus, brokers should have capabilities to schedule appli-cations and obtain resources from multiple resource sites.
16 Chapter 2. TAXONOMY OF MARKET-ORIENTED SCHEDULING MECHANISMS
Estimation of Resource Usage: In general, due to the heterogeneity of hardware anddifferent input sizes, it is difficult to describe precisely execution time, and the require-ment of an application which can vary drastically. In the traditional Grid, an importantresearch problem is how to profile the runtime of an application since execution timecan affect not only the resource utilisation but also cause delays for users. In the utilityGrid, this requirement becomes more critical as over estimation and under estimation ofresource requirements can lead to tangible loss in the form of real money. Currently, theresource providers such as Amazon sell their compute resources in time blocks. In addi-tion, if many users compete for the same resource, the resource availability, depending onindividual user’s requirement, can vary from minutes to days. Thus, users must estimatetheir resource needs in advance. Thus, profiling tools and mechanisms are required forefficient resource allocation in terms of utility.
2.2.2 Resource Provider Requirements
Resource Management Systems (RMSs): These systems interact with underline hard-ware infrastructure and control the allocation of resources and job scheduling. In amarket-oriented system, the advance reservation function is required to allocate resourcesin future, and also to track the availability of resources which can be advertised. Thus, thereservation system should be able to provide the guaranteed resource usage time (basedon SLA) and support estimation of the future resource offers. Grid Middleware such asGlobus has components such as advance reservation, but to support the market-orientedreservation and scheduling, they should be integrated with a module that supports variousmarket-oriented scheduling mechanisms and models.
Pricing/Valuation Mechanism: In utility Grids, a resource provider’s main objectiveis to maximise their profit not just the efficiency of the system, thus mechanisms arerequired to set the resource price based on the market supply and demand, and the currentlevel of resource utilisation. These prices can be static or can vary dynamically based onthe resource demand. For example, an academic user may require more resources due toa conference deadline and, thus, is willing to pay more.
Admission Control and Negotiation Protocols: As stated before, in market-orientedsystems, all participants are self-interested and want to maximise their utility. Thus,providers need to decide which user application they should accept or negotiate for. Sincethere may be a chance of reservation cancellation by users, thus the mechanisms such asresource over provisioning may be required. SLA is also needed to be formulated once auser request is accepted for reservation. In addition, depending on how providers want to
2.2. REQUIREMENTS 17
lease their resources, they may choose different market model for negotiation. For exam-ple, the simplest negotiation is required in the commodity models, while the bargainingmodel requires more intelligent negotiation protocol.
Commoditization of the Resources: Unlike many other markets, commoditization ofthe resources is one of the major difficult problems, which complicates the reservation andallocation decisions. For instance, for a compute intensive application, it is meaningless tojust allocate CPUs without some memory. How much memory should be allocated whenhardware infrastructure contain shared memory? Even for storage some small CPU cyclesare required. Thus, intelligent resource partitioning techniques are required to overcomethe hardware difficulties.
2.2.3 Market Exchange (ME) Requirements
An Information and Market Directory is required for advertising participants, availableresources, and auctions. It should support heterogeneous resources, as well as providesupport for different resource specifications. This means that the market ought to offerfunctionalities for providing, for instance, both storage and computation with differentqualities and sizes.
Support for Different Market Models: Multiple market models are needed to be de-signed and deployed as resource providers and consumers have different goals, objectives,strategies, and requirements that vary with time [121]. If there are multiple sellers for thesame good, a Double auction which aggregates supply and demand generally yields higherefficiency. If there is only one seller (e.g. in a differentiated service market for complexservices), supporting single-sided auction protocols may be desirable. The negotiationprotocol also depends on the user application. For example, in the case applications withsoft deadlines, the large scheduling cycle helps in collecting a higher number of bids andoffers for auction. This may lead to more efficient allocation than clearing continuously,since the allocation can be based on more resource information and has more degrees offreedom in optimising efficiency (and/or other objectives). On the contrary, users havingurgent resource requirements may prefer an immediate allocation, thus the commoditymodel will be better choice for negotiation. Consequently, the market exchange mustclearly support multiple negotiation protocols.
Reputation and Monitoring System: In general, it is assumed that after the schedulingmechanism has determined the allocation and resultant pricing, the market participants ad-here to the market’s decisions and promises. In reality, however, this does not happen due
18 Chapter 2. TAXONOMY OF MARKET-ORIENTED SCHEDULING MECHANISMS
to several reasons such as untruthful behaviour of participants, failure while communi-cating the decision, and failure of resources. Consequently, there is a need for reputationmechanisms that prevent such circumstances by removing distrustful participants. How-ever, there is a strong need for monitoring systems that can detect any SLA violationduring execution. In Grids, the reason for a job failure or a corruption of results is hardto detect since it can occur due to several reasons such as intentional misbehaviour of theresource provider, or technical reasons which are neither controlled by the user nor theprovider. The monitoring systems should support reputation system for early detectionof violations and responsible participant. An important challenge is thus to design suchintelligent monitoring systems.
Banking System (Accounting, Billing, Payment Mechanism): In the market exchange,an accounting system is necessary to record all the transactions between resource providersand consumers. The accounting system especially records the resource usage and chargesthe consumer as per the usage agreement between the consumer and provider.
Meta-Scheduling/Meta-Brokering: The market exchange provides the services suchas meta-scheduling of consumer applications on multiple resource providers in the caseseveral consumers require simultaneous access to resources. For instance, a large pa-rameter sweep application requires resources across the number of providers, performingdistributed queries across multiple databases, or creating a distributed multi-site workflow.Thus, the meta-scheduling service does two tasks for their clients (i.e. resource discoveryand efficiently scheduling applications according to client’s objectives). It can act as anauctioneer in case a client wants to hold an auction.
Currency Management: For ensuring the fair and efficient sharing of resources, anda successful market, a well-defined currency system is essential. Two kinds of currencymodels are proposed i.e. virtual and real currency. Both of these currency models have ad-vantages and disadvantages based on their managerial requirements. The virtual currencyis generally deployed [146] due to its low risk and low stakes in case of mismanagementor abuse. However, virtual currency requires careful initial and ongoing management, andlacks flexibility. For buying and selling resources in a real commercial environment, thereal currency is preferred due to several reasons. The most important reason is that the realcurrency formats (e.g. USD, Euro, etc.) are universally recognised and are easily trans-ferable and exchanged, and are managed outside the scope of a Grid market exchange, bylinked free markets and respective government policy.
Security and Legal System: To avoid spamming, there should be a security system foruser registration. All the services of the exchange must be accessed by authorised users.
2.3. UTILITY GRID INFRASTRUCTURAL COMPONENTS 19
Similarly, there is also a need for legal support that can resolve various conflicts betweenproviders and consumers, such as violations of SLA [42]. Thus, the legal support can bebuild by the help of some authoritative agency such as a country’s government.
2.3 Utility Grid Infrastructural Components
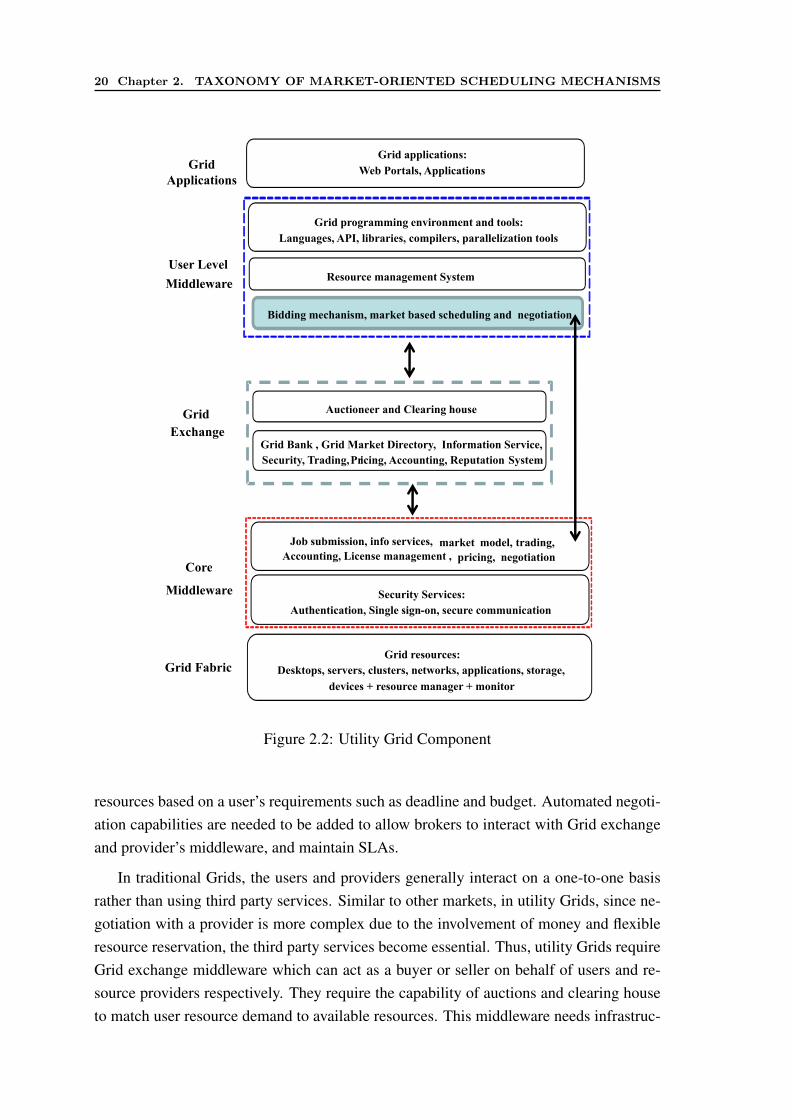
Based on above requirements, in this section we discuss various infrastructure requiredfor a fully functional utility Grid. Figure 2.2 outlines an abstract model for utility Gridthat identifies essential components. This model can be used to explore how existing Gridmiddleware such as user-centric brokers, meta-schedulers and RMSs can be leveraged andextended to incorporate market-oriented mechanisms.
The utility Grid consists of multi-layer middleware for each participant: users (Gridapplication, user level middleware), Grid exchange, and providers (core middleware andGrid fabric). The architecture of each of the components should be generic enough toaccommodate different negotiation models for resource trading. Except for Grid exchangeand highlighted components, most of the components are also present in traditional Grids.
The lowest layer is the Grid fabric that consists of distributed resources such as com-puters, networks, storage devices, and scientific instruments. These computational re-sources are leased by providers, thus the resource usage is needed to be monitored pe-riodically to inform the above layers about free resources which can be rented out. Theresource managers in this layer have the responsibility of scheduling applications.
The core middleware offers the interface for negotiation with Grid exchange and user-level middleware. It offers services such as remote process management, co-allocation ofresources, storage access, information registration and discovery, security, and aspects ofQoS such as resource reservation and trading. These services hide the heterogeneity at thefabric level. The support for accounting, market model and pricing mechanisms is vital forresource providers since such support enables them to participate in the utility Grid. Thepricing mechanism decides how resource requests are charged. The pricing of resourceusage by consumers can depend on several variables such as submission time (peak/off-peak), pricing rates (fixed/changing) or availability of resources (supply/demand). Pricingserves in the utility Grid as an efficient and cost-effective medium for resource sharing.The accounting mechanism maintains the actual usage of resources so that the final costcan be computed and charged from the consumers. The market model defines the nego-tiation protocol that can be used to serve different resource requests depending on theireffect on provider’s utility.
The user-level Grid middleware and applications also need to be enhanced to satisfythe requirements discussed in the previous section. A new layer is needed in the brokersto give users functionality of automatic bidding and negotiation. This layer also discovers
20 Chapter 2. TAXONOMY OF MARKET-ORIENTED SCHEDULING MECHANISMS
Grid applications:
Web Portals, Applications GridApplications
Resource management System
Grid programming environment and tools:
Languages, API, libraries, compilers, parallelization tools
User LevelResource management System
Middleware
Bidding mechanism, market based scheduling and negotiation
Auctioneer and Clearing houseGrid
Grid Bank , Grid Market Directory, Information Service,Security, Trading, Pricing, Accounting, Reputation System
Exchange
Job submission, info services, market model, trading, Accounting, License management , pricing, negotiation
Core
Security Services:Authentication, Single sign-on, secure communication
Core
Middleware
Grid resources:Desktops, servers, clusters, networks, applications, storage,
devices + resource manager + monitor
Grid Fabric
Figure 2.2: Utility Grid Component
resources based on a user’s requirements such as deadline and budget. Automated negoti-ation capabilities are needed to be added to allow brokers to interact with Grid exchangeand provider’s middleware, and maintain SLAs.
In traditional Grids, the users and providers generally interact on a one-to-one basisrather than using third party services. Similar to other markets, in utility Grids, since ne-gotiation with a provider is more complex due to the involvement of money and flexibleresource reservation, the third party services become essential. Thus, utility Grids requireGrid exchange middleware which can act as a buyer or seller on behalf of users and re-source providers respectively. They require the capability of auctions and clearing houseto match user resource demand to available resources. This middleware needs infrastruc-
2.4. TAXONOMY OF MARKET-ORIENTED SCHEDULING 21
tures such as a meta-broker which matches of users and providers, Grid Market Directory(GMD) that allows resource advertisements, negotiation protocols, a reputation system,security and price control. Meta-broker is a key component of the market-exchange. Itacts as an auctioneer or clearing house, and thus schedules a user’s application on thedesired resources. More details on the meta-broker architecture used in this thesis arediscussed in the next chapter.
2.4 Taxonomy of Market-Oriented Scheduling
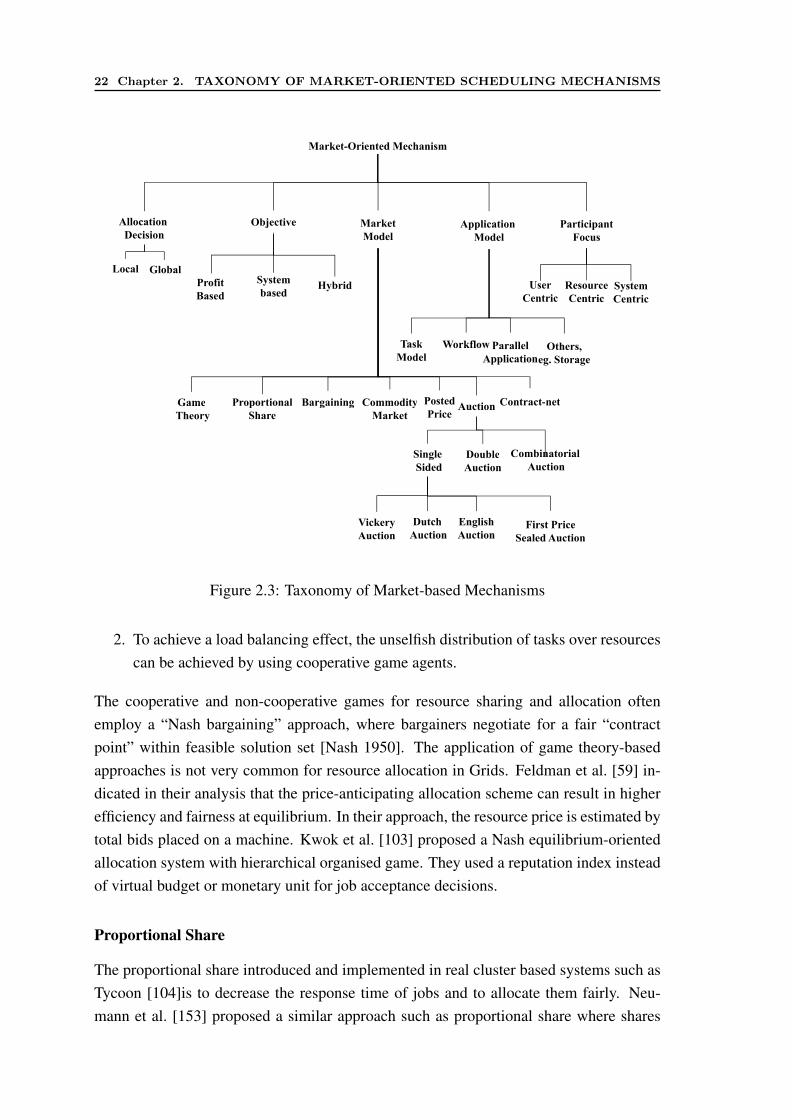
There are several proposed taxonomies for scheduling in distributed and heterogeneouscomputing [175][5]. However, none of these taxonomies focus on the market-orientedscheduling mechanism in Grids. Here, we present the taxonomy, which emphasises thepractical aspects of market-oriented scheduling in Grids and its difficulties which are vitalto achieve utility-based Grid computing in practice. We can understand works in market-oriented scheduling (as shown in Figure 2.3) from five major perspectives, namely marketmodel, allocation decision, market objective, application model, and participant focus.
2.4.1 Market Model
The market model refers to the mechanism used for trading between consumers andproviders. Any particular market model cannot solve all the special requirements of dif-ferent participants. Having different characteristics each model is the most profitable toits participants depending on the Grid situation. For example, when the number of partic-ipants in terms of consumers and providers is almost same, the Double auction is a muchbetter choice. Due to the differences in the applicability of auctions, various authors haveapplied and analysed the efficiency achieved [121]. Various market models that can beapplied to market-oriented Grid computing, include the following:
Game Theory
If Grid participants only interact in the form of an allocation game with different payoffsas a result of specific actions employing various strategies, a game theoretical setting canbe assumed. This approach is generally applied to ease the congestion of a commonresource or network which can lead to reduction in the overall utility of the system. Thereare two types of solution approaches in this context:
1. To avoid excessive consumption of the resources one can use a game with self-interested economic agents (non-cooperative games).
22 Chapter 2. TAXONOMY OF MARKET-ORIENTED SCHEDULING MECHANISMS
Market-Oriented Mechanism
Allocation Decision
MarketModel
Application Model
ParticipantFocus
Objective
ProfitBased
Systembased
Hybrid UserCentric
ResourceC t i
SystemC t i
Local Global
Based b sed
Task Parallel Others,Workflow
Centric Centric Centric
Game Commodity Contract-netBargainingProportional Posted A i
Model ApplicationOthers,
eg. Storage
GameTheory
CommodityMarket
Contract-netBargainingProportionalShare
PostedPrice
Auction
Single Double CombinatorialSingleSided
DoubleAuction
CombinatorialAuction
VickeryAuction
DutchAuction
EnglishAuction
First PriceSealed Auction
Figure 2.3: Taxonomy of Market-based Mechanisms
2. To achieve a load balancing effect, the unselfish distribution of tasks over resourcescan be achieved by using cooperative game agents.
The cooperative and non-cooperative games for resource sharing and allocation oftenemploy a “Nash bargaining” approach, where bargainers negotiate for a fair “contractpoint” within feasible solution set [Nash 1950]. The application of game theory-basedapproaches is not very common for resource allocation in Grids. Feldman et al. [59] in-dicated in their analysis that the price-anticipating allocation scheme can result in higherefficiency and fairness at equilibrium. In their approach, the resource price is estimated bytotal bids placed on a machine. Kwok et al. [103] proposed a Nash equilibrium-orientedallocation system with hierarchical organised game. They used a reputation index insteadof virtual budget or monetary unit for job acceptance decisions.
Proportional Share
The proportional share introduced and implemented in real cluster based systems such asTycoon [104]is to decrease the response time of jobs and to allocate them fairly. Neu-mann et al. [153] proposed a similar approach such as proportional share where shares
2.4. TAXONOMY OF MARKET-ORIENTED SCHEDULING 23
of resources are distributed using a discriminatory pay-as-bid mechanism to increase theefficiency of allocation and for the maximisation of resource provider profit. This modelmakes an inherit assumption that resources are divisible, which is generally not the casewhen a single CPU is needed to be allocated; a situation which is quite usual in coopera-tive problem-solving environments such as clusters (in single administrative domain).
In the proportional share based market model, the percentage of resource share al-located to an application is proportional to the bid value in comparison to other users’bids. The users are allocated credits or tokens, which can be used for gaining access toresources. The value of each credit depends on the resource demand and the value thatother users place on the resource at the time of usage. One major drawback of proportionalshare is that users do not get any QoS guarantee.
Commodity Market Model
In this model, resource providers specify their resource price and charge users accordingto the amount of resources they consume. The resource allocation mechanisms consist offinding prices and allocations such that each economic participant maximises their utility.One of the first evaluation work in Grids on commodity market was presented by Wolskiet al. [168] who analysed and compared commodity markets with other auction models.Many commercial providers such as Amazon [6] are using commodity market modelswith fixed and dynamic pricing.
The determination of the equilibrium price is very crucial since it act as a great toolin resource allocation decisions. The prices depend on various factors such as invest-ment and management cost of resource provider, current demand and supply, and futuremarkets [148][3]. According to the prices, users can adopt any strategy to decrease theirspending while getting satisfactory QoS level [140][151]. Various systems have been de-signed to automate this process; such as Dornemann et al. [47] designed and implementedof a workflow system based on a Business Process Execution Language (BPEL) to supporton-demand resource provisioning. Ernemann et al. [52] presented an economic schedul-ing system for Grid environments. HA-JES (Kang et al. [91]) presented an algorithm toincrease revenue for providers whose resources are underutilised, by ensuring high avail-ability to users. To determine the equilibrium price, Stuer et al. [154] presented a strategyfor commodity resource pricing in dynamic computational Grids. They proposed somerefinements to the application of Smale’s method for finding price equilibria in such aGrid market for price stability, allocative efficiency, and fairness.
Contract-Net
In the contract-net protocol, users advertise their demand and invite resource owners tosubmit bids [149][171] [90]. Resource owners check these advertisements with respect to
24 Chapter 2. TAXONOMY OF MARKET-ORIENTED SCHEDULING MECHANISMS
their requirements. If the advertisement is favourable, the resource owners respond withbids. The user consolidates all the bids, compares them, and selects the most favourablebids. The bidding process has only two outcomes: the bid is accepted or rejected in itsentirety.
Bargaining
Bargaining models are employed in bi-lateral negotiations between providers and con-sumers, and do not rely on 3rd parties to mediate the negotiation. During the negoti-ation, each player applies concessions until mutual agreement is reached by alternatingoffers [162]. Li and Yahyapour [107] proposed a concurrent bilateral negotiation modelfor Grid resource management. The bargaining problem in Grid resource management isdifficult because while attempting to optimise utility, negotiation agents need to: (i) nego-tiate for simultaneous access to multiple resources, (ii) consider the (market) dynamics ofa computational Grid, and (iii) be highly successful in acquiring resources to reduce delayoverhead in waiting for resources.
Posted Price
It is similar to the commodity market model. In this model, providers may also makespecial offers such as discounts for new clients; differentiate prices across peak and off-peak hours. Prices do not vary relative to the current supply and demand but are fixedover a period of time.
Auction
An Auction is a process of trading resources by offering them up for bidding, and sellingthe items to the highest bidder. In economic terms, it is also a method to determine thevalue of a resource whose price is unknown. An auction is organised by an auctioneer,who distributes Grid resources from the providers to the users. Thus, the mechanismconsists of determining the winner and setting the price. The auctions can be divided intothree types based on participants and commodity exchanged: a) Single-sided auction, b)Double-sided auction, and c) Combinatorial auctions.
• Single-sided Auction
Single-sided auctions are mechanisms, where only buyers or sellers can submit bidsor asks. Even though the single-sided auction is the most widely applied marketmodel, it often leads to inefficient allocation [143]. The most prominent singlesided auctions are Vickrey Auction, Dutch Auction, First Price Sealed Bid (FPSB),and English Auction.
2.4. TAXONOMY OF MARKET-ORIENTED SCHEDULING 25
1. English Auction
In the English auction, the auctioneer begins the auction with a reserve price(lowest acceptable price) [43]. Auction continues in rounds with increasingbid prices, until there is no price increase. The item is then sold to the highestbidder.
2. Dutch Auction
In the Dutch auction the auctioneer begins with a high asking price whichis lowered until some participant is willing to accept the auctioneer’s priceor a predetermined minimum price is reached. That participant pays the lastannounced price. This type of auction is convenient when it is important toauction resources quickly, since a sale never requires more than one bid.
3. Vickrey Auction
A Vickrey auction is a sealed-bid auction, where bidders submit sealed bids.The highest bidder wins, paying the price of the second highest bid. Thisgives bidders incentives to bid their true value. When multiple identical unitsare auctioned, one obvious generalisation is to have all bidders pay the amountof the highest non-winning bid.
4. First Price Sealed Bid (FPSB) Auction
In this type of auction, all bidders simultaneously submit bids so that no bidderknows the bid of any other participant [43]. The highest bidder pays the pricethey submitted. In this case, the bid strategy is a function of one’s privatevalue and the prior belief of other bidders’ valuations. The best strategy is tobid less than its true valuation and it might still win the bid, but it all dependson what the others bid.
• Double-Sided Auction
In a Double auction, both providers and users submit bids which are then ranked(from the highest to the lowest) to generate demand and supply profiles. From theprofiles, the maximum quantity exchanged can be determined by matching sellingoffers (starting with the lowest price and moving up) with demand bids (startingwith the highest price and moving down). This format allows users to make of-fers and providers to accept those offers at any particular moment. In the Doubleauction, the winner determination depends on different aspects such as aggregation,resource divisibility, and goods which can be homogeneous or heterogeneous. Ag-gregation can come from the supplier side or from the buyer side. If no aggregationis allowed then each bid can be exactly matched to one ask. Divisible goods canbe allocated partially. In the case that the bidder wants the entire good or nothing
26 Chapter 2. TAXONOMY OF MARKET-ORIENTED SCHEDULING MECHANISMS
then its bid is considered indivisible. Kant et al. [92] proposed and compared vari-ous types of Double auctions to investigate its efficiency for resource allocation inGrid. In addition, Tan et al. [156] proposed the stable continuous Double auction toovercome the problem of high volatility.
• Combinatorial Auctions
The Grid users may require a combination of multiple resources such as CPUs,memory, and bandwidth. Combinatorial auction allows users and providers to tradea bundle of multiple resources. It is advantageous to users as they do not needto participate in multiple negotiations with providers for each resource required.Moreover, in some cases it also leads to cost benefits. In combinatorial auction,users express their preferences as bundles of resources that need to be matched. Theproviders submit their asks and the auctioneer solves the optimisation problem ofallocation. The only drawback of combinatorial auction is the NP-hardness [118]of the matching problem, which makes it inapplicable for large scale settings. Anumber of variants of combinatorial auction are proposed in the literature to allocatecomputational resources among Grid users [94][142].
2.4.2 Allocation Decision
In Grids, the resource allocation to users can be done at two points. It can be initiatedeither by an individual provider (local) or a middleman such as meta-scheduler or auc-tioneer (global). In ‘local’, the trading decisions are based on the information providedby one resource provider. Generally in this case, users approach the resource providerdirectly to buy or bid for a resource bundle advertised. For instance, to buy compute re-sources of Amazon [6], users can directly negotiate with Amazon service [6]. Most of thesingle-sided auctions fall into this category.
In ‘global’, the trading decisions are based on the global information of multipleproviders. Users utilise the services of a an auctioneer in the market exchange to getthe required resources. Thus, the auctioneer makes the decision on behalf of the users tobuy resources from providers. The two-sided auctions fall into this category.
The local decision point is more scalable but can lead to contention. While the globaldecision point is more optimised and coordinates demand fairly.
2.4.3 Participant Focus
The two major parties in Grid computing, namely, resource consumers who submit vari-ous applications, and resources providers who share their resources, usually have different
2.4. TAXONOMY OF MARKET-ORIENTED SCHEDULING 27
motivations when they join the Grid. The participant focus identifies the market side forwhich market oriented systems or mechanisms are explicitly designed to achieve benefit.
Application-centric: In the application centric, mechanisms are designed such that anapplication can be executed on resources, which meet the user requirements within his/herbudget or deadline.
Resource-centric: Similarly, a resource-centric mechanism focuses mainly on resourceproviders by fulfilling their desired utility goal in terms of resource utilisation and profit.
System-centric: In the market scenario, there may be middlemen such as meta-brokersor meta-schedulers that coordinate and negotiate the resource allocations between usersand producers. They try to maximise the utility for both users and providers. Thus, theresource allocation decision involves multiple users and providers.
In utility Grids, mechanisms are required that can cater to the needs of both sides ofthe market. For instance, they should be able to satisfy end-users’ demand for resourceswhile giving enough incentive to resource providers to join the market. Moreover, the spe-cific requirements of participants should not be neglected. It is also possible for market-oriented RMSs to have multiple participants focus such as in Double auctions.
2.4.4 Application Type
Market-oriented resource allocation mechanisms need to take into account job attributesto ensure that different job types with distinct requirements can be fulfilled successfully.The application model affects not only the scheduling mechanism but also other aspect ofthe utility Grid such as resource offerings by providers, negotiation with providers, andformation of SLAs and their monitoring. For applications consisting of independent tasks,all the tasks can be distributed across multiple providers and thus optimisation of the user’sutility is easier. For the parallel application model, all tasks are needed to be mapped ona single resource site. In the workflow type of application, there is a precedence orderexisting in tasks; that is, a task cannot start until all its parent tasks are done. This willrequire coordination between multiple providers, and the scheduling problem needs to befault tolerant since single failure may result in a large utility loss.
2.4.5 Allocation Objective
The market-oriented mechanisms can be used to achieve different objectives both in utilityGrids and traditional Grids. The allocation objective of mechanism can be profit-oriented,
28 Chapter 2. TAXONOMY OF MARKET-ORIENTED SCHEDULING MECHANISMS
system-oriented, or hybrid of both of them. The objectives of various participants decidethe trading relationship between them. The profit based objective in terms of monetarygains, in general, encourages competition between participants. Thus, each participanttries to maximise their own utility without considering other consumers.
The objective of market-oriented scheduling mechanisms could be to achieve optimi-sation of system metrics such as utilisation, fairness, load balancing, and response time.This application of market-oriented mechanism, categorised in taxonomy as “system-oriented objective”, is quite common. For example, OurGrid [7] uses a resource exchangemechanism termed network of favours which is used to share resources among distributedusers. Bellagio [9] is another system deployed on PlanetLab for increasing system utilisa-tion on non peak time. The objective of market-oriented scheduling mechanism can be ofhybrid type. For example, a user may simultaneously want to minimise the response timeand the cost of application execution. A provider may accept a less profitable applicationto increase resource utilisation rather than waiting for more profitable jobs.
2.5 Survey of Grid Resource Management Systems
Grid RMSs chosen for the survey can be classified into two broad categories: market-oriented or system-oriented (presented in the following sections). Since this survey fo-cuses on utility computing, market-oriented RMSs are surveyed to understand currenttechnological advances and identify outstanding issues that are yet to be explored so thatmore practical RMSs can be implemented in future. On the other hand, surveying system-oriented RMSs allow analysing and examining the applicability, and suitability of thesesystems for supporting utility Grids in practice. This in turn helps us to identify possiblestrengths of these systems that may be leveraged for utility computing environments. Intraditional Grids, a user accesses the Grid services either through User Brokers (UB) orLocal Resource Managers (LRM). These systems schedule the jobs using system-centricapproaches which optimise the metrics such as response time and utilisation. We call suchschedulers as “System-Oriented Schedulers” to differentiate them from the schedulers inmarket-oriented Grids (or utility Grids).
2.5.1 Survey of Market-Oriented Systems
Table 2.1 shows a summary listing of the existing market-oriented RMSs and brokersthat have been proposed by researchers for various computing platforms. In the market-oriented Grid, there are also three entities which participate in scheduling. One is theuser broker that provides access to users on multiple resources. The resource providersare other entities who also have resource brokers that facilitate the admission control,
2.5. SURVEY OF GRID RESOURCE MANAGEMENT SYSTEMS 29
pricing, and negotiation with user brokers. The negotiation between users and resourceproviders can be on one-to-one basis or through third entity i.e. market exchange. Themarket exchange also provide other services such as resource discovery, banking, buyingand selling compute services.
Gridbus Broker
Gridbus broker [163] is a single user resource broker that supports access to both com-putational and data Grids. It transparently interacts with multiple types of computationalresources which are exposed by various local Grid middleware’s such as Globus, Al-chemi, Unicore and Amazon EC2, and scheduling systems such as PBS and Condor. Bydefault, it implements two scheduling strategies that take into account budget and deadlineof applications. Additionally, the design of the broker allows the integration of customscheduling algorithms. Job-monitoring and status-reporting features are provided. Grid-bus broker supports two application models, i.e., parametric-sweep and workflow.
Nimrod/G
Nimrod/G is an automated and specialised resource management system, which allowsexecution of parameter sweep applications on Grid to scientists and other types of users.Nimrod/G follows mainly the commodity market model and provides four budget anddeadline based algorithms [25] for computationally-intensive applications. Each resourceprovider is compensated for sharing their resources by the users. The users can vary theirQoS requirement based on their urgency and execution expense. Nimrod/G consists ofa Task Farming Engine (TFE) for managing an execution, a Scheduler that talks to vari-ous information services and decides resource allocations, and a Dispatcher that createsAgents and sends them to remote nodes for execution. It is widely used by scientificcommunity for their computation-intensive simulations in the areas of bio-informatics,operations research, ecological modelling, and Business Process Simulation.
Tycoon
Tycoon [104] is a market-based distributed resource allocation system based on Propor-tional Share scheduling algorithm. The user request with the highest bid is allocatedthe processor time slice. The bid is computed as the pricing rate that the user pays forthe required processor time. Tycoon allocates the resources to the self-interested usersin environments where service hosts are unreliable because of frequent changes in theavailability. Tycoon distinguishes itself from other systems by separating the allocationmechanism (which provides incentives) from the agent strategy (which interprets prefer-ences). This simplifies the system and allows specialisation of agent strategies for dif-
30 Chapter 2. TAXONOMY OF MARKET-ORIENTED SCHEDULING MECHANISMS
ferent applications while providing incentives for applications to use resources efficientlyand resource providers to provide valuable resources. A host self-manages its local se-lection of applications, thus maintaining decentralised resource management. Hosts areheterogeneous since they are installed in various administrative domains and owned bydifferent owners. Tycoon’s distributed market allows the system to be fault tolerant andto allocate resources with low latency.
Spawn
Spawn [95] uses sealed-bid second-price auctions for market-oriented resource allocationin a network of heterogeneous computer nodes. Users place bids to purchase CPU re-sources for executing hierarchy-based concurrent programs in auctions held privately byeach computer node and are not aware of other users’ bids. The concurrent applicationsare then represented using a tree structure where a hierarchy of tasks expand or shrink insize depending on the resource cost. This mechanism limits the ability of customers toexpress fine-grained preferences for services.
Java Market
Java Market [173] is one of the oldest market-oriented systems developed by John Hop-kins Univ. It is an Internet-wide meta-computing system that brings together people whohave applications to execute and people who have spare computing resources. One cansell CPU cycles by pointing a Java-enabled browser to a portal and allow execution ofApplets in a QoS-based computational market. The goal of Java Market is to make it pos-sible to transfer jobs to any participating machine. In addition, in Java Market, a resourceprovider receives payment or award based on the execution time of a job and the amountof work done.
Mariposa
Mariposa [152] is a distributed database system developed at the University of California.It supports query processing and storage management based on budget. Users submitqueries with time-dependent budgets to brokers who then select servers for executingthe queries based on two protocols. One protocol is expensive as it solicits bids fromall servers, requiring many communication messages. The expensive protocol adopts agreedy algorithm that aims to minimise cost to schedule sub-queries so as to select thecheapest server for the user. The other protocol is cheaper since it selects specific serverbased on the historical information. In Mariposa, bids on queries are based on local andselfish optimisation of each user.
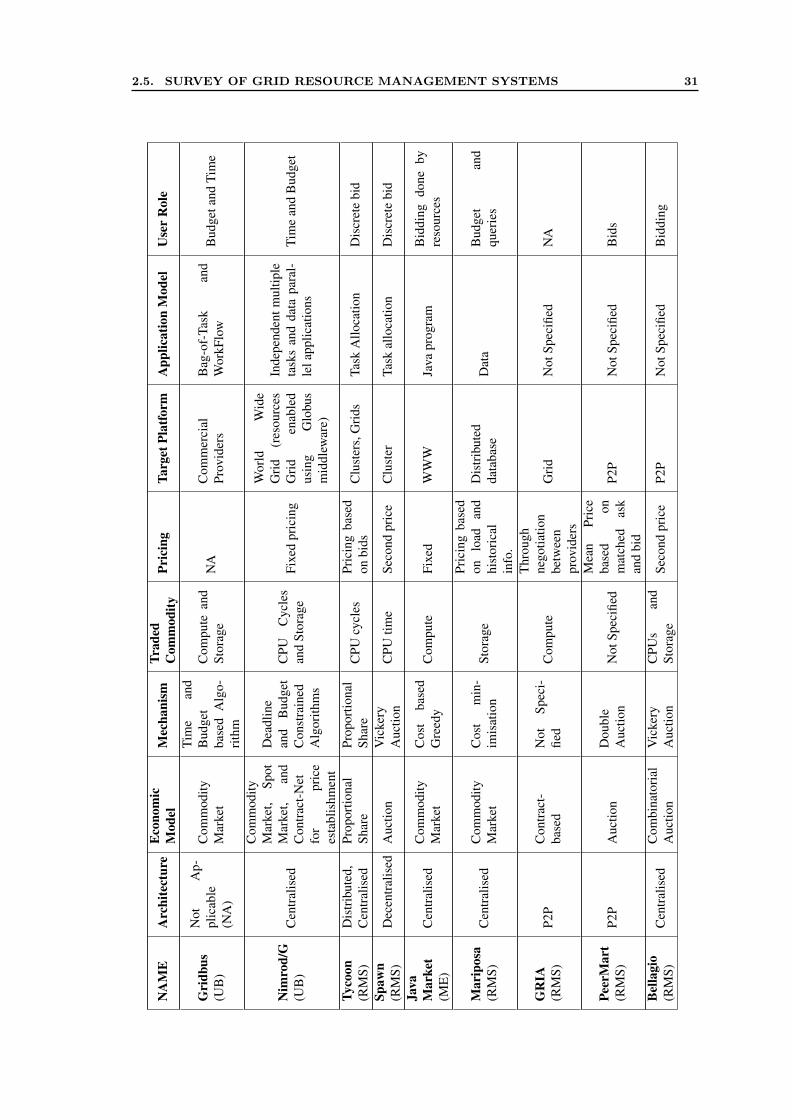
2.5. SURVEY OF GRID RESOURCE MANAGEMENT SYSTEMS 31
NA
ME
Arc
hite
ctur
eE
cono
mic
Mod
elM
echa
nism
Trad
edC
omm
odity
Pric
ing
Targ
etPl
atfo
rmA
pplic
atio
nM
odel
Use
rR
ole
Gri
dbus
(UB
)
Not
Ap-
plic
able
(NA
)
Com
mod
ityM
arke
t
Tim
ean
dB
udge
tba
sed
Alg
o-ri
thm
Com
pute
and
Stor
age
NA
Com
mer
cial
Prov
ider
sB
ag-o
f-Ta
skan
dW
orkF
low
Bud
geta
ndTi
me
Nim
rod/
G(U
B)
Cen
tral
ised
Com
mod
ityM
arke
t,Sp
otM
arke
t,an
dC
ontr
act-
Net
for
pric
ees
tabl
ishm
ent
Dea
dlin
ean
dB
udge
tC
onst
rain
edA
lgor
ithm
s
CPU
Cyc
les
and
Stor
age
Fixe
dpr
icin
g
Wor
ldW
ide
Gri
d(r
esou
rces
Gri
den
able
dus
ing
Glo
bus
mid
dlew
are)
Inde
pend
entm
ultip
leta
sks
and
data
para
l-le
lapp
licat
ions
Tim
ean
dB
udge
t
Tyco
on(R
MS)
Dis
trib
uted
,C
entr
alis
edPr
opor
tiona
lSh
are
Prop
ortio
nal
Shar
eC
PUcy
cles
Pric
ing
base
don
bids
Clu
ster
s,G
rids
Task
Allo
catio
nD
iscr
ete
bid
Spaw
n(R
MS)
Dec
entr
alis
edA
uctio
nV
icke
ryA
uctio
nC
PUtim
eSe
cond
pric
eC
lust
erTa
skal
loca
tion
Dis
cret
ebi
d
Java
Mar
ket
(ME
)C
entr
alis
edC
omm
odity
Mar
ket
Cos
tba
sed
Gre
edy
Com
pute
Fixe
dW
WW
Java
prog
ram
Bid
ding
done
byre
sour
ces
Mar
ipos
a(R
MS)
Cen
tral
ised
Com
mod
ityM
arke
tC
ost
min
-im
isat
ion
Stor
age
Pric
ing
base
don
load
and
hist
oric
alin
fo.
Dis
trib
uted
data
base
Dat
aB
udge
tan
dqu
erie
s
GR
IA(R
MS)
P2P
Con
trac
t-ba
sed
Not
Spec
i-fie
dC
ompu
te
Thr
ough
nego
tiatio
nbe
twee
npr
ovid
ers
Gri
dN
otSp
ecifi
edN
A
Peer
Mar
t(R
MS)
P2P
Auc
tion
Dou
ble
Auc
tion
Not
Spec
ified
Mea
nPr
ice
base
don
mat
ched
ask
and
bid
P2P
Not
Spec
ified
Bid
s
Bel
lagi
o(R
MS)
Cen
tral
ised
Com
bina
tori
alA
uctio
nV
icke
ryA
uctio
nC
PUs
and
Stor
age
Seco
ndpr
ice
P2P
Not
Spec
ified
Bid
ding
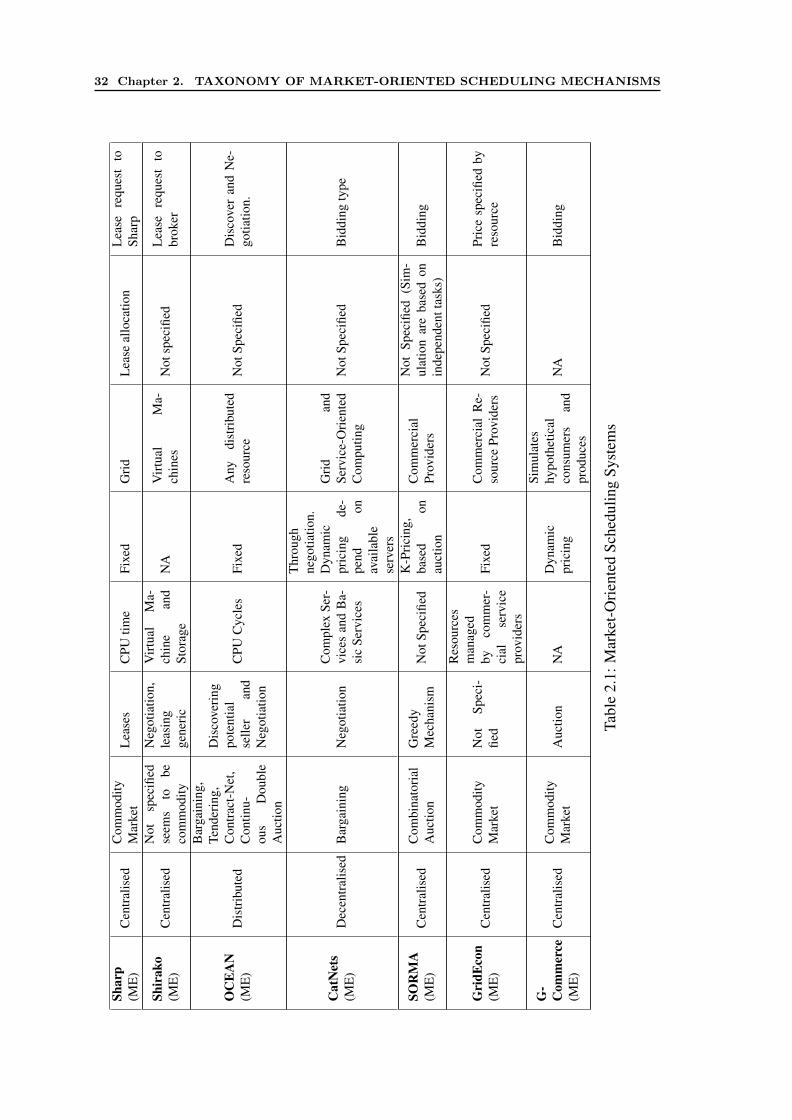
32 Chapter 2. TAXONOMY OF MARKET-ORIENTED SCHEDULING MECHANISMS
Shar
p(M
E)
Cen
tral
ised
Com
mod
ityM
arke
tL
ease
sC
PUtim
eFi
xed
Gri
dL
ease
allo
catio
nL
ease
requ
est
toSh
arp
Shir
ako
(ME
)C
entr
alis
edN
otsp
ecifi
edse
ems
tobe
com
mod
ity
Neg
otia
tion,
leas
ing
gene
ric
Vir
tual
Ma-
chin
ean
dSt
orag
eN
AV
irtu
alM
a-ch
ines
Not
spec
ified
Lea
sere
ques
tto
brok
er
OC
EA
N(M
E)
Dis
trib
uted
Bar
gain
ing,
Tend
erin
g,C
ontr
act-
Net
,C
ontin
u-ou
sD
oubl
eA
uctio
n
Dis
cove
ring
pote
ntia
lse
ller
and
Neg
otia
tion
CPU
Cyc
les
Fixe
dA
nydi
stri
bute
dre
sour
ceN
otSp
ecifi
edD
isco
ver
and
Ne-
gotia
tion.
Cat
Net
s(M
E)
Dec
entr
alis
edB
arga
inin
gN
egot
iatio
nC
ompl
exSe
r-vi
ces
and
Ba-
sic
Serv
ices
Thr
ough
nego
tiatio
n.D
ynam
icpr
icin
gde
-pe
ndon
avai
labl
ese
rver
s
Gri
dan
dSe
rvic
e-O
rien
ted
Com
putin
gN
otSp
ecifi
edB
iddi
ngty
pe
SOR
MA
(ME
)C
entr
alis
edC
ombi
nato
rial
Auc
tion
Gre
edy
Mec
hani
smN
otSp
ecifi
edK
-Pri
cing
,ba
sed
onau
ctio
n
Com
mer
cial
Prov
ider
s
Not
Spec
ified
(Sim
-ul
atio
nar
eba
sed
onin
depe
nden
ttas
ks)
Bid
ding
Gri
dEco
n(M
E)
Cen
tral
ised
Com
mod
ityM
arke
tN
otSp
eci-
fied
Res
ourc
esm
anag
edby
com
mer
-ci
alse
rvic
epr
ovid
ers
Fixe
dC
omm
erci
alR
e-so
urce
Prov
ider
sN
otSp
ecifi
edPr
ice
spec
ified
byre
sour
ce
G-
Com
mer
ce(M
E)
Cen
tral
ised
Com
mod
ityM
arke
tA
uctio
nN
AD
ynam
icpr
icin
g
Sim
ulat
eshy
poth
etic
alco
nsum
ers
and
prod
uces
NA
Bid
ding
Tabl
e2.
1:M
arke
t-O
rien
ted
Sche
dulin
gSy
stem
s
2.5. SURVEY OF GRID RESOURCE MANAGEMENT SYSTEMS 33
GRIA
GRIA (Grid Resources for Industrial Applications) [155] is a web-services based Gridmiddleware for Business-to-Business (B2B) service procurement and operation. It aims atthe development of business models and processes that make it feasible and cost-effectiveto offer and use computational services securely in an open Grid market exchange. It alsohelps the Industries to achieve better utilisation and manage demand peaks on resources.GRIA software is based on and uses web services standard specifications and tools such asApache AXIS. GRIA aiming to make Grid Middleware reliable for industrial application,thus, provides various software packages for performance estimation and QoS, workflowenforcement, cluster management, security and inter-operability semantics. Thus, eachservice provider using GRIA middleware has an account service and a resource allocationservice, as well as services to store and transfer data files, and execute jobs which processthese data files. Service provider’s interaction is based on B2B model for accounting andQoS agreement.
PeerMart
PeerMart [78] is a Peer-to-Peer market based framework which allows completely decen-tralised trading of services between peers. It includes with capability of dynamic pricingand efficient price dissemination, and services discovery over a P2P network. Using Peer-Mart, peers can bid prices for services, which enable them to govern the desired serviceperformance. PeerMart implements an economically efficient distributed Double auctionmechanism where each peer being responsible for matching several services. PeerMartuses the overlay network infrastructure to map the services onto particular sets of peersfollowing a fully distributed and redundant approach for high reliability and scalability tothe number of participating peers. Its main limitation is the tight integration of auctionmodel in the framework, making it inflexible with respect of the market model.
Bellagio
The Bellagio [9] is a resource management system that allocates resources using combina-torial auction in order maximise aggregate end-user utility. Users identify their resourcesof interest via a SWORD [125] based resource discovery mechanism and register theirpreference to a centralised auctioneer for said resources over time and space as a com-binatorial auction bids using a bidding language, which support XOR bids [122]. Thebids are formulated in the virtual currency. The auction employed in Bellagio is peri-odic. Unlike other work that focuses on the contention for a single resource (CPU cycles),they are motivated by scenarios where users express interest in ‘slices’ of heterogeneousgoods (e.g. disk space, memory, bandwidth). Bellagio employs Share [37] for resource
34 Chapter 2. TAXONOMY OF MARKET-ORIENTED SCHEDULING MECHANISMS
allocation in order to support a combinatorial auction for heterogeneous resources.
SHARP
SHARP [69] is not exactly a complete resource management system, but it is an archi-tecture to enable secure distributed resource management, resource control and sharingacross sites and trust domains. The real management and enforcement of allocationsare created by resource provider middleware which process the tickets and leases issuedby SHARP. SHARP stands for Secure Highly Available Resource Peering and is basedaround timed claims that expire after a specified period, following a classical lease model.The resource claims are split into two phases. In the first phase, a user agent obtains a‘ticket’, representing a soft claim that represents a probabilistic claim on a specific re-source for a period of time. In the second phase, the ticket must be converted into aconcrete reservation by contracting the resources site authority and requesting a ‘lease’.These two phases allow SHARP system to become oversubscribed by issuing more tick-ets than it can support. SHARP also presents a very strong security model to exchangeclaims between agents, either user agents or 3rd party brokers, and that then achievesidentification, non-repudiation, encryption, and prevents man-in-the-middle attacks.
CATNET
CATNET Project [54] proposed a Catallaxy based market place where trading is dividedinto two layers, the application and service layer. The notion of a Catallaxy based marketfor Grids was proposed by Austrian economist F.A. von Hayek. In this market, pricesevolve from the actions of economically self-interested participants which try to max-imise their own gain whilst having limited information available to them. In the applica-tion layer, complex services are mapped to basic services. The service layer maps servicerequests to actual resources provided by local resource managers. There are two marketswhich operate simultaneously - one for buying resources by service providers from re-source providers, and another for buying services by clients from service providers. Thus,the client is not aware of the details of the resource provider, and vice versa. The prices arefixed in two markets by bilateral bargaining. CATNETS offers very interesting featuresbut lacks comprehensive support (e.g., monitoring, multi platform deployment).
In both layers, the participants have varying objectives which change dynamically andunpredictably over time. In the application/service layer, a complex service is a proxywho negotiates the access to bundles of basic service capabilities for execution on behalfof the application. Basic services provide an interface to access computational resourcesAgents representing the complex services, basic services and resources participate in apeer-to-peer trading network, on which requests are disseminated and when an appropriateprovider is found, agents engage in a bilateral bargaining [55].
2.5. SURVEY OF GRID RESOURCE MANAGEMENT SYSTEMS 35
Shirako
Shirako [87] is a generic and extensible system that is motivated by SHARP for on-demand leasing of shared networked resources across clusters. Shirako framework con-sists of distributed brokers which provision the resources advertised by provider sites tothe guest applications. Thus, it enables users to lease groups of resources from multipleproviders over multiple physical sites through broker service. Site authorities computeand advertise the amount of free resource by issuing resource tickets to the selected bro-kers. When a broker approves a request, it issues a ticket that is redeemable for a lease ata site authority. The ticket specifies the resource type, resource units granted and the val-idation period. SHIRAKO allows ‘flexible’ resource allocation through leases which canbe re-negotiated and extended via mutual agreement. A request can be defined as ‘elastic’to specify a user will accept fewer resources if its full allocation is not available. Requestscan be ‘deferrable’ if a user will accept a later start time than what is specified in the leaseif that time is unavailable. The function of broker is to prioritise the request and matchto appropriate resource type and quantity. Provider side is represented by site authoritiesthat run Cluster on Demand [31] to configure the resources allocated at the remote sites.
OCEAN
OCEAN (Open Computation Exchange and Arbitration Network) [127] is a market basedsystem for matching user applications with resources in the high performance computingenvironments, such as Cluster and Grid computing. It consists of all major componentsrequired to build utility Grid, such as user node which submit trade proposals, computa-tional resource and underlying market mechanism. Ocean first discovers potential sellersby announcing a buyer’s trade proposal using optimised P2P search protocol. Then, theuser node can negotiate with sellers based on the rules dynamically defined in a XML for-mat. The ability to define negotiation rules is a remarkable characteristic of OCEAN thatallows the adaptation of the economic model to diverse applications. The two possiblenegotiation allowed by OCEAN are “yes/no” and automated bargain.
SORMA
Based on market engineering principles, the SORMA project [121] proposed an OpenGrid Market which is built above the existing RMSs. It consists of self-interested resourcebrokers and user-agents. The users submit their bids for resources to the Open Grid Mar-ket using an autonomous bidding agent. On the other side of the market, the resourceside bidding agents publish automatically available resources based on their predefinedpolicies. The Open Grid Market matches requesting and offering bids and executes themagainst each other using Combinatorial Auction. The matches (i.e. allocations) are for-
36 Chapter 2. TAXONOMY OF MARKET-ORIENTED SCHEDULING MECHANISMS
mulated in SLAs (i.e. contracts). The Grid middleware is responsible for the resourceprovisioning and the payment system (such as PayPal) for the monetary transfer of funds.The open infrastructure of Open Grid Market allows various resource providers with dif-ferent virtualisation platforms or managers to easily plug in the market.
GridEcon
GridEcon Project [4] proposed a market exchange technology that allows many (smalland medium) providers to offer their resources for sale. To support buying and sellingof resources, GridEcon market offers various services that makes exchange of commod-ity convenient, secure, and safe. The GridEcon market also proposed to design a seriesof value-added services on top of the market exchange (e.g. insurance against resourcefailures, capacity planning, resource quality assurance, stable price offering), ensuringquality of the traded goods for Grid users. Currently, GridEcon supports only commoditymarket model where commercial resource providers can advertise their spare resources.The fixed pricing is used to allow users to sell and buy resources. The GridEcon marketdelegates the real resource management to commercial service providers.
G-Commerce
G-Commerce [169] provides a framework for trading computer resources (CPU and harddisk) in commodity markets and Vickrey auctions. By comparing the results of both mar-ket strategies in terms of price stability, market equilibrium, consumer efficiency, andproducer efficiency, the G-commerce project concludes that commodity market is a betterchoice for controlling Grid resources than the existing auction strategies. It is argued andshown in simulations that this model achieves better price predictability than auctions.Thus, G-commerce is a Grid resource allocation system based on the commodity mar-ket model where providers decide the selling price after considering long-term profit andpast performance. The simulated auctions are winner-takes-it-all auctions and not pro-portional share, leading to reduced fairness and starvation. Furthermore, the auctions areonly performed locally and separately on all hosts, leading to poor efficiency.
2.5.2 System-Oriented Schedulers
For over a decade various technologies have enabled applications to be deployed on theGrids, including Grid middleware such as Globus [64], Legion [30], and gLite [8]; sched-ulers such as Application Level Schedulers (AppLeS) [11]; and resource brokers includingGridbus Resource Broker [163], Nimrod/G [1], Condor-G [68], and GridWay [85]. Thesemeta-schedulers or resource management systems interact with Local Schedulers or Grid
2.5. SURVEY OF GRID RESOURCE MANAGEMENT SYSTEMS 37
Middleware of various resource sites. The Local Scheduler supported such as Load Shar-ing Facility (LSF) [180], Open Portable Batch System (Open PBS [79] and Grid Engine(SGE / N1GE) [71]. In following section, we discuss some of the scheduling systems indetail and compare them using a Table 2.2.
Community Scheduler Framework (CSF)
The Community Scheduler Framework (CSF) [172] is an open source tool set for im-plementing a Grid meta-scheduler using the Globus Toolkit Services. The Grid meta-scheduler provides an environment for dispatching jobs to various resource managers.CSF was developed by Platform Computing in cooperation with the Jilin University,China. The CSF provides plug-in for various heterogeneous schedulers such as PlatformLoad Sharing Facility (LSF), Open Portable Batch System (Open PBS) and Grid Engine(SGE / N1GE), however CSF is designed for the best compliance with Platform LSF.
CSF implements by default two basic scheduling algorithms i.e. Round-robin andreservation based algorithm. For the later algorithm, CSF facilitates advance reservationof resources for its users. Thus, users can make resource reservation using ResourceManager Tool of CSF, in order to guarantee the resource availability at a specified time.In addition, it also provides submission and monitoring tools to its users.
Computing Centre Software (CCS)
CCS [132] is a vendor-independent resource management software that manages geo-graphically distributed High Performance Computers. It is analogous to Globus and con-sists of three main components the CCS, which is a vendor-independent Local ResourceManagement Schedulers (LRMSs) for local HPC systems; the Resource and Service De-scription (RSD), used by the CCS to specify, and map hardware and software compo-nents of computing environments; and the Service Coordination Layer (SCL), which co-ordinates the resource usage across multiple computing sites. CCS schedules and mapsinteractive and parallel jobs using an enhanced first-come-first-served (FCFS) schedulerwith backfilling. Deadline scheduling is another feature of CCS that gives the flexibilityto improve the system utilisation by scheduling batch jobs at the earliest convenient andat the latest possible time. It also supports jobs with reservation requirements. At themeta-computing level, the Centre Resource Manager (CRM) is a layer above the CCSislands that exposes CSS scheduling features. When a user submits an application, theCRM maps the user request to the static and dynamic information regarding available re-sources through Centre Information Server (CIS). Centre Information Server (CIS) is apassive component that contains information about resources and their status. Once theCRM finds resources, it interacts with selected CCS islands for resource allocations. Ifnot all resources are available, the CRM either re-schedules the request or rejects it.
38 Chapter 2. TAXONOMY OF MARKET-ORIENTED SCHEDULING MECHANISMS
GridWay
GridWay [85] is a meta-scheduler framework developed by a team working for DistributedArchitecture Group from Universidad Complutense in Madrid, Spain. GridWay providesa transparent job execution management and resource brokering to the end user in a ‘sub-mit and forget’ fashion. GridWay uses the Globus GRAM to interface with remote re-sources and, thus it can support all remote platforms and resource managers (for examplefork, PBS and LSF) compatible with Globus. GridWay offers only simple schedulingcapabilities even though custom scheduling algorithms are also supported. By default,GridWay follows the “greedy approach”, implemented by the round-robin algorithm. Thecollective scheduling of many jobs is not supported by the meta-scheduler. GridWayalso provides sophisticated resource discovery, scheduling, constant monitoring and self-adaptive job migration to increase performance. Thus, an application is able to decideabout resource selection as it operates, i.e. it can modify its requirements and request amigration. GridWay also enables the deployment of virtual machines in a Globus Grid.
Moab (Silver) Grid Scheduler
Moab Grid Scheduler is a Grid metascheduler developed by Cluster Resources Inc. Moaballows combining the resources from multiple high performance computing systems whileproviding a common user interface to all resources. It supports intelligent load balancingand advanced allocation allowing a job to be run over multiple machines in a homoge-neous way or in a heterogeneous way resulting in better overall utilisation and better time.Moab supports all major scheduling systems and even optionally relies on Globus ToolkitGrid middleware for security and user account management purposes. It manages theresources on any system where Moab Workload Manager (a part of Moab Cluster Suite)is installed. Moab Workload Manager is a policy engine that allows sites to control theallocation of available resources to jobs. The meta-scheduler supports fine-grained Gridlevel fairness policies. Using these policies, the system manager may configure com-plex throttling rules, fairshare, a hierarchical prioritisation, and cooperation with alloca-tion managers. Moab also has support for advanced reservations. This feature enablesscheduling techniques such as backfilling, deadline based scheduling, QoS support andGrid scheduling. One of the most interesting features going to be added in Moab is sup-port for resource selection based on utility function where job completion time, resourcecost, and other parameters are taken into account. These features allow easy transition ofMoab meta-scheduler to market-oriented Grid.
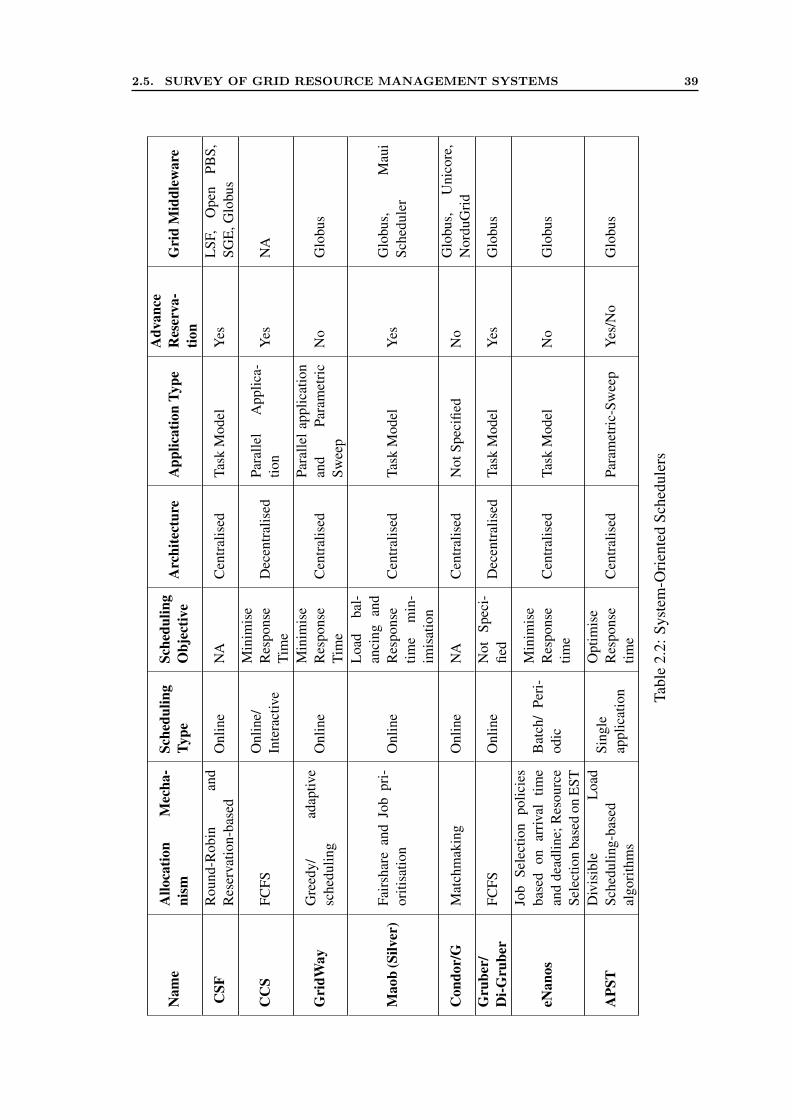
2.5. SURVEY OF GRID RESOURCE MANAGEMENT SYSTEMS 39
Nam
eA
lloca
tion
Mec
ha-
nism
Sche
dulin
gTy
peSc
hedu
ling
Obj
ectiv
eA
rchi
tect
ure
App
licat
ion
Type
Adv
ance
Res
erva
-tio
nG
rid
Mid
dlew
are
CSF
Rou
nd-R
obin
and
Res
erva
tion-
base
dO
nlin
eN
AC
entr
alis
edTa
skM
odel
Yes
LSF
,O
pen
PBS,
SGE
,Glo
bus
CC
SFC
FSO
nlin
e/In
tera
ctiv
e
Min
imis
eR
espo
nse
Tim
eD
ecen
tral
ised
Para
llel
App
lica-
tion
Yes
NA
Gri
dWay
Gre
edy/
adap
tive
sche
dulin
gO
nlin
eM
inim
ise
Res
pons
eTi
me
Cen
tral
ised
Para
llela
pplic
atio
nan
dPa
ram
etri
cSw
eep
No
Glo
bus
Mao
b(S
ilver
)Fa
irsh
are
and
Job
pri-
oriti
satio
nO
nlin
e
Loa
dba
l-an
cing
and
Res
pons
etim
em
in-
imis
atio
n
Cen
tral
ised
Task
Mod
elY
esG
lobu
s,M
aui
Sche
dule
r
Con
dor/
GM
atch
mak
ing
Onl
ine
NA
Cen
tral
ised
Not
Spec
ified
No
Glo
bus,
Uni
core
,N
ordu
Gri
dG
rube
r/D
i-Gru
ber
FCFS
Onl
ine
Not
Spec
i-fie
dD
ecen
tral
ised
Task
Mod
elY
esG
lobu
s
eNan
os
Job
Sele
ctio
npo
licie
sba
sed
onar
rival
time
and
dead
line;
Res
ourc
eSe
lect
ion
base
don
EST
Bat
ch/
Peri
-od
ic
Min
imis
eR
espo
nse
time
Cen
tral
ised
Task
Mod
elN
oG
lobu
s
APS
TD
ivis
ible
Loa
dSc
hedu
ling-
base
dal
gori
thm
s
Sing
leap
plic
atio
n
Opt
imis
eR
espo
nse
time
Cen
tral
ised
Para
met
ric-
Swee
pY
es/N
oG
lobu
s
Tabl
e2.
2:Sy
stem
-Ori
ente
dSc
hedu
lers
40 Chapter 2. TAXONOMY OF MARKET-ORIENTED SCHEDULING MECHANISMS
Condor-G
Condor-G [68] is a fault tolerant job submission system that can access various computingresources which employs softwares from Globus and Condor [108] to allocate resourcesto users in multiple domains. Condor-G is not a real broker but a job manager, thus itdoes not support scheduling policies but it provides framework to implement schedulingarchitecture about it. Condor-G can cooperate with the following middleware: GlobusToolkit (2.4.x - 4.0.x), Unicore and NorduGrid, and it can submit jobs to Condor, PBSand Grid Engine (SGE / N1GE) scheduling systems. Condor’s Classified Advertisementlanguage (ClassAd) MatchMaking tool allows users to specify which resource to allocate.The mechanism allows both jobs and machines to describe attributes about themselves,their requirements and preferences, and matches result in a logical-to physical binding.The GlideIn mechanism is also provided in Condor-G that starts a daemon processeswhich can advertise resource availability which is used by Condor-G to match locallyqueued jobs to resources advertised. The command-line interface is provided to performbasic job management such as submitting a job, indicating executable input and outputfiles and arguments, querying a job status or cancelling a job. The most striking capabilityof Condor-G is its failure management which can deal with crashes at various levels.
Gruber/DI-Gruber
To avoid bottleneck of a central broker, DI-Gruber [49] is implemented as a completelydistributed resource broker. It has been developed as an extension of the SLA basedGRUBER broker deployed on the Open Science Grid.
The Gruber system [48] consists of four main components. The engine implementsseveral algorithms necessary for determining optimised resource assignments. The sitemonitor acts as a data provider that publishes the status of Grid resources. The site selectorprovides the information about sites which is used for selecting a resource provider forexecution of new tasks. It communicates with the engine to select the resource provider.The queue manager resides on submitting hosts, deciding which jobs can be executed atwhat time. The Gruber can be utilised as the queue manager that controls the start time ofjobs and enforces Virtual Organisation (VO) policies, or as a site recommender when thequeue manager is not available.
eNanos Resource Broker
eNANOS [134] is a general purpose OGSI-compliant resource broker developed by theBarcelona Supercomputing Center. It abstracts Grid resources and provides an API-basedmodel to access the Grid. The eNanos Grid resource broker is implemented on top ofGlobus Toolkit (GT) and supports both GT2 and GT3. It focuses on resource discov-
2.6. DISCUSSION AND GAP ANALYSIS 41
ery and management, failure handling, and dynamic policy management for job schedul-ing and resource selection. The eNanos Grid resource broker provides dynamic policymanagement and multi-criteria user requirements which are described in an XML docu-ment. These multi-criteria descriptions are used for resource filtering and ranking. Thejob scheduling in eNanos broker is divided into three phases, first is to select job to beschedule, second to select resource for selected job, and finally using meta-policy whichconsists of selection of the best job and the best resource. For job scheduling, several po-lices are implemented such as FIFOjobPolicy (First In First Out), REALTIMEjobPolicy(minimises REALTIME=deadline time-estimated time of job finalisation), EDFjobPol-icy (Earliest Deadline First). Similarly for resource selection RANKresPolicy (resourceselection based in the greatest rank obtained from the resource filtering process), ESTre-sPolicy (Earliest Starting Time, based in the estimated waiting time for a job in a localqueue). Jobs are queued up in the local system, and periodically scheduled by the resourcebroker.
AppLeS Parameter Sweep Template (APST)
APST [11] is an application level scheduler that provides an environment for schedul-ing and deploying large-scale parameter sweep applications (PSAs) on Grid platforms.APST supports scheduling and job submission on different Grid middleware and sched-ulers that take into account PSAs with data requirements. The APST scheduler allocatesresources based on several parameters including predictions of resource performance, ex-pected network bandwidths and historical data. The scheduler takes help of tools such asDataManger and ComputeManager to deploy and monitor data transfers and computationrespectively which in turn get information from sources such as Network Weather Service(NWS) [170] and the Globus Monitoring and Discovery Service (MDS) [95]. AppLeSinteracts directly with resource managers, performs all application management tasks, in-cluding, e.g., file staging, and can enact collations of applications. APST is compatiblewith different low-level Grid middleware through the use of Actuators and also allows fordifferent scheduling algorithms to be implemented.
2.6 Discussion and Gap analysis
After understanding the basic features of various market-oriented and system-orientedschedulers, based on presented taxonomy and requirements of utility Grids, we can iden-tify several outstanding issues that are yet to be explored to adopt a Grid for creating autility computing environment.
42 Chapter 2. TAXONOMY OF MARKET-ORIENTED SCHEDULING MECHANISMS
2.6.1 Scheduling Mechanisms
The market oriented scheduling mechanisms vary based on a market model used for trad-ing resources. For example, if auction is the main market model then strategies for biddingand auction selection are required to maximise the chances of winning the auction. Whilein a commodity model, aggregation of resources from different provider is required tomaximise user’s utility. The challenges which are needed to be tackled more deeply canbe categorised as following:
Support for multiple QoS parameters
In utility Grids, other than traditional QoS requirements of users such as response time,additional QoS issues are needed to be addressed. For example, for HPC application, onehas to minimise the execution time, thus, the resource capability and availability becomesessential which may be contradictory to the budget constraint. Many factors, such asdeadline, resource reliability and security, need to be considered with monetary cost whilemaking a scheduling decision on utility Grids. Similarly, the resource management systemshould support QoS based scheduling and monitoring to deliver the quality service.
Support for different application type
The current market-oriented scheduling mechanisms mainly support simpler applications/job models such as parameter-sweep. But, in reality, more advanced job models thatcomprise parallel job processing type and multiple-task data intensive applications, suchas message-passing and workflow applications are also required by users. Thus, advancedalgorithms, which require concurrent negotiation with multiple resource providers, areneeded to be designed.
Support for market-oriented meta-scheduling mechanisms
Currently, most of the scheduling approaches in utility Grids are studied from an auctionperspective [143] (Schnizler et al., 2008). However, auctions based scheduling may not bealways suitable, particularly when users want immediate access to resources or they arepart of the same community. As an example of a user community, we consider the finan-cial institution Morgan Stanley that has various branches across the world. Each branchhas computational needs and QoS (Quality of Service) constraints that can be satisfied byGrid resources. In this scenario, it is more appealing for the company to schedule variousapplications in a coordinated manner. Furthermore, another goal is to minimise the costof using resources to all users across the community. Thus, mechanisms are required foruser selection, and then resource allocation for utility maximisation across all users. To
2.6. DISCUSSION AND GAP ANALYSIS 43
tackle the problem of coordination and utility maximisation among concurrent users, thisthesis proposes market-oriented meta-scheduling mechanisms in the three scenarios.
2.6.2 Market-Oriented Systems
In the previous sections, we discussed major systems which support market based mech-anisms to buy and sell resources, and execute applications. Some of the most importantoutstanding issues from user, provider and market exchange perspective are presented asfollows:
User Level Middleware
User level Middleware such as Gridbus broker [163] and GridWay [85] are designed onlyto participate in commodity market model. Moreover, they are not designed to trade inthe market exchange for leasing resources. Thus, this infrastructure support is needed toprovide flexibility to user for trading in any market. Moreover, automatic bidding supportis required to participate in auctions used by systems such as Tycoon [104].
Market Exchange
As discussed previously, users and providers can also start negotiation using market ex-change’s services. The market exchange services are needed to match multiple usersto multiple providers. The market exchange systems such as Catnet [54], Bellagio [9],GridEcon [4] and SORMA [121]have restrictive price setting and negotiation policies. Inreal marketplaces, the choice of negotiation and pricing protocols are decided by partici-pants in the system. This flexibility is critical because the choice of negotiation protocol(auction, commodity market, and one-to-one) and pricing (fixed, variable) can affect theparticipants utility enormously depending on the current demand and supply.
As the number of consumers and providers grows scalability of the market exchangewill become an issue. Thus, some of the components such as job submission and mon-itoring, which are already well supported by user brokers and meta-schedulers, can bedelegated to them. It makes the system more decentralised in the sense that, market ex-change mainly act as the middleman for matching users demand to providers supply, andother responsibilities during job submission and execution will be delegated to user andprovider’s brokers (or RMSs).
A reputation system would also compliment the market exchanges by removing theunreliable and malicious users from the market. In addition to that, marketplaces areneeded to be flexible enough to allow the participants to use market protocols of theirchoice. This feature will require co-existence of multiple negotiations between consumersand providers. This thesis proposes a market exchange architecture to overcome some of
44 Chapter 2. TAXONOMY OF MARKET-ORIENTED SCHEDULING MECHANISMS
the short-comings of existing systems by allowing co-existence of multiple negotiation ofdifferent types.
Core Middleware (i.e., Resource Level Middleware)
Similar to the user level middleware, the existing resource middleware are needed to beextended to participate in market exchange. In addition, these systems support simple jobmodels, and thus more advanced job models such as workflows need to be considered. Inaddition to that, SLA monitoring is required to ensure that user’s QoS satisfaction.
2.7 Summary
In this chapter, a taxonomy and survey of market-based resource allocation approachesand systems are presented. This chapter also provides an overview of the key requirementsand components which are needed to be added in the existing Grid middleware in orderto support the utility computing. The taxonomy categorises the market-based resourceallocation approaches from five different angles: (i) allocation decisions (ii) mechanism’sobjective (iii) market model (iv) application model (v) participant focus. This taxonomyis then used to classify various Grid middleware, which helps to examine current state-of-the-art in utility Grids, thus identifying gaps which are needed to be filled in.
In the utility Grid, several projects are working to solve issues from both user andprovider perspectives. The rapid emergence of utility computing infrastructures such asAmazon’s Elastic Cloud, combined with industrial and academic High Performance Com-puting (HPC) demand, has increased the development of open marketplaces. However,significant work is required to fully benefit from the capabilities of utility Grids. Specif-ically, the need for coordination between different participants while maximising theirutilities has not been addressed. The lack of coordination can lead to underutilisation ofresources and starvation of low income users. Thus, market-based meta-scheduling mech-anisms are required to tackle such challenges, particularly in situations where a schedul-ing decision can affect more than just the immediate users and providers. In the followingchapters, these issues are addressed in different contexts by proposing “Meta-Broker” ar-chitecture which is a market-oriented meta-scheduler. This meta-broker service can bepart of a market exchange and interact with user and resource brokers (middleware).
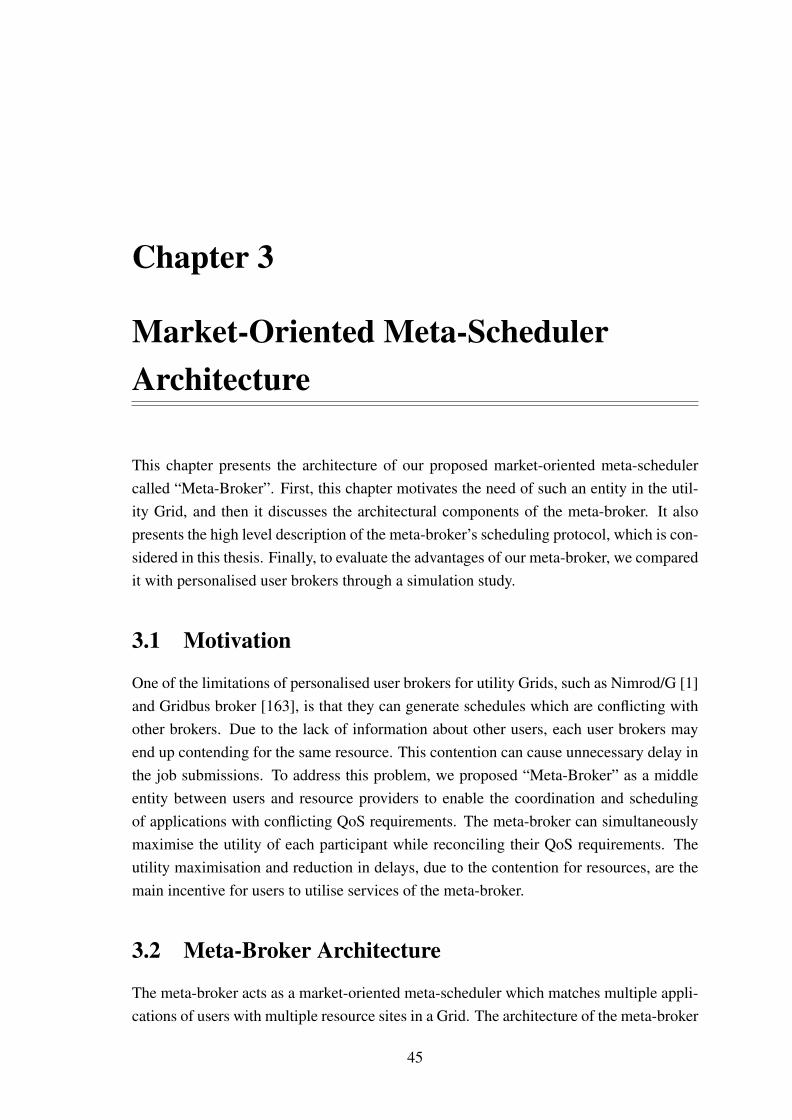
Chapter 3
Market-Oriented Meta-SchedulerArchitecture
This chapter presents the architecture of our proposed market-oriented meta-schedulercalled “Meta-Broker”. First, this chapter motivates the need of such an entity in the util-ity Grid, and then it discusses the architectural components of the meta-broker. It alsopresents the high level description of the meta-broker’s scheduling protocol, which is con-sidered in this thesis. Finally, to evaluate the advantages of our meta-broker, we comparedit with personalised user brokers through a simulation study.
3.1 Motivation
One of the limitations of personalised user brokers for utility Grids, such as Nimrod/G [1]and Gridbus broker [163], is that they can generate schedules which are conflicting withother brokers. Due to the lack of information about other users, each user brokers mayend up contending for the same resource. This contention can cause unnecessary delay inthe job submissions. To address this problem, we proposed “Meta-Broker” as a middleentity between users and resource providers to enable the coordination and schedulingof applications with conflicting QoS requirements. The meta-broker can simultaneouslymaximise the utility of each participant while reconciling their QoS requirements. Theutility maximisation and reduction in delays, due to the contention for resources, are themain incentive for users to utilise services of the meta-broker.
3.2 Meta-Broker Architecture
The meta-broker acts as a market-oriented meta-scheduler which matches multiple appli-cations of users with multiple resource sites in a Grid. The architecture of the meta-broker
45
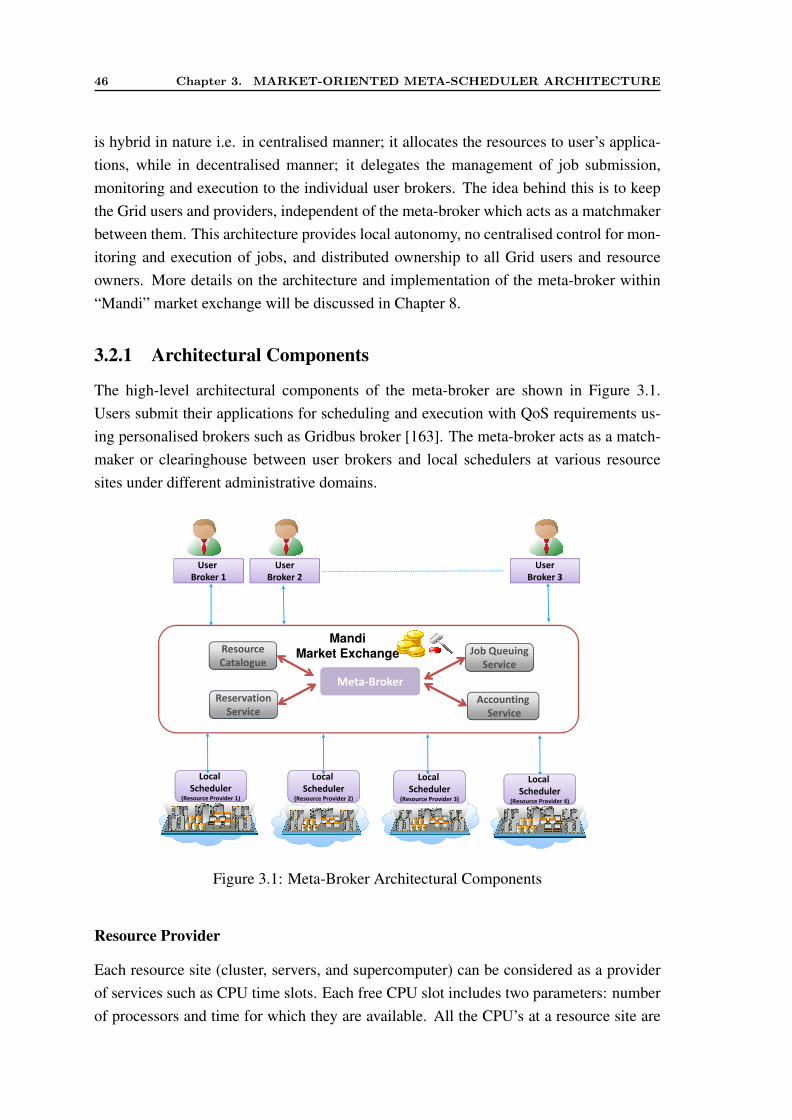
46 Chapter 3. MARKET-ORIENTED META-SCHEDULER ARCHITECTURE
is hybrid in nature i.e. in centralised manner; it allocates the resources to user’s applica-tions, while in decentralised manner; it delegates the management of job submission,monitoring and execution to the individual user brokers. The idea behind this is to keepthe Grid users and providers, independent of the meta-broker which acts as a matchmakerbetween them. This architecture provides local autonomy, no centralised control for mon-itoring and execution of jobs, and distributed ownership to all Grid users and resourceowners. More details on the architecture and implementation of the meta-broker within“Mandi” market exchange will be discussed in Chapter 8.
3.2.1 Architectural Components
The high-level architectural components of the meta-broker are shown in Figure 3.1.Users submit their applications for scheduling and execution with QoS requirements us-ing personalised brokers such as Gridbus broker [163]. The meta-broker acts as a match-maker or clearinghouse between user brokers and local schedulers at various resourcesites under different administrative domains.
Resource
Catalogue
Meta-Broker
Mandi
Market Exchange Job Queuing
Service
User User
Broker 1
UserUser
Broker 2
UserUser
Broker 3
Meta-Broker
Local
(Resource Provider 1)
Local
Scheduler(Resource Provider 1)
Reservation
ServiceAccounting
Service
Local Local
Scheduler(Resource Provider 2)
Local
Scheduler(Resource Provider 3)
Local
(Resource Provider 4)
Local
Scheduler(Resource Provider 4)
Figure 3.1: Meta-Broker Architectural Components
Resource Provider
Each resource site (cluster, servers, and supercomputer) can be considered as a providerof services such as CPU time slots. Each free CPU slot includes two parameters: numberof processors and time for which they are available. All the CPU’s at a resource site are
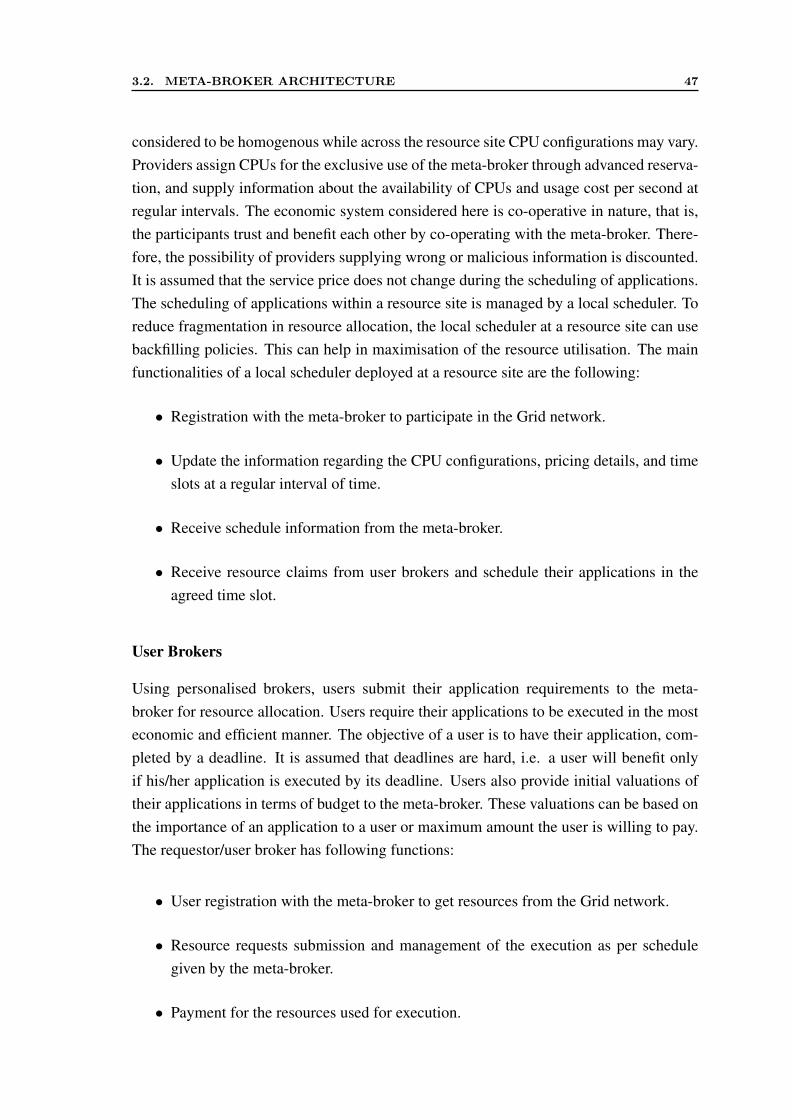
3.2. META-BROKER ARCHITECTURE 47
considered to be homogenous while across the resource site CPU configurations may vary.Providers assign CPUs for the exclusive use of the meta-broker through advanced reserva-tion, and supply information about the availability of CPUs and usage cost per second atregular intervals. The economic system considered here is co-operative in nature, that is,the participants trust and benefit each other by co-operating with the meta-broker. There-fore, the possibility of providers supplying wrong or malicious information is discounted.It is assumed that the service price does not change during the scheduling of applications.The scheduling of applications within a resource site is managed by a local scheduler. Toreduce fragmentation in resource allocation, the local scheduler at a resource site can usebackfilling policies. This can help in maximisation of the resource utilisation. The mainfunctionalities of a local scheduler deployed at a resource site are the following:
• Registration with the meta-broker to participate in the Grid network.
• Update the information regarding the CPU configurations, pricing details, and timeslots at a regular interval of time.
• Receive schedule information from the meta-broker.
• Receive resource claims from user brokers and schedule their applications in theagreed time slot.
User Brokers
Using personalised brokers, users submit their application requirements to the meta-broker for resource allocation. Users require their applications to be executed in the mosteconomic and efficient manner. The objective of a user is to have their application, com-pleted by a deadline. It is assumed that deadlines are hard, i.e. a user will benefit onlyif his/her application is executed by its deadline. Users also provide initial valuations oftheir applications in terms of budget to the meta-broker. These valuations can be based onthe importance of an application to a user or maximum amount the user is willing to pay.The requestor/user broker has following functions:
• User registration with the meta-broker to get resources from the Grid network.
• Resource requests submission and management of the execution as per schedulegiven by the meta-broker.
• Payment for the resources used for execution.
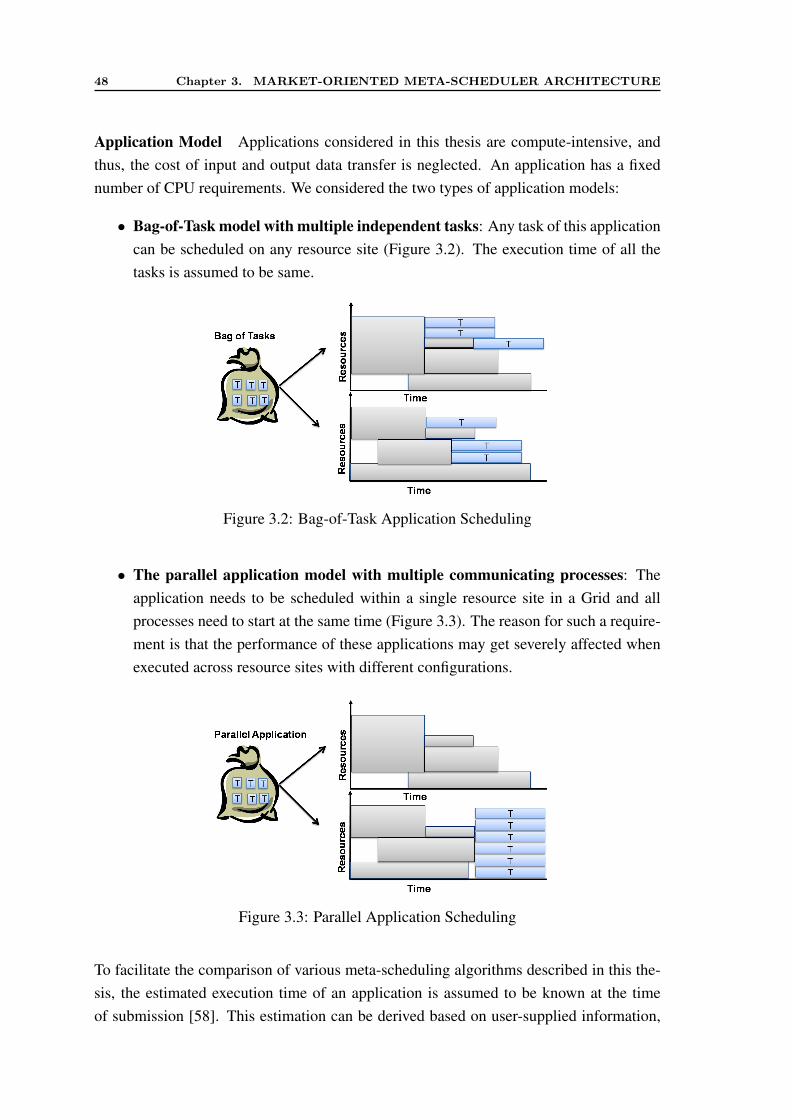
48 Chapter 3. MARKET-ORIENTED META-SCHEDULER ARCHITECTURE
Application Model Applications considered in this thesis are compute-intensive, andthus, the cost of input and output data transfer is neglected. An application has a fixednumber of CPU requirements. We considered the two types of application models:
• Bag-of-Task model with multiple independent tasks: Any task of this applicationcan be scheduled on any resource site (Figure 3.2). The execution time of all thetasks is assumed to be same.
Figure 3.2: Bag-of-Task Application Scheduling
• The parallel application model with multiple communicating processes: Theapplication needs to be scheduled within a single resource site in a Grid and allprocesses need to start at the same time (Figure 3.3). The reason for such a require-ment is that the performance of these applications may get severely affected whenexecuted across resource sites with different configurations.
Figure 3.3: Parallel Application Scheduling
To facilitate the comparison of various meta-scheduling algorithms described in this the-sis, the estimated execution time of an application is assumed to be known at the timeof submission [58]. This estimation can be derived based on user-supplied information,
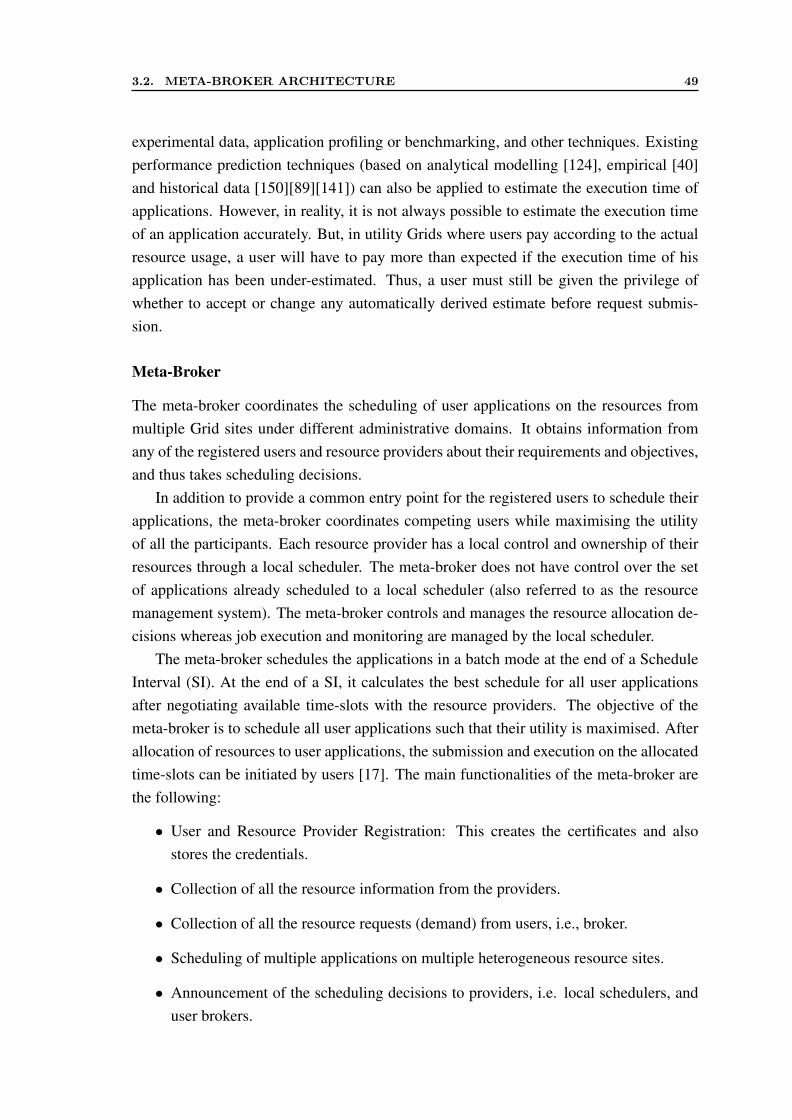
3.2. META-BROKER ARCHITECTURE 49
experimental data, application profiling or benchmarking, and other techniques. Existingperformance prediction techniques (based on analytical modelling [124], empirical [40]and historical data [150][89][141]) can also be applied to estimate the execution time ofapplications. However, in reality, it is not always possible to estimate the execution timeof an application accurately. But, in utility Grids where users pay according to the actualresource usage, a user will have to pay more than expected if the execution time of hisapplication has been under-estimated. Thus, a user must still be given the privilege ofwhether to accept or change any automatically derived estimate before request submis-sion.
Meta-Broker
The meta-broker coordinates the scheduling of user applications on the resources frommultiple Grid sites under different administrative domains. It obtains information fromany of the registered users and resource providers about their requirements and objectives,and thus takes scheduling decisions.
In addition to provide a common entry point for the registered users to schedule theirapplications, the meta-broker coordinates competing users while maximising the utilityof all the participants. Each resource provider has a local control and ownership of theirresources through a local scheduler. The meta-broker does not have control over the setof applications already scheduled to a local scheduler (also referred to as the resourcemanagement system). The meta-broker controls and manages the resource allocation de-cisions whereas job execution and monitoring are managed by the local scheduler.
The meta-broker schedules the applications in a batch mode at the end of a ScheduleInterval (SI). At the end of a SI, it calculates the best schedule for all user applicationsafter negotiating available time-slots with the resource providers. The objective of themeta-broker is to schedule all user applications such that their utility is maximised. Afterallocation of resources to user applications, the submission and execution on the allocatedtime-slots can be initiated by users [17]. The main functionalities of the meta-broker arethe following:
• User and Resource Provider Registration: This creates the certificates and alsostores the credentials.
• Collection of all the resource information from the providers.
• Collection of all the resource requests (demand) from users, i.e., broker.
• Scheduling of multiple applications on multiple heterogeneous resource sites.
• Announcement of the scheduling decisions to providers, i.e. local schedulers, anduser brokers.
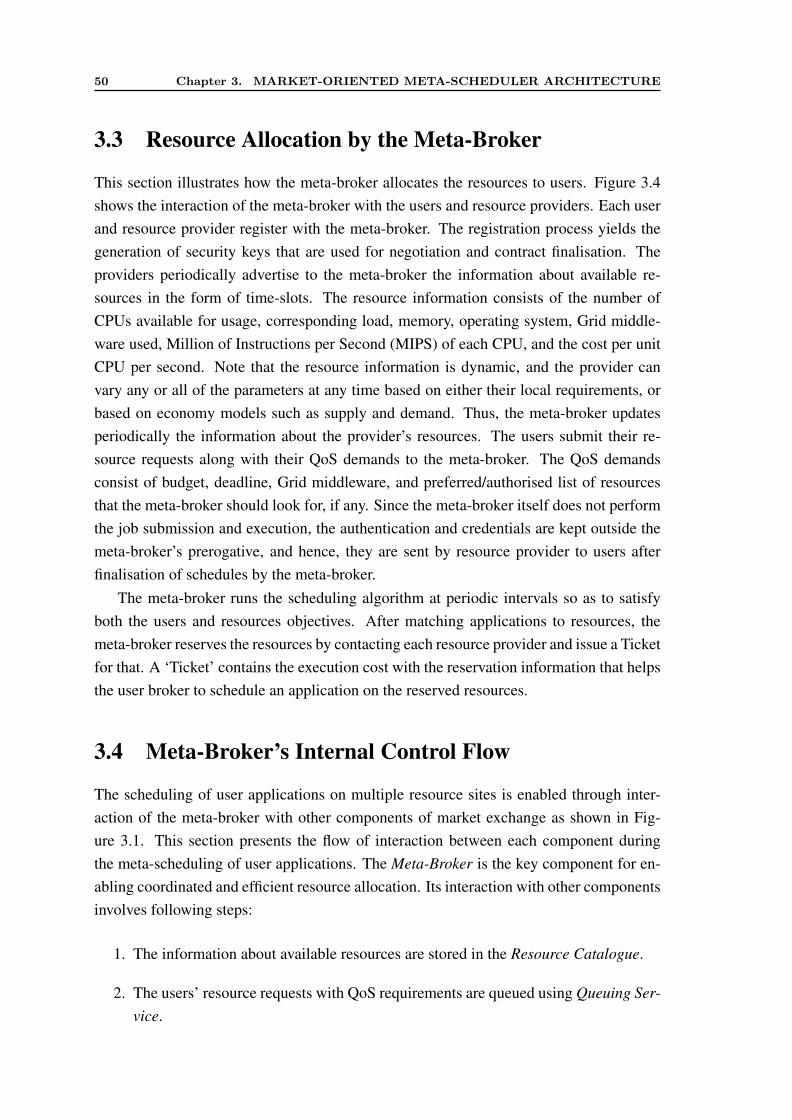
50 Chapter 3. MARKET-ORIENTED META-SCHEDULER ARCHITECTURE
3.3 Resource Allocation by the Meta-Broker
This section illustrates how the meta-broker allocates the resources to users. Figure 3.4shows the interaction of the meta-broker with the users and resource providers. Each userand resource provider register with the meta-broker. The registration process yields thegeneration of security keys that are used for negotiation and contract finalisation. Theproviders periodically advertise to the meta-broker the information about available re-sources in the form of time-slots. The resource information consists of the number ofCPUs available for usage, corresponding load, memory, operating system, Grid middle-ware used, Million of Instructions per Second (MIPS) of each CPU, and the cost per unitCPU per second. Note that the resource information is dynamic, and the provider canvary any or all of the parameters at any time based on either their local requirements, orbased on economy models such as supply and demand. Thus, the meta-broker updatesperiodically the information about the provider’s resources. The users submit their re-source requests along with their QoS demands to the meta-broker. The QoS demandsconsist of budget, deadline, Grid middleware, and preferred/authorised list of resourcesthat the meta-broker should look for, if any. Since the meta-broker itself does not performthe job submission and execution, the authentication and credentials are kept outside themeta-broker’s prerogative, and hence, they are sent by resource provider to users afterfinalisation of schedules by the meta-broker.
The meta-broker runs the scheduling algorithm at periodic intervals so as to satisfyboth the users and resources objectives. After matching applications to resources, themeta-broker reserves the resources by contacting each resource provider and issue a Ticketfor that. A ‘Ticket’ contains the execution cost with the reservation information that helpsthe user broker to schedule an application on the reserved resources.
3.4 Meta-Broker’s Internal Control Flow
The scheduling of user applications on multiple resource sites is enabled through inter-action of the meta-broker with other components of market exchange as shown in Fig-ure 3.1. This section presents the flow of interaction between each component duringthe meta-scheduling of user applications. The Meta-Broker is the key component for en-abling coordinated and efficient resource allocation. Its interaction with other componentsinvolves following steps:
1. The information about available resources are stored in the Resource Catalogue.
2. The users’ resource requests with QoS requirements are queued using Queuing Ser-vice.
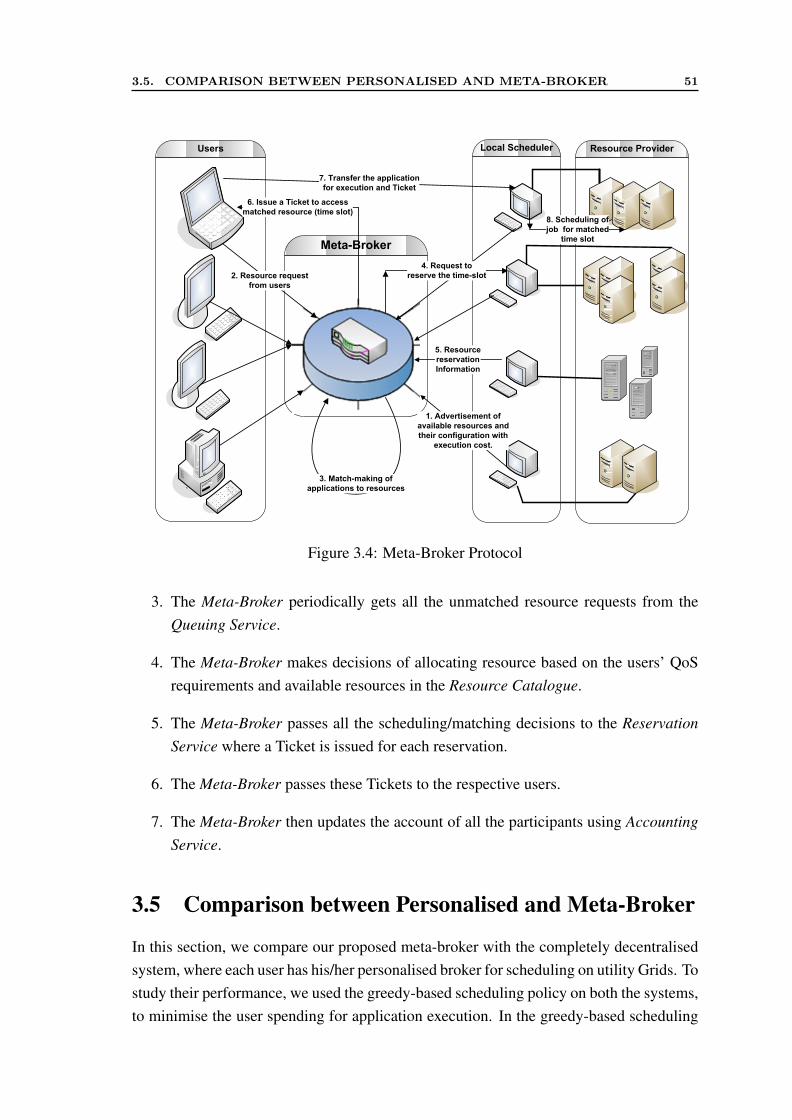
3.5. COMPARISON BETWEEN PERSONALISED AND META-BROKER 51
`
Users Local Scheduler
Meta-Broker
Resource Provider
2. Resource request
from users
6. Issue a Ticket to access
matched resource (time slot)
1. Advertisement of
available resources and
their configuration with
execution cost.
5. Resource
reservation
Information
3. Match-making of
applications to resources
4. Request to
reserve the time-slot
8. Scheduling of
job for matched
time slot
7. Transfer the application
for execution and Ticket
Figure 3.4: Meta-Broker Protocol
3. The Meta-Broker periodically gets all the unmatched resource requests from theQueuing Service.
4. The Meta-Broker makes decisions of allocating resource based on the users’ QoSrequirements and available resources in the Resource Catalogue.
5. The Meta-Broker passes all the scheduling/matching decisions to the ReservationService where a Ticket is issued for each reservation.
6. The Meta-Broker passes these Tickets to the respective users.
7. The Meta-Broker then updates the account of all the participants using AccountingService.
3.5 Comparison between Personalised and Meta-Broker
In this section, we compare our proposed meta-broker with the completely decentralisedsystem, where each user has his/her personalised broker for scheduling on utility Grids. Tostudy their performance, we used the greedy-based scheduling policy on both the systems,to minimise the user spending for application execution. In the greedy-based scheduling
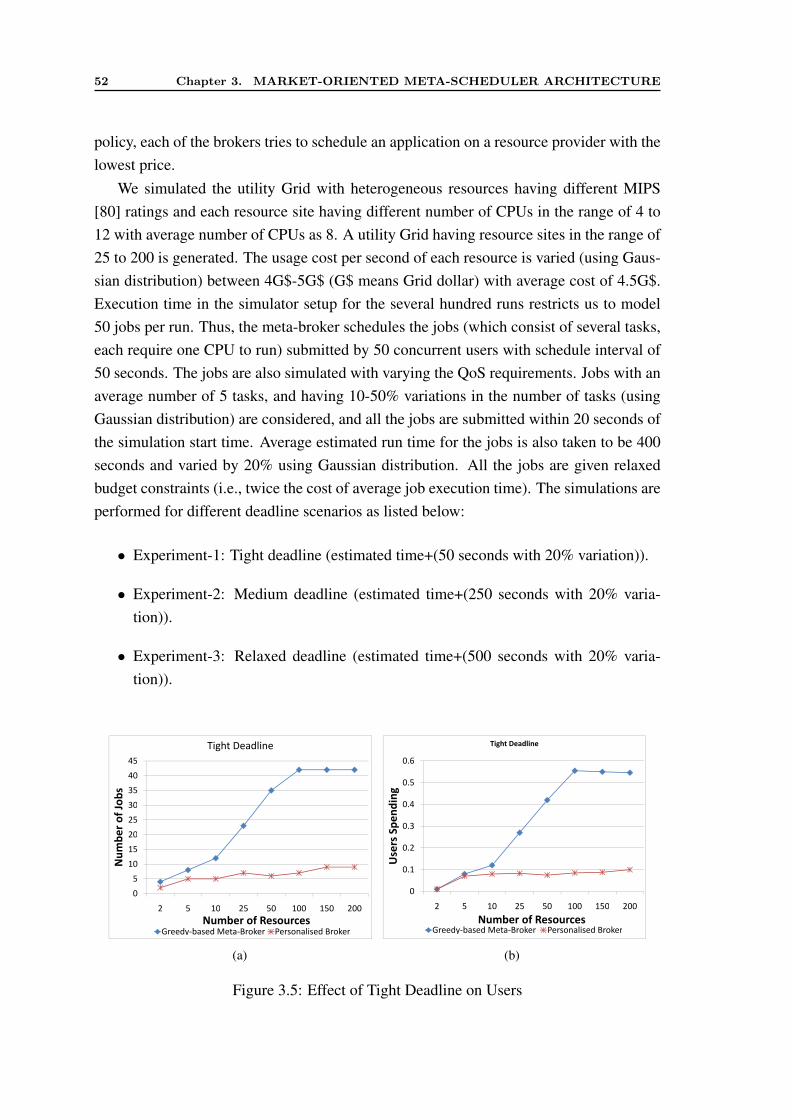
52 Chapter 3. MARKET-ORIENTED META-SCHEDULER ARCHITECTURE
policy, each of the brokers tries to schedule an application on a resource provider with thelowest price.
We simulated the utility Grid with heterogeneous resources having different MIPS[80] ratings and each resource site having different number of CPUs in the range of 4 to12 with average number of CPUs as 8. A utility Grid having resource sites in the range of25 to 200 is generated. The usage cost per second of each resource is varied (using Gaus-sian distribution) between 4G$-5G$ (G$ means Grid dollar) with average cost of 4.5G$.Execution time in the simulator setup for the several hundred runs restricts us to model50 jobs per run. Thus, the meta-broker schedules the jobs (which consist of several tasks,each require one CPU to run) submitted by 50 concurrent users with schedule interval of50 seconds. The jobs are also simulated with varying the QoS requirements. Jobs with anaverage number of 5 tasks, and having 10-50% variations in the number of tasks (usingGaussian distribution) are considered, and all the jobs are submitted within 20 seconds ofthe simulation start time. Average estimated run time for the jobs is also taken to be 400seconds and varied by 20% using Gaussian distribution. All the jobs are given relaxedbudget constraints (i.e., twice the cost of average job execution time). The simulations areperformed for different deadline scenarios as listed below:
• Experiment-1: Tight deadline (estimated time+(50 seconds with 20% variation)).
• Experiment-2: Medium deadline (estimated time+(250 seconds with 20% varia-tion)).
• Experiment-3: Relaxed deadline (estimated time+(500 seconds with 20% varia-tion)).
45
Tight Deadline
40
45
30
35
Nu
mb
er o
f Jo
bs
20
25
30
Nu
mb
er o
f Jo
bs
15
20
Nu
mb
er o
f Jo
bs
5
10Nu
mb
er o
f Jo
bs
0
5
2 5 10 25 50 100 150 2002 5 10 25 50 100 150 200
Number of ResourcesGreedy-based Meta-Broker Personalised BrokerGreedy-based Meta-Broker Personalised Broker
(a)
0.6
Tight Deadline
0.5
0.6
0.4
0.5
Use
rs S
pe
nd
ing
0.3
0.4
Use
rs S
pe
nd
ing
0.2
0.3
Use
rs S
pe
nd
ing
0.1
Use
rs S
pe
nd
ing
0
2 5 10 25 50 100 150 2002 5 10 25 50 100 150 200
Number of ResourcesGreedy-based Meta-Broker Personalised BrokerGreedy-based Meta-Broker Personalised Broker
(b)
Figure 3.5: Effect of Tight Deadline on Users
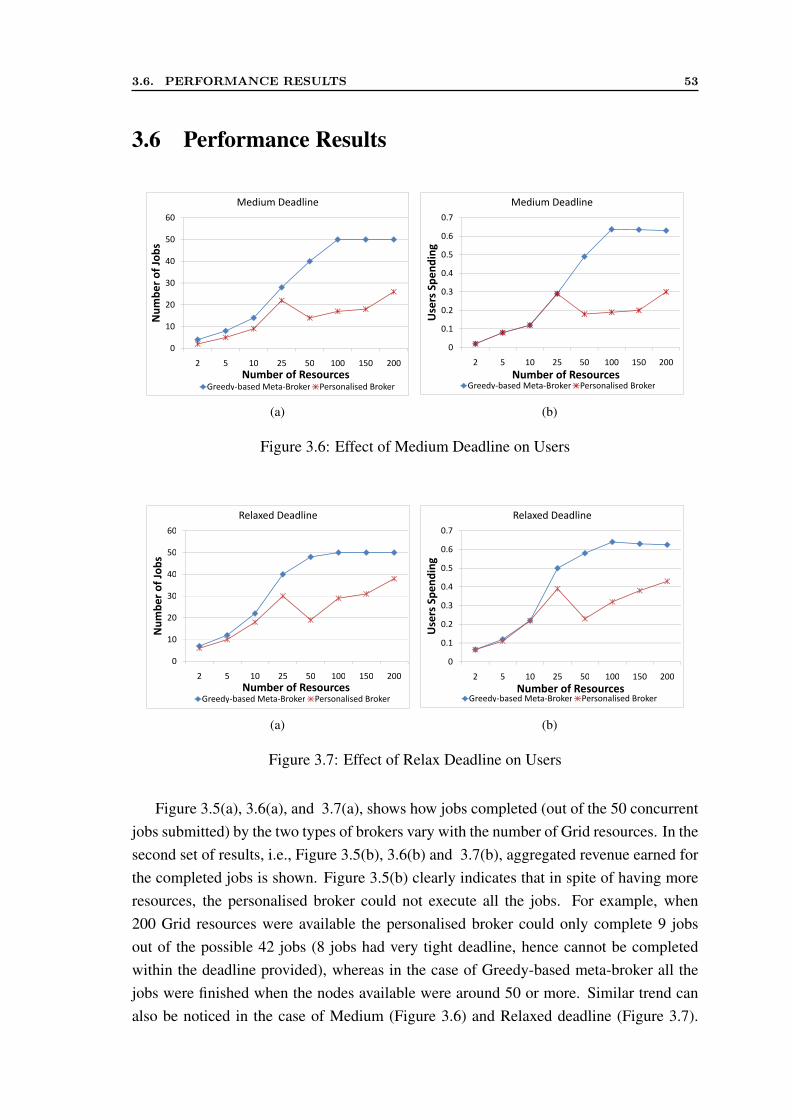
3.6. PERFORMANCE RESULTS 53
3.6 Performance Results
60
Medium Deadline
50
60
40
50
Nu
mb
er o
f Jo
bs
30
40
Nu
mb
er o
f Jo
bs
20
30
Nu
mb
er o
f Jo
bs
10
Nu
mb
er o
f Jo
bs
0
2 5 10 25 50 100 150 2002 5 10 25 50 100 150 200
Number of Resources
Greedy-based Meta-Broker Personalised BrokerGreedy-based Meta-Broker Personalised Broker
(a)
0.3
0.4
0.5
0.6
0.7
Use
rs S
pe
nd
ing
Medium Deadline
0
0.1
0.2
0.3
2 5 10 25 50 100 150 200
Use
rs S
pe
nd
ing
Number of ResourcesGreedy-based Meta-Broker Personalised BrokerGreedy-based Meta-Broker Personalised Broker
(b)
Figure 3.6: Effect of Medium Deadline on Users
60
Relaxed Deadline
50
60
40
50
Nu
mb
er o
f Jo
bs
30
40
Nu
mb
er o
f Jo
bs
20
30
Nu
mb
er o
f Jo
bs
10
Nu
mb
er o
f Jo
bs
0
2 5 10 25 50 100 150 2002 5 10 25 50 100 150 200
Number of Resources
Greedy-based Meta-Broker Personalised BrokerGreedy-based Meta-Broker Personalised Broker
(a)
0.7
Relaxed Deadline
0.6
0.7
0.5
0.6
Use
rs S
pe
nd
ing
0.3
0.4
Use
rs S
pe
nd
ing
0.2
0.3
Use
rs S
pe
nd
ing
0.1
0.2
Use
rs S
pe
nd
ing
0
2 5 10 25 50 100 150 2002 5 10 25 50 100 150 200
Number of ResourcesGreedy-based Meta-Broker Personalised BrokerGreedy-based Meta-Broker Personalised Broker
(b)
Figure 3.7: Effect of Relax Deadline on Users
Figure 3.5(a), 3.6(a), and 3.7(a), shows how jobs completed (out of the 50 concurrentjobs submitted) by the two types of brokers vary with the number of Grid resources. In thesecond set of results, i.e., Figure 3.5(b), 3.6(b) and 3.7(b), aggregated revenue earned forthe completed jobs is shown. Figure 3.5(b) clearly indicates that in spite of having moreresources, the personalised broker could not execute all the jobs. For example, when200 Grid resources were available the personalised broker could only complete 9 jobsout of the possible 42 jobs (8 jobs had very tight deadline, hence cannot be completedwithin the deadline provided), whereas in the case of Greedy-based meta-broker all thejobs were finished when the nodes available were around 50 or more. Similar trend canalso be noticed in the case of Medium (Figure 3.6) and Relaxed deadline (Figure 3.7).
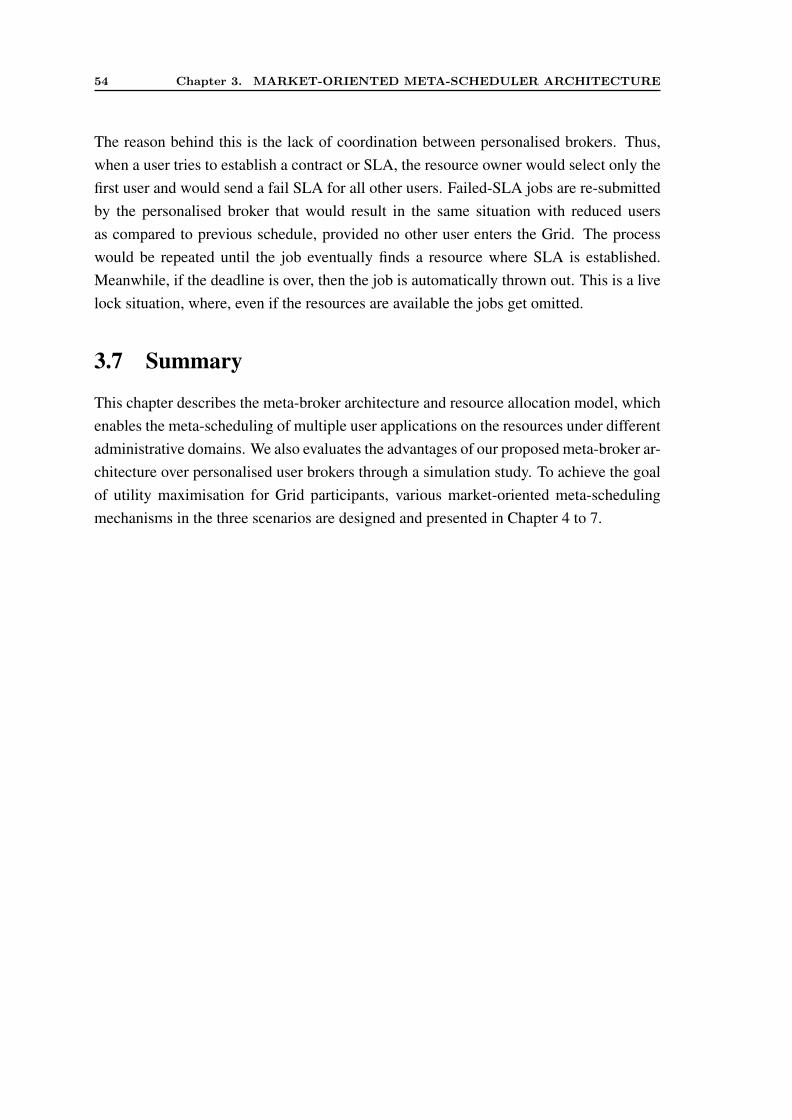
54 Chapter 3. MARKET-ORIENTED META-SCHEDULER ARCHITECTURE
The reason behind this is the lack of coordination between personalised brokers. Thus,when a user tries to establish a contract or SLA, the resource owner would select only thefirst user and would send a fail SLA for all other users. Failed-SLA jobs are re-submittedby the personalised broker that would result in the same situation with reduced usersas compared to previous schedule, provided no other user enters the Grid. The processwould be repeated until the job eventually finds a resource where SLA is established.Meanwhile, if the deadline is over, then the job is automatically thrown out. This is a livelock situation, where, even if the resources are available the jobs get omitted.
3.7 Summary
This chapter describes the meta-broker architecture and resource allocation model, whichenables the meta-scheduling of multiple user applications on the resources under differentadministrative domains. We also evaluates the advantages of our proposed meta-broker ar-chitecture over personalised user brokers through a simulation study. To achieve the goalof utility maximisation for Grid participants, various market-oriented meta-schedulingmechanisms in the three scenarios are designed and presented in Chapter 4 to 7.
Chapter 4
Meta-Scheduling to Minimise UserSpending
This chapter describes the market-oriented meta-scheduling algorithms to reduce users’spending. The user applications are constrained by QoS parameters such as deadline andbudget. To investigate the challenges in this meta-scheduling problem, we present a LinearProgramming/Integer Programming (LP/IP)-based analytical model of meta-schedulingof applications with deadline and budget constraints. The LP model is then used to designa Genetic Algorithm (GA), which minimises the combined cost of all users participatingin the meta-scheduling. Finally, a simulation-based study is presented to show the effec-tiveness of the proposed algorithms in minimising the combined spending of all users.
4.1 Problem Definition
As discussed in the previous chapter, users and resource providers interact through themeta-broker. Grid users submit their applications to the meta-broker with their QoS re-quirements. The QoS requirements consist of budget, deadline, and number of CPUs re-quired. Each application consists of independent tasks with each task requiring one CPU.Grids, such as Grid5000 [28], are generally composed by many resource sites, whereeach site consists of homogeneous CPUs. The following two kinds of user applicationsare modelled:
1. Multi-Grid node (MGN) applications can split into independent tasks, which canrun on different resources. For example, bag-of-tasks applications.
2. Single-Grid node (SGN) applications that require a complete set of CPUs on thesame resource and fail if all CPUs are not available. For example, synchronousparallel applications.
55
56 Chapter 4. META-SCHEDULING TO MINIMISE USER SPENDING
The meta-broker gathers the information from resource providers such as CPUs avail-able, Grid middleware, cost of CPUs per unit time for each user and CPUs capacity (e.g.Millions of Instruction per Seconds (MIPS) rating). The meta-broker generates a com-bined schedule based on algorithms discussed in subsequent sections. As the demand forresources may exceed the supply in the Grid, some applications are placed in the queuefor later assignment when resources are available or freed.
4.1.1 Problem Formulation
The objectives of meta-scheduling in the above environment with m resources and n
applications are as follows:
• Scheduling based on QoS, i.e., budget and deadline.
• Minimise combined cost for all the users by meeting the budget and deadline con-straints.
• Maximise the total number of users’ application submission.
Let Pi(ni, ci, vi) represents the information that the meta-broker receives from Grid re-source site i at a given instance T, where ni is the number of free CPUs available, ci isthe cost of using a single CPU per second for application/user j, vi is the MIPS speedof one of the CPUs, and i ∈ I = 1...m. Let Qj represents the QoS requirement thatthe meta-broker receives from user j. Let bj , dj , Mkj and mj be the budget constraintthe user specifies, the deadline constraint for finishing the application, the size of eachtask in the application in terms of Millions of Instructions (MI) [80], and the number ofCPUs the user requires for executing the application respectively. Let j ∈ J = 1..n, andkj ∈ K = 1..mj .
The mathematical model for scheduling of SGN applications is as follows:
c = min
m∑i=1
n∑j=1
cixijrijMaxk(Mkj/vi) (4.1)
In Equation 4.1, the variable rij denotes the number of CPUs allotted to application jon resource i. Note that, in the case of SGN applications, the value of rij would be either0 or mj (the number of CPUs required by the application j). The variable xij denotes thatwhether application j is mapped to resource i or not. (Mkj/vi) refers to the executiontime of task kj on resource i. Equation 4.1 denotes the cost minimisation function that
4.2. PROPOSED ALGORITHMS 57
represents the dollar cost spent by all the users. The constraints are following:
n∑j=1
rijxij ≤ ni,∀i ∈ I (4.2)
m∑i=1
rijxij = mj, ∀j ∈ J (4.3)
xij ∈ {0, 1},∀i ∈ I, j ∈ J (4.4)m∑i=1
xij = 1, ∀j ∈ J (4.5)∑rijcijMaxk(Mkj/vi) ≤ bj, ∀j ∈ J (4.6)
Max(Mkj/vi)xij ≤ dj,∀i ∈ I, j ∈ J, k ∈ K (4.7)
ci, xij, rij, bj, and dj ≥ 0, i ∈ I, j ∈ J (4.8)
Equation 4.2 denotes the resources capacity constraints. Equation 4.3 denotes the CPUrequirement of an application i.e.,mj . Equation 4.4 and 4.5 denote the assignment matrix,which indicates that an application can be assigned to a maximum of one resource. Equa-tion 4.6 is added for satisfying the budget constraints and Equation 4.7 is added for thetime constraints. Equation 4.1 is solved for minimisation to obtain an optimal cost effi-cient schedule. All the quantities, i.e., the resource parameters, cost, deadline and budgetshould be greater than zero, hence the Equation 4.8. Note that Equation 4.4 and 4.5 makethe problem NP-hard as these constraints make the problem a 0-1 assignment problem,which is well known to be NP-hard [112]. LP/IP model for scheduling MGN applica-tions is almost same as for SGN applications. The only difference is that model for MGNapplications will not include constraints 4.4 and 4.5.
4.2 Proposed Algorithms
4.2.1 Linear Programming-based Algorithm for Scheduling MGNJobs
As discussed in the previous section, the mathematical model for MGN application schedul-ing will be converted to an LP/IP model after removing constraints 4.4 and 4.5. LP/IP canbe then easily solved optimally using any standard integer programming algorithms suchas Simplex algorithm. There are many open-source and commercial implementations ofsuch algorithms. For simulation purposes, we have used the Coin-OR library [138]. TheCoin-OR library is a high quality open-source LP solver, and its main strengths are itsDual and Primal Simplex algorithms.
58 Chapter 4. META-SCHEDULING TO MINIMISE USER SPENDING
4.2.2 Linear Programming-based Algorithm for Scheduling SGN Jobs
Due to the absence of constraints 4.4 and 4.5, LP/IP solutions obtained in Section 4.2.1are infeasible for the SGN application scheduling problem. Thus, we need to address theproblem in the two phases: a) approximation of LP/IP solution to a feasible solution b)search for the optimal solution. For the first phase, we have designed a novel algorithmModified MinCost (MMC) to approximate an infeasible LP/IP solution to a feasible so-lution for the SGN application scheduling problem. For the second phase, we have useda GA-based heuristic to further optimise the feasible solution. We have chosen GAs forsolving budget and deadline constraint cost minimization problem mainly due to two rea-sons. First, GAs are more robust than standard heuristics for assignment problem. If goodinitial seed and enough computation time is given, then GA most likely approximates aglobal optimum, while heuristics in many cases are trapped in a local optimum. Second,GAs performance is evaluated in many previous studies such as by Golconda et al. [72]who evaluated performance of five heuristics. It was found in their study that GA pro-duces the best utility for users in comparison to the heuristics such as Min-Min. Thus,we have used GA in our second phase. The details about the chosen strategies in each ofthese phases are explained in the following sections.
Modified MinCost (MMC) Algorithm
Our MMC algorithm is inspired from ‘Minimum Cost Algorithm’ which is a well-knownmethod for finding the feasible solution near to the optimal in transport problems. Inthe Minimum Cost algorithm, we find the minimum cost resource, assign the maximumnumber of applications to that, and reduce the demand and supply. The process is repeateduntil all applications are allocated.
In MMC, we take an optimal solution from the LP-based algorithm (discussed in theprevious section), and then, approximate it to obtain a feasible solution for SGN schedul-ing problem. The solution obtained from this algorithm acts as an initial solution to theGA.
The pseudo code for MMC is given in Algorithm 4.1, which shows how MMC approx-imates a LP/IP solution. It takes as an input a list of applications which is a data-structurecontaining information regarding, how different tasks of an application are mapped to re-source providers, and how many CPUs are required by the application. This applicationlist is generated from the algorithm for scheduling MGN applications. First, MMC algo-rithm makes a copy of the input, and then sorts application list on the basis of the numberof resources to which applications are mapped (line 1-2). This is done so that we get asolution as closer as possible to the optimal LP/IP solution.
We handle differently the applications that are mapped only to (a) one resource and(b) more than one resource. For applications which are mapped only to one resource,
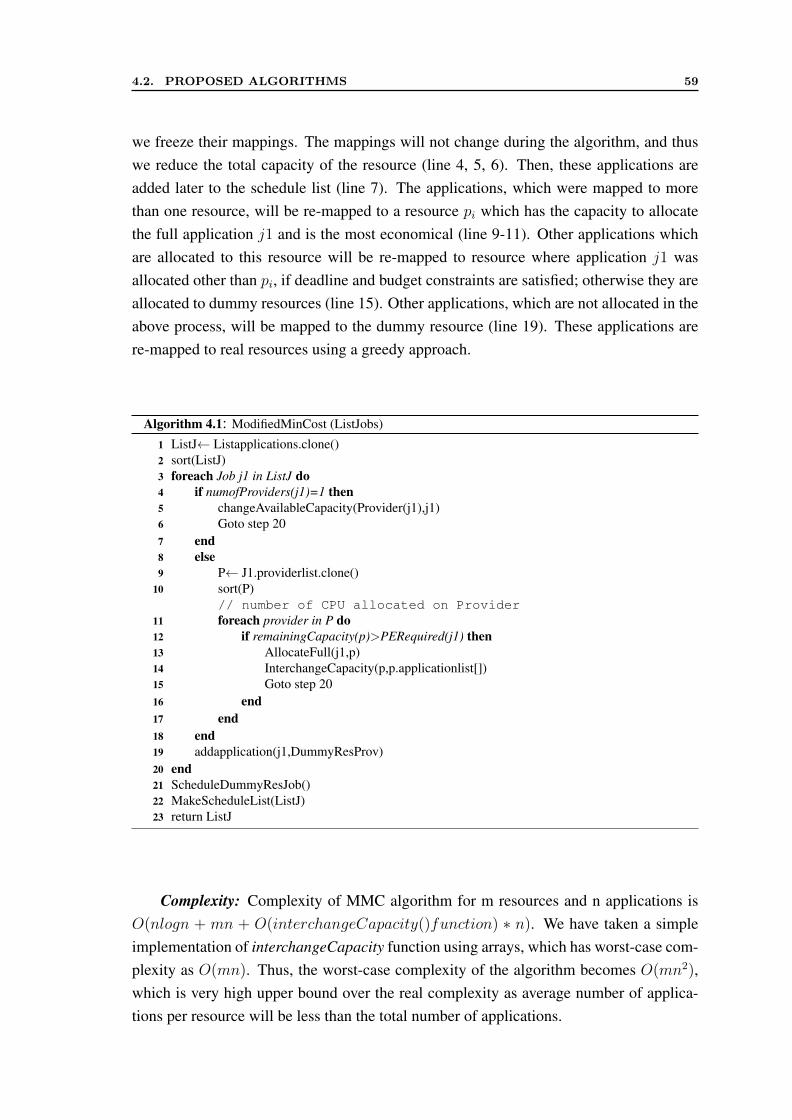
4.2. PROPOSED ALGORITHMS 59
we freeze their mappings. The mappings will not change during the algorithm, and thuswe reduce the total capacity of the resource (line 4, 5, 6). Then, these applications areadded later to the schedule list (line 7). The applications, which were mapped to morethan one resource, will be re-mapped to a resource pi which has the capacity to allocatethe full application j1 and is the most economical (line 9-11). Other applications whichare allocated to this resource will be re-mapped to resource where application j1 wasallocated other than pi, if deadline and budget constraints are satisfied; otherwise they areallocated to dummy resources (line 15). Other applications, which are not allocated in theabove process, will be mapped to the dummy resource (line 19). These applications arere-mapped to real resources using a greedy approach.
Algorithm 4.1: ModifiedMinCost (ListJobs)
ListJ← Listapplications.clone()1sort(ListJ)2foreach Job j1 in ListJ do3
if numofProviders(j1)=1 then4changeAvailableCapacity(Provider(j1),j1)5Goto step 206
end7else8
P← J1.providerlist.clone()9sort(P)10// number of CPU allocated on Providerforeach provider in P do11
if remainingCapacity(p)>PERequired(j1) then12AllocateFull(j1,p)13InterchangeCapacity(p,p.applicationlist[])14Goto step 2015
end16end17
end18addapplication(j1,DummyResProv)19
end20ScheduleDummyResJob()21MakeScheduleList(ListJ)22return ListJ23
Complexity: Complexity of MMC algorithm for m resources and n applications isO(nlogn + mn + O(interchangeCapacity()function) ∗ n). We have taken a simpleimplementation of interchangeCapacity function using arrays, which has worst-case com-plexity as O(mn). Thus, the worst-case complexity of the algorithm becomes O(mn2),which is very high upper bound over the real complexity as average number of applica-tions per resource will be less than the total number of applications.
60 Chapter 4. META-SCHEDULING TO MINIMISE USER SPENDING
Genetic Algorithm formulation
For the second phase, we have used GAs [34]. GAs provide a robust search technique thatallows a high-quality solution to be derived from a large search space in polynomial time,by applying the principle of evolution. A GA combines the exploitation of best solutionsfrom past searches with the exploration of new regions of the solution space. Any solutionin the search space of the problem is represented by an individual (chromosomes). A GAmaintains a population of individuals that evolves over generations. The quality of anindividual in the population is determined by a fitness-function. The fitness value indicateshow good the individual is compared to others in the population. A typical GA consistsof the following steps:
1. Create an initial population consisting of randomly generated solutions.
2. Generate new offspring by applying genetic operators, namely selection, crossoverand mutation, one after the other.
3. Compute the fitness value for each individual in the population.
4. Repeat steps 2 and 3 until the algorithm converges.
Convergence can be a different criterion for different problems, but generally the ab-sence of changes in the solution for n generations is considered as convergence. The ncould be application specific again; in our implementation n is assigned a value of 10.The following space encoding and fitness function used in our GA-based heuristic:
• Chromosome Encoding
The solution for the scheduling is an assignment vector S (= s1, s2, ..sj, .., sn),where each element sj in the vector represents the node/resource site onto whichthe application is scheduled. The vector S represents a chromosome (individual) inthe population. Since each application can be assigned to a maximum of one node,it can be denoted as a simple single dimensional integer vector of size equal to thenumber of applications. Note that the node number sj can be the same for multipleapplications, which means that, if there are sufficient resources then the node canexecute multiple applications.
• Fitness Function
The fitness function for our GA is a cost function on the same lines of Equation 4.1and is denoted as follows:
F (S) =n∑j=1
mj∑k=1
csjij ∗Mk/vsj + αj, where αj = C ∗ pj (4.9)
4.2. PROPOSED ALGORITHMS 61
αj represents the QoS index; pj is the priority of application j (priority sequencenumber, i.e., (1..n)); and C is a cost constant chosen such that the fitness valueof a least priority (higher value of pj) application assigned to real node is alwaysless than a higher priority (lower value of pj) application scheduled to a dummynode. The use of pj into the fitness function gives preference to the applicationswhich promise better QoS; and constraints on C ensure that the solution does notprematurely end in a local minimum.
The computation of QoS index αj is discussed in the next section. If constraintslisted in Equation 4.2, 4.5 and 4.6 are not satisfied then an infeasible cost or veryhigh cost is assigned to S.
• QoS index
The QoS index is used to assign priority to applications. Generally priority is apersonal or providers preference, but in an ideal market situation the priority islinked with QoS, i.e., priority is given to the users who are willing to pay moreincentives, and to provide relaxed deadlines. Therefore it can be represented asfollows:
αj = C ∗ pj, where pj = bj/Max(1, dj − tj) (4.10)
In the above equation, C is a constant value, and tj is the execution time of appli-cation j. The QoS index is a fairness index computed for each application based ontheir deadline and budget parameters. Ideally the user pays either the entire budgetor amount proportional to its priority. As we are considering a fair market meta-broker scheduling, where user pays only for the resources he/she consumed, thepriority index is computed by using following equation.
if(dj > (T + tj)), αj = 1/MAX(a, dj − (T + tj)) else αj = 0 (4.11)
T is the current schedule time. This function assigns priority to the applications/usersaccording to their finish time and incentive offered. Note that as the time increases,even the applications with relaxed deadlines gain priority and similarly, if the userprovides a tight deadline then there is a danger of getting eliminated from schedul-ing very quickly.
Linear Programming-based Genetic Algorithm (LPGA)
LPGA seeds the approximate LP solution from MMC (first phase) with a GA (secondphase) for generating a solution near to the optimal solution. Thus, first we solve a LP/IPproblem without constraints 4.4 and 4.5 and then MMC approximates the solution ob-
62 Chapter 4. META-SCHEDULING TO MINIMISE USER SPENDING
tained in the previous step. Finally, using the feasible solution from MMC, we iteratevarious genetic operations to get the best solution.
The pseudo code is given by Algorithm 4.2. As the scheduling is done by the meta-broker periodically, it waits for the applications from the users (taken as QoS requirementfor the application in line 4) and the resource load from the provider (line 3). Then, wehave to add a dummy application queue with high cost and number of CPUs to makescheduling problem balanced, i.e. to balance the supply of resources and the demandby users for resources (line 6-8). After that, we sort the resource list on the basis oftheir cost, and the application list on the basis of QoS index (line 11-13). After sortingthe resource list and the application list, the LP/IP solution is generated that is obtainedwithout considering constraints 4.4 and 4.5 discussed in the Section 4.1.1 (line 15). Thissolution is approximated using the MMC algorithm (line 16) which is used to generatethe initial population space for the GA (line 20-23). From the initial population space,we select the best chromosome values on the basis of the fitness function. These bestchromosomes are then mutated to generate the next generation population (line 24-35).This operation is repeated until the convergence criterion is reached or the maximumspecified limit of iteration is reached (line 26). Based on the chromosome, the schedulelist is generated and users are notified about mappings (line 39-41).
One limitation to the problem formulation is that if the number of resources requestedis more than the number of resources available for the broker, then the problem results inan infeasible solution. Therefore, we propose the introduction of dummy resources withinfinite capacity and having more cost than any of the resources available on the Grid.This enables the algorithm to converge and assign some of the applications to the dummyresources. The fitness function forces the applications with lower priority to be scheduledon the dummy nodes rather than the applications with higher priority. Dummy resourceapplications are rolled over to the next schedule period, as they cannot be executed.
4.3 Performance Evaluation
4.3.1 Simulation Methodology
Workload Characteristics: The meta-broker schedules the jobs (which consist of sev-eral tasks, each require one CPU to run) submitted by 50 concurrent users with simulationinterval of 50 seconds. Execution time in the simulator setup for the several hundred runsrestricts us to model 50 jobs with varying QoS requirements per run. The jobs charac-teristics such as size and runtime are generated using random distributions. We modelledjobs with average number of 5 tasks, and having 10-50% variations in the number of tasks(using Gaussian distribution), and all the jobs are submitted within 20 seconds of simula-
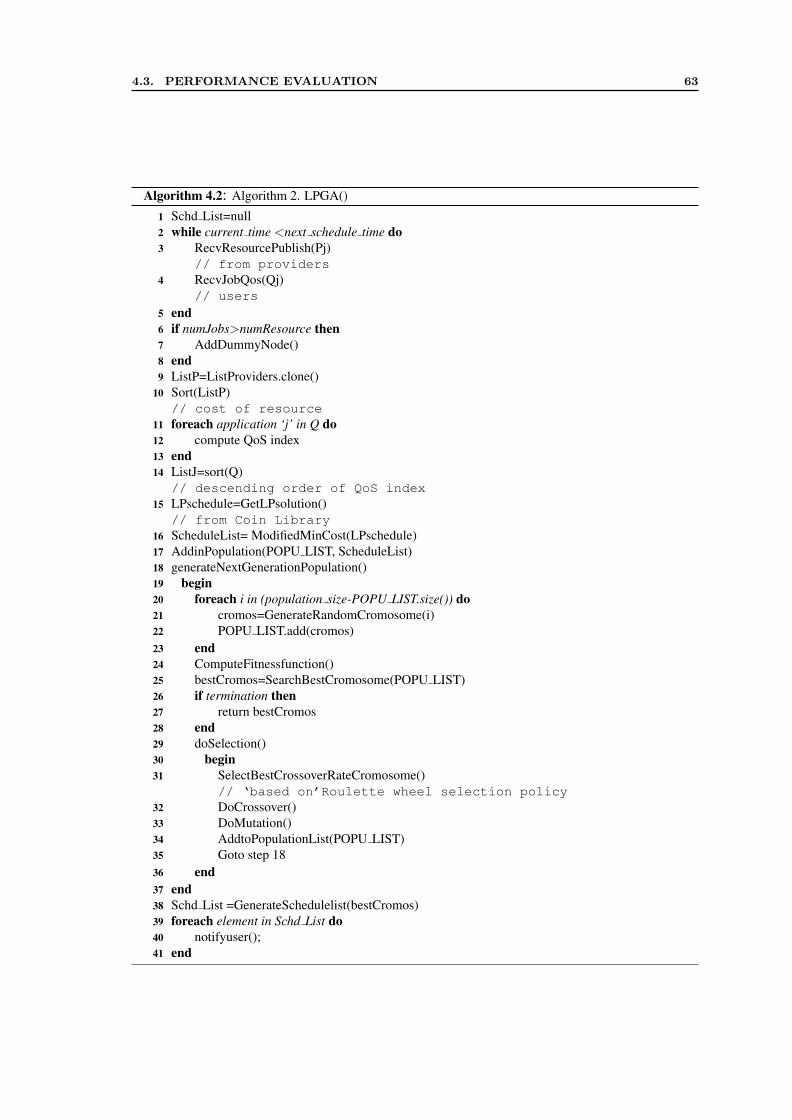
4.3. PERFORMANCE EVALUATION 63
Algorithm 4.2: Algorithm 2. LPGA()
Schd List=null1while current time <next schedule time do2
RecvResourcePublish(Pj)3// from providersRecvJobQos(Qj)4// users
end5if numJobs>numResource then6
AddDummyNode()7end8ListP=ListProviders.clone()9Sort(ListP)10// cost of resourceforeach application ‘j’ in Q do11
compute QoS index12end13ListJ=sort(Q)14// descending order of QoS indexLPschedule=GetLPsolution()15// from Coin LibraryScheduleList= ModifiedMinCost(LPschedule)16AddinPopulation(POPU LIST, ScheduleList)17generateNextGenerationPopulation()18
begin19foreach i in (population size-POPU LIST.size()) do20
cromos=GenerateRandomCromosome(i)21POPU LIST.add(cromos)22
end23ComputeFitnessfunction()24bestCromos=SearchBestCromosome(POPU LIST)25if termination then26
return bestCromos27end28doSelection()29
begin30SelectBestCrossoverRateCromosome()31// ‘based on’Roulette wheel selection policyDoCrossover()32DoMutation()33AddtoPopulationList(POPU LIST)34Goto step 1835
end36end37Schd List =GenerateSchedulelist(bestCromos)38foreach element in Schd List do39
notifyuser();40end41
64 Chapter 4. META-SCHEDULING TO MINIMISE USER SPENDING
tion start time. The average estimated run time for the jobs is also taken to be 400 secondsand varied by 20% using Gaussian distribution. Even though runtime of jobs can be var-ied other than 20%, we believe that similar results can also be expected in other cases.In addition, the variation in runtime is chosen to analyze the effect of jobs with similarneeds. All the jobs are given relaxed budget constraints (i.e., twice the cost of average jobexecution time), so that it is always greater than job execution cost. The job executioncost can be computed by using resource usage price*execution time*number of CPUs.
Configuration of Resources: We considered the Grid with heterogeneous resourceshaving different MIPS [80] ratings, and each resource having different number of CPUs inthe range of 4 to 12 with mean number of CPUs as 8. Grid resources are varied from therange of 25 to 200. Since, there is no information available on how to model usage cost ofa resource, thus, the usage cost per second per CPU unit of each resource is syntheticallygenerated. The usage cost is varied (using Gaussian distribution) between 4G$-5G$ (G$means Grid dollar) with mean cost of 4.5G$.
Experimental Scenarios: To comprehensively evaluate the performance of our al-gorithms, we examine three experimental scenarios for different job deadlines i.e. tight,medium and relaxed. The deadlines are model based on how much users are willing towait to have their job executed. The tight deadline is modelled as very urgent schedul-ing requirement from users. Thus, the tight deadline is set to job′s execution time +
scheduling interval time (i.e. 50 sec). The user having medium deadline is modelledconsidering that he is willing to wait for at least 50% of his/her job’s execution time. Thus,the medium deadline is set to 150% ofjob′s execution time+scheduling interval time
(i.e. 50 sec). Similarly, the user having relaxed deadline is willing to wait more than thejob’s execution time. Thus, the relaxed deadline is set to more than 200% ofjob′s execution time+
scheduling interval time (i.e. 50 sec). Since, in our experiments, the average executiontime of an job is set to 400 sec, therefore the following experiments with different dead-lines are performed
• Experiment-1: Tight deadline (estimated time+(50 seconds with 20% variation)).
• Experiment-2: Medium deadline (estimated time+(250 seconds with 20% varia-tion)).
• Experiment-3: Relaxed deadline (estimated time+(500 seconds with 20% varia-tion)).
Our performance evaluation examines the relative performance (users spending andnumber of jobs completed) of LPGA with respect to three other following meta-schedulingalgorithms for the above type of jobs by varying the number of resources:
1. Greedy-based meta-scheduling algorithm.
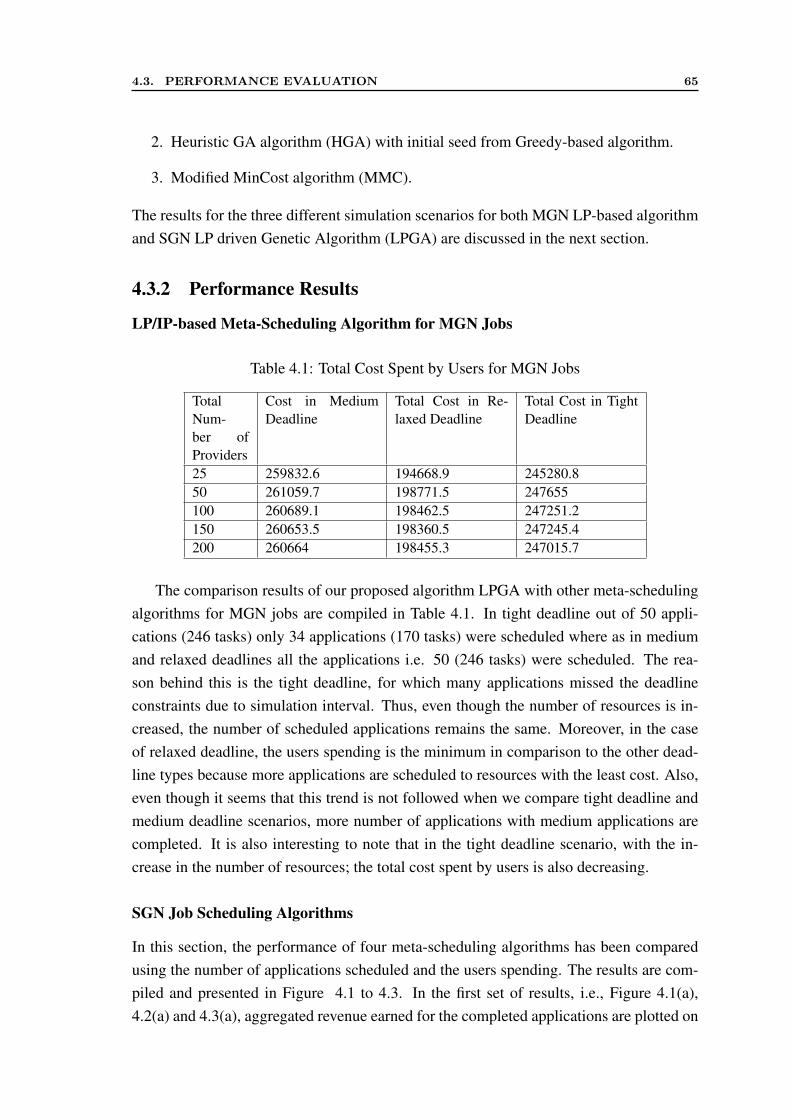
4.3. PERFORMANCE EVALUATION 65
2. Heuristic GA algorithm (HGA) with initial seed from Greedy-based algorithm.
3. Modified MinCost algorithm (MMC).
The results for the three different simulation scenarios for both MGN LP-based algorithmand SGN LP driven Genetic Algorithm (LPGA) are discussed in the next section.
4.3.2 Performance Results
LP/IP-based Meta-Scheduling Algorithm for MGN Jobs
Table 4.1: Total Cost Spent by Users for MGN Jobs
TotalNum-ber ofProviders
Cost in MediumDeadline
Total Cost in Re-laxed Deadline
Total Cost in TightDeadline
25 259832.6 194668.9 245280.850 261059.7 198771.5 247655100 260689.1 198462.5 247251.2150 260653.5 198360.5 247245.4200 260664 198455.3 247015.7
The comparison results of our proposed algorithm LPGA with other meta-schedulingalgorithms for MGN jobs are compiled in Table 4.1. In tight deadline out of 50 appli-cations (246 tasks) only 34 applications (170 tasks) were scheduled where as in mediumand relaxed deadlines all the applications i.e. 50 (246 tasks) were scheduled. The rea-son behind this is the tight deadline, for which many applications missed the deadlineconstraints due to simulation interval. Thus, even though the number of resources is in-creased, the number of scheduled applications remains the same. Moreover, in the caseof relaxed deadline, the users spending is the minimum in comparison to the other dead-line types because more applications are scheduled to resources with the least cost. Also,even though it seems that this trend is not followed when we compare tight deadline andmedium deadline scenarios, more number of applications with medium applications arecompleted. It is also interesting to note that in the tight deadline scenario, with the in-crease in the number of resources; the total cost spent by users is also decreasing.
SGN Job Scheduling Algorithms
In this section, the performance of four meta-scheduling algorithms has been comparedusing the number of applications scheduled and the users spending. The results are com-piled and presented in Figure 4.1 to 4.3. In the first set of results, i.e., Figure 4.1(a),4.2(a) and 4.3(a), aggregated revenue earned for the completed applications are plotted on
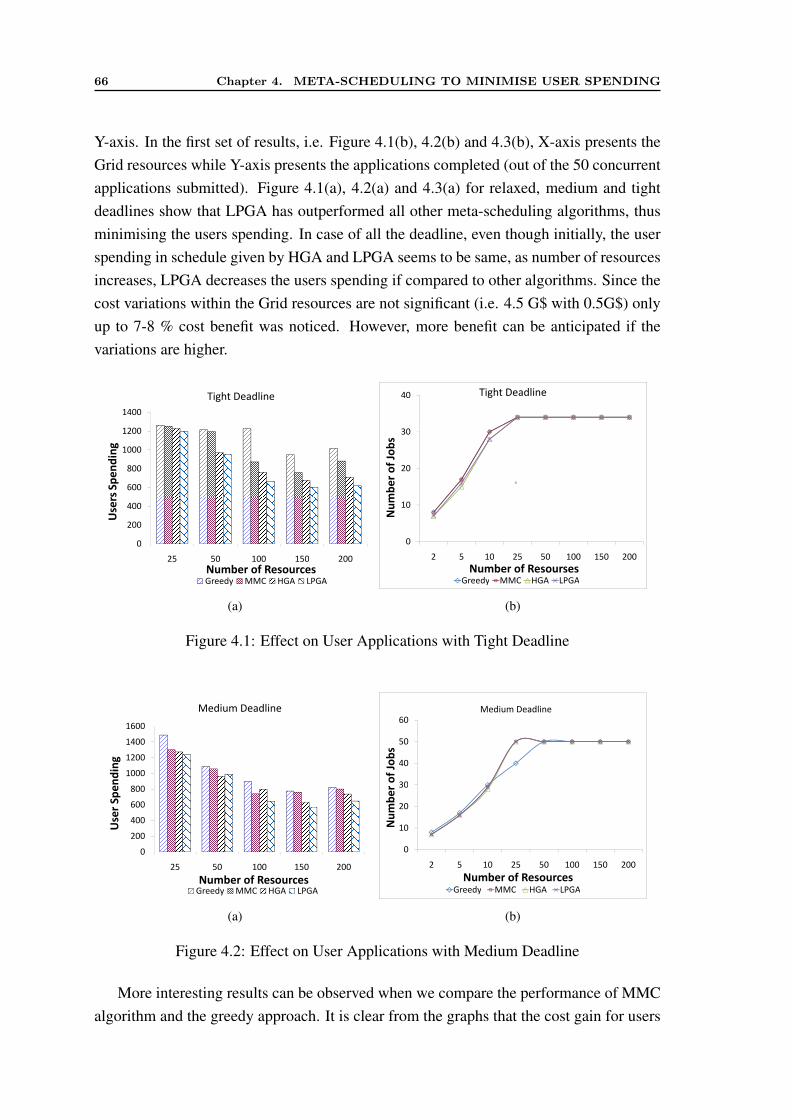
66 Chapter 4. META-SCHEDULING TO MINIMISE USER SPENDING
Y-axis. In the first set of results, i.e. Figure 4.1(b), 4.2(b) and 4.3(b), X-axis presents theGrid resources while Y-axis presents the applications completed (out of the 50 concurrentapplications submitted). Figure 4.1(a), 4.2(a) and 4.3(a) for relaxed, medium and tightdeadlines show that LPGA has outperformed all other meta-scheduling algorithms, thusminimising the users spending. In case of all the deadline, even though initially, the userspending in schedule given by HGA and LPGA seems to be same, as number of resourcesincreases, LPGA decreases the users spending if compared to other algorithms. Since thecost variations within the Grid resources are not significant (i.e. 4.5 G$ with 0.5G$) onlyup to 7-8 % cost benefit was noticed. However, more benefit can be anticipated if thevariations are higher.
800
1000
1200
1400
Sp
en
din
g
Tight Deadline
0
200
400
600
25 50 100 150 200
Use
rsS
pe
nd
ing
Number of ResourcesGreedy MMC HGA LPGAGreedy MMC HGA LPGA
(a)
20
30
40N
um
be
r o
f Jo
bs
Tight Deadline
0
10
2 5 10 25 50 100 150 200
Nu
mb
er o
f Jo
bs
Number of Resourses
Greedy MMC HGA LPGA
Ti
Greedy MMC HGA LPGA
(b)
Figure 4.1: Effect on User Applications with Tight Deadline
Medium Deadline
1400
1600
1200
1400
Use
r S
pe
nd
ing
800
1000
Use
r S
pe
nd
ing
600
800
Use
r S
pe
nd
ing
200
400
Use
r S
pe
nd
ing
0
200
25 50 100 150 20025 50 100 150 200
Number of ResourcesGreedy MMC HGA LPGAGreedy MMC HGA LPGA
(a)
30
40
50
60
Nu
mb
er o
f Jo
bs
Medium Deadline
0
10
20
30
2 5 10 25 50 100 150 200
Nu
mb
er o
f Jo
bs
Number of Resources
Greedy MMC HGA LPGAGreedy MMC HGA LPGA
(b)
Figure 4.2: Effect on User Applications with Medium Deadline
More interesting results can be observed when we compare the performance of MMCalgorithm and the greedy approach. It is clear from the graphs that the cost gain for users
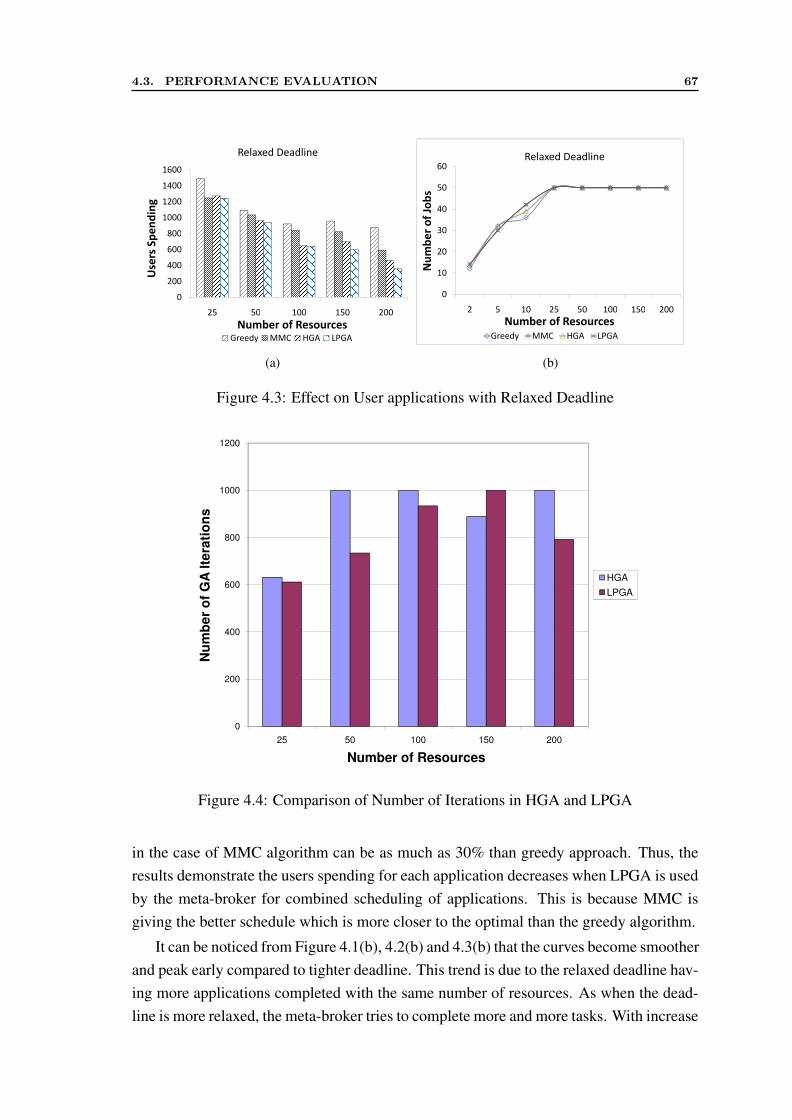
4.3. PERFORMANCE EVALUATION 67
800
1000
1200
1400
1600
Use
rs S
pe
nd
ing
Relaxed Deadline
0
200
400
600
800
25 50 100 150 200
Use
rs S
pe
nd
ing
Number of ResourcesGreedy MMC HGA LPGAGreedy MMC HGA LPGA
(a)
30
40
50
60
Nu
mb
er o
f Jo
bs
Relaxed Deadline
0
10
20
2 5 10 25 50 100 150 200
Nu
mb
er o
f Jo
bs
Number of Resources
Greedy MMC HGA LPGAGreedy MMC HGA LPGA
(b)
Figure 4.3: Effect on User applications with Relaxed Deadline
600
800
1000
1200
Nu
mb
er o
f G
A Ite
ra
tio
ns
HGA
LPGA
0
200
400
25 50 100 150 200
Nu
mb
er o
f G
A Ite
ra
tio
ns
Number of Resources
LPGA
Number of Resources
Figure 4.4: Comparison of Number of Iterations in HGA and LPGA
in the case of MMC algorithm can be as much as 30% than greedy approach. Thus, theresults demonstrate the users spending for each application decreases when LPGA is usedby the meta-broker for combined scheduling of applications. This is because MMC isgiving the better schedule which is more closer to the optimal than the greedy algorithm.
It can be noticed from Figure 4.1(b), 4.2(b) and 4.3(b) that the curves become smootherand peak early compared to tighter deadline. This trend is due to the relaxed deadline hav-ing more applications completed with the same number of resources. As when the dead-line is more relaxed, the meta-broker tries to complete more and more tasks. With increase
68 Chapter 4. META-SCHEDULING TO MINIMISE USER SPENDING
in the number of resources, all algorithms schedule the same number of user applications.In case of tight deadline (Figure 4.1(b)), many applications missed the deadlines (verytight); only 34 applications are completed even though the number of resource increasedto 200.
The next simulation study presents the advantage of LPGA over HGA algorithm. Wehave compared the number of iteration taken by both algorithms in case of tight deadline.The results shown in Figure 4.4 indicate that in case of LPGA, the number of iterationsis reduced with a decrease in user spending. For example, with 50 resources, the numberof iterations performed in HGA is 1000, whereas in LPGA it is less than 700. Eventhough the number of iterations in HGA is less than in LPGA with 150 resources, therevenue generated is smaller which can be observed from Figure 4.1(a). These results alsoindicate that in spite of taking more iteration, the HGA could not find the global/betteroptimum. The reason for this is the property of GA-based heuristics which are searchalgorithms. The convergence and search domain of a GA are highly dependent on theseeded population. If the seed is in a domain where the sub-optimal solution exists butthe seed is far away from sub-optimal solution, then the GA may require more numberof iteration to reach the sub-optimal solution. Hence, to search a better solution (eitherthe one found by LPGA implementation or any other better solution) the algorithm wouldhave required a higher number of iterations. This clearly explains the reason for a highernumber of iterations in the case of LPGA when the number of resources is 150.
4.4 Related Work
Many works have investigated the application of market models and mechanisms to im-prove scheduling in Grids. The most relevant works in the context of maximising theuser’s utility are [25][169][61]and [46]. The Gridbus broker [25] is a personalised brokerthat uses a greedy approach to schedule a parameter sweep application with deadline andcost constraints. We differ from them in our aim that is to schedule multiple applicationshaving different QoS requirements to optimise combined cost.
G-commerce [169] is another economic-based study that applies strategies for pricingGrid resources to facilitate resource trading, and compares auction and commodity mar-ket models using these pricing models. Feng [61] proposed a deadline cost optimisationmodel for scheduling one application with dependent tasks. There are some limitationsof these studies: (1) the algorithms proposed are not designed to accommodate concur-rent users competing for resources (2) the application models considered are simple i.e.independent task or parametric sweep application. Similarly, Dogan et al. [46] proposeda meta-scheduling algorithm considering many concurrent users with single task applica-tions. On the other hand, in our work, we have modelled both independent and parallel
4.5. SUMMARY 69
applications submitted by concurrent users in a meta-scheduling environment to minimisethe combined cost of all users.
In the Grid environment, where each user has different QoS constraints, the schedul-ing problem becomes a Generalised Assignment Problem (GAP) that is a well known NPhard problem. GAP can be solved using GAs [34]. Thus many GA-based heuristics areproposed in the literature. Wiessman et al. [98] proposed a novel GA-based algorithm thatschedules a divisible data intensive application. Martino et al. [45] presented a GA-basedscheduling algorithm where the goal of super-scheduling was to minimise the release timeof applications. These GA-based heuristics do not consider the QoS constraints of concur-rent users such as budget and deadline. The viability of an evolutionary algorithm-basedscheduling such as GAs for realistic scientific workloads is demonstrated by systems suchas Mars [13]. Mars is a meta-scheduling framework for scheduling tasks across multipleresources in a Grid. In a recent study [72] where five heuristics were compared, it wasfound that the GA produces the best utility for users in comparison to the heuristics suchas Min-Min. Thus, for comparison, we have used GA seeded with greedy as an algo-rithm. In this work, we have used LP/IP model to solve the cost minimisation schedulingproblem in Grid. The LP/IP can offer optimal solutions in minimisation/ maximisationscheduling problems when constraints and objective functions are linear. There are manyworks on scheduling in domains other than Grid using LP/IP model. In Feltl et al. [60],an LP/IP-based initial solution and followed by an intelligent replacement of offspringbased on Martello et al. [112] is proposed. But these models do not consider the deadlineand budgets constraints. As they are developed based on specific domain knowledge, theycannot be applied directly to Grid scheduling problems, and hence. have been enhancedaccordingly.
4.5 Summary
This chapter models the scheduling of concurrent user applications in utility Grids as anLP/IP problem. The meta-broker maximises the utility of all the users participating in themeta-scheduling. We have presented a novel algorithm called MMC that approximates theLP solution to derive a near-optimal solution for single-grid node application scheduling.LPGA is designed to decrease the combined user spending and increase the resourceutilisation by seeding the solution from MMC algorithm to the GA. We have also takeninto consideration user QoS constraints, i.e., deadline, number of CPUs and budget. Theresults show that LPGA outperforms other meta-scheduling algorithms such as the greedyapproach and HGA by giving the minimum monetary cost.
In this chapter, we have considered only one objective function i.e. cost minimisation,but in some scenarios, users may want to optimise both response time and execution cost

70 Chapter 4. META-SCHEDULING TO MINIMISE USER SPENDING
of the application. Thus, the user has to choose between multiple conflicting objectives,which makes the problem of meta-scheduling more challenging. In the next chapter, wewill show how this challenge can be tackled using a “trade-off metric”.
Chapter 5
Meta-Scheduling to Minimise Time andCost for Users
This chapter proposes three meta-scheduling heuristics, i.e. MinMin Cost Time Trade-off(MinCTT), Max-Min Cost Time Trade-off (MaxCTT) and Sufferage Cost Time Trade-off(SuffCTT), to manage the trade-off between the overall processing time and monetarycost. Thus, these heuristics aim to minimise simultaneously both the response time andmonetary cost on the basis of a trade-off factor. The trade-off factor indicates the priorityof optimising monetary cost over time. In order to study the effectiveness and efficiencyof the proposed heuristics, this chapter presents an extensive simulation study which anal-yses the best heuristic to adopt according to different user preferences.
5.1 Motivation
As discussed in the last chapter, users in the utility Grid may have conflicting require-ments, and thus the coordination is needed with efficient and cost-effective schedulingalgorithms. Other than this, users may also want to minimise application’s response timenot just monetary cost. In this scenario, the aim of user is to execute their applicationsmost economically in the minimum time. The meta-broker needs to consider multiple fac-tors such as execution time, monetary cost, and number of CPUs while making a schedul-ing decision on utility Grids where heterogeneous resources have different capabilitiesand pricing. Therefore, we designed three heuristics in order to simultaneously minimisethe response time and monetary cost while meeting users’ QoS requirements.
5.2 Meta-Broker System
As discussed in Chapter 3, resource providers sell the CPU time slots on their resources(clusters or supercomputers) and the consumers (or users) buy these time slots to run their
71
72 Chapter 5. META-SCHEDULING TO MINIMISE TIME AND COST FOR USERS
applications through the meta-broker. Providers delegate the allocation control of theirCPUs to the meta-broker.
Users require their parallel applications with fixed CPU requirements to be executedin the most economical and efficient manner. Thus, the users also provide a trade-offfactor to indicate the importance of cost over execution time, otherwise it will be set bythe meta-broker. The trade-off factor can be calculated by a user on the basis of urgencyand budget for executing the application.
The meta-broker maps the user’s application to the delegated resources through ad-vanced reservation based on the availability of CPUs and usage cost per second at regulartime intervals. The objective of the meta-broker is to schedule all user applications suchthat both the total time and cost for applications execution are minimised.
5.3 Meta-Scheduling Algorithms
In general, users have two QoS requirements, i.e., the processing time and cost for exe-cuting their applications on pay-per-use services [176]. The users normally would like toget the execution done at the lowest possible monetary cost in minimum time. Thus, weintroduce a trade-off factor that indicates the importance level of the monetary cost forusers in comparison to the response time. In this section, we present our meta-schedulingheuristics that aim to manage the trade-off between cost and time.
5.3.1 Problem Statement
Let n(t) be the number of user’s resource request during the scheduling cycle which endsat time t. Every application i requires pi CPUs for execution. Let T (t) be the set of ap-plications that the meta-broker has to schedule at time t. Let application i arrives at timearr(i). The estimated time to compute (ETC) values of each application on each computeresource is assumed to be known based on the user-supplied information, experimentaldata, application profiling or benchmarking, or other techniques. We assume that an ap-plication cannot be executed until all of the required CPUs are available simultaneously.Let m(t) be the total number of service providers available, and R(t) be the set of serviceproviders available during the scheduling interval at time t. Each service provider has mi
CPUs to rent. Let cj be the cost of using a CPU on resource j per unit time.
Let s(i, j) and f(i, j) be the submission time and finish time of application i on re-source j, respectively. The response time of application i is defined as
α(i, j) = f(i, j)− s(i, j)
5.3. META-SCHEDULING ALGORITHMS 73
The average execution time of application i is given by
βi =
∑jεR(t)ETC(i, j)
m(t)
The cost spent to execute application i on resource j is given by
c(i, j) = cj × pi × ETC(i, j)
The average cost of executing application i is given by
γi =
∑jεR(t) c(i, j)
m(t)
Given δ is the trade-off factor for all user applications; the trade-off cost metric for ithuser application is given by:
φ(i, j, t) = δc(i, j)
γi+ (1− δ)α(i, j)
βi(5.1)
Thus, the objective of our scheduling algorithm is to minimise the summation of trade-offmetric for all user applications:
minimise(∑
∀(iεT (t),t)
min∀j,tφ(i, j, t))
The scheduling problem is to map every application iεT (t) onto a suitable resourcejεR(t) to minimise the total execution time and monetary cost of all user applications.
A lower bound on the overall cost and makespan (or response time) of executing allapplications successfully can be calculated as the minimum cost and makespan whenvalue of the cost metric (Equation 5.1) is the lowest for all the applications. The valueof the cost metric will be the lowest when (1) response time is minimal i.e. application’ssubmission time is equal to its execution start time, and (2) application get scheduled onthe cheapest and fastest resource. Let φ(i, j, arr(i)) is the minimum for application i andresource j assuming no other application is present.Mathematically, the lower bound can be described as follows :
Lower bound for Overall Cost =∑∀i
costi,j. (5.2)
Lower bound for Overall Makespan = max(max∀i(arr(i) + ETC(i, j)),
+∑∀i
ETC(i, j)/m) (5.3)
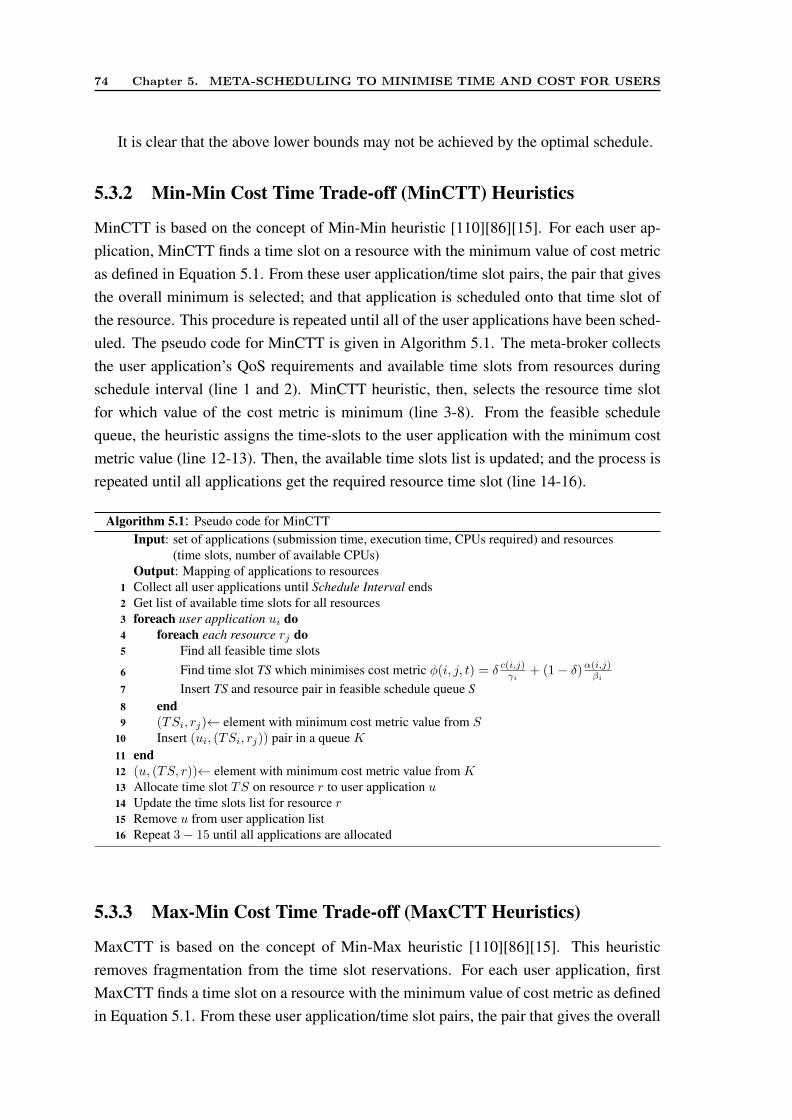
74 Chapter 5. META-SCHEDULING TO MINIMISE TIME AND COST FOR USERS
It is clear that the above lower bounds may not be achieved by the optimal schedule.
5.3.2 Min-Min Cost Time Trade-off (MinCTT) Heuristics
MinCTT is based on the concept of Min-Min heuristic [110][86][15]. For each user ap-plication, MinCTT finds a time slot on a resource with the minimum value of cost metricas defined in Equation 5.1. From these user application/time slot pairs, the pair that givesthe overall minimum is selected; and that application is scheduled onto that time slot ofthe resource. This procedure is repeated until all of the user applications have been sched-uled. The pseudo code for MinCTT is given in Algorithm 5.1. The meta-broker collectsthe user application’s QoS requirements and available time slots from resources duringschedule interval (line 1 and 2). MinCTT heuristic, then, selects the resource time slotfor which value of the cost metric is minimum (line 3-8). From the feasible schedulequeue, the heuristic assigns the time-slots to the user application with the minimum costmetric value (line 12-13). Then, the available time slots list is updated; and the process isrepeated until all applications get the required resource time slot (line 14-16).
Algorithm 5.1: Pseudo code for MinCTTInput: set of applications (submission time, execution time, CPUs required) and resources
(time slots, number of available CPUs)Output: Mapping of applications to resourcesCollect all user applications until Schedule Interval ends1Get list of available time slots for all resources2foreach user application ui do3
foreach each resource rj do4Find all feasible time slots5
Find time slot TS which minimises cost metric φ(i, j, t) = δ c(i,j)γi+ (1− δ)α(i,j)βi
6Insert TS and resource pair in feasible schedule queue S7
end8(TSi, rj)← element with minimum cost metric value from S9Insert (ui, (TSi, rj)) pair in a queue K10
end11(u, (TS, r))← element with minimum cost metric value from K12Allocate time slot TS on resource r to user application u13Update the time slots list for resource r14Remove u from user application list15Repeat 3− 15 until all applications are allocated16
5.3.3 Max-Min Cost Time Trade-off (MaxCTT Heuristics)
MaxCTT is based on the concept of Min-Max heuristic [110][86][15]. This heuristicremoves fragmentation from the time slot reservations. For each user application, firstMaxCTT finds a time slot on a resource with the minimum value of cost metric as definedin Equation 5.1. From these user application/time slot pairs, the pair that gives the overall
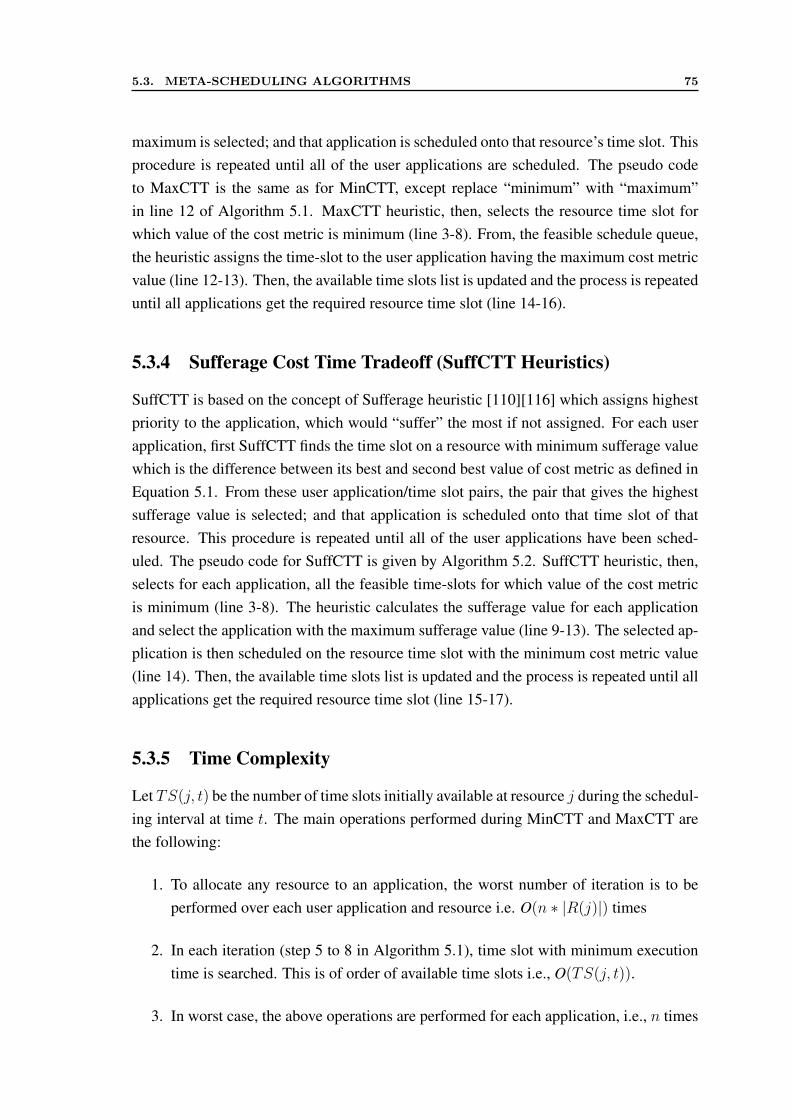
5.3. META-SCHEDULING ALGORITHMS 75
maximum is selected; and that application is scheduled onto that resource’s time slot. Thisprocedure is repeated until all of the user applications are scheduled. The pseudo codeto MaxCTT is the same as for MinCTT, except replace “minimum” with “maximum”in line 12 of Algorithm 5.1. MaxCTT heuristic, then, selects the resource time slot forwhich value of the cost metric is minimum (line 3-8). From, the feasible schedule queue,the heuristic assigns the time-slot to the user application having the maximum cost metricvalue (line 12-13). Then, the available time slots list is updated and the process is repeateduntil all applications get the required resource time slot (line 14-16).
5.3.4 Sufferage Cost Time Tradeoff (SuffCTT Heuristics)
SuffCTT is based on the concept of Sufferage heuristic [110][116] which assigns highestpriority to the application, which would “suffer” the most if not assigned. For each userapplication, first SuffCTT finds the time slot on a resource with minimum sufferage valuewhich is the difference between its best and second best value of cost metric as defined inEquation 5.1. From these user application/time slot pairs, the pair that gives the highestsufferage value is selected; and that application is scheduled onto that time slot of thatresource. This procedure is repeated until all of the user applications have been sched-uled. The pseudo code for SuffCTT is given by Algorithm 5.2. SuffCTT heuristic, then,selects for each application, all the feasible time-slots for which value of the cost metricis minimum (line 3-8). The heuristic calculates the sufferage value for each applicationand select the application with the maximum sufferage value (line 9-13). The selected ap-plication is then scheduled on the resource time slot with the minimum cost metric value(line 14). Then, the available time slots list is updated and the process is repeated until allapplications get the required resource time slot (line 15-17).
5.3.5 Time Complexity
Let TS(j, t) be the number of time slots initially available at resource j during the schedul-ing interval at time t. The main operations performed during MinCTT and MaxCTT arethe following:
1. To allocate any resource to an application, the worst number of iteration is to beperformed over each user application and resource i.e. O(n ∗ |R(j)|) times
2. In each iteration (step 5 to 8 in Algorithm 5.1), time slot with minimum executiontime is searched. This is of order of available time slots i.e., O(TS(j, t)).
3. In worst case, the above operations are performed for each application, i.e., n times
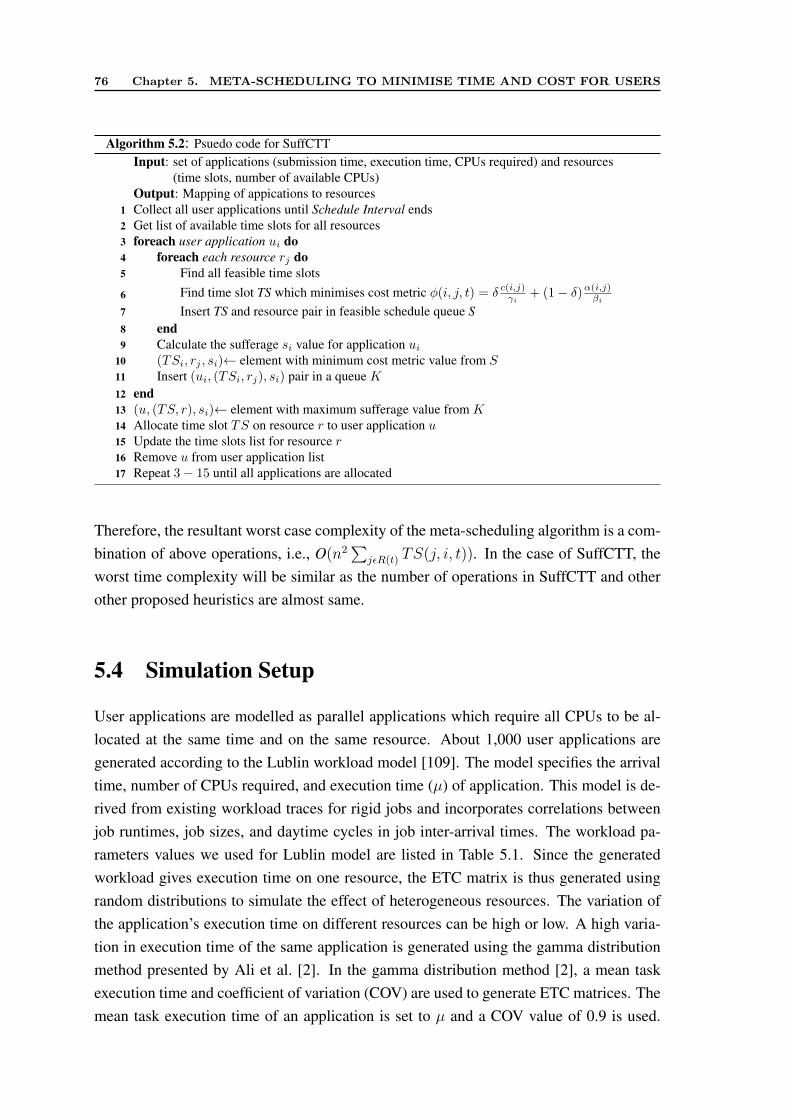
76 Chapter 5. META-SCHEDULING TO MINIMISE TIME AND COST FOR USERS
Algorithm 5.2: Psuedo code for SuffCTTInput: set of applications (submission time, execution time, CPUs required) and resources
(time slots, number of available CPUs)Output: Mapping of appications to resourcesCollect all user applications until Schedule Interval ends1Get list of available time slots for all resources2foreach user application ui do3
foreach each resource rj do4Find all feasible time slots5
Find time slot TS which minimises cost metric φ(i, j, t) = δ c(i,j)γi+ (1− δ)α(i,j)βi
6Insert TS and resource pair in feasible schedule queue S7
end8Calculate the sufferage si value for application ui9(TSi, rj , si)← element with minimum cost metric value from S10Insert (ui, (TSi, rj), si) pair in a queue K11
end12(u, (TS, r), si)← element with maximum sufferage value from K13Allocate time slot TS on resource r to user application u14Update the time slots list for resource r15Remove u from user application list16Repeat 3− 15 until all applications are allocated17
Therefore, the resultant worst case complexity of the meta-scheduling algorithm is a com-bination of above operations, i.e., O(n2
∑jεR(t) TS(j, i, t)). In the case of SuffCTT, the
worst time complexity will be similar as the number of operations in SuffCTT and otherother proposed heuristics are almost same.
5.4 Simulation Setup
User applications are modelled as parallel applications which require all CPUs to be al-located at the same time and on the same resource. About 1,000 user applications aregenerated according to the Lublin workload model [109]. The model specifies the arrivaltime, number of CPUs required, and execution time (µ) of application. This model is de-rived from existing workload traces for rigid jobs and incorporates correlations betweenjob runtimes, job sizes, and daytime cycles in job inter-arrival times. The workload pa-rameters values we used for Lublin model are listed in Table 5.1. Since the generatedworkload gives execution time on one resource, the ETC matrix is thus generated usingrandom distributions to simulate the effect of heterogeneous resources. The variation ofthe application’s execution time on different resources can be high or low. A high varia-tion in execution time of the same application is generated using the gamma distributionmethod presented by Ali et al. [2]. In the gamma distribution method [2], a mean taskexecution time and coefficient of variation (COV) are used to generate ETC matrices. Themean task execution time of an application is set to µ and a COV value of 0.9 is used.
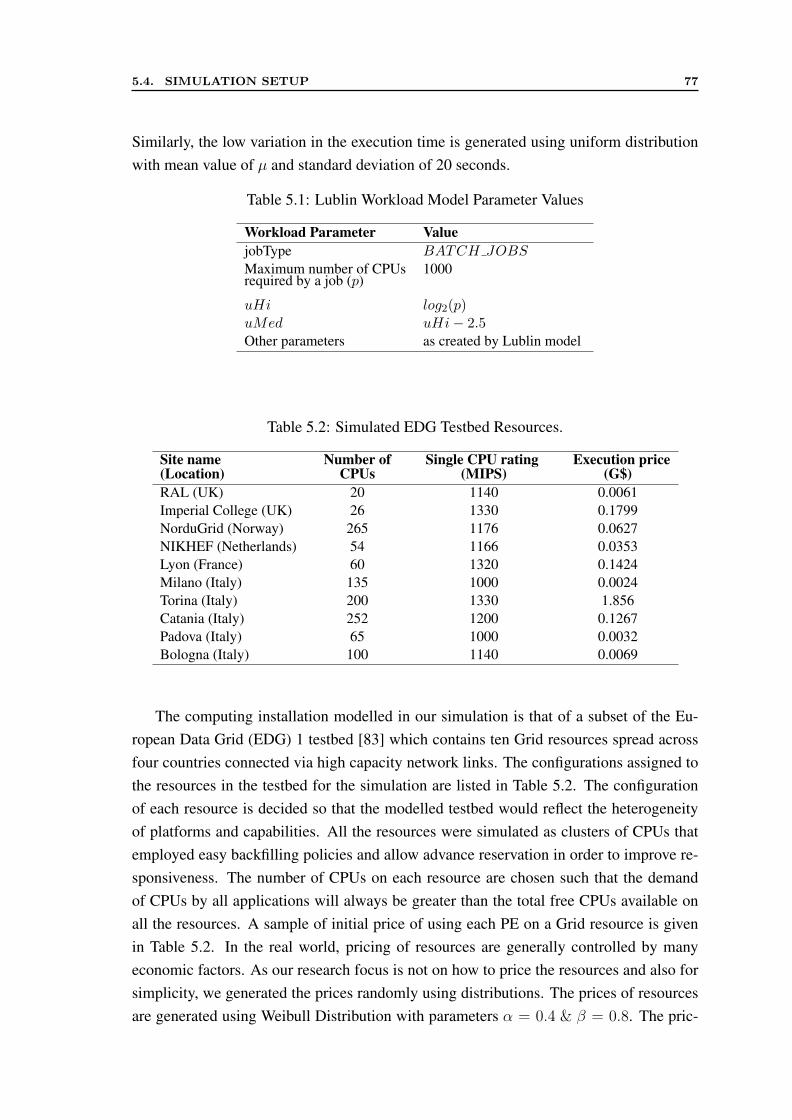
5.4. SIMULATION SETUP 77
Similarly, the low variation in the execution time is generated using uniform distributionwith mean value of µ and standard deviation of 20 seconds.
Table 5.1: Lublin Workload Model Parameter Values
Workload Parameter ValuejobType BATCH JOBSMaximum number of CPUs 1000required by a job (p)
uHi log2(p)uMed uHi− 2.5Other parameters as created by Lublin model
Table 5.2: Simulated EDG Testbed Resources.
Site name Number of Single CPU rating Execution price(Location) CPUs (MIPS) (G$)RAL (UK) 20 1140 0.0061Imperial College (UK) 26 1330 0.1799NorduGrid (Norway) 265 1176 0.0627NIKHEF (Netherlands) 54 1166 0.0353Lyon (France) 60 1320 0.1424Milano (Italy) 135 1000 0.0024Torina (Italy) 200 1330 1.856Catania (Italy) 252 1200 0.1267Padova (Italy) 65 1000 0.0032Bologna (Italy) 100 1140 0.0069
The computing installation modelled in our simulation is that of a subset of the Eu-ropean Data Grid (EDG) 1 testbed [83] which contains ten Grid resources spread acrossfour countries connected via high capacity network links. The configurations assigned tothe resources in the testbed for the simulation are listed in Table 5.2. The configurationof each resource is decided so that the modelled testbed would reflect the heterogeneityof platforms and capabilities. All the resources were simulated as clusters of CPUs thatemployed easy backfilling policies and allow advance reservation in order to improve re-sponsiveness. The number of CPUs on each resource are chosen such that the demandof CPUs by all applications will always be greater than the total free CPUs available onall the resources. A sample of initial price of using each PE on a Grid resource is givenin Table 5.2. In the real world, pricing of resources are generally controlled by manyeconomic factors. As our research focus is not on how to price the resources and also forsimplicity, we generated the prices randomly using distributions. The prices of resourcesare generated using Weibull Distribution with parameters α = 0.4 & β = 0.8. The pric-
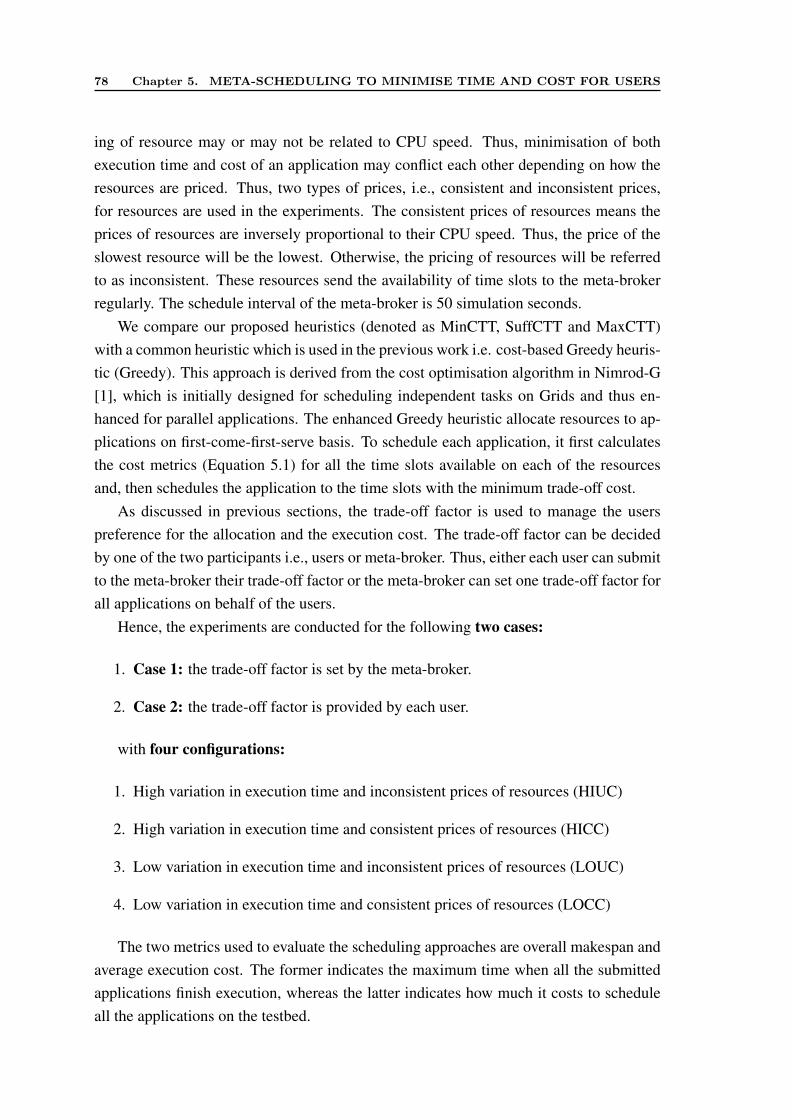
78 Chapter 5. META-SCHEDULING TO MINIMISE TIME AND COST FOR USERS
ing of resource may or may not be related to CPU speed. Thus, minimisation of bothexecution time and cost of an application may conflict each other depending on how theresources are priced. Thus, two types of prices, i.e., consistent and inconsistent prices,for resources are used in the experiments. The consistent prices of resources means theprices of resources are inversely proportional to their CPU speed. Thus, the price of theslowest resource will be the lowest. Otherwise, the pricing of resources will be referredto as inconsistent. These resources send the availability of time slots to the meta-brokerregularly. The schedule interval of the meta-broker is 50 simulation seconds.
We compare our proposed heuristics (denoted as MinCTT, SuffCTT and MaxCTT)with a common heuristic which is used in the previous work i.e. cost-based Greedy heuris-tic (Greedy). This approach is derived from the cost optimisation algorithm in Nimrod-G[1], which is initially designed for scheduling independent tasks on Grids and thus en-hanced for parallel applications. The enhanced Greedy heuristic allocate resources to ap-plications on first-come-first-serve basis. To schedule each application, it first calculatesthe cost metrics (Equation 5.1) for all the time slots available on each of the resourcesand, then schedules the application to the time slots with the minimum trade-off cost.
As discussed in previous sections, the trade-off factor is used to manage the userspreference for the allocation and the execution cost. The trade-off factor can be decidedby one of the two participants i.e., users or meta-broker. Thus, either each user can submitto the meta-broker their trade-off factor or the meta-broker can set one trade-off factor forall applications on behalf of the users.
Hence, the experiments are conducted for the following two cases:
1. Case 1: the trade-off factor is set by the meta-broker.
2. Case 2: the trade-off factor is provided by each user.
with four configurations:
1. High variation in execution time and inconsistent prices of resources (HIUC)
2. High variation in execution time and consistent prices of resources (HICC)
3. Low variation in execution time and inconsistent prices of resources (LOUC)
4. Low variation in execution time and consistent prices of resources (LOCC)
The two metrics used to evaluate the scheduling approaches are overall makespan andaverage execution cost. The former indicates the maximum time when all the submittedapplications finish execution, whereas the latter indicates how much it costs to scheduleall the applications on the testbed.
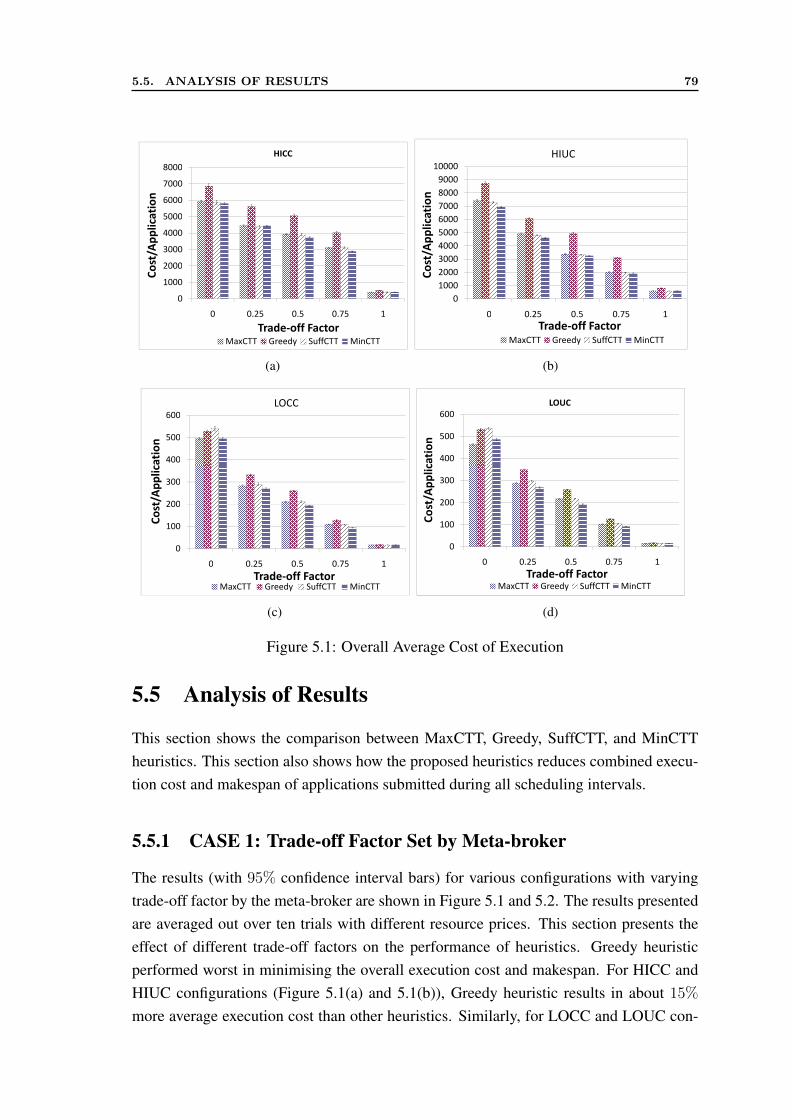
5.5. ANALYSIS OF RESULTS 79
8000
HICC
7000
8000
5000
6000
Co
st/A
pp
lica
tio
n
4000
5000
Co
st/A
pp
lica
tio
n
2000
3000
Co
st/A
pp
lica
tio
n
1000
2000
Co
st/A
pp
lica
tio
n
0
0 0.25 0.5 0.75 10 0.25 0.5 0.75 1
Trade-off FactorMaxCTT Greedy SuffCTT MinCTTMaxCTT Greedy SuffCTT MinCTT
(a)
10000
HIUC
8000
9000
10000
7000
8000
Co
st/A
pp
lica
tio
n
5000
6000
Co
st/A
pp
lica
tio
n
3000
4000
5000
Co
st/A
pp
lica
tio
n
1000
2000
3000
Co
st/A
pp
lica
tio
n
0
1000
0 0.25 0.5 0.75 10 0.25 0.5 0.75 1
Trade-off FactorMaxCTT Greedy SuffCTT MinCTTMaxCTT Greedy SuffCTT MinCTT
(b)
600
LOCC
500
600
400
500
Co
st/A
pp
lica
tio
n
300
400
Co
st/A
pp
lica
tio
n
200
300
Co
st/A
pp
lica
tio
n
100
Co
st/A
pp
lica
tio
n
0
0 0.25 0.5 0.75 10 0.25 0.5 0.75 1
Trade-off FactorMaxCTT Greedy SuffCTT MinCTTMaxCTT Greedy SuffCTT MinCTT
(c)
600
LOUC
500
600
400
500C
ost
/Ap
pli
cati
on
300
400
Co
st/A
pp
lica
tio
n
200
300
Co
st/A
pp
lica
tio
n
100
Co
st/A
pp
lica
tio
n
0
0 0.25 0.5 0.75 10 0.25 0.5 0.75 1
Trade-off FactorMaxCTT Greedy SuffCTT MinCTTMaxCTT Greedy SuffCTT MinCTT
(d)
Figure 5.1: Overall Average Cost of Execution
5.5 Analysis of Results
This section shows the comparison between MaxCTT, Greedy, SuffCTT, and MinCTTheuristics. This section also shows how the proposed heuristics reduces combined execu-tion cost and makespan of applications submitted during all scheduling intervals.
5.5.1 CASE 1: Trade-off Factor Set by Meta-broker
The results (with 95% confidence interval bars) for various configurations with varyingtrade-off factor by the meta-broker are shown in Figure 5.1 and 5.2. The results presentedare averaged out over ten trials with different resource prices. This section presents theeffect of different trade-off factors on the performance of heuristics. Greedy heuristicperformed worst in minimising the overall execution cost and makespan. For HICC andHIUC configurations (Figure 5.1(a) and 5.1(b)), Greedy heuristic results in about 15%
more average execution cost than other heuristics. Similarly, for LOCC and LOUC con-
80 Chapter 5. META-SCHEDULING TO MINIMISE TIME AND COST FOR USERS
800
HICC
700
800
500
600
700
Ov
era
ll M
ak
esp
an
(se
con
ds)
400
500
Ov
era
ll M
ak
esp
an
(se
con
ds)
200
300
Ov
era
ll M
ak
esp
an
(se
con
ds)
100
200
Ov
era
ll M
ak
esp
an
0
0 0.25 0.5 0.75 10 0.25 0.5 0.75 1
Trade-off FactorMaxCTT Greedy SuffCTT MinCTTMaxCTT Greedy SuffCTT MinCTT
(a)
1200
HIUC
1000
1200
800
1000
Ov
era
ll M
ak
esp
an
600
800
Ov
era
ll M
ak
esp
an
(se
con
ds)
400
600
Ov
era
ll M
ak
esp
an
(se
con
ds)
200Ov
era
ll M
ak
esp
an
(se
con
ds)
0
0 0.25 0.5 0.75 10 0.25 0.5 0.75 1
Trade-off FactorMaxCTT Greedy SuffCTT MinCTTMaxCTT Greedy SuffCTT MinCTT
(b)
500
LOCC
400
450
500
Ov
era
ll M
ak
esp
an
300
350
400
Ov
era
ll M
ak
esp
an
(se
con
ds)
250
300
Ov
era
ll M
ak
esp
an
(se
con
ds)
150
200
Ov
era
ll M
ak
esp
an
(se
con
ds)
50
100
150
Ov
era
ll M
ak
esp
an
0
50
0 0.25 0.5 0.75 10 0.25 0.5 0.75 1
Trade-off FactorMaxCTT Greedy SuffCTT MinCTTMaxCTT Greedy SuffCTT MinCTT
(c)
500
LOUC
400
450
500
Ov
era
ll M
ak
esp
an
350
400
Ov
era
ll M
ak
esp
an
(se
con
ds)
250
300
Ov
era
ll M
ak
esp
an
(se
con
ds)
150
200
250
Ov
era
ll M
ak
esp
an
(se
con
ds)
50
100
150
Ov
era
ll M
ak
esp
an
0
50
0 0.25 0.5 0.75 10 0.25 0.5 0.75 1
Trade-off FactorMaxCTT Greedy SuffCTT MinCTTMaxCTT Greedy SuffCTT MinCTT
(d)
Figure 5.2: Overall Makespan
figuration (Figure 5.1(c) and 5.1(d)), Greedy heuristic also results in about 10% moreexecution cost except when “Trade-off factor=0”. The reason for this anomaly is that“Trade-off factor=0” means users are only looking for the fastest execution time of theirapplications, not the cheapest resource. Thus all heuristics try to run the applications onthe fastest resource. For HICC and HIUC configurations (Figure 5.1), MaxCTT, MinCTTand SuffCTT results in almost similar average execution cost. While in the case of LOCCand LOUC configurations, MinCTT resulted in the lowest cost.
It can be noted from Figure 5.1 that with the increase in the trade-off factors, the over-all average execution cost is also decreased. With the increase in the trade-off factor from0 to 1, the average execution cost fall by about 90%. This is because more applicationsare scheduled on the cheaper resources, due to the increase in user’s priority for cost overtime.
Figure 5.2 shows the effect on the overall makespan by the four heuristics in differentconfigurations. The overall makespan of applications for HICC and HIUC (Figure 5.2(a)and 5.2(b)) is about 30% higher than for LOCC and LOUC (Figure 5.2(c) and 5.2(d)).
5.5. ANALYSIS OF RESULTS 81
Moreover, for LOCC (Figure 5.2(c)) and LOUC (Figure 5.2(d)), the overall makespan byall heuristics, except greedy, remained almost the same (about 150–200 sec) regardless ofthe change in trade-off factor (0–1). This is because the low variation in execution timeacross various resources causes the time factor in the cost metric (as defined in Equation5.1) to be less effective. This low variation in overall makespan also demonstrates theeffectiveness of our proposed heuristics in managing the time requirement of all users.
For configurations HICC and HIUC (Figure 5.2(a) and 5.2(b)), the overall makespanincreases with the trade-off factor which becomes very significant for Trade-off factor=1.This increase in the overall makespan is because of running all applications on the cheap-est resources. Figure 5.2 shows that MinCTT resulted in the lowest overall makespan andgreedy resulted in the highest makespan.
The effect of cost consistency can also be observed when we compare Figure 5.1and 5.2. The overall makespan is increased on average by about 30–40% from HICCconfiguration (Figure 5.2(a)) to HIUC configuration (Figure 5.2(b)). Similar behaviour isalso observed in the case of average execution cost from Figure 5.1(a) and 5.1(b).
5.5.2 CASE 2: Trade-off Factor Set by User
This section discusses the performance of the heuristics in four different configurations ofETC matrix and resource pricing.
Impact on Makespan and Execution Cost of Users
In Figure 5.3, the normalised average execution cost and overall makespan for all userapplications is compiled in four different configurations with the lower bound. The costand makespan by different heuristics is normalised using values by Greedy heuristic.
The Greedy heuristic performed worst by generating the most expensive schedule withthe maximum makespan in almost all four configurations, thus values in Figure 5.3 are lessthan one. MaxCTT, MinCTT, and SuffCTT resulted in about 18% cheaper schedule thanGreedy heuristic. The reason for Greedy heuristic performance is that Greedy heuristicdoes not consider the effect of other applications in the meta-broker while generating theschedule for any application. Even though, MinCTT, MaxCTT, and SuffCTT heuristicsgive almost same overall cost improvement over Greedy, MinCTT gives the best overallmakespan in almost all the cases. For example, in LOCC configuration (Figure 5.3(b)),MinCTT improved the overall makespan by 20%.
Moreover, in comparison to the lower bound, our proposed heuristics give the bestperformance for LOCC and LOUC configuration. In Figure 5.3, in case of LOCC con-figuration, the difference between lower bound for overall cost and our heuristics is just2 − 3%, while for overall makespan it is about 8 − 9%. In case of high variation of
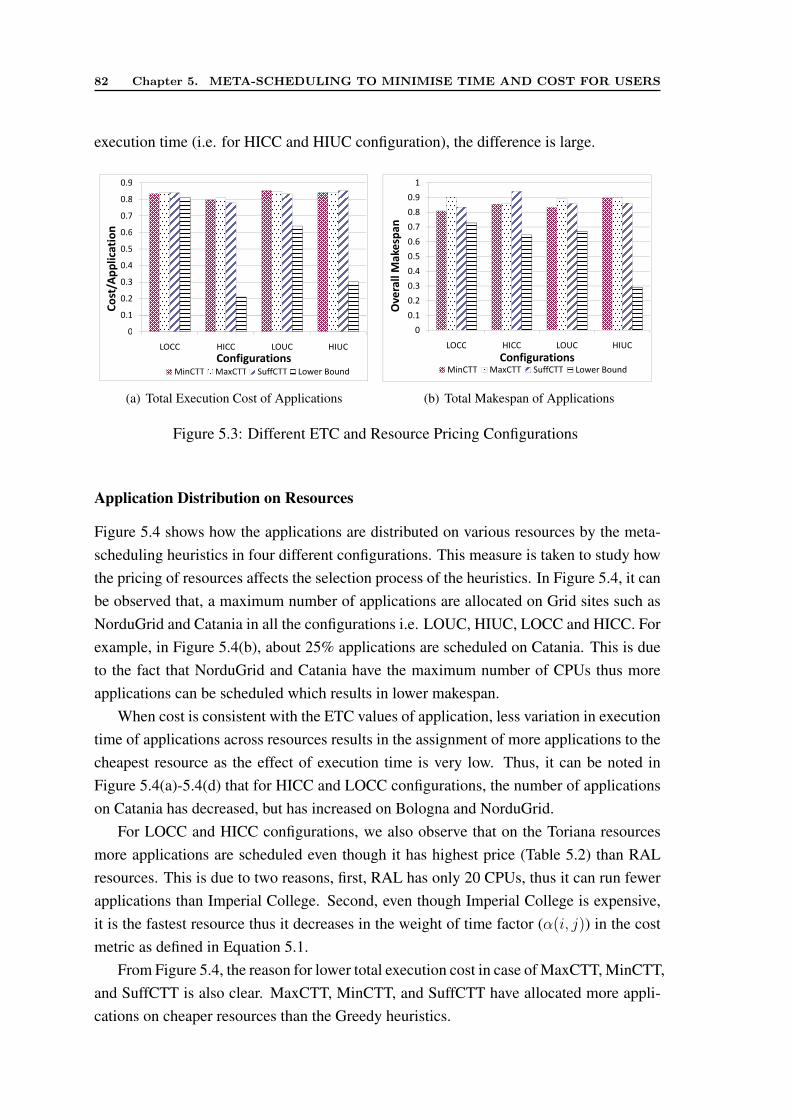
82 Chapter 5. META-SCHEDULING TO MINIMISE TIME AND COST FOR USERS
execution time (i.e. for HICC and HIUC configuration), the difference is large.
0.90.90.9
0.80.8
0.7
0.8
0.70.7
0.6
Cost/Application 0.6
Cost/Application 0.6
Cost/Application
0.5
Cost/Application
0.5
Cost/Application
0.5
Cost/Application
0.4
Cost/Application
0.4
Cost/Application
0.3
Cost/Application
0.3
Cost/Application
0.3
Cost/Application
0.2
Cost/Application
0.2
Cost/Application
0.2
Cost/Application
0.1
Cost/Application
0.1
000
LOCC HICC LOUC HIUCLOCC HICC LOUC HIUC
ConfigurationsLOCC HICC LOUC HIUC
ConfigurationsConfigurationsConfigurationsMinCTT MaxCTT SuffCTT Lower BoundMinCTT MaxCTT SuffCTT Lower BoundMinCTT MaxCTT SuffCTT Lower Bound
(a) Total Execution Cost of Applications
0.9
1
0.7
0.8
0.9
Ov
era
ll M
ak
esp
an
0.6
0.7
Ov
era
ll M
ak
esp
an
0.4
0.5
Ov
era
ll M
ak
esp
an
0.2
0.3
0.4
Ov
era
ll M
ak
esp
an
0.1
0.2
Ov
era
ll M
ak
esp
an
0
LOCC HICC LOUC HIUCLOCC HICC LOUC HIUC
ConfigurationsMinCTT MaxCTT SuffCTT Lower BoundMinCTT MaxCTT SuffCTT Lower Bound
(b) Total Makespan of Applications
Figure 5.3: Different ETC and Resource Pricing Configurations
Application Distribution on Resources
Figure 5.4 shows how the applications are distributed on various resources by the meta-scheduling heuristics in four different configurations. This measure is taken to study howthe pricing of resources affects the selection process of the heuristics. In Figure 5.4, it canbe observed that, a maximum number of applications are allocated on Grid sites such asNorduGrid and Catania in all the configurations i.e. LOUC, HIUC, LOCC and HICC. Forexample, in Figure 5.4(b), about 25% applications are scheduled on Catania. This is dueto the fact that NorduGrid and Catania have the maximum number of CPUs thus moreapplications can be scheduled which results in lower makespan.
When cost is consistent with the ETC values of application, less variation in executiontime of applications across resources results in the assignment of more applications to thecheapest resource as the effect of execution time is very low. Thus, it can be noted inFigure 5.4(a)-5.4(d) that for HICC and LOCC configurations, the number of applicationson Catania has decreased, but has increased on Bologna and NorduGrid.
For LOCC and HICC configurations, we also observe that on the Toriana resourcesmore applications are scheduled even though it has highest price (Table 5.2) than RALresources. This is due to two reasons, first, RAL has only 20 CPUs, thus it can run fewerapplications than Imperial College. Second, even though Imperial College is expensive,it is the fastest resource thus it decreases in the weight of time factor (α(i, j)) in the costmetric as defined in Equation 5.1.
From Figure 5.4, the reason for lower total execution cost in case of MaxCTT, MinCTT,and SuffCTT is also clear. MaxCTT, MinCTT, and SuffCTT have allocated more appli-cations on cheaper resources than the Greedy heuristics.
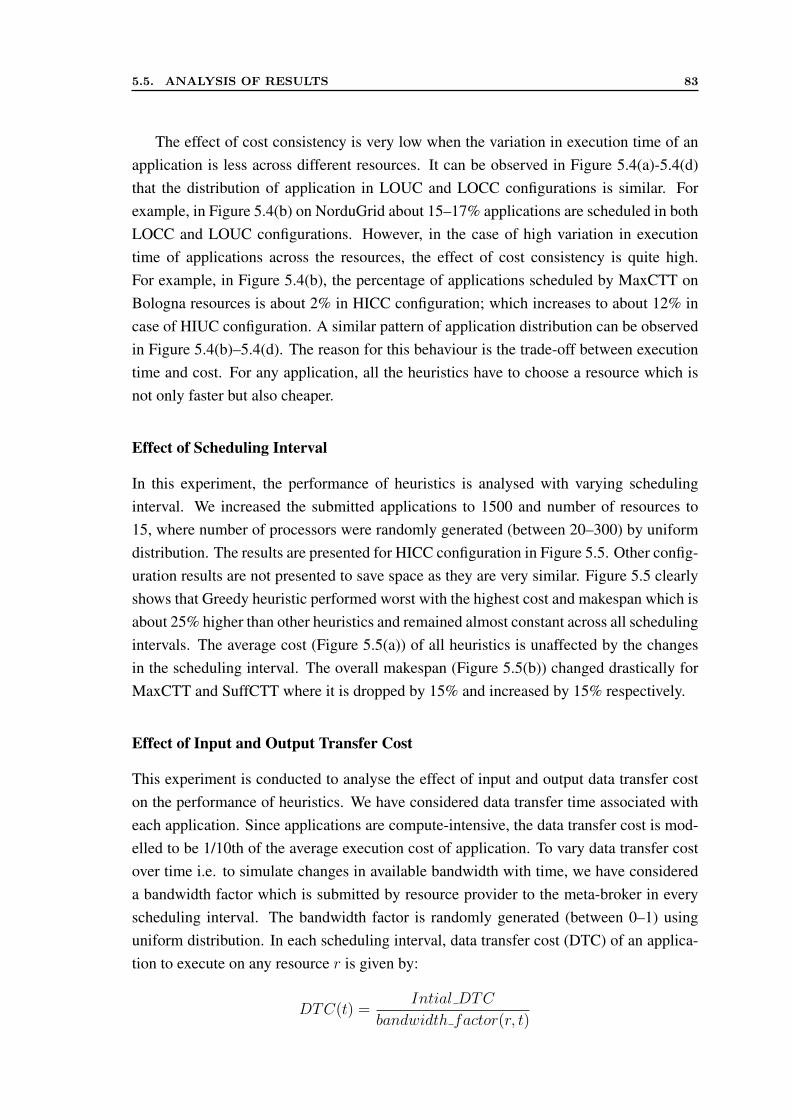
5.5. ANALYSIS OF RESULTS 83
The effect of cost consistency is very low when the variation in execution time of anapplication is less across different resources. It can be observed in Figure 5.4(a)-5.4(d)that the distribution of application in LOUC and LOCC configurations is similar. Forexample, in Figure 5.4(b) on NorduGrid about 15–17% applications are scheduled in bothLOCC and LOUC configurations. However, in the case of high variation in executiontime of applications across the resources, the effect of cost consistency is quite high.For example, in Figure 5.4(b), the percentage of applications scheduled by MaxCTT onBologna resources is about 2% in HICC configuration; which increases to about 12% incase of HIUC configuration. A similar pattern of application distribution can be observedin Figure 5.4(b)–5.4(d). The reason for this behaviour is the trade-off between executiontime and cost. For any application, all the heuristics have to choose a resource which isnot only faster but also cheaper.
Effect of Scheduling Interval
In this experiment, the performance of heuristics is analysed with varying schedulinginterval. We increased the submitted applications to 1500 and number of resources to15, where number of processors were randomly generated (between 20–300) by uniformdistribution. The results are presented for HICC configuration in Figure 5.5. Other config-uration results are not presented to save space as they are very similar. Figure 5.5 clearlyshows that Greedy heuristic performed worst with the highest cost and makespan which isabout 25% higher than other heuristics and remained almost constant across all schedulingintervals. The average cost (Figure 5.5(a)) of all heuristics is unaffected by the changesin the scheduling interval. The overall makespan (Figure 5.5(b)) changed drastically forMaxCTT and SuffCTT where it is dropped by 15% and increased by 15% respectively.
Effect of Input and Output Transfer Cost
This experiment is conducted to analyse the effect of input and output data transfer coston the performance of heuristics. We have considered data transfer time associated witheach application. Since applications are compute-intensive, the data transfer cost is mod-elled to be 1/10th of the average execution cost of application. To vary data transfer costover time i.e. to simulate changes in available bandwidth with time, we have considereda bandwidth factor which is submitted by resource provider to the meta-broker in everyscheduling interval. The bandwidth factor is randomly generated (between 0–1) usinguniform distribution. In each scheduling interval, data transfer cost (DTC) of an applica-tion to execute on any resource r is given by:
DTC(t) =Intial DTC
bandwidth factor(r, t)
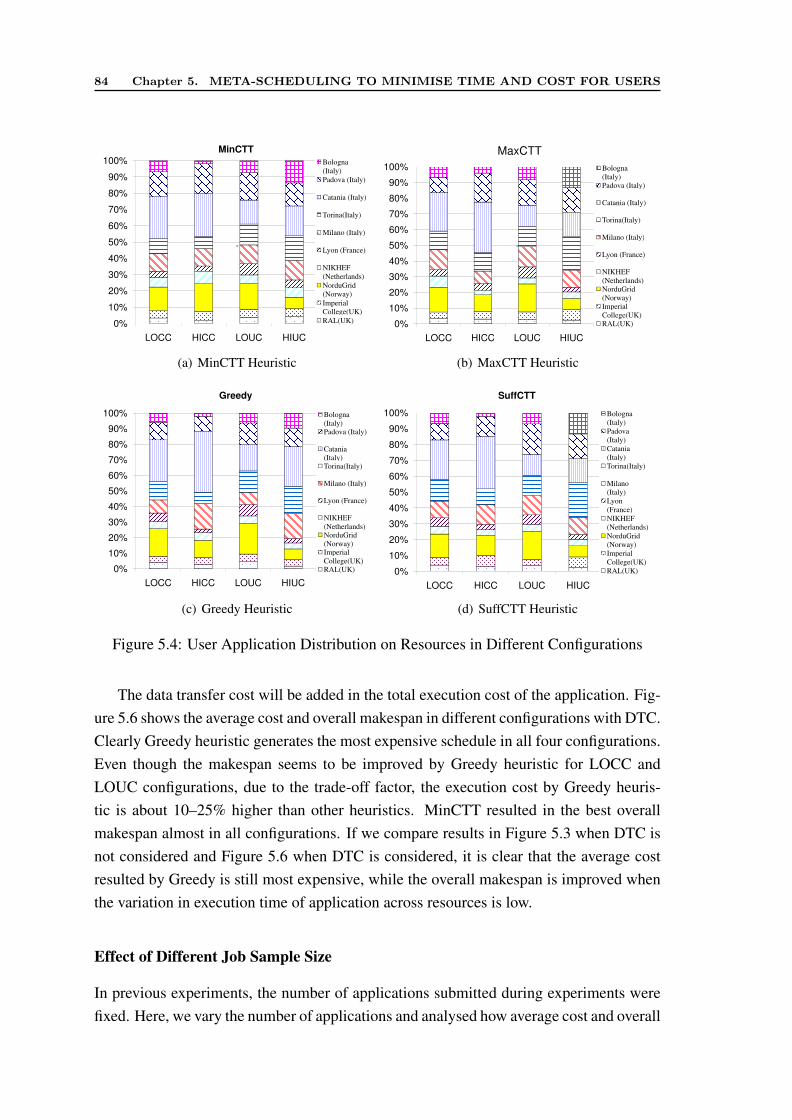
84 Chapter 5. META-SCHEDULING TO MINIMISE TIME AND COST FOR USERS
100%
MinCTT
Bologna
90%
100% Bologna
(Italy)
Padova (Italy)
70%
80% Catania (Italy)
Torina(Italy)
60%
70%Torina(Italy)
Milano (Italy)
40%
50%
Milano (Italy)
Lyon (France)c
30%
40%NIKHEF
(Netherlands)
NorduGrid
10%
20%NorduGrid
(Norway)
Imperial
College(UK)
0%
10%
LOCC HICC LOUC HIUC
College(UK)
RAL(UK)
LOCC HICC LOUC HIUC
(a) MinCTT Heuristic
100%
MaxCTT
90%
100% Bologna
(Italy)
Padova (Italy)
70%
80%
90% Padova (Italy)
Catania (Italy)
60%
70%Torina(Italy)
Milano (Italy)
40%
50%Milano (Italy)
Lyon (France)
c
30%
40%
NIKHEF
(Netherlands)
10%
20%NorduGrid
(Norway)
Imperial
0%
10%
LOCC HICC LOUC HIUC
Imperial
College(UK)
RAL(UK)
LOCC HICC LOUC HIUC
(b) MaxCTT Heuristic
100%
Greedy
90%
100% Bologna
(Italy)
Padova (Italy)
70%
80%
90% Padova (Italy)
Catania
(Italy)
60%
70% (Italy)
Torina(Italy)
Milano (Italy)
40%
50%Milano (Italy)
Lyon (France)
30%
40%
NIKHEF
(Netherlands)NorduGrid
10%
20% NorduGrid
(Norway) Imperial
0%
10%
LOCC HICC LOUC HIUC
Imperial
College(UK)
RAL(UK)
LOCC HICC LOUC HIUC
(c) Greedy Heuristic
100%
SuffCTT
90%
100% Bologna
(Italy)
Padova
70%
80%
90% Padova
(Italy)
Catania
(Italy)
60%
70%(Italy)
Torina(Italy)
Milano
40%
50%
Milano
(Italy)
Lyon
(France)
30%
40% (France)
NIKHEF
(Netherlands)
10%
20%
(Netherlands)
NorduGrid
(Norway)
Imperial
0%
10%
LOCC HICC LOUC HIUC
Imperial
College(UK)
RAL(UK)
LOCC HICC LOUC HIUC
(d) SuffCTT Heuristic
Figure 5.4: User Application Distribution on Resources in Different Configurations
The data transfer cost will be added in the total execution cost of the application. Fig-ure 5.6 shows the average cost and overall makespan in different configurations with DTC.Clearly Greedy heuristic generates the most expensive schedule in all four configurations.Even though the makespan seems to be improved by Greedy heuristic for LOCC andLOUC configurations, due to the trade-off factor, the execution cost by Greedy heuris-tic is about 10–25% higher than other heuristics. MinCTT resulted in the best overallmakespan almost in all configurations. If we compare results in Figure 5.3 when DTC isnot considered and Figure 5.6 when DTC is considered, it is clear that the average costresulted by Greedy is still most expensive, while the overall makespan is improved whenthe variation in execution time of application across resources is low.
Effect of Different Job Sample Size
In previous experiments, the number of applications submitted during experiments werefixed. Here, we vary the number of applications and analysed how average cost and overall
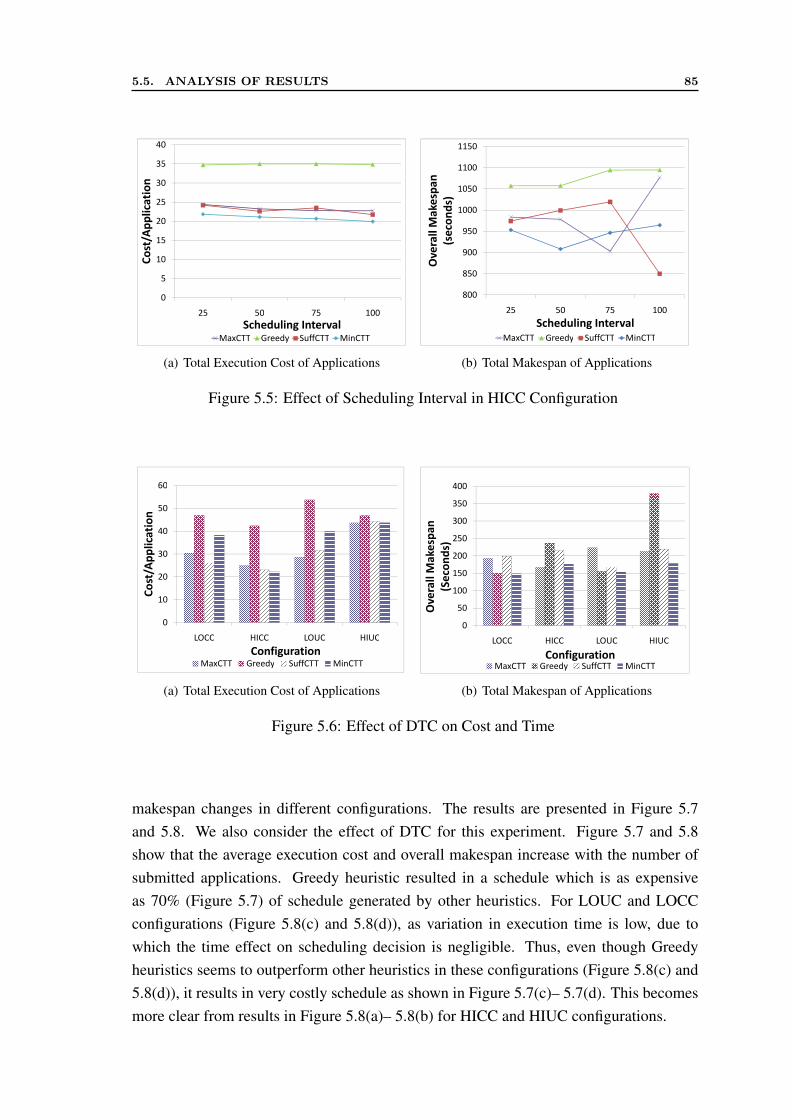
5.5. ANALYSIS OF RESULTS 85
35
40
30
35
Cost/Application
25
30
Cost/Application
15
20
Cost/Application
10
15
Cost/Application
5
10Cost/Application
0
25 50 75 10025 50 75 100
Scheduling IntervalMaxCTT Greedy SuffCTT MinCTTMaxCTT Greedy SuffCTT MinCTT
(a) Total Execution Cost of Applications
950
1000
1050
1100
1150
Ov
era
ll M
ak
esp
an
(se
con
ds)
800
850
900
950
25 50 75 100
Ov
era
ll M
ak
esp
an
(se
con
ds)
Scheduling Interval
MaxCTT Greedy SuffCTT MinCTTMaxCTT Greedy SuffCTT MinCTT
(b) Total Makespan of Applications
Figure 5.5: Effect of Scheduling Interval in HICC Configuration
60
50
60
Cost/Application
40
Cost/Application
30
Cost/Application
20
Cost/Application
10
Cost/Application
0
LOCC HICC LOUC HIUCLOCC HICC LOUC HIUC
ConfigurationMaxCTT Greedy SuffCTT MinCTTMaxCTT Greedy SuffCTT MinCTT
(a) Total Execution Cost of Applications
200
250
300
350
400
Ov
era
ll M
ak
esp
an
(Se
con
ds)
0
50
100
150
LOCC HICC LOUC HIUC
Ov
era
ll M
ak
esp
an
(Se
con
ds)
ConfigurationMaxCTT Greedy SuffCTT MinCTTMaxCTT Greedy SuffCTT MinCTT
(b) Total Makespan of Applications
Figure 5.6: Effect of DTC on Cost and Time
makespan changes in different configurations. The results are presented in Figure 5.7and 5.8. We also consider the effect of DTC for this experiment. Figure 5.7 and 5.8show that the average execution cost and overall makespan increase with the number ofsubmitted applications. Greedy heuristic resulted in a schedule which is as expensiveas 70% (Figure 5.7) of schedule generated by other heuristics. For LOUC and LOCCconfigurations (Figure 5.8(c) and 5.8(d)), as variation in execution time is low, due towhich the time effect on scheduling decision is negligible. Thus, even though Greedyheuristics seems to outperform other heuristics in these configurations (Figure 5.8(c) and5.8(d)), it results in very costly schedule as shown in Figure 5.7(c)– 5.7(d). This becomesmore clear from results in Figure 5.8(a)– 5.8(b) for HICC and HIUC configurations.
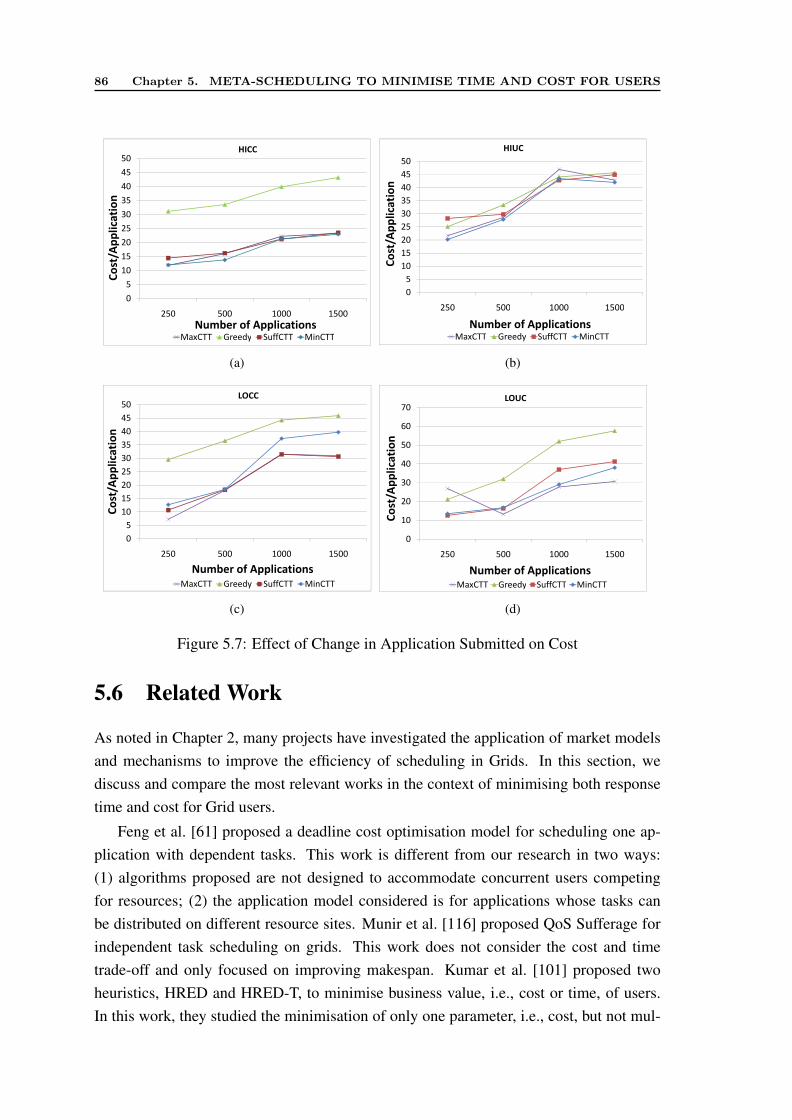
86 Chapter 5. META-SCHEDULING TO MINIMISE TIME AND COST FOR USERS
25
30
35
40
45
50
Co
st/A
pp
lica
tio
n
HICC
0
5
10
15
20
250 500 1000 1500
Co
st/A
pp
lica
tio
n
Number of ApplicationsMaxCTT Greedy SuffCTT MinCTTMaxCTT Greedy SuffCTT MinCTT
(a)
50
HIUC
40
45
50
Co
st/A
pp
lica
tio
n
30
35
40
Co
st/A
pp
lica
tio
n
20
25
30
Co
st/A
pp
lica
tio
n
10
15
20
Co
st/A
pp
lica
tio
n
5
10Co
st/A
pp
lica
tio
n
0
250 500 1000 1500250 500 1000 1500
Number of ApplicationsMaxCTT Greedy SuffCTT MinCTTMaxCTT Greedy SuffCTT MinCTT
(b)
20
25
30
35
40
45
50
Co
st/A
pp
lica
tio
n
LOCC
0
5
10
15
20
250 500 1000 1500
Co
st/A
pp
lica
tio
n
Number of ApplicationsMaxCTT Greedy SuffCTT MinCTTMaxCTT Greedy SuffCTT MinCTT
(c)
30
40
50
60
70
Co
st/A
pp
lica
tio
nLOUC
0
10
20
30
250 500 1000 1500
Co
st/A
pp
lica
tio
n
Number of ApplicationsMaxCTT Greedy SuffCTT MinCTTMaxCTT Greedy SuffCTT MinCTT
(d)
Figure 5.7: Effect of Change in Application Submitted on Cost
5.6 Related Work
As noted in Chapter 2, many projects have investigated the application of market modelsand mechanisms to improve the efficiency of scheduling in Grids. In this section, wediscuss and compare the most relevant works in the context of minimising both responsetime and cost for Grid users.
Feng et al. [61] proposed a deadline cost optimisation model for scheduling one ap-plication with dependent tasks. This work is different from our research in two ways:(1) algorithms proposed are not designed to accommodate concurrent users competingfor resources; (2) the application model considered is for applications whose tasks canbe distributed on different resource sites. Munir et al. [116] proposed QoS Sufferage forindependent task scheduling on grids. This work does not consider the cost and timetrade-off and only focused on improving makespan. Kumar et al. [101] proposed twoheuristics, HRED and HRED-T, to minimise business value, i.e., cost or time, of users.In this work, they studied the minimisation of only one parameter, i.e., cost, but not mul-
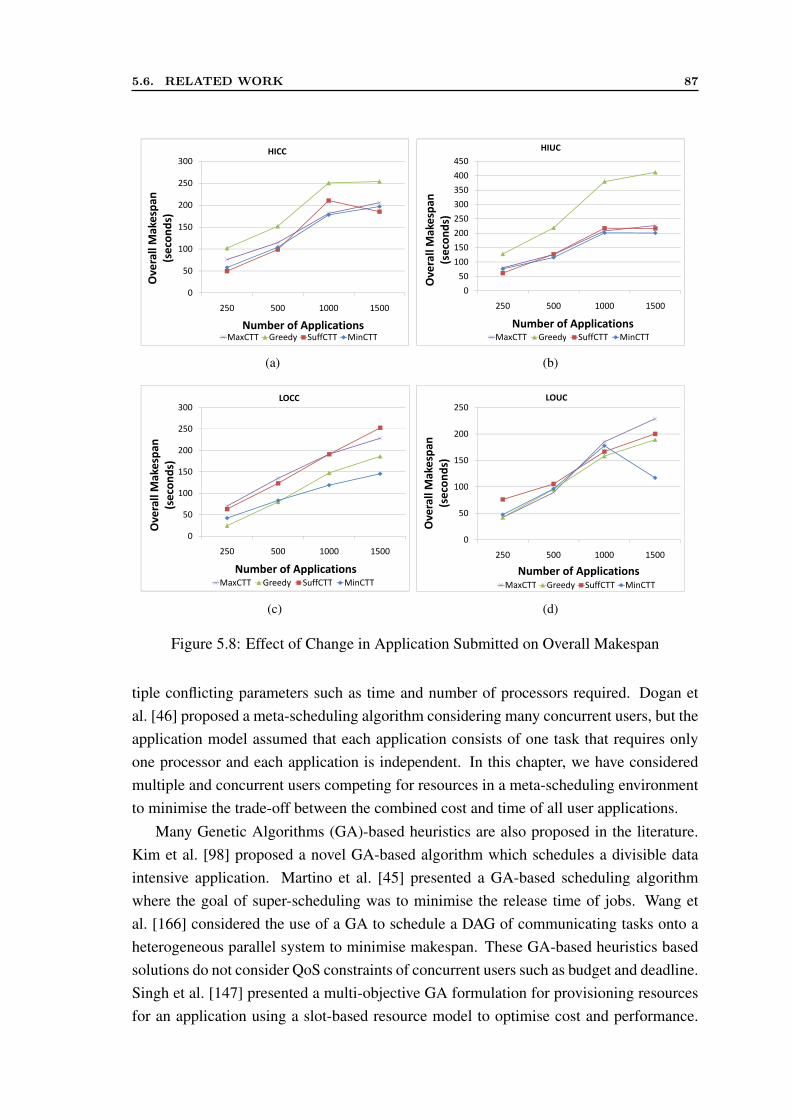
5.6. RELATED WORK 87
150
200
250
300O
ve
rall
Ma
ke
spa
n
(se
con
ds)
HICC
0
50
100
250 500 1000 1500
Ov
era
ll M
ak
esp
an
(se
con
ds)
Number of ApplicationsMaxCTT Greedy SuffCTT MinCTTMaxCTT Greedy SuffCTT MinCTT
(a)
200
250
300
350
400
450
Ov
era
ll M
ak
esp
an
(se
con
ds)
HIUC
0
50
100
150
200
250 500 1000 1500
Ov
era
ll M
ak
esp
an
(se
con
ds)
Number of ApplicationsMaxCTT Greedy SuffCTT MinCTTMaxCTT Greedy SuffCTT MinCTT
(b)
150
200
250
300
Ov
era
ll M
ak
esp
an
(se
con
ds)
LOCC
0
50
100
250 500 1000 1500
Ov
era
ll M
ak
esp
an
(se
con
ds)
Number of ApplicationsMaxCTT Greedy SuffCTT MinCTTMaxCTT Greedy SuffCTT MinCTT
(c)
100
150
200
250
Ov
era
ll M
ak
esp
an
(se
con
ds)
LOUC
0
50
100
250 500 1000 1500
Ov
era
ll M
ak
esp
an
(se
con
ds)
Number of ApplicationsMaxCTT Greedy SuffCTT MinCTTMaxCTT Greedy SuffCTT MinCTT
(d)
Figure 5.8: Effect of Change in Application Submitted on Overall Makespan
tiple conflicting parameters such as time and number of processors required. Dogan etal. [46] proposed a meta-scheduling algorithm considering many concurrent users, but theapplication model assumed that each application consists of one task that requires onlyone processor and each application is independent. In this chapter, we have consideredmultiple and concurrent users competing for resources in a meta-scheduling environmentto minimise the trade-off between the combined cost and time of all user applications.
Many Genetic Algorithms (GA)-based heuristics are also proposed in the literature.Kim et al. [98] proposed a novel GA-based algorithm which schedules a divisible dataintensive application. Martino et al. [45] presented a GA-based scheduling algorithmwhere the goal of super-scheduling was to minimise the release time of jobs. Wang etal. [166] considered the use of a GA to schedule a DAG of communicating tasks onto aheterogeneous parallel system to minimise makespan. These GA-based heuristics basedsolutions do not consider QoS constraints of concurrent users such as budget and deadline.Singh et al. [147] presented a multi-objective GA formulation for provisioning resourcesfor an application using a slot-based resource model to optimise cost and performance.
88 Chapter 5. META-SCHEDULING TO MINIMISE TIME AND COST FOR USERS
As GAs require a long time to execute, they are not suitable for a dynamic environmentsuch as Grids where schedules have to be recomputed regularly as resource availabilitychanges rapidly.
For scheduling approaches outside Grid computing, the Min-Min, Min-Max, and Suf-ferage heuristics [110] are the three major task-level heuristics employed for resourceallocation. As they are developed based on specific domain knowledge, they cannot beapplied directly to scheduling parallel jobs with strict requirements on utility Grids. Inthis chapter, we are considering jobs/applications with fixed number of processors re-quirement that are also called rigid parallel jobs [145]. The scheduling of such jobs onGrid resources is a complex 0–1 Knapsack Problem that is more challenging than tradi-tional scheduling on parallel systems, because of the fixed (rigid) number of processorsrequired by the job, the dynamic availability of resources with different capabilities in dif-ferent administrative domains, and continuously arriving jobs at the meta-scheduler [178].Thus, in this chapter, these heuristics are enhanced accordingly.
5.7 Summary
In utility Grids, a user may have conflicting goals of minimising simultaneously the pro-cessing time and monetary execution cost of his/her application. Thus, we design a costmetric to manage the trade-off between execution cost and time. We also propose threemeta-scheduling heuristics (MaxCTT, SuffCTT, and MinCTT) which minimise and man-age the execution cost and makespan of users’ applications.
The sensitivity of the proposed heuristics is evaluated with respect to changes in theuser preferences (trade-off factor), application’s execution time, and resource pricing. Theresults show that MaxCTT, SuffCTT, and MinCTT outperform the Greedy heuristic innot only optimising cost, but also in minimising the overall makespan. When the trade-off factor (TF) value is chosen by the meta-broker, MinCTT gives the lowest makespanand cost for all configurations except for TF = 1. When the trade-off factor is set byusers, MinCTT, SuffCTT, and MaxCTT generate the cheapest schedule with the lowestmakespan. Among these three heuristics, MinCTT results in the lowest overall makespanfor LOCC, LOUC and HICC configurations. For HIUC configuration, SuffCTT gener-ates the lowest overall makespan. The impact on the average cost due to the changes inthe scheduling interval is minimal for all heuristics. Similarly, the overall makespan byMaxCTT and Greedy heuristics almost remained same. When data transfer cost is consid-ered, similar results are observed except for LOUC and LOCC configurations, MinCTTand Greedy heuristic generates the lowest overall makespan. In short, this chapter hasaddressed the importance of managing the trade-off between execution cost and responsetime by analysing various resource configurations.

5.7. SUMMARY 89
Chapter 4 and 5 discusses the meta-scheduling of concurrent users with competingQoS requirements. The meta-broker maximises users’ utility by decreasing their spend-ing for execution of applications in the utility Grid environment. In the next chapter,we will discuss the market-oriented meta-scheduling problem in the second scenario, i.e.maximising the provider’s utility (profit) while reconciling users’ demand for resources.

Chapter 6
Meta-Scheduling to MaximiseProvider’s Utility
In this chapter, we study the problem of scheduling concurrent users with deadline con-straint on multiple resource sites from the resource provider’s perspective. In this context,the aim of our meta-broker is to maximise resource provider’s utility calculated in termsof the total profit. The profit of resource provider can be maximised by two methods oneby intelligent selection of users, and other by intelligent scheduling across different re-source sites. In this chapter, we focus on minimising the resource provider’s cost by usingthe later approach i.e. scheduling applications across multiple sites.
6.1 Motivation
The increasing maintenance cost of super-computing centers or data centers has becomea big issue for resource providers. The major contributor in this cost is the high energyconsumption [12] which checks the growth of provider’s profit with growing resourcedemand [133]. The high energy consumption not only translates into high energy costswhich directly affect the profit, but also high carbon emissions [113] which can indirectlyaffects the profit due to restriction from regulatory agencies [96]. Thus, many resourceproviders are building different data centers and deploying them in many geographicallocations so as not only to expose their resources to business and consumer applications,e.g. Amazon [6], but also to reduce energy cost, e.g. Google [111]. To address this issue,in this chapter, we present novel near-optimal meta-scheduling algorithms to maximiseprovider’s profit by exploiting heterogeneity across multiple resource sites in terms ofenergy efficiency and electricity cost.
The analysis of previous work shows that little investigation has been done for botheconomic and environmental sustainability of utility Grids. Most previous works have
91
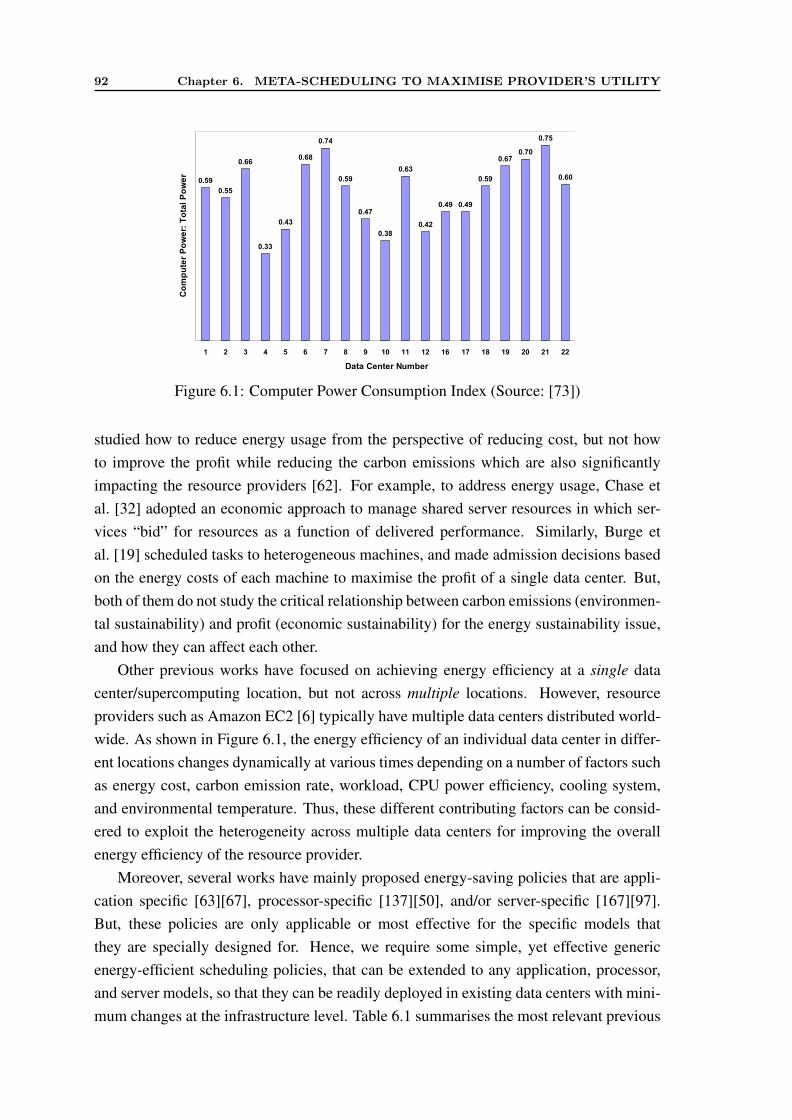
92 Chapter 6. META-SCHEDULING TO MAXIMISE PROVIDER’S UTILITY
Computer Power Consumption Index
0.59
0.55
0.66
0.33
0.43
0.68
0.59
0.47
0.38
0.63
0.42
0.49 0.49
0.59
0.670.70
0.75
0.60
0.74
1 2 3 4 5 6 7 8 9 10 11 12 16 17 18 19 20 21 22
Data Center Number
Co
mp
ute
r P
ow
er:
To
tal
Po
we
r
Figure 6.1: Computer Power Consumption Index (Source: [73])
studied how to reduce energy usage from the perspective of reducing cost, but not howto improve the profit while reducing the carbon emissions which are also significantlyimpacting the resource providers [62]. For example, to address energy usage, Chase etal. [32] adopted an economic approach to manage shared server resources in which ser-vices “bid” for resources as a function of delivered performance. Similarly, Burge etal. [19] scheduled tasks to heterogeneous machines, and made admission decisions basedon the energy costs of each machine to maximise the profit of a single data center. But,both of them do not study the critical relationship between carbon emissions (environmen-tal sustainability) and profit (economic sustainability) for the energy sustainability issue,and how they can affect each other.
Other previous works have focused on achieving energy efficiency at a single datacenter/supercomputing location, but not across multiple locations. However, resourceproviders such as Amazon EC2 [6] typically have multiple data centers distributed world-wide. As shown in Figure 6.1, the energy efficiency of an individual data center in differ-ent locations changes dynamically at various times depending on a number of factors suchas energy cost, carbon emission rate, workload, CPU power efficiency, cooling system,and environmental temperature. Thus, these different contributing factors can be consid-ered to exploit the heterogeneity across multiple data centers for improving the overallenergy efficiency of the resource provider.
Moreover, several works have mainly proposed energy-saving policies that are appli-cation specific [63][67], processor-specific [137][50], and/or server-specific [167][97].But, these policies are only applicable or most effective for the specific models thatthey are specially designed for. Hence, we require some simple, yet effective genericenergy-efficient scheduling policies, that can be extended to any application, processor,and server models, so that they can be readily deployed in existing data centers with mini-mum changes at the infrastructure level. Table 6.1 summarises the most relevant previous
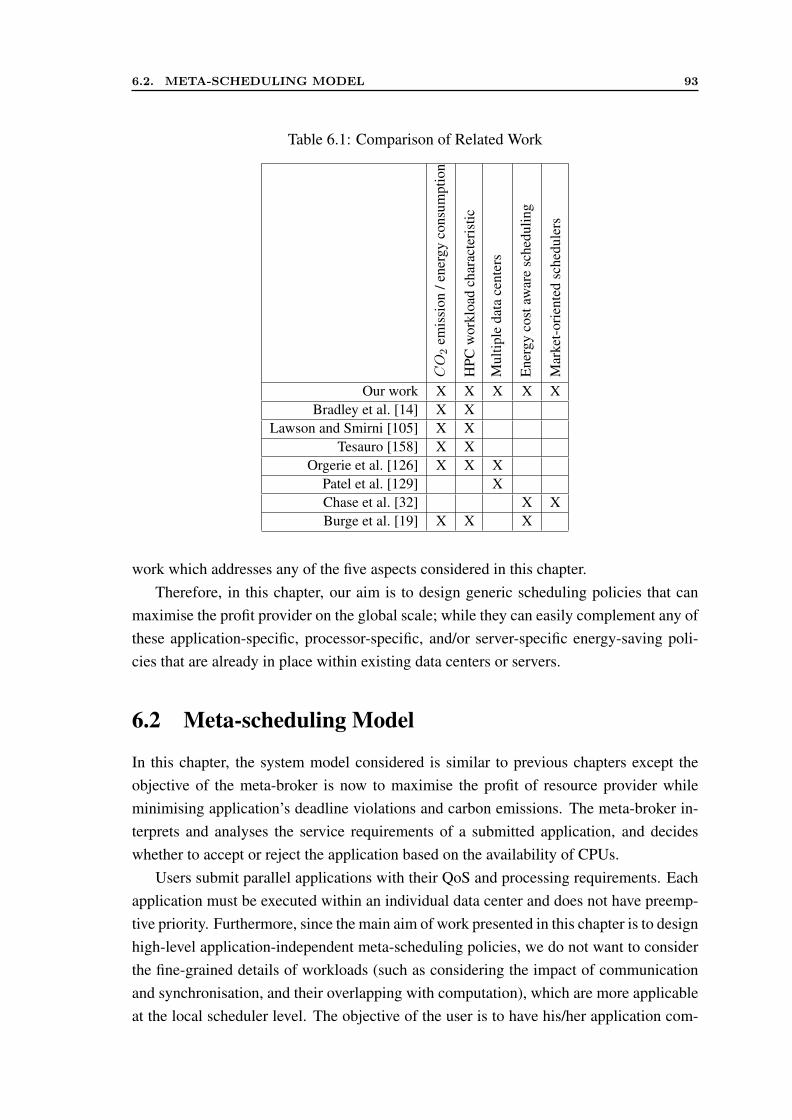
6.2. META-SCHEDULING MODEL 93
Table 6.1: Comparison of Related Work
CO
2em
issi
on/e
nerg
yco
nsum
ptio
n
HPC
wor
kloa
dch
arac
teri
stic
Mul
tiple
data
cent
ers
Ene
rgy
cost
awar
esc
hedu
ling
Mar
ket-
orie
nted
sche
dule
rs
Our work X X X X XBradley et al. [14] X X
Lawson and Smirni [105] X XTesauro [158] X X
Orgerie et al. [126] X X XPatel et al. [129] XChase et al. [32] X XBurge et al. [19] X X X
work which addresses any of the five aspects considered in this chapter.Therefore, in this chapter, our aim is to design generic scheduling policies that can
maximise the profit provider on the global scale; while they can easily complement any ofthese application-specific, processor-specific, and/or server-specific energy-saving poli-cies that are already in place within existing data centers or servers.
6.2 Meta-scheduling Model
In this chapter, the system model considered is similar to previous chapters except theobjective of the meta-broker is now to maximise the profit of resource provider whileminimising application’s deadline violations and carbon emissions. The meta-broker in-terprets and analyses the service requirements of a submitted application, and decideswhether to accept or reject the application based on the availability of CPUs.
Users submit parallel applications with their QoS and processing requirements. Eachapplication must be executed within an individual data center and does not have preemp-tive priority. Furthermore, since the main aim of work presented in this chapter is to designhigh-level application-independent meta-scheduling policies, we do not want to considerthe fine-grained details of workloads (such as considering the impact of communicationand synchronisation, and their overlapping with computation), which are more applicableat the local scheduler level. The objective of the user is to have his/her application com-
94 Chapter 6. META-SCHEDULING TO MAXIMISE PROVIDER’S UTILITY
pleted by the specified deadline. Deadlines are hard, i.e. the user will benefit from theresources only if the application completes before its deadline [131].
A resource provider has multiple resource sites distributed across the world. Eachresource site is modelled as a data center. For example, Amazon [6] has data centers inmany cities across Asia, Europe, and United States. Each data center has a local schedulerthat manages the execution of incoming applications. The meta-broker interacts with theselocal schedulers for application execution. Each local scheduler periodically advertiseinformation about available time slots (ts, te, n) to the meta-broker, where ts and te arethe start time and end time of the slot respectively and n is the number of CPUs availablefor the slot.
To facilitate energy-efficient computing, each local scheduler also supplies informa-tion about the carbon emission rate, Coefficient of Performance (COP), electricity price,CPU power-frequency relationship, Million Instructions Per Second (MIPS) rating ofCPUs at the maximum frequency, and CPU operating frequency range of the data cen-ter. The MIPS rating is used to indicate the overall performance of a CPU. All CPUswithin a data center are homogeneous, but CPUs can be heterogeneous across data cen-ters. The carbon emission rates are calculated based on the fuel type used in electricpower generation. These are published regularly by various government agencies suchas U.S. Energy Information Administration (EIA). COP of the data center’s cooling sys-tem is defined as the amount of cooling delivered per unit of electrical power consumed.COP can be measured by monitoring the energy consumption by various components ofthe cooling system [128]. Various parameters of CPUs at the data center can be derivedexperimentally [70].
6.2.1 Data Center Energy Model
The major contributors for the total energy usage in a data center are IT equipments (whichconsists of servers, storage devices, and network equipment) and cooling systems [159].Other systems such as lighting are not considered due to their negligible contribution tothe total energy usage.
Within a data center, the total energy usage of a server depends on its CPUs, memory,disks, fans, and other components [56]. It is pointed out by Fan et al [56], the energy usageof the server varies depending on the type of workload executed. Since we only considercompute-intensive applications and the CPUs use the largest proportion of energy in aserver, it is sufficient in our case to only model CPU energy usage. Thus, for simplicity,we only compute the energy usage of a server based on its CPUs.
The power consumption of a CPU can be reduced by lowering its supply voltage us-ing Dynamic Voltage Scaling (DVS). DVS is an efficient way to manage dynamic powerdissipation during computation. The power consumption model of CPUs which are gen-
6.2. META-SCHEDULING MODEL 95
erally composed of CMOS circuits is given by: P = αV 2f + IleakV + Pshort, where Pis the power dissipation, V is the supply voltage, f is the clock frequency, Ileak is theleakage current, and Pshort is the short circuit power dissipated during the voltage switch-ing process [18][130]. The first term constitutes the dynamic power of the CPU and thesecond term constitutes the static power. Pshort is generally negligible in comparison toother terms.
Since the voltage can be expressed as a linear function of frequency in the CMOSlogic, the power consumption Pi of a CPU in a data center i is approximated by thefollowing function (similar to previous works [167][33]): Pi = βi + αif
3, where βiis the static power consumed by the CPU, αi is the proportionality constant, and f isthe frequency at which the CPU is operating. We use this cubic relationship betweenthe operating frequency and power consumption since this work focuses on compute-intensive workload and to the best of our knowledge, the cubic relationship is the mostcommonly used metric for CPU power in previous works [167][33]. We also consider thata CPU of data center i can adjust its frequency from a minimum of fmini to a maximumof fmaxi discretely. The frequency levels supported by a CPU typically varies for differentCPU architecture. For instance, Intel Pentium M 1.6GHz CPU supports 6 voltages from0.956V to 1.484V.
The energy cost of the cooling system depends on its COP [114] [157]. COP is anindication for the efficiency of the cooling system, which is defined as the ratio of theamount of energy consumed by CPUs to the energy consumed by the cooling system.However, COP is not constant and varies with the cooling air temperature. We assumethat COP will remain constant during a scheduling cycle and data centers will update themeta-broker whenever COP changes. Thus, the total energy consumed by the coolingsystem in a data center i is given by:
Ehi =
Eci
COPi(6.1)
where Eci is the total energy consumed by CPUs and Eh
i is the total energy consumed bycooling devices. The total energy consumed by data center i can then be approximatedby:
Etotali = Ec
i + Ehi = (1 + 1
COPi)Ec
i = (COPi+1COPi
)Eci
Therefore, the data center efficiency (DCiE) [164] is given as:
DCiE = COPCOP+1
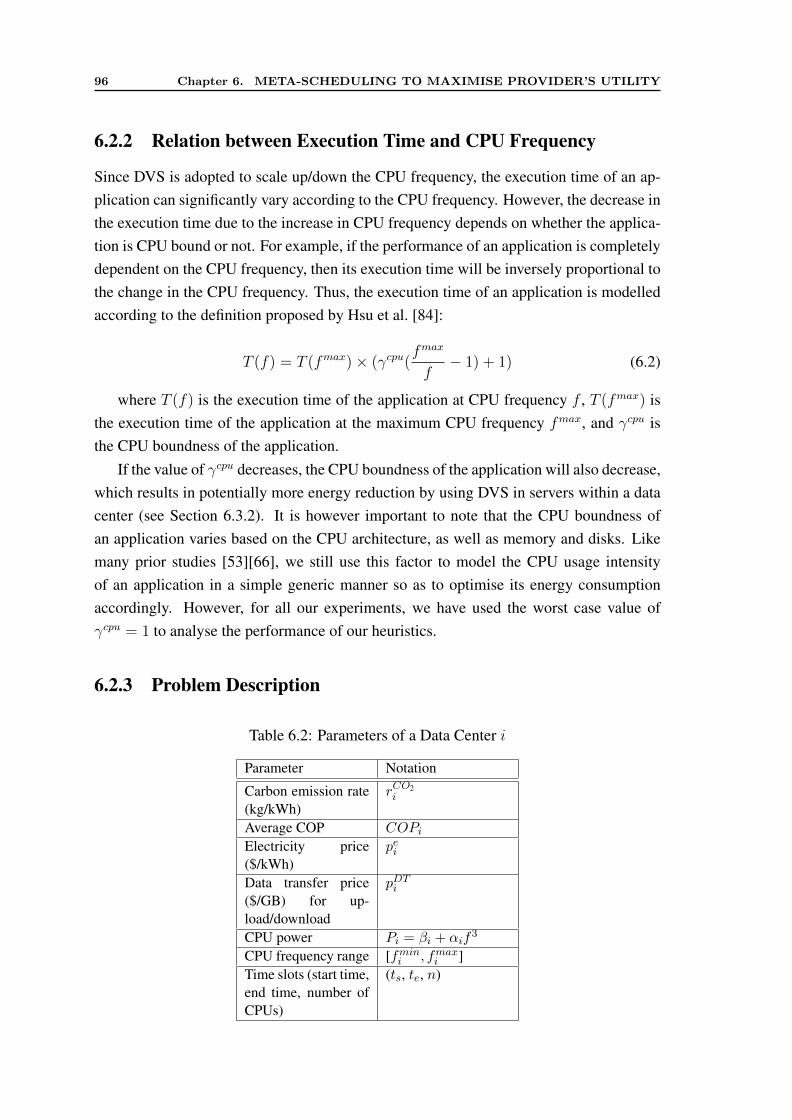
96 Chapter 6. META-SCHEDULING TO MAXIMISE PROVIDER’S UTILITY
6.2.2 Relation between Execution Time and CPU Frequency
Since DVS is adopted to scale up/down the CPU frequency, the execution time of an ap-plication can significantly vary according to the CPU frequency. However, the decrease inthe execution time due to the increase in CPU frequency depends on whether the applica-tion is CPU bound or not. For example, if the performance of an application is completelydependent on the CPU frequency, then its execution time will be inversely proportional tothe change in the CPU frequency. Thus, the execution time of an application is modelledaccording to the definition proposed by Hsu et al. [84]:
T (f) = T (fmax)× (γcpu(fmax
f− 1) + 1) (6.2)
where T (f) is the execution time of the application at CPU frequency f , T (fmax) isthe execution time of the application at the maximum CPU frequency fmax, and γcpu isthe CPU boundness of the application.
If the value of γcpu decreases, the CPU boundness of the application will also decrease,which results in potentially more energy reduction by using DVS in servers within a datacenter (see Section 6.3.2). It is however important to note that the CPU boundness ofan application varies based on the CPU architecture, as well as memory and disks. Likemany prior studies [53][66], we still use this factor to model the CPU usage intensityof an application in a simple generic manner so as to optimise its energy consumptionaccordingly. However, for all our experiments, we have used the worst case value ofγcpu = 1 to analyse the performance of our heuristics.
6.2.3 Problem Description
Table 6.2: Parameters of a Data Center i
Parameter Notation
Carbon emission rate(kg/kWh)
rCO2i
Average COP COPiElectricity price($/kWh)
pei
Data transfer price($/GB) for up-load/download
pDTi
CPU power Pi = βi + αif3
CPU frequency range [fmini , fmaxi ]Time slots (start time,end time, number ofCPUs)
(ts, te, n)
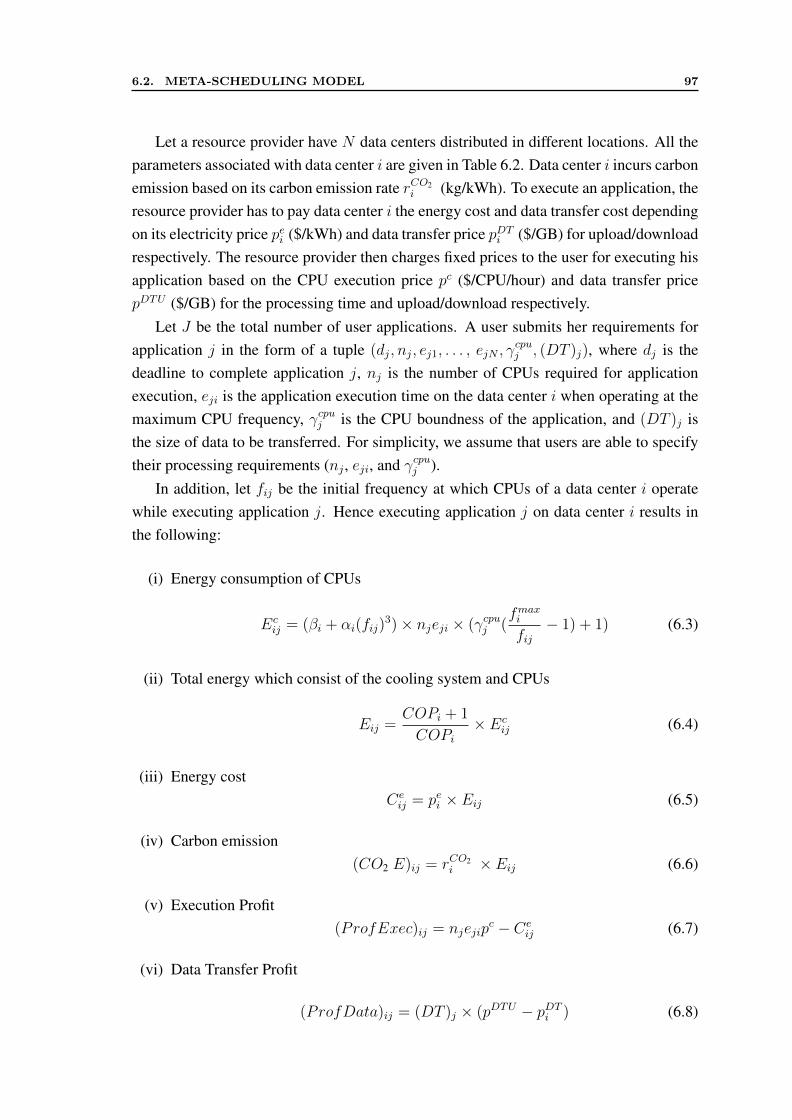
6.2. META-SCHEDULING MODEL 97
Let a resource provider have N data centers distributed in different locations. All theparameters associated with data center i are given in Table 6.2. Data center i incurs carbonemission based on its carbon emission rate rCO2
i (kg/kWh). To execute an application, theresource provider has to pay data center i the energy cost and data transfer cost dependingon its electricity price pei ($/kWh) and data transfer price pDTi ($/GB) for upload/downloadrespectively. The resource provider then charges fixed prices to the user for executing hisapplication based on the CPU execution price pc ($/CPU/hour) and data transfer pricepDTU ($/GB) for the processing time and upload/download respectively.
Let J be the total number of user applications. A user submits her requirements forapplication j in the form of a tuple (dj, nj, ej1, . . . , ejN , γ
cpuj , (DT )j), where dj is the
deadline to complete application j, nj is the number of CPUs required for applicationexecution, eji is the application execution time on the data center i when operating at themaximum CPU frequency, γcpuj is the CPU boundness of the application, and (DT )j isthe size of data to be transferred. For simplicity, we assume that users are able to specifytheir processing requirements (nj , eji, and γcpuj ).
In addition, let fij be the initial frequency at which CPUs of a data center i operatewhile executing application j. Hence executing application j on data center i results inthe following:
(i) Energy consumption of CPUs
Ecij = (βi + αi(fij)
3)× njeji × (γcpuj (fmaxi
fij− 1) + 1) (6.3)
(ii) Total energy which consist of the cooling system and CPUs
Eij =COPi + 1
COPi× Ec
ij (6.4)
(iii) Energy costCeij = pei × Eij (6.5)
(iv) Carbon emission(CO2 E)ij = rCO2
i × Eij (6.6)
(v) Execution Profit(ProfExec)ij = njejip
c − Ceij (6.7)
(vi) Data Transfer Profit
(ProfData)ij = (DT )j × (pDTU − pDTi ) (6.8)
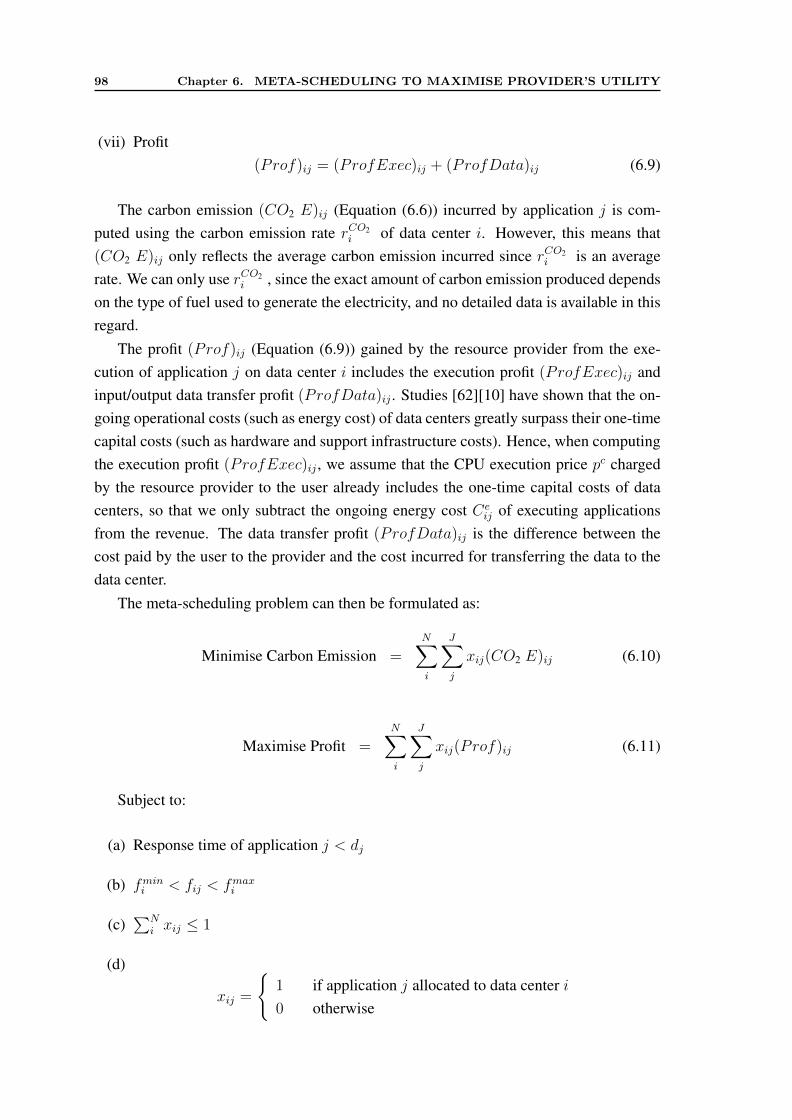
98 Chapter 6. META-SCHEDULING TO MAXIMISE PROVIDER’S UTILITY
(vii) Profit(Prof)ij = (ProfExec)ij + (ProfData)ij (6.9)
The carbon emission (CO2 E)ij (Equation (6.6)) incurred by application j is com-puted using the carbon emission rate rCO2
i of data center i. However, this means that(CO2 E)ij only reflects the average carbon emission incurred since rCO2
i is an averagerate. We can only use rCO2
i , since the exact amount of carbon emission produced dependson the type of fuel used to generate the electricity, and no detailed data is available in thisregard.
The profit (Prof)ij (Equation (6.9)) gained by the resource provider from the exe-cution of application j on data center i includes the execution profit (ProfExec)ij andinput/output data transfer profit (ProfData)ij . Studies [62][10] have shown that the on-going operational costs (such as energy cost) of data centers greatly surpass their one-timecapital costs (such as hardware and support infrastructure costs). Hence, when computingthe execution profit (ProfExec)ij , we assume that the CPU execution price pc chargedby the resource provider to the user already includes the one-time capital costs of datacenters, so that we only subtract the ongoing energy cost Ce
ij of executing applicationsfrom the revenue. The data transfer profit (ProfData)ij is the difference between thecost paid by the user to the provider and the cost incurred for transferring the data to thedata center.
The meta-scheduling problem can then be formulated as:
Minimise Carbon Emission =N∑i
J∑j
xij(CO2 E)ij (6.10)
Maximise Profit =N∑i
J∑j
xij(Prof)ij (6.11)
Subject to:
(a) Response time of application j < dj
(b) fmini < fij < fmaxi
(c)∑N
i xij ≤ 1
(d)
xij =
{1 if application j allocated to data center i0 otherwise
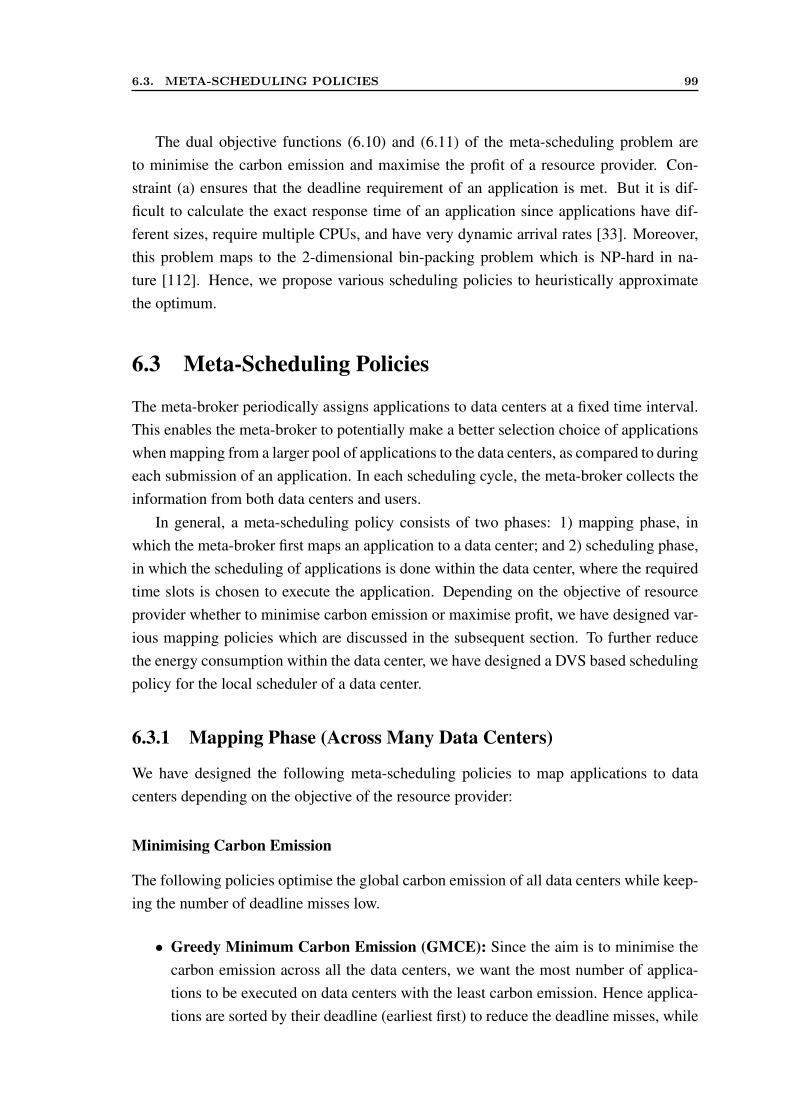
6.3. META-SCHEDULING POLICIES 99
The dual objective functions (6.10) and (6.11) of the meta-scheduling problem areto minimise the carbon emission and maximise the profit of a resource provider. Con-straint (a) ensures that the deadline requirement of an application is met. But it is dif-ficult to calculate the exact response time of an application since applications have dif-ferent sizes, require multiple CPUs, and have very dynamic arrival rates [33]. Moreover,this problem maps to the 2-dimensional bin-packing problem which is NP-hard in na-ture [112]. Hence, we propose various scheduling policies to heuristically approximatethe optimum.
6.3 Meta-Scheduling Policies
The meta-broker periodically assigns applications to data centers at a fixed time interval.This enables the meta-broker to potentially make a better selection choice of applicationswhen mapping from a larger pool of applications to the data centers, as compared to duringeach submission of an application. In each scheduling cycle, the meta-broker collects theinformation from both data centers and users.
In general, a meta-scheduling policy consists of two phases: 1) mapping phase, inwhich the meta-broker first maps an application to a data center; and 2) scheduling phase,in which the scheduling of applications is done within the data center, where the requiredtime slots is chosen to execute the application. Depending on the objective of resourceprovider whether to minimise carbon emission or maximise profit, we have designed var-ious mapping policies which are discussed in the subsequent section. To further reducethe energy consumption within the data center, we have designed a DVS based schedulingpolicy for the local scheduler of a data center.
6.3.1 Mapping Phase (Across Many Data Centers)
We have designed the following meta-scheduling policies to map applications to datacenters depending on the objective of the resource provider:
Minimising Carbon Emission
The following policies optimise the global carbon emission of all data centers while keep-ing the number of deadline misses low.
• Greedy Minimum Carbon Emission (GMCE): Since the aim is to minimise thecarbon emission across all the data centers, we want the most number of applica-tions to be executed on data centers with the least carbon emission. Hence applica-tions are sorted by their deadline (earliest first) to reduce the deadline misses, while
100 Chapter 6. META-SCHEDULING TO MAXIMISE PROVIDER’S UTILITY
data centers are sorted by their carbon emission (lowest first), which is computedas: rCO2
i × COPi+1COPi
× (βi + αi(fmaxi )3). Each application is then mapped to a data
center in this ordering.
• Minimum Carbon Emission - Minimum Carbon Emission (MCE-MCE): MCE-MCE is based on the Min-Min heuristic [110] which has performed very well in pre-vious studies of different environments [15]. The meta-broker first finds the “best”data center for all applications that are considered. Then among these application-data center pairs, the meta-broker selects the “best” pair to map first. Since theaim is to minimise the carbon emission, the “best” pair has the minimum carbonemission (CO2 E)ij , i.e. minimum fitness value of executing application j on datacenter i. MCE-MCE has the following steps:
Step 1: For each application in the list of applications to be mapped, find the datacenter of which the carbon emission is the minimum, i.e. minimum (CO2 E)ij
(the first MCE), among all data centers which can complete the application byits deadline. If there is no data center where the application can be completedby its deadline, the application is removed from the list of applications to bemapped.
Step 2: Among all the application-data center pairs found in Step 1, find the pairthat results in the minimum carbon emission, i.e. minimum (CO2 E)ij (thesecond MCE). Then, map the application to the data center, and remove itfrom the list of applications to be mapped.
Step 3: Update the available time slots from data centers.
Step 4: Do Step 1 to 3 again until all applications are mapped.
Maximising Profit
The following policies optimise the global profit of all data centers while keeping thenumber of deadline misses low.
• Greedy Maximum Profit (GMP): Since the aim is to maximise the profit acrossall the data centers, we want the most number of applications to be executed on datacenters with the least energy cost. Hence applications are sorted by their deadline(earliest first) to reduce the deadline misses, while data centers are sorted by theirenergy cost (lowest first), which is computed as: pei × COPi+1
COPi× (βi + αi(f
maxi )3).
Each application is then mapped to a data center in this ordering.
• Maximum Profit - Maximum Profit(MP-MP): MP-MP works in the same way asMCE-MCE. However, since the aim is to maximise the profit, the “best” pair has
6.3. META-SCHEDULING POLICIES 101
the maximum profit (Prof)ij , i.e. maximum fitness value of executing applicationj on data center i. Hence the steps of MP-MP are the same as MCE-MCE, exceptthe following differences:
Step 1: For each application in the list of applications to be mapped, find the datacenter of which the profit is the maximum, i.e. maximum (Prof)ij (the firstMP), among all data centers which can complete the application by its dead-line.
Step 2: Among all the application-data center pairs found in Step 1, find the pairthat results in the maximum profit, i.e. maximum (Prof)ij (the second MP).
Minimising Carbon Emission and Maximising Profit (MCE-MP)
MCE-MP works in the same way as MCE-MCE. But, since the aim is to minimise the totalcarbon emission while maximising the total profit across all the data centers, MCE-MPhandles the trade-off between carbon emission and profit which may be conflicting. Hencethe steps of MCE-MP are the same as MCE-MCE, except the following differences:
Step 1: For each application in the list of applications to be mapped, find the data centerof which the carbon emission is the minimum, i.e. minimum (CO2 E)ij (the firstMCE), among all data centers which can complete the application by its deadline.
Step 2: Among all the application-data center pairs found in Step 1, find the pair thatresults in the maximum profit, i.e. maximum (Prof)ij (the second MP).
6.3.2 Scheduling Phase (Within a Data Center)
The energy consumption and carbon emission are further reduced within a data center byusing DVS at the CPU level to save energy by scaling down the CPU frequency. Thus,before the meta-broker assigns an application to a data center, it decides the time slot inwhich the application should be executed and the frequency at which the CPU shouldoperate to save energy. But, since a lower CPU frequency can increase the number ofapplications rejected due to the deadline misses, the scheduling of applications within thedata center can be of two types: 1) CPUs run at the maximum frequency (i.e. withoutDVS) or 2) CPUs run at various frequencies using DVS (i.e. with DVS). It is importantto adjust DVS appropriately in order to reduce the number of deadline misses and energyconsumption simultaneously.
The meta-broker will first try to operate the CPU at a frequency in the range [fmini , fmaxi ]
nearest to the optimal CPU frequency f opti = 3
√βi2αi
for γcpu = 1. Since the CPU fre-
quency of data center i can only operate in the interval [fmini , fmaxi ], we define f opti = fmini
if f opti < fmini , and f opti = fmaxi if f opti > fmaxi .
102 Chapter 6. META-SCHEDULING TO MAXIMISE PROVIDER’S UTILITY
If the deadline of an application will be violated, the meta-broker will scale up theCPU frequency to the next level and then try again to find the free time slots to executethe application. If the meta-broker fails to schedule the application on the data center asno free time slot is available, then the application is forwarded to the next data centerfor scheduling (the ordering of data centers depends on various policies as described inSection 6.3.1).
6.3.3 Lower Bound and Upper Bound
Due to the NP hardness of the meta-scheduling problem described in Section 6.2.3, it isdifficult to find the optimal profit and carbon emission in polynomial time. Thus, to esti-mate the performance of our scheduling algorithms, we present a lower bound for the car-bon emission and an upper bound for the profit of the resource provider respectively. Bothbounds are derived based on the principle that we can get the minimum carbon emissionor the maximum profit when most of the applications are executed on the most “efficient”data center and also at the optimal CPU frequency. For carbon emission minimisation,the most “efficient” data center incurs the minimum carbon emission for executing ap-plications, while for profit maximisation, the most “efficient” data center results in theminimum energy cost.
For the sole purpose of deriving the lower and upper bounds, we relax three constraintsof our system model so as to map the maximal number of applications to the most “effi-cient” data center. First, we relax the constraint that when an application is executed at themaximum CPU frequency, it will result in the maximum energy consumption. Instead, weassume that even though all applications are executed at the maximum CPU frequency,the actual energy consumed by them for calculating their carbon emission still remainsat the optimal CPU frequency using DVS. Second, although the applications consideredin the system model are parallel applications with fixed CPU requirements, we relax thisconstraint to applications that are moldable in the required number of CPUs. Thus, theruntime of applications will decrease linearly when it is scheduled on a larger number ofCPUs. This in turn increases the number of applications that can be allocated to the most“efficient” data center with the minimum energy possible. Third, the applications in thesystem model are arriving dynamically in many different scheduling cycles, but for deriv-ing the bounds, all applications are considered in only one scheduling cycle and mappedto data centers. This forms the best ideal bound scenario, where all the incoming appli-cations are known in advance. Hence the actual dynamic scenario definitely has worseperformance than that of the ideal bound scenario.
It is important to note that the bounds of carbon emission and profit obtained with thesethree assumptions are unreachable loose bounds of the system model. This is because datacenters will be executing the maximum possible workload with 100% utilisation of their
6.3. META-SCHEDULING POLICIES 103
CPUs, while the least possible energy consumption is still considered for the purpose ofcomparison.
Let TWL be the total workload scheduled, TCE be the total carbon emission, andTP be the total profit. The lower bound for the carbon emission is derived through thefollowing steps:
Step 1: Applications are sorted by their deadline (earliest first) to reduce the deadlinemisses, while data centers are sorted by their carbon emission (lowest first), whichis computed as: rCO2
i × COPi+1COPi
×(βi+αi(fmaxi )3). Each application is then mapped
to a data center in this ordering.
Step 2: For each application j, search for a data center i, starting from the most “efficient”one, where the application j can be scheduled without missing its deadline whenrunning at the maximum CPU frequency.
Step 3: If a data center i is not found, then application j will be removed from the list ofpotential applications. Go to step 2 to schedule other applications.
Step 4: If a data center i is found, application j is assigned to it and molded such thatthere is no fragmentation in the schedule of data center i for executing applications.
Step 5: TWL += nj × eji
Step 6: TCE += rCO2i × COPi+1
COPi× (Power consumption of the CPU at optimal CPU
frequency) ×nj× (Execution time of application j at optimal CPU frequency)
Step 7: TP += (1 − (pei × COPi+1COPi
× (Power consumption of the CPU at optimal CPUfrequency))) ×nj× (Execution time of application j at optimal CPU frequency)
Step 8: Repeat from Step 2 until all applications are scheduled.
TCETWL
will be the lower bound of the average carbon emission due to the execution ofall applications across multiple data centers of the resource provider.
To derive the upper bound for the profit, the steps remain the same, except the follow-ing differences:
• In Step 1, data centers are sorted by their energy cost (lowest first), which is com-puted as: pei × COPi+1
COPi× (βi + αi(f
maxi )3).
• TPTWL
will be the upper bound of the average profit.
104 Chapter 6. META-SCHEDULING TO MAXIMISE PROVIDER’S UTILITY
6.4 Performance Evaluation
Configuration of Applications: We use workload traces from Feitelson’s Parallel Work-load Archive (PWA) [57] to model the workload. Since this chapter focuses on studyingthe requirements of users with compute-intensive applications, the PWA meets our objec-tive by providing workload traces that reflect the characteristics of real parallel applica-tions. Our experiments utilise the first week of the LLNL Thunder trace (January 2007 toJune 2007). The LLNL Thunder trace from the Lawrence Livermore National Laboratory(LLNL) in USA is chosen due to its highest resource utilisation of 87.6% among availabletraces to ideally model a heavy workload scenario. From this trace, we obtain the submittime, requested number of CPUs, and actual runtime of applications. We set the CPUboundness of all workload as 1 (i.e. γcpu = 1) to examine the worst case scenario of CPUenergy usage. We use a methodology proposed by Irwin et al. [88] to synthetically assigndeadlines through two classes namely Low Urgency (LU) and High Urgency (HU).
An application j in the LU class has a high ratio of deadlinej/runtimej so that itsdeadline is definitely longer than its required runtime. Conversely, an application j in theHU class has a deadline of low ratio. Values are normally distributed within each of thehigh and low deadline parameters. The ratio of the deadline parameter’s high-value meanand low-value mean is thus known as the high:low ratio. In our experiments, the deadlinehigh:low ratio is 3, while the low-value deadline mean and variance is 4 and 2 respectively.In other words, LU applications have a high-value deadline mean of 12, which is 3 timeslonger than HU applications with a low-value deadline mean of 4. The arrival sequenceof applications from the HU and LU classes is randomly distributed.
Configuration of Data Centers: We model 8 data centers with different configura-tions as listed in Table 6.3. Carbon emission rates and electricity prices at various datacenter locations are averages over the entire region and derived from the data publishedby US Department of Energy [161] and Energy Information Administration [160].
Wang and Lu [167] also focus on the similar problem of considering the energy con-sumption of heterogeneous CPUs within a data center. Thus, power parameters (i.e. CPUpower factors and frequency level) of the CPUs at different data centers are derived basedon the experimental data from Wang and Lu’s work [167]. The values of α and β are setsuch that the ratio of static power and dynamic power can cover a wide variety of CPUs.
Current commercial CPUs only support discrete frequency levels, such as the IntelPentium M 1.6GHz CPU which supports 6 voltage levels. We consider discrete CPUfrequencies with 5 levels in the range [fmini , fmaxi ]. For the lowest frequency fmini , we usethe same value used by Wang and Lu [167], i.e. fmini is 37.5% of fmaxi .
To increase the utilisation of data centers and reduce the fragmentation in the schedul-ing of parallel applications, the local scheduler at each data center uses ConservativeBackfilling with advance reservation support as proposed by Mu’alem and Feitelson [115].
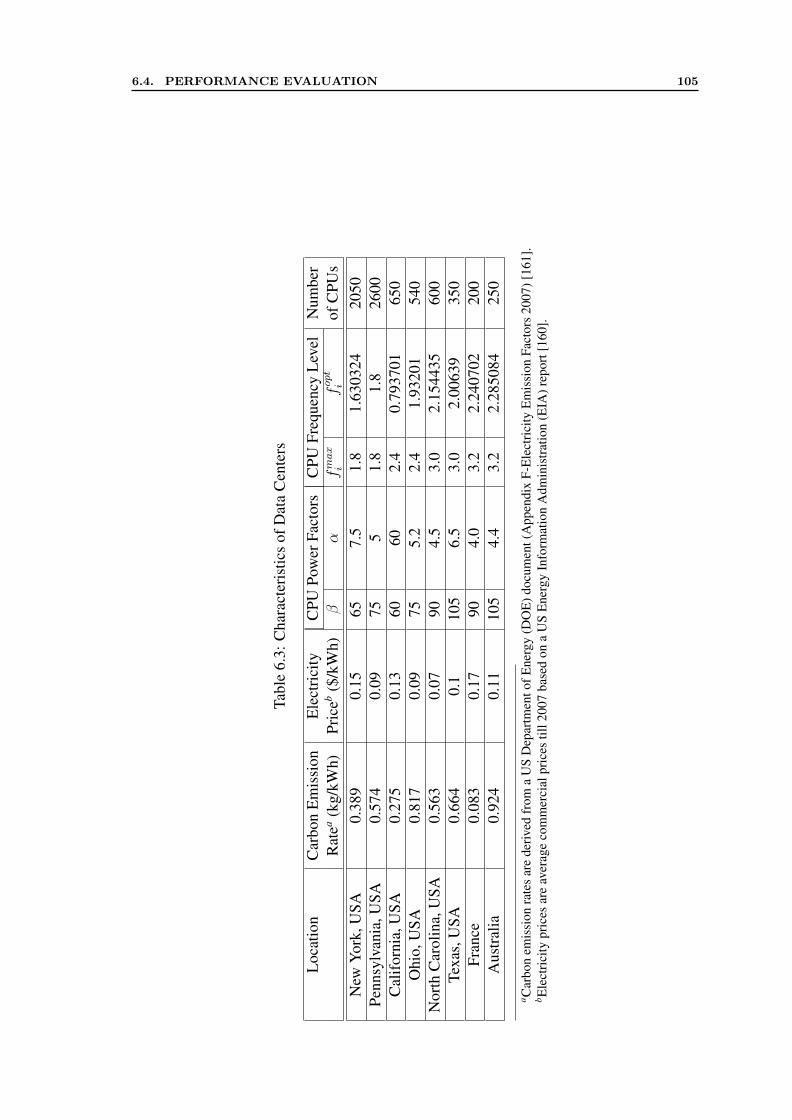
6.4. PERFORMANCE EVALUATION 105
Tabl
e6.
3:C
hara
cter
istic
sof
Dat
aC
ente
rs
Loc
atio
nC
arbo
nE
mis
sion
Ele
ctri
city
CPU
Pow
erFa
ctor
sC
PUFr
eque
ncy
Lev
elN
umbe
rR
atea
(kg/
kWh)
Pric
eb($
/kW
h)β
αfmax
ifopt
iof
CPU
sN
ewY
ork,
USA
0.38
90.
1565
7.5
1.8
1.63
0324
2050
Penn
sylv
ania
,USA
0.57
40.
0975
51.
81.
826
00C
alif
orni
a,U
SA0.
275
0.13
6060
2.4
0.79
3701
650
Ohi
o,U
SA0.
817
0.09
755.
22.
41.
9320
154
0N
orth
Car
olin
a,U
SA0.
563
0.07
904.
53.
02.
1544
3560
0Te
xas,
USA
0.66
40.
110
56.
53.
02.
0063
935
0Fr
ance
0.08
30.
1790
4.0
3.2
2.24
0702
200
Aus
tral
ia0.
924
0.11
105
4.4
3.2
2.28
5084
250
a Car
bon
emis
sion
rate
sar
ede
rived
from
aU
SD
epar
tmen
tofE
nerg
y(D
OE
)doc
umen
t(A
ppen
dix
F-E
lect
rici
tyE
mis
sion
Fact
ors
2007
)[16
1].
b Ele
ctri
city
pric
esar
eav
erag
eco
mm
erci
alpr
ices
till2
007
base
don
aU
SE
nerg
yIn
form
atio
nA
dmin
istr
atio
n(E
IA)r
epor
t[16
0].
106 Chapter 6. META-SCHEDULING TO MAXIMISE PROVIDER’S UTILITY
The meta-broker schedules applications periodically at each scheduling cycle of 50 sec-onds, which is to ensure that the meta-broker can receive at least one application in everyscheduling cycle.
The COP (power usage efficiency) value of data centers is randomly generated using auniform distribution between [0.6, 3.5] as indicated in the study conducted by Greenberget al. [73]. To avoid the energy cost of a data center exceeding the revenue generated bythe resource provider, the CPU execution price charged by the provider to the user is fixedat $0.40/CPU/hour which is approximately twice of the maximum energy cost at a datacenter.
Performance Metrics: We observe the performance from both user and providerperspectives. From the provider perspective, four metrics are necessary to compare thepolicies: average energy consumption, average carbon emission, profit gained, and work-load executed. The average energy consumption compares the amount of energy savedby using different scheduling algorithms, whereas the average carbon emission comparesits corresponding environmental impact. Since minimising the carbon emission can affecta resource provider economically by decreasing its profit, we have considered the profitgained as another metric to compare different algorithms. It is important to know theeffect of various meta-scheduling policies on energy consumption, since higher energyconsumption is likely to generate more carbon emission for worse environmental impactand incur more energy cost for operating data centers.
From the user perspective, we observe the performance of varying: 1) urgency classand 2) arrival rate of applications. For the urgency class, we use various percentages (0%,20%, 40%, 60%, 80%, and 100%) of HU applications. For instance, if the percentage ofHU applications is 20%, then the percentage of LU applications is the remaining 80%.For the arrival rate, we use various factors (10 (low), 100 (medium), 1000 (high), and10000 (very high)) of submit time from the trace. For example, a factor of 10 means anapplication with a submit time of 10s from the trace now has a simulated submit time of1s. Hence, a higher factor represents higher workload by shortening the submit time ofapplications.
Experimental Scenarios: To comprehensively evaluate the performance of our algo-rithms, we examine various experimental scenarios that are classified as:
(a) Evaluation without data transfer cost (Section 6.5.1): In the first set of experi-ments (Section 6.5.1), we evaluate the importance of our mapping policies whichconsider global factors such as carbon emission rate, electricity price and data cen-ter efficiency. In these experiments, we also evaluate the effectiveness of exploitinglocal minima in our local DVS policy (Section 6.5.1 and Section 6.5.1). Then, inthe next set of experiments (Section 6.5.1), we compare the performance of ourproposed algorithms with the lower bound (carbon emission) and the upper bound
6.5. ANALYSIS OF RESULTS 107
(profit).
To evaluate the overall best among the proposed algorithms, we conduct more ex-periments by varying different factors which can affect their performance:
• Impact of urgency and arrival rate of applications (Section 6.5.1)
• Impact of carbon emission rate (Section 6.5.1)
• Impact of electricity price (Section 6.5.1)
• Impact of data center efficiency (Section 6.5.1)
(b) Evaluation with data transfer cost (Section 6.5.2): In the last set of experiments(Section 6.5.2), we examine how the data transfer cost affect the performance ofour algorithms.
6.5 Analysis of Results
6.5.1 Evaluation without Data Transfer Cost
Effect of Mapping Policy and DVS
As discussed in Section 6.3, our meta-scheduling policies are designed to save energy attwo phases, first at the mapping phase and then at the scheduling phase. Hence, in thissection, we examine the importance of each phase in saving energy. These experimentsalso answer the question why we require special energy saving schemes at two phases.
First, we examine the importance of considering the global factors at the mappingphase by comparing meta-scheduling policies without the energy saving feature at the lo-cal scheduling phase, i.e. DVS is not available at the local scheduler. Hence, we namethe without-DVS version of the carbon emission based policy (GMCE) and profit basedpolicy (GMP) as GMCE-WithoutDVS and GMP-WithoutDVS respectively. The results inFigure 6.2 shows that the consideration of various global factors not only decrease the car-bon emission, but also decrease the overall energy consumption. For various urgency ofapplications (Figure 6.2(a)), GMCE-WithoutDVS can prevent up to 10% carbon emissionover GMP-WithoutDVS. For various arrival rate of applications (Figure 6.2(b)), GMCE-WithoutDVS can produce up to 23% less carbon emission than GMP-WithoutDVS. Thecorresponding difference in energy cost (Figure 6.2(c) and 6.2(d)) between them is verylittle (about 0–6%). This is because with the decrease in energy consumption due to theexecution of HPC workload, both carbon emission and energy cost will automatically de-crease. This trend still remains by comparing GMCE and GMP, both of which uses DVSat the scheduling phase.
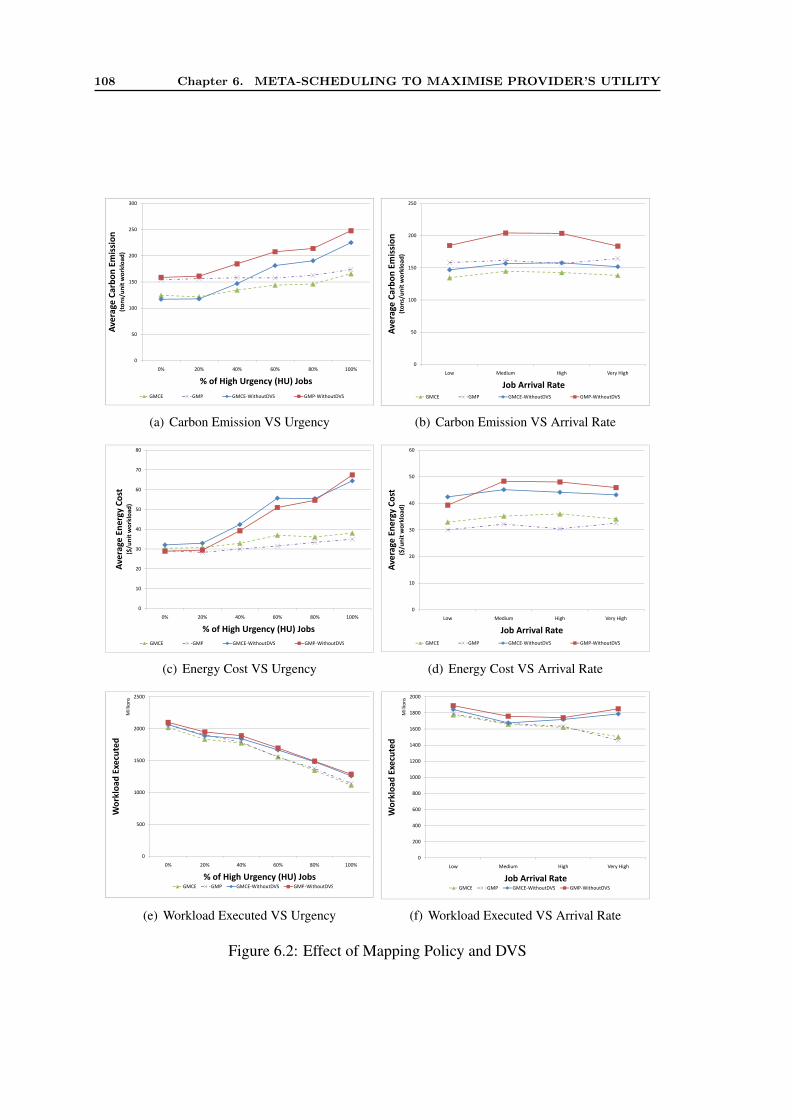
108 Chapter 6. META-SCHEDULING TO MAXIMISE PROVIDER’S UTILITY
150
200
250
300
Av
era
ge
Ca
rbo
n E
mis
sio
n(t
on
s/u
nit
wo
rklo
ad
)
0
50
100
0% 20% 40% 60% 80% 100%
Av
era
ge
Ca
rbo
n E
mis
sio
n(t
on
s/u
nit
wo
rklo
ad
)
% of High Urgency (HU) Jobs
GMCE GMP GMCE-WithoutDVS GMP-WithoutDVSGMCE GMP GMCE-WithoutDVS GMP-WithoutDVS
(a) Carbon Emission VS Urgency
150
200
250
Av
era
ge
Ca
rbo
n E
mis
sio
n(t
on
s/u
nit
wo
rklo
ad
)
0
50
100
Low Medium High Very High
Av
era
ge
Ca
rbo
n E
mis
sio
n(t
on
s/u
nit
wo
rklo
ad
)
Job Arrival RateGMCE GMP GMCE-WithoutDVS GMP-WithoutDVS
(b) Carbon Emission VS Arrival Rate
40
50
60
70
80
Av
era
ge
En
erg
y C
ost
($/u
nit
wo
rklo
ad
)
0
10
20
30
0% 20% 40% 60% 80% 100%
Av
era
ge
En
erg
y C
ost
($/u
nit
wo
rklo
ad
)
% of High Urgency (HU) Jobs
GMCE GMP GMCE-WithoutDVS GMP-WithoutDVSGMCE GMP GMCE-WithoutDVS GMP-WithoutDVS
(c) Energy Cost VS Urgency
30
40
50
60
Av
era
ge
En
erg
y C
ost
($/u
nit
wo
rklo
ad
)
0
10
20
Low Medium High Very High
Av
era
ge
En
erg
y C
ost
($/u
nit
wo
rklo
ad
)
Job Arrival Rate
GMCE GMP GMCE-WithoutDVS GMP-WithoutDVSGMCE GMP GMCE-WithoutDVS GMP-WithoutDVS
(d) Energy Cost VS Arrival Rate
1500
2000
2500
Wo
rklo
ad
Exe
cute
d
Millions
0
500
1000
0% 20% 40% 60% 80% 100%
Wo
rklo
ad
Exe
cute
d
% of High Urgency (HU) JobsGMCE GMP GMCE-WithoutDVS GMP-WithoutDVSGMCE GMP GMCE-WithoutDVS GMP-WithoutDVS
(e) Workload Executed VS Urgency
1000
1200
1400
1600
1800
2000
Wo
rk
loa
d E
xe
cu
ted
Mil
lio
ns
0
200
400
600
800
Low Medium High Very High
Wo
rk
loa
d E
xe
cu
ted
Job Arrival Rate
GMCE GMP GMCE-WithoutDVS GMP-WithoutDVSGMCE GMP GMCE-WithoutDVS GMP-WithoutDVS
(f) Workload Executed VS Arrival Rate
Figure 6.2: Effect of Mapping Policy and DVS
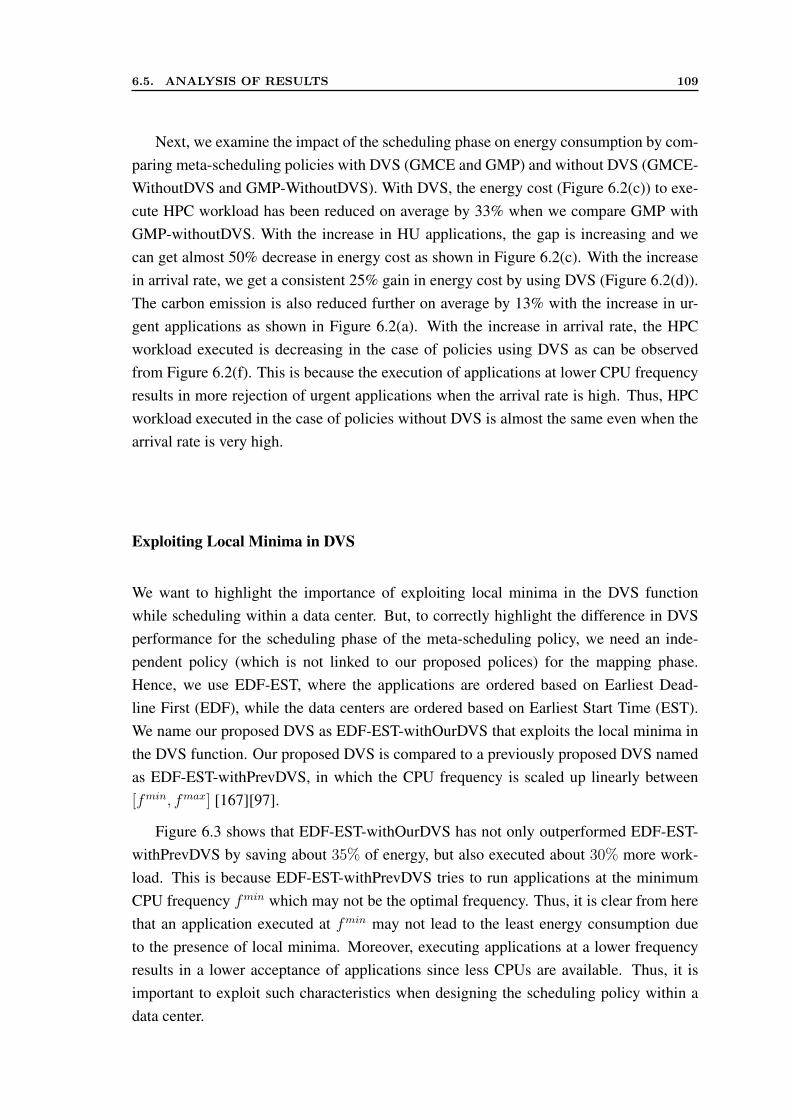
6.5. ANALYSIS OF RESULTS 109
Next, we examine the impact of the scheduling phase on energy consumption by com-paring meta-scheduling policies with DVS (GMCE and GMP) and without DVS (GMCE-WithoutDVS and GMP-WithoutDVS). With DVS, the energy cost (Figure 6.2(c)) to exe-cute HPC workload has been reduced on average by 33% when we compare GMP withGMP-withoutDVS. With the increase in HU applications, the gap is increasing and wecan get almost 50% decrease in energy cost as shown in Figure 6.2(c). With the increasein arrival rate, we get a consistent 25% gain in energy cost by using DVS (Figure 6.2(d)).The carbon emission is also reduced further on average by 13% with the increase in ur-gent applications as shown in Figure 6.2(a). With the increase in arrival rate, the HPCworkload executed is decreasing in the case of policies using DVS as can be observedfrom Figure 6.2(f). This is because the execution of applications at lower CPU frequencyresults in more rejection of urgent applications when the arrival rate is high. Thus, HPCworkload executed in the case of policies without DVS is almost the same even when thearrival rate is very high.
Exploiting Local Minima in DVS
We want to highlight the importance of exploiting local minima in the DVS functionwhile scheduling within a data center. But, to correctly highlight the difference in DVSperformance for the scheduling phase of the meta-scheduling policy, we need an inde-pendent policy (which is not linked to our proposed polices) for the mapping phase.Hence, we use EDF-EST, where the applications are ordered based on Earliest Dead-line First (EDF), while the data centers are ordered based on Earliest Start Time (EST).We name our proposed DVS as EDF-EST-withOurDVS that exploits the local minima inthe DVS function. Our proposed DVS is compared to a previously proposed DVS namedas EDF-EST-withPrevDVS, in which the CPU frequency is scaled up linearly between[fmin, fmax] [167][97].
Figure 6.3 shows that EDF-EST-withOurDVS has not only outperformed EDF-EST-withPrevDVS by saving about 35% of energy, but also executed about 30% more work-load. This is because EDF-EST-withPrevDVS tries to run applications at the minimumCPU frequency fmin which may not be the optimal frequency. Thus, it is clear from herethat an application executed at fmin may not lead to the least energy consumption dueto the presence of local minima. Moreover, executing applications at a lower frequencyresults in a lower acceptance of applications since less CPUs are available. Thus, it isimportant to exploit such characteristics when designing the scheduling policy within adata center.
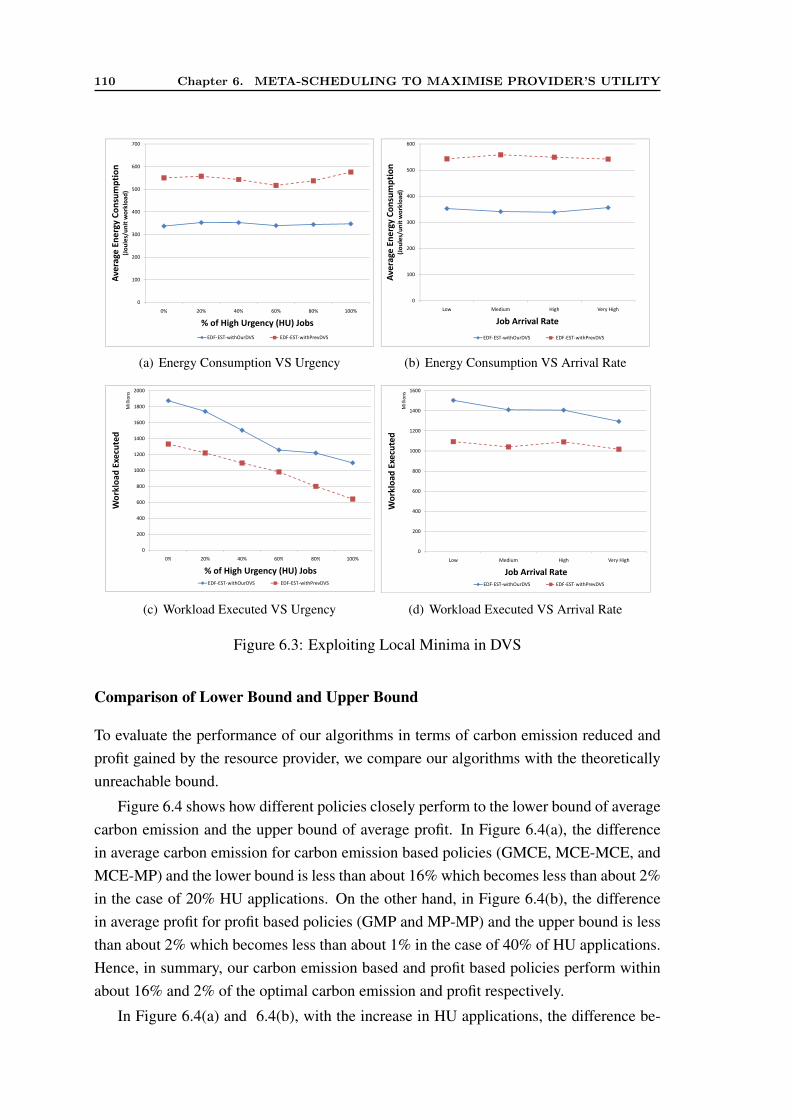
110 Chapter 6. META-SCHEDULING TO MAXIMISE PROVIDER’S UTILITY
700
500
600
Av
era
ge
En
erg
y C
on
sum
pti
on
400
500
Av
era
ge
En
erg
y C
on
sum
pti
on
(Jo
ule
s/u
nit
wo
rklo
ad
)
300
400
Av
era
ge
En
erg
y C
on
sum
pti
on
(Jo
ule
s/u
nit
wo
rklo
ad
)
200
300
Av
era
ge
En
erg
y C
on
sum
pti
on
(Jo
ule
s/u
nit
wo
rklo
ad
)
100Av
era
ge
En
erg
y C
on
sum
pti
on
0
0% 20% 40% 60% 80% 100%0% 20% 40% 60% 80% 100%
% of High Urgency (HU) Jobs
EDF-EST-withOurDVS EDF-EST-withPrevDVS
(a) Energy Consumption VS Urgency
300
400
500
600
Av
era
ge
En
erg
y C
on
sum
pti
on
(Jo
ule
s/u
nit
wo
rklo
ad
)
0
100
200
Low Medium High Very High
Av
era
ge
En
erg
y C
on
sum
pti
on
(Jo
ule
s/u
nit
wo
rklo
ad
)
Job Arrival Rate
EDF-EST-withOurDVS EDF-EST-withPrevDVS
(b) Energy Consumption VS Arrival Rate
1000
1200
1400
1600
1800
2000
Wo
rklo
ad
Exe
cute
d
Millions
0
200
400
600
800
0% 20% 40% 60% 80% 100%
Wo
rklo
ad
Exe
cute
d
% of High Urgency (HU) Jobs
EDF-EST-withOurDVS EDF-EST-withPrevDVSEDF-EST-withOurDVS EDF-EST-withPrevDVS
(c) Workload Executed VS Urgency
800
1000
1200
1400
1600W
ork
loa
d E
xe
cu
ted
Mil
lio
ns
0
200
400
600
Low Medium High Very High
Wo
rk
loa
d E
xe
cu
ted
Job Arrival Rate
EDF-EST-withOurDVS EDF-EST-withPrevDVS
(d) Workload Executed VS Arrival Rate
Figure 6.3: Exploiting Local Minima in DVS
Comparison of Lower Bound and Upper Bound
To evaluate the performance of our algorithms in terms of carbon emission reduced andprofit gained by the resource provider, we compare our algorithms with the theoreticallyunreachable bound.
Figure 6.4 shows how different policies closely perform to the lower bound of averagecarbon emission and the upper bound of average profit. In Figure 6.4(a), the differencein average carbon emission for carbon emission based policies (GMCE, MCE-MCE, andMCE-MP) and the lower bound is less than about 16% which becomes less than about 2%in the case of 20% HU applications. On the other hand, in Figure 6.4(b), the differencein average profit for profit based policies (GMP and MP-MP) and the upper bound is lessthan about 2% which becomes less than about 1% in the case of 40% of HU applications.Hence, in summary, our carbon emission based and profit based policies perform withinabout 16% and 2% of the optimal carbon emission and profit respectively.
In Figure 6.4(a) and 6.4(b), with the increase in HU applications, the difference be-
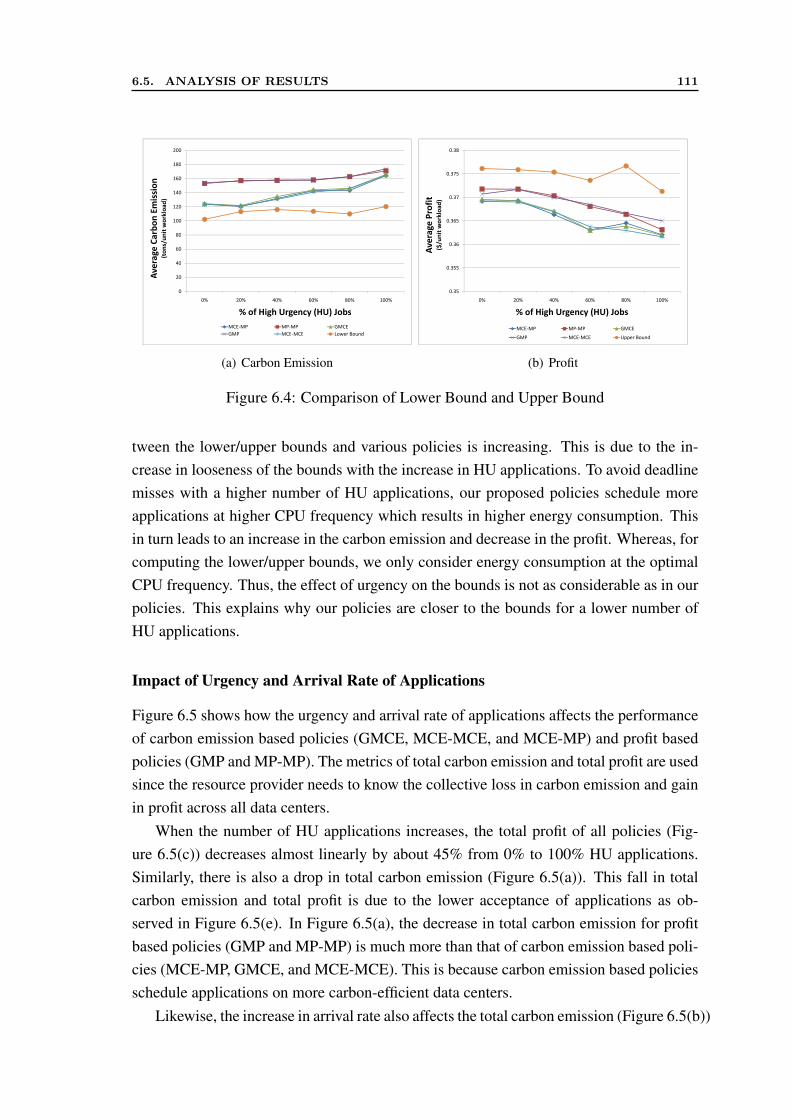
6.5. ANALYSIS OF RESULTS 111
180
200
160
180
Av
era
ge
Ca
rbo
n E
mis
sio
n
120
140
Av
era
ge
Ca
rbo
n E
mis
sio
n(t
on
s/u
nit
wo
rklo
ad
)
80
100
Av
era
ge
Ca
rbo
n E
mis
sio
n(t
on
s/u
nit
wo
rklo
ad
)
40
60
80
Av
era
ge
Ca
rbo
n E
mis
sio
n(t
on
s/u
nit
wo
rklo
ad
)
20
40
Av
era
ge
Ca
rbo
n E
mis
sio
n
0
0% 20% 40% 60% 80% 100%
% of High Urgency (HU) Jobs% of High Urgency (HU) Jobs
MCE-MP MP-MP GMCE
GMP MCE-MCE Lower BoundGMP MCE-MCE Lower Bound
(a) Carbon Emission
0.38
0.375
0.37
Av
era
ge
Pro
fit
($/u
nit
wo
rklo
ad
)
0.365
Av
era
ge
Pro
fit
($/u
nit
wo
rklo
ad
)
0.36
Av
era
ge
Pro
fit
($/u
nit
wo
rklo
ad
)
0.355
0.35
0% 20% 40% 60% 80% 100%
% of High Urgency (HU) Jobs% of High Urgency (HU) Jobs
MCE-MP MP-MP GMCE
GMP MCE-MCE Upper Bound
(b) Profit
Figure 6.4: Comparison of Lower Bound and Upper Bound
tween the lower/upper bounds and various policies is increasing. This is due to the in-crease in looseness of the bounds with the increase in HU applications. To avoid deadlinemisses with a higher number of HU applications, our proposed policies schedule moreapplications at higher CPU frequency which results in higher energy consumption. Thisin turn leads to an increase in the carbon emission and decrease in the profit. Whereas, forcomputing the lower/upper bounds, we only consider energy consumption at the optimalCPU frequency. Thus, the effect of urgency on the bounds is not as considerable as in ourpolicies. This explains why our policies are closer to the bounds for a lower number ofHU applications.
Impact of Urgency and Arrival Rate of Applications
Figure 6.5 shows how the urgency and arrival rate of applications affects the performanceof carbon emission based policies (GMCE, MCE-MCE, and MCE-MP) and profit basedpolicies (GMP and MP-MP). The metrics of total carbon emission and total profit are usedsince the resource provider needs to know the collective loss in carbon emission and gainin profit across all data centers.
When the number of HU applications increases, the total profit of all policies (Fig-ure 6.5(c)) decreases almost linearly by about 45% from 0% to 100% HU applications.Similarly, there is also a drop in total carbon emission (Figure 6.5(a)). This fall in totalcarbon emission and total profit is due to the lower acceptance of applications as ob-served in Figure 6.5(e). In Figure 6.5(a), the decrease in total carbon emission for profitbased policies (GMP and MP-MP) is much more than that of carbon emission based poli-cies (MCE-MP, GMCE, and MCE-MCE). This is because carbon emission based policiesschedule applications on more carbon-efficient data centers.
Likewise, the increase in arrival rate also affects the total carbon emission (Figure 6.5(b))
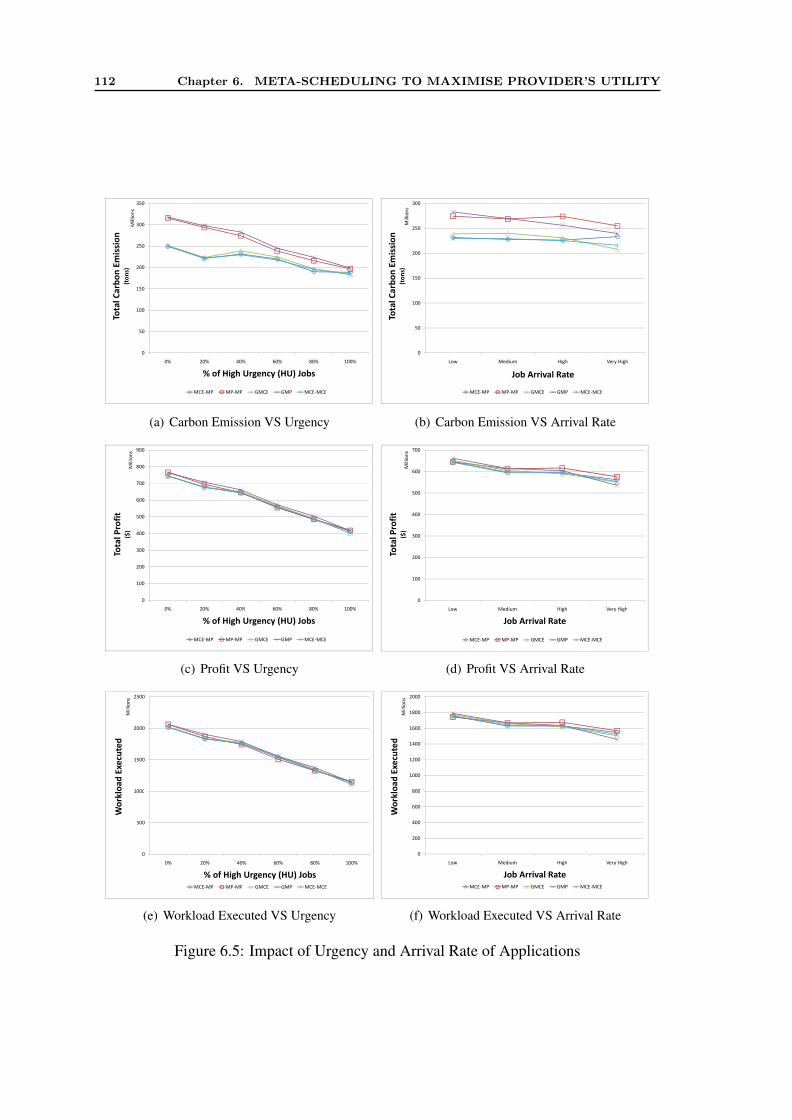
112 Chapter 6. META-SCHEDULING TO MAXIMISE PROVIDER’S UTILITY
150
200
250
300
350
Tota
l C
arb
on
Em
issi
on
(to
ns)
Millions
0
50
100
0% 20% 40% 60% 80% 100%
Tota
l C
arb
on
Em
issi
on
% of High Urgency (HU) Jobs
MCE-MP MP-MP GMCE GMP MCE-MCEMCE-MP MP-MP GMCE GMP MCE-MCE
(a) Carbon Emission VS Urgency
150
200
250
300
Tota
l C
arb
on
Em
issi
on
(to
ns)
Mil
lio
ns
0
50
100
Low Medium High Very High
Tota
l C
arb
on
Em
issi
on
Job Arrival Rate
MCE-MP MP-MP GMCE GMP MCE-MCEMCE-MP MP-MP GMCE GMP MCE-MCE
(b) Carbon Emission VS Arrival Rate
400
500
600
700
800
900
Tota
l P
rofi
t ($
)Millions
0
100
200
300
0% 20% 40% 60% 80% 100%
Tota
l P
rofi
t
% of High Urgency (HU) Jobs
MCE-MP MP-MP GMCE GMP MCE-MCEMCE-MP MP-MP GMCE GMP MCE-MCE
(c) Profit VS Urgency
300
400
500
600
700
Tota
l P
rofi
t ($
)M
illi
on
s
0
100
200
Low Medium High Very High
Tota
l P
rofi
t
Job Arrival Rate
MCE-MP MP-MP GMCE GMP MCE-MCEMCE-MP MP-MP GMCE GMP MCE-MCE
(d) Profit VS Arrival Rate
1000
1500
2000
2500
Wo
rklo
ad
Exe
cute
dMillions
0
500
1000
0% 20% 40% 60% 80% 100%
Wo
rklo
ad
Exe
cute
d
% of High Urgency (HU) Jobs
MCE-MP MP-MP GMCE GMP MCE-MCEMCE-MP MP-MP GMCE GMP MCE-MCE
(e) Workload Executed VS Urgency
800
1000
1200
1400
1600
1800
2000
Wo
rk
loa
d E
xe
cu
ted
Mil
lio
ns
0
200
400
600
800
Low Medium High Very High
Wo
rk
loa
d E
xe
cu
ted
Job Arrival Rate
MCE-MP MP-MP GMCE GMP MCE-MCEMCE-MP MP-MP GMCE GMP MCE-MCE
(f) Workload Executed VS Arrival Rate
Figure 6.5: Impact of Urgency and Arrival Rate of Applications
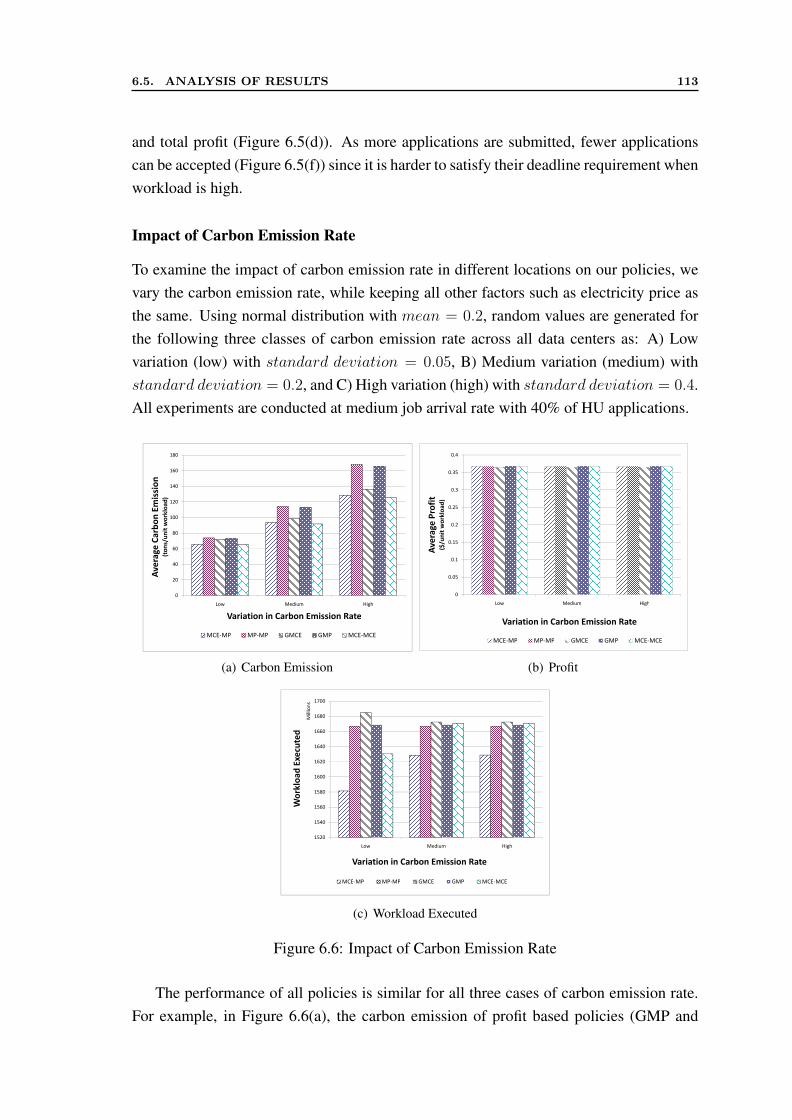
6.5. ANALYSIS OF RESULTS 113
and total profit (Figure 6.5(d)). As more applications are submitted, fewer applicationscan be accepted (Figure 6.5(f)) since it is harder to satisfy their deadline requirement whenworkload is high.
Impact of Carbon Emission Rate
To examine the impact of carbon emission rate in different locations on our policies, wevary the carbon emission rate, while keeping all other factors such as electricity price asthe same. Using normal distribution with mean = 0.2, random values are generated forthe following three classes of carbon emission rate across all data centers as: A) Lowvariation (low) with standard deviation = 0.05, B) Medium variation (medium) withstandard deviation = 0.2, and C) High variation (high) with standard deviation = 0.4.All experiments are conducted at medium job arrival rate with 40% of HU applications.
180
140
160
Av
era
ge
Ca
rbo
n E
mis
sio
n
100
120
Av
era
ge
Ca
rbo
n E
mis
sio
n(t
on
s/u
nit
wo
rklo
ad
)
80
100
Av
era
ge
Ca
rbo
n E
mis
sio
n(t
on
s/u
nit
wo
rklo
ad
)
40
60
Av
era
ge
Ca
rbo
n E
mis
sio
n(t
on
s/u
nit
wo
rklo
ad
)
20
40
Av
era
ge
Ca
rbo
n E
mis
sio
n
0
Low Medium High
Variation in Carbon Emission RateVariation in Carbon Emission Rate
MCE-MP MP-MP GMCE GMP MCE-MCEMCE-MP MP-MP GMCE GMP MCE-MCE
(a) Carbon Emission
0.4
0.3
0.35
0.25
0.3
Av
era
ge
Pro
fit
($/u
nit
wo
rklo
ad
)
0.15
0.2
Av
era
ge
Pro
fit
($/u
nit
wo
rklo
ad
)
0.1
0.15
Av
era
ge
Pro
fit
($/u
nit
wo
rklo
ad
)
0.05
0
Low Medium High
Variation in Carbon Emission Rate
MCE-MP MP-MP GMCE GMP MCE-MCEMCE-MP MP-MP GMCE GMP MCE-MCE
(b) Profit
1680
1700
Millions
1660
1680
Wo
rk
loa
d E
xe
cu
ted
Millions
1620
1640
Wo
rk
loa
d E
xe
cu
ted
1600
1620
Wo
rk
loa
d E
xe
cu
ted
1560
1580
Wo
rk
loa
d E
xe
cu
ted
1520
1540
1520
Low Medium High
Variation in Carbon Emission RateVariation in Carbon Emission Rate
MCE-MP MP-MP GMCE GMP MCE-MCEMCE-MP MP-MP GMCE GMP MCE-MCE
(c) Workload Executed
Figure 6.6: Impact of Carbon Emission Rate
The performance of all policies is similar for all three cases of carbon emission rate.For example, in Figure 6.6(a), the carbon emission of profit based policies (GMP and
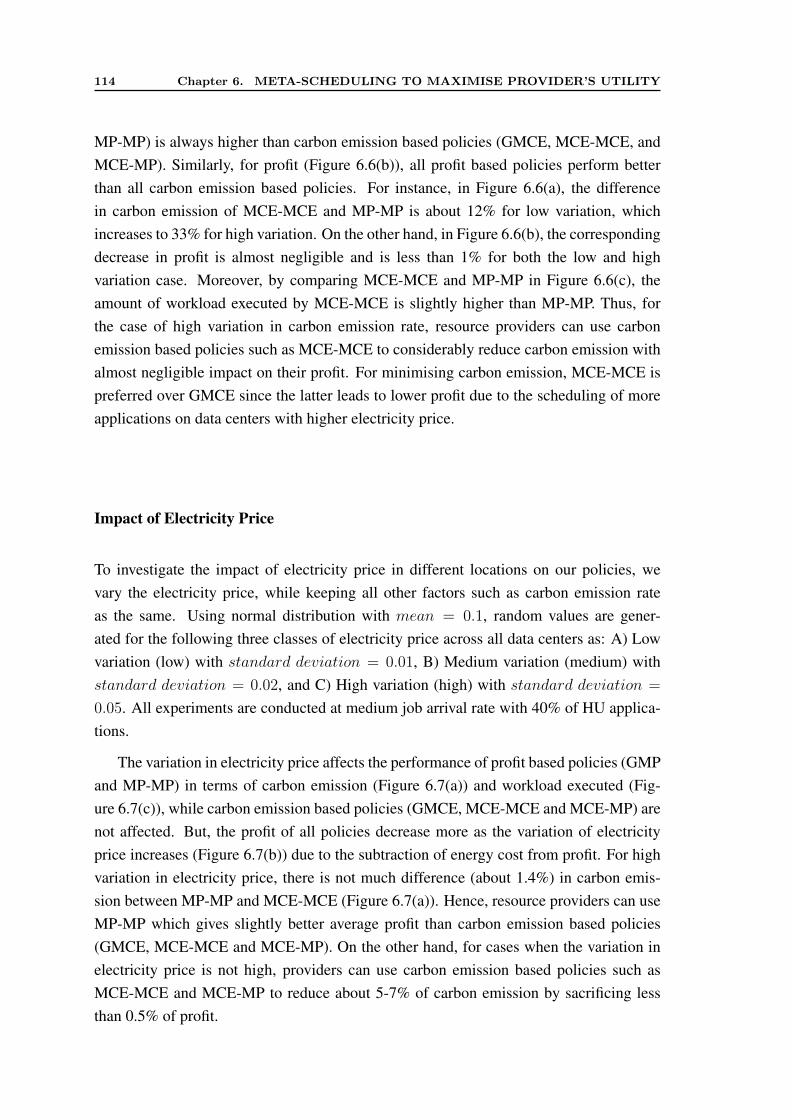
114 Chapter 6. META-SCHEDULING TO MAXIMISE PROVIDER’S UTILITY
MP-MP) is always higher than carbon emission based policies (GMCE, MCE-MCE, andMCE-MP). Similarly, for profit (Figure 6.6(b)), all profit based policies perform betterthan all carbon emission based policies. For instance, in Figure 6.6(a), the differencein carbon emission of MCE-MCE and MP-MP is about 12% for low variation, whichincreases to 33% for high variation. On the other hand, in Figure 6.6(b), the correspondingdecrease in profit is almost negligible and is less than 1% for both the low and highvariation case. Moreover, by comparing MCE-MCE and MP-MP in Figure 6.6(c), theamount of workload executed by MCE-MCE is slightly higher than MP-MP. Thus, forthe case of high variation in carbon emission rate, resource providers can use carbonemission based policies such as MCE-MCE to considerably reduce carbon emission withalmost negligible impact on their profit. For minimising carbon emission, MCE-MCE ispreferred over GMCE since the latter leads to lower profit due to the scheduling of moreapplications on data centers with higher electricity price.
Impact of Electricity Price
To investigate the impact of electricity price in different locations on our policies, wevary the electricity price, while keeping all other factors such as carbon emission rateas the same. Using normal distribution with mean = 0.1, random values are gener-ated for the following three classes of electricity price across all data centers as: A) Lowvariation (low) with standard deviation = 0.01, B) Medium variation (medium) withstandard deviation = 0.02, and C) High variation (high) with standard deviation =
0.05. All experiments are conducted at medium job arrival rate with 40% of HU applica-tions.
The variation in electricity price affects the performance of profit based policies (GMPand MP-MP) in terms of carbon emission (Figure 6.7(a)) and workload executed (Fig-ure 6.7(c)), while carbon emission based policies (GMCE, MCE-MCE and MCE-MP) arenot affected. But, the profit of all policies decrease more as the variation of electricityprice increases (Figure 6.7(b)) due to the subtraction of energy cost from profit. For highvariation in electricity price, there is not much difference (about 1.4%) in carbon emis-sion between MP-MP and MCE-MCE (Figure 6.7(a)). Hence, resource providers can useMP-MP which gives slightly better average profit than carbon emission based policies(GMCE, MCE-MCE and MCE-MP). On the other hand, for cases when the variation inelectricity price is not high, providers can use carbon emission based policies such asMCE-MCE and MCE-MP to reduce about 5-7% of carbon emission by sacrificing lessthan 0.5% of profit.
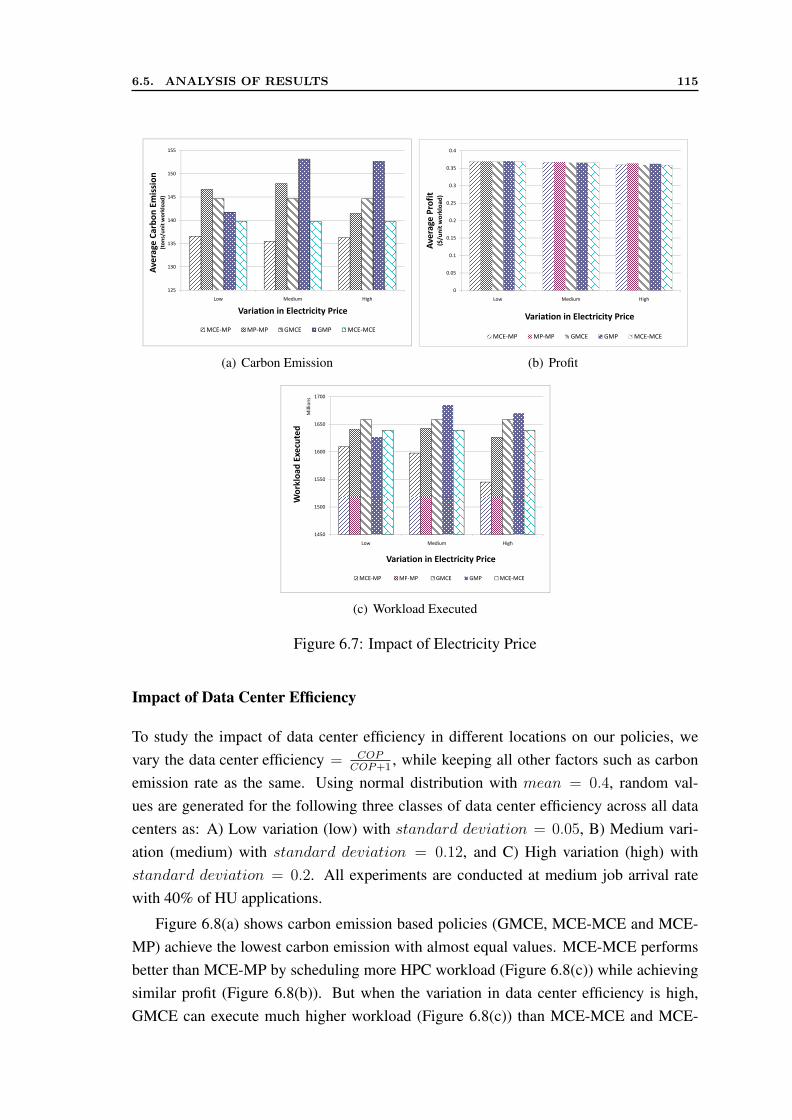
6.5. ANALYSIS OF RESULTS 115
140
145
150
155A
ve
rag
e C
arb
on
Em
issi
on
(to
ns/
un
it w
ork
loa
d)
125
130
135
Low Medium High
Av
era
ge
Ca
rbo
n E
mis
sio
n(t
on
s/u
nit
wo
rklo
ad
)
Variation in Electricity Price
MCE-MP MP-MP GMCE GMP MCE-MCE
(a) Carbon Emission
0.15
0.2
0.25
0.3
0.35
0.4
Av
era
ge
Pro
fit
($/u
nit
wo
rklo
ad
)
0
0.05
0.1
0.15
Low Medium High
Av
era
ge
Pro
fit
($/u
nit
wo
rklo
ad
)
Variation in Electricity Price
MCE-MP MP-MP GMCE GMP MCE-MCEMCE-MP MP-MP GMCE GMP MCE-MCE
(b) Profit
1550
1600
1650
1700
Wo
rklo
ad
Exe
cute
d
Millions
1450
1500
1550
Low Medium High
Wo
rklo
ad
Exe
cute
d
Variation in Electricity Price
MCE-MP MP-MP GMCE GMP MCE-MCEMCE-MP MP-MP GMCE GMP MCE-MCE
(c) Workload Executed
Figure 6.7: Impact of Electricity Price
Impact of Data Center Efficiency
To study the impact of data center efficiency in different locations on our policies, wevary the data center efficiency = COP
COP+1, while keeping all other factors such as carbon
emission rate as the same. Using normal distribution with mean = 0.4, random val-ues are generated for the following three classes of data center efficiency across all datacenters as: A) Low variation (low) with standard deviation = 0.05, B) Medium vari-ation (medium) with standard deviation = 0.12, and C) High variation (high) withstandard deviation = 0.2. All experiments are conducted at medium job arrival ratewith 40% of HU applications.
Figure 6.8(a) shows carbon emission based policies (GMCE, MCE-MCE and MCE-MP) achieve the lowest carbon emission with almost equal values. MCE-MCE performsbetter than MCE-MP by scheduling more HPC workload (Figure 6.8(c)) while achievingsimilar profit (Figure 6.8(b)). But when the variation in data center efficiency is high,GMCE can execute much higher workload (Figure 6.8(c)) than MCE-MCE and MCE-
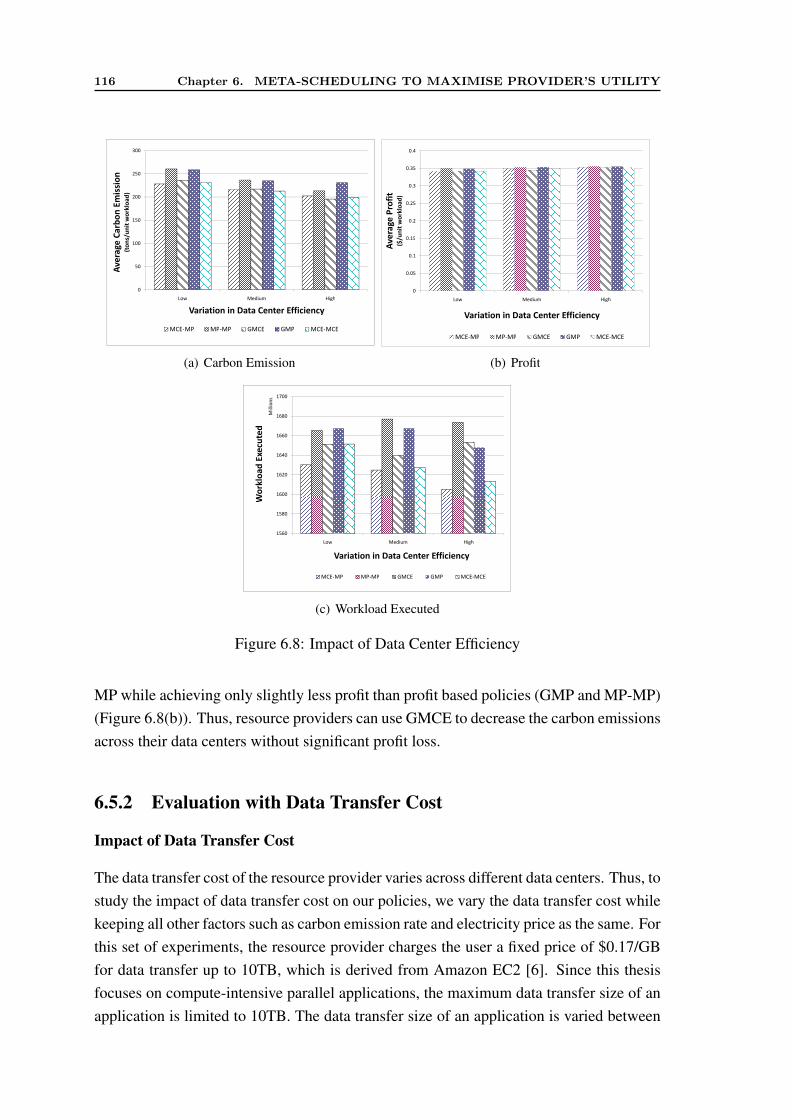
116 Chapter 6. META-SCHEDULING TO MAXIMISE PROVIDER’S UTILITY
150
200
250
300
Av
era
ge
Ca
rbo
n E
mis
sio
n(t
on
s/u
nit
wo
rklo
ad
)
0
50
100
Low Medium High
Av
era
ge
Ca
rbo
n E
mis
sio
n(t
on
s/u
nit
wo
rklo
ad
)
Variation in Data Center Efficiency
MCE-MP MP-MP GMCE GMP MCE-MCE
(a) Carbon Emission
0.15
0.2
0.25
0.3
0.35
0.4
Av
era
ge
Pro
fit
($/u
nit
wo
rklo
ad
)
0
0.05
0.1
0.15
Low Medium High
Av
era
ge
Pro
fit
($/u
nit
wo
rklo
ad
)
Variation in Data Center Efficiency
MCE-MP MP-MP GMCE GMP MCE-MCEMCE-MP MP-MP GMCE GMP MCE-MCE
(b) Profit
1620
1640
1660
1680
1700
Wo
rklo
ad
Exe
cute
dMillions
1560
1580
1600
Low Medium High
Wo
rklo
ad
Exe
cute
d
Variation in Data Center Efficiency
MCE-MP MP-MP GMCE GMP MCE-MCE
(c) Workload Executed
Figure 6.8: Impact of Data Center Efficiency
MP while achieving only slightly less profit than profit based policies (GMP and MP-MP)(Figure 6.8(b)). Thus, resource providers can use GMCE to decrease the carbon emissionsacross their data centers without significant profit loss.
6.5.2 Evaluation with Data Transfer Cost
Impact of Data Transfer Cost
The data transfer cost of the resource provider varies across different data centers. Thus, tostudy the impact of data transfer cost on our policies, we vary the data transfer cost whilekeeping all other factors such as carbon emission rate and electricity price as the same. Forthis set of experiments, the resource provider charges the user a fixed price of $0.17/GBfor data transfer up to 10TB, which is derived from Amazon EC2 [6]. Since this thesisfocuses on compute-intensive parallel applications, the maximum data transfer size of anapplication is limited to 10TB. The data transfer size of an application is varied between
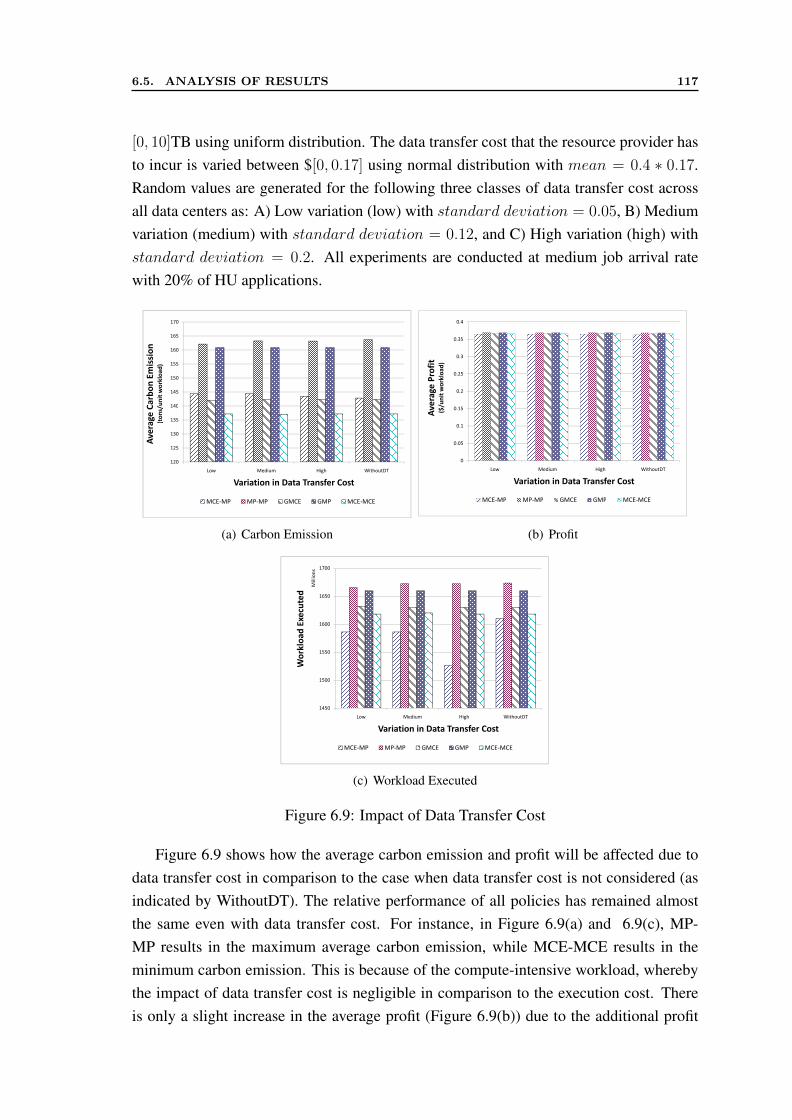
6.5. ANALYSIS OF RESULTS 117
[0, 10]TB using uniform distribution. The data transfer cost that the resource provider hasto incur is varied between $[0, 0.17] using normal distribution with mean = 0.4 ∗ 0.17.Random values are generated for the following three classes of data transfer cost acrossall data centers as: A) Low variation (low) with standard deviation = 0.05, B) Mediumvariation (medium) with standard deviation = 0.12, and C) High variation (high) withstandard deviation = 0.2. All experiments are conducted at medium job arrival ratewith 20% of HU applications.
140
145
150
155
160
165
170
Av
era
ge
Ca
rbo
n E
mis
sio
n(t
on
s/u
nit
wo
rklo
ad
)
120
125
130
135
140
Low Medium High WithoutDT
Av
era
ge
Ca
rbo
n E
mis
sio
n(t
on
s/u
nit
wo
rklo
ad
)
Variation in Data Transfer Cost
MCE-MP MP-MP GMCE GMP MCE-MCE
(a) Carbon Emission
0.15
0.2
0.25
0.3
0.35
0.4
Av
era
ge
Pro
fit
($/u
nit
wo
rklo
ad
)
0
0.05
0.1
0.15
Low Medium High WithoutDT
Av
era
ge
Pro
fit
($/u
nit
wo
rklo
ad
)
Variation in Data Transfer Cost
MCE-MP MP-MP GMCE GMP MCE-MCE
(b) Profit
1550
1600
1650
1700
Wo
rk
loa
d E
xe
cu
ted
Millions
1450
1500
1550
Low Medium High WithoutDT
Wo
rk
loa
d E
xe
cu
ted
Variation in Data Transfer Cost
MCE-MP MP-MP GMCE GMP MCE-MCE
(c) Workload Executed
Figure 6.9: Impact of Data Transfer Cost
Figure 6.9 shows how the average carbon emission and profit will be affected due todata transfer cost in comparison to the case when data transfer cost is not considered (asindicated by WithoutDT). The relative performance of all policies has remained almostthe same even with data transfer cost. For instance, in Figure 6.9(a) and 6.9(c), MP-MP results in the maximum average carbon emission, while MCE-MCE results in theminimum carbon emission. This is because of the compute-intensive workload, wherebythe impact of data transfer cost is negligible in comparison to the execution cost. Thereis only a slight increase in the average profit (Figure 6.9(b)) due to the additional profit
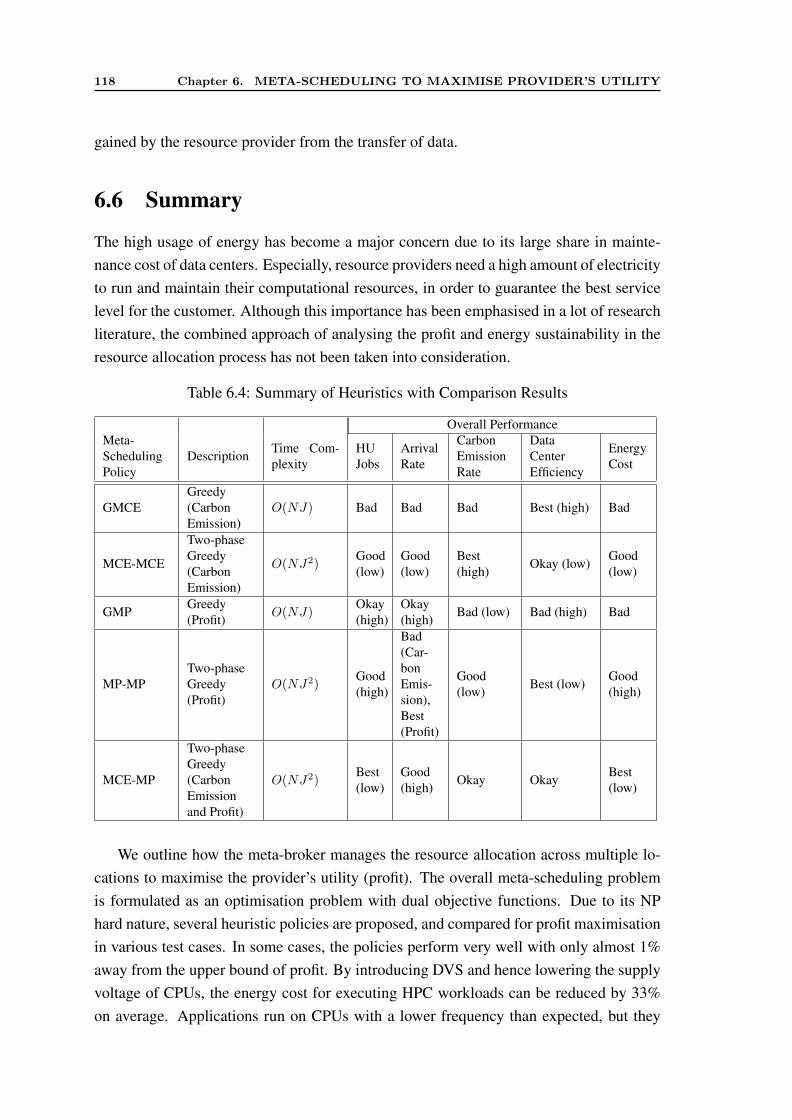
118 Chapter 6. META-SCHEDULING TO MAXIMISE PROVIDER’S UTILITY
gained by the resource provider from the transfer of data.
6.6 Summary
The high usage of energy has become a major concern due to its large share in mainte-nance cost of data centers. Especially, resource providers need a high amount of electricityto run and maintain their computational resources, in order to guarantee the best servicelevel for the customer. Although this importance has been emphasised in a lot of researchliterature, the combined approach of analysing the profit and energy sustainability in theresource allocation process has not been taken into consideration.
Table 6.4: Summary of Heuristics with Comparison Results
Overall PerformanceMeta-SchedulingPolicy
Description Time Com-plexity
HUJobs
ArrivalRate
CarbonEmissionRate
DataCenterEfficiency
EnergyCost
GMCEGreedy(CarbonEmission)
O(NJ) Bad Bad Bad Best (high) Bad
MCE-MCE
Two-phaseGreedy(CarbonEmission)
O(NJ2)Good(low)
Good(low)
Best(high) Okay (low) Good
(low)
GMP Greedy(Profit) O(NJ)
Okay(high)
Okay(high) Bad (low) Bad (high) Bad
MP-MPTwo-phaseGreedy(Profit)
O(NJ2)Good(high)
Bad(Car-bonEmis-sion),Best(Profit)
Good(low) Best (low) Good
(high)
MCE-MP
Two-phaseGreedy(CarbonEmissionand Profit)
O(NJ2)Best(low)
Good(high) Okay Okay Best
(low)
We outline how the meta-broker manages the resource allocation across multiple lo-cations to maximise the provider’s utility (profit). The overall meta-scheduling problemis formulated as an optimisation problem with dual objective functions. Due to its NPhard nature, several heuristic policies are proposed, and compared for profit maximisationin various test cases. In some cases, the policies perform very well with only almost 1%away from the upper bound of profit. By introducing DVS and hence lowering the supplyvoltage of CPUs, the energy cost for executing HPC workloads can be reduced by 33%on average. Applications run on CPUs with a lower frequency than expected, but they
6.6. SUMMARY 119
still meet the required deadlines. The limitation of carbon emission can be forced by gov-ernments to comply with certain threshold values [96]. In such cases, resource providersshould focus on reducing carbon emission in addition to minimising energy consumption.
We identify that policies, such as MCE-MCE, can help providers to reduce their emis-sion while almost maintaining their profit. If providers face a volatile electricity price,the MP-MP policy will lead to a better outcome. Depending on the environmental andeconomic constraints, resource providers can selectively choose different policies to effi-ciently allocate their resources to meet customers’ requests. The characteristics and per-formance of each meta-scheduling policy are summarised in Table 6.4, where “low” and“high” represent the scenario for which the overall performance of the policy is given.For instance, GMCE performs the best when the variation in data center efficiency ishigh, while MCE-MP performs the best when the variation in energy cost is low, or whenthere is a low number of HU applications. We observe that the impact of data transfercost is minimal for the compute-intensive applications that we have considered. How-ever, our model has explicitly considered the data transfer cost, and thus can be used fordata-intensive applications as well.
Hence, this chapter addresses the problem of profit maximisation for the resourceprovider having multiple resource sites (data centers) by intelligent meta-scheduling ofuser applications with QoS requirements. In the next chapter, we will investigate themarket-oriented meta-scheduling problem in the third scenario i.e. to maximise the utilityof both Grid users and resource providers.

Chapter 7
Meta-Scheduling to Enhance All GridPlayers’ Utility
In previous chapters, we developed market-oriented meta-scheduling algorithms for twoscenarios where matching of multiple applications and resources is required. In this chap-ter, we aim to apply the market-oriented meta-scheduling in order to maximise simultane-ously both Grid users’ and resource providers’ utility. To achieve this objective, valuationmetrics are designed and presented for both user applications and resources. The valuationmetrics commodify the complex resource requirements of the users and the capabilities ofavailable computational resources. An analytical model of the meta-scheduling problemin Grids is presented to ensure correctness of our mechanism, and to estimate effect onother crucial system-based metrics such as slowdown and waiting time. Then, at the endof the chapter, a simulation study discusses the performance of our presented mechanismin comparison to both existing market-based and traditional meta-scheduling algorithms.The results show that our meta-scheduling mechanism not only satisfies more user re-quirements (users’ utility) than others, but also improves system utilisation (providers’utility) through load balancing.
7.1 Motivation
As discussed in Chapter 1 and 2, the previously proposed solutions for meta-scheduling inGrid computing focused more on improving system-centric performance metrics such asutilisation, average load and turnaround time for user applications [136]. They were notdesigned to cater to the sophisticated QoS needs of an application, particularly when thedemand for resources exceeded the supply. Thus, in recent years, a number of researchershave explored application of market-based models to address user requirements in meta-scheduling. Auctions have been particularly preferred [9, 104] as they provide immense
121
122 Chapter 7. META-SCHEDULING TO ENHANCE ALL GRID PLAYERS’ UTILITY
flexibility to participants to specify their valuations for applications and resources. How-ever, these systems have limitations [168]. It is difficult for the users to come up with avaluation corresponding to their utility function. In a Grid with changing availability ofresources, it is difficult to determine resource and application valuations accurately. Also,users with low valued and urgent requirements may be starved by those with higher value.Auctions are applied to commodities that are comparable to one another. However, theparallel applications having fixed processor requirements are not comparable, and cannotbe commodified easily. Hence, the problem is to design valuation metrics that commodi-tize resource requirements and availability so as to take advantage of the efficiency ofauction mechanisms [146]. Thus, we need new scheduling mechanisms that are not onlyefficient and ensure better performance of Grid resources, but also take into account userinterests, resource valuation and demand, and allocate resources fairly to user applicationsby reducing the starvation of low valued and urgent applications.
Therefore, in this chapter, we present a novel market-oriented meta-scheduling mech-anism which takes inspiration from auction principles to allocate resources in global Gridenvironment. The objective of our meta-scheduling mechanism is to maximise both theusers’ utility by reducing starvation of applications, and the resource providers’ utilityby equally distributing the load, while minimising affect on other crucial metrics such aswaiting time and slowdown.
7.2 System Model
We consider a Grid with m resource sites, R1, R2..Rm having k job queues. Resourcesites supply information about available slots, load and waiting times of each queue tothe meta-broker at regular time intervals. A slot is a unit of resource allocation which isdescribed by a start time, a finish time, and the number of processors available for thatduration. A resource site also supplies an initial valuation for running an application in aqueue on that resource. The utility of of the resource provider is considered in the termsof fairness in receiving the workload for execution. Thus, the objective of the meta-brokeris to equally distribute the load across all the resource sites.
The objective of the users is to have their applications completed by a deadline. Itis assumed that deadlines are hard, i.e. a user will benefit only if his/her application isexecuted by its deadline. Users will also provide an initial valuation of the application tothe meta-broker.
7.3 Double Auction-Inspired Meta-scheduling (DAM)
Auction-based mechanisms have been the subject of many previous studies. Grosu etal. [74] compare resource allocation protocols using First-Price, Second-Price, Vickery
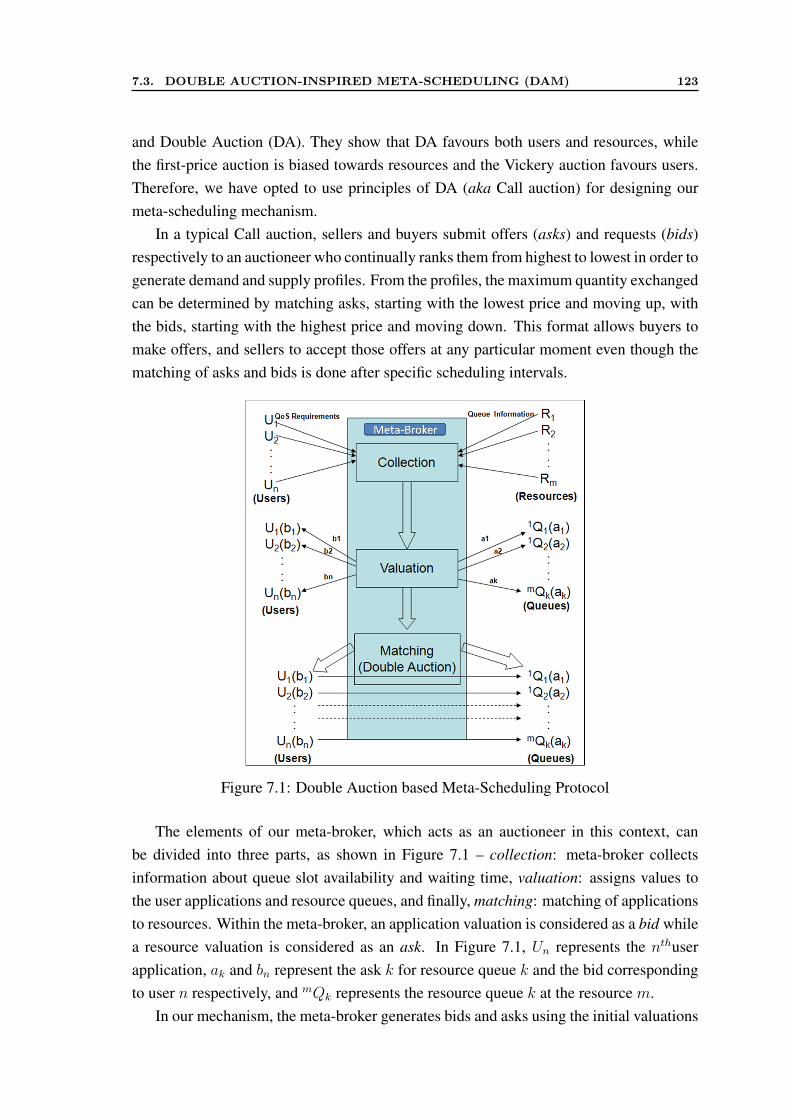
7.3. DOUBLE AUCTION-INSPIRED META-SCHEDULING (DAM) 123
and Double Auction (DA). They show that DA favours both users and resources, whilethe first-price auction is biased towards resources and the Vickery auction favours users.Therefore, we have opted to use principles of DA (aka Call auction) for designing ourmeta-scheduling mechanism.
In a typical Call auction, sellers and buyers submit offers (asks) and requests (bids)respectively to an auctioneer who continually ranks them from highest to lowest in order togenerate demand and supply profiles. From the profiles, the maximum quantity exchangedcan be determined by matching asks, starting with the lowest price and moving up, withthe bids, starting with the highest price and moving down. This format allows buyers tomake offers, and sellers to accept those offers at any particular moment even though thematching of asks and bids is done after specific scheduling intervals.
Figure 7.1: Double Auction based Meta-Scheduling Protocol
The elements of our meta-broker, which acts as an auctioneer in this context, canbe divided into three parts, as shown in Figure 7.1 – collection: meta-broker collectsinformation about queue slot availability and waiting time, valuation: assigns values tothe user applications and resource queues, and finally, matching: matching of applicationsto resources. Within the meta-broker, an application valuation is considered as a bid whilea resource valuation is considered as an ask. In Figure 7.1, Un represents the nthuserapplication, ak and bn represent the ask k for resource queue k and the bid correspondingto user n respectively, and mQk represents the resource queue k at the resource m.
In our mechanism, the meta-broker generates bids and asks using the initial valuations
124 Chapter 7. META-SCHEDULING TO ENHANCE ALL GRID PLAYERS’ UTILITY
of users and resources as input, and augmenting them with information about resourceavailability and user requirements. The valuation methods are described in the next sec-tion. At regular scheduling intervals, the meta-broker matches the applications (asks) tothe resource queues (bids) if the deadline constraint of the application is satisfied. If anapplication cannot be matched, then it will be reconsidered in the next scheduling interval.Throughout this thesis, we refer to our Double auction-inspired mechanism as DAM.
7.3.1 Valuation Mechanism
One of the most important components of an auction is to assign valuation to user applica-tions and resources. The Grid services may be valued based on the cost of infrastructure,and economic factors such as supply and demand. However, user needs and urgency, andsimultaneously, efficient utilisation of Grid services must be reflected through valuationof user applications and resources. Therefore, the meta-broker must generate a metricfor both the users and the resource providers that takes into account all these attributes.This valuation should be dynamic, that is, in each scheduling cycle; it should be updatedbased on various parameters, and the dynamic demand and supply of the system. Todesign a good valuation metric, we took inspiration from Multi-Attribute Utility Theory(MAUT) [20] [93]. MAUT gives a logical, consistent and tractable approach for quantify-ing an individual’s preferences by consolidating them into a single objective. This allowscomparison of many diverse measures via single value. This theory includes first the iden-tification of attributes and desirability function for each attributes and, then aggregationof these desirability functions to a single scalar utility value. The details of our valuationmetric are discussed in next section.
Resource Valuation (Ask): The valuation of resources is affected by attributes such aswaiting time, load, initial valuation of the provider, and economic factors such as demandand supply. The load of a queue is defined as the ratio of the number of processorsoccupied to the total number of processors available to the queue. In order to balance loadacross independent Grid sites, the meta-broker tries to give preference to the least loadedqueues while submitting applications. Also, the most urgent application must be matchedto the fastest queue. Since, in a Call auction, the maximum bid is matched to minimumask, the valuation metric of resource queues should be such that the queue with the leastwaiting time should have the least ask value. Moreover, the valuation metric should alsotake into account the initial valuation given by the resource provider, and also the demandand supply levels of resources in the system (denoted asDemand and Supply). Demandis the sum of the processors required by tasks to be allocated and Supply is the totalnumber of processors available at all resources. Let lk,t be the load on the resource queuek at time t. Let ck,t be the initial resource valuation given by the provider. Let wk,t be
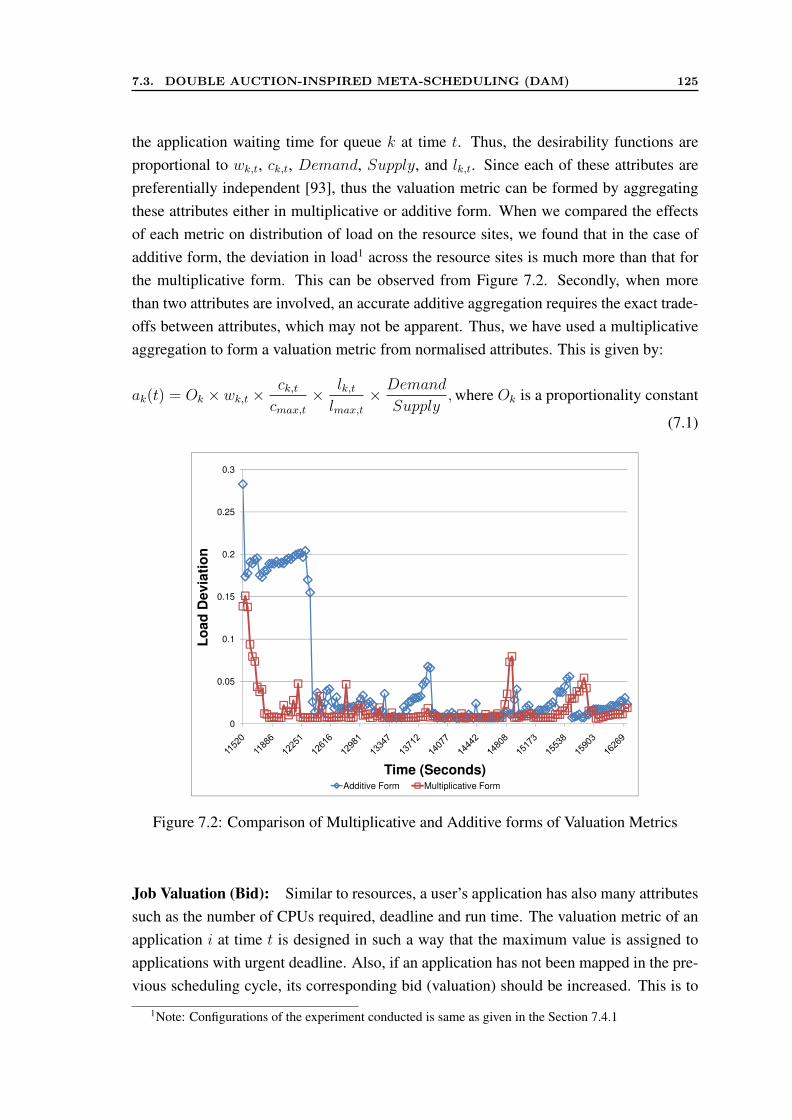
7.3. DOUBLE AUCTION-INSPIRED META-SCHEDULING (DAM) 125
the application waiting time for queue k at time t. Thus, the desirability functions areproportional to wk,t, ck,t, Demand, Supply, and lk,t. Since each of these attributes arepreferentially independent [93], thus the valuation metric can be formed by aggregatingthese attributes either in multiplicative or additive form. When we compared the effectsof each metric on distribution of load on the resource sites, we found that in the case ofadditive form, the deviation in load1 across the resource sites is much more than that forthe multiplicative form. This can be observed from Figure 7.2. Secondly, when morethan two attributes are involved, an accurate additive aggregation requires the exact trade-offs between attributes, which may not be apparent. Thus, we have used a multiplicativeaggregation to form a valuation metric from normalised attributes. This is given by:
ak(t) = Ok × wk,t ×ck,tcmax,t
× lk,tlmax,t
× Demand
Supply,where Ok is a proportionality constant
(7.1)
0.15
0.2
0.25
0.3
Lo
ad
Devia
tio
n
0
0.05
0.1Lo
ad
Devia
tio
n
Time (Seconds)Additive Form Multiplicative Form
Figure 7.2: Comparison of Multiplicative and Additive forms of Valuation Metrics
Job Valuation (Bid): Similar to resources, a user’s application has also many attributessuch as the number of CPUs required, deadline and run time. The valuation metric of anapplication i at time t is designed in such a way that the maximum value is assigned toapplications with urgent deadline. Also, if an application has not been mapped in the pre-vious scheduling cycle, its corresponding bid (valuation) should be increased. This is to
1Note: Configurations of the experiment conducted is same as given in the Section 7.4.1
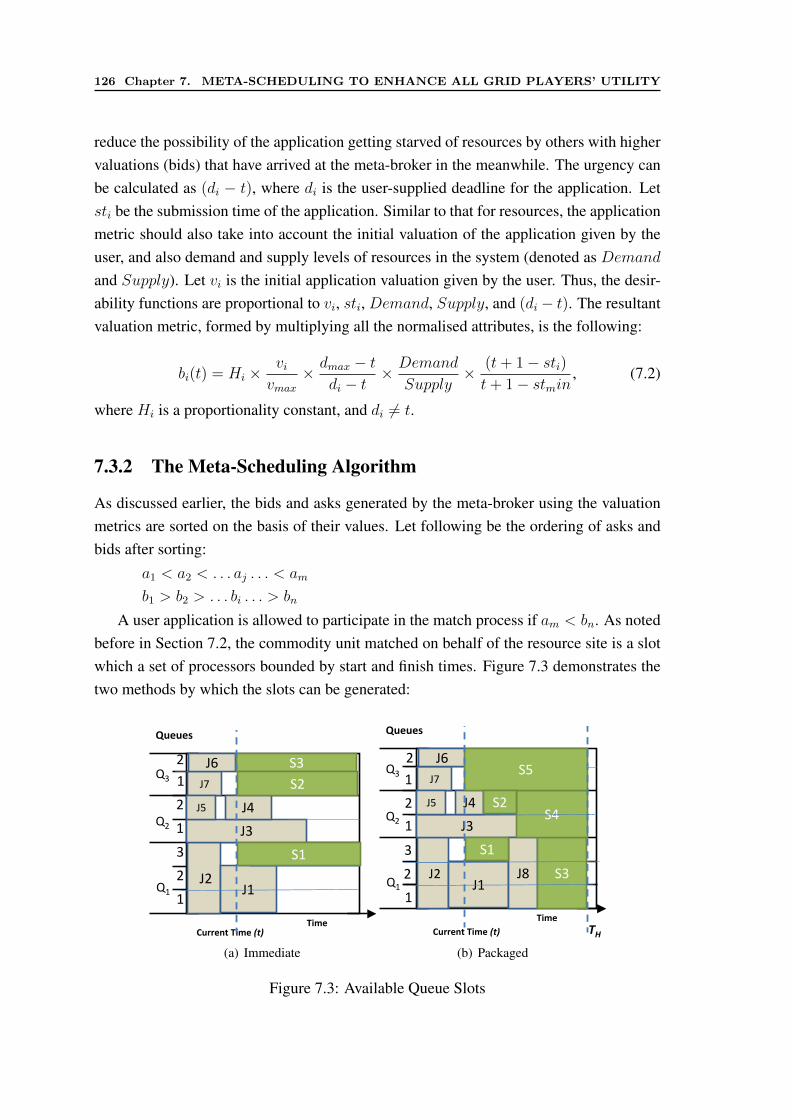
126 Chapter 7. META-SCHEDULING TO ENHANCE ALL GRID PLAYERS’ UTILITY
reduce the possibility of the application getting starved of resources by others with highervaluations (bids) that have arrived at the meta-broker in the meanwhile. The urgency canbe calculated as (di − t), where di is the user-supplied deadline for the application. Letsti be the submission time of the application. Similar to that for resources, the applicationmetric should also take into account the initial valuation of the application given by theuser, and also demand and supply levels of resources in the system (denoted as Demandand Supply). Let vi is the initial application valuation given by the user. Thus, the desir-ability functions are proportional to vi, sti, Demand, Supply, and (di − t). The resultantvaluation metric, formed by multiplying all the normalised attributes, is the following:
bi(t) = Hi ×vivmax
× dmax − tdi − t
× Demand
Supply× (t+ 1− sti)t+ 1− stmin
, (7.2)
where Hi is a proportionality constant, and di 6= t.
7.3.2 The Meta-Scheduling Algorithm
As discussed earlier, the bids and asks generated by the meta-broker using the valuationmetrics are sorted on the basis of their values. Let following be the ordering of asks andbids after sorting:
a1 < a2 < . . . aj . . . < am
b1 > b2 > . . . bi . . . > bn
A user application is allowed to participate in the match process if am < bn. As notedbefore in Section 7.2, the commodity unit matched on behalf of the resource site is a slotwhich a set of processors bounded by start and finish times. Figure 7.3 demonstrates thetwo methods by which the slots can be generated:
!
"
#
!
"
!
"
$"
$!
$#%&
%'
(%"%!
%#
%) %*
!"##$%&'()*$'!"#()*$
+"$"$,
+!
+#
+"
(a) Immediate
!
"
#
!
"
!
"
$"
$!
$#%&
%'
(%"%!
%#
%) %*
!"##$%&'()*$'!"#
()*$
+"$"$,
'$%
%+
,!
,#
,*
,)
,"
(b) Packaged
Figure 7.3: Available Queue Slots
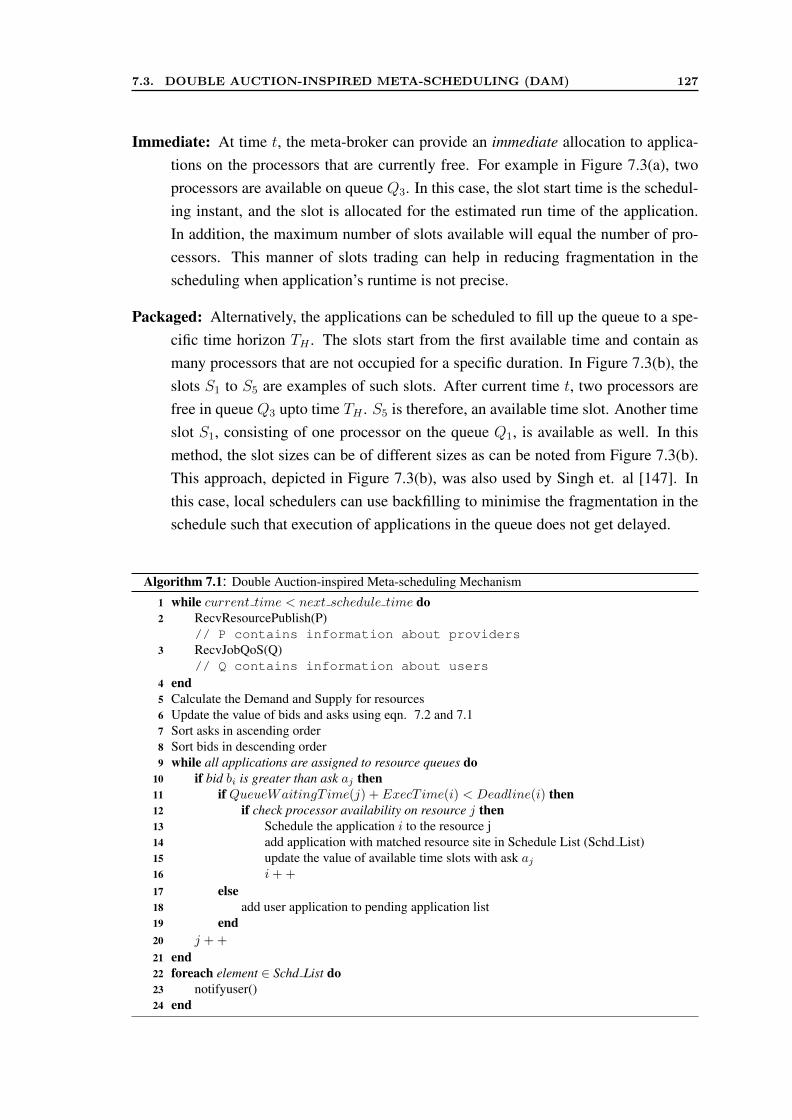
7.3. DOUBLE AUCTION-INSPIRED META-SCHEDULING (DAM) 127
Immediate: At time t, the meta-broker can provide an immediate allocation to applica-tions on the processors that are currently free. For example in Figure 7.3(a), twoprocessors are available on queue Q3. In this case, the slot start time is the schedul-ing instant, and the slot is allocated for the estimated run time of the application.In addition, the maximum number of slots available will equal the number of pro-cessors. This manner of slots trading can help in reducing fragmentation in thescheduling when application’s runtime is not precise.
Packaged: Alternatively, the applications can be scheduled to fill up the queue to a spe-cific time horizon TH . The slots start from the first available time and contain asmany processors that are not occupied for a specific duration. In Figure 7.3(b), theslots S1 to S5 are examples of such slots. After current time t, two processors arefree in queue Q3 upto time TH . S5 is therefore, an available time slot. Another timeslot S1, consisting of one processor on the queue Q1, is available as well. In thismethod, the slot sizes can be of different sizes as can be noted from Figure 7.3(b).This approach, depicted in Figure 7.3(b), was also used by Singh et. al [147]. Inthis case, local schedulers can use backfilling to minimise the fragmentation in theschedule such that execution of applications in the queue does not get delayed.
Algorithm 7.1: Double Auction-inspired Meta-scheduling Mechanism
while current time < next schedule time do1RecvResourcePublish(P)2// P contains information about providersRecvJobQoS(Q)3// Q contains information about users
end4Calculate the Demand and Supply for resources5Update the value of bids and asks using eqn. 7.2 and 7.16Sort asks in ascending order7Sort bids in descending order8while all applications are assigned to resource queues do9
if bid bi is greater than ask aj then10if QueueWaitingT ime(j) + ExecT ime(i) < Deadline(i) then11
if check processor availability on resource j then12Schedule the application i to the resource j13add application with matched resource site in Schedule List (Schd List)14update the value of available time slots with ask aj15i++16
else17add user application to pending application list18
end19j ++20
end21foreach element ∈ Schd List do22
notifyuser()23end24
128 Chapter 7. META-SCHEDULING TO ENHANCE ALL GRID PLAYERS’ UTILITY
Our scheduling mechanism is shown in Algorithm 7.1. In each scheduling cycle,the meta-broker schedules the parallel applications after collecting all user’s requests andresource performance information such as queue waiting times and free time slots (Line1-3). At the end of each scheduling cycle, the meta-broker computes the demand forresources and their supply (Line 4). Then it assigns valuation to user applications (bids)and resource’s queue (asks) using the mechanisms presented in the previous section (Line5).
From the sorted bid list, the bid (bi) with the highest value is matched to the resourcequeue with the minimum ask (aj) that can satisfy the user requirement. Whether theuser application i is scheduled to the resource queue j (corresponding to ask aj), it willdepend on the applications’ processor and deadline requirements. Thus, first the deadlineof application i is checked using waiting time of the resource queue j (Line 10) and thenprocessor availability is checked on resource queue j (Line 11). If there is an ask whichsatisfies the application’s QoS requirements, then the bid is matched to ask, and the userand the resource provider are informed of the match. The application i is then scheduledon to the resource queue j (Line 12) and then added to schedule list (Line 13). Theavailable time slots (commodity units) on resource queue j are updated correspondingly(Line 14). If the deadline requirement of application i can be satisfied by resource queuej, then no other ask can be matched to the application’s bid (Line 18). Therefore, theapplication is removed from the bids list in that scheduling cycle. If the required numberof processor is not available on the resource queue j, bid bi is matched with next ask inthe sequence (Line 19). Matching for other bids and asks will be repeated until either allbids or asks are matched.
7.3.3 Queueing Theory Based Model for Meta-scheduling
In order to know the generalised behaviour of any meta-scheduling algorithm, it is impor-tant to analyse it with a queuing model which will also help to test the near optimality ofthe algorithm. Thus, we designed a formal mathematical model to analyse and predict theperformance of the DAM in terms of other system-based metrics such as slowdown andwaiting time. This analytical model which finds the expected (average) metrics for ourmeta-scheduling heuristic is used to test the correctness and substantiate the strength ofDAM in the experimental section.
Our analytical model is based on queuing theory, which has been used extensivelyfor modelling scheduling problems in distributed systems. Queuing Theory provides apowerful stochastic and probabilistic approach to analytically model the mechanisms ofscheduling policies [100]. It can be observed by the queueing view of the system modelconsidered in previous section (as shown in Figure 7.4) that the system is well suited tobe analysed via queueing theory.
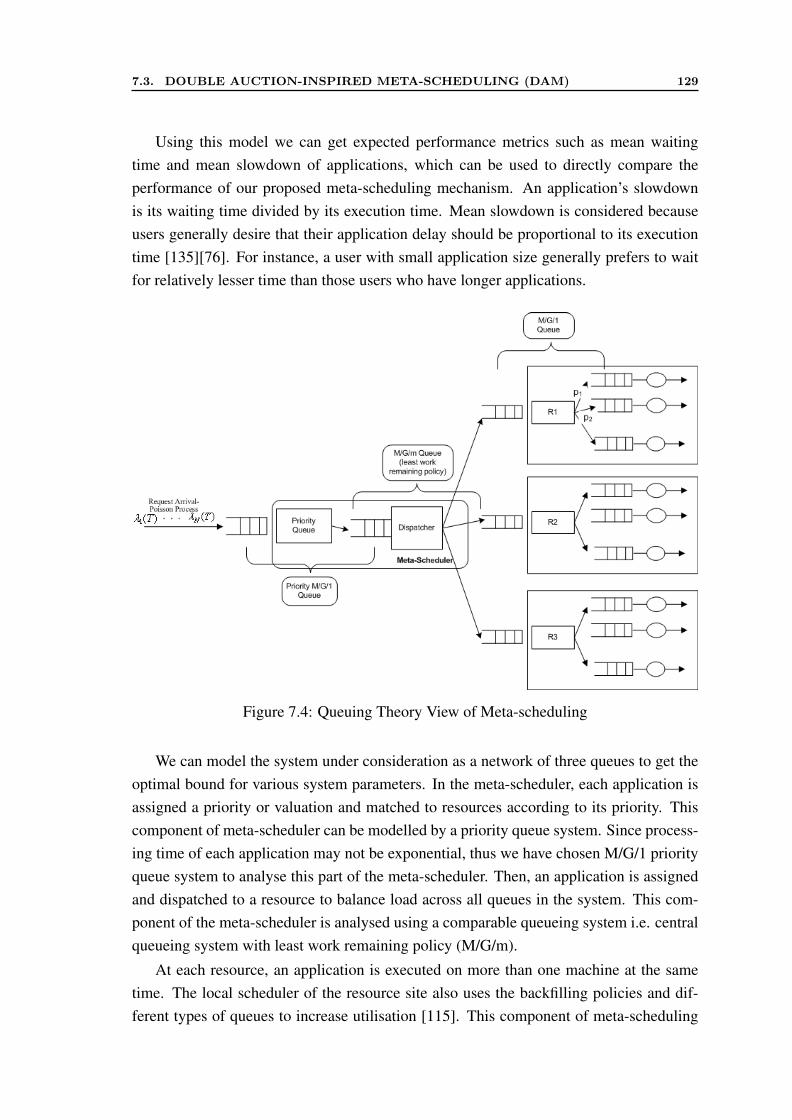
7.3. DOUBLE AUCTION-INSPIRED META-SCHEDULING (DAM) 129
Using this model we can get expected performance metrics such as mean waitingtime and mean slowdown of applications, which can be used to directly compare theperformance of our proposed meta-scheduling mechanism. An application’s slowdownis its waiting time divided by its execution time. Mean slowdown is considered becauseusers generally desire that their application delay should be proportional to its executiontime [135][76]. For instance, a user with small application size generally prefers to waitfor relatively lesser time than those users who have longer applications.
Figure 7.4: Queuing Theory View of Meta-scheduling
We can model the system under consideration as a network of three queues to get theoptimal bound for various system parameters. In the meta-scheduler, each application isassigned a priority or valuation and matched to resources according to its priority. Thiscomponent of meta-scheduler can be modelled by a priority queue system. Since process-ing time of each application may not be exponential, thus we have chosen M/G/1 priorityqueue system to analyse this part of the meta-scheduler. Then, an application is assignedand dispatched to a resource to balance load across all queues in the system. This com-ponent of the meta-scheduler is analysed using a comparable queueing system i.e. centralqueueing system with least work remaining policy (M/G/m).
At each resource, an application is executed on more than one machine at the sametime. The local scheduler of the resource site also uses the backfilling policies and dif-ferent types of queues to increase utilisation [115]. This component of meta-scheduling
130 Chapter 7. META-SCHEDULING TO ENHANCE ALL GRID PLAYERS’ UTILITY
is difficult to model analytically. Thus, to analyse this part of meta-scheduling, we havetaken an approximate model of real local scheduling systems. We have divided CPUs ofa resource into multiple partitions, where each partition acts as a M/G/1 queueing sys-tem. The resource with multiple partitions is an approximation of real local schedulingsystems. The CPU/machine processing requirements of each application also follows ageneral distribution (denoted as G).
Thus, in meta-scheduling, each application goes through three queuing systems be-fore it start executing. Hence, by analysing the combination of the following sequentialnetwork of three queuing systems, we get an approximate analytical model for meta-scheduling system:
• Valuation or prioritisation (M/G/1 Queue with Priority)
• Matching or Dispatching (M/G/m Queue i.e. least work remaining (LWR) policy)
• Scheduling at a resource for execution (M/G/1 Queues)
The mean arrival rate of applications is λ. Let the service requirement distribution ofapplications be any general distribution X . The mean service time of the applications isE(X) and the second moment of service time is σ or E(X2). The distribution of processorrequirement by each application is given by C. Let the number of resource sites be m.
Valuation or prioritisation (M/G/1 Queue with Priority)
In the first part of DAM, applications are assigned valuations so that they can be re-sequenced for scheduling. Thus, this scenario can be modelled as a single server queuingsystem as shown in Figure 7.4. There are K priority classes of applications. The meanservice time of priority class j is 1
µjand the second moment of service time is σ′j . The
overall second moment of service rate of applications by the server is σ′ . Since the timetaken to assign priorities is very small in DAM mechanism, the mean service rates ofapplication will also be very small. The applications arrival follows a Poisson distributionwith mean λ.
Let pj be the probability with which jth priority class applications arrived at the server.Then, the mean arrival rate (λj) of the jth priority applications is given by:
λj = pj × λ (7.3)
Since the service time distribution of all priority class is 1µj
, thus the system load dueto jth priority class applications is given by:
ρj =λjµj
7.3. DOUBLE AUCTION-INSPIRED META-SCHEDULING (DAM) 131
Let E(wj) is expected waiting time for the applications with priority level j. Thenusing the classic result on non-preemptive priority queue by A. Cobham [38] we obtainthe mean waiting time and slowdown (E(sj)) of class-j applications:
E(wj) =λ×σ′
2
(1−∑j−1
i=1 ρi)(1−∑j
i=1 ρi)
Thus, total mean waiting time and slowdown of applications in the system is given by:
W1 =K∑j=1
(pj × (E(wj) +1
µj)) (7.4)
S1 =K∑j=1
(pj × (E(wj) +1
µj))× E(X−1j ) (7.5)
Matching or Dispatching (M/G/m Queue)
After applications are served by above queuing system based on priority, applications inthe out-going queue will be served by the second queuing server on a FCFS basis. It canbe considered as third component of meta-scheduler i.e., matching. For simplicity, the ap-plications arriving into the second queueing system are taken to follow a poisson process.For the assignment of these applications to the resource sites, we have used the centralqueue with m servers policy. This policy has been proven to be equivalent to least-work-remaining allocation policy, which is claimed to be optimal by Nelson et. al [119][120].This policy is not analytically tractable under M/G/m queueing system. Nonetheless, sev-eral good approximations exist in the literature, many of which are empirical. In thisstudy, we use the approximation given by Nozaki et. al [123] which is used in severalother publications [75] [76]. The approximation for mean queue length is stated as:
E(NM/G/m) = E(NM/M/m)E(X2)
E(X)2,where X: Service Requirement & N: Queue Length
(7.6)
The load of system is given by:
ρ = λ× E(X)
Let E(WM/M/m) be the average waiting time in a M/M/m queueing system and ρ bethe system load. Then, using well known Pollaczek-Khinchin formula in queuing theory,
132 Chapter 7. META-SCHEDULING TO ENHANCE ALL GRID PLAYERS’ UTILITY
the average queue length and waiting time for M/M/m queueing system is given by:
E(NM/M/m) =PNρ
1− ρ,where PN = [
m−1∑z
(mρ)z
z!+
mmρm
m!1− ρ]−1 (7.7)
E(WM/M/m) =E(NM/M/m)
λ(7.8)
Thus, using Equation 7.6, 7.7 and 7.8, the mean waiting time and slowdown in thequeue by using central queue policy is given by:
W2 = E(WM/G/m) = E(WM/M/m)σ
E(X)2(7.9)
S2 = W2 × E(X−1) (7.10)
Scheduling at a Resource for Execution (M/G/1 Queues)
After the application is assigned to the resource queue, the application is needed to bescheduled on multiple servers. Unlike the most of the commonly used queuing systemswhere an application requires only one server for execution, here each application needsmore than one server (processors in our context) at the same time. Moreover, local sched-uler at a resource uses different backfilling policies to decrease slowdown of applica-tions [115]. Since, it is analytically intractable to solve this system, the designed analyt-ical system for this component of meta-scheduling differ slightly from real systems. Wedivided the processors of the resource into multiple disjoint partitions, with one queue perpartition. Each partition f on resource z is initially assigned rzf processors. Each of thesequeues processes the applications, which require processors within range of (rz(f−1), rzf ),on FCFS basis. Let there be Nz servers/processors at resource site z, which are dividedbetween nz queues. Thus,
rz0 + rz1 + rz2 + rz3...rzf + ..rz(nz−1) = Nz (7.11)
Since the total number of resource sites ism, the arrival rate of applications at resourcesite z is given by:
λz =λ
m(7.12)
Let uzf be the probability that an application require processor between rz(f−1) and rzf ,and thus processed by queue f of resource site f . Let C be the probability distribution ofprocessor requirements for an application, this probability is given by:
uzf =
∫ azf
az(f−1)
C(x)dx (7.13)
Thus, the fraction of applications arriving at queue f of the resource site z is given by:
7.3. DOUBLE AUCTION-INSPIRED META-SCHEDULING (DAM) 133
λzf = λzuzf (7.14)
The load shared by each queue, when E(X) is mean service time, is given by:
ρzf = λzfE(X) (7.15)
Since each queue partition has M/G/1 FCFS queue system behaviour, thus we candirectly use the same results for the average waiting time. This is given by:
E(wzf ) =λzfσ
2(1− ρzf )(7.16)
The total expected waiting time at a resource site is the average of all waiting time ateach queue partition, which is given by:
E(wz) =1
nz
nz∑f=1
E(wzf ) (7.17)
Let W3 and S3 be the expected waiting time and slowdown of all resource sites, re-spectively. Thus, they are given by:
W3 =λ
m
m∑z=1
E(wz) (7.18)
S3 = W3 × E(X−1) (7.19)
The overall expected waiting time and slowdown measures are given by combiningwaiting time and slowdown of all three queueing system, i.e., Equation 7.4-7.5, 7.9-7.10and 7.18-7.19:
Waiting Time = E(W ) = W1 +W2 +W3 (7.20)
Slowdown = E(S) = S1 + S2 + S3 (7.21)
Thus, the queueing theory based analytical model for our meta-scheduling mechanismis given by following equations:
134 Chapter 7. META-SCHEDULING TO ENHANCE ALL GRID PLAYERS’ UTILITY
Minimise(E(W )) subject tonz∑k
rzk = Nz, 1 < z < m (7.22)
Minimise(E(S)) subject tonz∑k
rzk = Nz, 1 < z < m (7.23)
The above model gives an approximation for real meta-scheduling systems. Thus,to predict performance of our meta-scheduling policy, we can obtain optimal expectedwaiting time and slowdown. Thus, Equations 7.22 and 7.23 for expected waiting time andslowdown are needed to be solved for different values of nz using optimisation tools suchas Mathematica [Wolform Research 2008]. These analytical values are used to ascertainthe performance of DAM.
7.4 Performance Evaluation
7.4.1 Experimental Configuration
For our experiments in this chapter, we use Feitelson’s Parallel Workload Archive (PWA)to model the parallel application workload for Grids. Since this chapter focuses on study-ing the HPC parallel applications of users, the PWA meets our objective by providing thenecessary characteristics of real parallel applications collected from supercomputing cen-ters. To avoid affect of initial setup phase of the HPC center, our experiments utilise theapplications in the second week of the Lawrence Livermore National Laboratory (LLNL)Thunder (January 2007 to June 2007). The LLNL Thunder trace from the LLNL in USAis chosen due to its highest resource utilisation of 87.6% among available traces to ideallymodel a heavy workload scenario. From this trace, we obtain the submit time, requestednumber of processors, and actual run time of applications. The characteristics of thetraces are given in Table 7.1. The submission time of parallel application is divided by1000 to increase the number of applications submitted per schedule interval as per themethodology presented by Sanjay and Vadhiyar [141]. Since the workload trace does notcontain any information about the user’s deadline and initial valuation, these were gen-erated synthetically. For a user application with a runtime r, the deadline was generatedfrom a uniform random distribution between r and 3r. The trace data of utility Grid ap-plications are currently not released and shared by any commercial utility Grid providers,thus this information also has to be generated using a random distribution. The averageinitial valuation of applications is chosen randomly between 90000 and 160000 currencyunits using uniform distribution, so that it is always greater than application executioncost. The user valuations are assigned so that at least half of users can afford to execute
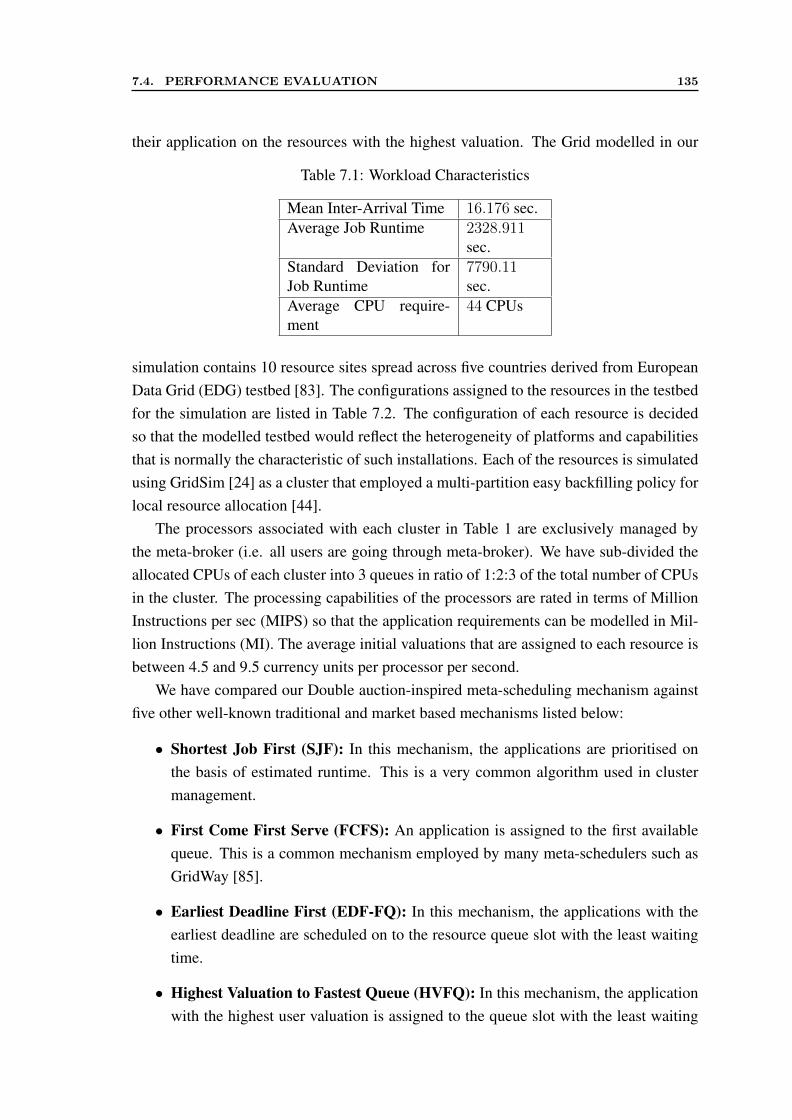
7.4. PERFORMANCE EVALUATION 135
their application on the resources with the highest valuation. The Grid modelled in our
Table 7.1: Workload Characteristics
Mean Inter-Arrival Time 16.176 sec.Average Job Runtime 2328.911
sec.Standard Deviation forJob Runtime
7790.11sec.
Average CPU require-ment
44 CPUs
simulation contains 10 resource sites spread across five countries derived from EuropeanData Grid (EDG) testbed [83]. The configurations assigned to the resources in the testbedfor the simulation are listed in Table 7.2. The configuration of each resource is decidedso that the modelled testbed would reflect the heterogeneity of platforms and capabilitiesthat is normally the characteristic of such installations. Each of the resources is simulatedusing GridSim [24] as a cluster that employed a multi-partition easy backfilling policy forlocal resource allocation [44].
The processors associated with each cluster in Table 1 are exclusively managed bythe meta-broker (i.e. all users are going through meta-broker). We have sub-divided theallocated CPUs of each cluster into 3 queues in ratio of 1:2:3 of the total number of CPUsin the cluster. The processing capabilities of the processors are rated in terms of MillionInstructions per sec (MIPS) so that the application requirements can be modelled in Mil-lion Instructions (MI). The average initial valuations that are assigned to each resource isbetween 4.5 and 9.5 currency units per processor per second.
We have compared our Double auction-inspired meta-scheduling mechanism againstfive other well-known traditional and market based mechanisms listed below:
• Shortest Job First (SJF): In this mechanism, the applications are prioritised onthe basis of estimated runtime. This is a very common algorithm used in clustermanagement.
• First Come First Serve (FCFS): An application is assigned to the first availablequeue. This is a common mechanism employed by many meta-schedulers such asGridWay [85].
• Earliest Deadline First (EDF-FQ): In this mechanism, the applications with theearliest deadline are scheduled on to the resource queue slot with the least waitingtime.
• Highest Valuation to Fastest Queue (HVFQ): In this mechanism, the applicationwith the highest user valuation is assigned to the queue slot with the least waiting
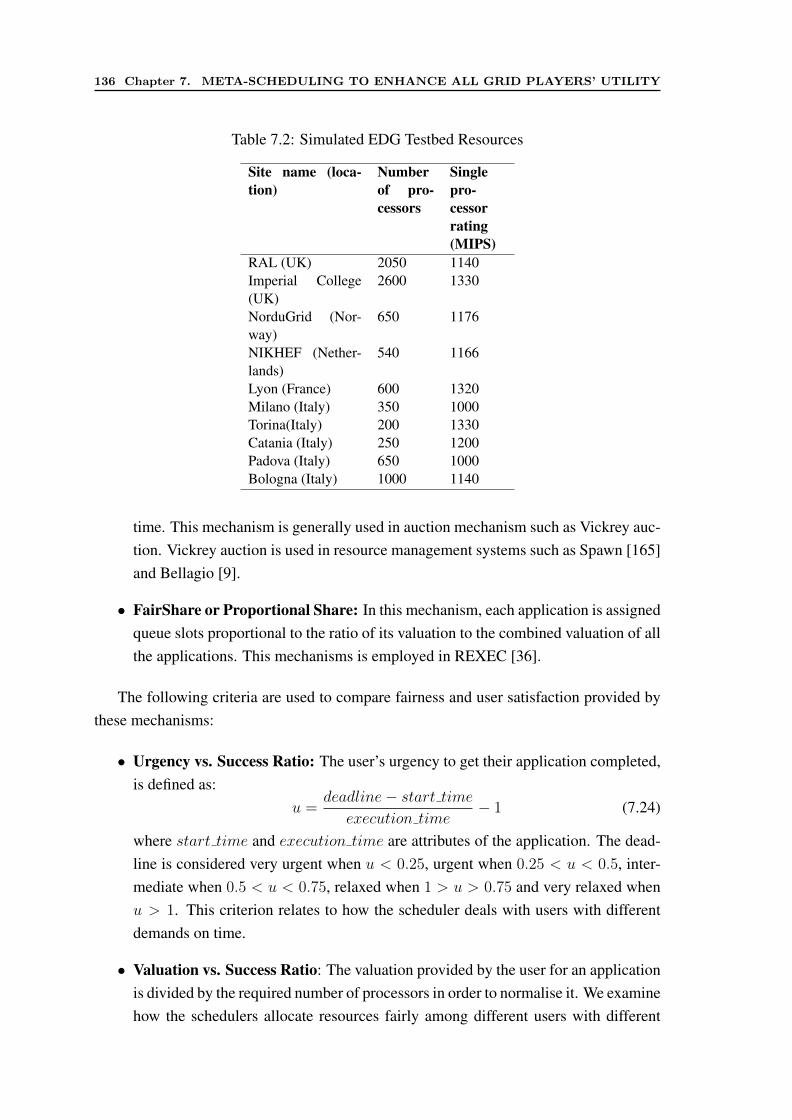
136 Chapter 7. META-SCHEDULING TO ENHANCE ALL GRID PLAYERS’ UTILITY
Table 7.2: Simulated EDG Testbed Resources
Site name (loca-tion)
Numberof pro-cessors
Singlepro-cessorrating(MIPS)
RAL (UK) 2050 1140Imperial College(UK)
2600 1330
NorduGrid (Nor-way)
650 1176
NIKHEF (Nether-lands)
540 1166
Lyon (France) 600 1320Milano (Italy) 350 1000Torina(Italy) 200 1330Catania (Italy) 250 1200Padova (Italy) 650 1000Bologna (Italy) 1000 1140
time. This mechanism is generally used in auction mechanism such as Vickrey auc-tion. Vickrey auction is used in resource management systems such as Spawn [165]and Bellagio [9].
• FairShare or Proportional Share: In this mechanism, each application is assignedqueue slots proportional to the ratio of its valuation to the combined valuation of allthe applications. This mechanisms is employed in REXEC [36].
The following criteria are used to compare fairness and user satisfaction provided bythese mechanisms:
• Urgency vs. Success Ratio: The user’s urgency to get their application completed,is defined as:
u =deadline− start time
execution time− 1 (7.24)
where start time and execution time are attributes of the application. The dead-line is considered very urgent when u < 0.25, urgent when 0.25 < u < 0.5, inter-mediate when 0.5 < u < 0.75, relaxed when 1 > u > 0.75 and very relaxed whenu > 1. This criterion relates to how the scheduler deals with users with differentdemands on time.
• Valuation vs. Success Ratio: The valuation provided by the user for an applicationis divided by the required number of processors in order to normalise it. We examinehow the schedulers allocate resources fairly among different users with different
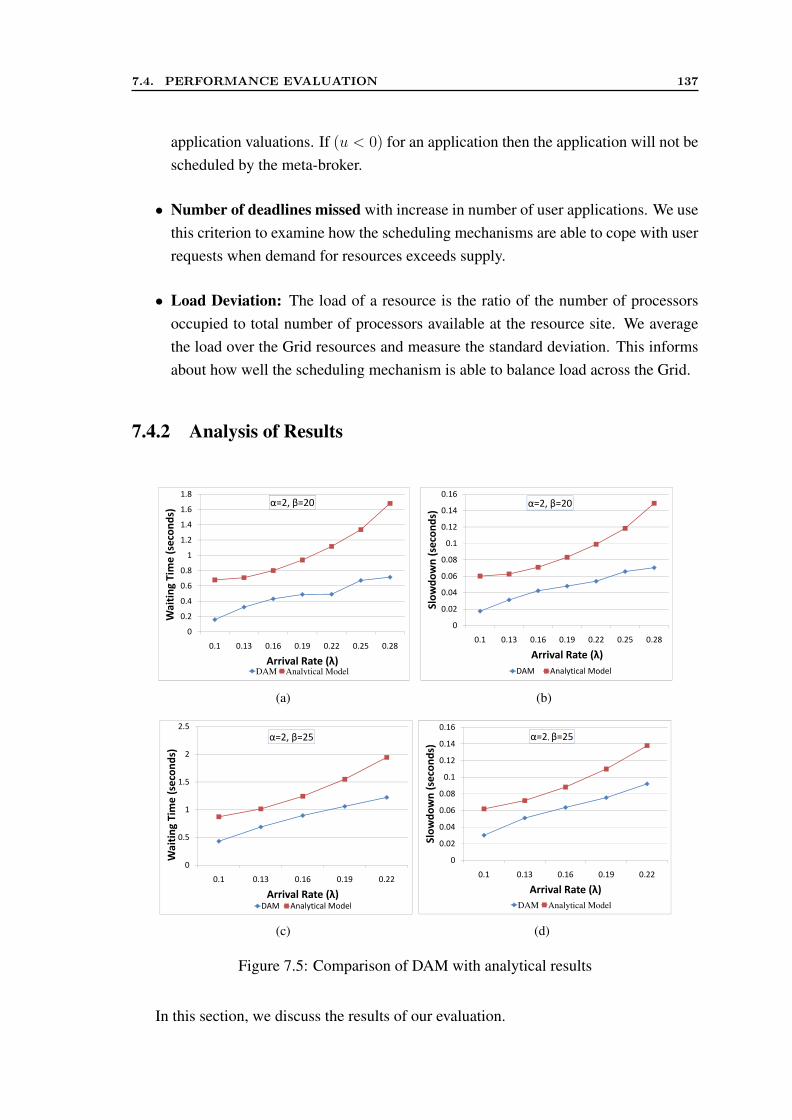
7.4. PERFORMANCE EVALUATION 137
application valuations. If (u < 0) for an application then the application will not bescheduled by the meta-broker.
• Number of deadlines missed with increase in number of user applications. We usethis criterion to examine how the scheduling mechanisms are able to cope with userrequests when demand for resources exceeds supply.
• Load Deviation: The load of a resource is the ratio of the number of processorsoccupied to total number of processors available at the resource site. We averagethe load over the Grid resources and measure the standard deviation. This informsabout how well the scheduling mechanism is able to balance load across the Grid.
7.4.2 Analysis of Results
0.8
1
1.2
1.4
1.6
1.8
Wa
itin
g T
ime
(se
con
ds)
α=2, β=20
0
0.2
0.4
0.6
0.1 0.13 0.16 0.19 0.22 0.25 0.28
Wa
itin
g T
ime
(se
con
ds)
Arrival Rate (λ)DAM Analytical ModelDAM Analytical Model
(a)
0.06
0.08
0.1
0.12
0.14
0.16
Slo
wd
ow
n (
seco
nd
s)
α=2, β=20
0
0.02
0.04
0.06
0.1 0.13 0.16 0.19 0.22 0.25 0.28
Slo
wd
ow
n (
seco
nd
s)
Arrival Rate (λ)
DAM Analytical ModelDAM Analytical Model
(b)
2.5
α=2, β=25
2
Wa
itin
g T
ime
(se
con
ds)
α=2, β=25
1.5
Wa
itin
g T
ime
(se
con
ds)
1
Wa
itin
g T
ime
(se
con
ds)
0.5
1
Wa
itin
g T
ime
(se
con
ds)
0.5
Wa
itin
g T
ime
(se
con
ds)
0
0.1 0.13 0.16 0.19 0.22
Wa
itin
g T
ime
(se
con
ds)
0.1 0.13 0.16 0.19 0.22
Arrival Rate (λ)DAM Analytical ModelDAM Analytical Model
(c)
0.06
0.08
0.1
0.12
0.14
0.16
Slo
wd
ow
n (
seco
nd
s)
α=2, β=25
0
0.02
0.04
0.06
0.1 0.13 0.16 0.19 0.22
Slo
wd
ow
n (
seco
nd
s)
Arrival Rate (λ)
DAM Analytical ModelDAM Analytical Model
(d)
Figure 7.5: Comparison of DAM with analytical results
In this section, we discuss the results of our evaluation.
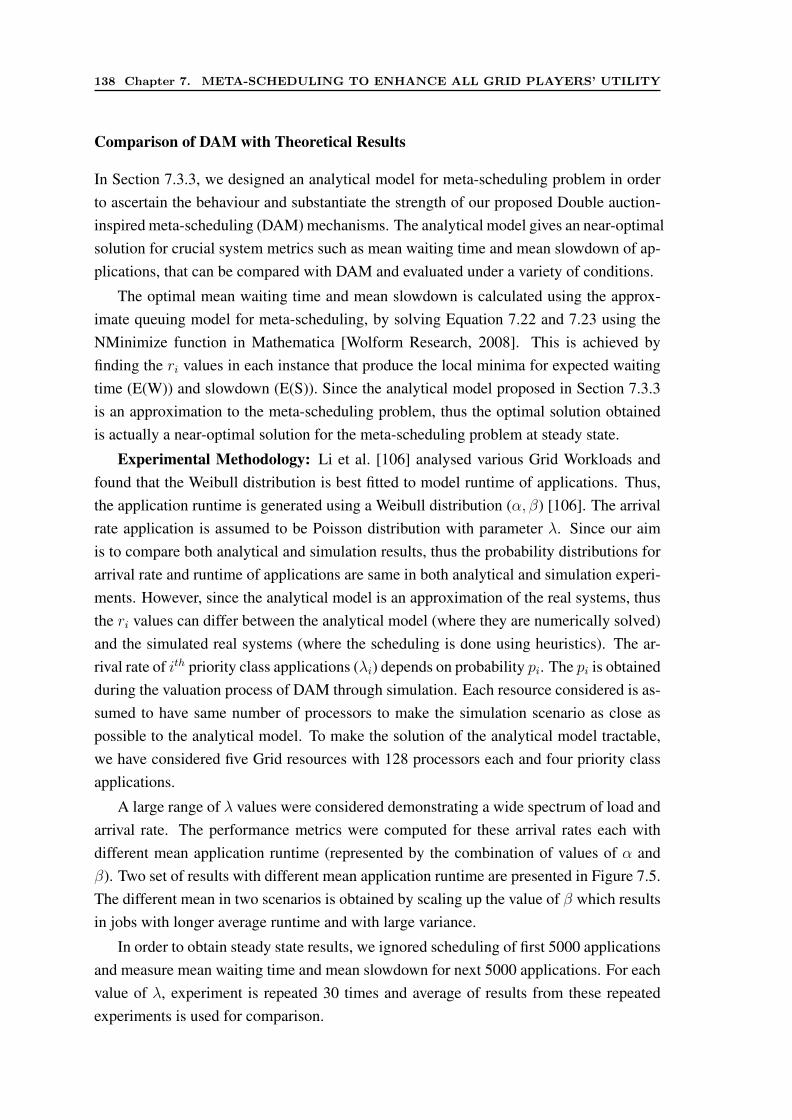
138 Chapter 7. META-SCHEDULING TO ENHANCE ALL GRID PLAYERS’ UTILITY
Comparison of DAM with Theoretical Results
In Section 7.3.3, we designed an analytical model for meta-scheduling problem in orderto ascertain the behaviour and substantiate the strength of our proposed Double auction-inspired meta-scheduling (DAM) mechanisms. The analytical model gives an near-optimalsolution for crucial system metrics such as mean waiting time and mean slowdown of ap-plications, that can be compared with DAM and evaluated under a variety of conditions.
The optimal mean waiting time and mean slowdown is calculated using the approx-imate queuing model for meta-scheduling, by solving Equation 7.22 and 7.23 using theNMinimize function in Mathematica [Wolform Research, 2008]. This is achieved byfinding the ri values in each instance that produce the local minima for expected waitingtime (E(W)) and slowdown (E(S)). Since the analytical model proposed in Section 7.3.3is an approximation to the meta-scheduling problem, thus the optimal solution obtainedis actually a near-optimal solution for the meta-scheduling problem at steady state.
Experimental Methodology: Li et al. [106] analysed various Grid Workloads andfound that the Weibull distribution is best fitted to model runtime of applications. Thus,the application runtime is generated using a Weibull distribution (α, β) [106]. The arrivalrate application is assumed to be Poisson distribution with parameter λ. Since our aimis to compare both analytical and simulation results, thus the probability distributions forarrival rate and runtime of applications are same in both analytical and simulation experi-ments. However, since the analytical model is an approximation of the real systems, thusthe ri values can differ between the analytical model (where they are numerically solved)and the simulated real systems (where the scheduling is done using heuristics). The ar-rival rate of ith priority class applications (λi) depends on probability pi. The pi is obtainedduring the valuation process of DAM through simulation. Each resource considered is as-sumed to have same number of processors to make the simulation scenario as close aspossible to the analytical model. To make the solution of the analytical model tractable,we have considered five Grid resources with 128 processors each and four priority classapplications.
A large range of λ values were considered demonstrating a wide spectrum of load andarrival rate. The performance metrics were computed for these arrival rates each withdifferent mean application runtime (represented by the combination of values of α andβ). Two set of results with different mean application runtime are presented in Figure 7.5.The different mean in two scenarios is obtained by scaling up the value of β which resultsin jobs with longer average runtime and with large variance.
In order to obtain steady state results, we ignored scheduling of first 5000 applicationsand measure mean waiting time and mean slowdown for next 5000 applications. For eachvalue of λ, experiment is repeated 30 times and average of results from these repeatedexperiments is used for comparison.
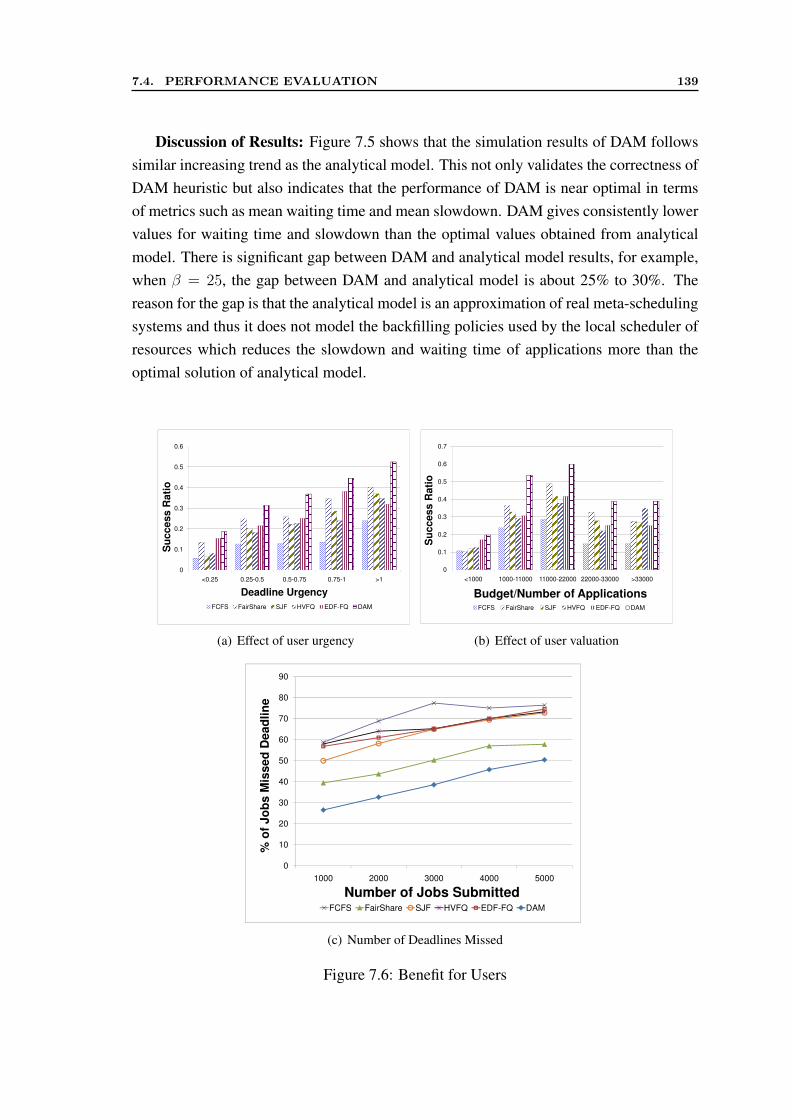
7.4. PERFORMANCE EVALUATION 139
Discussion of Results: Figure 7.5 shows that the simulation results of DAM followssimilar increasing trend as the analytical model. This not only validates the correctness ofDAM heuristic but also indicates that the performance of DAM is near optimal in termsof metrics such as mean waiting time and mean slowdown. DAM gives consistently lowervalues for waiting time and slowdown than the optimal values obtained from analyticalmodel. There is significant gap between DAM and analytical model results, for example,when β = 25, the gap between DAM and analytical model is about 25% to 30%. Thereason for the gap is that the analytical model is an approximation of real meta-schedulingsystems and thus it does not model the backfilling policies used by the local scheduler ofresources which reduces the slowdown and waiting time of applications more than theoptimal solution of analytical model.
0.3
0.4
0.5
0.6
Su
ccess R
ati
o
0
0.1
0.2
<0.25 0.25-0.5 0.5-0.75 0.75-1 >1
Su
ccess R
ati
o
Deadline Urgency
FCFS FairShare SJF HVFQ EDF-FQ DAM
(a) Effect of user urgency
0.7
0.6
0.4
0.5
Su
ccess R
ati
o
0.3
0.4
Su
ccess R
ati
o
0.2
Su
ccess R
ati
o
0
0.1
Su
ccess R
ati
o
0
<1000 1000-11000 11000-22000 22000-33000 >33000
Budget/Number of ApplicationsBudget/Number of ApplicationsFCFS FairShare SJF HVFQ EDF-FQ DAM
(b) Effect of user valuation
40
50
60
70
80
90
% o
f J
ob
s M
iss
ed
De
ad
lin
e
0
10
20
30
40
1000 2000 3000 4000 5000
% o
f J
ob
s M
iss
ed
De
ad
lin
e
Number of Jobs Submitted
FCFS FairShare SJF HVFQ EDF-FQ DAMFCFS FairShare SJF HVFQ EDF-FQ DAM
(c) Number of Deadlines Missed
Figure 7.6: Benefit for Users
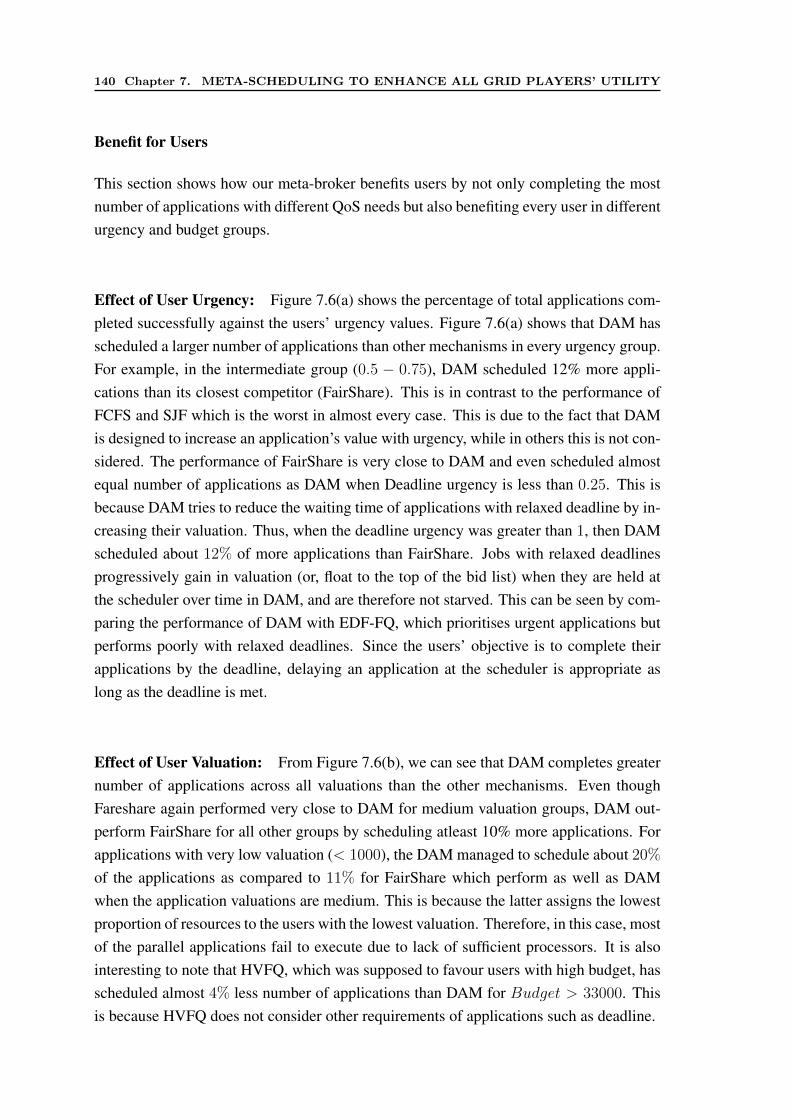
140 Chapter 7. META-SCHEDULING TO ENHANCE ALL GRID PLAYERS’ UTILITY
Benefit for Users
This section shows how our meta-broker benefits users by not only completing the mostnumber of applications with different QoS needs but also benefiting every user in differenturgency and budget groups.
Effect of User Urgency: Figure 7.6(a) shows the percentage of total applications com-pleted successfully against the users’ urgency values. Figure 7.6(a) shows that DAM hasscheduled a larger number of applications than other mechanisms in every urgency group.For example, in the intermediate group (0.5 − 0.75), DAM scheduled 12% more appli-cations than its closest competitor (FairShare). This is in contrast to the performance ofFCFS and SJF which is the worst in almost every case. This is due to the fact that DAMis designed to increase an application’s value with urgency, while in others this is not con-sidered. The performance of FairShare is very close to DAM and even scheduled almostequal number of applications as DAM when Deadline urgency is less than 0.25. This isbecause DAM tries to reduce the waiting time of applications with relaxed deadline by in-creasing their valuation. Thus, when the deadline urgency was greater than 1, then DAMscheduled about 12% of more applications than FairShare. Jobs with relaxed deadlinesprogressively gain in valuation (or, float to the top of the bid list) when they are held atthe scheduler over time in DAM, and are therefore not starved. This can be seen by com-paring the performance of DAM with EDF-FQ, which prioritises urgent applications butperforms poorly with relaxed deadlines. Since the users’ objective is to complete theirapplications by the deadline, delaying an application at the scheduler is appropriate aslong as the deadline is met.
Effect of User Valuation: From Figure 7.6(b), we can see that DAM completes greaternumber of applications across all valuations than the other mechanisms. Even thoughFareshare again performed very close to DAM for medium valuation groups, DAM out-perform FairShare for all other groups by scheduling atleast 10% more applications. Forapplications with very low valuation (< 1000), the DAM managed to schedule about 20%
of the applications as compared to 11% for FairShare which perform as well as DAMwhen the application valuations are medium. This is because the latter assigns the lowestproportion of resources to the users with the lowest valuation. Therefore, in this case, mostof the parallel applications fail to execute due to lack of sufficient processors. It is alsointeresting to note that HVFQ, which was supposed to favour users with high budget, hasscheduled almost 4% less number of applications than DAM for Budget > 33000. Thisis because HVFQ does not consider other requirements of applications such as deadline.
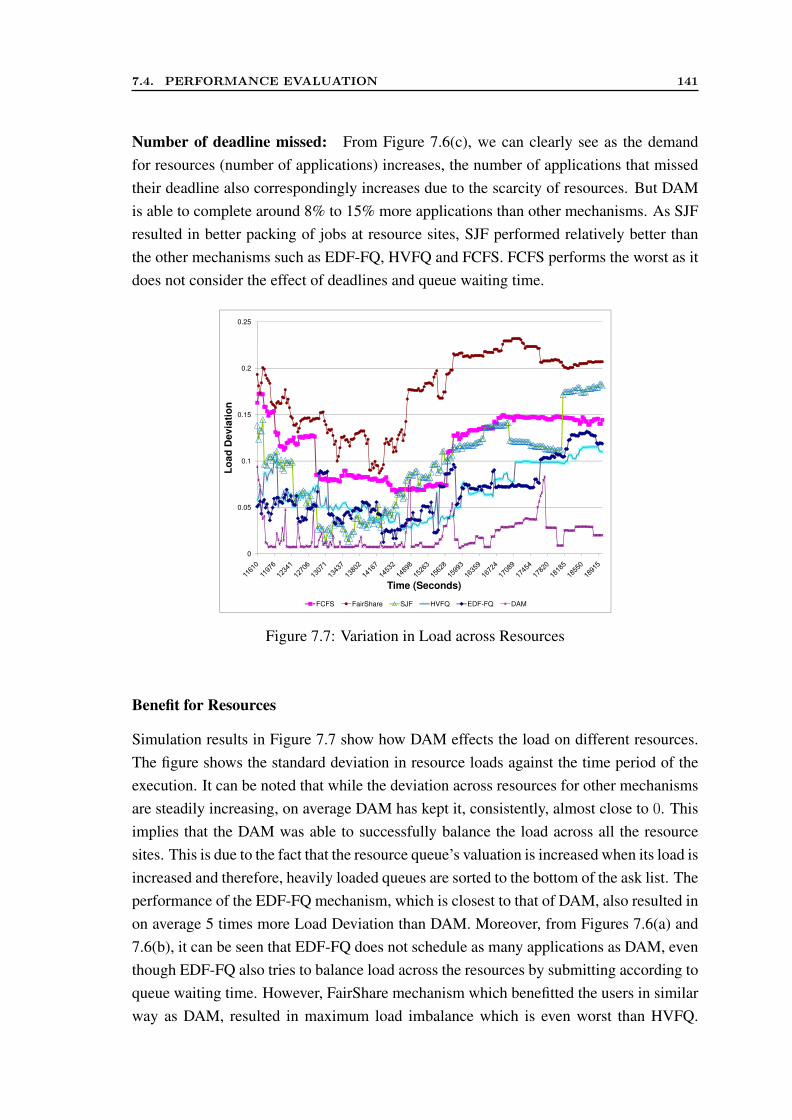
7.4. PERFORMANCE EVALUATION 141
Number of deadline missed: From Figure 7.6(c), we can clearly see as the demandfor resources (number of applications) increases, the number of applications that missedtheir deadline also correspondingly increases due to the scarcity of resources. But DAMis able to complete around 8% to 15% more applications than other mechanisms. As SJFresulted in better packing of jobs at resource sites, SJF performed relatively better thanthe other mechanisms such as EDF-FQ, HVFQ and FCFS. FCFS performs the worst as itdoes not consider the effect of deadlines and queue waiting time.
0.25
0.2
0.15
Lo
ad
Devia
tio
n
0.15
Lo
ad
Devia
tio
n
0.1
Lo
ad
Devia
tio
n
0.05
0
Time (Seconds)
FCFS FairShare SJF HVFQ EDF-FQ DAM
Figure 7.7: Variation in Load across Resources
Benefit for Resources
Simulation results in Figure 7.7 show how DAM effects the load on different resources.The figure shows the standard deviation in resource loads against the time period of theexecution. It can be noted that while the deviation across resources for other mechanismsare steadily increasing, on average DAM has kept it, consistently, almost close to 0. Thisimplies that the DAM was able to successfully balance the load across all the resourcesites. This is due to the fact that the resource queue’s valuation is increased when its load isincreased and therefore, heavily loaded queues are sorted to the bottom of the ask list. Theperformance of the EDF-FQ mechanism, which is closest to that of DAM, also resulted inon average 5 times more Load Deviation than DAM. Moreover, from Figures 7.6(a) and7.6(b), it can be seen that EDF-FQ does not schedule as many applications as DAM, eventhough EDF-FQ also tries to balance load across the resources by submitting according toqueue waiting time. However, FairShare mechanism which benefitted the users in similarway as DAM, resulted in maximum load imbalance which is even worst than HVFQ.
142 Chapter 7. META-SCHEDULING TO ENHANCE ALL GRID PLAYERS’ UTILITY
Thus, DAM is not only providing benefit to users but also providing benefit to resourceproviders by equally dividing load between them.
7.5 Summary
We have presented a market-oriented meta-scheduling policy for allocating multiple ap-plications on distributed resources within a Grid. The resource sites are organised as acollection of queues with different capabilities and waiting times. The goal of the sched-uler is to maximise the users’ utility by taking into account their deadlines and the valueattached to their applications, and to maximise the resource providers’ utility by fairly al-locating the applications across the Grid. The meta-broker also has to benefit all users bypreventing starvation of applications that have relaxed deadlines or low valuation, whilekeeping effect on other crucial system metrics such as mean waiting time and slowdownat minimum level.
Experimental evaluation of the proposed mechanism against common mechanisms,such as SJF, HVFQ, EDF-FQ, FCFS, and FairShare, used in other meta-schedulers hasshowed that DAM maximises the utility of both users and resource providers across allthe target metrics. DAM is not only able to schedule about 8% to 15% more user ap-plications, but also has the highest success ratio in almost all the groups for applicationswith different deadlines and different valuations. For the users with the lowest budget(< 1000), the success ratio of their applications is increased by almost 10%. Similarly,DAM also maximises the utility of resource side by equally distributing the workloadaccording to capacity of resource sites. Thus, DAM is able to improve the balancingof load across the constituent resources of the Grid with almost zero load deviation. Inmaximising providers’ utility, DAM even outperforms the FairShare mechanism whichprovides similar utility to users as DAM. The key reason here is that the valuation metricsare able to capture information which is important to both users and resource providers,and therefore the meta-broker schedules applications more effectively.
Thus, we demonstrate that, by considering both system metrics and market parame-ters, we can enable more effective scheduling which maximises both users’ and resourceproviders’ utility. In the next chapter, we will describe how the meta-broker can be im-plemented within a Grid exchange environment.
Chapter 8
Market Exchange and Meta-BrokerImplementation
This chapter presents the implementation of our meta-broker within a market exchange(named as ‘Mandi’) framework. The resulting system aims to provide a market-orientedmeta-scheduling environment in which users can trade and reserve resources in utilityGrids. The architecture of Mandi is designed to overcome the limitations of the existingGrid Market infrastructures [4] [121], which were discussed in Chapter 2. The Mandisoftware also serves as a proof of concept for this thesis. In the next section, the motiva-tion for designing Mandi is discussed. In the remaining sections of the chapter, marketexchange’s requirements, its architectural design, and the implementation of “Mandi” arediscussed.
8.1 Motivation
Emerging utility computing paradigms such as Clouds are promising to deliver highlyscalable HPC infrastructure on-demand. In Chapters 2 and 3, we discussed how a marketexchange can ease the process of buying and selling of compute resources in these utilityGrids. A market exchange provides a shared trading infrastructure which can enableinteraction between different market-oriented systems.
As described in Chapter 3, our proposed meta-broker architecture distinguishes itselffrom other meta-scheduling systems by separating the job submission and monitoring(performed by the user brokers) from the resource allocation (performed by the meta-broker). The existing market exchange systems, such as Catnet [54], Bellagio [9], GridE-con [4] and SORMA [121], do not allow such separation, which makes them difficult tocustomise. In addition, they have been designed to support a limited number of tradingprotocols. This restricts the participation of resource providers using a trading protocol of
143
144 Chapter 8. MARKET EXCHANGE AND META-BROKER IMPLEMENTATION
their own choice. The flexibility to choose trading and pricing protocols is critical sinceit can impact the participants utility enormously depending on the current demand andsupply. Thus, a market exchange requires to support diverse services [16] including (a)registration, buying and selling; (b) advertisement of free resources; (c) coexistence ofmultiple market models or negotiation protocols such as auction; and (d) Grid resourcebrokers and RMSs to discover resources/services and their attributes (e.g., access priceand usage constraints) that meet user QoS requirements.
Therefore, we introduce the design of a market exchange framework ‘Mandi’, whichsupports the above features, and thus overcomes some of the short-comings of the existingsystems, by allowing the co-existence of multiple negotiations of different types. We aimto develop a light weight and platform independent service-oriented market architecturewhose features can be accessed easily by current Grid systems. This chapter describes theimplementation of our meta-broker architecture (proposed in Chapter 3) within Mandimarket exchange, and how it enables the reservation of resources from multiple sites.
8.2 Market Exchange Requirements
The market exchange framework requirements can be divided into two categories: infras-tructure and market requirements.
8.2.1 Infrastructure Requirements
(a) Scalability: Since, the increase in the number of resource requests can affectthe performance of the market exchange, thus the scalability of the exchange canbecome an issue. The exchange architecture should be designed such that accessto market services be least effected by the number of service requests. In addi-tion, it should guarantee the best efficiency in matching the consumers demand andprovider’s supply.
(b) Interface Requirements and Grid Heterogeneity: The user interface plays animportant role in allowing the access of the market exchange by a wide variety ofusers. Depending on how a user wants to access the market, different types of in-terfaces should be provided. In Grids, many market based brokers [85] [163] easethe process of accessing the Cloud resources. Similarly, on the resource providerside, heterogeneous resource brokers [104] with market based capabilities are avail-able. Thus, these brokers should seamlessly access the market exchange’s serviceswhenever required by invoking simple platform independent exchange APIs.
(c) Fault Tolerance: the market exchange should be able to resume its services fromthe closest point before the failure.
8.2. MARKET EXCHANGE REQUIREMENTS 145
(d) Security: To avoid spamming, there should be a security system for user registra-tion. All the services of the exchange must be accessed by authorised users.
8.2.2 Market Requirements
(a) Multiple types of Application Models and Compute Services: The user resourcerequirements can vary according to their application model. For example, to run anMPI application, users may want to lease all the compute resources from same re-source provider, which gives much better bandwidth for communicating processes.Thus, users can have different types of compute resource demands depending ontheir applications. Similarly, resource providers can advertise different type of re-sources such as storage and virtual machines. Thus, the market exchange shouldbe generic enough to allow the submission of different types of compute resourcerequests and services.
(b) Multiple User Objectives: Users may wish to satisfy different objectives at thesame time. Some possible objectives include receiving the results in the minimumpossible time or within a set deadline, reducing the amount of data transfer and du-plication, or ensuring minimum expense for an execution or minimum usage of al-located quota of resources. Different tasks within an application may be associatedwith different objectives and different QoS requirements. The exchange should,therefore, ensure that different matching strategies meeting different objectives canbe employed whenever required.
(c) Resource Discovery: Users may have different resource requirements dependingon their application model and QoS needs. Thus, the exchange should be able toaggregate different compute resources and should allow users to access and discoverthem on demand.
(d) Support for Different Market Models: In Grids, several market based mecha-nisms have been proposed for trading resources using market models such as auc-tions and commodity market [5]. Each mechanism, such as the English auction andthe Vickery auction, has different matching and pricing strategies and has their ownadvantages and disadvantages. Thus, the exchange should be generic enough tosupport as many market models as possible.
(e) Coexistence/Isolation of Market Models: Similar to real world markets, the mar-ket exchange should support concurrent trading of compute services by differentnegotiation protocols such as auction. For example, Double auction and Vickeryauction can coexist simultaneously and users can participate in each of them.
146 Chapter 8. MARKET EXCHANGE AND META-BROKER IMPLEMENTATION
(f) Support for Holding, Joining and Discovery of Auctions: Users can have re-quirements that may not be fulfilled by currently available compute resources, andthus, may want to hold their own auctions and invite bids. Moreover, any user candiscover these auctions and join them if necessary.
The following sections present the architecture, design, and implementation of Mandimarket exchange that takes into account the challenges mentioned so far, and abstracts theheterogeneity of the environment at all levels from the end-user.
8.3 Mandi Architecture and Design
8.3.1 Design Considerations and Solutions
The primary aim of Mandi is to provide a marketplace where the consumer’s resourcerequests and the provider’s compute resources can be aggregated, and matched using dif-ferent market models. The main challenges and the way they are approached in Mandidesign are as following:
(a) Flexibility in choosing market model and user objectives: As discussed variousmarket models or negotiation protocols can be employed by users to trade com-pute resources. Each market model has different requirements [5]. For example,in the commodity market model, consumers search the current state of the marketand immediately buy some compute service. This requires synchronous access tothat instance of compute resource. In the case of an auction, there is a clearing timewhen the winner selection is done. In addition, any user can request to hold auctionswhich require separation of each auction. Thus, the components within Mandi aredesigned to be modular and cleanly separated on the basis of functionality. Eachof them talks through the persistence database that constitutes a synchronisationpoint in the whole system. Different auction protocols are abstracted as “one-sidedauction” and “two-sided auction” which can be extended to add new auction mech-anisms. Each auction type is characterised by the winner selection mechanism. Thereservation of matched services is separated from the trading mechanisms to al-low flexibility and coexistence of different trading models such as commodity andauction market.
(b) Support heterogeneous compute resources and applications: To allow hetero-geneous Resource Management Systems (RMSs) and brokers to access market ex-change services, Mandi’s architecture is needed to be platform independent. Currentmarket exchanges such as Sorma [121] handle the heterogeneity by implementingplug-in for each resource management system. This is not feasible in the long term
8.3. MANDI ARCHITECTURE AND DESIGN 147
since APIs of different resource providers for job submission, reservation and mon-itoring may get updated with time. Thus, Mandi is designed to handle mainly theallocation of resources to users applications, while the job submission, monitor-ing and execution are left to user brokers. Mandi’s services are available throughplatform independent APIs implemented by using Web Services.
(c) Fault tolerance: Mandi can handle failures at two stages: during trading, and dur-ing reservation. The failure during reservation can occur due to network problems,and over subscription of resources. In the case of network problem, the failed re-source requests will be considered in the next scheduling cycle. The reservationfailure due to resource oversubscription is handled by consumers and providers.
To avoid failures during trading, the resources are not reserved, unless all the tasksof an application are mapped. To avoid allocation of one resource to multiple appli-cations, one compute resource is allowed to be traded only in one negotiation.
In addition, the persistence database protects the Market Exchange against failureduring trading. The state of Mandi is periodically saved in the database. Thus,Mandi can resume its work from where it was left.
(d) Scalability: Most of the Mandi’s components work independently and interactthrough the database. This facilitates the scalable implementation of Mandi as eachcomponent can be distributed across different servers accessing a shared database.Since, Mandi handles only the resource allocation and delegates the management ofjob submission and execution to the participating brokers and providers RMS, thusmost of threads in Mandi are light weight and short lived.
8.3.2 Architectural Components
The architecture proposed in this work is inspired by the concepts of the ‘Open Market’where any user can join, sell and buy their compute services. Figure 8.1 shows the serviceoriented architecture design of the Mandi’s framework and its main services. Mandi isorganised into two main services i.e. the user services, and the core services consistingof the meta-broker service the reservation service and the database service. The corefunctionality of each layer is described in the following sections. Each of the services canrun on different machines independently, and communicate with only database service.
User Services
The user services hide all the internal components of Mandi and implement all the ser-vices visible to market participants. The services of Mandi are exposed to consumers and
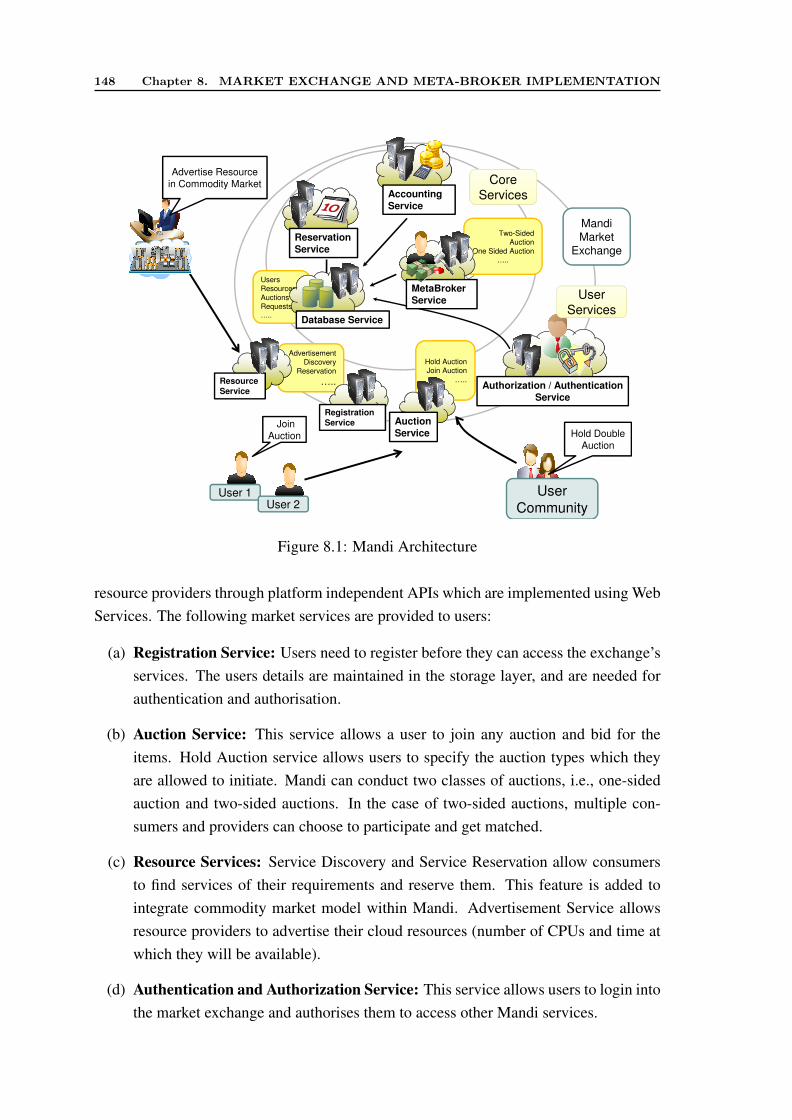
148 Chapter 8. MARKET EXCHANGE AND META-BROKER IMPLEMENTATION
MandiMarket
Exchange
Accounting
Service
Reservation
Service
Core
Services
User
Services
�Us
er 3
Advertise Resource
in Commodity Market
UsersResources
AuctionsRequests…..
Two-Sided Auction
One Sided Auction…..
Database Service
MetaBroker
Service
AdvertisementDiscovery
Reservation
….. Authorization / Authentication
Service
Resource
Service
User 1 User
Community
Hold Double
Auction
Join
Auction
User 2
Hold AuctionJoin Auction
…..
Registration
Service Auction
Service
Figure 8.1: Mandi Architecture
resource providers through platform independent APIs which are implemented using WebServices. The following market services are provided to users:
(a) Registration Service: Users need to register before they can access the exchange’sservices. The users details are maintained in the storage layer, and are needed forauthentication and authorisation.
(b) Auction Service: This service allows a user to join any auction and bid for theitems. Hold Auction service allows users to specify the auction types which theyare allowed to initiate. Mandi can conduct two classes of auctions, i.e., one-sidedauction and two-sided auctions. In the case of two-sided auctions, multiple con-sumers and providers can choose to participate and get matched.
(c) Resource Services: Service Discovery and Service Reservation allow consumersto find services of their requirements and reserve them. This feature is added tointegrate commodity market model within Mandi. Advertisement Service allowsresource providers to advertise their cloud resources (number of CPUs and time atwhich they will be available).
(d) Authentication and Authorization Service: This service allows users to login intothe market exchange and authorises them to access other Mandi services.
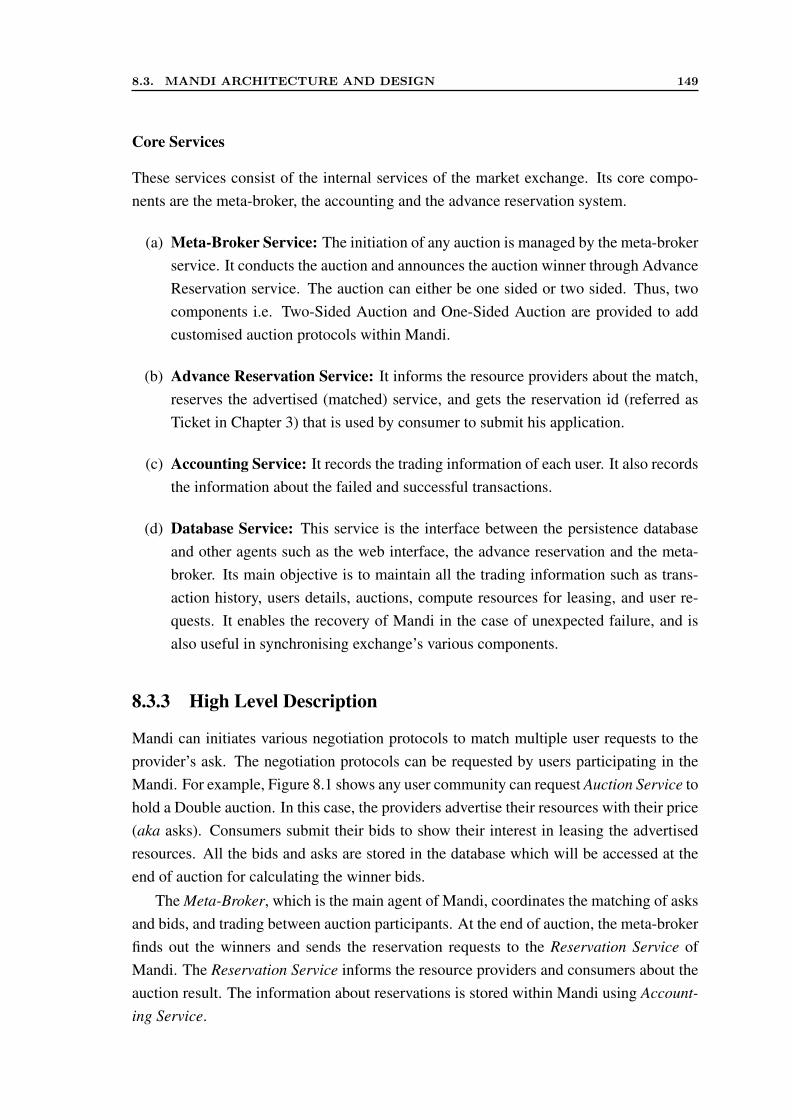
8.3. MANDI ARCHITECTURE AND DESIGN 149
Core Services
These services consist of the internal services of the market exchange. Its core compo-nents are the meta-broker, the accounting and the advance reservation system.
(a) Meta-Broker Service: The initiation of any auction is managed by the meta-brokerservice. It conducts the auction and announces the auction winner through AdvanceReservation service. The auction can either be one sided or two sided. Thus, twocomponents i.e. Two-Sided Auction and One-Sided Auction are provided to addcustomised auction protocols within Mandi.
(b) Advance Reservation Service: It informs the resource providers about the match,reserves the advertised (matched) service, and gets the reservation id (referred asTicket in Chapter 3) that is used by consumer to submit his application.
(c) Accounting Service: It records the trading information of each user. It also recordsthe information about the failed and successful transactions.
(d) Database Service: This service is the interface between the persistence databaseand other agents such as the web interface, the advance reservation and the meta-broker. Its main objective is to maintain all the trading information such as trans-action history, users details, auctions, compute resources for leasing, and user re-quests. It enables the recovery of Mandi in the case of unexpected failure, and isalso useful in synchronising exchange’s various components.
8.3.3 High Level Description
Mandi can initiates various negotiation protocols to match multiple user requests to theprovider’s ask. The negotiation protocols can be requested by users participating in theMandi. For example, Figure 8.1 shows any user community can request Auction Service tohold a Double auction. In this case, the providers advertise their resources with their price(aka asks). Consumers submit their bids to show their interest in leasing the advertisedresources. All the bids and asks are stored in the database which will be accessed at theend of auction for calculating the winner bids.
The Meta-Broker, which is the main agent of Mandi, coordinates the matching of asksand bids, and trading between auction participants. At the end of auction, the meta-brokerfinds out the winners and sends the reservation requests to the Reservation Service ofMandi. The Reservation Service informs the resource providers and consumers about theauction result. The information about reservations is stored within Mandi using Account-ing Service.
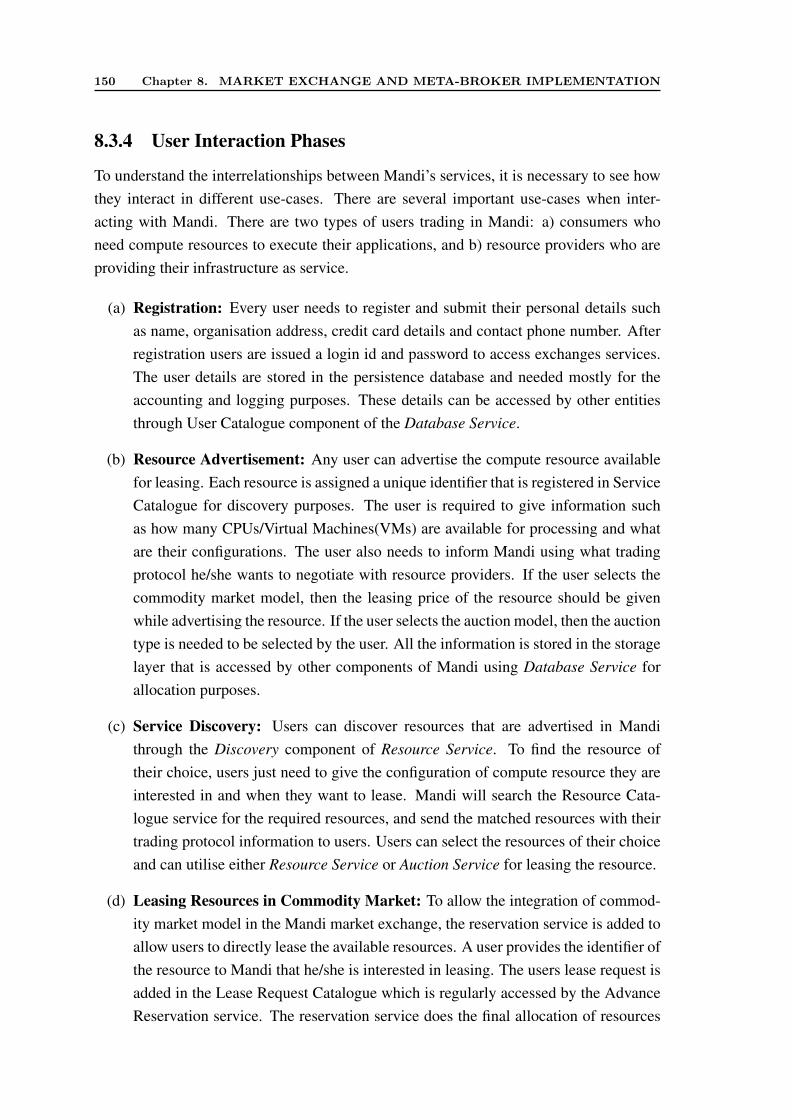
150 Chapter 8. MARKET EXCHANGE AND META-BROKER IMPLEMENTATION
8.3.4 User Interaction Phases
To understand the interrelationships between Mandi’s services, it is necessary to see howthey interact in different use-cases. There are several important use-cases when inter-acting with Mandi. There are two types of users trading in Mandi: a) consumers whoneed compute resources to execute their applications, and b) resource providers who areproviding their infrastructure as service.
(a) Registration: Every user needs to register and submit their personal details suchas name, organisation address, credit card details and contact phone number. Afterregistration users are issued a login id and password to access exchanges services.The user details are stored in the persistence database and needed mostly for theaccounting and logging purposes. These details can be accessed by other entitiesthrough User Catalogue component of the Database Service.
(b) Resource Advertisement: Any user can advertise the compute resource availablefor leasing. Each resource is assigned a unique identifier that is registered in ServiceCatalogue for discovery purposes. The user is required to give information suchas how many CPUs/Virtual Machines(VMs) are available for processing and whatare their configurations. The user also needs to inform Mandi using what tradingprotocol he/she wants to negotiate with resource providers. If the user selects thecommodity market model, then the leasing price of the resource should be givenwhile advertising the resource. If the user selects the auction model, then the auctiontype is needed to be selected by the user. All the information is stored in the storagelayer that is accessed by other components of Mandi using Database Service forallocation purposes.
(c) Service Discovery: Users can discover resources that are advertised in Mandithrough the Discovery component of Resource Service. To find the resource oftheir choice, users just need to give the configuration of compute resource they areinterested in and when they want to lease. Mandi will search the Resource Cata-logue service for the required resources, and send the matched resources with theirtrading protocol information to users. Users can select the resources of their choiceand can utilise either Resource Service or Auction Service for leasing the resource.
(d) Leasing Resources in Commodity Market: To allow the integration of commod-ity market model in the Mandi market exchange, the reservation service is added toallow users to directly lease the available resources. A user provides the identifier ofthe resource to Mandi that he/she is interested in leasing. The users lease request isadded in the Lease Request Catalogue which is regularly accessed by the AdvanceReservation service. The reservation service does the final allocation of resources
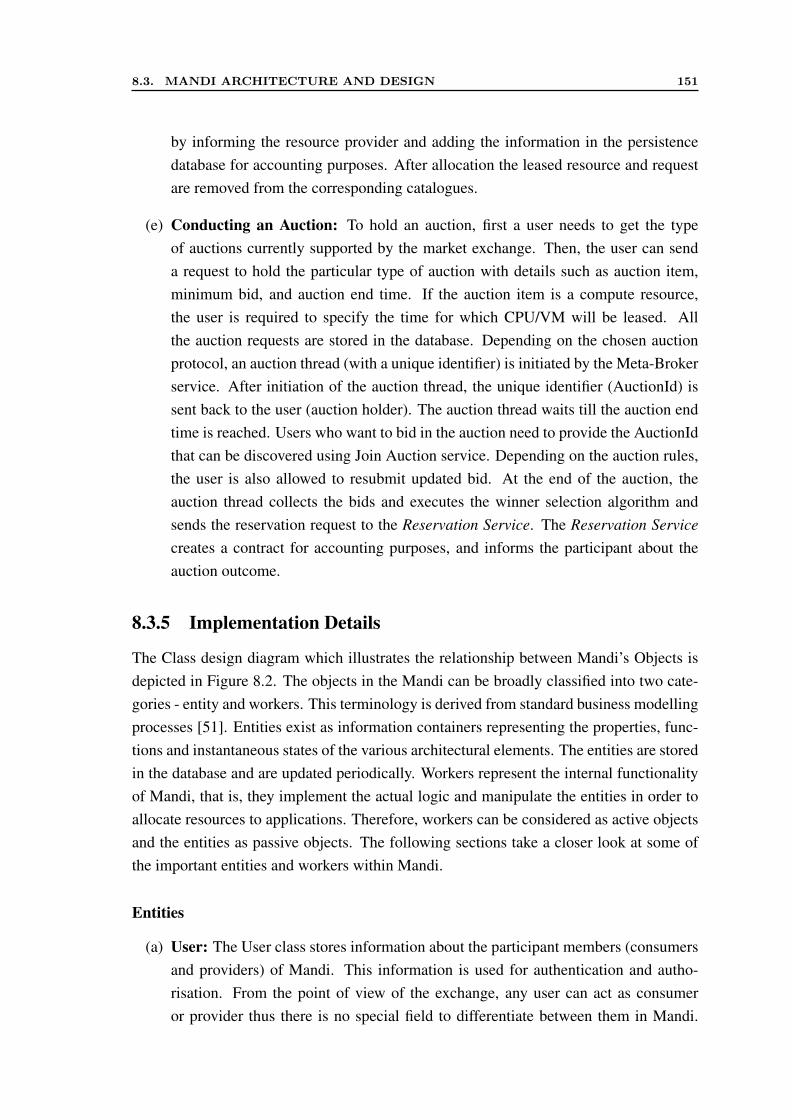
8.3. MANDI ARCHITECTURE AND DESIGN 151
by informing the resource provider and adding the information in the persistencedatabase for accounting purposes. After allocation the leased resource and requestare removed from the corresponding catalogues.
(e) Conducting an Auction: To hold an auction, first a user needs to get the typeof auctions currently supported by the market exchange. Then, the user can senda request to hold the particular type of auction with details such as auction item,minimum bid, and auction end time. If the auction item is a compute resource,the user is required to specify the time for which CPU/VM will be leased. Allthe auction requests are stored in the database. Depending on the chosen auctionprotocol, an auction thread (with a unique identifier) is initiated by the Meta-Brokerservice. After initiation of the auction thread, the unique identifier (AuctionId) issent back to the user (auction holder). The auction thread waits till the auction endtime is reached. Users who want to bid in the auction need to provide the AuctionIdthat can be discovered using Join Auction service. Depending on the auction rules,the user is also allowed to resubmit updated bid. At the end of the auction, theauction thread collects the bids and executes the winner selection algorithm andsends the reservation request to the Reservation Service. The Reservation Servicecreates a contract for accounting purposes, and informs the participant about theauction outcome.
8.3.5 Implementation Details
The Class design diagram which illustrates the relationship between Mandi’s Objects isdepicted in Figure 8.2. The objects in the Mandi can be broadly classified into two cate-gories - entity and workers. This terminology is derived from standard business modellingprocesses [51]. Entities exist as information containers representing the properties, func-tions and instantaneous states of the various architectural elements. The entities are storedin the database and are updated periodically. Workers represent the internal functionalityof Mandi, that is, they implement the actual logic and manipulate the entities in order toallocate resources to applications. Therefore, workers can be considered as active objectsand the entities as passive objects. The following sections take a closer look at some ofthe important entities and workers within Mandi.
Entities
(a) User: The User class stores information about the participant members (consumersand providers) of Mandi. This information is used for authentication and autho-risation. From the point of view of the exchange, any user can act as consumeror provider thus there is no special field to differentiate between them in Mandi.
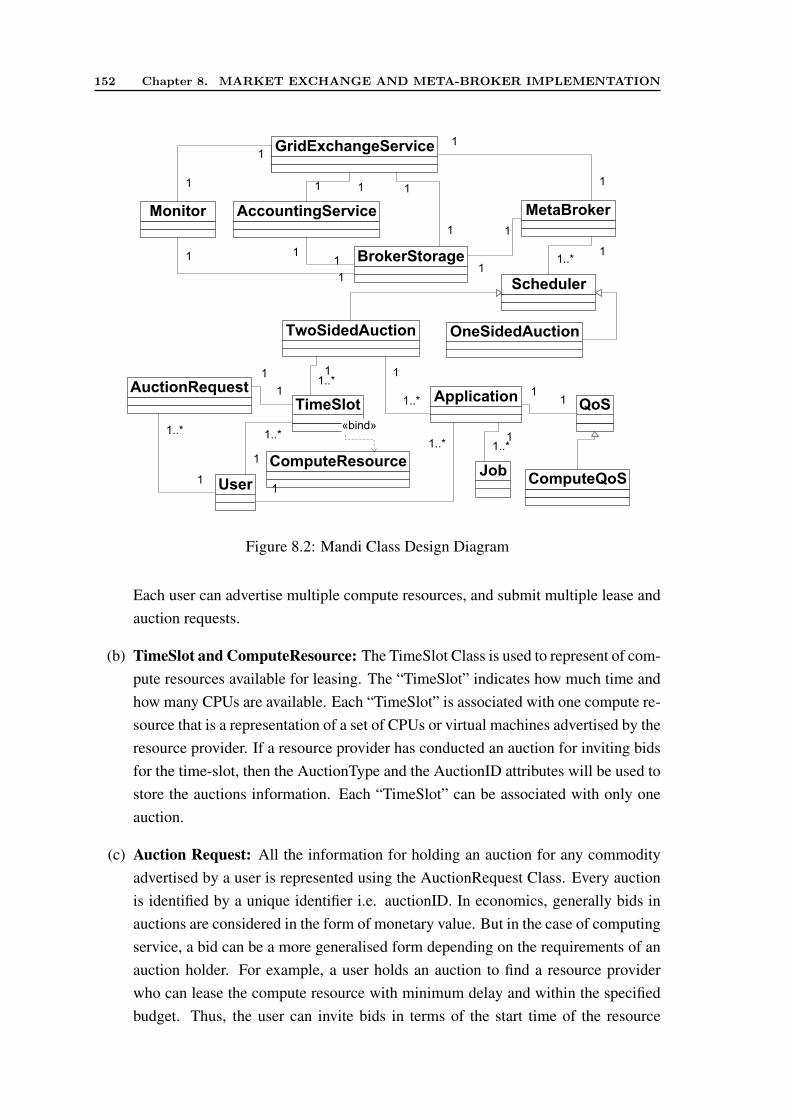
152 Chapter 8. MARKET EXCHANGE AND META-BROKER IMPLEMENTATION
GridExchangeService
Monitor
BrokerStorage
AccountingService MetaBroker
Scheduler
TwoSidedAuction OneSidedAuction
AuctionRequestTimeSlot
ApplicationQoS
ComputeResource
UserJob
ComputeQoS
1
1 11 1
1
1
1
1
111
1
1
11..*
11..*
1
1..*1
1
11..*
1..*
1
1..*
1
1
1
«bind»
1
1..*
Figure 8.2: Mandi Class Design Diagram
Each user can advertise multiple compute resources, and submit multiple lease andauction requests.
(b) TimeSlot and ComputeResource: The TimeSlot Class is used to represent of com-pute resources available for leasing. The “TimeSlot” indicates how much time andhow many CPUs are available. Each “TimeSlot” is associated with one compute re-source that is a representation of a set of CPUs or virtual machines advertised by theresource provider. If a resource provider has conducted an auction for inviting bidsfor the time-slot, then the AuctionType and the AuctionID attributes will be used tostore the auctions information. Each “TimeSlot” can be associated with only oneauction.
(c) Auction Request: All the information for holding an auction for any commodityadvertised by a user is represented using the AuctionRequest Class. Every auctionis identified by a unique identifier i.e. auctionID. In economics, generally bids inauctions are considered in the form of monetary value. But in the case of computingservice, a bid can be a more generalised form depending on the requirements of anauction holder. For example, a user holds an auction to find a resource providerwho can lease the compute resource with minimum delay and within the specifiedbudget. Thus, the user can invite bids in terms of the start time of the resource
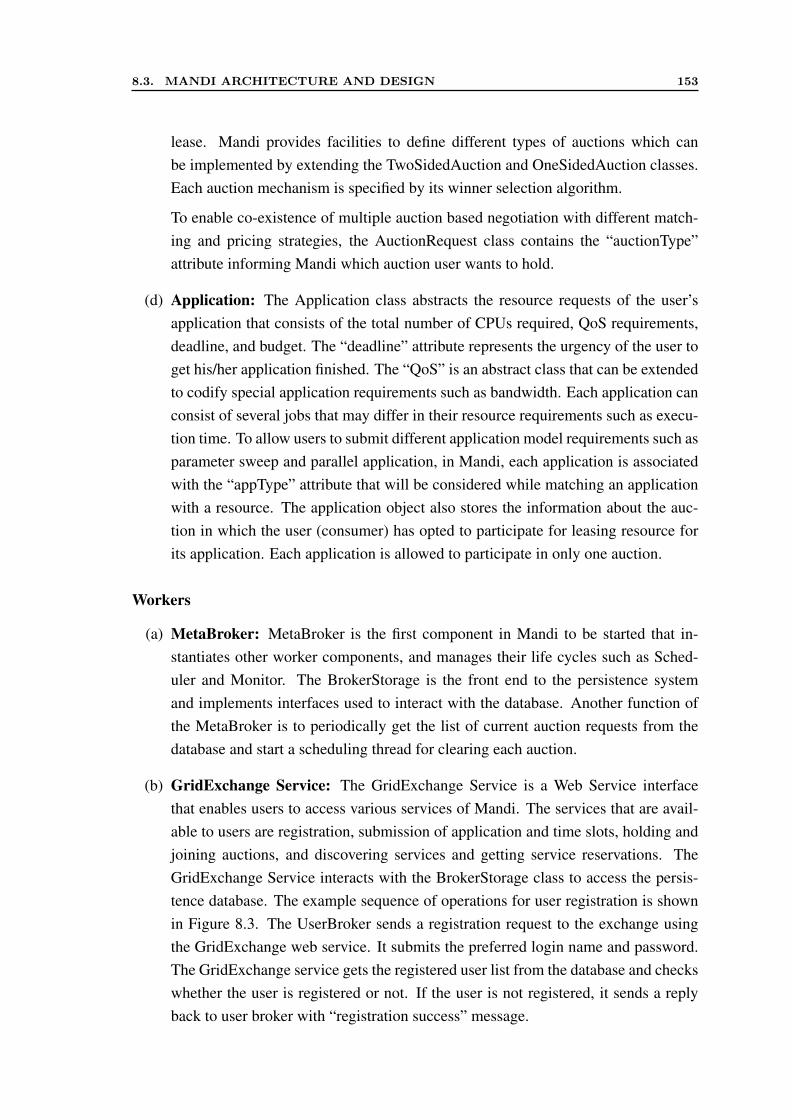
8.3. MANDI ARCHITECTURE AND DESIGN 153
lease. Mandi provides facilities to define different types of auctions which canbe implemented by extending the TwoSidedAuction and OneSidedAuction classes.Each auction mechanism is specified by its winner selection algorithm.
To enable co-existence of multiple auction based negotiation with different match-ing and pricing strategies, the AuctionRequest class contains the “auctionType”attribute informing Mandi which auction user wants to hold.
(d) Application: The Application class abstracts the resource requests of the user’sapplication that consists of the total number of CPUs required, QoS requirements,deadline, and budget. The “deadline” attribute represents the urgency of the user toget his/her application finished. The “QoS” is an abstract class that can be extendedto codify special application requirements such as bandwidth. Each application canconsist of several jobs that may differ in their resource requirements such as execu-tion time. To allow users to submit different application model requirements such asparameter sweep and parallel application, in Mandi, each application is associatedwith the “appType” attribute that will be considered while matching an applicationwith a resource. The application object also stores the information about the auc-tion in which the user (consumer) has opted to participate for leasing resource forits application. Each application is allowed to participate in only one auction.
Workers
(a) MetaBroker: MetaBroker is the first component in Mandi to be started that in-stantiates other worker components, and manages their life cycles such as Sched-uler and Monitor. The BrokerStorage is the front end to the persistence systemand implements interfaces used to interact with the database. Another function ofthe MetaBroker is to periodically get the list of current auction requests from thedatabase and start a scheduling thread for clearing each auction.
(b) GridExchange Service: The GridExchange Service is a Web Service interfacethat enables users to access various services of Mandi. The services that are avail-able to users are registration, submission of application and time slots, holding andjoining auctions, and discovering services and getting service reservations. TheGridExchange Service interacts with the BrokerStorage class to access the persis-tence database. The example sequence of operations for user registration is shownin Figure 8.3. The UserBroker sends a registration request to the exchange usingthe GridExchange web service. It submits the preferred login name and password.The GridExchange service gets the registered user list from the database and checkswhether the user is registered or not. If the user is not registered, it sends a replyback to user broker with “registration success” message.
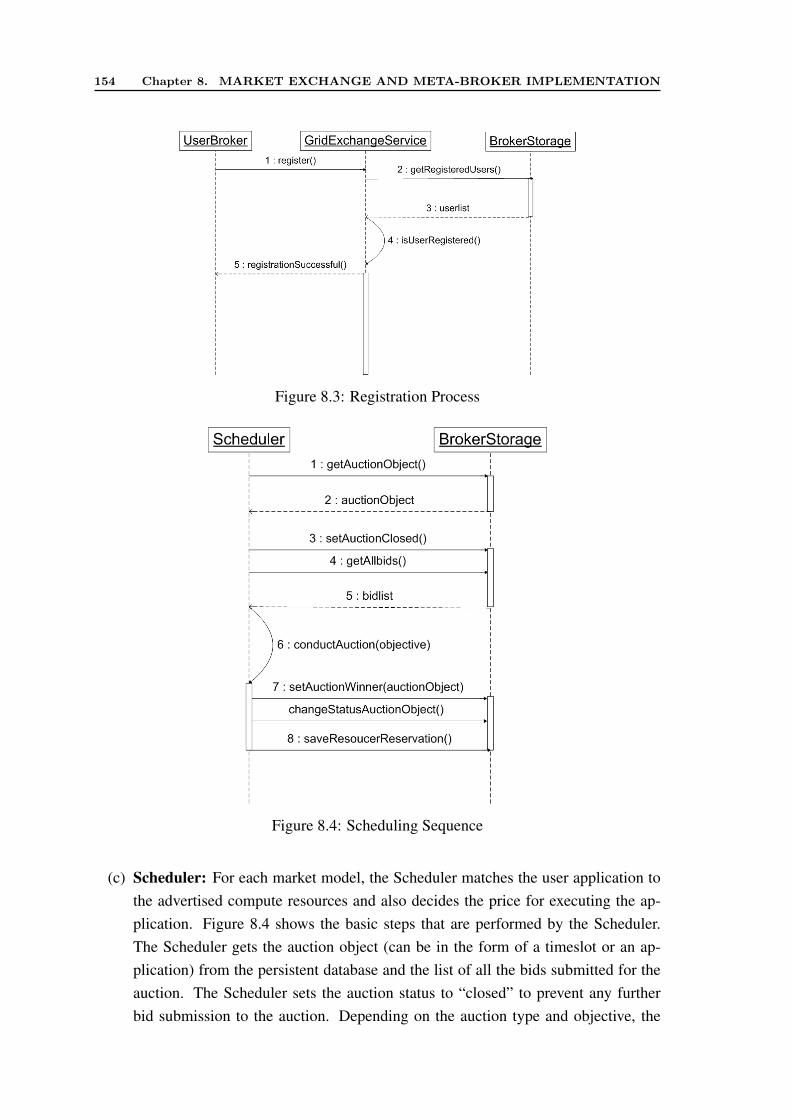
154 Chapter 8. MARKET EXCHANGE AND META-BROKER IMPLEMENTATION
Figure 8.3: Registration Process
Figure 8.4: Scheduling Sequence
(c) Scheduler: For each market model, the Scheduler matches the user application tothe advertised compute resources and also decides the price for executing the ap-plication. Figure 8.4 shows the basic steps that are performed by the Scheduler.The Scheduler gets the auction object (can be in the form of a timeslot or an ap-plication) from the persistent database and the list of all the bids submitted for theauction. The Scheduler sets the auction status to “closed” to prevent any furtherbid submission to the auction. Depending on the auction type and objective, the
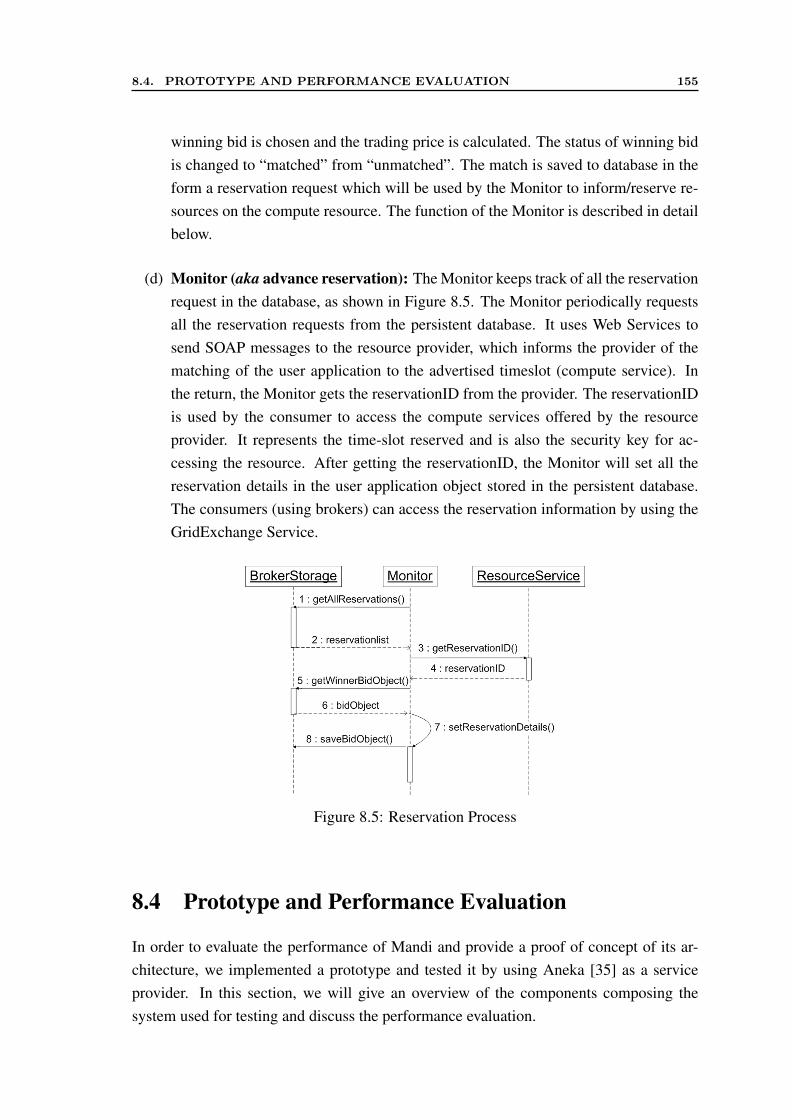
8.4. PROTOTYPE AND PERFORMANCE EVALUATION 155
winning bid is chosen and the trading price is calculated. The status of winning bidis changed to “matched” from “unmatched”. The match is saved to database in theform a reservation request which will be used by the Monitor to inform/reserve re-sources on the compute resource. The function of the Monitor is described in detailbelow.
(d) Monitor (aka advance reservation): The Monitor keeps track of all the reservationrequest in the database, as shown in Figure 8.5. The Monitor periodically requestsall the reservation requests from the persistent database. It uses Web Services tosend SOAP messages to the resource provider, which informs the provider of thematching of the user application to the advertised timeslot (compute service). Inthe return, the Monitor gets the reservationID from the provider. The reservationIDis used by the consumer to access the compute services offered by the resourceprovider. It represents the time-slot reserved and is also the security key for ac-cessing the resource. After getting the reservationID, the Monitor will set all thereservation details in the user application object stored in the persistent database.The consumers (using brokers) can access the reservation information by using theGridExchange Service.
Figure 8.5: Reservation Process
8.4 Prototype and Performance Evaluation
In order to evaluate the performance of Mandi and provide a proof of concept of its ar-chitecture, we implemented a prototype and tested it by using Aneka [35] as a serviceprovider. In this section, we will give an overview of the components composing thesystem used for testing and discuss the performance evaluation.
156 Chapter 8. MARKET EXCHANGE AND META-BROKER IMPLEMENTATION
8.4.1 System Details
Mandi
Mandi has been implemented in Java in order to be portable over different platformssuch as the Windows and Unix operative systems. From an implementation point of viewMandi is composed of a collection of services that interact by means of a persistence layerrepresented by the HSQL database. The system is accessible from external componentsthrough a Web Service that has been deployed by using Apache Axis2 on a TOMCATweb server (v.5.5). The Web Service interface makes the interaction with Mandi platformindependent. The current prototype support three type of trading mechanisms: i) First BidSealed Auction; ii) Double Auction, and iii) Commodity market.
Aneka
On the provider side, Aneka [35] has been used and extended to support the reservationand advertisement of slots on Mandi. Aneka is a service-oriented middleware for buildingEnterprise Clouds. The core component of an Aneka Cloud is the Aneka container thatrepresents the runtime environment of distributed applications on Aneka. The containerhosts a collection of services through which all the tasks are performed: scheduling andexecution of jobs, security, accounting, and reservation. In order to support the require-ments of Mandi a specific and lightweight implementation of the reservation infrastructurehas been integrated into the system. This infrastructure is composed by a central reserva-tion service that provides global view of the allocation map of the Cloud and manages thereservation of execution slots, and a collection of allocation services on each node hostingexecution services that are in charge of keeping track of the local allocation map and ofensuring the exclusive execution for reserved slots. The reservation service is accessibleto external applications by means of a specific Web Service that exposes the commonoperations for obtaining the advertised execution slots and reserving them.
Client Components
The client components are constituted by a simple Web Service client that generates allthe resource requests to Mandi.
8.4.2 Performance Evaluation
We evaluated the performance of Mandi in terms of overhead caused to the system dueto the interaction between the internal components and Mandi’s interaction with users re-quests and provider’s middleware. As discussed previously, Mandi is designed to handlemultiple market models concurrently and exposes a service oriented interface to handle
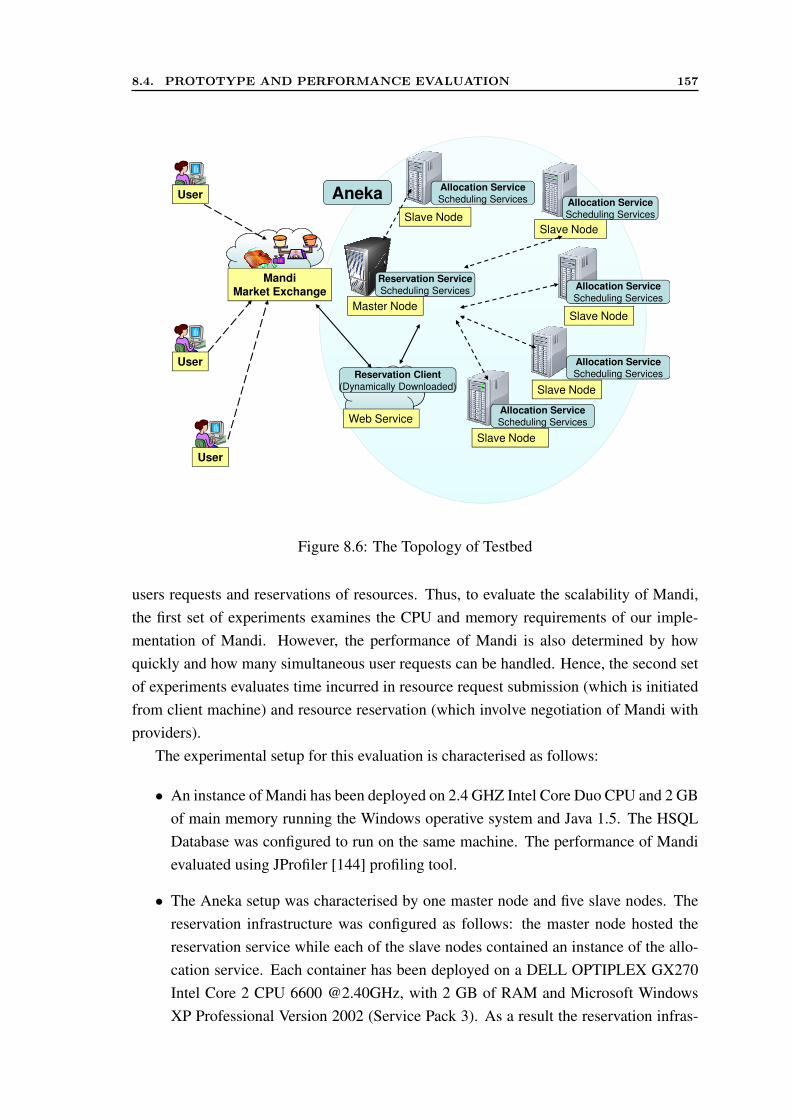
8.4. PROTOTYPE AND PERFORMANCE EVALUATION 157
Master Node
Reservation Service
Scheduling Services
Slave NodeSlave Node
Slave Node
MandiMarket Exchange
User AnekaAllocation Service
Scheduling Services
Allocation Service
Scheduling Services
Allocation Service
Scheduling Services
Slave Node
Allocation Service
Scheduling Services
Slave Node
Web Service
Reservation Client
(Dynamically Downloaded)
User
User
Allocation Service
Scheduling Services
Figure 8.6: The Topology of Testbed
users requests and reservations of resources. Thus, to evaluate the scalability of Mandi,the first set of experiments examines the CPU and memory requirements of our imple-mentation of Mandi. However, the performance of Mandi is also determined by howquickly and how many simultaneous user requests can be handled. Hence, the second setof experiments evaluates time incurred in resource request submission (which is initiatedfrom client machine) and resource reservation (which involve negotiation of Mandi withproviders).
The experimental setup for this evaluation is characterised as follows:
• An instance of Mandi has been deployed on 2.4 GHZ Intel Core Duo CPU and 2 GBof main memory running the Windows operative system and Java 1.5. The HSQLDatabase was configured to run on the same machine. The performance of Mandievaluated using JProfiler [144] profiling tool.
• The Aneka setup was characterised by one master node and five slave nodes. Thereservation infrastructure was configured as follows: the master node hosted thereservation service while each of the slave nodes contained an instance of the allo-cation service. Each container has been deployed on a DELL OPTIPLEX GX270Intel Core 2 CPU 6600 @2.40GHz, with 2 GB of RAM and Microsoft WindowsXP Professional Version 2002 (Service Pack 3). As a result the reservation infras-
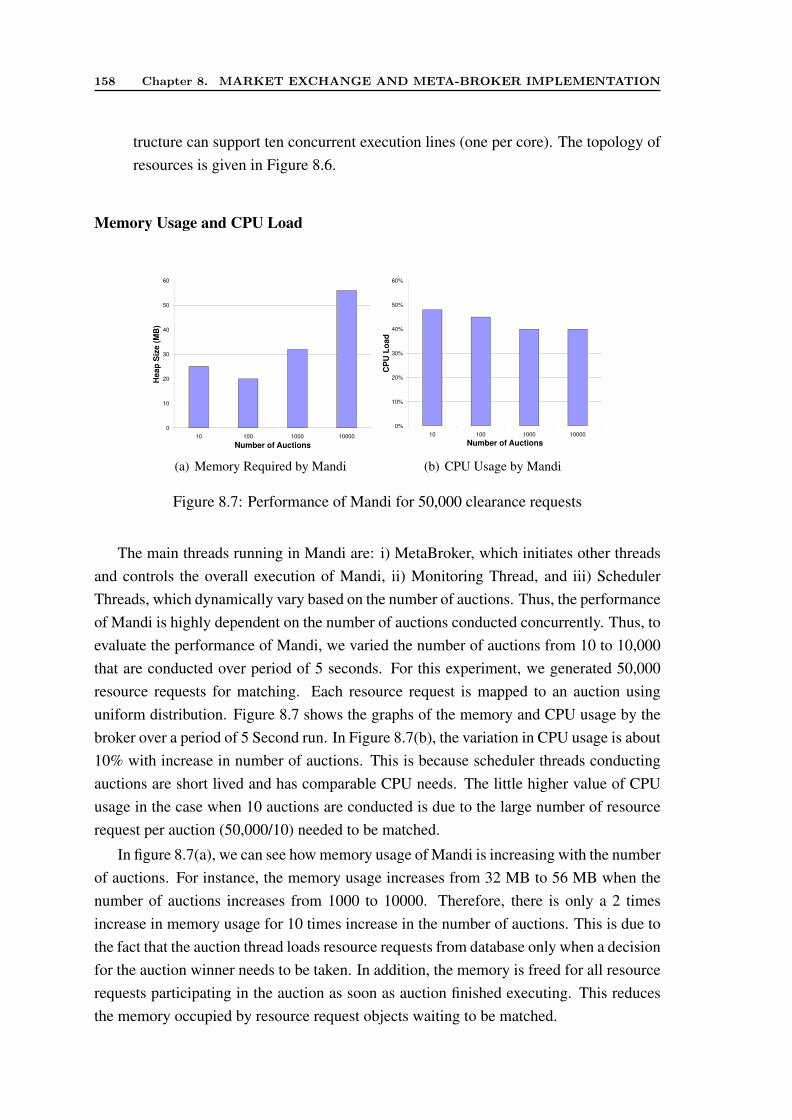
158 Chapter 8. MARKET EXCHANGE AND META-BROKER IMPLEMENTATION
tructure can support ten concurrent execution lines (one per core). The topology ofresources is given in Figure 8.6.
Memory Usage and CPU Load
60
50
40
He
ap
Siz
e (
MB
)
30
He
ap
Siz
e (
MB
)
20He
ap
Siz
e (
MB
)
20He
ap
Siz
e (
MB
)
10
0
10 100 1000 10000
Number of Auctions
(a) Memory Required by Mandi
60%
50%
40%
CP
U L
oa
d
30%
CP
U L
oa
d20%
CP
U L
oa
d
10%
20%
10%
0%
10 100 1000 10000
Number of AuctionsNumber of Auctions
(b) CPU Usage by Mandi
Figure 8.7: Performance of Mandi for 50,000 clearance requests
The main threads running in Mandi are: i) MetaBroker, which initiates other threadsand controls the overall execution of Mandi, ii) Monitoring Thread, and iii) SchedulerThreads, which dynamically vary based on the number of auctions. Thus, the performanceof Mandi is highly dependent on the number of auctions conducted concurrently. Thus, toevaluate the performance of Mandi, we varied the number of auctions from 10 to 10,000that are conducted over period of 5 seconds. For this experiment, we generated 50,000resource requests for matching. Each resource request is mapped to an auction usinguniform distribution. Figure 8.7 shows the graphs of the memory and CPU usage by thebroker over a period of 5 Second run. In Figure 8.7(b), the variation in CPU usage is about10% with increase in number of auctions. This is because scheduler threads conductingauctions are short lived and has comparable CPU needs. The little higher value of CPUusage in the case when 10 auctions are conducted is due to the large number of resourcerequest per auction (50,000/10) needed to be matched.
In figure 8.7(a), we can see how memory usage of Mandi is increasing with the numberof auctions. For instance, the memory usage increases from 32 MB to 56 MB when thenumber of auctions increases from 1000 to 10000. Therefore, there is only a 2 timesincrease in memory usage for 10 times increase in the number of auctions. This is due tothe fact that the auction thread loads resource requests from database only when a decisionfor the auction winner needs to be taken. In addition, the memory is freed for all resourcerequests participating in the auction as soon as auction finished executing. This reducesthe memory occupied by resource request objects waiting to be matched.
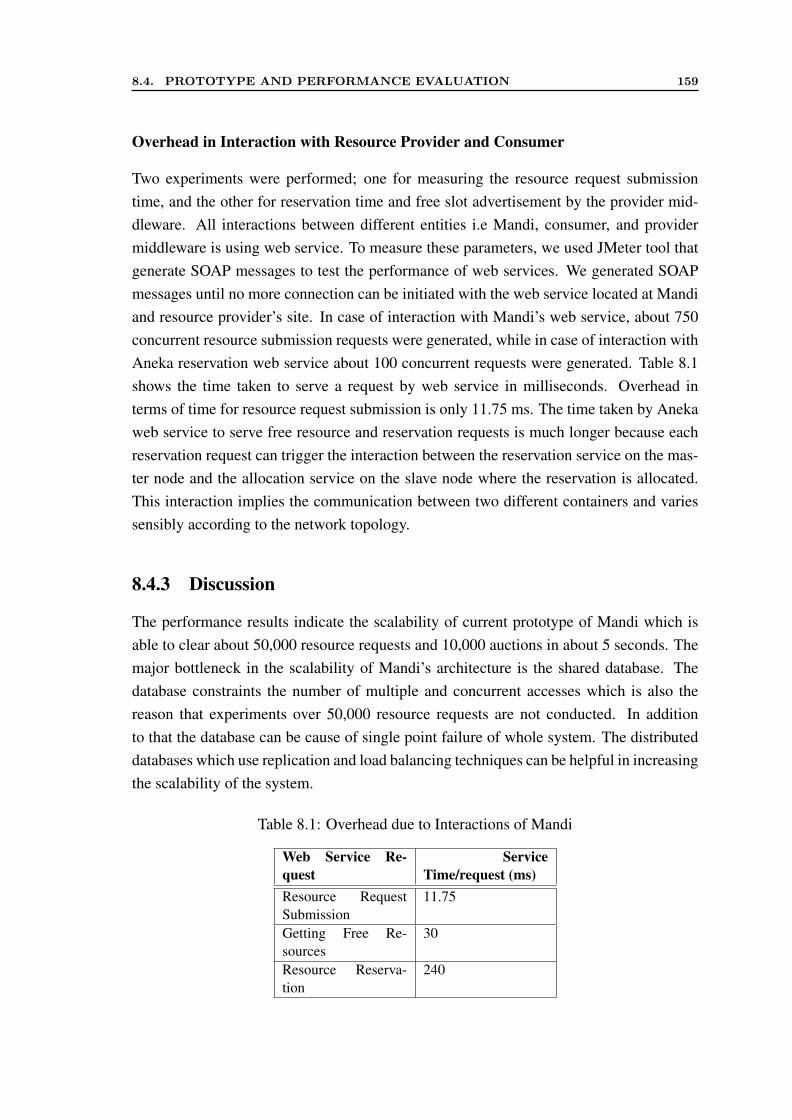
8.4. PROTOTYPE AND PERFORMANCE EVALUATION 159
Overhead in Interaction with Resource Provider and Consumer
Two experiments were performed; one for measuring the resource request submissiontime, and the other for reservation time and free slot advertisement by the provider mid-dleware. All interactions between different entities i.e Mandi, consumer, and providermiddleware is using web service. To measure these parameters, we used JMeter tool thatgenerate SOAP messages to test the performance of web services. We generated SOAPmessages until no more connection can be initiated with the web service located at Mandiand resource provider’s site. In case of interaction with Mandi’s web service, about 750concurrent resource submission requests were generated, while in case of interaction withAneka reservation web service about 100 concurrent requests were generated. Table 8.1shows the time taken to serve a request by web service in milliseconds. Overhead interms of time for resource request submission is only 11.75 ms. The time taken by Anekaweb service to serve free resource and reservation requests is much longer because eachreservation request can trigger the interaction between the reservation service on the mas-ter node and the allocation service on the slave node where the reservation is allocated.This interaction implies the communication between two different containers and variessensibly according to the network topology.
8.4.3 Discussion
The performance results indicate the scalability of current prototype of Mandi which isable to clear about 50,000 resource requests and 10,000 auctions in about 5 seconds. Themajor bottleneck in the scalability of Mandi’s architecture is the shared database. Thedatabase constraints the number of multiple and concurrent accesses which is also thereason that experiments over 50,000 resource requests are not conducted. In additionto that the database can be cause of single point failure of whole system. The distributeddatabases which use replication and load balancing techniques can be helpful in increasingthe scalability of the system.
Table 8.1: Overhead due to Interactions of Mandi
Web Service Re-quest
ServiceTime/request (ms)
Resource RequestSubmission
11.75
Getting Free Re-sources
30
Resource Reserva-tion
240
160 Chapter 8. MARKET EXCHANGE AND META-BROKER IMPLEMENTATION
8.5 Summary
The presence of IT demand and supply in utility oriented Clouds and Grids led to the needof a market exchange that can ease the trading process by providing the required infras-tructure for interaction. In this chapter, we introduce a novel market exchange frameworknamed ”Mandi” for facilitating such trading. We identify the essential technical and mar-ket requirements, and challenges in designing such an exchange. The architecture andimplementation of Mandi is comprehensively described and evaluated. The two exper-iments performed measure the effect of design choices on the performance of Mandi,and overhead time incurred in the interaction between the consumer and provider throughMandi. The experiments show that Mandi can scale well and can handle many concurrenttrading models and resource requests. We can thus conclude that the overhead generatedfor matching a large number of resource requests in concurrent auctions is minimal. Theonly limit to the scalability of the system is the persistence layer, which also constitutesthe single point of failure. In order to address this issue, a more efficient database serverand a solid replication infrastructure has to be put in place.
Chapter 9
Conclusions and Future Directions
This chapter summarises our objectives and work done in this thesis. Our main findingsand lessons learned are discussed along with their significance. In this chapter, this thesisconcludes with a discussion on the future work that emerged during this research but areloosely connected and outside its scope.
9.1 Summary
This thesis began with the introduction of utility Grids which are becoming the main-stream infrastructure for executing large scale applications from academia and industrialenterprises. Many challenges are pointed out in solving the problem of resource manage-ment and scheduling in utility Grids. The literature review identified a lack of researchon the coordinated scheduling of multiple applications which have conflicting QoS re-quirements, across multiple resource sites. Thus, we set out to investigate how to designmarket-oriented meta-scheduling algorithms and mechanisms which can reconcile andcoordinate users’ QoS requirements while maximising the utility for both users and re-source providers. To solve the problem of market-oriented meta-scheduling, the followingobjectives are defined:
• To investigate an architectural model for a market-oriented meta-scheduler to coor-dinate resource demand,
• To design the meta-scheduling algorithms and mechanisms that can reconcile theresource demands from users with conflicting requirements,
• To investigate how other system-centric metrics such as response time will impactboth the participants’ utility.
The first objective is achieved in Chapter 3, which proposed the meta-broker architec-ture and evaluated its advantages against a completely decentralised model, where each
161
162 Chapter 9. CONCLUSIONS AND FUTURE DIRECTIONS
personalised broker competes to access resources in a utility Grid. We showed in thatchapter how the meta-broker, not only maximises the successful execution of user appli-cations, but also maximises the resource utilisation.
This thesis accomplished the second and third objectives by studying the problem inthree scenarios: i) to maximise users’ utility, ii) to maximise providers’ utility, and iii)to maximise both users’ and providers’ utility. Chapter 4 and 5 discussed the problemfrom user’s point of view and proposed several heuristics to maximise the user’s utility interms of performance and monetary costs. Experimental results showed how the trade-offbetween two conflicting goals can be managed by aggregating them within a trade-offmetric.
Chapter 6 examined mechanisms which can maximise a provider’s utility by minimis-ing the maintenance costs in terms of energy consumption of CPUs. This chapter alsopresented mechanisms that minimise carbon emissions from the environment’s perspec-tive. Chapter 7 addressed the problem of meta-scheduling to maximise both users’ andresource providers’ utility using analytical and experimental approaches. In the next sec-tion, we summarise the main contributions of this thesis with lessons learned and theirsignificance.
9.2 Lessons Learned and Significance
In the beginning of this thesis, a taxonomy was developed to classify the common market-oriented scheduling mechanisms based on allocation decisions, mechanisms’ objective,market model, application model, and participant focus. The taxonomy provided the basisfor comparing market-oriented scheduling systems and technologies. This comprehensiveclassification not only enhances the understanding of recent developments in utility Grids,but also provides an insight into research gaps which still need to be addressed.
Based on the literature study, we pointed out that a lack of coordination between per-sonalised brokers can lead to the contention for cheap and efficient resources. Our simu-lation study in Chapter 3 showed that the contention can even result in underutilisation ofresources. Thus, this thesis proposed a market-oriented meta-scheduler architecture called“Meta-Broker”. The meta-broker architecture is semi-decentralised, thus only schedulingdecisions are made by the meta-broker, while job submission and monitoring is performedby personalised user brokers. This hybrid design makes the meta-broker system lightweight, and thus, it can handle a large number of scheduling requests, while allowinglocal autonomy to its participants. The meta-broker allows the inclusion of various strate-gies for resource selection and allocation. From our simulation study, we learned thatthe meta-broker architecture can maximise the utilisation of resources by decreasing thedeadline violation of applications.
9.2. LESSONS LEARNED AND SIGNIFICANCE 163
Motivated by these preliminary results, this thesis investigated the meta-scheduling al-gorithms that can minimise the combined spending of users with QoS requirements suchas deadline and budget. To analyse challenges involved, the meta-scheduling problem ofscheduling multiple applications on multiple resources is modelled using Linear/IntegerProgramming model. Based on this model, a novel genetic algorithm, LPGA, was pre-sented to minimise the combined spending of users in executing their applications. Thisthesis also reveals how approximation algorithms such as MMC in Grid environments canbe designed to achieve cost optimisation.
In Chapter 5, we relaxed the deadline constraint, and studied the problem in a scenariowhere users also wanted to optimise system metrics such as makespan while minimisingmonetary cost. The challenge was to schedule various applications in a coordinated man-ner by satisfying as many users as possible with the goal of minimising the monetary costand time of using resources for all Grid users. This scheduling problem, which aims tominimise the cost and time of using resources for all concurrent users, is found to be NP-hard due to its combinatorial nature. The problem becomes more challenging when a userhas to relax her QoS requirements, such as makespan, under limited budget constraints.Users may prefer cheaper services with a relaxed QoS, if it is sufficient to meet their re-quirements. Thus, a user has to choose between multiple conflicting optimisation objec-tives [102]. This problem is not only strongly NP-hard, but also non-approximable [101],i.e., it cannot be approximated in polynomial time within a reasonably good precision.Moreover, the scheduling in utility Grids needs to be online, which further adds to thechallenge. Thus, this thesis proposed three meta-scheduling online heuristics, such asMinMin Cost Time Trade-off (MinCTT), Sufferage Cost Time Trade-off (SuffCTT), andMax-Min Cost Time Trade-off (MaxCTT), to manage the trade-off between overall exe-cution time and cost, and minimise them simultaneously on the basis of a trade-off factor.The trade-off factor is used to resolve the conflicting goals of a user. It indicates thepriority of optimising cost over time. The proposed heuristics were evaluated by an ex-tensive simulation study, which analysed the best heuristic to adopt according to differentuser preferences. The heuristic MinCTT gave the lowest makespan and cost in almost allscenarios considered.
The algorithms proposed in Chapter 4 and 5 can be used in scheduling applications ofusers from the same community (scientific or industry) on Cloud resources provided com-mercially by companies such as Amazon. The Cloud resources are virtualised computinginfrastructure which can be leased on the hourly basis. The organizations such as Mor-gan Stanley, having more than one research divisions, can directly employ our approachesto schedule their applications from different divisions in a coordinated and cost-effectivemanner.
In Chapter 6, we investigated the market-oriented scheduling problem in the resource
164 Chapter 9. CONCLUSIONS AND FUTURE DIRECTIONS
provider’s context. This thesis gave a novel approach to maximise the resource provider’sprofit (utility) by intelligent energy-efficient meta-scheduling of applications across het-erogeneous resource sites. Thus, the proposed approach reduces the maintenance costwhich results in higher profit rather than selecting profitable users. This scenario is verytimely since high maintenance costs in data centers due to the increasing price of electric-ity have become a major concern. To maximise profit for the provider, this thesis proposedthree simple, yet effective generic scheduling policies that can be extended to any appli-cation, processor, and server models so that they can be readily deployed in existing datacenters with minimum changes. Our generic scheduling policies can also easily com-plement any of the existing application-specific, processor-specific, and/or server-specificenergy-saving policies that are already in place within existing data centers or servers.We identified some of the factors such as electricity rates, energy efficiency of data cen-ters and carbon emissions which play an important role in minimising the maintenancecost for resource providers. Thus, the thesis addressed an important topic of balancingprofit and carbon emissions for globally distributed utility computing environments suchas Clouds. This thesis highlighted the need to consider the heterogeneity in data cen-ters when mapping workloads, and to conserve energy when scheduling and running theworkloads.
In Chapter 7, this thesis investigated the meta-scheduling problem of simultaneouslymaximising both users’ and resource providers’ utility. A question to answer was “Canwe design a meta-scheduling approach which can benefit users by satisfying their QoSand benefit resource providers by increasing their utilisation?”. Another more specificquestion to answer was “How the consideration of other system-centric metrics such as re-sponse time will impact the participants’ utility”. This thesis proposed a meta-schedulingmechanism (Double Auction-Inspired Meta-Scheduling Mechanism) for parallel applica-tions that takes advantage of both auctions and system-based schedulers to simultaneouslymaximise satisfied users, and resource providers by evenly distributing load across all theresources. To achieve this, valuation metrics were designed using system parameters thatcommodify the available resource share and the user’s application requirements so thatthey can be compared and matched using principles similar to Double auctions. To inves-tigate the impact on system metrics, this meta-scheduling problem was analysed through aqueuing theory based analytical model. This thesis demonstrated that by considering bothsystem metrics and market parameters we can enable more effective scheduling whichwill benefit both users and resource providers. This thesis also demonstrated how classicaleconomic models, when adapted suitably, are able to deal with multiple QoS requirementsof the users more effectively than state-of-the art algorithms used in existing schedulers.This motivates further exploration of other economic models to solve particular problemsin job scheduling.
9.3. FUTURE DIRECTIONS 165
Finally, we realised the proposed architecture by presenting a system prototype as partof Mandi Grid exchange . We implemented it using Web Services to make this platformindependent. A web interface is also provided so that users can check their account detailsand advertise resources. Mandi gives flexibility to its users not only in terms of tradingprotocol but also allows co-existence of multiple negotiation between users and providers.
In summary, the planning and scheduling algorithms proposed in this thesis have takeninto account both costs and capabilities of Grid resources while meeting users QoS re-quirements. Hence, this thesis successfully demonstrated the feasibility of using market-oriented meta-scheduling for multiple applications in utility Grids, and made significantcontributions towards the advancement of the discipline.
9.3 Future Directions
In this thesis, the problem of market-oriented meta-scheduling of multiple applicationswith QoS constraints on heterogeneous and distributed resources was addressed. How-ever, there are still open issues that can serve as a starting point for future research.
9.3.1 Resources with Different Pricing Models
In this thesis, we considered a fixed pricing model while scheduling multiple applica-tions. In recent years, many research studies [148] [154] has been done on pricing theresources in utility Grids. Each provider can employ different dynamic pricing policiesfor maximising their profit. For example, Amazon [6] uses two types of pricing models;a) spot pricing and b) fixed pricing. Each of these models gives some advantages and dis-advantages to end users. For example, the spot pricing can be exploited by meta-broker tomaximise the user’s profit but it reduces the chances of task being executed successfully.In such environments, not only the current but also future status of resources needs to beconsidered to reduce the user’s spending. Hence, there is a need to understand the effectof using different pricing models on cost-based scheduling, and design novel schedulingpolicies to handle such heterogeneity. The time factor will again play an important role inthis study.
9.3.2 Scheduling with Pre-emption
Throughout this thesis, we considered a non-preemptive execution model to avoid delayscaused in the transfer of applications from one resource provider to another. However,there are some cases where checkpoints can be used to restart the application from thepoint, where execution was stopped. This has become more feasible due to recent techno-logical advancement in Virtual Machines [31]. In such cases, the consideration of migra-
166 Chapter 9. CONCLUSIONS AND FUTURE DIRECTIONS
tion might be useful to enhance the utility of users and resource providers. The providercan preempt those applications which are less profitable and accept more profitable ones.Similarly, the meta-broker can migrate the application from expensive resources (fast) tocheaper ones (slow). The migration of such jobs would be a challenging task since wealso need to consider other issues such as the application model, network delays, resourcestatus and checkpointing.
9.3.3 Network and Data-Aware Application Meta-scheduling
In scientific environments such as High Energy Physics (HEP), there are several appli-cations that require petabytes of data from various repositories distributed across variousnations. The meta-scheduling of these applications competing for compute and storageresources can be very challenging due to the highly dynamic nature of network. In addi-tion, computation should be ideally located near to storage, thus decreasing the delays inthe execution. If the scheduling decisions are made just on the basis of either data size orcomputation time, the resultant schedule can lead to resource wastage in terms of networkbandwidth, and performance degradation due to large execution delays. Moreover usersneed to pay for both data transfer and computation. These challenges soar up when thereis contention for resources by concurrent users with similar applications. Thus, intelligentmeta-scheduling approaches that take into account not only monetary execution costs, butalso reconciling the competing storage, network and computation demand of users arerequired.
9.3.4 SLA based Meta-Scheduling in Cloud Computing Environments
Cloud computing has emerged as an important utility computing paradigm that provideshighly flexible on-demand access to commercial resources. Being a commercialised en-vironment, the formal SLA acts as the basis for resource sharing. In the case when usersrequire resources from multiple resource providers, multiple levels of SLAs may exist.From the user’s perspective, it is challenging to handle any SLA violation because it canrecursively affect other SLAs. From the provider’s perspective, the challenge is to man-age SLAs in such a way to ensure profit maximisation. Thus, admission control plays animportant role.
9.3.5 Energy-efficient Meta-Scheduling
Energy efficiency is important for the development of utility computing and environmen-tal sustainability. In Chapter 6, we showed how meta-scheduling can also help in reducingenergy consumption to a great degree. This finding has given a new research perspective
9.3. FUTURE DIRECTIONS 167
into scheduling across data centers. For further efficiency within a data center, differ-ent techniques for energy consumption, such as turning servers on and off, need to worksimultaneously. This requires more technical analysis of the effect of various strategieson the execution delays and power consumption for servers, as well as the effect on thereliability of computing devices. The benefit of virtualised environments can also be har-nessed. Virtualisation makes it easier to consolidate many applications on fewer physicalservers. In addition, in future research, it is important to consider the energy (and po-tential latency) overhead of moving data sets between the data centers, in particular fordata-intensive HPC applications. This overhead can be quite significant depending on thesize of the data set and the activity of the workloads.
9.3.6 Scalable Meta-Broker Architecture
The meta-broker coordinates communication between multiple resource providers anduser brokers. Being a common entry point for accessing global information about re-sources, the failure of the meta-broker can result in the failure of the entire system. Inaddition, in the case of high load, the computation required to make scheduling decisionscan cause long execution delays. Thus, the scalability of the meta-broker can become abottleneck in the system’s performance.
To resolve the scalability issue, investigation is required on the most suitable architec-ture for the meta-broker. A decentralised architecture such as P2P can be incorporated sothat the single point of failure can be avoided and fast scheduling decisions can be madeby sharing information between peers. In addition, the communication protocol betweenpeers needs to be investigated.
9.3.7 Mixed Application Model with QoS Requirements
It will be interesting to enhance all heuristics to schedule jobs with different applicationmodels such as workflows. Different application models forces different QoS needs on thescheduling strategy. For example, workflow and bag-of-task application, which consist ofmany independent tasks, may not require re-execution of the entire application in caseof failure. On the other hand, in the case of parallel application, any failure will requirethe re-execution of the entire application. Thus, it is important to study the challenge ofscheduling applications by reconciling the QoS needs based on their model. In addition,the proposed heuristics in this thesis can also be enhanced by considering more QoS needssuch as memory and network bandwidth.

REFERENCES
[1] D. Abramson, R. Buyya, and J. Giddy. A Computational Economy for Grid Com-puting and its Implementation in the Nimrod-G Resource Broker. Future Genera-tion Computing System, 18(8):1061–1074, 2002.
[2] S. Ali, H. J. Siegel, M. Maheswaran, and D. Hensgen. Representing Task and Ma-chine Heterogeneities for Heterogeneous Computing Systems. Tamkang Journalof Science and Engineering, 3(3):195–208, 2000.
[3] D. Allenotor and R. Thulasiram. Grid Resources Pricing: A Novel Financial Optionbased Quality of Service-Profit Quasi-Static Equilibrium Model. In Proceedingsof 9th IEEE/ACM International Conference on Grid Computing. IEEE ComputerSociety, 2008.
[4] J. Altmann, C. Courcoubetis, J. Darlington, and J. Cohen. GridEcon-TheEconomic-Enhanced Next-Generation Internet. In Proceedings of the 4th Interna-tional Workshop on Grid Economics and Business Models, Rennes, France, 2007.
[5] J. Altmann, M. Ion, A. Adel, and B. Mohammed. A Taxonomy of Grid BusinessModels. In Proceedings of the 4th International Workshop on Grid Economics andBusiness Models, Rennes, France, 2007.
[6] Amazon. Amazon Elastic Compute Cloud (EC2). http://www.amazon.com/ec2/, Aug. 2009.
[7] N. Andrade, W. Cirne, F. Brasileiro, and P. Roisenberg. OurGrid: An Approach toEasily Assemble Grids with Equitable Resource Sharing. Lecture Notes in Com-puter Science, 2862:61–86, 2003.
[8] P. Andreetto, S. Andreozzi, G. Avellino, S. Beco, A. Cavallini, M. Cecchi, V. Cias-chini, A. Dorise, F. Giacomini, A. Gianelle, et al. The gLite Workload ManagementSystem. In Journal of Physics: Conference Series, volume 119, page 062007. In-stitute of Physics Publishing, 2008.
[9] A. AuYoung, B. Chun, A. Snoeren, and A. Vahdat. Resource Allocation in Feder-ated Distributed Computing Infrastructures. In Proceedings of the 1st Workshop onOperating System and Architectural Support for the On-demand IT InfraStructure,NV, USA, 2004.
[10] C. Belady. In the Data Center, Power and Cooling Costs More Than the IT Equip-ment it Supports. Electronics cooling, 13(1):24, 2007.
[11] F. Berman and R. Wolski. The AppLeS Project: A Status Report. In Proceedingsof the 8th NEC Research Symposium, Berlin, Germany, 1997.
169
170 REFERENCES
[12] R. Bianchini and R. Rajamony. Power and Energy Management for Server Sys-tems. Computer, 37(11):68–74, 2004.
[13] A. Bose, B. Wickman, and C. Wood. Mars: A Metascheduler for Distributed Re-sources in Campus Grids. In Proceedings of the 5th IEEE/ACM International Work-shop on Grid Computing, Pittsburgh, USA, 2004.
[14] D. Bradley, R. Harper, and S. Hunter. Workload-based Power Management for Par-allel Computer Systems. IBM Journal of Research and Development, 47(5):703–718, 2003.
[15] T. Braun, H. Siegel, N. Beck, L. Boloni, M. Maheswaran, A. Reuther, J. Robertson,M. Theys, B. Yao, D. Hensgen, et al. A Comparison of Eleven Static Heuristics forMapping a Class of Independent Tasks onto Heterogeneous Distributed ComputingSystems. Journal of Parallel and Distributed Computing, 61(6):810–837, 2001.
[16] J. Broberg, S. Venugopal, and R. Buyya. Market-oriented Grids and Utility Com-puting: The State-of-the-Art and Future Directions. Journal of Grid Computing,6(3):255–276, 2008.
[17] M. Buco, R. Chang, L. Luan, C. Ward, J. Wolf, and P. Yu. Utility Computing SLAManagement Based upon Business Objectives. IBM Systems Journal, 43(1):159–178, 2004.
[18] T. Burd and R. Brodersen. Energy Efficient CMOS Microprocessor Design. InProceedings of the 28th Hawaii International Conference on System Science, Maui,Hawaii, USA, 1995.
[19] J. Burge, P. Ranganathan, and J. Wiener. Cost-Aware Scheduling for Hetero-geneous Enterprise Machines (CASHEM). In Proceedings of 2007 IEEE Inter-national Conference on Cluster Computing, Austin, Texas, USA, pages 481–487,2007.
[20] J. Butler, D. Morrice, and P. Mullarkey. A Multiple Attribute Utility Theory Ap-proach to Ranking and Selection. Management Science, 47(6):800–816, 2001.
[21] R. Buyya, D. Abramson, J. Giddy, and H. Stockinger. Economic Models for Re-source Management and Scheduling in Grid Computing. Concurrency and Com-putation: Practice and Experience, 14(13-15):1507–1542, 2002.
[22] R. Buyya, D. Abramson, and S. Venugopal. The Grid Economy. Proceedings ofthe IEEE, 93(3):698–714, 2005.
[23] R. Buyya and K. Bubendorfer, editors. Market-Oriented Grid and Utility Comput-ing. John Wiley & Sons Inc, New Jersey, USA., 2009.
[24] R. Buyya and M. Murshed. Gridsim: A Toolkit For the Modeling and Simulation ofDistributed Resource Management and Scheduling for Grid Computing. Concur-rency and Computation: Practice and Experience, 14(13-15):1175–1220, 2002.
REFERENCES 171
[25] R. Buyya, M. Murshed, D. Abramson, and S. Venugopal. Scheduling ParameterSweep Applications on Global Grids: A Deadline and Budget Constrained Cost-Time Optimisation Algorithm. Software: Practice and Experience, 35(5):491–512,2005.
[26] R. Buyya and S. Vazhkudai. Compute Power Market: Towards a Market-OrientedGrid. In Proceedings of the 1st International Symposium on Cluster Computingand the Grid, Brisbane, Australia, 2001.
[27] R. Buyya, C. S. Yeo, S. Venugopal, J. Broberg, and I. Brandic. Cloud Computingand Emerging IT Platforms: Vision, Hype, and Reality for Delivering Computingas the 5th Utility. Future Generation Computer Systems, 25(6):599–616, 2009.
[28] F. Cappello. Towards an International Computer Science Grid. In Proceedings ofthe 16th IEEE International Workshops on Enabling Technologies: Infrastructurefor Collaborative Enterprises, Paris, France, 2007.
[29] C. Catlett. The Philosophy of TeraGrid: Building an Open, Extensible, DistributedTeraScale Facility. In Proceedings of 2nd IEEE International Symposium on Clus-ter Computing and the Grid, Berlin, Germany, 2002.
[30] S. Chapin, J. Karpovich, and A. Grimshaw. The Legion Resource ManagementSystem. In Proceedings of the 5th Workshop on Job Scheduling Strategies forParallel Processing, San Juan, Puerto Rico, 1999.
[31] J. Chase, D. Irwin, L. Grit, J. Moore, and S. Sprenkle. Dynamic Virtual Clustersin a Grid Site Manager. In Proceedings of the Twelfth International Symposium onHigh Performance Distributed Computing, Seattle, Washington, USA, 2003.
[32] J. S. Chase, D. C. Anderson, P. N. Thakar, A. M. Vahdat, and R. P. Doyle. ManagingEnergy and Serve Resources in Hosting Centers. SIGOPS Opering System Review,35(5):103–116, 2001.
[33] Y. Chen, A. Das, W. Qin, A. Sivasubramaniam, Q. Wang, and N. Gautam. Manag-ing Server Energy and Operational Costs in Hosting Centers. ACM SIGMETRICSPerformance Evaluation Review, 33(1):303–314, 2005.
[34] P. Chu and J. Beasley. A Genetic Algorithm for the Generalised Assignment Prob-lem. Computers and Operations Research, 24(1):17–23, 1997.
[35] X. Chu, K. Nadiminti, C. Jin, S. Venugopal, and R. Buyya. Aneka: Next-Generation Enterprise Grid Platform for e-Science and e-Business Applications.In Proceedings of the 3rd IEEE International Conference on e-Science and GridComputing, Bangalore, India, 2007.
[36] B. Chun and D. Culler. Rexec: A Decentralized, Secure Remote Execution environ-ment for Clusters. In Proceedings of 4th Workshop on Communication, Architec-ture, and Applications for Network-based Parallel Computing, Toulouse, France,2000.
172 REFERENCES
[37] B. Chun, C. Ng, J. Albrecht, D. Parkes, and A. Vahdat. ComputationalResource Exchanges for Distributed Resource Allocation. Technical report,http://citeseer.ist.psu.edu/706369.html, 2004.
[38] A. Cobham. Priority Assignment in Waiting Line Problems. Journal of the Oper-ations Research Society of America, 2(1):70–76, 1954.
[39] B. Cooper and H. Garcia-Molina. Bidding for Storage Space in a Peer-to-PeerData Preservation System. In Proceeding of 22nd International Conference onDistributed Computing Systems, Vienna, Austria, 2002.
[40] K. Cooper, A. Dasgupta, K. Kennedy, C. Koelbel, A. Mandal, G. Marin, M. Maz-ina, J. Mellor-Crummey, F. Berman, H. Casanova, et al. New Grid Scheduling andRescheduling Methods in the GrADS Project. In Proceedings of 18th InternationalParallel and Distributed Processing Symposium, New Mexico, USA, 2004.
[41] K. Czajkowski, S. Fitzgerald, I. Foster, and C. Kesselman. Grid Information Ser-vices for Distributed Resource Sharing. In 10th IEEE International Symposium onHigh Performance Distributed Computing, San Francisco, CA, USA, 2001.
[42] K. Czajkowski, I. Foster, C. Kesselman, V. Sander, and S. Tuecke. SNAP: A Proto-col for Negotiating Service Level Agreements and Coordinating Resource Manage-ment in Distributed Systems. Lecture Notes in Computer Science, 2537:153–183,2002.
[43] E. David, R. Azoulay-Schwartz, and S. Kraus. Protocols and Strategies for Au-tomated Multi-Attribute Auctions. In Proceedings of the First International JointConference on Autonomous Agents and Multiagent Systems , Bologna, Italy, 2002.
[44] M. de Assuncao and R. Buyya. Performance Analysis of Allocation Policies forInterGrid resource Provisioning. Information and Software Technology, 51(1):42–55, 2009.
[45] V. Di Martino and M. Mililotti. Scheduling in a Grid Computing Environmentusing Genetic Algorithms. In Proceedings of the 16th International Parallel andDistributed Processing Symposium, Fort Lauderdale, Florida, USA, 2002.
[46] A. Dogan and F. Ozgiiner. Scheduling Independent Tasks with QoS Requirementsin Grid Computing with Time-Varying Resource Prices. In Proceedings of ThirdInternational Workshop of Grid Computing, Baltimore, MD, USA, 2002.
[47] T. Dornemann, E. Juhnke, and B. Freisleben. On-Demand Resource Provisioningfor BPEL Workflows Using Amazon’s Elastic Compute Cloud. In Proceedings ofthe 9th IEEE/ACM International Symposium on Cluster Computing and the Grid,Shanghai, China, 2009.
[48] C. Dumitrescu and I. Foster. Gruber: A Grid Resource Usage SLA Broker. 2005.
[49] C. Dumitrescu, I. Raicu, and I. Foster. DI-GRUBER: A Distributed Approach toGrid Resource Brokering. In Proceedings of the 2005 ACM/IEEE conference onSupercomputing (SC’05), Seattle, WA, USA, 2005.
REFERENCES 173
[50] A. Elyada, R. Ginosar, and U. Weiser. Low-Complexity Policies for Energy-Performance Tradeoff in Chip-Multi-Processors. IEEE Transactions on Very LargeScale Integration (VLSI) Systems, 16(9):1243–1248, 2008.
[51] H. Eriksson and M. Penker. Business Modeling with UML: Business Patterns atWork, John Wiley&Sons, 2001.
[52] C. Ernemann, V. Hamscher, and R. Yahyapour. Economic Scheduling in Grid Com-puting. In Proceedings of 7th International Workshop on Job Scheduling Strategiesfor Parallel Processing, Cambridge, MA, USA, 2001.
[53] M. Etinski, J. Corbalan, J. Labarta, M. Valero, and A. Veidenbaum. Power-AwareLoad Balancing of Large Scale MPI Applications. In Proceedings of the 2009 IEEEInternational Symposium on Parallel&Distributed Processing, Rome, Italy, 2009.
[54] T. Eymann, M. Reinicke, O. Ardaiz, P. Artigas, F. Freitag, and L. Navarro. Decen-tralized Resource Allocation in Application Layer Networks. In Proceedings of the3rd International Symposium on Cluster Computing and the Grid, Tokyo, Japan,2003.
[55] T. Eymann, M. Reinicke, F. Freitag, L. Navarro, O. Ardaiz, and P. Artigas. AHayekian Self-Organization Approach to Service Allocation in Computing Sys-tems. Advanced Engineering Informatics, 19(3):223–233, 2005.
[56] X. Fan, W.-D. Weber, and L. A. Barroso. Power Provisioning for a Warehouse-Sized Computer. In Proceedings of the 34th Annual International Symposium onComputer Architecture, pages 13–23, New York, NY, USA, 2007.
[57] D. Feitelson. Parallel Workloads Archive. URL http://www. cs. huji. ac.il/labs/parallel/workload.
[58] D. Feitelson, L. Rudolph, U. Schwiegelshohn, K. Sevcik, and P. Wong. Theoryand Practice in Parallel Job Scheduling. In Proceedings of 1997 Job SchedulingStrategies for Parallel Processing, Geneva, Switzerland, 1997.
[59] M. Feldman, K. Lai, and L. Zhang. A Price-Anticipating Resource AllocationMechanism for Distributed Shared Clusters. In Proceedings of the 6th ACM Con-ference on Electronic Commerce, Vancouver, Canada, 2005.
[60] H. Feltl and G. Raidl. An Improved Hybrid Genetic Algorithm for the GeneralizedAssignment Problem. In Proceedings of the 2004 ACM Symposium on AppliedComputing, Nicosia, Cyprus, 2004.
[61] H. Feng, G. Song, Y. Zheng, and J. Xia. A Deadline and Budget Constrained Cost-Time Optimization Algorithm for Scheduling Dependent Tasks in Grid Computing.Lecture Notes In Ccomputer Science, pages 113–120, 2004.
[62] W. Feng and K. Cameron. The Green500 List: Encouraging Sustainable Super-computing. Computer, 40(12):50–55, 2007.
174 REFERENCES
[63] X. Feng, R. Ge, and K. W. Cameron. Power and Energy Profiling of Scientific Ap-plications on Distributed Systems. In Proceedings of the 19th IEEE InternationalParallel and Distributed Processing Symposium, Los Alamitos, CA, USA, 2005.
[64] I. Foster and C. Kesselman. Globus: A Metacomputing Infrastructure Toolkit.International Journal of High Performance Computing Applications, 11(2):115,1997.
[65] I. Foster and C. Kesselman. The Grid: Blueprint for a New Computing Infrastruc-ture. Morgan Kaufmann, 2004.
[66] V. Freeh, D. Lowenthal, F. Pan, N. Kappiah, R. Springer, B. Rountree, and M. Fe-mal. Analyzing the Energy-Time Trade-Off in High Performance Computing Ap-plications. IEEE Transactions on Parallel and Distributed Systems, 18(6):835,2007.
[67] V. W. Freeh, F. Pan, N. Kappiah, D. K. Lowenthal, and R. Springer. Exploring theEnergy-Time Tradeoff in MPI Programs on a Power-Scalable Cluster. In Proceed-ings of the 19th IEEE International Parallel and Distributed Processing Sympo-sium, Los Alamitos, CA, USA, 2005.
[68] J. Frey, T. Tannenbaum, M. Livny, I. Foster, and S. Tuecke. Condor-G: A Com-putation Management Agent for Multi-Institutional Grids. Cluster Computing,5(3):237–246, Jul 2002.
[69] Y. Fu, J. Chase, B. Chun, S. Schwab, and A. Vahdat. SHARP: An Architecture forSecure Resource Peering. In Proceedings of the 19th ACM Symposium on Operat-ing Systems Principles, Bolton Landing, New York, USA, 2003.
[70] A. Gandhi, M. Harchol-Balter, R. Das, and C. Lefurgy. Optimal Power Allocationin Server Farms. In Proceedings of the 11th International Joint Conference onMeasurement and Modeling of Computer Systems, Seattle, WA, USA, 2009.
[71] W. Gentzsch et al. Sun Grid Engine: Towards Creating a Compute Power Grid.In Proceedings of the 1st International Symposium on Cluster Computing and theGrid, Brisbane, Australia, 2001.
[72] K. Golconda, F. Ozguner, and A. Dogan. A Comparison of Static QoS-basedScheduling Heuristics for a Meta-Task with Multiple QoS Dimensions in Heteroge-neous computing. In Proceedings of the 18th International Parallel and DistributedProcessing Symposium, Santa Fe, New Mexico, 2004.
[73] S. Greenberg, E. Mills, B. Tschudi, P. Rumsey, and B. Myatt. Best Practices forData Centers: Results from Benchmarking 22 Data Centers. In Proceedings ofthe 2006 ACEEE Summer Study on Energy Efficiency in Buildings, Pacific Grove,USA, 2006.
[74] D. Grosu and A. Das. Auction-based Resource Allocation Protocols in Grids. InProceedings of the 16th International Conference on Parallel and Distributed Com-puting and Systems, Cambridge, USA, 2004.
REFERENCES 175
[75] M. Harchol-Balter, M. Crovella, and M. C.D. On Choosing a Task AssignmentPolicy for a Distributed Server System. Journal of Parallel and Distributed Com-puting, 59(2):204–228, 1999.
[76] M. Harchol-Balter and A. Downey. Exploiting Process Lifetime Distributionsfor Dynamic Load Balancing. ACM Transactions on Computer Systems (TOCS),15(3):253–285, 1997.
[77] G. Hardin. The Tragedy of the Commons. Science, 162(3859):1243–1248, 1968.
[78] D. Hausheer and B. Stiller. Peermart: The Technology for a Distributed Auction-based Market for Peer-to-Peer Services. In Proceedings of the 2005 IEEE Interna-tional Conference on Communications, Seoul, South Korea, 2005.
[79] R. Henderson. Job Scheduling Under the Portable Batch System. In Proceedingsof the 1995 Workshop on Job Scheduling Strategies for Parallel Processing, SantaBarbara, CA, USA, 1995.
[80] J. Henning. SPEC CPU2000: Measuring CPU Performance in the New Millen-nium. Computer, 33(7):28–35, 2000.
[81] E. Herness, R. High, and J. McGee. WebSphere Application Server: A Foundationfor on Demand Computing. IBM Systems Journal, 43(2):213–237, 2004.
[82] W. Hoschek, F. J. Jaen-Martınez, A. Samar, H. Stockinger, and K. Stockinger. DataManagement in an International Data Grid Project. In Proceedings of the FirstIEEE/ACM International Workshop on Grid Computing, pages 77–90, London,UK, 2000. Springer-Verlag.
[83] W. Hoschek, J. Jaen-Martinez, A. Samar, H. Stockinger, and K. Stockinger. DataManagement in an International Data Grid Project. In Proceedings of 1st Interna-tional Workshop on Grid Computing, Bangalore, India, 2000.
[84] C. Hsu and U. Kremer. The Design, Implementation, and Evaluation of a CompilerAlgorithm for CPU Energy Reduction. In Proceedings of the 2003 ACM SIG-PLAN Conference on Programming Language Design and Implementation, Swe-den, 2003.
[85] E. Huedo, R. Montero, I. Llorente, D. Thain, M. Livny, R. van Nieuwpoort,J. Maassen, T. Kielmann, H. Bal, G. Kola, et al. The GridWay Framework forAdaptive Scheduling and Execution on Grids. Software-Practice and Experience,6(8), 2005.
[86] O. Ibarra and C. Kim. Heuristic Algorithms for Scheduling Independent Tasks onNonidentical Processors. Journal of the ACM (JACM), 24(2):280–289, 1977.
[87] D. Irwin, J. Chase, L. Grit, A. Yumerefendi, D. Becker, and K. Yocum. SharingNetworked Resources with Brokered Leases. In Proceedings of the 2006 USENIXTechnical Conference, Boston, MA, USA, 2006.
176 REFERENCES
[88] D. Irwin, L. Grit, and J. Chase. Balancing Risk and Reward in a Market-BasedTask Service. In Proceedings of the 13th IEEE International Symposium on HighPerformance Distributed Computing, Honolulu, Hawaii, USA, 2004.
[89] S. Jang, V. Taylor, X. Wu, M. Prajugo, E. Deelman, G. Mehta, and K. Vahi. Perfor-mance Prediction-Based Versus Load-based Site Selection: Quantifying the Dif-ference. In Proceedings of the 18th International Conference on Parallel and Dis-tributed Computing Systems, Las Vegas, Nevada, 2005.
[90] L. Kale, S. Kumar, M. Potnuru, J. DeSouza, and S. Bandhakavi. Faucets: Effi-cient Resource Allocation on the Computational Grid. In Proceedings of the 33rdInternational Conference on Parallel Processing, Quebec, Canada, 2004.
[91] W. Kang, H. Huang, and A. Grimshaw. A Highly Available Job Execution Servicein Computational Service Market. In Proceedings of the 8th IEEE/ACM Interna-tional Conference on Grid Computing, Austin, Texas, USA, 2007.
[92] U. Kant and D. Grosu. Double Auction Protocols for Resource Allocation in Grids.In Proceedings of the International Conference on Information Technology: Cod-ing and Computing, Nevada, USA, 2005.
[93] R. Keeney and H. Raiffa. Decisions with Multiple Objectives: Preferences andValue Tradeoffs. Cambridge University Press, 1993.
[94] T. Kelly. Generalized Knapsack Solvers for Multi-Unit Combinatorial Auctions:Analysis and Application to Computational Resource Allocation. Technical ReportHPL-2004-21, HP Labs, Palo Alto, CA, USA, 2004.
[95] H. Keung, J. Dyson, S. Jarvis, and G. Nudd. Performance Evaluation of aGrid Resource Monitoring and Discovery Service. IEE Proceedings - Software,150(4):243–251, 2003.
[96] A. S. Kiara Corrigan and C. Patel. Estimating Environmental Costs. In Proceedingsof the Ist USENIX Workshop on Sustainable Information Technology, San Jose, CA,USA, 2009.
[97] K. Kim, R. Buyya, and J. Kim. Power Aware Scheduling of Bag-of-Tasks Appli-cations with Deadline constraints on DVS-Enabled Clusters. In Proceedings of theSeventh IEEE International Symposium on Cluster Computing and the Grid, Riode Janeiro, Brazil, 2007.
[98] S. Kim and J. Weissman. A GA-based Approach for Scheduling DecomposableData Grid Applications. In Proceedings of the 2004 International Conference onParallel Processing, Montreal, Canada, 2004.
[99] L. Kleinrock. A Vision for the Internet. ST Journal of Research, 2(1):4–5, 2005.
[100] L. Kleinrock and R. Gail. Queueing Systems. Wiley New York, 1976.
REFERENCES 177
[101] S. Kumar, K. Dutta, and V. Mookerjee. Maximizing Business Value by OptimalAssignment of Jobs to Resources in Grid Computing. European Journal of Oper-ational Research, 194(3):856–872, 2009.
[102] K. Kurowski, J. Nabrzyski, A. Oleksiak, and J. Weglarz. Scheduling Jobs on theGrid–Multicriteria Approach. Computational Methods in Science and Technology,12(2):123–138, 2006.
[103] Y. Kwok, S. Song, and K. Hwang. Selfish Grid Computing: Game-Theoretic Mod-eling and NAS Performance Results. In Proceedings of the 5th IEEE InternationalSymposium on Cluster Computing and the Grid, Cardiff, UK, 2005.
[104] K. Lai, L. Rasmusson, E. Adar, L. Zhang, and B. Huberman. Tycoon: An Imple-mentation of a Distributed, Market-based Resource Allocation System. Multiagentand Grid Systems, 1(3):169–182, 2005.
[105] B. Lawson and E. Smirni. Power-Aware Resource Allocation in High-End Systemsvia Online Simulation. In Proceedings of the 19th Annual International Conferenceon Supercomputing, pages 229–238, Cambridge, USA, 2005.
[106] H. Li, D. Groep, and L. Wolters. Workload Characteristics of a Multi-ClusterSupercomputer. In Proceedings of the 7th Internation Workshop on Job SchedulingStrategies for Parallel Processing, New York, USA, 2004.
[107] J. Li and R. Yahyapour. Learning-based Negotiation Strategies for Grid Schedul-ing. In Proceedings of the 6th IEEE International Symposium on Cluster Comput-ing and the Grid, Singapore, 2006.
[108] M. Litzkow, M. Livny, and M. W. Mutka. Condor - A Hunter of Idle Workstations.In Proceedings of the 8th International Conference of Distributed Computing Sys-tems, San Jose, CA, 1988.
[109] U. Lublin and D. Feitelson. The Workload on Parallel Supercomputers: Modelingthe Characteristics of Rigid Jobs. Journal of Parallel and Distributed Computing,63(11):1105–1122, 2003.
[110] M. Maheswaran, S. Ali, H. J. Siegel, D. Hensgen, and R. Freund. Dynamic Map-ping of a Class of Independent Tasks onto Heterogeneous Computing Systems.Journal of Parallel and Distributed Computing, 59(2):107–131, 1999.
[111] J. Markoff and S. Hansell. Hiding in Plain Sight, Google Seeks More Power. NewYork Times, 14, 2006.
[112] S. Martello and P. Toth. An Algorithm for the Generalized Assignment Problem.Operational research, 81:589–603, 1981.
[113] S. Mingay. ITs Role in a Low Carbon Economy. Keynote Address, Greening theEnterprise, 2, 2008.
178 REFERENCES
[114] J. Moore, J. Chase, P. Ranganathan, and R. Sharma. Making Scheduling ”Cool”:Temperature-Aware Workload Placement in Data Centers. In Proceedings of the2005 USENIX Annual Technical Conference, Anaheim, CA, 2005.
[115] A. Mu’alem and D. Feitelson. Utilization, Predictability, Workloads, and UserRuntime Estimatesin Scheduling the IBM SP2 with Backfilling. IEEE Transactionson Parallel and Distributed Systems, 12(6):529–543, 2001.
[116] E. Munir, J. Li, and S. Shi. QoS Sufferage Heuristic for Independent Task Schedul-ing in Grid. Information Technology Journal, 6(8):1166–1170, 2007.
[117] J. Nakai and R. Van Der Wijngaart. Applicability of Markets to Global Schedulingin Grids. NAS Report, pages 03–004, 2003.
[118] M. Narumanchi and J. Vidal. Algorithms for Distributed Winner Determination inCombinatorial Auctions. Agent-Mediated Electronic Commerce. Designing Trad-ing Agents and Mechanisms, 3937:43–56, 2006.
[119] R. Nelson and T. Philips. An Approximation to the Response Time for ShortestQueue Routing. ACM SIGMETRICS Performance Evaluation Review, 17(1):181–189, 1989.
[120] R. Nelson and T. Philips. An Approximation for the Mean Response Time forShortest Queue Routing with General Interarrival and Service Times. PerformanceEvaluation, 17(2):123–139, 1993.
[121] D. Neumann, J. Stoesser, A. Anandasivam, and N. Borissov. Sorma-Building anApen Grid Market for Grid Resource Allocation. In Proceedings of the 4th In-ternational Workshop of Grid Economics and Business Models, Rennes, France,2007.
[122] N. Nisan. Bidding and Allocation in Combinatorial Auctions. In Proceedings ofthe 2nd ACM Conference on Electronic Commerce, pages 1–12, New York, NY,USA, 2000.
[123] S. Nozaki and S. Ross. Approximations in Finite-Capacity Multi-Server Queueswith Poisson Arrivals. Journal of Applied Probability, 15(4):826–834, 1978.
[124] G. Nudd, D. Kerbyson, E. Papaefstathiou, S. Perry, J. Harper, and D. Wilcox. Pace–A Toolset for the Performance Prediction of Parallel and Distributed Systems. In-ternational Journal of High Performance Computing Applications, 14(3):228–251,2000.
[125] D. Oppenheimer, J. Albrecht, D. Patterson, and A. Vahdat. Distributed ResourceDiscovery on PlanetLab with SWORD. In Proceedings of the 1st Workshop onReal, Large Distributed Systems, San Fancisco, CA, USA, 2004.
[126] A. Orgerie, L. Lefevre, and J. Gelas. Save Watts in Your Grid: Green Strategies forEnergy-Aware Framework in Large Scale Distributed Systems. In Proceedings ofthe 2008 14th IEEE International Conference on Parallel and Distributed Systems,Melbourne, Australia, 2008.
REFERENCES 179
[127] P. Padala, C. Harrison, N. Pelfort, E. Jansen, M. Frank, and C. Chokkareddy.OCEAN: The Open Computation Exchange and Arbitration Network, A MarketApproach to Meta Computing. In Proceedings of the 2nd International Symposiumon Parallel and Distributed Computing, Ljubljana, Slovenia, 2003.
[128] C. Patel, R. Sharma, C. Bash, and M. Beitelmal. Energy Flow in the InformationTechnology Stack: Coefficient of Performance of the Ensemble and its Impact onthe Total Cost of Ownership. HP Labs External Technical Report, HPL-2006-55,2006.
[129] C. Patel, R. Sharma, C. Bash, and S. Graupner. Energy Aware Grid: Global Work-load Placement based on Energy Efficiency. Technical Report HPL-2002-329, HPLabs, Palo Alto, Nov. 2002.
[130] P. Pillai and K. Shin. Real-time Dynamic Voltage Scaling for Low-Power Embed-ded Operating Systems. In Proceedings of the 18th ACM Symposium on OperatingSystems Principles, Banff, Canada, 2001.
[131] R. Porter. Mechanism Design for Online Real-Time Scheduling. In Proceedings ofthe 5th ACM Conference on Electronic Commerce, pages 61–70, New York, USA,2004.
[132] F. Ramme, T. Romke, and K. Kremer. A Distributed Computing Center Softwarefor the Efficient Use of Parallel Computer Systems. In Proceedings of the 1994 In-ternational Confernece on High Performance Computing and Networking, Munich,Germany, 1994.
[133] S. Rivoire, M. A. Shah, P. Ranganathan, and C. Kozyrakis. JouleSort: A BalancedEnergy-Efficiency Benchmark. In Proceedings of the 2007 ACM SIGMOD Inter-national Conference on Management of Data, New York, NY, USA, 2007.
[134] I. Rodero, F. Guim, J. Corbalan, and J. Labarta. eNANOS: Coordinated Schedulingin Grid Environments. In Proceedings of the 2005 International Conference onParallel Computing (ParCo), Malaga, Spain, 2005.
[135] L. Rudolph and P. Smith. Valuation of Ultra-scale Computing Systems. In Proceed-ings of 2000 Job Scheduling Strategies for Parallel Processing, Cancun, Mexico,2000.
[136] G. Sabin, V. Sahasrabudhe, and P. Sadayappan. Assessment and Enhancement ofMeta-Schedulers for Multi-Site Job Sharing. In Proceedings of 14th IEEE Interna-tional Symposium on High Performance Distributed Computing, Research TrianglePark, NC, 2005.
[137] V. Salapura et al. Power and Performance Optimization at the System Level. InProceedings of the 2nd Conference on Computing Frontiers, Ischia, Italy, 2005.
[138] M. Saltzman. COIN-OR: An Open-Source Library for Optimization. ProgrammingLanguages and Systems in Computational Economics and Finance, page 1, 2002.
180 REFERENCES
[139] T. Sandholm, K. Lai, and S. Clearwater. Admission Control in a ComputationalMarket. In Proceedings of the 2008 Eighth IEEE International Symposium onCluster Computing and the Grid, Lyon, France, 2008.
[140] T. Sandholm, K. Lai, J. Ortiz, and J. Odeberg. Market-Based Resource Alloca-tion using Price Prediction in a High Performance Computing Grid for ScientificApplications. In Proceedings of 15th IEEE International Symposium on High Per-formance Distributed Computing, Paris, France, 2006.
[141] H. A. Sanjay and S. Vadhiyar. Performance Modeling of Parallel Applications forGrid Scheduling. Journal of Parallel Distributed Computing, 68(8):1135–1145,2008.
[142] B. Schnizler. MACE: a Multi-Attribute Combinatorial Exchange. Negotiation,Auctions, and Market Engineering, 2:84–100.
[143] B. Schnizler. Resource Allocation in the Grid. A Market Engineering Approach,Ph.D. thesis. Studies on eOrganisation and Market Engineering, 2007.
[144] J. Shirazi. Java performance tuning. O’Reilly Media, Inc., 2003.
[145] E. Shmueli and D. Feitelson. Backfilling with Lookahead to Optimize The Packingof Parallel Jobs. Journal of Parallel and Distributed Computing, 65(9):1090–1107,2005.
[146] J. Shneidman, C. Ng, D. Parkes, A. AuYoung, A. Snoeren, A. Vahdat, and B. Chun.Why Markets Could (but Dont Currently) Solve Resource Allocation Problems inSystems. In Proceedings of the 10th USENIX Workshop on Hot Topics in OperatingSystem, Santa Fe, NM, USA, 2005.
[147] G. Singh, C. Kesselman, and E. Deelman. A Provisioning Model and its Compari-son with Best-Effort for Performance-Cost Optimization in Grids. In Proceedingsof the 16th International Symposium on High Performance Distributed Computing,California, USA, 2007.
[148] G. Singh, C. Kesselman, and E. Deelman. Adaptive Pricing for Resource Reserva-tions in Shared Environments. In Proceedings of the 8th IEEE/ACM InternationalConference on Grid Computing, Texas, USA, 2007.
[149] R. Smith. The Contract Net Protocol High-Level Communication and Control in aDistributed Porblem Solver. IEEE Transaction on Computer, 4:1104–1113, 1980.
[150] W. Smith, I. Foster, and V. Taylor. Predicting Application Run Times Using Histor-ical Information. In Proceedings of IPPS/SPDP ’98 Workshop on Job SchedulingStrategies for Parallel Processing, Florida, USA, 1998.
[151] O. Sonmez and A. Gursoy. A Novel Economic-based Scheduling Heuristic forComputational Grids. International Journal of High Performance Computing Ap-plications, 21(1):21, 2007.
REFERENCES 181
[152] M. Stonebraker, R. Devine, M. Kornacker, W. Litwin, A. Pfeffer, A. Sah, andC. Staelin. An Economic Paradigm for Query Processing and Data Migration inMariposa. In Proceedings of the 3rd International Conference on Parallel andDistributed Information Systems, Austin, Texas, USA, 1994.
[153] J. Stosser, P. Bodenbenner, S. See, and D. Neumann. A Discriminatory Pay-as-BidMechanism for Efficient Scheduling in the Sun N1 Grid Engine. In Proceedingsof the 41st Annual Hawaii International Conference on System Sciences, Hawaii,2008.
[154] G. Stuer, K. Vanmechelen, and J. Broeckhove. A Commodity Market Algorithmfor Pricing Substitutable Grid Resources. Future Generation Computer Systems,23(5):688–701, 2007.
[155] M. Surridge, S. Taylor, D. De Roure, and E. Zaluska. Experiences with GRIAIndustrial Applications on a Web Services Grid. In Proceedings of the Ist Interna-tional Conference on e-Science and Grid Computing, Melbourne, Australia, 2005.
[156] Z. Tan and J. Gurd. Market-based Grid Resource Allocation using a Stable Con-tinuous Double Auction. In Proceedings of the 8th IEEE/ACM International Con-ference on Grid Computing, Austin, Texas, USA, 2007.
[157] Q. Tang, S. K. S. Gupta, D. Stanzione, and P. Cayton. Thermal-Aware TaskScheduling to Minimize Energy Usage of Blade Server Based Datacenters. InProceedings of the 2nd IEEE International Symposium on Dependable, Autonomicand Secure Computing, Los Alamitos, CA, USA, 2006.
[158] G. Tesauro et al. Managing Power Consumption and Performance of ComputingSystems Using Reinforcement Learning. In Proceedings of the 21st Annual Con-ference on Neural Information Processing Systems, Vancouver, Canada, 2007.
[159] United States Environmental Protection Agency. Report to Congress onServer and Data Center Energy Efficiency, Public Law 109-431. http://www.energystar.gov/ia/partners/prod_development/downloads/EPA_Datacenter_Report_Congress_Final1.pdf,Aug. 2007.
[160] U.S. Department of Energy. US Energy Information Administration(EIA) report. http://www.eia.doe.gov/cneaf/electricity/epm/table5_6_a.html, 2007.
[161] U.S. Department of Energy. Voluntary Reporting of Green-house Gases: Appendix F. Electricity Emission Factors, 2007.http://www.eia.doe.gov/oiaf/1605/pdf/Appendix20F r071023.pdf.
[162] S. Venugopal, X. Chu, and R. Buyya. A Negotiation Mechanism for AdvanceResource Reservation using the Alternate Offers Protocol. In Proceedings of the16th International Workshop on Quality of Service, Netherlands, 2008.
182 REFERENCES
[163] S. Venugopal, K. Nadiminti, H. Gibbins, and R. Buyya. Designing a ResourceBroker for Heterogeneous Grids. Software: Practice and Experience, 38(8):793–826, 2008.
[164] G. Verdun, D. Azevedo, H. Barrass, S. Berard, M. Bramfitt, T. Cader, T. Darby,C. Long, N. Gruendler, B. Macarthur, et al. The Green Grid Metrics: Data CenterInfrastructure Efficiency (DCIE) Detailed Analysis. The Green Grid, 2008.
[165] C. A. Waldspurger, T. Hogg, B. A. Huberman, J. O. Kep hart, and W. S. Stornetta.Spawn: A Distributed Computational Economy. IEEE Transactions on SoftwareEngineering, 18(2):103–117, 1992.
[166] L. Wang, H. J. Siegel, V. Royehowdhury, and A. Maciejewski. Task Match-ing and Scheduling in Heterogeneous Computing Environments Using a Genetic-Algorithm-Based Approach. Journal of Parallel and Distributed Computing,47(1):8–22, 1997.
[167] L. Wang and Y. Lu. Efficient Power Management of Heterogeneous Soft Real-TimeClusters. In Proceedings of the 2008 Real-Time Systems Symposium, Barcelona,Spain, 2008.
[168] R. Wolski, J. Plank, J. Brevik, and T. Bryan. Analyzing Market-based ResourceAllocation Strategies for the Computational Grid. International Journal of HighPerformance Computing Applications, 15(3):258, 2001.
[169] R. Wolski, J. Plank, J. Brevik, and T. Bryan. G-commerce: Market FormulationsControlling Resource Allocation on the Computational Grid. In Proceedings ofthe 2001 International Parallel and Distributed Processing Symposium, CA, USA,2001.
[170] R. Wolski, N. Spring, and J. Hayes. The Network Weather Service: A DistributedResource Performance Forecasting Service for Metacomputing. Journal of FutureGeneration Computing Systems, 15:757–768, 1999.
[171] L. Xiao, Y. Zhu, L. Ni, and Z. Xu. GridIS: An Incentive-Based Grid Scheduling.In Proceedings of the 19th IEEE International Parallel and Distributed ProcessingSymposium, Denver, Colorado, USA, 2005.
[172] W. Xiaohui, D. Zhaohui, Y. Shutao, H. Chang, and L. Huizhen. CSF4: A WSRFcompliant meta-scheduler. In Proceedings of the 2006 World Congress in Com-puter Science, Computer Engineering, and Applied Computing, Las Vegas, Nevada,USA, 2006.
[173] B. A. Yair Amir and R. S. Borgstrom. The Java Market: Transforming the Internetinto a Metacomputer. Technical Report CNDS-98-1, Johns Hopkins University,1998.
[174] C. Yeo and R. Buyya. Service Level Agreement based Allocation of Cluster Re-sources: Handling Penalty to Enhance Utility. In Proceedings of the 7th IEEEInternational Conference on Cluster Computing, Boston, USA, 2005.
REFERENCES 183
[175] C. Yeo and R. Buyya. A Taxonomy of Market-based Resource Management Sys-tems for Utility-Driven Cluster Computing. Software: Practice and Experience,36(13):1381, 2006.
[176] J. Yu, R. Buyya, and C. Tham. Cost-based Scheduling of Scientific Workflow Ap-plications on Utility Grids. In Proceeding of the 1st IEEE International Conferenceon e-Science and Grid Computing, Melbourne, Australia, 2005.
[177] J. Yu, S. Venugopal, and R. Buyya. A Market-Oriented Grid Directory Servicefor Publication and Discovery of Grid Service Providers and their Services. TheJournal of Supercomputing, 36(1):17–31, 2006.
[178] W. Zhang, A. Cheng, and M. Hu. Multisite Co-allocation Algorithms for Com-putational Grid. In Proceedings of the 20th International Parallel and DistributedProcessing Symposium, Rhodes Island, Greece, 2006.
[179] H. Zhao and X. Li. Efficient Grid Task-Bundle Allocation Using Bargaining BasedSelf-Adaptive Auction. In Proceedings of the 9th IEEE/ACM International Sym-posium on Cluster Computing and the Grid, Shanghai, China, 2009.
[180] S. Zhou, X. Zheng, J. Wang, and P. Delisle. Utopia: A Load sharing Facilityfor Large, Heterogeneous Distributed Computer Systems. Software, Practice &Experience, 23(12):1305–1336, 1993.