metabolic control phenomena involved in damped … · metabolic control phenomena involved in...
TRANSCRIPT

TFIE JOURNAL OF BIOLOGICAL CHE~XISTRI Vol. 240, No.7, July 1965
Printed in U.S.A.
Metabolic Control Phenomena Involved in Damped Sinusoidal Oscillations of Reduced Diphosphopyridine Nucleotide in a
Cell-free Extract of Saccharomyces carlsbergensis
BRITTON CHANCE, BRIGITTE SCNOENER, AND SIGRID ELSAESSER
From the Johnson Research Foundation, University oj Pennsylvania, Philadelphia, Pennsylvania 19104
(Received for publication, December 4, 1964)
The possibility that the periodicities of biological systems (clock phenomena) are dependent upon periodic fluctuations of intermediates in enzymatic systems represents a hypothesis which has surely colored the thinking of many of the investi- gators of this important biological problem (1, 2). Of the many periodic responses of biological systems (3), some appear more closely associated with biochemical processes such as the fluctuations of luminescence and of bacteria and Gonyaulax (4) which show intracellular localization as well. Periodic phe- nomena have also been observed in respiration rate (5).
Chemical assays for reduced pyridine nucleotide have been carried out on a number of cells and tissues beginning with the work of von Euler, Schlenk, Heiwinkel, and Hogberg (6). How- ever, attention was drawn to the importance of the intracellular kinetics of reduced pyridine nucleotide following the develop- ment of the double beam spectrophotometer (7, 8) which allowed a direct recording of changes of the oxidation-reduction state of DPNH in the transition from the aerobic to the anaerobic state. Such transitions usually showed a monotonic, exponential response, for example, in yeast cells supplemented with alcohol as a substrate (9). However, upon addition of glucose (or sucrose) to the aerobic, starved cell or to the anaerobic cell, the cyclic responses of intracellular DPNH were observed (10, 11). For example, a full cycle of oscillation of the DPNH level was observed on adding sucrose to the aerobic cells (12). This response, consisting of a large initial reduction of DPN with an oscillatory recovery to the steady state level, was tentatively attributed to the binding of pyridine nucleotide to glyceralde- hyde-3-P dehydrogenase (10) or to the DPN:DPNH feedback over the whole glycolytic system by Holzer and Freytag-Hilf (13). Holzer and Freytag-Hilf (13) and Estabrook, Maitra, and Chance (14) have carried out metabolic assays during the cyclic response. Fluctuations of a similar type were observed in the concentration of P-glycerate and ribulose-di-P upon illumination of Scenedesmus by Wilson and Calvin (15).
A more persistent fluctuation of the reduced pyridine level following the aerobic to anaerobic transition of bakers’ yeast cells was observed fluorometrically by Duysens and Amesz (16), and in 1960 Matthaeii observed a persistent damped sinusoidal oscillation of DPNH with a 20.set period following the aerobic to anaerobic transition of a suspension of Candida utilis. In this laboratory a damped train of up to 12 oscillations was observed in an inositol-requiring strain of Saccharomyces carls-
1 J. H. Matthaei, personal communication.
bergensis (ATCC 4228) (11, 12), and metabolite assays showed the oscillation of most of the glycolytic intermediates with a crossover point between glucose-6-P and fructose-di-P (17). These metabolite assays have been confirmed and greatly ex- tended with a special attention to the phase relationships of the oscillations in the concentrations of the various intermediates (18, 19). Hornme@ has also observed the oscillations in a re- lated strain of X. carlsbergensis and in other yeast as well and has also found fluctuations of the glycolytic intermediates (20- 22).3 A mathematical analysis of the oscillation reaction in yeast has been put forward by Higgins (24).
The more recent findings of oscillations of the DPNH level of a cell-free extract containing the glycolytic system of X. curls- bergensis (25) have opened a new field of investigations of meta- bolic control phenomena. In a series of experiments reported elsewhere, we have described control of the wave form of the oscillation, its period, amplitude, and phase relationship in response to a number of factors, particularly adenine nucleotides, in order to determine how well this model enzyme system suits the needs of a “master oscillator” for a biological clock (26). In a preliminary report we have described the general nature of the response of the oscillations of the cell-free extract to cyclic 3’ ,5’-AMP and have further pointed out the reactivation of oscillations by this reagent (27). In this paper we have ex- plored metabolic control phenomena in the cell-free extract. These phenomena can be examined under two conditions, by additions made at (a) the maximum of DPN reduction and (b) a minimum of DPN reduction. This method of timing the addi- tions of control metabolites and nucleotides with respect to the oscillation cycle gives information on the separate mechanisms which control DPNH oxidation and DPN reduction. This
2 F. Hommes, personal communication. 3 Since cyclic fluctuations of experimental data are phenomena
of the type which are suspect of artifact, the possibility of putting the oscillations on a biochemical basis has led to a re-evaluation of numerous experimental data which suggested such fluctuations and which are of considerable interest (E. K. Pye, University of Manchester (23); J. Matthaei, Max-Planck-Ges. Giittingeni N. Solomas. Universitv of Cambridge: N. Haueaard. Universitv of Pennsylvania; J. Lowenstein, Br&deis University.) Since sub- mitting the manuscript for publication, oscillations of glycolytic intermediates have been observed in a cell-free extract from rat heart (as reported at the Federation Meeting Symposium on Cyclic and Oscillatory Biochemical Systems, 1965) and oscillations of mitochondrial volumes have been observed (as reported at the Federation Meeting Symposium on Cyclic and Oscillatory Bio- chemical Systems, 1965).
3170
by guest on June 5, 2018http://w
ww
.jbc.org/D
ownloaded from

July 1965 B. Chance, B. Schoener, and S. Elsaesser 3171
paper reports the effects of activators and inhibitors on the oscillatory reaction in the yeast extract. The only component recorded in these studies is DPXH, as observed spectrophoto- metrically. The experimental results identify metabolites and nucleotides which are important in the metabolic control phe- nomena and, in addition, point to appropriate conditions for obtaining novel steady states of the oscillatory system which are suitable for subsequent analysis of all intermediates.
EXPERIMENTAL PROCEDURE
Preparations-The inositol-requiring strain of Sacchurom~ces carlsbergensis (ATTA 4228) was grown on an artificial medium containing glucose, citrate, inositol, vitamin mixture, casein hydrolysate, and salt mixture (12). In order to obtain a more luxuriant growth of cells, 4 mg of ergosterol and 1 g of yeast extract were added per liter of growth medium. The growth medium (2.5 liters) was inoculated with 8 ml of a precultivated yeast suspension in a 6-liter flask (19). Incubation for 13 to 14 hours at 30”32” was carried out under continuous aeration. The yield was 40 to 60 g of yeast, wet weight, per 6 liters. Prior to the preparation of the cell extract, a variety of treatments were tested in order to provide more favorable conditions for the oscillations in the extract, and it was found useful to wash the cells free of endogenous substrate and to treat them with glucose as well, essentially to simulate the conditions employed to show the oscillations in vivo (12). The harvested cells were washed twice with 0.1 M phosphate buffer, pH 4.5; a type I preparation (26) is made direct,ly from the cells in this condi- tion. In this paper we employ a type II preparation (26) which is made from cells which have been resuspended at a 1:5 dilution in 0.1 M phosphate buffer, pH 4.5, and aerated for 3 hours at 25”. The cells for the type II preparation are centri- fuged and, after the supernatant solution is decanted, are stored at 4”. The type II preparation is often identified by the number of hours the cells are stored under these conditions. Prior to rupture, the cells are resuspended in 0.1 M phosphate buffer, pH 6.5; the resuspending medium contains 5 rnru glucose. They are t,hen recentrifuged to a hard pellet. When the Aminco pressure cell is used, a 20-g sample of packed cells is employed, and the press is operated at 8000 pounds per sq in. When high intensity ultrasound is used, 12 g of the packed cells are diluted with 2 ml of 0.1 M phosphate, pH 6.5; a Branson unit is employed and is operated for four intervals of 30 set each at a current of 6 amperes. In both cases cell debris and unruptured cells are removed by centrifugation at 17,300 X g for 30 min at 0”. The supernatant solution is then recentrifuged for 60 min at 105,000 x g in the Spinco model L centrifuge at 0”. The super- natant solution is slightly turbid and opalescent, and may have a thin layer of fat on top which may be removed by aspiration. The yield from the pressure cell is 15 to 25 mg of protein per g of yeast, wet weight, at a protein concentration of 60 to 120 mg per ml, the extract containing less than 1 X 1OW of the initial number of intact cells. The yield with the sonic disruption technique is 35 to 40 mg of protein per g of yeast at a protein concentration of 70 to 150 mg per ml. Apparently any method of cell rupture which maintains a high protein concentration is satisfactory. The cell-free extract may be frozen at -20” and will maint.ain its oscillatory activity for several days, at least.
The extracts contain the glycolytic intermediates, glycogen equivalent to 7 mM glucose and glucose in the range of 1 to 24 mM (28). The concentration of ethanol in the extracts is 40
to 80 mM (28).4 The rate of ethanol formation is about 10 pmoles per min per mg of protein.4 The DPNH is largely oxidized at the minimum point of the oscillation, and reaches about 6 mkmoles per mg of protein at the maximum.4 The concentration change can be computed from the recordings with As = 5 cm-l X rnM-i or 1 rnr@ for a 2-mm optical path.
Physical Methods-Since the observation of the train of oscil- lations from a single sample of the cell-free extract may require several hours and the total interval over which the extract may exhibit oscillatory behavior may be about 6 to 12 hours, it has been found desirable to observe samples of the same extract simultaneously with three spectrophotometers so that compara- tive data may be obtained on the oscillatory characteristics of a particular cell-free extract without having to compare results obtained from different extracts of possibly differing properties.
Our experimental procedure in this paper is to examine the metabolic control status of these oscillations by the addition of appropriate metabolite intermediates at appropriate times dur- ing the oscillation cycle. This technique differs from that used in Reference 25 where the metabolite intermediate was added before the extract was warmed to room temperature, and there- fore the timing of the addition with respect to the oscillatory cycle was not controlled. Actually, no additions are necessary for initiating the oscillations; studies reported elsewhere (26) indicate that the oscillations are probably proceeding in the cell-free extract maintained at 0”.
In order to compare exactly the properties of the two oscillat- ing systems, one with inhibitor and the other without inhibitor, two of the samples were pipetted into a pair of cuvettes simul- taneously so that the oscillations start in phase. Experiments showed that this gave oscillations in which the synchrony per- sisted for over 1 hour. Thus it was possible to treat the system with the inhibitor and to observe its phase relationship to the continuing oscillations in the uninhibited sample. The chemical additions are specified not only with respect to concentration but also with respect to the number of the oscillation cycle and its phase with respect to a DPNH ma,ximum or minimum.
The spectrophotometers which have been employed are the double beam instrument with interference filters (26) and the usual type of double beam spectrophotometer equipped with Bausch and Lomb or Beckman monochromators (7). The dou- ble beam spectrophotometer is desirable for this type of recording because of its inherent great stability; continuous recording of the oscillations over a period of several hours is desirable without the opportunity of “zero” checking. The absorbance changes are large under favorable conditions, up to 20% per mm. Thus, the short optical path provides a satisfactory result and con- serves material. Usually, transmission changes are recorded directly; the nonlinearity involved does not cause an error in the determination of the period, but would serve to round off the tops of the DPNH maxima of a sinusoidal wave form as in Fig. 2A. Obviously, optical density recording would be pref- erable for the larger changes.
Since the extract was fluorescent, a guard filter was usually employed which rendered the photomultiplier sensitive only to wave lengths in the region of 330 to 400 mp. It should be noted that since oxidation-reduction changes in hemoproteins do not occur in the extract, the reference wave length of approxi- mately 400 rnp is satisfactory. The changes of concentration
4 Y. Cassuto, personal communication.
by guest on June 5, 2018http://w
ww
.jbc.org/D
ownloaded from

3172 DPNH Oscillations in Glycolytic Xystems Vol. 240, No. 7
Cel I Free 4 Extract Prep
Type II (96 Hrs.),
Cell Free Extract Type It (72 Hrs.)
340-400mp
A
k30min-rl T
340 - 300mp
Ith
IB
D; 1.09 Q = 12.6
DPN Reduction t
FIG. 1. A, illustration of two types of wave forms generated by oscillations in a cell-free extract. Record A, typical sinusoidal oscillation, type II preparation (72 hours). Absorbance changes measured in l-mm path cuvette. Protein, 85 mg per ml; tempera- ture, 25’; pH 6.8 (Experiment 460-C-6). B, typical recording of nonsinusoidal oscillations; cell-free extract type II (96 hours). Protein, 93 mg per ml; temperature 25”; optical path 1 mm. Damping factor (DF) and Q are defined in the text (Experiment 459-C-6).
can be calculated with 0.5 mm-1 mM+. The changes recorded are largely due to DPNH, as determined by chemical assay (28).
RESULTS
The two charts of Fig. 1 illustrate the two types of oscillations observed in these extracts. In Fig. IA, a type II extract from cells stored 72 hours at 0” and studied at 25” shows an approxi- mately sinusoidal oscillation with a period of 113 min, a damping factor of 1.1, and a Q of 20.4.5 Approximately 11 full cycles of oscillation can be observed. Since the extract is usually already oscillating at 0” with a period of about 2 hours (26), the oscillations are accelerated when the cuvette is filled with the chilled yeast extract and the extract is allowed to come to room temperature. Also frequently observed are nonsinusoidal oscillations of the type indicated by Fig. lB, where the length of time in which the pyridine nucleotide is oxidized is much greater than that in which it is reduced. The number of cycles of oscillation of the nonsinusoidal mode6 may be just as great as in the sinusoidal mode. The damping factor is equally low, 1.09; the Q is slightly lower than that of Fig. 1A. Both types of wave
5 The damping factor is defined as the ratio of the amplitude of oscillation in one direction to the amplitude of the next oscil- lation in the opposite direction. Q is defined as ?r times the num- ber of cycles in which the amplitude falls to l/e of its initial value (12) f
6 The mathematical equation for the nonsinusoidal oscillation is
378 + 180 cos ot + 68 cos 2 wt + 14.5 cos 3 wt + 26 sin wt + 40 sin 2 wt + 9.9 sin 3 wt
where w = 0.30 min-’ (Experiment 459-2). (Thanks are due to Mr. Martin Poe for the computer computations.)
forms are simulated by the simple mechanism for enzymatic oscillations (24). The wave form of the oscillations apparently depends in part upon the nucleotide and substrate levels (see below).
Control by Glucose-6-P-Two general types of control of the DPNH level have been observed: first, substrate control, in which glucose-6-P or pyruvate dominates, and second, adenine nucleotide control. Since glycogen and glucose are being con- tinuously expended, it is easy to show this response, and Fig. 2 provides two examples of the control of the DPNH level by glucose-6-P.
In Fig. 2A, an extract of type II (96 hours) is studied in the double beam spectrophot,ometer with a 2-mm optical path. Sinusoidal oscillations of the type corresponding to Fig. 1A are observed on warming the cell extract and are allowed to proceed for one full cycle. The first addition of 2.5 mM glucose- 6-P at the second DPNH minimum rapidly causes a high degree of DPN reduction, which suggests that at this point DPN reduc- tion is limited by the rate of formation of glyceraldehyde-3-P. The oscillation increases in amplitude in the following cycle and
Cell Free Extract Type II (96 Hrs.)
Minutes
7f- 340-400mp 20% 2mm Path
ternin
DF
2.5mM G6P 2.5mM G6P DF = 1.05
A DPN Reduction t
Cell Free Extract Type II (72 Hrs.)
340-400mp 2mm Path
B DPN Reduction t
FIG. 2. A and B, effects of glucose-6-P (G-6-P) upon the oscil- lations. The moments of addition of 2.5 rnM glucose-6-P are indi- cated in both figures as are the periods of the oscillations. The optical path length is 2 mm; protein concentration in A is 69 mg per ml; in B, 61 mg per ml; temperature 25”; pH 6.8 (Experiments 462-D-10 and 462-C-10).
by guest on June 5, 2018http://w
ww
.jbc.org/D
ownloaded from

July 1965 B. Chance, B. Xchoener, and S. Elsaesser 3173
then diminishes to a smaller amplitude in succeeding cycles. A second addition of 2.5 mM glucose-6-P at the fifth DPNH mini- mum again causes rapid reduct’ion of DPN and an increase in the amplitude of the following cycle. The extracts employed in Fig. 2, A and B, are of a type reported in our previous publication (25). There ADP and AMP did not have a large effect upon the oscillation as shown by a separate experiment in which the extract employed in Fig. 2 was treated with 5 mM ADP. Never- theless, the oscillations proceeded at t’he same amplitude. The result,s of this paper now clarify this result by indicating that sensitivity to ADP is exhibited only over a portion of the oscilla- t,ion cycle.
In Fig. 2B, glucose-6-P is observed to reactivate an oscillation that is nearly stopped. A cell extract of type II (72 hours) oscillates with a high damping factor (3.2) when it is warmed to room temperature. Addition of glucose-6-P at the second DPNH minimum initiates an oscillation of lower damping factor and larger amplitude. The oscillation is again reactivated by a second addition of glucose-6-P at, the fifth DPNH minimum; this time, however, the damping factor is higher, probably be- cause of the accumulation of reaction products (alcohol and aldehyde) .
Control of DPNH Level by ;ldenine Nucleotides-Different control characteristics are illustrat,ed in Fig. 3. Approximately sinusoidal oscillations are observed on warming the suspension to room temperature (Fig. 3A). After one full cycle, 1.5 mM AMP is added at the DPNH minimum. There then ensues a much more rapid DPN reduct,ion than occurred in the spontane- ous oscillation, and the amplitude of the oscillation is somewhat increased. One and one-half cycles later, at the DPNH maxi- mum, 5 nlM ATP is added. There is a rapid jump in the direc- tion of oxidation at this point., and after a few minutes, the level of the DPN reduction exceeds that observed in the oscilla- tions. Thereafter, no further oscillations are observed. These experiments indicate the activation of DPN reduction by AMP (or ADP, see Fig. 3B) and the act.ivation of DPNH oxidation by ATP. It has been generally observed that the oscillation will continue in the presence of added ,4DP but comes to a halt following the addition of ATP; the ,4TPase activity of the ex- tract is inadequate to return the ATP:ADP value to within the range in which oscillations occur.
An explanation of the nonsinusoidal wave form of Fig. 1B is afforded by the measurements of the response of DPNH to the addition of ADP (Fig. 3B). The portion of the oscillation of a nonsinusoidal wave form shown in the left-hand portion of the chart is actually the last of a series of such oscillations. iZDP is then added, and it causes a cycle of pyridine nucleotide reduction and oxidation which has the same characteristic shape as is observed to occur spontaneously in the preceding cycle of oscillation. The duration of this cycle approximates the time to phosphorylate the added ADP to ATP and thus the ADP concentration change is approximately the same in the two cases. However, the rate of DPNH oxidation is less in the left-hand figure (see Fig. 3C). In this type of extract, which exhibits a nonsinusoidal wave form and which is insensitive to hexose phosphates, we ident,ify the cycle of pyridine nucleotide reduction with an increase of ADP (or AMP) concentration (and a fall in the ATP concentration (19)). Other experiments show ADP to be highly effective in concentrations of 0.5 mM when added to the DPNH minimum. When added to the DPNH maximum, ADP prolongs only slightly the time for
Cell Free Extract Type II (18 Hrs.1
Cell Free Extract
4.8mi
2mm Poth 40 -4OOmp
DPN Reduction t A DPN Reduction t B
Cell Free Extract Type II (18 Hrs.)
40mi
Imm Path
1.5mM ADP
DPN Reduction t c
FIG. 3. A, effects of 5’-AMP and ATP. The preparation of yeast extract followed the typical procedure for type II, except that glucose was not added prior to rupture of the cells. Optical path length, 2 mm; protein concentration, 58 mg per ml (Experi- ment 462-B-7). B, a comparison of the “pulse” duration observed to occur spontaneously in the course of the nonsinusoidal oscilla- tions (left-hand portion) and caused to occur on the addition of 1.5 mM ADP (right-hand portion). Optical path, 2 mm; protein concentration, 25.4 mg per ml; temperature 26”; pH 6.8 (Experi- ment 461-A-6). C, kinetics of oxidation of DPNH on addition of 1.5 mM ADP at the DPNH minimum. The oscillations are recorded on two time scales (20 min per vertical division and 0.33 min per vertical division). The scale expansion occurs at the sharp break in the trace. Optical path, 1 mm; 25.4 mg of protein per ml; temperature 25”; pH 6.8 (Experiment 461-A-2).
reoxidation, while ATP causes initially a rapid oxidation as shown in Fig. 3,4.
Kinetics of DPN Reduction by ADP--By employing a more rapid chart speed at the time of ADP addition, it is possible to compare the speed with which DPN can be reduced upon addi- tion of ADP with the maximum speed of DPN change in the spontaneous sinusoidal oscillations and thus provide information of the relationship between maximal enzymatic activities and the period of oscillation. The experiment of Fig. 3C is a typical record. By taking into account the 60-fold difference in the time scales employed in the recording (20 min per division on the left side and 0.33 min per division on the right side), the initial rate of DPN reduction on adding ADP is 30 times the maximal rate of change of DPN reduction in the steady state oscillation. This result is in agreement with biochemical and computer studies of enzymatic oscillatory systems which indicate that the speed of the DPNH change in the steady state oscillation is considerably less than the maximal velocity in either direction.
by guest on June 5, 2018http://w
ww
.jbc.org/D
ownloaded from
3174 DPNH Oscillations in Glycolytic Systems Vol. 240, No. 7
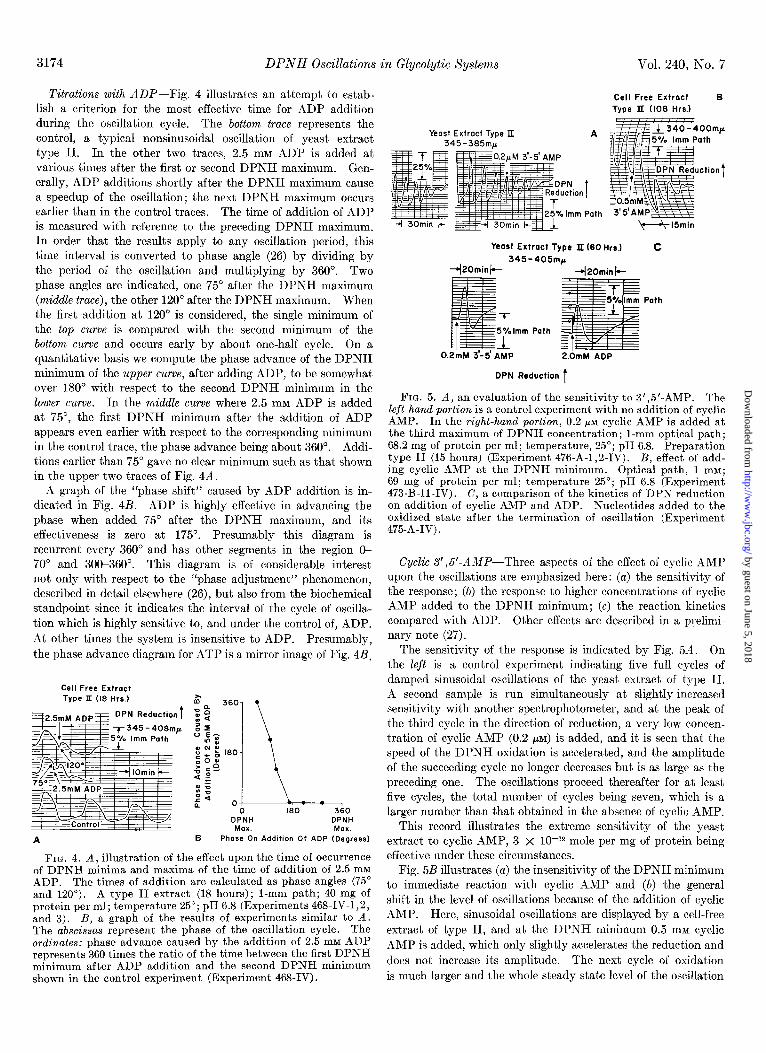
Titrations with ADP-Fig. 4 illustrates an attempt to estab- lish a criterion for the most effective time for ADP addition during the oscillation cycle. The bottom trace represents the control, a typical nonsinusoidal oscillation of yeast extract type II. In the other two traces, 2.5 mM ADP is added at various times after the first or second DPNH maximum. Gen- erally, ADP additions shortly after the DPNH maximum cause a speedup of the oscillation; the next DPNH maximum occurs earlier than in the control traces. The time of addition of ADP is measured with reference to the preceding DPNH maximum. In order that the results apply to any oscillation period, this time interval is converted to phase angle (26) by dividing by the period of the oscillation and multiplying by 360”. Two phase angles are indicated, one 75” after the DPNH maximum (middle trace), the other 120” after the DPNH maximum. When the first addition at 120” is considered, the single minimum of the top curve is compared with the second minimum of the bottom curve and occurs early by about one-half cycle. On a quantitative basis we compute the phase advance of the DPNH minimum of the upper curve, after adding ADP, to be somewhat over 180” with respect to the second DPNH minimum in the lower curve. In the middle curve where 2.5 mM ADP is added at 75”, the first DPNH minimum after the addition of ADP appears even earlier with respect to the corresponding minimum in the control trace, the phase advance being about 360”. Addi- tions earlier than 75” gave no clear minimum such as that shown in the upper two traces of Fig. 4A.
A graph of the “phase shift” caused by ADP addition is in- dicated in Fig. 4B. ADP is highly effective in advancing the phase when added 75” after the DPNH maximum, and it,s effectiveness is zero at 175”. Presumably this diagram is recurrent every 360” and has other segments in the region O- 70” and 300-360”. This diagram is of considerable interest not only with respect to the “phase adjustment” phenomenon, described in detail elsewhere (26), but also from the biochemical standpoint since it indicates the interval of the cycle of oscilla- tion which is highly sensitive to, and under the control of, ADP. At other times the system is insensitive to ADP. Presumably, the phase advance diagram for ATP is a mirror image of Fig. 4B.
Cell Free Exiract Type I (18 Hrs.) 360
180
0 ! 0
DPNH MOX.
DPNH Max.
A B Phase On Addition Of ADP (Degrees)
FIG. 4. A, illustration of the effect upon the time of occurrence of DPNH minima and maxima of the time of addition of 2.5 mM ADP. The times of addition are calculated as phase angles (75” and 120”). A type II extract (18 hours); l-mm path; 40 mg of protein per ml; temperature 25”; pH 6.8 (Experiments 468-D-1,2, and 3). B, a graph of the results of experiments similar to A. The abscissas represent the phase of the oscillation cycle. The ordinates: phase advance caused by the addition of 2.5 rnrvr ADP represents 360 times the ratio of the time between the first DPNH minimum after ADP addition and the second DPNH minimum shown in the control experiment (Experiment 46%IV).
Cell Free Extract B Type It (108 Hrs.)
Yeast Extract Type IJZ A 5% Imm Path
o Imm Path 3’5’AM Ml5min
Yeast Extract Type II (60 Hrs.) C 345-405mp
-42Omin I+
Path
f 5%lmm Path
I %?mM 3-5 AMP 2.0mM ADP
DPN Reduction /
FIG. 5. A, an evaluation of the sensitivity to 3’,5’-AMP. The left-hand portion is a control experiment with no addition of cyclic AMP. In the right-hand portion, 0.2 PM cyclic AMP is added at the third maximum of DPNH concentration; l-mm optical path; 68.2 mg of protein per ml; temperature, 25”; pH 6.8. Preparation type II (15 hours) (Experiment 476-A-1,2-IV). B, effect of add- ing cyclic AMP at the DPNH minimum. Optical path, 1 mM; 69 mg of protein per ml; temperature 25’; pH 6.8 (Experiment 473-B-11-IV). C, a comparison of the kinetics of DPN reduction on addition of cyclic AMP and ADP. Nucleotides added to the oxidized state after the termination of oscillation (Experiment 475.A-IV).
CycKc S’,5’-AMP-Three aspects of the effect of cyclic AMP upon the oscillations are emphasized here: (u) the sensit.ivity of the response; (b) the response to higher concentrations of cyclic AMP added to the DPNH minimum; (c) the reaction kinetics compared with ADP. Other effects are described in a prelimi- nary note (27).
The sensitivity of the response is indicated by Fig. 5d. On the left is a control experiment indicating five full cycles of damped sinusoidal oscillations of the yeast extract of type II. A second sample is run simultaneously at slightly increased sensitivity with another spectrophotometer, and at the peak of the third cycle in the direction of reduction, a very low concen- tration of cyclic AMP (0.2 PM) is added, and it is seen that the speed of the DPNH oxidation is accelerated, and the amplitude of the succeeding cycle no longer decreases but is as large as the preceding one. The oscillations proceed thereafter for at least five cycles, the total number of cycles being seven, which is a larger number than that obtained in the absence of cyclic AMP.
This record illustrates the extreme sensitivity of the yeast extract to cyclic AMP, 3 x lo-l2 mole per mg of protein being effective under these circumstances.
Fig. 5B illustrates (a) the insensitivity of the DPNH minimum to immediate reaction with cyclic AMP and (b) the general shift in the level of oscillations because of the addition of cyclic AMP. Here, sinusoidal oscillations are displayed by a cell-free extract of type II, and at the DPNH minimum 0.5 rnM cyclic AMP is added, which only slightly accelerates the reduction and does not increase its amplitude. The next cycle of oxidation is much larger and the whole steady state level of the oscillation
by guest on June 5, 2018http://w
ww
.jbc.org/D
ownloaded from

July 1965 B. Chance, B. Xchoener, and S. Elsaesser 3175
Cell Free Extract Type II (72 Hrs.)
5mM Pyruvate
Yeast Extract T
vate
340-400mp 20% 2mm Path
OF= 1.05
DPN Reduction B
FIG. 6. A, effect of addition of 2 mM pyruvate to the oscillation at the second DPNH maximum. Optical path, 1 mm; 103.4 mg of protein per ml; temperature 25”; pH 6.8 (Experiment 476-B. IV). B, addition of 5 mM pyruvate at the second DPNH maxi- mum. The periods and damping factors are indicated in the figure. Pyruvate (5 mM) is again added at the seventh DPNH maximum. Optical path, 2 mm; 61.2 mg of protein per ml; pH 6.8; temperature 26” (Experiment 462-C-11-W).
is moved in the direction of oxidation. There follows a damped train of approximately four complete cycles (27).
Fig. 5C illustrates the kinetics of the response of the cell-free extract to addition of 3’ ,5’-AMP and ADP added after the cessation of oscillations near the DPNH minimum. Similar results can be obtained by addition of cyclic AMP to the DPNH minima of nonsinusoidal oscillations. On the Z& is illustrated the effect of adding 0.2 mM cyclic AMP. The record shows that after a 1-min delay, increased reduction of DPN occurs and reaches a maximum in 5 min. Thereafter, an overshoot of DPN occurs with a nonoscillatory approach to a final steady state. On the right-hand side is illustrated the effects of adding 2 mM ADP. It appears as if there is an immediate increase of DPN reduction on adding ADP, which is substantiated by the records of the preceding figures (Fig. 3C). After a small disturbance on the trace, the DPNH maximum is reached in 3 min. The overshoot phenomena are identical with cyclic AMP and with ADP. Thus the effects of cyclic AMP and ADP are qualita- tively similar. In both cases, it is apparent that a pulse of substrate has been caused to pass through the glycolytic system.? The mechanism can be due to either an activation of phospho- fructokinase or reversal of inhibition of glyceraldehyde-3-P dehydrogenase. Evidence that the latter enzyme is involved is provided by the fact that ADP acts similarly to, but more rapidly than, cyclic AMP.
Effects of Pyruvate-An interpretation of the effect of cyclic AMP is provided by the chart of Fig. 64. An extract of type II is set in a nonsinusoidal oscillation. At the peak of the second DPNH maximum, 2 mM pyruvate is added, and there follows a rapid oxidation and a shorter period of oscillation showing at least seven full cycles. This record may well be compared with that of Fig. 5B; the similarity suggests an increase of pyruvate following the addition of cyclic AMP.7
Activation of the oscillations by the addition of pyruvate is illustrated by Fig. 6B. Here, an extract of type II (72 hours) is observed to oscillate with a small amplitude and a damping factor of 2.4. At the maximum of DPN reduction, 5 mM pyru-
‘i Unpublished experiments of Y. Cassuto show ethanol produc- tion to accelerate g-fold due to an increase of pyruvate concentra- tion.
vate is added. There ensues a damped oscillation with a larger amplitude and a lower damping factor (1.0 to 1.5). A second addition of pyruvate causes a second cycle of oxidation and reduction of DPNH; however, after this no oscillation is ob- served, presumably because the glucose-6-P level is too low and the alcohol-aldehyde values are too high. It is apparent that pyruvate affords an effective control of DPNH oxidation in the extract. The prolongation of oscillations by the addition of pyruvate to this type of extract is also similar to the effect of glucose-6-P on the extract employed in Fig. 2B.
Eflect oj Acetaldehyde-Based upon response of the DPNH level to pyruvate, it might be expected that acetaldehyde would show a faster and larger response. This is illustrated by Fig. 7A. At approximately the DPNH maximum, 0.5 mM acetalde- hyde is added causing a very rapid oxidation of DPNH. The magnitude exceeds that of the normal oscillatory amplitude by 30%, and is equal in duration to one-half cycle. After an over- shoot the oscillation resumes with essentially the same wave form as was obtained prior to the addition of acetaldehyde. Thus, if acetaldehyde is added near the DPNH minimum, a smaller cyclic oxidation occurs followed by a return to the normal pattern of oscillation. While it is apparent that alcohol de- hydrogenase exerts a considerable control over the DPNH level, this is a transient response, resulting in only a momentary dis- placement of the alcohol-aldehyde “equilibrium.” Thus, control of the oscillations would occur only when the alcohol-aldehyde concentrations were sufficient to cause a “buffering” of the oxidation-reduction state of the cell (9).
E$ect of Lactate-In order to determine whether or not lactate dehydrogenase is responsible for the effects of pyruvate, we added lactate to the extracts. We have failed to find any measurable DPN reduction on adding lactate.
Effect of or-Glycerol-P--or-Glycerol-P was added at the peak of the reduction; no oxidation of DPNH was obtained. -4p- parently the dehydrogenase is not effective in controlling the DPNH level in the oscillating extract.
E$ect of Citrate-Although studies of phosphofructokinase in viva and in vitro (29-31) suggest citrate control in this system, addition of up to 20 mM citrate at the DPNH maximum or mini- mum is without measurable effect.
Effect of Iodoacetate and Arsenate-We have already indicated that the addition of iodoacetate leads to a rapid oxidation of
Cell Free Extract Type II (24 Hrs.)
Cell Free Extract Type II (18 Hrs.)
DPN Reduct
FIG. 7. A,effect of acetaldehyde. The figure illustrates the addi- tion of 0.5 mM acetaldehyde at the third DPNH maximum and at the fifth DPNH minimum; 65.5 mg of protein per ml; pH 6.8; tem- perature 25” (Experiment 472-A-10). B, effect of arsenate. Ar- senate (25 mm) added at the second DPNH minimum; 25.4 mg of protein per ml; temperature 25”; pH 6.8 (Experiment 461-A-7).
by guest on June 5, 2018http://w
ww
.jbc.org/D
ownloaded from

3176 DPNH Oscillations in Glycolytic Systems Vol. 240, No. 7
DPNH because of inhibition of glyceraldehyde-3-P dehydro- genase (25). Fig. 7B illust,rates an experiment of this type in which a type II extract (18 hours) is observed to oscillate in the usual manner with a nonsinusoidal wave form. At the DPNH minimum 25 mM arsenate is added and there ensues the rapid reduction of DPN slightly beyond the level of the previous cycle, followed by a small recovery. Thereafter, the oscillations stop. It is apparent that the effects of both iodoacetate and arsenate identify glyceraldehyde-3-P dehydrogenase as the key enzyme controlling the DPNH level.
E$ect of Fluoride-Two traces of Fig. 8 when compared with a control trace (top) show the influence of fluoride upon the oscillations. In the middle trace 1 mM fluoride is added to the second minimum of DPNH concentration. A comparison with the control experiment indicates t,hat the trace rises in the direc- tion of oxidation without, the delay usually observed in the nonsinusoidal oscillations. The magnitude of the DPNH maximum is only slightly larger than that which would have been reached in the normal course of the oscillations. There follows a slow return to the DPNH minimum, much slower than that which would have been observed had the oscillations con- tinued. If fluoride is added near the DPNH maximum as in the lower truce, there is a small “jump” in the direction of DPNH oxidation, a slower return 00 the DPNH maximum, and a final very slow shift to the DPXH minimum. It is apparent that addition of the fluoride to t,he DPNH minimum causes an early reduction of DPN and a slow recovery to the highly oxidized state.
DPN Reduction 345- 400mp t
FIG. 8. Illustration of the effects of adding 1 mM fluoride at the DPNH minimum (middle trace) and near the DPNH maxi- mum (bottom trace); the top trace represents a control; 69.4 mg of protein per ml; temperature 25’; pH 6.8 (Experiments 494- 34,24, and 39).
Effects of Magnesium and EDTA-Determinations of mag- nesium (28) indicate approximately 2 mM magnesium in a type II extract. Experiments with added magnesium and added EDTA indicate that this is approximately an optimal value. Concentrations of 1 mM Mg++ added at the DPNH maximum caused an oxidation reaction and shortly thereafter caused a cessation of oscillations. Similarly, 2 mM EDTA when added at the DPNH maximum caused an abrupt oxidation and a diminution in the amplitude of oscillations. An interpretation of the nature of the optimum is difficult, except that the mag- nesium is about equivalent to the total adenine nucleotide con- centration, which, as determined in separate experiments, is about 1 mM.
Respiratory Activity-The preparations described here showed negligible DPNH oxidase activity, but more extensive sonic treatment leads to measurable activities: which may render the system anaerobic. In this case stirring may add oxygen and briefly oxidize DPNH.
DISCUSSION
The oscillating system in the cell-free extract affords unusual opportunities for studying metabolic controls in action as is clear from a comparison of the oscillating system with a steady state system. The latter exhibits a single state of oxidation of the components and gives little evidence of the control sites. It is only in the transition from one state to another state re- vealing a “crossover point” (17, 32) that an approach to the identification of control sites can be made. In observations of the interaction of components of the respiratory and glycolytic activity, various transitions between metabolic states have been of use in revealing control sites; for example, the aerobic to anaerobic transition (9, 10) as in the Pasteur effect or in the case of ascites tumor cells, the transient involved in the activa- tion-inhibition phenomena in ascites tumor cells (33). In the oscillating system not only is the same metabolic control re- peated 5 to 10 times during the oscillation but two types of control are illustrated, one at the DPNH maximum and one at the DPNH minimum. Thus, the controls regulating each of these maxima can be appropriately studied. In fact, it is important to distinguish between the control phenomena at maxima and minima of DPNH.
The cyclic and short period oscillatory responses of DPNH in yeast cells (9, 10) and perfused heart (11) were insufficiently prolonged to warrant a detailed study of metabolic control phenomena, but with the discovery of the long term persistent oscillation in S. carlsbergensis, it was appropriate not only to make metabolite assays (17, 22) but also to attempt to observe the oscillations in a cell-free extract (25). It was surprising to observe that, indeed, the cell-free extract oscillates vigorously and with a number of cycles equal to the maximum that was observed in the intact cells; the chief difference is that the period is increased approximately 20-fold. If we may accept as evi- dence that no enzyme inactivation has occurred, the fact that two very different methods of cell rupture give the same oscilla- tion period in the cell extract, our results suggest a considerable dilution of the glycolytic space by the cell sap? This prepara- tion has opened up new possibilities for investigating metabolic
* E. K. Pye, personal communication. 9 The dilution factor may be large, since the period is not highly
sensitive to the dilution. A a-fold dilution of a cell-free extract increased the period by 50y0.
by guest on June 5, 2018http://w
ww
.jbc.org/D
ownloaded from

July 1965 B. Chance, B. Schoeney, and S. Elsaesser 3177
control phenomena in the glycolytic system and for examining critically the various hypotheses concerning metabolic control. The system carries out a well defined function observed in viva (namely, persistent oscillations) and thereby identifies the con- trol properties of the extract with the function of metabolic controls in viva.
Classification of Responses-The diagram of Fig. 9 is helpful for comparing expected and observed responses of the oscillating system. This diagram emphasizes the principal control points in the cell-free extract which would respond to changes in the concentration of adenine or reduced pyridine nucleotide. All of the enzymes listed in the figure have been identified in the cell-free extract (28). From the arbitrary conditions of the metabolite assay, alcohol dehydrogenase is in considerable excess with respect to glyceraldehyde-3-P dehydrogenase, suggesting that the latter would be the site of rate control insofar as balance of DPN:DPNH is concerned. The activity of 3-P- glycerate kinase is high with respect to P-fructokinase, and the latter two would be expected to exert control. In addition, control by product inhibition of glyceraldehyde-3-P dehydro- genase is also to be considered (34).
The effects of added substrates are clarified by the diagram of Fig. 9. Addition of those substances on the substrate side of glyceraldehyde-3-P dehydrogenase would cause increased DPN reduction as indeed they are observed to do, while those on the product side would cause DPNH oxidation, particularly pyruvate and acetaldehyde. In the case of the adenine nucleotides, ADP and AMP would be expected to cause DPNH oxidation by activating 3-P-glycerate kinase and pyruvate kinase. The effects of nucleotides upon P-fructokinase are less predictable because of the complex interaction of substrate and nucleotides with this enzyme (35, 36), but generally DPN reduction would result from ADP activation and DPNH oxidation from ATP inhibition. The increases of DPNH are closely in phase with the formation of pyruvate. Thus the DPNH maxima correspond to maxima of glycolytic flux and vice versa. Lastly, the sites of inhibitors may be mentioned. Iodoacetate and arsenate will respectively inhibit and activate DPN reduction at the glycer- aldehyde-3-P dehydrogenase step while fluoride will show an inhibition of P-enolpyruvate formation and a reversal of ATP inhibition of P-fructokinase (35). Fluoride will also inhibit the conversion of phosphorylase a to b (37), but this would prolong the activation of phosphorylase and increase DPN reduction.
Several types of kinetic responses are noted. Some substances
simply disturb the steady state of the system, and after a given interval a recovery is observed. The displacement of the steady state may lead to inhibition of the oscillation with some inhibitors, and with others an enhancement. ADP addition will lead to the conversion from sinusoidal to the nonsinusoidal wave form (26) while ATP, at least in the amounts added in Fig. 3B, leads to a cessation of oscillations. Cyclic AMP, on the other hand, may lead to a considerable enhancement of the oscillations, as is the case with pyruvate.
The speed with which the system recovers from a displacement caused by acetaldehyde and pyruvate is remarkable. The alcohol-aldehyde equilibrium is sufficiently rapid that the dis- placement caused by the aldehyde has disappeared in less than one cycle. That caused by pyruvate requires several cycles for the displacement to subside. In brief, we are dealing with a steady state system which, as extracted from the yeast cells, may or may not have an optimal concentration of substrate and cofactors present. A displacement toward the optimum will obviously enhance the oscillations and vice versa.
Adenine Nucleotides-The three sites for adenine nucleotide interaction, P-fructokinase, 3-P-glycerate kinase, and pyruvate kinase, may all show a complex feedback interaction, but the results generally indicate that ADP or AMP cause DPN re- duction, either by activation of P-fructokinase or by the re- lease of product inhibition of glyceraldehyde-3-P dehydrogenase due to 3-P-glycerate (34). The effects of ATP are the converse of those of ADP or AMP, as is indicated by Fig. 3A. An abrupt oxidation of DPNH is observed when ATP is added at the DPNH maximum. An inhibition of P-fructokinase by ATP (36) would also lead to DPSH oxidation, but only after the fructose-di-P was expended; thus a delay in DPNH oxidation would be expected. These kinetic considerations suggest that the 3-P-glycerate kinase may exert a primary control. Never- theless, a secondary control is without doubt exerted by P-fructo- kinase. Thus, the interval of ATP control is converse to that of ADP control; as ADP control diminishes with the approach of the DPNH maximum, ATP control t,akes over. The t,ransfer between the two types of control would presumably be due to ATPase. While we can associate this type of control most clearly with the nonsinusoidal oscillations characteristic of the cell-free extract, it is possible that these controls can be just as effectively exerted over the sinusoidal oscillations.
While the concentrations of AMP which affect the oscillations are less than those of ADP, equal concentrations shift the steady
A A
GLY
ATP
GLU
ADP
v
ADP
. pi ADP ADP ‘ADP
t
FIG. 9. Metabolic control diagram
by guest on June 5, 2018http://w
ww
.jbc.org/D
ownloaded from

DPNH Oscillations in Glycolytic Systems Vol. 240, No. 7
state at approximately equal rates. If anything, ADP causes more rapid reaction than does AMP. This result supports the role of ADP activation of a product-inhibited glyceraldehyde-3-P dehydrogenase as opposed t,o an AMP activation of P-fructo- kinase.
There are three phases of t’he response to cyclic AMP (27). The primary response is observed at the DPNH maximum. In this case an oxidation is observed, an unexpected response in view of the effect of cyclic A1MP on yeast P-fructokinase (35). This initial effect is similar to that of increased ATP and, accord- ing to the considerations above, would be attributed to an inhibi- tion of 3-P-glycerate kinase or more complex interactions with pyruvate kinase. The second phase of the effect of cyclic AMP is best observed at the DPNH minimum at which enhanced reduction of DPN will occur particularly if the oscillations were previously of small amplitude. This effect could be due to an increase of substrate in the system caused by enhanced glycogen breakdown (37). Analytical data4 show a greatly decreased ATP concentration which can cause increased DPN reduction as indicated above for F- inhibition (see below). The third phase of the cyclic AMP effect is the general shift in the average level of the oscillations in the direction of oxidation. This fact is similar to the effect of increased pyruvate concentration and is inconsistent with the increased P-fructokinase activity as the sole cause of the observed data. In summary, it is not yet possible to attribute the effects of cyclic AMP to a particular site in the enzyme system, and it is likely that it is acting at several en- zymatic sites, some of which are heretofore unsuspected (27). It is of considerable interest to note that the cyclic AMP content of the yeast cells has been determined through the kindness of Drs. Hardman and Sutherland,‘0 and is found to be approxi- mately 3 x 10-s mole per kg of cells, fresh weight, a value that is about one-tenth that found to be effective in the cell-free extract.*l
Interval of ADP Control-Experiments of Fig. 4 illustrate an attempt to determine the portion of the oscillatory cycle in which the oscillations are at least partially under control of the particular metabolite. By adding a fixed concentration of ADP at certain intervals after the DPNH maximum (computed as phase angle with respect to the DPNH maximum), it is observed that the succeeding DPNH minima and maxima occur earlier (also computed as phase angle). The change in the phase angle of the DPNH minimum wit.h respect to a control trace is termed “phase advance.” The phase advance is very large at about 75” after t.he DPNH maximum and becomes undetectable at 170” after the DPNH maximum. Thus ADP control is maximal shortly after the DPNH maximum and holds over part of the DPNH minimum. ADP controls at the time of decreasing glycolytic flux. Although this experiment is tentative in concept and execution, it indicates the interval of the oscillatory cycle over which a chemical control is effective. It is apparent that the ADP concentration employed may not have been the optimal one and that the criterion by which its effects were evaluated is an arbitrary one.
The experiment is of importance since for the first time it posi- tively identifies ADP as at least one of the control parameters in this portion of the cycle and t,imes relatively accurately the
10 E. Sutherland and G. Hardman, personal communication. 11 Assays of the extract for cyclic AMP also show its presence,
and its destruction by the diesterase nullifies the effects of added cyclic AMP (Dr. George Cheung, personal communication).
interval of the cycle over which it serves to control. This result is in ext’remely good agreement with metabolite assays on the whole cell published elsewhere (18).
E$ect of Phosphate-No clear-cut effects of phosphate are yet observed; an extract prepared with 0.1 M Tris buffer does not show a phosphate requirement. It is apparent that t.he meta- bolic controls operative in the oscillation do not involve phos- phate.
Pasteur E$ect-The relationship of these results to the Pasteur effect may also be suggested by the fact that ADP control is instituted t.o reduce the glycolytic flow shortly after the DPNH maximum. This is analogous to mitochondrial control of the ADP level (33). The transition from the DPNH minimum to the DPNH maximum in the oscillatory system would correspond to the aerobic to anaerobic transition in which the ADP level and the glycolytic flow rise. In Fig. 4B, ADP has risen beyond the control level after 180”, to cause the flux to rise and DPN to reach its next maximum.
The clear demonstrations of control of the oscillations by ADP, AMP, cyclic AMP, and ATP and the lack of evidence for phosphate control seem to clarify diverse views on control mecha- nisms in glycolysis. The conclusions regarding phosphate con- trol put forward by Lynen (38) and by Wu and Racker (39) may well be restricted to the particular cells and the particular condi- tions they studied. Our data are significant because they show that a rapid and effective control of glycolytic intermediates can occur without the need for phosphate control.
In int,act cells, binding of phosphate may be a factor; our stud- ies of phosphate potential in ascites cells suggested that only about 0.01 of the total is free (see References 38 and 39). But even there, direct evidence for phosphate control in vivo in short term metabolic regulations is questionable (40) in yeast cells as well (14).
Inhibitors-Inhibitors of specific sites are helpful in confirming the above observations. Iodoacetate gives the clearest response when added at the DPNH maximum and causes abrupt oxida- tion which identifies glyceraldehyde-3-P dehydrogenase as a key enzyme in DPN reduction. Similarly, arsenate when added at the DPNH minimum causes rapid reduction because arsenate causes DPN reduction to become essentially irreversible. The fact that the oscillations abruptly stop further underlines the essential role of this enzyme.
Addition of fluoride at the DPNH minimum causes in the course of 2 or 3 min a rise to a DPNH maximum which in the absence of fluoride would have required 5 to 10 min. Such an effect would be expected as a consequence of fluoride inhibition of enolase with a consequent pileup of phosphoenolpyruvate and phosphoglycerate. But we observe that DPN becomes re- oxidized, and assays of intermediates4 show a precipitous drop of ATP immediately following fluoride addition. While the nature of this drop is not yet fully understood, it is apparent that such a drop and the corresponding rise of ADP would lead to increased reduction of DPN at the triose phosphate dehy- drogenase stage until the fructose-di-P pool was exhausted, ATP being no longer adequate to supply fructose-di-P from glucose- 6-P. Upon the exhaustion of this pool, triose phosphate can no longer provide reducing power and the alcohol to aldehyde system comes to its equilibrium point corresponding to a high degree of oxidation of DPNH. Thus, the reduction of DPN appears to trace out the activation of DPN reduction by the triose phosphate dehydrogenase due to the drop of ADP con-
by guest on June 5, 2018http://w
ww
.jbc.org/D
ownloaded from

July 1965 B. Chance, B. Schoener, and S. Elsaesser 3179
centration, and t’he slow oxidation corresponds to the depletion of substrate for this enzyme and the establishment of equilibrium conditions by alcohol dehydrogenase. It is not clear that the fluoride activation of ATP-inhibited yeast P-fructokinase (35) plays a part in this regulation.
Pyruvate and Bcetaldehyde-Additions of pyruvate and acetal- dehyde indicate the role of pyruvat~e decarboxylase and alcohol dehydrogenase in the enzyme system. The striking effects of pyruvate in causing rapid DPKH oxidation are apparently not due to lactate dehydrogenase, since added lactate does not cause DPK reduction. Instead, pyruvate activates DPNH oxidation in two ways: first, by providing an increased concentration of acetaldehyde, and second, by slowing the flow of metabolites through the glyceraldehyde-3-P dehydrogenase-3-P-glycerate kinase step and thereby increasing product inhibition of glycer- aldehyde-3-P dehydrogenase. It has already been demonstrated in the nonsinusoidal oscillations that addition of pyruvate will prolong the oxidized state, especially under conditions in which the duration of the oxidized stat,e is not controlled by the high ATP:ADP ratio.
Oscillations in Cell Extracts and in Intact Cells-The approach to the study of oscillations in intact cells and in cell-free extracts differs in principle. In intact cells the study is restricted to the analysis of the time course of fluctuations in the metabolic inter- mediates; very few rapid transients can be imposed upon the system externally, but those which can include a step change of the ATP : ADP ratio by cessation of oxidative phosphorylation or by the addition of glucose. Both these fluctuations can be used to start the oscillations under appropriate conditions (12, 18). Although precise studies of the changes of concentration of the chemicals can shed important information on control sites based upon the crossover theorem (32), the pathways for chemical feedback are sufficiently involved that identification of the con- trol chemical is often obscured. Here the cell-free extract be- comes import,ant, first to show how substrates and nucleotides may inhibit or augment the oscillation, and second, for studies in greater depth to show the intervals during a cycle of oscillation in which addition of a certain int.ermediate can control the nature of the oscillations. Our survey in this paper includes examples of both types of studies, the most detailed one being the above mentioned study of the interval of oscillation over which ADP can modify the oscillatory response. This study not only identi- fies ADP as an important cont,rol subst,ance in the oscillation, but, in addition, shows its control to be effective between the DPNH maximum and the DPNH minimum. These results would seem to afford an even more direct support for indirect evidence on ADP control of glycolysis based upon studies of ascites cells (see, for example, References 33 and 40).
Of t,he two distinct wave forms of oscillations, “sinusoidal and nonsinusoidal,” observed in the cell-free extract, only the sinusoidal form is observed in viva. An explanation for this difference is based upon the lower ATP utilization rate of the extract. Functional ATPase would be expected to be higher in the cell because of cell function, synthesis, ion transport, etc.; these reactions are absent in the cell-free extract.
Reaction Mechanism in Cell-free Extract-It is possible to give a qualitative explanation of the oscillation mechanism based upon the responses to substrates and inhibitors given here and in met’abolic assays in cells and cell-free extracts’2 (17, 22). The
12 B. Chance, Y. Cassuto, and S. Elsaesser, in preparation.
general reaction in the cell-free extract includes a quiescent inter- val at the DPNH minimum and a burst of DPN reduction lead- ing to a short lived maximum. Shortly after the DPNH maxi- mum in the nonsinusoidal oscillation, ATP and glucose-6-P are high and fructose-di-P is Iow.~~ This is apparently an interval at which the ATP:ADP ratio is high and at which these experi- ments show that the low ADP concentration prevents DPN reduction. i2s the ATP level falls slowly, presumably because of the slow action of endogenous ATPase,l3 the ADP concentra- tion rises to the point at which activation of P-fructokinase and of 3-P-glycerate kinase occurs. The latt.er enzyme then relieves product inhibition of glyceraldehyde-3-P dehydrogenase. At the present time it is difficult to determine the primary step of activation; in fact, both enzymes may be activated simultane- ously. On the basis of preliminary results which show the rise of DPNH slightly to precede the rise of fructose-di-P, it is proba- ble that the 3-P-glycerate kinase is activated first. In any case, however, activation at both points of glycolysis is probably necessary for the oscillations we are observing. The precipitous rise of DPNH to its maximum is accompanied by a rise of fruc- tose-di-P and a fall of ATP and glucose-B-Pi2 (17, 19). Under these circumstances, the ADP level rises as indicated by our lack of BDP control prior to the DPNH ma,ximum, and shortly thereafter phosphorylative activities restore the ATP:ADP level to its previous value, glucose&P rises, and fructose-di-P falls, completing the oscillation cyclei (17, 19). It is fully recognized that a verbal description of these complex chemical interactions affords no proof of the proposed control mechanisms; it is desir- able to defer to further st,udy and “proof” for the existence of such control mechanisms. As soon, however, as the control characteristics for the enzyme systems are available in detail (40), a computer representation of the detailed reaction mecha- nism can be carried out.
The chemical equations which allow either damped or continu- ous oscillations are described in preliminary form elsewhere (17, 24). The general principle of the oscillating system may involve either the inhibition of an enzyme by its substrate or activation of an enzyme by its reaction product. As an example we have selected the fructose-di-P activation of P-fructokinase, but on further consideration (10) a number of other enzymes equally suit the needs of this reaction mechanism, for example, the prod- uct inhibition of P-fructokinase by ATP generated at 3-P-glycer- ate kinase. The latter mechanism further leads to the general viewpoint that the ATP concentration acts not just at one but at two points in the glycolytic system to provide a control which has the oscillatory potentiality; the fall of ATP concentration causes the activation of ATP-inhibited P-fructokinase and of glyceraldehyde-3-P dehydrogenase (via 3-P-glycerate kinase) as well. Such a system incorporates not only the properties of the simple oscillator described previously by us (17, 24) but has a much higher “gain” as well. It is apparent that the oscillating system need use only an exaggerated form of the normal meta- bolic controls of glycolysis.
Relationship to Metabolic Control in General-In this paper we are attempting to establish principles by which the kinetics of enzymatic action and oscillating systems can best be studied. At the present time we can report long term damped sinusoidal oscillations in yeasts only, but it is apparent from the character- istics of this system that others will soon be found. Three gen-
13 Dr. B. Hess (28) points to the hydrolysis of 1,3-phospo- glycerate as a source of ATPase.
by guest on June 5, 2018http://w
ww
.jbc.org/D
ownloaded from

3180 DPNH Oscillations
era1 approaches are possible : first, purely biophysical observation of the effect of environmental factors, particularly the tempera- ture and pressure as two of the important variables, upon the oscillation in vivo; this is one of the few systems which, like that of bioluminescence, provides a continuous “readout” of intra- cellular reaction kinetics, In this case, of course, the enzyme systems are much better characterized than they are in lumines- cent systems. Second, the biochemical phenomena in the intact cell may be studied either by alterations of chemical environment and observations of their effect upon the oscillation, or by an analysis of metabolite intermediates during the course of the oscillations under various conditions. Third, the cell-free ex- tracts may be studied by their response to the addition of sub- strates, adenine nucleotides, and inhibitors (reported in this paper) or by the addition of isolated enzymes as we11.14 Finally, it is hoped that a reconstruction of this enzymatic system may be achieved by using purified enzymes in order to reveal unknown cofactors of the oscillation in the extract and in viv0.1~
SUMMARY
A cell-free system of glycolytic enzymes which exhibits sinusoi- dal and nonsinusoidal oscillations has been examined. Control phenomena were investigated at maxima and minima of diphos- phopyridine nucleotide reduction. Near the minima of DPN reduction two facts were noted. Adenosine diphosphate and ade- nosine monophosphate are effective in rapidly increasing the re- duction, and cyclic AMP and fluoride have related effects in that both cause a slow reduction of DPN. Cyclic AMP, however, shifts the mean level of the oscillations in the direction of oxida- tion. At the maximum of DPN reduction, ATP is active in causing rapid oxidation of DPNH. It is also found that pyru- vate and acetaldehyde are effective oxidants for the steady state level and both are rapidly dissipated, presumably in the equi- librium of alcohol and aldehyde.
Iodoacetate and arsenate clearly identify glyceraldehyde-3-P dehydrogenase as the enzyme dominating DPN reduction in the extract.
A study of the effectiveness of ADP added at various times after the DPNH maximum and evaluated in terms of the change of wave form of the oscillation indicates ADP control to be rela- tively ineffective prior to the DPNH maximum and to cause significant effects when added shortly after the maximum and until the minimum. This method of titration identifies ADP as one of the controlling factors in the transition from a DPNH maximum to a DPNH minimum.
Tentative explanations for the nonsinusoidal (pulsed) type of oscillation observed in the extract are based upon the concept of inhibition of glycolytic flux at P-fructokinase and glyceralde- hyde-3-P dehydrogenase due to a high ratio of ATP to ADP, AMP, and possibly cyclic 3’,5’-AMP. As this ratio falls to a critical value, a pulse of glycolytic flux is activated causing rapid DPN reduction and a gush of intermediates between fructose-di-P and pyruvate. This results in a re-establishment of a high ATP:ADP ratio and the inhibition of glycolysis.
Control mechanisms for glycolytic flux in the oscillatory reac- tion suggest that similar cont.rols are operative in the Pasteur
r4B. Hess, B. Chance, and Y. Cassuto, in preparation. 15 There has been limited success in establishing oscillations in
a reconstituted glycolytic system (as reported at the Federation Meeting Symposium on Cyclic and Oscillatory Biochemical Sys- tems, 1965).
in Glycolytic Xystems Vol. 240, No. 7
reaction and require the mediation of substrates and adenine nucleotides; phosphate control is not essential.
REFERENCES
1.
2.
3.
4.
5.
6.
7. 8. 9.
10.
11. 12.
13.
14.
15.
16.
17.
18.
19.
20.
21.
22. 23.
24. 25.
26.
27.
28.
29.
30.
31.
32.
33. 34.
35.
36.
PITTENDRIGH, C. S., in R. B. WITHROW (Editor), Photo- periodism in plants and animals, American Association for the Advancement of Science, Washington, 1959, p. 475.
HASTINGS, J. W., AND SWEENEY, B. M., in R. B. WITHROW (Editor), Photoperiodism in plants and animals, American Association for the Advancement of Science, Washington, 1959, p. 567.
PITTENDRIGH, C. S., Harvey Lectures, Ser. 66 (1959-1960), 93 (1961).
DESA, R., HASTINGS, J. W., .IND VATTER, A. E., Science, 141, 1269 (1963).
SNEZHHO, A. D., Doklady Akad. Nauk S. S. S. R., 133, 984 (1960).
EULER, H. V., SCHLENK, F., HEIWINKEL, H., AND HOGBERG, B., 2. physiol. Chem., 256, 208 (1938).
CHANCE, B., Rev. Sci. Instr., 22, 619 (1951). CHANCE, B., Nature, 169, 215 (1952). CHANCE, B., Harvey Lectures. Ser. 48. (196%1956), 145 (1954). CHANCE; B., in W. b. MCELROY AND’B. GLASS (Editors), The
mechanism of enzyme action, Johns Hopkins Press, Balti- more, 1955, p. 399.
CHANCE, B., Ann. N. Y. Acad. Sci., 116, 1010 (1964). CHANCE. B.. ESTABROOH. R. W.. AND GHOSH. A.. Proc. Natl.
Acad.‘Sci: U. S., 61, 1244 (1964). I I
HOLZER, H., AND FREYTAG-HILF, R., 2. physiol. Chem., 316, 7 (1959).
ESTABROOH, R. W., MAITRA, P. K., AND CHANCE, B., in J. SENEZ (Editor), Symposium on the mechanism of cellular regulation in bacteria, Marseilles, France, July, 1963, Centre National de la Recherche Scientifique, Paris, p. 491,1965.
WILSON. A. T., AND CALVIN, M., J. Am. Chem. Sot., 77, 5948 (1955).
DUYSENS, L. N. M., AND AYESZ, J., Biochim. et Biophys. Acta, 24, 19 (1957).
GHOSH, A., AND CHANCE, B., Biochem. and Biophys. Research Communs., 16, 174 (1964).
BETZ, A., AND CHANCE, B., Arch. Biochem. Biophys., 109, 579 (1965).
BETZ, A., AND CHANCE, B., Arch. Biochem. Biophys., 109, 585 (1965).
HOMMES, F. A., AND SCHUURMANS STEBHOVEN, F.M.A.H., Biochim. et Biophys. Acta, 86, 427 (1964).
HOMMES, F. A., Abstracts Sixth International Congress of Bio- chemistry, 1964, IUB Vol. 32, p. 512, VI-48.
HOMMES, F. A., Arch. Biochem. Biophys., 108, 36 (1964). PYE, E. K., Dissertation, University of Manchester, Man-
chester, England, 1964. HIGGINS, J., Proc. Natl. Acad. Sci. U. S., 61, 989 (1964). CHANCE, B., HESS, B., AND BETZ, A., Biochem. and Biophys.
Research Communs., 16, 182 (1964). CHANCE, B., SCHOENER, B., AND ELSAESSER, S., Proc. Natl.
Acad. Sci. U. S., 62, 337 (1964). CHANCE, B., AND SCHOENER, B., Biochem. and Biophys. Re-
search Communs., 17, 416 (1964). HESS, B., Berichte der Bunsengesellschaft fiir physikalische
Chemie, 68, 584 (1964). GARLAND, P. B., RANDLE, P. J., AND NEWSHOLME, E. A.,
Nature, 200, 169 (1963). PARMEGGIANI, A., AND BOWMAN, R. H., Biochem. and Bio-
phys. Research Communs., 12, 268 (1963). PASSONNEAU, J. V., AND LOWRY, 0. H., Biochem. and Biophys.
Research Communs., 13, 372 (1963). CHANCE, B., HOLMES, W., HIGGINS, J., AND CONNELLY, C. M.,
Nature, 182, 1190 (1958). CHANCE, B., AND HESS, B., Science, 129,700 (1959). VELICK, S. F., AND FURFINE, C., in P. D. BOYER, H. LARDY,
AND K. MYRBXCK (Editors), The enzymes, Vol. 7, Academic Press, Inc., New York, 1963, p. 243.
VI~~UELA. E.. SALAS. M.. AND SOLS. A.. Biochem. and Biophvs. Researih communs., Ib, 243 (1964). ’
- ”
LARDY, H., AND PARKS, R., in 0. H. GAEBLER (Editor), En-
by guest on June 5, 2018http://w
ww
.jbc.org/D
ownloaded from

July 1965 B. Chance, B. Xchoener, and S. Elsaesser
zymes: units of biological structure and function, Academic Press, Inc., New York, 1956, p. 584.
39. Wu, R., AND RACKER, E., in B. WRIGHT (Editor), Control
37. CORI, G. T., AND ILLINGTVORTH, B., Biochim. et Biophys. Acta, mechanisms in respiration and fermentation, Ronald Press Company, New York, 1963, pp. 265-288.
21, 105 (1956). 38. LYNEN, F., in B. WRIGHT (Editor), Control mechanisms in
40. CHANCE, B., GARFINKEL, D., HIGGINS, J., AND HESS, B., J. Biol. Chem., 236, 2426 (1960).
respiration and fermentation, Ronald Press Company, New York, 1963, pp. 289-306.
41. CHANCE, B., in Cold Spring Harbor Symposia Quant. Biol., 26, 289 (1961).
by guest on June 5, 2018http://w
ww
.jbc.org/D
ownloaded from

Britton Chance, Brigitte Schoener and Sigrid ElsaesserSaccharomyces carlsbergensis
Reduced Diphosphopyridine Nucleotide in a Cell-free Extract of Metabolic Control Phenomena Involved in Damped Sinusoidal Oscillations of
1965, 240:3170-3181.J. Biol. Chem.
http://www.jbc.org/content/240/7/3170.citation
Access the most updated version of this article at
Alerts:
When a correction for this article is posted•
When this article is cited•
to choose from all of JBC's e-mail alertsClick here
http://www.jbc.org/content/240/7/3170.citation.full.html#ref-list-1
This article cites 0 references, 0 of which can be accessed free at
by guest on June 5, 2018http://w
ww
.jbc.org/D
ownloaded from