metabolic diversity in the grains of indian varieties of rice
TRANSCRIPT

Bio
M
Bra
Phyt
Kolk
1. I
on
divreslikeQualomworesmabetcon
prohea
C. R. Biologies 337 (2014) 283–293
A R
Artic
Rece
Acce
Avai
Keyw
Rice
Met
Dive
*
163
http
diversity/Biodiversite
etabolic diversity in the grains of Indian varieties of rice
tati De *, Gargi Nag
ochemistry and Pharmacognosy research Laboratory, Department of Botany, University of Calcutta, 35, Ballygunge Circular Road,
ata 700019, India
ntroduction
The nutritional quality of a food crop depends, in part,the metabolite components present in it. Natural
ersity of chemical composition of a food crop is alsoponsible for its taste, colour, fragrance and characters
resistance to disease and other stress factors.litative and quantitative identification of the metabo-e (the small molecules) using metabolomic technology
uld assist in identifying the biochemical markersponsible for such quality. The nutritional scientists alsoy precisely identify bioactive ingredients in foods andter understand their potentially beneficial (or harmful)sequences using metabolomic technology [1].Rice (Oryza sativa L.) is the staple food source for a largeportion of the world’s population and also has potentiallth benefits. In India rice gruel is used in disorganized
digestion, in bowel complaints in diarrhoea and dysentery.Rice water is demulcent, nourishing drink in febrilediseases and inflammatory states of the intestine [2].The tocotrienol rich fraction of rice bran is effective inlowering serum total and LDL-cholesterol levels. Toco-trienols have superior efficacy compared with a-toco-pherol [3]. Red and black rice decrease atheroscleroticplaque formation in rabbits [4]. Rice grains have anti-oxidant properties [5].
Metabolomic methodology has been applied to themetabolic phenotyping of natural variants in brown ricefrom 68 varieties from the world rice core collection (WRC)and two other varieties. Ten metabolites were selected asmetabolite representatives [6]. The correlative relation-ships between genetic and metabolic diversity among 18accessions from the world rice collection based on theirpopulation structure were assessed. The variations in themetabolic fingerprint of the extracts of seed grains wereanalysed with one dimensional 1H-nuclear magneticresonance (NMR). The result indicated that there wereno relationships between the genomic and metabolic
T I C L E I N F O
le history:
ived 29 November 2013
pted after revision 24 January 2014
lable online 11 March 2014
ords:
grains
abolites
rsity
A B S T R A C T
The aim of the present work was to analyze metabolic diversity in 26 different indica
varieties of rice grains. Seventy-six metabolites could be identified in the methanol
extracts of each of the rice varieties analyzed by gas chromatography-mass spectrometry.
These metabolites included 9 sugars/sugar alcohols, 17 amino acids/derivatives, 18 fatty
acids, 5 free phenolic acids and 19 other organic acids, 3 phytosterols, 5 other constituents.
Cluster analyses to extract information for similarity and differences in metabolites
unveiled diversity in metabolite profile. Two hierarchical clusters were generated based
on the metabolite contents of the rice varieties. The first cluster (cluster I) consisted of one
variety only. The second cluster again segregated into four clusters (clusters II, III, IV and V).
Very distinct differences were visible amongst the clusters with respect to their sugars/sugar
alcohols, organic acid, amino acid and fatty acid, phenol, and sterol profiles. Metabolites
determine nutritional quality, taste, aroma. This and future efforts on the metabolomic
information would help biochemists and nutritionists to better understand the nutritional
quality of such grains at varietal level and correlating metabolites and long term human
health related issues.
� 2014 Academie des sciences. Published by Elsevier Masson SAS. All rights reserved.
Corresponding author.
E-mail address: [email protected] (B. De).
Contents lists available at ScienceDirect
Comptes Rendus Biologies
ww w.s c ien c edi r ec t . c om
1-0691/$ – see front matter � 2014 Academie des sciences. Published by Elsevier Masson SAS. All rights reserved.
://dx.doi.org/10.1016/j.crvi.2014.01.006
B. De, G. Nag / C. R. Biologies 337 (2014) 283–293284
diversity of solution metabolites [7]. Metabolomics tech-nology has also been applied for determination of flavourprofile [8], production of GM rice [9].
Analysis of the natural variations in rice using metabo-lomics techniques is thought to be not only useful tounderstand the biological traits of rice such as the yield anddefence responses, but also helpful to improve rice quality,including its taste and nutritive value [10]. Variations in thechemical composition of grains are important to grainconsumers and to both food/feed industries for the purposesof quality control [11]. Metabolomics is thought to be atechnique that may be applicable to rice breeding by acombination of other omics approaches [12]. Detailed reportregarding the metabolite profile of Indian rice varieties arelacking. The aim of the present work is to analyse metabolicdiversity in 26 varieties of rice grains of India using gaschromatography-mass spectrometry (GC-MS) which iscurrently the most utilized global analysis method for dataacquisition by metabolomics technology [13].
2. Materials and methods
2.1. Plant materials
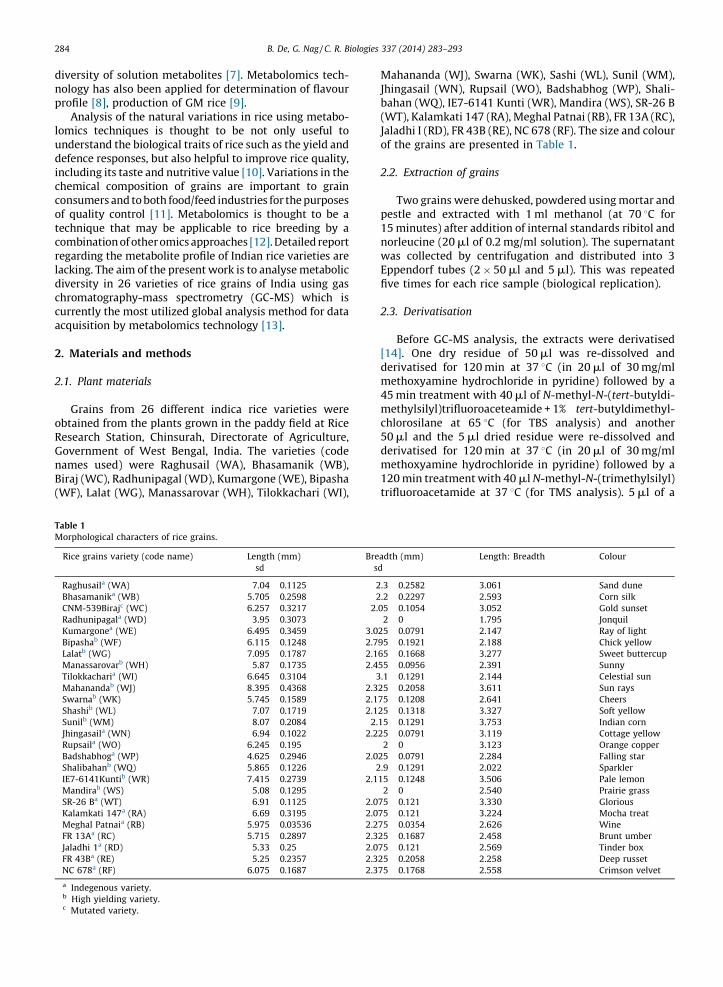
Grains from 26 different indica rice varieties wereobtained from the plants grown in the paddy field at RiceResearch Station, Chinsurah, Directorate of Agriculture,Government of West Bengal, India. The varieties (codenames used) were Raghusail (WA), Bhasamanik (WB),Biraj (WC), Radhunipagal (WD), Kumargone (WE), Bipasha(WF), Lalat (WG), Manassarovar (WH), Tilokkachari (WI),
Mahananda (WJ), Swarna (WK), Sashi (WL), Sunil (WM),Jhingasail (WN), Rupsail (WO), Badshabhog (WP), Shali-bahan (WQ), IE7-6141 Kunti (WR), Mandira (WS), SR-26 B(WT), Kalamkati 147 (RA), Meghal Patnai (RB), FR 13A (RC),Jaladhi I (RD), FR 43B (RE), NC 678 (RF). The size and colourof the grains are presented in Table 1.
2.2. Extraction of grains
Two grains were dehusked, powdered using mortar andpestle and extracted with 1 ml methanol (at 70 8C for15 minutes) after addition of internal standards ribitol andnorleucine (20 ml of 0.2 mg/ml solution). The supernatantwas collected by centrifugation and distributed into 3Eppendorf tubes (2 � 50 ml and 5 ml). This was repeatedfive times for each rice sample (biological replication).
2.3. Derivatisation
Before GC-MS analysis, the extracts were derivatised[14]. One dry residue of 50 ml was re-dissolved andderivatised for 120 min at 37 8C (in 20 ml of 30 mg/mlmethoxyamine hydrochloride in pyridine) followed by a45 min treatment with 40 ml of N-methyl-N-(tert-butyldi-methylsilyl)trifluoroaceteamide + 1% tert-butyldimethyl-chlorosilane at 65 8C (for TBS analysis) and another50 ml and the 5 ml dried residue were re-dissolved andderivatised for 120 min at 37 8C (in 20 ml of 30 mg/mlmethoxyamine hydrochloride in pyridine) followed by a120 min treatment with 40 ml N-methyl-N-(trimethylsilyl)trifluoroacetamide at 37 8C (for TMS analysis). 5 ml of a
Table 1
Morphological characters of rice grains.
Rice grains variety (code name) Length (mm)
� sd
Breadth (mm)
� sd
Length: Breadth Colour
Raghusaila (WA) 7.04 � 0.1125 2.3 � 0.2582 3.061 Sand dune
Bhasamanika (WB) 5.705 � 0.2598 2.2 � 0.2297 2.593 Corn silk
CNM-539Birajc (WC) 6.257 � 0.3217 2.05 � 0.1054 3.052 Gold sunset
Radhunipagala (WD) 3.95 � 0.3073 2 � 0 1.795 Jonquil
Kumargonea (WE) 6.495 � 0.3459 3.025 � 0.0791 2.147 Ray of light
Bipashab (WF) 6.115 � 0.1248 2.795 � 0.1921 2.188 Chick yellow
Lalatb (WG) 7.095 � 0.1787 2.165 � 0.1668 3.277 Sweet buttercup
Manassarovarb (WH) 5.87 � 0.1735 2.455 � 0.0956 2.391 Sunny
Tilokkacharia (WI) 6.645 � 0.3104 3.1 � 0.1291 2.144 Celestial sun
Mahanandab (WJ) 8.395 � 0.4368 2.325 � 0.2058 3.611 Sun rays
Swarnab (WK) 5.745 � 0.1589 2.175 � 0.1208 2.641 Cheers
Shashib (WL) 7.07 � 0.1719 2.125 � 0.1318 3.327 Soft yellow
Sunilb (WM) 8.07 � 0.2084 2.15 � 0.1291 3.753 Indian corn
Jhingasaila (WN) 6.94 � 0.1022 2.225 � 0.0791 3.119 Cottage yellow
Rupsaila (WO) 6.245 � 0.195 2 � 0 3.123 Orange copper
Badshabhoga (WP) 4.625 � 0.2946 2.025 � 0.0791 2.284 Falling star
Shalibahanb (WQ) 5.865 � 0.1226 2.9 � 0.1291 2.022 Sparkler
IE7-6141Kuntib (WR) 7.415 � 0.2739 2.115 � 0.1248 3.506 Pale lemon
Mandirab (WS) 5.08 � 0.1295 2 � 0 2.540 Prairie grass
SR-26 Ba (WT) 6.91 � 0.1125 2.075 � 0.121 3.330 Glorious
Kalamkati 147a (RA) 6.69 � 0.3195 2.075 � 0.121 3.224 Mocha treat
Meghal Patnaia (RB) 5.975 � 0.03536 2.275 � 0.0354 2.626 Wine
FR 13Aa (RC) 5.715 � 0.2897 2.325 � 0.1687 2.458 Brunt umber
Jaladhi 1a (RD) 5.33 � 0.25 2.075 � 0.121 2.569 Tinder box
FR 43Ba (RE) 5.25 � 0.2357 2.325 � 0.2058 2.258 Deep russet
NC 678a (RF) 6.075 � 0.1687 2.375 � 0.1768 2.558 Crimson velvet
a Indegenous variety.b High yielding variety.
c Mutated variety.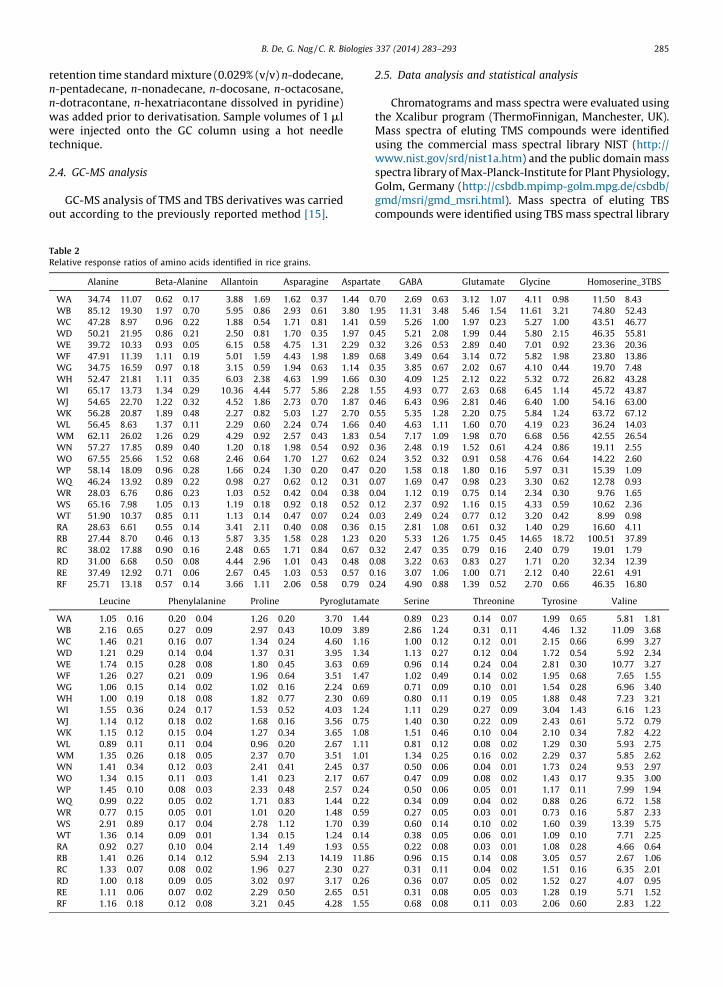
reten-pn-dwawetec
2.4.
out
Tab
Rela
W
W
W
W
W
W
W
W
W
W
W
W
W
W
W
W
W
W
W
W
RA
RB
RC
RD
RE
RF
W
W
W
W
W
W
W
W
W
W
W
W
W
W
W
W
W
W
W
W
RA
RB
RC
RD
RE
RF
B. De, G. Nag / C. R. Biologies 337 (2014) 283–293 285
ntion time standard mixture (0.029% (v/v) n-dodecane,entadecane, n-nonadecane, n-docosane, n-octacosane,otracontane, n-hexatriacontane dissolved in pyridine)s added prior to derivatisation. Sample volumes of 1 mlre injected onto the GC column using a hot needlehnique.
GC-MS analysis
GC-MS analysis of TMS and TBS derivatives was carried according to the previously reported method [15].
2.5. Data analysis and statistical analysis
Chromatograms and mass spectra were evaluated usingthe Xcalibur program (ThermoFinnigan, Manchester, UK).Mass spectra of eluting TMS compounds were identifiedusing the commercial mass spectral library NIST (http://www.nist.gov/srd/nist1a.htm) and the public domain massspectra library of Max-Planck-Institute for Plant Physiology,Golm, Germany (http://csbdb.mpimp-golm.mpg.de/csbdb/gmd/msri/gmd_msri.html). Mass spectra of eluting TBScompounds were identified using TBS mass spectral library
le 2
tive response ratios of amino acids identified in rice grains.
Alanine Beta-Alanine Allantoin Asparagine Aspartate GABA Glutamate Glycine Homoserine_3TBS
A 34.74 � 11.07 0.62 � 0.17 3.88 � 1.69 1.62 � 0.37 1.44 � 0.70 2.69 � 0.63 3.12 � 1.07 4.11 � 0.98 11.50 � 8.43
B 85.12 � 19.30 1.97 � 0.70 5.95 � 0.86 2.93 � 0.61 3.80 � 1.95 11.31 � 3.48 5.46 � 1.54 11.61 � 3.21 74.80 � 52.43
C 47.28 � 8.97 0.96 � 0.22 1.88 � 0.54 1.71 � 0.81 1.41 � 0.59 5.26 � 1.00 1.97 � 0.23 5.27 � 1.00 43.51 � 46.77
D 50.21 � 21.95 0.86 � 0.21 2.50 � 0.81 1.70 � 0.35 1.97 � 0.45 5.21 � 2.08 1.99 � 0.44 5.80 � 2.15 46.35 � 55.81
E 39.72 � 10.33 0.93 � 0.05 6.15 � 0.58 4.75 � 1.31 2.29 � 0.32 3.26 � 0.53 2.89 � 0.40 7.01 � 0.92 23.36 � 20.36
F 47.91 � 11.39 1.11 � 0.19 5.01 � 1.59 4.43 � 1.98 1.89 � 0.68 3.49 � 0.64 3.14 � 0.72 5.82 � 1.98 23.80 � 13.86
G 34.75 � 16.59 0.97 � 0.18 3.15 � 0.59 1.94 � 0.63 1.14 � 0.35 3.85 � 0.67 2.02 � 0.67 4.10 � 0.44 19.70 � 7.48
H 52.47 � 21.81 1.11 � 0.35 6.03 � 2.38 4.63 � 1.99 1.66 � 0.30 4.09 � 1.25 2.12 � 0.22 5.32 � 0.72 26.82 � 43.28
I 65.17 � 13.73 1.34 � 0.29 10.36 � 4.44 5.77 � 5.86 2.28 � 1.55 4.93 � 0.77 2.63 � 0.68 6.45 � 1.14 45.72 � 43.87
J 54.65 � 22.70 1.22 � 0.32 4.52 � 1.86 2.73 � 0.70 1.87 � 0.46 6.43 � 0.96 2.81 � 0.46 6.40 � 1.00 54.16 � 63.00
K 56.28 � 20.87 1.89 � 0.48 2.27 � 0.82 5.03 � 1.27 2.70 � 0.55 5.35 � 1.28 2.20 � 0.75 5.84 � 1.24 63.72 � 67.12
L 56.45 � 8.63 1.37 � 0.11 2.29 � 0.60 2.24 � 0.74 1.66 � 0.40 4.63 � 1.11 1.60 � 0.70 4.19 � 0.23 36.24 � 14.03
M 62.11 � 26.02 1.26 � 0.29 4.29 � 0.92 2.57 � 0.43 1.83 � 0.54 7.17 � 1.09 1.98 � 0.70 6.68 � 0.56 42.55 � 26.54
N 57.27 � 17.85 0.89 � 0.40 1.20 � 0.18 1.98 � 0.54 0.92 � 0.36 2.48 � 0.19 1.52 � 0.61 4.24 � 0.86 19.11 � 2.55
O 67.55 � 25.66 1.52 � 0.68 2.46 � 0.64 1.70 � 1.27 0.62 � 0.24 3.52 � 0.32 0.91 � 0.58 4.76 � 0.64 14.22 � 2.60
P 58.14 � 18.09 0.96 � 0.28 1.66 � 0.24 1.30 � 0.20 0.47 � 0.20 1.58 � 0.18 1.80 � 0.16 5.97 � 0.31 15.39 � 1.09
Q 46.24 � 13.92 0.89 � 0.22 0.98 � 0.27 0.62 � 0.12 0.31 � 0.07 1.69 � 0.47 0.98 � 0.23 3.30 � 0.62 12.78 � 0.93
R 28.03 � 6.76 0.86 � 0.23 1.03 � 0.52 0.42 � 0.04 0.38 � 0.04 1.12 � 0.19 0.75 � 0.14 2.34 � 0.30 9.76 � 1.65
S 65.16 � 7.98 1.05 � 0.13 1.19 � 0.18 0.92 � 0.18 0.52 � 0.12 2.37 � 0.92 1.16 � 0.15 4.33 � 0.59 10.62 � 2.36
T 51.90 � 10.37 0.85 � 0.11 1.13 � 0.14 0.47 � 0.07 0.24 � 0.03 2.49 � 0.24 0.77 � 0.12 3.20 � 0.42 8.99 � 0.98
28.63 � 6.61 0.55 � 0.14 3.41 � 2.11 0.40 � 0.08 0.36 � 0.15 2.81 � 1.08 0.61 � 0.32 1.40 � 0.29 16.60 � 4.11
27.44 � 8.70 0.46 � 0.13 5.87 � 3.35 1.58 � 0.28 1.23 � 0.20 5.33 � 1.26 1.75 � 0.45 14.65 � 18.72 100.51 � 37.89
38.02 � 17.88 0.90 � 0.16 2.48 � 0.65 1.71 � 0.84 0.67 � 0.32 2.47 � 0.35 0.79 � 0.16 2.40 � 0.79 19.01 � 1.79
31.00 � 6.68 0.50 � 0.08 4.44 � 2.96 1.01 � 0.43 0.48 � 0.08 3.22 � 0.63 0.83 � 0.27 1.71 � 0.20 32.34 � 12.39
37.49 � 12.92 0.71 � 0.06 2.67 � 0.45 1.03 � 0.53 0.57 � 0.16 3.07 � 1.06 1.00 � 0.71 2.12 � 0.40 22.61 � 4.91
25.71 � 13.18 0.57 � 0.14 3.66 � 1.11 2.06 � 0.58 0.79 � 0.24 4.90 � 0.88 1.39 � 0.52 2.70 � 0.66 46.35 � 16.80
Leucine Phenylalanine Proline Pyroglutamate Serine Threonine Tyrosine Valine
A 1.05 � 0.16 0.20 � 0.04 1.26 � 0.20 3.70 � 1.44 0.89 � 0.23 0.14 � 0.07 1.99 � 0.65 5.81 � 1.81
B 2.16 � 0.65 0.27 � 0.09 2.97 � 0.43 10.09 � 3.89 2.86 � 1.24 0.31 � 0.11 4.46 � 1.32 11.09 � 3.68
C 1.46 � 0.21 0.16 � 0.07 1.34 � 0.24 4.60 � 1.16 1.00 � 0.12 0.12 � 0.01 2.15 � 0.66 6.99 � 3.27
D 1.21 � 0.29 0.14 � 0.04 1.37 � 0.31 3.95 � 1.34 1.13 � 0.27 0.12 � 0.04 1.72 � 0.54 5.92 � 2.34
E 1.74 � 0.15 0.28 � 0.08 1.80 � 0.45 3.63 � 0.69 0.96 � 0.14 0.24 � 0.04 2.81 � 0.30 10.77 � 3.27
F 1.26 � 0.27 0.21 � 0.09 1.96 � 0.64 3.51 � 1.47 1.02 � 0.49 0.14 � 0.02 1.95 � 0.68 7.65 � 1.55
G 1.06 � 0.15 0.14 � 0.02 1.02 � 0.16 2.24 � 0.69 0.71 � 0.09 0.10 � 0.01 1.54 � 0.28 6.96 � 3.40
H 1.00 � 0.19 0.18 � 0.08 1.82 � 0.77 2.30 � 0.69 0.80 � 0.11 0.19 � 0.05 1.88 � 0.48 7.23 � 3.21
I 1.55 � 0.36 0.24 � 0.17 1.53 � 0.52 4.03 � 1.24 1.11 � 0.29 0.27 � 0.09 3.04 � 1.43 6.16 � 1.23
J 1.14 � 0.12 0.18 � 0.02 1.68 � 0.16 3.56 � 0.75 1.40 � 0.30 0.22 � 0.09 2.43 � 0.61 5.72 � 0.79
K 1.15 � 0.12 0.15 � 0.04 1.27 � 0.34 3.65 � 1.08 1.51 � 0.46 0.10 � 0.04 2.10 � 0.34 7.82 � 4.22
L 0.89 � 0.11 0.11 � 0.04 0.96 � 0.20 2.67 � 1.11 0.81 � 0.12 0.08 � 0.02 1.29 � 0.30 5.93 � 2.75
M 1.35 � 0.26 0.18 � 0.05 2.37 � 0.70 3.51 � 1.01 1.34 � 0.25 0.16 � 0.02 2.29 � 0.37 5.85 � 2.62
N 1.41 � 0.34 0.12 � 0.03 2.41 � 0.41 2.45 � 0.37 0.50 � 0.06 0.04 � 0.01 1.73 � 0.24 9.53 � 2.97
O 1.34 � 0.15 0.11 � 0.03 1.41 � 0.23 2.17 � 0.67 0.47 � 0.09 0.08 � 0.02 1.43 � 0.17 9.35 � 3.00
P 1.45 � 0.10 0.08 � 0.03 2.33 � 0.48 2.57 � 0.24 0.50 � 0.06 0.05 � 0.01 1.17 � 0.11 7.99 � 1.94
Q 0.99 � 0.22 0.05 � 0.02 1.71 � 0.83 1.44 � 0.22 0.34 � 0.09 0.04 � 0.02 0.88 � 0.26 6.72 � 1.58
R 0.77 � 0.15 0.05 � 0.01 1.01 � 0.20 1.48 � 0.59 0.27 � 0.05 0.03 � 0.01 0.73 � 0.16 5.87 � 2.33
S 2.91 � 0.89 0.17 � 0.04 2.78 � 1.12 1.70 � 0.39 0.60 � 0.14 0.10 � 0.02 1.60 � 0.39 13.39 � 5.75
T 1.36 � 0.14 0.09 � 0.01 1.34 � 0.15 1.24 � 0.14 0.38 � 0.05 0.06 � 0.01 1.09 � 0.10 7.71 � 2.25
0.92 � 0.27 0.10 � 0.04 2.14 � 1.49 1.93 � 0.55 0.22 � 0.08 0.03 � 0.01 1.08 � 0.28 4.66 � 0.64
1.41 � 0.26 0.14 � 0.12 5.94 � 2.13 14.19 � 11.86 0.96 � 0.15 0.14 � 0.08 3.05 � 0.57 2.67 � 1.06
1.33 � 0.07 0.08 � 0.02 1.96 � 0.27 2.30 � 0.27 0.31 � 0.11 0.04 � 0.02 1.51 � 0.16 6.35 � 2.01
1.00 � 0.18 0.09 � 0.05 3.02 � 0.97 3.17 � 0.26 0.36 � 0.07 0.05 � 0.02 1.52 � 0.27 4.07 � 0.95
1.11 � 0.06 0.07 � 0.02 2.29 � 0.50 2.65 � 0.51 0.31 � 0.08 0.05 � 0.03 1.28 � 0.19 5.71 � 1.52
1.16 � 0.18 0.12 � 0.08 3.21 � 0.45 4.28 � 1.55 0.68 � 0.08 0.11 � 0.03 2.06 � 0.60 2.83 � 1.22

B. De, G. Nag / C. R. Biologies 337 (2014) 283–293286
available at Melbourne University. Response ratios repre-sent peak area ratios using ribitol as quantitative internalstandard. Relative response ratios [16,17] normalised pergram fresh weight for each analysed metabolite werecalculated.
Data were analysed by one way ANOVA to describe thesignificance in variation of each metabolite level betweenthe varieties. P values < 0.05 were considered as signifi-cant. Hierarchical clusters were generated using SPSSSoftware (Version 16) following the minimum distancehierarchical method which calculates the sum of squaredEuclidean distances from each case in a cluster to the meanof all variables. The method minimized the sum of squares
of any pair of clusters formed at a given step. The approachmaximizes between-group differences and minimizeswithin-group distances, optimizing the F statistic.
3. Results
Metabolic diversity regarding some polar metabolitese.g. sugars and sugar alcohols, amino acids/derivatives,phenolic acids and other organic acids and non-polarmetabolites e.g. fatty acids and phytosterols was examinedin 26 varieties of Indian rice grains using metabolomicsapproach by gas chromatography-mass spectrometry (GC-MS). Methanol extracts of rice grains were separated and
Table 3
Relative response ratios of fatty acids identified in rice grains.
2-Butenoate_
3TBS
Docosanoate Dodecanoate Eicosanoate Heptadecanoic_
acid
Hexadecanoate Linoleic_acid Nonanoate Octadecadienoate
WA 1.22 � 0.42 1.96 � 0.51 3.20 � 1.51 1.03 � 0.14 0.41 � 0.05 255.99 � 53.85 200.52 � 37.36 1.59 � 0.27 52.55 � 8.73
WB 3.88 � 1.96 10.27 � 2.73 17.04 � 4.25 4.04 � 0.37 1.24 � 0.24 1228.45 � 316.44 859.35 � 180.72 9.65 � 1.66 161.62 � 28.40
WC 1.12 � 0.15 4.86 � 0.74 7.66 � 3.27 2.85 � 0.32 0.91 � 0.30 554.52 � 68.07 390.27 � 41.35 4.70 � 0.95 106.73 � 27.57
WD 0.87 � 0.28 3.84 � 0.27 7.96 � 2.06 2.10 � 0.27 0.85 � 0.11 470.04 � 39.41 318.63 � 40.44 5.12 � 0.75 81.18 � 39.47
WE 1.31 � 0.42 2.25 � 0.22 4.15 � 1.19 1.14 � 0.13 0.44 � 0.06 280.65 � 29.54 218.31 � 27.60 2.96 � 0.61 52.61 � 4.25
WF 1.78 � 0.40 2.08 � 0.63 5.96 � 2.69 1.31 � 0.31 0.61 � 0.13 252.58 � 75.65 173.16 � 61.48 4.36 � 0.80 41.54 � 14.65
WG 0.90 � 0.12 1.98 � 0.30 3.26 � 0.63 1.57 � 0.36 0.53 � 0.16 235.60 � 36.16 144.35 � 18.09 2.50 � 0.46 41.75 � 5.73
WH 0.81 � 0.25 2.13 � 0.91 2.64 � 0.84 1.45 � 0.47 0.47 � 0.10 260.51 � 79.43 200.64 � 55.40 2.37 � 0.65 55.74 � 15.26
WI 1.21 � 0.29 3.07 � 1.01 5.37 � 1.32 1.17 � 0.18 0.46 � 0.07 401.68 � 129.29 226.06 � 7.90 4.39 � 2.94 47.23 � 14.35
WJ 0.98 � 0.23 5.44 � 0.92 7.48 � 2.88 3.05 � 0.48 0.63 � 0.27 663.60 � 84.41 437.54 � 25.17 4.50 � 0.70 120.29 � 13.30
WK 1.02 � 0.35 4.36 � 0.89 6.32 � 1.64 2.70 � 0.68 1.34 � 0.44 554.53 � 132.31 302.66 � 107.36 6.29 � 2.02 93.54 � 18.59
WL 0.92 � 0.23 3.68 � 0.91 6.59 � 3.49 2.38 � 0.44 0.69 � 0.14 466.78 � 92.15 287.92 � 73.94 4.72 � 0.92 91.14 � 15.37
WM 1.39 � 0.85 4.73 � 0.91 8.22 � 1.99 2.36 � 0.66 3.49 � 6.34 613.59 � 150.61 302.30 � 118.00 5.88 � 3.21 92.68 � 35.42
WN 0.62 � 0.18 1.33 � 0.26 6.00 � 1.81 2.37 � 0.73 0.61 � 0.09 228.90 � 32.26 122.48 � 35.45 3.14 � 0.40 73.99 � 25.94
WO 0.42 � 0.03 1.17 � 0.29 2.05 � 0.41 1.79 � 0.36 0.60 � 0.08 184.63 � 35.10 95.31 � 12.51 2.32 � 0.49 49.27 � 10.11
WP 0.54 � 0.06 1.13 � 0.24 3.78 � 0.71 1.88 � 0.28 0.64 � 0.05 181.58 � 12.91 119.17 � 21.89 3.05 � 0.41 78.61 � 17.43
WQ 0.42 � 0.20 1.08 � 0.20 2.92 � 0.48 2.18 � 1.03 0.52 � 0.07 196.11 � 35.17 126.78 � 25.53 2.30 � 0.55 85.95 � 35.78
WR 0.37 � 0.11 0.70 � 0.13 2.03 � 0.63 1.52 � 0.21 0.47 � 0.10 129.09 � 10.18 74.02 � 9.22 1.72 � 0.48 53.14 � 20.00
WS 0.25 � 0.05 0.92 � 0.32 2.77 � 0.87 2.43 � 0.78 0.65 � 0.15 169.79 � 62.67 112.20 � 49.29 2.54 � 0.17 90.03 � 31.15
WT 0.31 � 0.10 0.91 � 0.22 2.43 � 1.56 1.96 � 0.82 0.50 � 0.17 152.18 � 39.61 101.09 � 29.81 2.14 � 0.24 70.64 � 25.60
RA 1.22 � 0.51 1.31 � 0.32 3.50 � 0.64 1.25 � 0.15 0.39 � 0.04 204.89 � 48.73 87.59 � 26.16 3.91 � 1.46 33.72 � 18.30
RB 1.91 � 0.71 8.77 � 3.09 23.33 � 13.30 3.15 � 0.42 0.83 � 0.12 1416.12 � 568.54 127.99 � 57.69 28.78 � 10.59 7.04 � 8.44
RC 1.03 � 0.21 1.08 � 0.20 4.84 � 1.35 1.19 � 0.29 0.50 � 0.10 183.24 � 13.67 98.97 � 14.11 4.26 � 1.02 34.26 � 10.98
RD 1.04 � 0.15 2.53 � 0.80 7.24 � 4.56 1.76 � 0.46 0.57 � 0.13 352.22 � 61.30 96.95 � 26.42 8.37 � 3.79 23.24 � 13.00
RE 0.78 � 0.33 1.42 � 0.53 6.63 � 3.24 1.35 � 0.85 0.42 � 0.10 220.18 � 61.35 95.71 � 61.31 5.30 � 1.24 34.97 � 30.42
RF 1.13 � 0.27 3.45 � 1.70 5.52 � 1.89 2.11 � 0.50 0.58 � 0.19 731.97 � 307.47 166.80 � 35.31 10.95 � 4.49 25.57 � 16.65
Octadecanoate 2-Oxobutanoate 2-Oxobutyrate 2-Oxovaleric_
acid
Pentadecanoate Phytanate Tetracosanoate Tetradecandioate Tricosanoate
WA 117.75 � 31.53 1.25 � 0.25 0.21 � 0.03 0.38 � 0.07 1.13 � 0.51 5.81 � 1.29 4.69 � 1.35 1.74 � 1.10 1.06 � 0.37
WB 677.54 � 179.61 2.46 � 0.83 1.12 � 0.78 2.31 � 0.70 8.10 � 5.74 34.34 � 8.71 16.11 � 3.96 3.45 � 1.35 3.91 � 1.14
WC 228.53 � 51.74 1.15 � 0.30 0.25 � 0.07 0.92 � 0.27 2.97 � 1.88 15.16 � 1.75 7.65 � 1.78 1.07 � 0.20 1.64 � 0.38
WD 281.38 � 32.16 1.07 � 0.38 0.41 � 0.42 1.02 � 0.14 2.76 � 0.44 11.16 � 8.19 5.95 � 1.73 0.98 � 0.19 1.21 � 0.19
WE 146.01 � 22.09 1.40 � 0.26 0.24 � 0.05 0.53 � 0.07 1.72 � 0.35 6.76 � 0.88 4.93 � 1.18 1.32 � 0.39 1.36 � 0.14
WF 165.03 � 47.24 0.75 � 0.12 0.32 � 0.10 0.63 � 0.18 1.89 � 0.62 7.04 � 2.27 3.56 � 1.48 1.78 � 0.59 0.92 � 0.42
WG 155.54 � 30.26 0.89 � 0.15 0.59 � 0.51 0.62 � 0.13 1.56 � 0.47 6.75 � 1.05 3.34 � 0.77 0.97 � 0.24 0.76 � 0.13
WH 139.95 � 36.88 1.12 � 0.33 0.34 � 0.09 0.50 � 0.17 1.24 � 0.44 7.06 � 3.01 3.98 � 1.91 0.80 � 0.26 0.86 � 0.42
WI 210.13 � 72.10 2.18 � 0.66 0.36 � 0.11 0.69 � 0.30 1.97 � 0.86 10.05 � 3.58 6.85 � 2.33 1.10 � 0.19 1.29 � 0.31
WJ 261.02 � 55.27 1.67 � 0.48 0.39 � 0.13 0.79 � 0.13 2.75 � 0.54 17.60 � 3.20 9.82 � 2.34 0.97 � 0.21 1.74 � 0.25
WK 314.28 � 83.37 1.18 � 0.14 0.89 � 1.22 1.23 � 0.27 2.66 � 0.77 14.49 � 3.61 9.16 � 1.96 0.92 � 0.26 1.40 � 0.30
WL 220.86 � 27.74 1.08 � 0.24 0.40 � 0.37 0.93 � 0.11 1.93 � 0.54 11.89 � 2.23 6.13 � 1.65 0.85 � 0.23 1.32 � 0.42
WM 256.75 � 70.43 1.44 � 0.23 0.83 � 1.24 0.91 � 0.09 2.30 � 0.57 15.81 � 3.69 7.93 � 2.28 0.98 � 0.41 1.38 � 0.29
WN 122.44 � 20.31 0.91 � 0.33 0.15 � 0.04 0.89 � 0.14 1.11 � 0.14 5.25 � 1.00 2.00 � 0.20 0.55 � 0.14 0.33 � 0.24
WO 88.73 � 13.73 0.92 � 0.19 0.14 � 0.03 0.60 � 0.05 1.31 � 0.99 3.65 � 0.91 2.12 � 0.47 0.33 � 0.10 0.30 � 0.09
WP 115.12 � 5.11 0.87 � 0.30 0.15 � 0.03 0.83 � 0.10 1.03 � 0.15 4.41 � 0.46 1.88 � 0.51 0.33 � 0.09 0.41 � 0.27
WQ 87.64 � 14.73 0.73 � 0.15 0.12 � 0.09 0.57 � 0.08 0.82 � 0.12 4.28 � 0.28 1.75 � 0.47 0.26 � 0.03 0.28 � 0.01
WR 64.20 � 17.99 0.48 � 0.14 0.10 � 0.03 0.43 � 0.16 0.69 � 0.31 2.64 � 0.37 1.31 � 0.19 0.27 � 0.09 0.17 � 0.09
WS 73.56 � 16.61 0.97 � 0.11 0.11 � 0.05 0.57 � 0.21 0.80 � 0.19 3.62 � 1.33 1.42 � 0.40 0.18 � 0.04 0.23 � 0.15
WT 61.33 � 11.79 0.57 � 0.08 0.11 � 0.01 0.37 � 0.06 0.64 � 0.14 3.33 � 0.79 1.55 � 0.37 0.21 � 0.07 0.29 � 0.21
RA 117.80 � 39.12 0.86 � 0.33 0.19 � 0.07 0.79 � 0.23 1.23 � 0.25 4.63 � 1.05 2.78 � 0.89 0.62 � 0.06 0.26 � 0.25
RB 656.06 � 229.14 5.80 � 1.73 0.88 � 0.45 4.13 � 1.09 7.52 � 2.56 30.85 � 10.63 18.67 � 6.40 1.98 � 0.80 0.07 � 0.05
RC 119.58 � 20.12 0.83 � 0.24 0.18 � 0.05 0.90 � 0.26 1.13 � 0.18 4.32 � 0.63 2.30 � 0.38 0.55 � 0.13 0.46 � 0.39
RD 211.74 � 84.84 2.33 � 0.59 0.32 � 0.07 1.38 � 0.64 3.02 � 1.34 9.42 � 3.46 4.82 � 0.91 0.65 � 0.27 0.26 � 0.12
RE 138.35 � 22.30 1.33 � 0.13 0.21 � 0.15 1.01 � 0.22 1.52 � 0.22 5.79 � 1.75 2.43 � 0.82 0.48 � 0.20 0.28 � 0.18
RF 269.11 � 94.93 2.32 � 0.79 0.39 � 0.19 1.49 � 0.40 3.39 � 1.26 12.92 � 5.91 6.46 � 2.44 0.57 � 0.16 0.14 � 0.13
anaChrspeSamhunvarthechachaacidorgconmepre
Tab
Rela
W
W
W
W
W
W
W
W
W
W
W
W
W
W
W
W
W
W
W
W
RA
RB
RC
RD
RE
RF
W
W
W
W
W
W
W
W
W
W
W
W
W
W
W
W
W
W
W
W
RA
RB
RC
RD
RE
RF
B. De, G. Nag / C. R. Biologies 337 (2014) 283–293 287
lysed by GC-MS after derivatisation in TMS or TBS.omatograms were analysed using Automated Massctral Deconvolution and Identification System (AMDIS).ples derivatised with TMS and TBS yielded more thandreds of compounds varying in quantity according to
ieties. Seventy-six metabolites could be identified in rice varieties analysed. These metabolites wereracterized into seven groups based on their chemicalracteristics. These are sugars/sugar alcohols, aminos/derivatives, fatty acids, free phenolic acids and other
anic acids, phytosterols, purine derivatives and otherstituents. Relative response ratios of the identifiedtabolites in different rice grains were calculated and aresented in Tables 2–6. For comparative purposes,
relative response ratios for each metabolite are routinelydescribed [18].
Table 2 shows the relative response ratios of 17 aminoacids identified in the rice grains. These were alanine, beta-alanine, allantoin, asparagines, aspartic acid, g-aminobu-tyric acid (GABA), glutamate, glycine, homoserine, leucine,phenylalanine, proline, pyroglutamate, serine, threonine,tyrosine, and valine. The amount of each amino aciddiffered between the varieties significantly except valine.Semiquantitative analyses on the basis of relativeresponse ratios indicated that alanine level was highestin WB and lowest in RF. Beta-alanine level was alsohighest in WB and lowest in RB. The grains of WBcontained highest amount of GABA, glutamate, tyrosine
le 4
tive response ratios of organic acids identified in rice grains.
Trans-aconitate_
4TBS
Ascorbate Citrate Fumarate Galactonate Gluconate Glycerate Glycerate-
3-P
Glycolate Isocitrate
A 0.23 � 0.13 0.09 � 0.03 4.06 � 1.05 0.62 � 0.21 85.27 � 10.03 36.29 � 14.49 0.63 � 0.11 0.52 � 0.16 4.38 � 1.95 0.25 � 0.11
B 1.50 � 1.30 0.40 � 0.20 2.93 � 0.75 2.37 � 1.16 388.09 � 72.23 66.19 � 17.05 3.38 � 1.06 3.66 � 1.26 22.31 � 14.90 0.46 � 0.48
C 0.45 � 0.25 0.17 � 0.08 2.81 � 0.65 1.18 � 0.88 278.51 � 46.13 27.75 � 4.19 1.47 � 0.15 1.33 � 0.50 8.79 � 5.78 0.20 � 0.11
D 0.43 � 0.33 0.17 � 0.10 1.88 � 1.16 1.00 � 0.25 170.94 � 60.97 27.96 � 8.99 1.55 � 0.30 1.36 � 0.28 10.06 � 5.54 0.19 � 0.10
E 0.26 � 0.12 0.11 � 0.04 1.88 � 0.92 0.62 � 0.24 112.98 � 13.88 40.93 � 8.07 0.56 � 0.08 0.66 � 0.29 5.46 � 2.39 0.18 � 0.08
F 0.27 � 0.13 0.07 � 0.04 3.93 � 1.51 0.76 � 0.19 171.16 � 39.34 25.46 � 1.52 0.54 � 0.09 0.94 � 0.31 7.06 � 3.95 0.14 � 0.11
G 0.23 � 0.18 0.05 � 0.03 2.38 � 0.75 0.75 � 0.35 159.62 � 17.14 31.49 � 7.55 0.59 � 0.24 0.72 � 0.29 5.72 � 3.50 0.11 � 0.07
H 0.25 � 0.15 0.08 � 0.07 4.49 � 2.00 0.81 � 0.34 132.05 � 10.62 22.35 � 2.04 0.92 � 0.74 0.62 � 0.12 5.68 � 4.14 0.15 � 0.14
I 0.25 � 0.07 0.20 � 0.12 1.93 � 0.63 1.65 � 1.21 127.83 � 14.42 44.62 � 16.12 1.25 � 0.56 1.00 � 0.30 7.98 � 5.25 0.14 � 0.09
J 0.42 � 0.28 0.15 � 0.08 2.12 � 0.78 1.00 � 0.26 93.14 � 13.77 24.66 � 4.24 2.41 � 0.64 1.22 � 0.64 7.25 � 3.71 0.14 � 0.06
K 0.49 � 0.42 0.20 � 0.13 3.17 � 1.90 1.01 � 0.67 129.62 � 17.49 26.65 � 3.68 1.29 � 0.28 1.11 � 0.34 8.99 � 5.46 0.21 � 0.15
L 0.45 � 0.26 0.17 � 0.04 2.54 � 0.63 1.15 � 0.33 121.53 � 9.69 25.81 � 5.51 1.67 � 0.53 1.12 � 0.19 7.22 � 5.13 0.10 � 0.08
M 0.43 � 0.47 0.24 � 0.21 2.96 � 1.17 1.31 � 0.89 203.57 � 15.05 51.41 � 61.62 2.61 � 1.02 1.06 � 0.47 7.94 � 4.95 0.12 � 0.04
N 0.38 � 0.19 0.05 � 0.03 7.01 � 1.82 0.62 � 0.25 31.55 � 8.59 226.03 � 21.83 0.61 � 0.07 0.26 � 0.16 7.76 � 2.15 0.08 � 0.05
O 0.28 � 0.26 0.04 � 0.01 5.98 � 1.38 0.53 � 0.14 39.28 � 5.14 234.82 � 41.60 0.59 � 0.13 0.21 � 0.14 5.38 � 1.84 0.06 � 0.03
P 0.34 � 0.23 0.05 � 0.02 9.87 � 2.04 0.79 � 0.06 480.10 � 67.88 309.25 � 40.30 0.34 � 0.04 0.22 � 0.17 7.45 � 2.86 0.05 � 0.01
Q 0.37 � 0.08 0.03 � 0.01 9.87 � 6.29 0.52 � 0.14 186.08 � 1.64 178.12 � 35.93 0.37 � 0.12 0.17 � 0.09 4.15 � 1.56 0.04 � 0.01
R 0.24 � 0.11 0.02 � 0.01 5.83 � 0.73 0.32 � 0.15 49.10 � 4.26 96.59 � 9.36 0.22 � 0.02 0.13 � 0.07 4.12 � 2.36 0.02 � 0.01
S 0.24 � 0.10 0.02 � 0.01 6.62 � 4.15 0.38 � 0.12 17.39 � 2.21 98.00 � 5.46 0.91 � 0.23 0.11 � 0.09 4.44 � 2.64 0.03 � 0.01
T 0.24 � 0.05 0.02 � 0.01 6.84 � 1.66 0.45 � 0.13 23.23 � 3.08 90.19 � 26.11 0.50 � 0.04 0.08 � 0.08 3.43 � 1.35 0.02 � 0.01
0.44 � 0.17 0.05 � 0.02 5.16 � 0.49 0.67 � 0.28 15.85 � 6.35 144.60 � 24.19 0.43 � 0.14 0.38 � 0.24 8.41 � 4.69 0.05 � 0.03
1.48 � 1.44 0.89 � 0.30 11.89 � 5.29 7.67 � 1.83 22.78 � 5.90 149.77 � 46.76 3.99 � 1.27 1.31 � 0.47 42.15 � 17.29 0.92 � 0.25
0.66 � 0.52 0.04 � 0.03 9.95 � 2.00 0.62 � 0.17 51.19 � 8.07 186.33 � 22.85 0.37 � 0.07 0.15 � 0.14 8.99 � 3.58 0.05 � 0.02
0.96 � 0.25 0.10 � 0.06 8.04 � 1.64 1.28 � 0.50 25.28 � 2.90 104.93 � 38.53 1.31 � 0.21 0.54 � 0.41 11.88 � 7.94 0.04 � 0.01
0.54 � 0.09 0.05 � 0.02 7.72 � 3.96 0.74 � 0.14 27.41 � 5.99 177.00 � 24.29 0.70 � 0.41 0.24 � 0.10 8.63 � 2.70 0.06 � 0.03
0.73 � 0.49 0.14 � 0.09 6.07 � 0.78 7.87 � 7.67 21.76 � 5.07 73.65 � 41.80 2.36 � 0.94 0.37 � 0.08 14.29 � 5.70 0.16 � 0.08
Malate Malonate Muconate Oxaloacetate Sinapinate Succinate Tartrate Threonate_4TBS Urate
A 2.29 � 0.94 0.23 � 0.04 0.48 � 0.26 1.66 � 0.70 1.31 � 0.41 0.79 � 0.23 5.38 � 2.01 0.12 � 0.01 0.40 � 0.33
B 6.89 � 3.00 0.97 � 0.32 0.82 � 0.34 5.07 � 2.72 3.82 � 1.00 5.00 � 2.67 19.31 � 6.74 0.49 � 0.14 0.61 � 0.40
C 1.91 � 0.59 0.35 � 0.07 0.26 � 0.07 2.13 � 0.80 1.75 � 0.45 1.50 � 0.34 8.02 � 1.37 0.17 � 0.06 0.15 � 0.04
D 2.54 � 0.70 0.39 � 0.11 0.22 � 0.09 2.13 � 0.76 1.58 � 0.08 1.51 � 0.33 6.89 � 3.07 0.13 � 0.02 2.52 � 5.97
E 1.50 � 0.83 0.30 � 0.03 0.49 � 0.15 2.03 � 0.30 1.13 � 0.23 0.83 � 0.28 6.69 � 1.08 0.14 � 0.03 0.47 � 0.88
F 1.74 � 0.66 0.35 � 0.07 0.51 � 0.20 3.21 � 0.88 1.79 � 0.63 1.08 � 0.46 5.95 � 1.98 0.12 � 0.03 0.17 � 0.26
G 1.86 � 0.75 0.29 � 0.02 0.25 � 0.09 1.59 � 0.57 1.28 � 0.32 0.91 � 0.22 4.70 � 0.60 0.11 � 0.02 0.06 � 0.05
H 2.07 � 0.92 0.34 � 0.11 0.26 � 0.14 1.46 � 0.70 1.24 � 0.31 1.15 � 0.60 3.91 � 0.74 0.17 � 0.13 0.06 � 0.03
I 2.45 � 1.23 0.61 � 0.28 0.50 � 0.17 1.88 � 0.70 1.62 � 0.34 1.59 � 0.65 7.10 � 2.50 0.39 � 0.20 0.20 � 0.34
J 4.25 � 1.62 0.39 � 0.08 0.28 � 0.08 1.65 � 0.41 1.66 � 0.25 1.68 � 0.41 6.13 � 0.93 0.35 � 0.13 2.44 � 4.42
K 2.61 � 1.03 0.55 � 0.13 0.26 � 0.13 1.95 � 0.77 1.51 � 0.64 1.35 � 0.51 6.21 � 0.98 0.15 � 0.08 1.82 � 2.62
L 3.55 � 1.78 0.46 � 0.07 0.20 � 0.06 1.70 � 0.57 1.10 � 0.14 1.58 � 0.69 6.04 � 1.23 0.19 � 0.07 0.18 � 0.23
M 3.98 � 1.91 0.45 � 0.13 0.33 � 0.14 2.15 � 0.91 1.62 � 0.35 1.89 � 0.83 7.06 � 1.88 0.26 � 0.10 1.13 � 2.25
N 1.33 � 0.25 0.35 � 0.06 0.21 � 0.04 1.25 � 0.91 0.34 � 0.07 0.82 � 0.12 2.87 � 0.39 0.05 � 0.02 0.17 � 0.12
O 1.21 � 0.38 0.32 � 0.08 0.19 � 0.04 0.60 � 0.28 0.51 � 0.14 0.71 � 0.20 2.22 � 0.30 0.06 � 0.02 0.06 � 0.02
P 1.29 � 0.16 0.31 � 0.04 0.22 � 0.16 0.90 � 0.26 1.08 � 0.14 1.03 � 0.12 3.68 � 0.24 0.04 � 0.02 0.73 � 0.83
Q 0.87 � 0.10 0.20 � 0.03 0.12 � 0.01 0.64 � 0.09 0.62 � 0.07 0.64 � 0.22 1.99 � 0.30 0.03 � 0.02 0.56 � 0.05
R 0.44 � 0.09 0.19 � 0.07 0.11 � 0.04 0.63 � 0.18 0.41 � 0.05 0.36 � 0.05 1.35 � 0.29 0.03 � 0.01 0.14 � 0.02
S 0.97 � 0.65 0.25 � 0.07 0.08 � 0.02 0.42 � 0.11 0.45 � 0.12 0.60 � 0.16 0.99 � 0.19 0.06 � 0.02 0.19 � 0.14
T 1.09 � 0.30 0.22 � 0.05 0.10 � 0.02 0.44 � 0.13 0.43 � 0.09 0.54 � 0.04 1.06 � 0.29 0.05 � 0.01 0.13 � 0.17
1.21 � 0.63 0.32 � 0.16 0.32 � 0.13 2.29 � 1.38 1.04 � 0.17 0.86 � 0.31 3.19 � 1.72 0.07 � 0.04 0.12 � 0.11
21.13 � 32.05 2.81 � 0.94 1.42 � 0.56 3.96 � 1.22 3.01 � 0.96 4.75 � 1.75 10.01 � 3.04 0.57 � 0.16 0.85 � 0.75
1.13 � 0.27 0.26 � 0.12 0.28 � 0.03 2.15 � 0.41 0.69 � 0.13 0.63 � 0.17 3.07 � 0.23 0.05 � 0.02 0.04 � 0.03
2.11 � 0.91 0.64 � 0.09 0.34 � 0.15 1.85 � 1.06 1.09 � 0.51 1.26 � 0.36 3.95 � 0.85 0.14 � 0.09 0.59 � 1.62
1.56 � 0.25 0.34 � 0.10 0.22 � 0.12 1.57 � 1.01 0.81 � 0.17 0.74 � 0.09 3.27 � 0.25 0.08 � 0.05 0.90 � 1.45
4.88 � 2.34 0.90 � 0.30 0.56 � 0.18 1.49 � 0.52 1.85 � 0.66 2.34 � 1.05 4.86 � 1.46 0.45 � 0.22 0.23 � 0.21
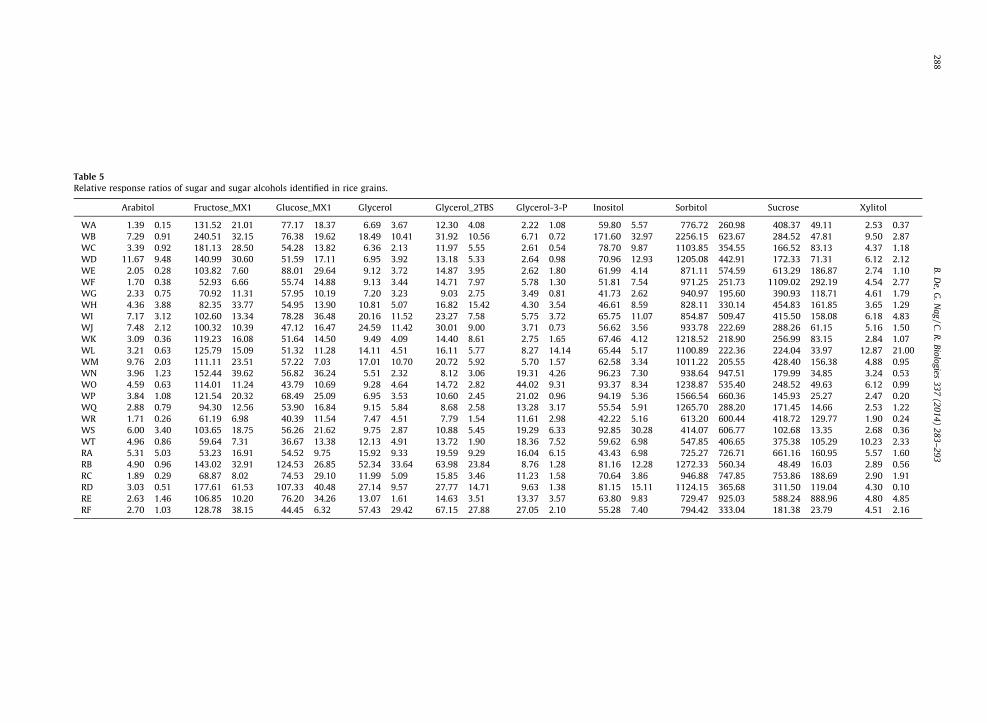
Table 5
Relative response ratios of sugar and sugar alcohols identified in rice grains.
Arabitol Fructose_MX1 Glucose_MX1 Glycerol Glycerol_2TBS Glycerol-3-P Inositol Sorbitol Sucrose Xylitol
WA 1.39� 0.15 131.52� 21.01 77.17� 18.37 6.69� 3.67 12.30� 4.08 2.22� 1.08 59.80� 5.57 776.72� 260.98 408.37� 49.11 2.53� 0.37
WB 7.29� 0.91 240.51� 32.15 76.38� 19.62 18.49� 10.41 31.92� 10.56 6.71� 0.72 171.60� 32.97 2256.15� 623.67 284.52� 47.81 9.50� 2.87
WC 3.39� 0.92 181.13� 28.50 54.28� 13.82 6.36� 2.13 11.97� 5.55 2.61� 0.54 78.70� 9.87 1103.85� 354.55 166.52� 83.13 4.37� 1.18
WD 11.67� 9.48 140.99� 30.60 51.59� 17.11 6.95� 3.92 13.18� 5.33 2.64� 0.98 70.96� 12.93 1205.08� 442.91 172.33� 71.31 6.12� 2.12
WE 2.05� 0.28 103.82� 7.60 88.01� 29.64 9.12� 3.72 14.87� 3.95 2.62� 1.80 61.99� 4.14 871.11� 574.59 613.29� 186.87 2.74� 1.10
WF 1.70� 0.38 52.93� 6.66 55.74� 14.88 9.13� 3.44 14.71� 7.97 5.78� 1.30 51.81� 7.54 971.25� 251.73 1109.02� 292.19 4.54� 2.77
WG 2.33� 0.75 70.92� 11.31 57.95� 10.19 7.20� 3.23 9.03� 2.75 3.49� 0.81 41.73� 2.62 940.97� 195.60 390.93� 118.71 4.61� 1.79
WH 4.36� 3.88 82.35� 33.77 54.95� 13.90 10.81� 5.07 16.82� 15.42 4.30� 3.54 46.61� 8.59 828.11� 330.14 454.83� 161.85 3.65� 1.29
WI 7.17� 3.12 102.60� 13.34 78.28� 36.48 20.16� 11.52 23.27� 7.58 5.75� 3.72 65.75� 11.07 854.87� 509.47 415.50� 158.08 6.18� 4.83
WJ 7.48� 2.12 100.32� 10.39 47.12� 16.47 24.59� 11.42 30.01� 9.00 3.71� 0.73 56.62� 3.56 933.78� 222.69 288.26� 61.15 5.16� 1.50
WK 3.09� 0.36 119.23� 16.08 51.64� 14.50 9.49� 4.09 14.40� 8.61 2.75� 1.65 67.46� 4.12 1218.52� 218.90 256.99� 83.15 2.84� 1.07
WL 3.21� 0.63 125.79� 15.09 51.32� 11.28 14.11� 4.51 16.11� 5.77 8.27� 14.14 65.44� 5.17 1100.89� 222.36 224.04� 33.97 12.87� 21.00
WM 9.76� 2.03 111.11� 23.51 57.22� 7.03 17.01� 10.70 20.72� 5.92 5.70� 1.57 62.58� 3.34 1011.22� 205.55 428.40� 156.38 4.88� 0.95
WN 3.96� 1.23 152.44� 39.62 56.82� 36.24 5.51� 2.32 8.12� 3.06 19.31� 4.26 96.23� 7.30 938.64� 947.51 179.99� 34.85 3.24� 0.53
WO 4.59� 0.63 114.01� 11.24 43.79� 10.69 9.28� 4.64 14.72� 2.82 44.02� 9.31 93.37� 8.34 1238.87� 535.40 248.52� 49.63 6.12� 0.99
WP 3.84� 1.08 121.54� 20.32 68.49� 25.09 6.95� 3.53 10.60� 2.45 21.02� 0.96 94.19� 5.36 1566.54� 660.36 145.93� 25.27 2.47� 0.20
WQ 2.88� 0.79 94.30� 12.56 53.90� 16.84 9.15� 5.84 8.68� 2.58 13.28� 3.17 55.54� 5.91 1265.70� 288.20 171.45� 14.66 2.53� 1.22
WR 1.71� 0.26 61.19� 6.98 40.39� 11.54 7.47� 4.51 7.79� 1.54 11.61� 2.98 42.22� 5.16 613.20� 600.44 418.72� 129.77 1.90� 0.24
WS 6.00� 3.40 103.65� 18.75 56.26� 21.62 9.75� 2.87 10.88� 5.45 19.29� 6.33 92.85� 30.28 414.07� 606.77 102.68� 13.35 2.68� 0.36
WT 4.96� 0.86 59.64� 7.31 36.67� 13.38 12.13� 4.91 13.72� 1.90 18.36� 7.52 59.62� 6.98 547.85� 406.65 375.38� 105.29 10.23� 2.33
RA 5.31� 5.03 53.23� 16.91 54.52� 9.75 15.92� 9.33 19.59� 9.29 16.04� 6.15 43.43� 6.98 725.27� 726.71 661.16� 160.95 5.57� 1.60
RB 4.90� 0.96 143.02� 32.91 124.53� 26.85 52.34� 33.64 63.98� 23.84 8.76� 1.28 81.16� 12.28 1272.33� 560.34 48.49� 16.03 2.89� 0.56
RC 1.89� 0.29 68.87� 8.02 74.53� 29.10 11.99� 5.09 15.85� 3.46 11.23� 1.58 70.64� 3.86 946.88� 747.85 753.86� 188.69 2.90� 1.91
RD 3.03� 0.51 177.61� 61.53 107.33� 40.48 27.14� 9.57 27.77� 14.71 9.63� 1.38 81.15� 15.11 1124.15� 365.68 311.50� 119.04 4.30� 0.10
RE 2.63� 1.46 106.85� 10.20 76.20� 34.26 13.07� 1.61 14.63� 3.51 13.37� 3.57 63.80� 9.83 729.47� 925.03 588.24� 888.96 4.80� 4.85
RF 2.70� 1.03 128.78� 38.15 44.45� 6.32 57.43� 29.42 67.15� 27.88 27.05� 2.10 55.28� 7.40 794.42� 333.04 181.38� 23.79 4.51� 2.16
B.
De,
G.
Na
g /
C.
R.
Bio
log
ies 3
37
(20
14
) 2
83
–2
93
28
8
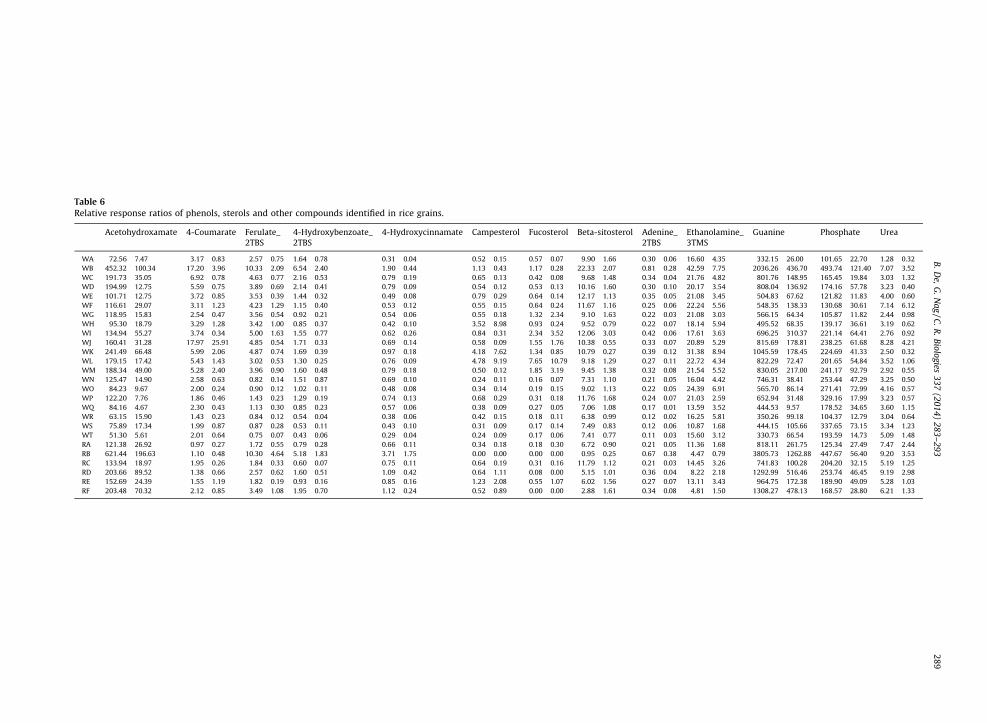
Table 6
Relative response ratios of phenols, sterols and other compounds identified in rice grains.
Acetohydroxamate 4-Coumarate Ferulate_
2TBS
4-Hydroxybenzoate_
2TBS
4-Hydroxycinnamate Campesterol Fucosterol Beta-sitosterol Adenine_
2TBS
Ethanolamine_
3TMS
Guanine Phosphate Urea
WA 72.56� 7.47 3.17� 0.83 2.57� 0.75 1.64� 0.78 0.31� 0.04 0.52� 0.15 0.57� 0.07 9.90� 1.66 0.30� 0.06 16.60� 4.35 332.15� 26.00 101.65� 22.70 1.28� 0.32
WB 452.32� 100.34 17.20� 3.96 10.33� 2.09 6.54� 2.40 1.90� 0.44 1.13� 0.43 1.17� 0.28 22.33� 2.07 0.81� 0.28 42.59� 7.75 2036.26� 436.70 493.74� 121.40 7.07� 3.52
WC 191.73� 35.05 6.92� 0.78 4.63� 0.77 2.16� 0.53 0.79� 0.19 0.65� 0.13 0.42� 0.08 9.68� 1.48 0.34� 0.04 21.76� 4.82 801.76� 148.95 165.45� 19.84 3.03� 1.32
WD 194.99� 12.75 5.59� 0.75 3.89� 0.69 2.14� 0.41 0.79� 0.09 0.54� 0.12 0.53� 0.13 10.16� 1.60 0.30� 0.10 20.17� 3.54 808.04� 136.92 174.16� 57.78 3.23� 0.40
WE 101.71� 12.75 3.72� 0.85 3.53� 0.39 1.44� 0.32 0.49� 0.08 0.79� 0.29 0.64� 0.14 12.17� 1.13 0.35� 0.05 21.08� 3.45 504.83� 67.62 121.82� 11.83 4.00� 0.60
WF 116.61� 29.07 3.11� 1.23 4.23� 1.29 1.15� 0.40 0.53� 0.12 0.55� 0.15 0.64� 0.24 11.67� 1.16 0.25� 0.06 22.24� 5.56 548.35� 138.33 130.68� 30.61 7.14� 6.12
WG 118.95� 15.83 2.54� 0.47 3.56� 0.54 0.92� 0.21 0.54� 0.06 0.55� 0.18 1.32� 2.34 9.10� 1.63 0.22� 0.03 21.08� 3.03 566.15� 64.34 105.87� 11.82 2.44� 0.98
WH 95.30� 18.79 3.29� 1.28 3.42� 1.00 0.85� 0.37 0.42� 0.10 3.52� 8.98 0.93� 0.24 9.52� 0.79 0.22� 0.07 18.14� 5.94 495.52� 68.35 139.17� 36.61 3.19� 0.62
WI 134.94� 55.27 3.74� 0.34 5.00� 1.63 1.55� 0.77 0.62� 0.26 0.84� 0.31 2.34� 3.52 12.06� 3.03 0.42� 0.06 17.61� 3.63 696.25� 310.37 221.14� 64.41 2.76� 0.92
WJ 160.41� 31.28 17.97� 25.91 4.85� 0.54 1.71� 0.33 0.69� 0.14 0.58� 0.09 1.55� 1.76 10.38� 0.55 0.33� 0.07 20.89� 5.29 815.69� 178.81 238.25� 61.68 8.28� 4.21
WK 241.49� 66.48 5.99� 2.06 4.87� 0.74 1.69� 0.39 0.97� 0.18 4.18� 7.62 1.34� 0.85 10.79� 0.27 0.39� 0.12 31.38� 8.94 1045.59� 178.45 224.69� 41.33 2.50� 0.32
WL 179.15� 17.42 5.43� 1.43 3.02� 0.53 1.30� 0.25 0.76� 0.09 4.78� 9.19 7.65� 10.79 9.18� 1.29 0.27� 0.11 22.72� 4.34 822.29� 72.47 201.65� 54.84 3.52� 1.06
WM 188.34� 49.00 5.28� 2.40 3.96� 0.90 1.60� 0.48 0.79� 0.18 0.50� 0.12 1.85� 3.19 9.45� 1.38 0.32� 0.08 21.54� 5.52 830.05� 217.00 241.17� 92.79 2.92� 0.55
WN 125.47� 14.90 2.58� 0.63 0.82� 0.14 1.51� 0.87 0.69� 0.10 0.24� 0.11 0.16� 0.07 7.31� 1.10 0.21� 0.05 16.04� 4.42 746.31� 38.41 253.44� 47.29 3.25� 0.50
WO 84.23� 9.67 2.00� 0.24 0.90� 0.12 1.02� 0.11 0.48� 0.08 0.34� 0.14 0.19� 0.15 9.02� 1.13 0.22� 0.05 24.39� 6.91 565.70� 86.14 271.41� 72.99 4.16� 0.57
WP 122.20� 7.76 1.86� 0.46 1.43� 0.23 1.29� 0.19 0.74� 0.13 0.68� 0.29 0.31� 0.18 11.76� 1.68 0.24� 0.07 21.03� 2.59 652.94� 31.48 329.16� 17.99 3.23� 0.57
WQ 84.16� 4.67 2.30� 0.43 1.13� 0.30 0.85� 0.23 0.57� 0.06 0.38� 0.09 0.27� 0.05 7.06� 1.08 0.17� 0.01 13.59� 3.52 444.53� 9.57 178.52� 34.65 3.60� 1.15
WR 63.15� 15.90 1.43� 0.23 0.84� 0.12 0.54� 0.04 0.38� 0.06 0.42� 0.15 0.18� 0.11 6.38� 0.99 0.12� 0.02 16.25� 5.81 350.26� 99.18 104.37� 12.79 3.04� 0.64
WS 75.89� 17.34 1.99� 0.87 0.87� 0.28 0.53� 0.11 0.43� 0.10 0.31� 0.09 0.17� 0.14 7.49� 0.83 0.12� 0.06 10.87� 1.68 444.15� 105.66 337.65� 73.15 3.34� 1.23
WT 51.30� 5.61 2.01� 0.64 0.75� 0.07 0.43� 0.06 0.29� 0.04 0.24� 0.09 0.17� 0.06 7.41� 0.77 0.11� 0.03 15.60� 3.12 330.73� 66.54 193.59� 14.73 5.09� 1.48
RA 121.38� 26.92 0.97� 0.27 1.72� 0.55 0.79� 0.28 0.66� 0.11 0.34� 0.18 0.18� 0.30 6.72� 0.90 0.21� 0.05 11.36� 1.68 818.11� 261.75 125.34� 27.49 7.47� 2.44
RB 621.44� 196.63 1.10� 0.48 10.30� 4.64 5.18� 1.83 3.71� 1.75 0.00� 0.00 0.00� 0.00 0.95� 0.25 0.67� 0.38 4.47� 0.79 3805.73� 1262.88 447.67� 56.40 9.20� 3.53
RC 133.94� 18.97 1.95� 0.26 1.84� 0.33 0.60� 0.07 0.75� 0.11 0.64� 0.19 0.31� 0.16 11.79� 1.12 0.21� 0.03 14.45� 3.26 741.83� 100.28 204.20� 32.15 5.19� 1.25
RD 203.66� 89.52 1.38� 0.66 2.57� 0.62 1.60� 0.51 1.09� 0.42 0.64� 1.11 0.08� 0.00 5.15� 1.01 0.36� 0.04 8.22� 2.18 1292.99� 516.46 253.74� 46.45 9.19� 2.98
RE 152.69� 24.39 1.55� 1.19 1.82� 0.19 0.93� 0.16 0.85� 0.16 1.23� 2.08 0.55� 1.07 6.02� 1.56 0.27� 0.07 13.11� 3.43 964.75� 172.38 189.90� 49.09 5.28� 1.03
RF 203.48� 70.32 2.12� 0.85 3.49� 1.08 1.95� 0.70 1.12� 0.24 0.52� 0.89 0.00� 0.00 2.88� 1.61 0.34� 0.08 4.81� 1.50 1308.27� 478.13 168.57� 28.80 6.21� 1.33
B.
De,
G.
Na
g /
C.
R.
Bio
log
ies 3
37
(20
14
) 2
83
–2
93
2
89
B. De, G. Nag / C. R. Biologies 337 (2014) 283–293290
and valine. Asparagine level was highest in the grains ofWI. The grains of RB contained high level of allantoin,glycine, homoserine and proline.
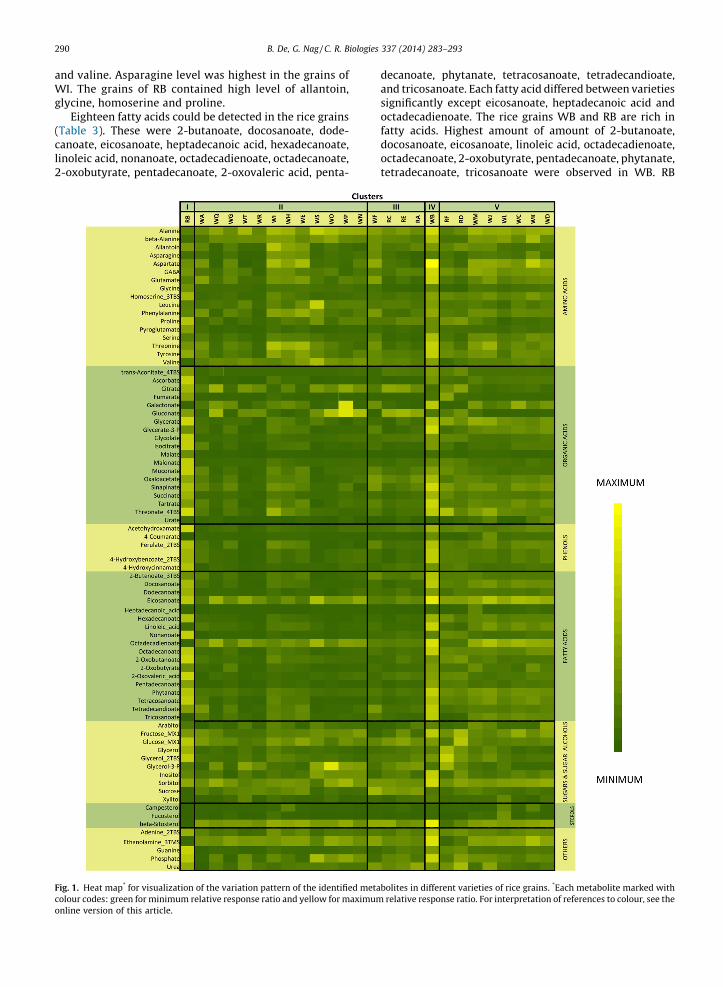
Eighteen fatty acids could be detected in the rice grains(Table 3). These were 2-butanoate, docosanoate, dode-canoate, eicosanoate, heptadecanoic acid, hexadecanoate,linoleic acid, nonanoate, octadecadienoate, octadecanoate,2-oxobutyrate, pentadecanoate, 2-oxovaleric acid, penta-
decanoate, phytanate, tetracosanoate, tetradecandioate,and tricosanoate. Each fatty acid differed between varietiessignificantly except eicosanoate, heptadecanoic acid andoctadecadienoate. The rice grains WB and RB are rich infatty acids. Highest amount of amount of 2-butanoate,docosanoate, eicosanoate, linoleic acid, octadecadienoate,octadecanoate, 2-oxobutyrate, pentadecanoate, phytanate,tetradecanoate, tricosanoate were observed in WB. RB
Fig. 1. Heat map* for visualization of the variation pattern of the identified metabolites in different varieties of rice grains. *Each metabolite marked with
colour codes: green for minimum relative response ratio and yellow for maximum relative response ratio. For interpretation of references to colour, see the
online version of this article.

connoncos
varascratematartbetnathigestWBoxafoufumthrrec
in
glyThetheeacwain W
B. De, G. Nag / C. R. Biologies 337 (2014) 283–293 291
tained highest level of dodecanoate, hexadecanoate,anoate, 2-oxobutanoate, 2-oxovaleric acid and tetra-
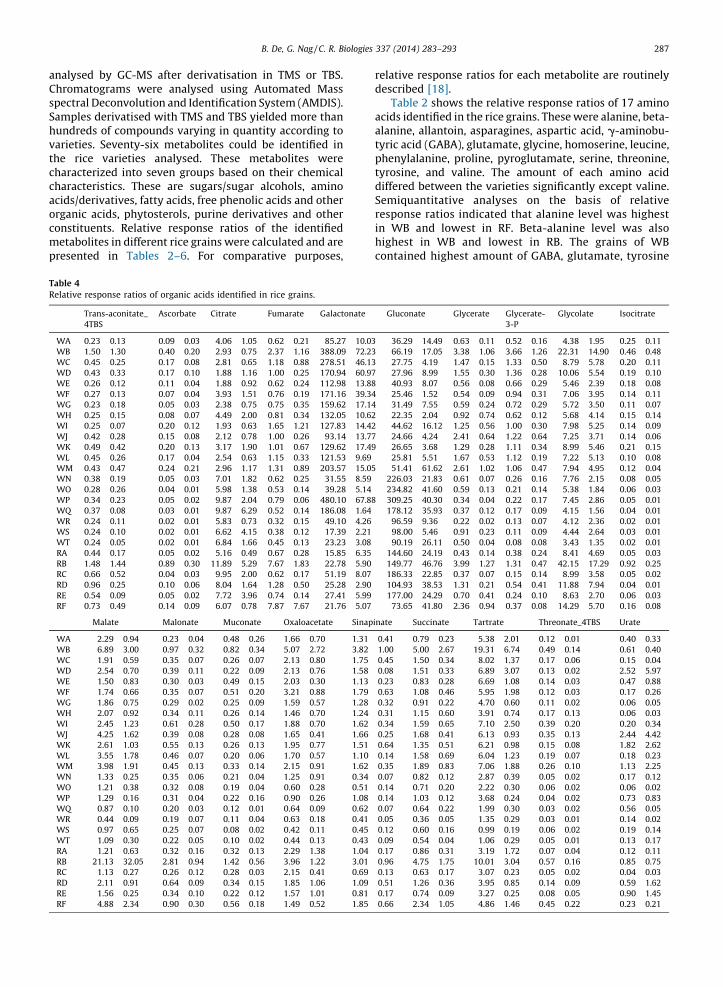
anoate.Nineteen organic acids could be detected in differentieties of rice grains (Table 4). These were trans-aconitate,orbate, citrate, fumarate, galactonate, gluconate, glyce-, glycerate-3-phosphate, glycolate, isocitrate, malate,
lonate, muconate, oxaloacetate, sinapinate, succinate,arate, threonate, urate. Each organic acid differedween varieties significantly except galactonate, gluco-e and urate. Extracts of both WB and RB containedhest amount of trans-aconitate and sinapinate asimated from the relative response ratios. Extracts of
grains contained highest level of glycerate-3-P,loacetate, succinate, tartarate. The grains of RB werend to contain highest level of ascorbate, citrate,arate, glycerate, glycolate, isocitrate, malate and
eonate. High fumarate and gluconate content wasorded in WP.Nine sugars and sugar alcohols (Table 5) were detectedrice grains. These were arabitol, fructose, glucose,cerol, glycerol-3-P, inositol, sorbitol, sucrose and xylitol.
relative response ratios indicated that the level ofse compounds were not significantly different fromh other except for glycerol and sucrose. Glycerol levels highest in RB. Sucrose was present in highest amount
F and in lowest amount in RB.
Five phenols detected (Table 6) were acetohydroxa-mate, 4-coumarate, ferulate, 4-hydroxybenzoate and4-hydroxycinnamate which differed significantly betweenvarieties. Of the sterols (campesterol, fucosterol, b-sitos-terol) identified in rice grains (Table 6), none differedsignificantly between varieties.
4. Discussion
Comparison of the metabolites identified in thegrains of 26 varieties of rice unveiled diversity inmetabolite profile. All data from the different varietiesare also summarized in the form of heat map (Fig. 1) forvisualization of how the identified metabolite levelsdiffered in varieties. This global perspective of metabolitediversity in rice grains was based on the semi-quantitativeinformation obtained from the relative response ratios. Aclear difference in metabolite levels in WB and RB can beobserved with most of the metabolites. A clear differencein the levels of many of the amino acids, organic acids, fattyacids, phenols and sterols is also visible for WN, WO, WP,WQ, WR, WS, WT.
Hierarchical clustering was constructed on the basisof the metabolites to extract relevant information forsimilarity and differences in metabolites in the grains.Cluster analysis unveiled diversity in metabolite profile.Two hierarchical clusters were generated based on the
Fig. 2. Cluster membership of different varieties of rice grains.
B. De, G. Nag / C. R. Biologies 337 (2014) 283–293292
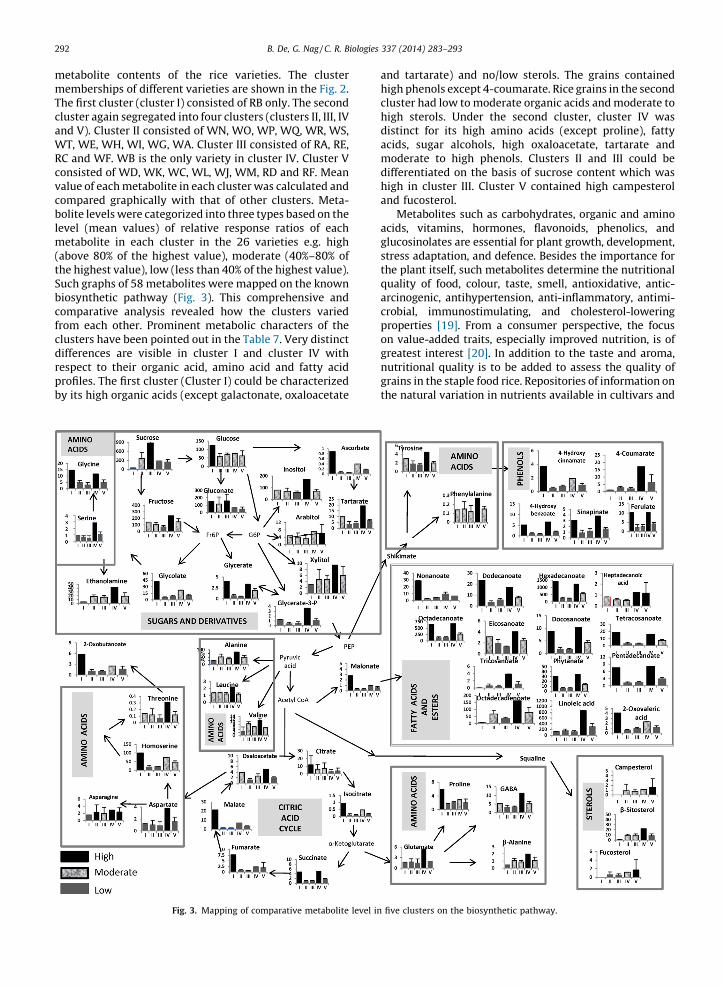
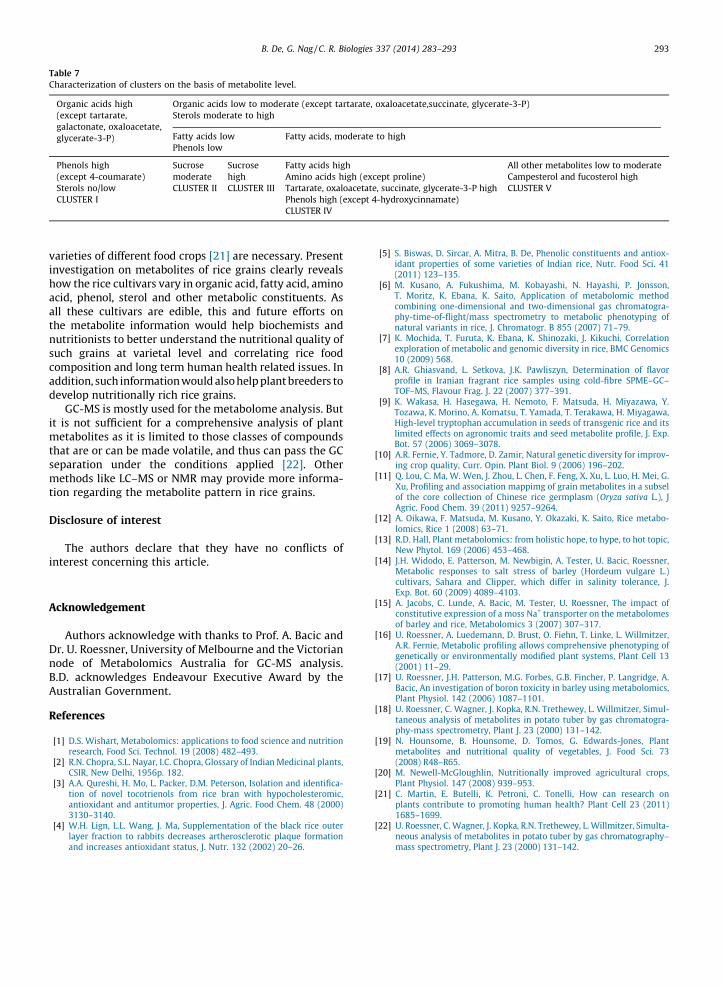
metabolite contents of the rice varieties. The clustermemberships of different varieties are shown in the Fig. 2.The first cluster (cluster I) consisted of RB only. The secondcluster again segregated into four clusters (clusters II, III, IVand V). Cluster II consisted of WN, WO, WP, WQ, WR, WS,WT, WE, WH, WI, WG, WA. Cluster III consisted of RA, RE,RC and WF. WB is the only variety in cluster IV. Cluster Vconsisted of WD, WK, WC, WL, WJ, WM, RD and RF. Meanvalue of each metabolite in each cluster was calculated andcompared graphically with that of other clusters. Meta-bolite levels were categorized into three types based on thelevel (mean values) of relative response ratios of eachmetabolite in each cluster in the 26 varieties e.g. high(above 80% of the highest value), moderate (40%–80% ofthe highest value), low (less than 40% of the highest value).Such graphs of 58 metabolites were mapped on the knownbiosynthetic pathway (Fig. 3). This comprehensive andcomparative analysis revealed how the clusters variedfrom each other. Prominent metabolic characters of theclusters have been pointed out in the Table 7. Very distinctdifferences are visible in cluster I and cluster IV withrespect to their organic acid, amino acid and fatty acidprofiles. The first cluster (Cluster I) could be characterizedby its high organic acids (except galactonate, oxaloacetate
and tartarate) and no/low sterols. The grains containedhigh phenols except 4-coumarate. Rice grains in the secondcluster had low to moderate organic acids and moderate tohigh sterols. Under the second cluster, cluster IV wasdistinct for its high amino acids (except proline), fattyacids, sugar alcohols, high oxaloacetate, tartarate andmoderate to high phenols. Clusters II and III could bedifferentiated on the basis of sucrose content which washigh in cluster III. Cluster V contained high campesteroland fucosterol.
Metabolites such as carbohydrates, organic and aminoacids, vitamins, hormones, flavonoids, phenolics, andglucosinolates are essential for plant growth, development,stress adaptation, and defence. Besides the importance forthe plant itself, such metabolites determine the nutritionalquality of food, colour, taste, smell, antioxidative, antic-arcinogenic, antihypertension, anti-inflammatory, antimi-crobial, immunostimulating, and cholesterol-loweringproperties [19]. From a consumer perspective, the focuson value-added traits, especially improved nutrition, is ofgreatest interest [20]. In addition to the taste and aroma,nutritional quality is to be added to assess the quality ofgrains in the staple food rice. Repositories of information onthe natural variation in nutrients available in cultivars and
Fig. 3. Mapping of comparative metabolite level in five clusters on the biosynthetic pathway.
varinvhowacidall
thenutsuccomadddev
it imethasepmetion
Dis
inte
Ack
Dr.nodB.DAus
Ref
[1]
[2]
[3]
[4]
Tab
Cha
Or
(e
ga
gl
Ph
(e
St
CL
B. De, G. Nag / C. R. Biologies 337 (2014) 283–293 293
ieties of different food crops [21] are necessary. Presentestigation on metabolites of rice grains clearly reveals
the rice cultivars vary in organic acid, fatty acid, amino, phenol, sterol and other metabolic constituents. As
these cultivars are edible, this and future efforts on metabolite information would help biochemists andritionists to better understand the nutritional quality ofh grains at varietal level and correlating rice foodposition and long term human health related issues. In
ition, such information would also help plant breeders toelop nutritionally rich rice grains.GC-MS is mostly used for the metabolome analysis. Buts not sufficient for a comprehensive analysis of planttabolites as it is limited to those classes of compoundst are or can be made volatile, and thus can pass the GCaration under the conditions applied [22]. Otherthods like LC–MS or NMR may provide more informa-
regarding the metabolite pattern in rice grains.
closure of interest
The authors declare that they have no conflicts ofrest concerning this article.
nowledgement
Authors acknowledge with thanks to Prof. A. Bacic and U. Roessner, University of Melbourne and the Victoriane of Metabolomics Australia for GC-MS analysis.. acknowledges Endeavour Executive Award by thetralian Government.
erences
D.S. Wishart, Metabolomics: applications to food science and nutritionresearch, Food Sci. Technol. 19 (2008) 482–493.
R.N. Chopra, S.L. Nayar, I.C. Chopra, Glossary of Indian Medicinal plants,CSIR, New Delhi, 1956p. 182.
A.A. Qureshi, H. Mo, L. Packer, D.M. Peterson, Isolation and identifica-tion of novel tocotrienols from rice bran with hypocholesteromic,antioxidant and antitumor properties, J. Agric. Food Chem. 48 (2000)3130–3140.
W.H. Lign, L.L. Wang, J. Ma, Supplementation of the black rice outerlayer fraction to rabbits decreases artherosclerotic plaque formationand increases antioxidant status, J. Nutr. 132 (2002) 20–26.
[5] S. Biswas, D. Sircar, A. Mitra, B. De, Phenolic constituents and antiox-idant properties of some varieties of Indian rice, Nutr. Food Sci. 41(2011) 123–135.
[6] M. Kusano, A. Fukushima, M. Kobayashi, N. Hayashi, P. Jonsson,T. Moritz, K. Ebana, K. Saito, Application of metabolomic methodcombining one-dimensional and two-dimensional gas chromatogra-phy-time-of-flight/mass spectrometry to metabolic phenotyping ofnatural variants in rice, J. Chromatogr. B 855 (2007) 71–79.
[7] K. Mochida, T. Furuta, K. Ebana, K. Shinozaki, J. Kikuchi, Correlationexploration of metabolic and genomic diversity in rice, BMC Genomics10 (2009) 568.
[8] A.R. Ghiasvand, L. Setkova, J.K. Pawliszyn, Determination of flavorprofile in Iranian fragrant rice samples using cold-fibre SPME–GC–TOF–MS, Flavour Frag. J. 22 (2007) 377–391.
[9] K. Wakasa, H. Hasegawa, H. Nemoto, F. Matsuda, H. Miyazawa, Y.Tozawa, K. Morino, A. Komatsu, T. Yamada, T. Terakawa, H. Miyagawa,High-level tryptophan accumulation in seeds of transgenic rice and itslimited effects on agronomic traits and seed metabolite profile, J. Exp.Bot. 57 (2006) 3069–3078.
[10] A.R. Fernie, Y. Tadmore, D. Zamir, Natural genetic diversity for improv-ing crop quality, Curr. Opin. Plant Biol. 9 (2006) 196–202.
[11] Q. Lou, C. Ma, W. Wen, J. Zhou, L. Chen, F. Feng, X. Xu, L. Luo, H. Mei, G.Xu, Profiling and association mappimg of grain metabolites in a subselof the core collection of Chinese rice germplasm (Oryza sativa L.), JAgric. Food Chem. 39 (2011) 9257–9264.
[12] A. Oikawa, F. Matsuda, M. Kusano, Y. Okazaki, K. Saito, Rice metabo-lomics, Rice 1 (2008) 63–71.
[13] R.D. Hall, Plant metabolomics: from holistic hope, to hype, to hot topic,New Phytol. 169 (2006) 453–468.
[14] J.H. Widodo, E. Patterson, M. Newbigin, A. Tester, U. Bacic, Roessner,Metabolic responses to salt stress of barley (Hordeum vulgare L.)cultivars, Sahara and Clipper, which differ in salinity tolerance, J.Exp. Bot. 60 (2009) 4089–4103.
[15] A. Jacobs, C. Lunde, A. Bacic, M. Tester, U. Roessner, The impact ofconstitutive expression of a moss Na+ transporter on the metabolomesof barley and rice, Metabolomics 3 (2007) 307–317.
[16] U. Roessner, A. Luedemann, D. Brust, O. Fiehn, T. Linke, L. Willmitzer,A.R. Fernie, Metabolic profiling allows comprehensive phenotyping ofgenetically or environmentally modified plant systems, Plant Cell 13(2001) 11–29.
[17] U. Roessner, J.H. Patterson, M.G. Forbes, G.B. Fincher, P. Langridge, A.Bacic, An investigation of boron toxicity in barley using metabolomics,Plant Physiol. 142 (2006) 1087–1101.
[18] U. Roessner, C. Wagner, J. Kopka, R.N. Trethewey, L. Willmitzer, Simul-taneous analysis of metabolites in potato tuber by gas chromatogra-phy-mass spectrometry, Plant J. 23 (2000) 131–142.
[19] N. Hounsome, B. Hounsome, D. Tomos, G. Edwards-Jones, Plantmetabolites and nutritional quality of vegetables, J. Food Sci. 73(2008) R48–R65.
[20] M. Newell-McGloughlin, Nutritionally improved agricultural crops,Plant Physiol. 147 (2008) 939–953.
[21] C. Martin, E. Butelli, K. Petroni, C. Tonelli, How can research onplants contribute to promoting human health? Plant Cell 23 (2011)1685–1699.
[22] U. Roessner, C. Wagner, J. Kopka, R.N. Trethewey, L. Willmitzer, Simulta-neous analysis of metabolites in potato tuber by gas chromatography–mass spectrometry, Plant J. 23 (2000) 131–142.
le 7
racterization of clusters on the basis of metabolite level.
ganic acids high
xcept tartarate,
lactonate, oxaloacetate,
ycerate-3-P)
Organic acids low to moderate (except tartarate, oxaloacetate,succinate, glycerate-3-P)
Sterols moderate to high
Fatty acids low
Phenols low
Fatty acids, moderate to high
enols high
xcept 4-coumarate)
erols no/low
USTER I
Sucrose
moderate
CLUSTER II
Sucrose
high
CLUSTER III
Fatty acids high
Amino acids high (except proline)
Tartarate, oxaloacetate, succinate, glycerate-3-P high
Phenols high (except 4-hydroxycinnamate)
CLUSTER IV
All other metabolites low to moderate
Campesterol and fucosterol high
CLUSTER V