metabonomic-transcriptome integration analysis...
TRANSCRIPT

Research ArticleMetabonomic-Transcriptome Integration Analysis onOsteoarthritis and Rheumatoid Arthritis
Ningyang Gao ,1 Li Ding,2 Jian Pang,2 Yuxin Zheng,1 Yuelong Cao ,2 Hongsheng Zhan,1
and Yinyu Shi1
1Shi’s Center of Orthopedics and Traumatology, Shuguang Hospital Affiliated to Shanghai University of TCM, No. 528Zhangheng Road, Shanghai 201203, China2Institute of Traumatology & Orthopedics, Shanghai Academy of TCM, No. 528 Zhangheng Road, Shanghai 201203, China
Correspondence should be addressed to Ningyang Gao; [email protected]
Received 26 May 2019; Accepted 20 November 2019; Published 2 January 2020
Academic Editor: Monika Dmitrzak-Weglarz
Copyright © 2020 Ningyang Gao et al. This is an open access article distributed under the Creative Commons Attribution License,which permits unrestricted use, distribution, and reproduction in any medium, provided the original work is properly cited.
Purpose. This study is aimed at exploring the potential metabolite/gene biomarkers, as well as the differences between the molecularmechanisms, of osteoarthritis (OA) and rheumatoid arthritis (RA). Methods. Transcriptome dataset GSE100786 was downloadedto explore the differentially expressed genes (DEGs) between OA samples and RA samples. Meanwhile, metabolomic datasetMTBLS564 was downloaded and preprocessed to obtain metabolites. Then, the principal component analysis (PCA) and linearmodels were used to reveal DEG-metabolite relations. Finally, metabolic pathway enrichment analysis was performed toinvestigate the differences between the molecular mechanisms of OA and RA. Results. A total of 976 DEGs and 171 metaboliteswere explored between OA samples and RA samples. The PCA and linear module analysis investigated 186 DEG-metaboliteinteractions including Glycogenin 1- (GYG1-) asparagine_54, hedgehog acyltransferase- (HHAT-) glucose_70, and TNFreceptor-associated factor 3- (TRAF3-) acetoacetate_35. Finally, the KEGG pathway analysis showed that these metabolites weremainly enriched in pathways like gap junction, phagosome, NF-kappa B, and IL-17 pathway. Conclusions. Genes such asHHAT, GYG1, and TRAF3, as well as metabolites including glucose, asparagine, and acetoacetate, might be implicated in thepathogenesis of OA and RA. Metabolites like ethanol and tyrosine might participate differentially in OA and RA progression viathe gap junction pathway and phagosome pathway, respectively. TRAF3-acetoacetate interaction may be involved in regulatinginflammation in OA and RA by the NF-kappa B and IL-17 pathway.
1. Introduction
Osteoarthritis (OA) and rheumatoid arthritis (RA) are allinflammatory joint diseases [1]. Globally, approximately250 million people (3.6% of the population) have OA [2].Meanwhile, RA will affect about 24.5 million people by theyear 2015 [3, 4]. Although some factors including cytokinesand chemokines help distinguish OA from RA [5], theunclear differences in the molecular mechanisms underlyingthese two diseases impede the choice of the optimal clinicaltreatment strategy.
Metabolites have various functions including signaling,defense, and interactions with other organisms [6]. Numer-ous studies have shown that metabolites are associated withthe pathological process of OA and RA [7–9]. A previous
study shows that the expression levels of reactive oxygenmetabolites are upregulated in patients with knee OA [10].Zhang et al. indicated that a total of 14 metabolites extractedcould be potentially used as biomarkers for OA [11]. More-over, as a biomarker of in vivo mast cell activation, theactivity of prostaglandin D2 metabolites is closely associatedwith the progression of RA [12]. In an animal model, Jahreiset al. showed that mold metabolites drive RA in mice via thepromotion of T cells [13]. However, the interpretation ofmetabonomic data is difficult due to the obstacle in dataextraction and disease correlation analysis [14]. A previousstudy indicates that the expression of interleukin 1 canregulate the progression of both OA and RA through directstimulation of synoviocytes and augmentation of matrix deg-radation [15]. Actually, the detection and interpretation of
HindawiInternational Journal of GenomicsVolume 2020, Article ID 5925126, 9 pageshttps://doi.org/10.1155/2020/5925126

metabolite-transcript coresponses using combined profilingcan yield important information on the complex biologicalregulation mechanism of the disease [16]. Thus, integrativeanalysis of transcriptome and metabonomic data maycontribute to a further understanding of OA and RAprogression.
In the present study, a metabonomic-transcriptome inte-gration analysis was performed. To investigate the genes andmetabolites that differentially expressed between OA and RA,the differentially expressed genes (DEGs) and metaboliteswere revealed from microarray data and metabolite expres-sion profile data, respectively. Then, principal componentanalysis (PCA) and the linear model were used to explorethe DEG-metabolite interactions. Finally, based on theseinteractions, pathway analysis was performed on DEG-associated metabolites to reveal the pathways that participatein the process of OA and RA. This study was expected toinvestigate the role of key metabolites and genes as well astheir interactions in the pathogenesis of OA and RA, andfurther understand the complex biological regulatory mecha-nisms of metabolites in these two diseases.
2. Materials and Methods
2.1. Data Resource. The transcriptome dataset GSE100786was downloaded from the Gene Expression Omnibus(GEO) database. The platform was the GPL570 AffymetrixHuman Genome U133 Plus 2.0 Array. A total of 8 OA bonemarrow (BM) monocyte samples and 8 RA BM monocytesamples were included in GSE100786.
The metabolite profiling MTBLS564 was downloadedfrom the Ensembl-European Bioinformatics Institute(EMBL-EBI) MetaboLights database (https://www.ebi.ac.uk/metabolights/index). The platform was Bruker (using
NMR spectroscopy technology). A total of 10 OA synovialfluid (SF) samples and 14 RA SF samples were included inMTBLS564.
2.2. Data Preprocessing. The normalization for transcriptomedata was performed using the Robust Multichip Average(RMA) [17] method in the Affy package (version: 1.56.0)[18] of R (version: 3.4.3) software. The normalization processin this study included background adjustment, quantilenormalization, and finally summarization and log base 2scale. If different probes mapped to the same miRNA(miRNA symbol), the mean value of different probes wasconsidered as the final expression value of this miRNA.Meanwhile, the metabolomic data could be directly readfrom the processed metabolite data file using R software.
2.3. The Investigation for DEGs. The P value between OAsamples and RA samples in transcriptome data was calcu-lated by the Linear Models for Microarray Data (version:3.34.9, limma) package [19] in R software. Then, P < 0:05was selected as the threshold for the identification of DEGs.Then, based on Euclidean distance, the bidirectional hierar-chical clustering for DEMs was performed by pheatmapsoftware (version: 1.0.8) [20]. The results were visualizedusing a heat map.
2.4. Principal Component Analysis. In the current study, theaverage value of each gene in the transcriptome data was cal-culated and ranked from high to low (deleting the last 10% ofthe genes). Meanwhile, the proportion of the deletion valuein the expression value of each metabolite was counted, andthe metabolites with more than 80% deletion value weredeleted. Then, the principal component analysis (PCA) wasperformed on the data in two groups.
OA
OA
_5O
A_6
OA
_4O
A_2
OA
_8O
A_3
OA
_7O
A_1
RA_2
RA_4
RA_6
RA_8
RA_5
RA_7
RA_3
RA_1
RA
−3
−2
−1
0
1
2
3
Row
Z−s
core
Figure 1: The heat map for differentially expressed genes between osteoarthritis samples and rheumatoid arthritis samples. The blue and redbars at the top represent the samples in osteoarthritis samples and rheumatoid arthritis samples, respectively. The red color represents lowexpression, while the red color represents high expression.
2 International Journal of Genomics
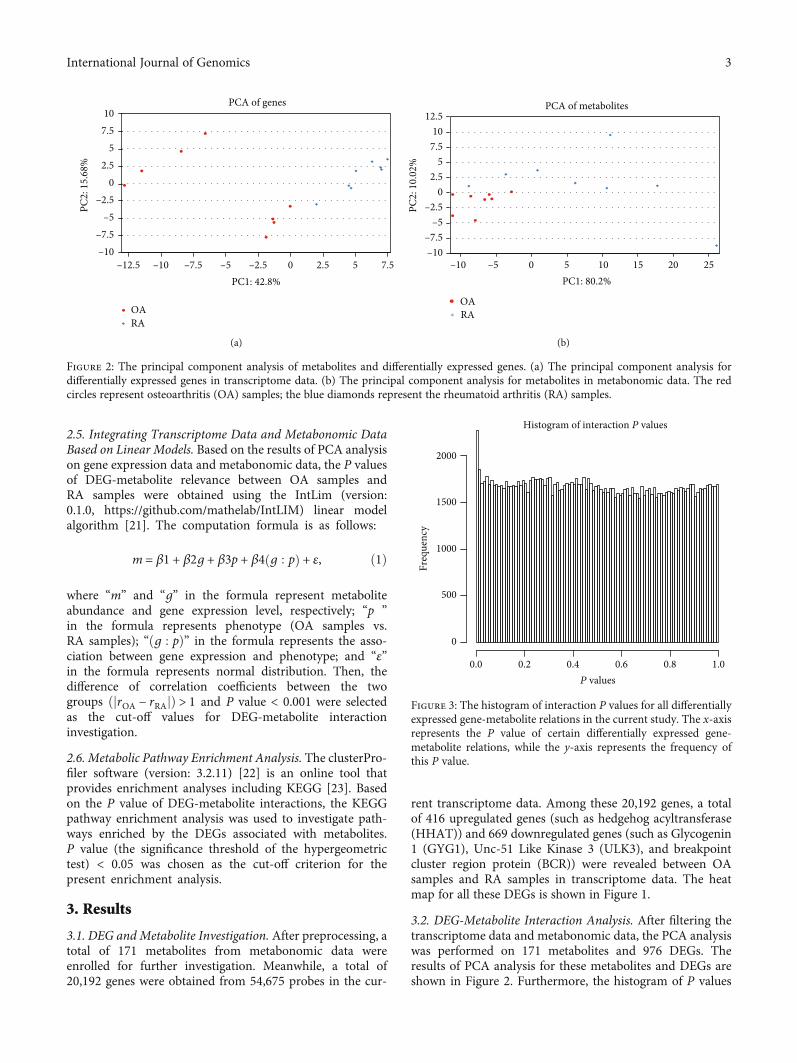
2.5. Integrating Transcriptome Data and Metabonomic DataBased on Linear Models. Based on the results of PCA analysison gene expression data and metabonomic data, the P valuesof DEG-metabolite relevance between OA samples andRA samples were obtained using the IntLim (version:0.1.0, https://github.com/mathelab/IntLIM) linear modelalgorithm [21]. The computation formula is as follows:
m = β1 + β2g + β3p + β4 g : pð Þ + ε, ð1Þ
where “m” and “g” in the formula represent metaboliteabundance and gene expression level, respectively; “p ”in the formula represents phenotype (OA samples vs.RA samples); “ðg : pÞ” in the formula represents the asso-ciation between gene expression and phenotype; and “ε”in the formula represents normal distribution. Then, thedifference of correlation coefficients between the twogroups ðjrOA − rRAjÞ > 1 and P value < 0.001 were selectedas the cut-off values for DEG-metabolite interactioninvestigation.
2.6. Metabolic Pathway Enrichment Analysis. The clusterPro-filer software (version: 3.2.11) [22] is an online tool thatprovides enrichment analyses including KEGG [23]. Basedon the P value of DEG-metabolite interactions, the KEGGpathway enrichment analysis was used to investigate path-ways enriched by the DEGs associated with metabolites.P value (the significance threshold of the hypergeometrictest) < 0.05 was chosen as the cut-off criterion for thepresent enrichment analysis.
3. Results
3.1. DEG and Metabolite Investigation. After preprocessing, atotal of 171 metabolites from metabonomic data wereenrolled for further investigation. Meanwhile, a total of20,192 genes were obtained from 54,675 probes in the cur-
rent transcriptome data. Among these 20,192 genes, a totalof 416 upregulated genes (such as hedgehog acyltransferase(HHAT)) and 669 downregulated genes (such as Glycogenin1 (GYG1), Unc-51 Like Kinase 3 (ULK3), and breakpointcluster region protein (BCR)) were revealed between OAsamples and RA samples in transcriptome data. The heatmap for all these DEGs is shown in Figure 1.
3.2. DEG-Metabolite Interaction Analysis. After filtering thetranscriptome data and metabonomic data, the PCA analysiswas performed on 171 metabolites and 976 DEGs. Theresults of PCA analysis for these metabolites and DEGs areshown in Figure 2. Furthermore, the histogram of P values
PC1: 42.8%
PC2:
15.
68%
PCA of genes
–12.5 –10 –7.5 –5 –2.5 0
OARA
2.5 5 7.5–10–7.5–5
–2.50
2.55
7.510
(a)
PC1: 80.2%
PC2:
10.
02%
PCA of metabolites
OARA
–10 –5 0 5 10 15 20 25–10–7.5–5
–2.50
2.55
7.510
12.5
(b)
Figure 2: The principal component analysis of metabolites and differentially expressed genes. (a) The principal component analysis fordifferentially expressed genes in transcriptome data. (b) The principal component analysis for metabolites in metabonomic data. The redcircles represent osteoarthritis (OA) samples; the blue diamonds represent the rheumatoid arthritis (RA) samples.
Histogram of interaction P values
P values
Freq
uenc
y
0.0 0.2 0.4 0.6 0.8 1.0
0
500
1000
1500
2000
Figure 3: The histogram of interaction P values for all differentiallyexpressed gene-metabolite relations in the current study. The x-axisrepresents the P value of certain differentially expressed gene-metabolite relations, while the y-axis represents the frequency ofthis P value.
3International Journal of Genomics
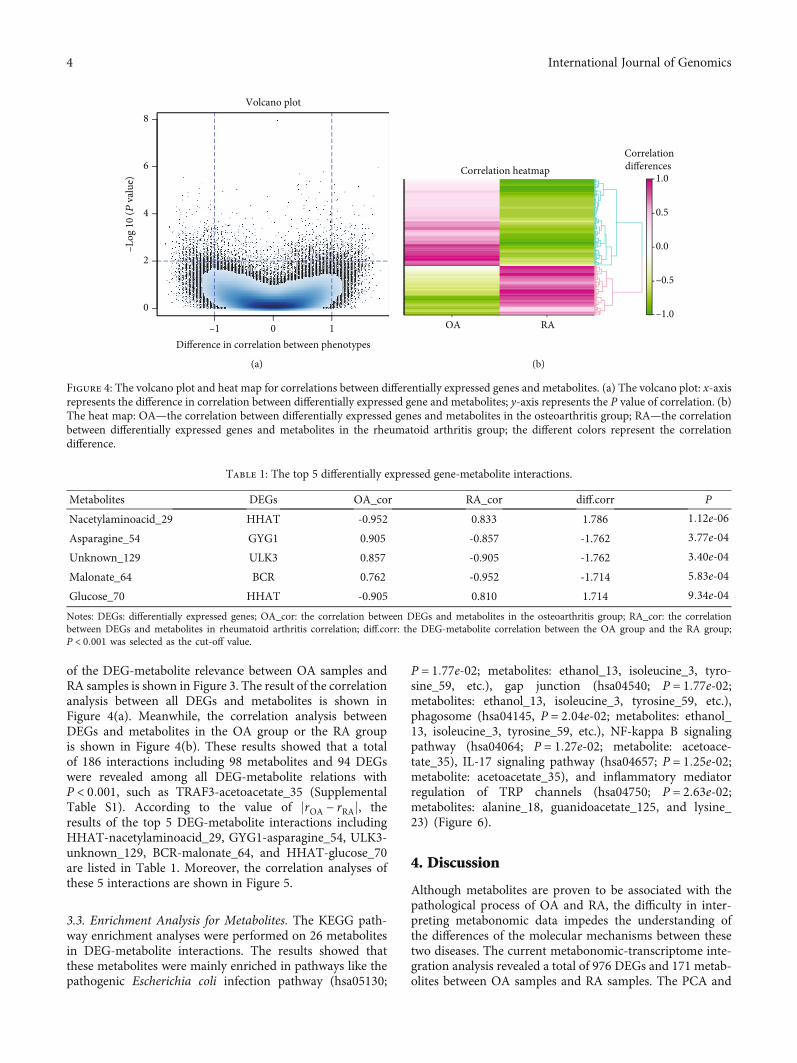
of the DEG-metabolite relevance between OA samples andRA samples is shown in Figure 3. The result of the correlationanalysis between all DEGs and metabolites is shown inFigure 4(a). Meanwhile, the correlation analysis betweenDEGs and metabolites in the OA group or the RA groupis shown in Figure 4(b). These results showed that a totalof 186 interactions including 98 metabolites and 94 DEGswere revealed among all DEG-metabolite relations withP < 0:001, such as TRAF3-acetoacetate_35 (SupplementalTable S1). According to the value of jrOA − rRAj, theresults of the top 5 DEG-metabolite interactions includingHHAT-nacetylaminoacid_29, GYG1-asparagine_54, ULK3-unknown_129, BCR-malonate_64, and HHAT-glucose_70are listed in Table 1. Moreover, the correlation analyses ofthese 5 interactions are shown in Figure 5.
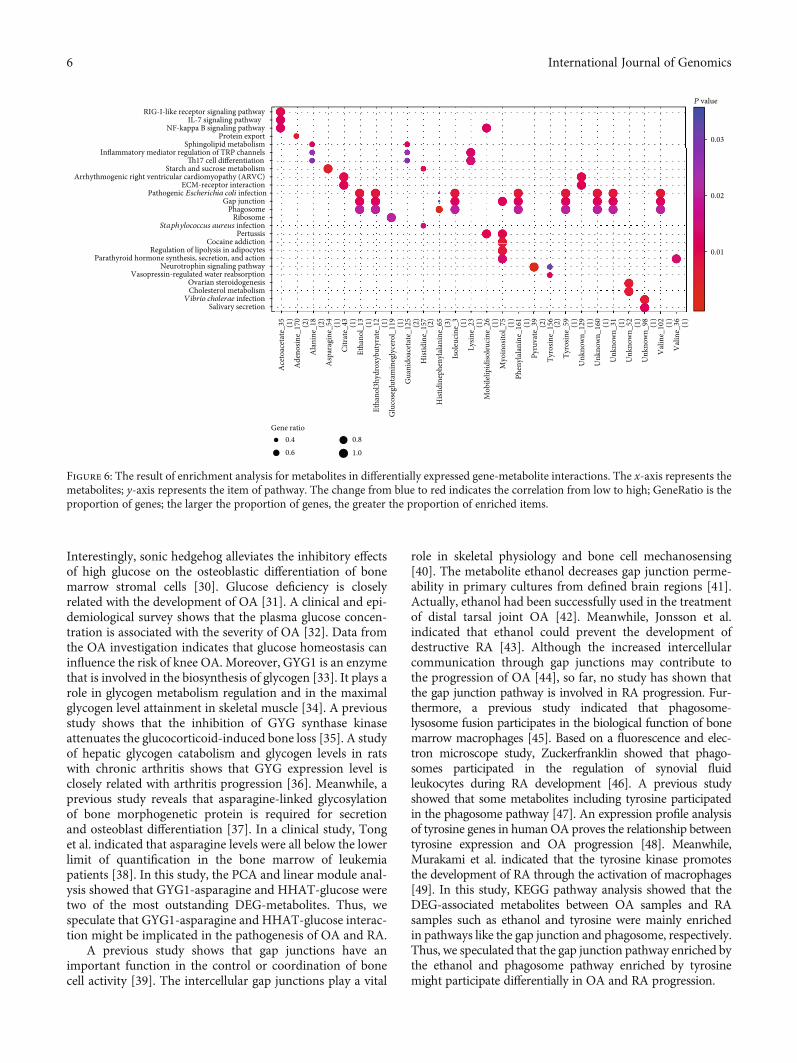
3.3. Enrichment Analysis for Metabolites. The KEGG path-way enrichment analyses were performed on 26 metabolitesin DEG-metabolite interactions. The results showed thatthese metabolites were mainly enriched in pathways like thepathogenic Escherichia coli infection pathway (hsa05130;
P = 1:77e‐02; metabolites: ethanol_13, isoleucine_3, tyro-sine_59, etc.), gap junction (hsa04540; P = 1:77e‐02;metabolites: ethanol_13, isoleucine_3, tyrosine_59, etc.),phagosome (hsa04145, P = 2:04e‐02; metabolites: ethanol_13, isoleucine_3, tyrosine_59, etc.), NF-kappa B signalingpathway (hsa04064; P = 1:27e‐02; metabolite: acetoace-tate_35), IL-17 signaling pathway (hsa04657; P = 1:25e‐02;metabolite: acetoacetate_35), and inflammatory mediatorregulation of TRP channels (hsa04750; P = 2:63e‐02;metabolites: alanine_18, guanidoacetate_125, and lysine_23) (Figure 6).
4. Discussion
Although metabolites are proven to be associated with thepathological process of OA and RA, the difficulty in inter-preting metabonomic data impedes the understanding ofthe differences of the molecular mechanisms between thesetwo diseases. The current metabonomic-transcriptome inte-gration analysis revealed a total of 976 DEGs and 171 metab-olites between OA samples and RA samples. The PCA and
–1 0 1
0
2
4
6
8Volcano plot
Difference in correlation between phenotypes
–Lo
g 10
(P v
alue
)
(a)
Correlation heatmap
–1.0
–0.5
0.0
0.5
1.0
Correlationdifferences
RAOA
(b)
Figure 4: The volcano plot and heat map for correlations between differentially expressed genes and metabolites. (a) The volcano plot: x-axisrepresents the difference in correlation between differentially expressed gene and metabolites; y-axis represents the P value of correlation. (b)The heat map: OA—the correlation between differentially expressed genes and metabolites in the osteoarthritis group; RA—the correlationbetween differentially expressed genes and metabolites in the rheumatoid arthritis group; the different colors represent the correlationdifference.
Table 1: The top 5 differentially expressed gene-metabolite interactions.
Metabolites DEGs OA_cor RA_cor diff.corr P
Nacetylaminoacid_29 HHAT -0.952 0.833 1.786 1:12e‐06Asparagine_54 GYG1 0.905 -0.857 -1.762 3:77e‐04Unknown_129 ULK3 0.857 -0.905 -1.762 3:40e‐04Malonate_64 BCR 0.762 -0.952 -1.714 5:83e‐04Glucose_70 HHAT -0.905 0.810 1.714 9:34e‐04Notes: DEGs: differentially expressed genes; OA_cor: the correlation between DEGs and metabolites in the osteoarthritis group; RA_cor: the correlationbetween DEGs and metabolites in rheumatoid arthritis correlation; diff.corr: the DEG-metabolite correlation between the OA group and the RA group;P < 0:001 was selected as the cut-off value.
4 International Journal of Genomics

linear module analysis explored 186 DEG-metabolite inter-actions including GYG1-asparagine_54, HHAT-glucose_70,and TRAF3-acetoacetate_35. Finally, the KEGG pathwayanalysis showed that these metabolites were mainly enrichedin pathways like pathogenic Escherichia coli infection, gapjunction, phagosome, NF-kappa B signaling pathway, andIL-17 signaling pathway.
HHAT is an enzyme in the endoplasmic reticulum thatpalmitoylates hedgehog proteins [24]. HHATs participate
in the expression of the sonic hedgehog signaling pathway[25]. The sonic hedgehog signaling pathway can regulatethe neuronal-like differentiation of bone mesenchymal stemcells [26]. It also promotes carcinoma cells associated withbone destruction [27]. A previous study shows that sonichedgehog signaling pathway-associated factors are upregu-lated in synovial tissues of RA [28]. Wang et al. indicated thatgenes such as HHAT in the sonic hedgehog signalingpathway are novel therapeutic targets for RA [29].
HHAT
Nac
etyl
amin
oacid
_29
HHAT vs. nacetylaminoacid_29
4.25 4.5
1.5
2
2.5
1
GYG1
Asp
arag
ine_
54
GYG1 vs. asparagine_54
10.25 10.5 10.750.3
0.35
0.4
0.45
0.5
0.55
ULK3
Unk
now
n_12
9
ULK3 vs. unknown_129
6.5 6.75 70.5
0.75
1
1.25
1.5
1.75
BCR
Malo
nate
_64
BCR vs. malonate_64
6 6.25 6.50
0.25
0.5
0.75
1
1.25
HHAT
Glu
cose
_70
HHAT vs. glucose_70
OARA
4.2 4.4 4.60
2
4
6
Top 1 Top 2
Top 3 Top 4
Top 5
Figure 5: The correlation for the top 5 differentially expressed gene-metabolite relations. The x-axis represents the expression of differentiallyexpressed genes; the y-axis represents the expression of metabolites. OA: osteoarthritis; RA: rheumatoid arthritis.
5International Journal of Genomics
Interestingly, sonic hedgehog alleviates the inhibitory effectsof high glucose on the osteoblastic differentiation of bonemarrow stromal cells [30]. Glucose deficiency is closelyrelated with the development of OA [31]. A clinical and epi-demiological survey shows that the plasma glucose concen-tration is associated with the severity of OA [32]. Data fromthe OA investigation indicates that glucose homeostasis caninfluence the risk of knee OA. Moreover, GYG1 is an enzymethat is involved in the biosynthesis of glycogen [33]. It plays arole in glycogen metabolism regulation and in the maximalglycogen level attainment in skeletal muscle [34]. A previousstudy shows that the inhibition of GYG synthase kinaseattenuates the glucocorticoid-induced bone loss [35]. A studyof hepatic glycogen catabolism and glycogen levels in ratswith chronic arthritis shows that GYG expression level isclosely related with arthritis progression [36]. Meanwhile, aprevious study reveals that asparagine-linked glycosylationof bone morphogenetic protein is required for secretionand osteoblast differentiation [37]. In a clinical study, Tonget al. indicated that asparagine levels were all below the lowerlimit of quantification in the bone marrow of leukemiapatients [38]. In this study, the PCA and linear module anal-ysis showed that GYG1-asparagine and HHAT-glucose weretwo of the most outstanding DEG-metabolites. Thus, wespeculate that GYG1-asparagine and HHAT-glucose interac-tion might be implicated in the pathogenesis of OA and RA.
A previous study shows that gap junctions have animportant function in the control or coordination of bonecell activity [39]. The intercellular gap junctions play a vital
role in skeletal physiology and bone cell mechanosensing[40]. The metabolite ethanol decreases gap junction perme-ability in primary cultures from defined brain regions [41].Actually, ethanol had been successfully used in the treatmentof distal tarsal joint OA [42]. Meanwhile, Jonsson et al.indicated that ethanol could prevent the development ofdestructive RA [43]. Although the increased intercellularcommunication through gap junctions may contribute tothe progression of OA [44], so far, no study has shown thatthe gap junction pathway is involved in RA progression. Fur-thermore, a previous study indicated that phagosome-lysosome fusion participates in the biological function of bonemarrow macrophages [45]. Based on a fluorescence and elec-tron microscope study, Zuckerfranklin showed that phago-somes participated in the regulation of synovial fluidleukocytes during RA development [46]. A previous studyshowed that some metabolites including tyrosine participatedin the phagosome pathway [47]. An expression profile analysisof tyrosine genes in humanOA proves the relationship betweentyrosine expression and OA progression [48]. Meanwhile,Murakami et al. indicated that the tyrosine kinase promotesthe development of RA through the activation of macrophages[49]. In this study, KEGG pathway analysis showed that theDEG-associated metabolites between OA samples and RAsamples such as ethanol and tyrosine were mainly enrichedin pathways like the gap junction and phagosome, respectively.Thus, we speculated that the gap junction pathway enriched bythe ethanol and phagosome pathway enriched by tyrosinemight participate differentially in OA and RA progression.
Salivary secretionVibrio cholerae infection
Cholesterol metabolismOvarian steroidogenesis
Vasopressin-regulated water reabsorptionNeurotrophin signaling pathway
Parathyroid hormone synthesis, secretion, and actionRegulation of lipolysis in adipocytes
Cocaine addictionPertussis
Staphylococcus aureus infectionRibosome
PhagosomeGap junction
Pathogenic Escherichia coli infectionECM-receptor interaction
Arrhythmogenic right ventricular cardiomyopathy (ARVC)Starch and sucrose metabolism
Th17 cell differentiationInflammatory mediator regulation of TRP channels
Sphingolipid metabolismProtein export
NF-kappa B signaling pathwayIL-7 signaling pathway
RIG-I-like receptor signaling pathway
Ace
toac
etat
e_35 (1
)A
deno
sine_
170
(2)
Ala
nine
_18
(2)
Asp
arag
ine_
54 (1)
Citr
ate_
43 (1)
Etha
nol_
13 (1)
Etha
nol3
hydr
oxyb
utyr
ate_
12 (1)
Glu
cose
glut
amin
egly
cero
l_11
9(1
)G
uani
doac
etat
e_12
5(2
)H
istid
ine_
157
(2)
Hist
idin
ephe
nyla
lani
ne_6
5(3
)Is
oleu
cine
_3 (1)
Lysin
e_23 (1
)M
obile
lipid
isole
ucin
e_26 (1
)M
yoin
osito
l_75 (1
)Ph
enyl
alan
ine_
161
(1)
Pyru
vate
_39
(2)
Tyro
sine_
156
(2)
Tyro
sine_
59 (1)
Unk
now
n_12
9(1
)U
nkno
wn_
160
(1)
Unk
now
n_31 (1
)U
nkno
wn_
52 (1)
Unk
now
n_98 (1
)V
alin
e_10
2(1
)V
alin
e_36 (1
)
0.01
0.02
0.03
P value
Gene ratio0.40.6
0.81.0
Figure 6: The result of enrichment analysis for metabolites in differentially expressed gene-metabolite interactions. The x-axis represents themetabolites; y-axis represents the item of pathway. The change from blue to red indicates the correlation from low to high; GeneRatio is theproportion of genes; the larger the proportion of genes, the greater the proportion of enriched items.
6 International Journal of Genomics

Studies had reported the roles of NF-kappa B and IL-17on regulating inflammation in RA [50–52]. Shui et al. sug-gested that inflammation could be alleviated by blockingIL-17 in RA rats [53]. Zhang et al. indicated that overexpres-sion of microRNA-125b could facilitate inflammation in RAby activating the NF-κB signaling pathway [54]. In this study,metabolite acetoacetate was significantly enriched in theNF-kappa B and IL-17 signaling pathway, and TRAF3-acetoacetate_35 interaction was identified. TRAF3 is anintracellular protein that belongs to the TNF receptor-associated factor protein family which is implicated inNF-kappa B activation [55, 56]. Reportedly, the TengmeiDecoction could improve inflammatory injury of synoviumin collagen-induced arthritis rats probably by regulating theTRAF3/NF-κB signaling pathway [57]. Liu et al. showed thatmiR-671-3p played a crucial role in the pathogenesis of OAby targeting TRAF3 and regulating chondrocyte apoptosisand inflammation [58]. Thereby, we speculated that theNF-kappa B and IL-17 pathway enriched by acetoacetatewas implicated in regulating inflammation in OA and RAprobably by targeting TRAF3. However, there were somelimitations in the current study including small sample sizeand lack of verification analysis. Thus, a further verificationstudy based on a large sample size is needed to confirm allspeculations in this study.
5. Conclusions
In conclusion, genes such as HHAT, GYG1, and TRAF3, aswell as metabolites including glucose, asparagine, and acetoa-cetate might be implicated in the pathogenesis of OA and RA.Metabolites like ethanol and tyrosine may participatedifferentially in OA and RA progression via the gap junctionpathway and the phagosome pathway, respectively. TRAF3-acetoacetate interaction may be involved in regulatinginflammation in OA and RA by the NF-kappa B and IL-17pathway.
Data Availability
The datasets generated and/or analyzed during the currentstudy are available from the corresponding author on reason-able request.
Conflicts of Interest
The authors declare that there is no conflict of interest.
Authors’ Contributions
Ningyang Gao and Li Ding contributed equally to this work.
Acknowledgments
This work was supported by the Youth Fund of the NationalNatural Science Foundation of China (grant number81302988).
Supplementary Materials
The obtained DEG-metabolite interactions with P < 0:001.(Supplementary Materials)
References
[1] H. Brouwers, J. von Hegedus, R. Toes, M. Kloppenburg, andA. Ioan-Facsinay, “Lipid mediators of inflammation in rheu-matoid arthritis and osteoarthritis,” Best Practice & ResearchClinical Rheumatology, vol. 29, no. 6, pp. 741–755, 2015.
[2] T. Vos, A. D. Flaxman, M. Naghavi et al., “Years lived withdisability (YLDs) for 1160 sequelae of 289 diseases and injuries1990-2010: a systematic analysis for the Global Burden ofDisease Study 2010,” The Lancet, vol. 380, no. 9859,pp. 2163–2196, 2012.
[3] M. Lorenzo, “Rheumatoid arthritis,” Foot and Ankle Clinics,vol. 12, no. 3, pp. 525–537, 2007.
[4] GBD 2016 Disease and Injury Incidence and PrevalenceCollaborators, “Global, regional, and national incidence, prev-alence, and years lived with disability for 328 diseases and inju-ries for 195 countries, 1990-2016: a systematic analysis for theGlobal Burden of Disease Study 2016,” The Lancet, vol. 390,no. 10100, pp. 1211–1259, 2017.
[5] J. F. Schlaak, I. Pfers, K. Z. Meyer, and E. Märker-Hermann,“Different cytokine profiles in the synovial fluid of patientswith osteoarthritis, rheumatoid arthritis and seronegativespondylarthropathies,” Clinical and Experimental Rheumatol-ogy, vol. 14, no. 2, pp. 155–162, 1996.
[6] T. J. Wang, M. G. Larson, R. S. Vasan et al., “Metabolite pro-files and the risk of developing diabetes,” Nature Medicine,vol. 17, no. 4, pp. 448–453, 2011.
[7] M. R. Sowers, D. Mcconnell, M. Jannausch, A. G. Buyuktur,M. Hochberg, and D. A. Jamadar, “Estradiol and its metabo-lites and their association with knee osteoarthritis,” Arthritis& Rheumatology, vol. 54, no. 8, pp. 2481–2487, 2014.
[8] R. J. A. N. Lamers, J. H. J. van Nesselrooij, V. B. Kraus et al.,“Identification of an urinary metabolite profile associated withosteoarthritis,” Osteoarthritis and Cartilage, vol. 13, no. 9,pp. 762–768, 2005.
[9] I. J. Russell, H. Vaeroy, M. Javors, and F. Nyberg, “Cerebrospi-nal fluid biogenic amine metabolites in fibromyalgia/fibrositissyndrome and rheumatoid arthritis,” Arthritis & Rheumatism,vol. 35, no. 5, pp. 550–556, 2010.
[10] K. Kotani, N. Sakane, M. Kamimoto, and N. Taniguchi,“Levels of reactive oxygen metabolites in patients with kneeosteoarthritis,” Australasian Journal on Ageing, vol. 30, no. 4,pp. 231–233, 2011.
[11] Q. Zhang, H. Li, Z. Zhang, F. Yang, and J. Chen, “Serummetabolites as potential biomarkers for diagnosis of kneeosteoarthritis,” Disease Markers, vol. 2015, Article ID684794, 7 pages, 2015.
[12] C. Cho, A. Nguyen, K. J. Bryant, S. G. O'Neill, and H. P.Mcneil, “Prostaglandin D2 metabolites as a biomarker ofin vivo mast cell activation in systemic mastocytosis and rheu-matoid arthritis,” Immunity, Inflammation and Disease, vol. 4,no. 1, pp. 64–69, 2016.
[13] S. Jahreis, S. Kuhn, A. M.Madaj, M. Bauer, and T. Polte, “Moldmetabolites drive rheumatoid arthritis in mice via promotionof IFN- gamma- and IL-17-producing T cells,” Food andChemical Toxicology, vol. 109, pp. 405–413, 2017.
7International Journal of Genomics

[14] Q. Zhang, L. A. Ford, A. M. Evans, and D. R. Toal, “Identifica-tion of an endogenous organosulfur metabolite by interpreta-tion of mass spectrometric data,” Organic Letters, vol. 20,no. 7, pp. 2100–2103, 2018.
[15] G. S. Firestein, A. E. Berger, D. E. Tracey et al., “IL-1 receptorantagonist protein production and gene expression in rheuma-toid arthritis and osteoarthritis synovium,” The Journal ofImmunology, vol. 149, no. 3, pp. 1054–1062, 1992.
[16] H. Redestig and I. G. Costa, “Detection and interpretationof metabolite-transcript coresponses using combined profil-ing data,” Bioinformatics, vol. 27, no. 13, pp. i357–i365,2011.
[17] R. Irizarry, B. Hobbs, F. Collin et al., “Exploration, normal-ization, and summaries of high density oligonucleotide arrayprobe level data,” Biostatistics, vol. 4, no. 2, pp. 249–264,2003.
[18] L. Gautier, L. Cope, B. M. Bolstad, and R. A. Irizarry, “Affy—a-nalysis of Affymetrix GeneChip data at the probe level,” Bioin-formatics, vol. 20, no. 3, pp. 307–315, 2004.
[19] M. E. Ritchie, B. Phipson, D. Wu et al., “limma powers differen-tial expression analyses for RNA-sequencing and microarraystudies,” Nucleic Acids Research, vol. 43, no. 7, article e47, 2015.
[20] R. Kolde and M. R. Kolde, “Package ‘pheatmap’,” R Package,vol. 1, no. 7, 2015.
[21] J. K. Siddiqui, E. Baskin, M. Liu et al., “IntLIM: integrationusing linear models of metabolomics and gene expressiondata,” BMC Bioinformatics, vol. 19, no. 1, p. 81, 2018.
[22] G. Yu, L. G. Wang, Y. Han, and Q. Y. He, “clusterProfiler: an Rpackage for comparing biological themes among gene clus-ters,” OMICS, vol. 16, no. 5, pp. 284–287, 2012.
[23] H. Ogata, S. Goto, K. Sato, W. Fujibuchi, H. Bono, andM. Kanehisa, “KEGG: Kyoto Encyclopedia of Genes andGenomes,” Nucleic Acids Research, vol. 27, no. 1, pp. 29–34,2000.
[24] A. D. Konitsiotis, B. Jovanović, P. Ciepla et al., “Topologicalanalysis of hedgehog acyltransferase, a multipalmitoylatedtransmembrane protein,” Journal of Biological Chemistry,vol. 290, no. 6, pp. 3293–3307, 2015.
[25] J. A. Buglino and M. D. Resh, “Hhat is a palmitoylacyltransfer-ase with specificity for N-palmitoylation of sonic hedgehog,”Journal of Biological Chemistry, vol. 283, no. 32, pp. 22076–22088, 2008.
[26] J.-G. Huang, C. B. Shen, W. B. Wu et al., “Primary cilia medi-ate sonic hedgehog signaling to regulate neuronal-like differ-entiation of bone mesenchymal stem cells for resveratrolinduction in vitro,” Journal of Neuroscience Research, vol. 92,no. 5, pp. 587–596, 2014.
[27] T. Honami, T. Shimo, T. Okui et al., “Sonic hedgehog signalingpromotes growth of oral squamous cell carcinoma cells associ-ated with bone destruction,” Oral Oncology, vol. 48, no. 1,pp. 49–55, 2012.
[28] W. Ming-Xia, H. Jian-Lin, Z. Shang-Ling et al., “Preliminarystudy of sonic hedgehog signaling pathway in rheumatoidarthritis,” Chinese Journal of Pathophysiology, vol. 28, no. 3,pp. 483–487, 2012.
[29] M. Wang, S. Zhu, W. Peng et al., “Sonic hedgehog signalingdrives proliferation of synoviocytes in rheumatoid arthritis: apossible novel therapeutic target,” Journal of ImmunologyResearch, vol. 2014, Article ID 401903, 10 pages, 2014.
[30] C. C. Guan, M. Yan, X. Q. Jiang et al., “Sonic hedgehog allevi-ates the inhibitory effects of high glucose on the osteoblastic
differentiation of bone marrow stromal cells,” Bone, vol. 45,no. 6, pp. 1146–1152, 2009.
[31] A. Fioravanti, R. Marcolongo, and A. Carcassi, “Glucose-6-phosphate dehydrogenase deficiency and osteoarthritis inmen of northern Sardinia,” Journal of Rheumatology, vol. 26,no. 6, p. 1425, 1999.
[32] M. A. Cimmino and M. Cutolo, “Plasma glucose concentra-tion in symptomatic osteoarthritis: a clinical and epidemiolog-ical survey,” Clinical and Experimental Rheumatology, vol. 8,no. 3, pp. 251–257, 1990.
[33] A. R. Moslemi, C. Lindberg, J. Nilsson, H. Tajsharghi,B. Andersson, and A. Oldfors, “Glycogenin-1 deficiency andinactivated priming of glycogen synthesis,” The New EnglandJournal of Medicine, vol. 362, no. 13, pp. 1203–1210, 2010.
[34] J. M. Ren, B. A. Marshall, E. A. Gulve et al., “Evidence fromtransgenic mice that glucose transport is rate-limiting forglycogen deposition and glycolysis in skeletal muscle,” Journalof Biological Chemistry, vol. 268, no. 22, pp. 16113–16115,1993.
[35] F. S. Wang, J. Y. Ko, L. H. Weng, D. W. Yeh, H. J. Ke, and S. L.Wu, “Inhibition of glycogen synthase kinase-3β attenuatesglucocorticoid-induced bone loss,” Life Sciences, vol. 85,no. 19-20, pp. 685–692, 2009.
[36] Z. Fedatto-Júnior, E. L. Ishii-Iwamoto, S. M. Caparroz-Assef,G. E. Vicentini, A. Bracht, and A. M. Kelmer-Bracht, “Glyco-gen levels and glycogen catabolism in livers from arthriticrats,” Molecular and Cellular Biochemistry, vol. 229, no. 1/2,pp. 1–7, 2002.
[37] Q. Hang, Y. Zhou, S. Hou et al., “Asparagine-linked glycosyla-tion of bone morphogenetic protein-2 is required for secretionand osteoblast differentiation,” Glycobiology, vol. 24, no. 3,pp. 292–304, 2014.
[38] W. H. Tong, R. Pieters, W. C. J. Hop, C. Lanvers-Kaminsky,J. Boos, and I. M. van der Sluis, “No evidence of increasedasparagine levels in the bone marrow of patients with acutelymphoblastic leukemia during asparaginase therapy,” Pediat-ric Blood & Cancer, vol. 60, no. 2, pp. 258–261, 2013.
[39] S. B. Doty, “Morphological evidence of gap junctions betweenbone cells,” Calcified Tissue International, vol. 33, no. 1,pp. 509–512, 1981.
[40] H. J. Donahue, “Gap junctions and biophysical regulation ofbone cell differentiation,” Bone, vol. 26, no. 5, pp. 417–422,2000.
[41] L. Adermark, T. Olsson, and E. Hansson, “Ethanol acutelydecreases astroglial gap junction permeability in primary cul-tures from defined brain regions,” Neurochemistry Interna-tional, vol. 45, no. 7, pp. 971–978, 2004.
[42] L. P. Lamas, J. Edmonds, W. Hodge et al., “Use of ethanol inthe treatment of distal tarsal joint osteoarthritis: 24 cases,”Equine Veterinary Journal, vol. 44, no. 4, pp. 399–403, 2012.
[43] I. M. Jonsson, M. Verdrengh, M. Brisslert et al., “Ethanol pre-vents development of destructive arthritis,” Proceedings of theNational Academy of Sciences of the United States of America,vol. 104, no. 1, pp. 258–263, 2007.
[44] A. A. Marino, D. D. Waddell, O. V. Kolomytkin et al.,“Increased intercellular communication through gap junctionsmay contribute to progression of osteoarthritis,” ClinicalOrthopaedics and Related Research, vol. 422, no. 422,pp. 224–232, 2004.
[45] C. de Chastellier, C. Fréhel, C. Offredo, and E. Skamene,“Implication of phagosome-lysosome fusion in restriction of
8 International Journal of Genomics

Mycobacterium avium growth in bone marrow macrophagesfrom genetically resistant mice,” Infection and Immunity,vol. 61, no. 9, pp. 3775–3784, 1993.
[46] D. Zucker-Franklin, “The phagosomes in rheumatoid synovialfluid leukocytes: a light, a light, fluorescence, and electronmicroscope study,” Arthritis & Rheumatism, vol. 9, no. 1,pp. 24–36, 2010.
[47] J. Fang, J. A. Brzostowski, S. Ou, N. Isik, V. Nair, and T. Jin, “Avesicle surface tyrosine kinase regulates phagosome matura-tion,” Journal of Cell Biology, vol. 178, no. 3, pp. 411–423, 2007.
[48] S. Islam, T. Kermode, D. Sultana et al., “Expression profile ofprotein tyrosine kinase genes in human osteoarthritis chon-drocytes,” Osteoarthritis and Cartilage, vol. 9, no. 8, pp. 684–693, 2001.
[49] M.Murakami, S. Iwai, S. Hiratsuka et al., “Signaling of vascularendothelial growth factor receptor-1 tyrosine kinase promotesrheumatoid arthritis through activation of monocytes/macro-phages,” Blood, vol. 108, no. 6, pp. 1849–1856, 2006.
[50] P. Miossec, “IL-17 as a contributor to inflammation anddestruction in rheumatoid arthritis: Birkhäuser Basel,” inCytokines and Joint Injury, Progress in InflammationResearch, W. B. Berg and P. Miossec, Eds., Birkhäuser, Basel,2011.
[51] S. Sarkar, S. Justa, M. Brucks et al., “Interleukin (IL)-17A, Fand AF in inflammation: a study in collagen-induced arthritisand rheumatoid arthritis,” Clinical & Experimental Immunol-ogy, vol. 177, no. 3, pp. 652–661, 2014.
[52] L. Cai-li andW. Ying-ying, “Effects of TNF-alpha/NF-kappa Bsignaling pathway on etanercept alleviating rheumatoid arthri-tis,” Chinese Journal of Applied Physiology, vol. 33, no. 4,pp. 373–376, 2017.
[53] X. L. Shui, W. Lin, C. W. Mao, Y. Z. Feng, J. Z. Kong, and S. M.Chen, “Blockade of IL-17 alleviated inflammation in rat arthri-tis and MMP-13 expression,” European Review for Medicaland Pharmacological Sciences, vol. 21, no. 10, pp. 2329–2337,2017.
[54] B. Zhang, L. S. Wang, and Y. H. Zhou, “Elevated microRNA-125b promotes inflammation in rheumatoid arthritis by acti-vation of NF-κB pathway,” Biomedicine & Pharmacotherapy,vol. 93, pp. 1151–1157, 2017.
[55] C. H. Yang, A. Murti, S. R. Pfeffer, M. Fan, Z. du, and L. M.Pfeffer, “The role of TRAF2 binding to the type I interferonreceptor in alternative NFκB activation and antiviralresponse,” Journal of Biological Chemistry, vol. 283, no. 21,pp. 14309–14316, 2013.
[56] M. Michel, I. Wilhelmi, A. S. Schultz, M. Preussner, andF. Heyd, “Activation-induced tumor necrosis factor receptor-associated factor 3 (Traf3) alternative splicing controls thenoncanonical nuclear factor κB pathway and chemokineexpression in human T cells,” Journal of Biological Chemistry,vol. 289, no. 19, pp. 13651–13660, 2014.
[57] B. Xiang-Wei, Z. Hong-Hong, Z. Jian-Ping et al., “Effects ofTengmei decoction on TRAF3/NF-κB signaling pathway insynovial membrane of collagen-induced arthritis rats,” Chi-nese Journal of Integrated Traditional and Western Medicine,vol. 38, no. 12, pp. 60–66, 2018.
[58] Z. Liu, S. Chen, Y. Yang et al., “MicroRNA-671-3p regulatesthe development of knee osteoarthritis by targeting TRAF3in chondrocytes,” Molecular Medicine Reports, vol. 20, no. 3,pp. 2843–2850, 2019.
9International Journal of Genomics

Hindawiwww.hindawi.com
International Journal of
Volume 2018
Zoology
Hindawiwww.hindawi.com Volume 2018
Anatomy Research International
PeptidesInternational Journal of
Hindawiwww.hindawi.com Volume 2018
Hindawiwww.hindawi.com Volume 2018
Journal of Parasitology Research
GenomicsInternational Journal of
Hindawiwww.hindawi.com Volume 2018
Hindawi Publishing Corporation http://www.hindawi.com Volume 2013Hindawiwww.hindawi.com
The Scientific World Journal
Volume 2018
Hindawiwww.hindawi.com Volume 2018
BioinformaticsAdvances in
Marine BiologyJournal of
Hindawiwww.hindawi.com Volume 2018
Hindawiwww.hindawi.com Volume 2018
Neuroscience Journal
Hindawiwww.hindawi.com Volume 2018
BioMed Research International
Cell BiologyInternational Journal of
Hindawiwww.hindawi.com Volume 2018
Hindawiwww.hindawi.com Volume 2018
Biochemistry Research International
ArchaeaHindawiwww.hindawi.com Volume 2018
Hindawiwww.hindawi.com Volume 2018
Genetics Research International
Hindawiwww.hindawi.com Volume 2018
Advances in
Virolog y Stem Cells International
Hindawiwww.hindawi.com Volume 2018
Hindawiwww.hindawi.com Volume 2018
Enzyme Research
Hindawiwww.hindawi.com Volume 2018
International Journal of
MicrobiologyHindawiwww.hindawi.com
Nucleic AcidsJournal of
Volume 2018
Submit your manuscripts atwww.hindawi.com