metal megatrends where will we be in 2035?
TRANSCRIPT

White Paper
Metal megatrends Where will we be in 2035?
London | Melbourne | Santiago | Shanghai | Toronto | Lima
SWANNGLOBAL.COM

White Paper
Introduction The world of commodities has been transformed in the past 20 years by the rise of megacities in Asia. China has been a crucial part of this and now dominates the consumption of metals, including steel, copper and aluminium.
In this white paper we look at the prospects for further expansions in Asian megacities. We explain how this impacts metals demand in key countries and who leads the way between now and 2035. We discuss the impact of megatrends such as globalisation and the energy transition and we seek to anticipate where the greatest growth will come from in terms of cities, countries and commodities.
The continued expansion of megacities in China and India will bring extra wealth and buying power for commodities. By 2035 we will see a significant shift in power from East to West, as Asian cities as a group will be richer than Europe and North American cities combined. This will be driven by steady growth in large cities in China, combined with more rapid growth in medium-sized cities in India.
In terms of the major industrial metal markets, there is plenty of scope for optimism about the demand outlook given the current low level of development that currently exists in Asia. Nickel will see the most significant growth, with demand for aluminium and steel also growing by more than fifty per cent.
In summary, the next 15 years will be a period of unprecedented geopolitical change. For governments, mining companies and investors alike there will be threats, but also immense opportunities.
Fasten your seatbelts. It’s going to be a bumpy ride.
Dan Smith

White Paper
Urbanisation has further to go and will drive increased demand for commodities Urbanisation and city development lie at the heart of global economic progress and, as countries expand and people get richer, they consume more commodities. Cars get larger and more numerous, electricity and public transport networks expand, and consumers buy more electronic products, such as televisions, mobile phones and computers. All this means more steel, more copper, more aluminium. But patterns of consumption also alter as incomes grow.
Looking ahead over the next 15 years, where will the winners and losers be for commodities, companies and employees who work in these industries?
In our previous white paper – Macroeconomic drivers of mining employment (Copper) - we discussed the importance of Asian megacities in driving economic progress, commodity prices and demand as part of a super-cycle which started around 2001, when China joined the World Trade Organisation. The expansion of megacities such as Beijing, Chongqing, Delhi, Guangzhou, Mumbai, Shenzhen, Shanghai and Tianjin resulted in a massive boom in construction activity and infrastructure spending, as urban populations ballooned. In total these eight cities alone now have a population of close to 150 million people, comfortably more than twice the size of the UK.
In particular, large cities in China have expanded at an unprecedent pace and there are high hopes that India or other parts of the developing world will drive the next wave of expansion, particularly given low starting bases in some parts of Asia and Africa. By 2035 four of these megacities are likely to feature in the top ten richest cities in the world, highlighting a significant shift of economic power between East and West.
Rising incomes in China and India mean that all the major metal markets look set to increase in size by 2035, with aluminium and nickel leading the way higher, based on recent trends in intensity of use. Copper, on the other hand, has been lagging behind, but offers the greatest scope for an upside surprise.
The continued expansion of megacities in China looks set to continue
There are two key domestic drivers of city wealth: income levels and working population. Also, globalisation is important as increased trade helps to drive productivity and growth in manufacturing, helped by access to a larger international market.
According to forecasts from Oxford Economics, by 2035 Asian cities as a group will be richer than Europe and North American cities combined. This comes from two main forces: steady growth in large cities in China, combined with fast growth in medium-sized cities in India. Significant development is also expected in some cities in Myanmar and Thailand. Africa remains a small part of the story, despite rapid population growth in places like Nigeria.
Chinese cities have expanded very quickly in the past 20 years, but growth is now naturally slowing due to their size and reduced potential for catching up with the developed world. The country has already gone through its fastest phase of development, but nevertheless it has six cities that will be in the list of the top 10 richest cities in the world by 2035. These are Beijing, Chongqing, Guangzhou, Shanghai, Shenzhen and Tianjin. Growth in these large cities was consistently above 10% in the first decade of this century. In terms of total GDP these six cities were 2.5 times the size of New York by 2019, helping to create a strong starting base. While China is facing strong headwinds from an aging population, productivity gains should result in city growth of 4% per year from 2020 to 2035, twice the growth rate expected for New York.
By 2035 these six cities will double their wealth.

White Paper
Indian cities are smaller, but rapid growth is likely, helped by Big Tech trends
India is a subtly different story. Its cities will boom over the next 15 years and GDP growth will outpace that of China. A key dynamic is that India’s population will grow far more rapidly than its Asian neighbour (more than eight times as fast according to forecasts from the World Bank). Indeed, 80% of the fastest growing cities in the world are expected to be in India, including Surat, Bangalore, Hyderabad, Nagpur and Yangon. Indian cities are typically much smaller than those in China, so there is far more potential for catch-up growth from a low base. India is expected to show strong productivity gains to 2035, combined with large increases in young and middle-aged employment. India’s cities are predicted to see GDP growth of 7% per year, according to Oxford Economics. The number of households with incomes greater than USD30,000 will double over the next decade.
A distinctive part of the Indian growth story is the rapid expansion of Big Tech (the finance and business services sector) - including software development and IT service provision. This helps to explain the rapid expansion that is likely to take place in Bangalore and Hyderabad. These two cities are expected to grow by more than 8% a year from 2020 to 2035, as they try to catch up with giant Tech cities, such as Silicon Valley and Shenzhen.
Finally, African cities will get much larger in terms of population, with huge numbers of young adult workers entering the workforce for the first time. However, modest productivity growth means that income per head will surprisingly fall further behind the advanced economies. Africa’s cities are expected to see GDP growth of 4% per year, even though the starting base is low.
China should grow well, but Indian incomes are likely to double by 2035
At a country level a similar trend can be seen. China grows well from a high base, while India grows more quickly from a low base. Oxford Economics predicts that US GDP will grow by 1% from 2020 to 2035, while China should grow at 4% and India at 5%. However, both Asian countries remain relatively poor compared to the industrialised world. In terms of GDP per capita, China should rise from 35% of the US level to 50% by 2035, whereas India is predicted to jump from 12% to 23% over the same period.
-
500
1,000
1,500
2,000
2,500
New York Tokyo Shanghai Beijing Shenzhen Guangzhou LosAngeles
Chongqing Tianjin
Four Chinese megacities are expected to enter the top 10 rich list by 2035 (Real GDP, Billion USD)
2001 2009 2019 2035
Source: Oxford Economics
White Paper
Demand for aluminium and nickel booms, as they play catch-up with copper We now examine how industrial metals demand has evolved over the past five years and then we look ahead to how things are likely to progress in the next 15 years, given the outlook for China and India discussed above. We have done this for five key metals: aluminium, copper, nickel, zinc and steel.
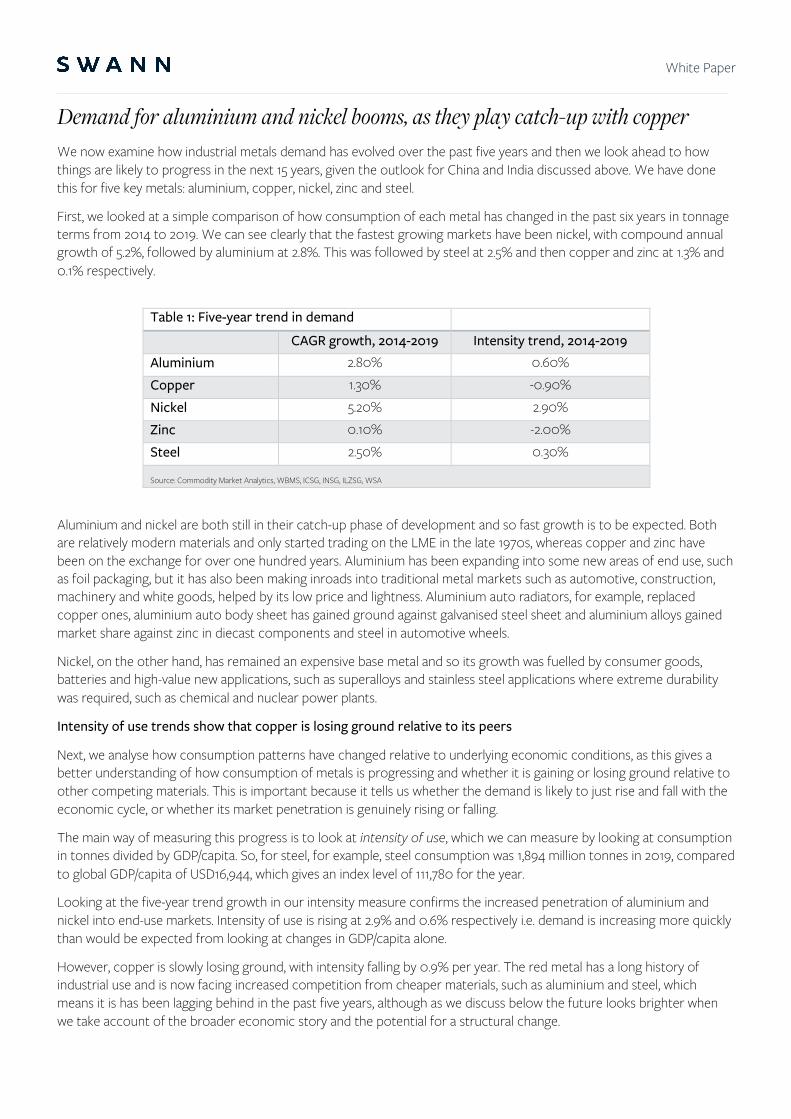
First, we looked at a simple comparison of how consumption of each metal has changed in the past six years in tonnage terms from 2014 to 2019. We can see clearly that the fastest growing markets have been nickel, with compound annual growth of 5.2%, followed by aluminium at 2.8%. This was followed by steel at 2.5% and then copper and zinc at 1.3% and 0.1% respectively.
Table 1: Five-year trend in demand
CAGR growth, 2014-2019 Intensity trend, 2014-2019
Aluminium 2.80% 0.60% Copper 1.30% -0.90% Nickel 5.20% 2.90% Zinc 0.10% -2.00% Steel 2.50% 0.30% Source: Commodity Market Analytics, WBMS, ICSG, INSG, ILZSG, WSA
Aluminium and nickel are both still in their catch-up phase of development and so fast growth is to be expected. Both are relatively modern materials and only started trading on the LME in the late 1970s, whereas copper and zinc have been on the exchange for over one hundred years. Aluminium has been expanding into some new areas of end use, such as foil packaging, but it has also been making inroads into traditional metal markets such as automotive, construction, machinery and white goods, helped by its low price and lightness. Aluminium auto radiators, for example, replaced copper ones, aluminium auto body sheet has gained ground against galvanised steel sheet and aluminium alloys gained market share against zinc in diecast components and steel in automotive wheels.
Nickel, on the other hand, has remained an expensive base metal and so its growth was fuelled by consumer goods, batteries and high-value new applications, such as superalloys and stainless steel applications where extreme durability was required, such as chemical and nuclear power plants.
Intensity of use trends show that copper is losing ground relative to its peers
Next, we analyse how consumption patterns have changed relative to underlying economic conditions, as this gives a better understanding of how consumption of metals is progressing and whether it is gaining or losing ground relative to other competing materials. This is important because it tells us whether the demand is likely to just rise and fall with the economic cycle, or whether its market penetration is genuinely rising or falling.
The main way of measuring this progress is to look at intensity of use, which we can measure by looking at consumption in tonnes divided by GDP/capita. So, for steel, for example, steel consumption was 1,894 million tonnes in 2019, compared to global GDP/capita of USD16,944, which gives an index level of 111,780 for the year.
Looking at the five-year trend growth in our intensity measure confirms the increased penetration of aluminium and nickel into end-use markets. Intensity of use is rising at 2.9% and 0.6% respectively i.e. demand is increasing more quickly than would be expected from looking at changes in GDP/capita alone.
However, copper is slowly losing ground, with intensity falling by 0.9% per year. The red metal has a long history of industrial use and is now facing increased competition from cheaper materials, such as aluminium and steel, which means it is has been lagging behind in the past five years, although as we discuss below the future looks brighter when we take account of the broader economic story and the potential for a structural change.

White Paper
Finally, zinc is even further behind and its intensity of use is falling significantly at 2.0% per year. Overall zinc demand is likely to underperform other base metals during our forecast period and growth will struggle to keep up with economic activity. This reflects strong competition from aluminium in some end-use markets, such as diecast alloys. Furthermore, it does not help that zinc is a heavy metal and has been subjected to significant thrifting as manufacturing efficiencies evolve and improve and lighter materials often offer advantages.
Steel has been a particular surprise over the past decade in that it has continued to grow very well despite lots of talk about peak steel demand being imminent. Its intensity of use has been rising at a modest 0.3% per year, despite being a well-established material and facing numerous threats from other materials such as aluminium. One of its main strengths is its cheapness and versatility. US hot-rolled steel, for example, is approximately one-third of the price of aluminium and one-tenth the price of copper.
The recent trends in metals demand therefore reflect each markets ability to find new fast-growing markets, fight off the threat from similar competing materials, such as other metals and plastics, and combat the ongoing tendency for thrifting and downsizing.
Metals demand looks set to expand dramatically, with nickel leading the way higher
So, what will industrial metals demand look like in 2035, given the expansion of global cities and continued growth in the emerging world? There does not seem much doubt that the world will be richer in terms of GDP/capita. According to the World Bank there will be a 37% increase in average income per head during the period 2019 to 2035, with China and India helping to close some of the deficit with the world’s richest countries. World GDP/capita should grow by around 2%, compared to 2.4% over the past 10 years.
Following on from this, what will be the impact on steel and the base metals? We have made the simple assumption that the most recent five-year trend in intensity of use will continue unchanged over the period to 2035. It seems clear that urbanisation and rising incomes will help to boost metals demand during the forecast period, as we show in our chart over.
1.0
1.1
1.2
1.3
1.4
1.5
1.6
1995 1997 1999 2001 2003 2005 2007 2009 2011 2013 2015 2017 2019
The recent flat trend shows a peak in copper intensity, but not demand itself
Intensity index (Consumption/GDP per capita)Source: Commodity Market Analytics, World Bank

White Paper
Nickel sees the fastest growth of course and based on our assumptions, demand will increase in size from 2.4Mt in 2019 to 5.2Mt in 2035 i.e. it will grow by 123%. Aluminium and steel will also see significant growth of 57% and 50% respectively, with copper increasing by 26%. Zinc lags and the impact of falling intensity mostly offsets the positive impact of rising GDP/capita to give a 6% increase in market size by 2035.
There is significant scope for catch-up growth in China and India
The forecast that we have outlined above assumes a continuation of recent trends in intensity, but the great hope for copper is that structural factors are moving in the market’s favour. There is clear potential for a surge in demand as electric vehicles take off and the energy transition (from fossil fuels to renewables) encourages a more comprehensive and flexible power grid.
0
100
200
300
400
500
600
Aluminium Copper Nickel Zinc Steel
Forecast for metals demand
2000 2010 2020 2035
Source: Commodity Market Analytics, WBMS, ICSG, INSG, ILZSG, WSA (Index, 2000=100)
20
25
30
15,000 16,000 17,000 18,000 19,000 20,000 21,000 22,000 23,000 24,000
The world should get richer, helping to take copper consumption higher (2019 to 2035)
Consumption (Mt)
Real GDP per capita, PPP
Source: Commodity Market Analytics, World Bank

White Paper
Even ignoring the potential for a structural shift in copper consumption, India is set to close the gap with the developed world and China will make further gains, which will boost all metal markets. In the charts below we show how China and India stand relative to the major developed countries of Germany, Japan and the US, to highlight the potential for further catch-up growth.
In terms of GDP per capita, China and India are still relatively poor. China is currently 74% behind the US, while India is 88% behind.
In terms of urbanisation the gap is narrower but still significant. Looking at the number of urban residents as a percentage of the population shows that China is around one-third behind Japan and India is around 60% behind.
In terms of number of mobile phone subscriptions, the gap is narrower still. China is just 17% behind Japan on this measure and India is 39% behind. This reflects the relative ease with which telephone networks can be developed, compared to the more complicated and slow process of urbanisation.
Finally, we look at the number of vehicles on the road per 1000 people. Car sales represent an important part of the manufacturing sector - in the EU, for example, the automotive sector accounts for around 12% of manufacturing jobs. Also, since cars are an expensive item, sales closely reflect the ability of a domestic economy to generate significant
-
10,000
20,000
30,000
40,000
50,000
60,000
70,000
India China Japan Germany United States
GDP per capita (2019), US$
Source: Commodity Market Analytics, World Bank
0%
20%
40%
60%
80%
100%
India China Germany United States Japan
Urban residents - % of population
Source: Commodity Market Analytics, World Bank

White Paper
wealth and confidence and provide affordable finance terms. The environmental lobby will disagree, but in terms of pure economics, higher car sales flag up an underlying story of success.
Interestingly, China and the US are already on an equal footing when it comes to the number of passenger cars on the road at 221 million and 211 million respectively in 2019. However, the more important measure of potential is the number of cars per person. On this measure China is still a long way behind and is 75% behind the US level, while the potential for massive growth in India is clear as it is 95% behind.
Metal markets should be boosted by Asian giants, while copper has scope to offer an upside surprise
Overall, there is plenty of scope for optimism about the outlook for industrial metals demand given the current low level of development that currently exists in Asia. In terms of individual markets further significant growth over the next 15 years is likely in nickel, aluminium and steel. Copper has been lagging behind in recent years, but there seems to be scope for it to shift onto a faster growth path soon, given the likelihood of expanded and improved electricity grids in many parts of the world in response to shifts towards electric vehicles and renewable power.
The next 15 years and beyond will be a period of unprecedented geopolitical change. For governments, mining companies and investors alike there will be threats, but also immense opportunities.
And just as fortune favours the brave, opportunity favours the well prepared.
-
200
400
600
800
India China Japan Germany US
Vehicles on road per 1000 people
Source: Commodity Market Analytics, World Bank

White Paper
About Swann Swann specialises in senior executive search and human capital advisory services for the natural resources sector. This includes mining, oil and gas, and related services such as industrials, engineering, energy, renewables, infrastructure and technology.
Mining remains a core part of our business and we believe that our knowledge of this complex space, and the cyclical challenges it faces, is unparalleled in executive search and advisory services. We partner with mining companies around the world throughout the value chain, from exploration to production to trading.
Our clients operate across all geographies, geologies and mine development stages. Swann’s sector insights into global talent and talent trends give our clients a real competitive advantage when it comes to attracting and retaining exceptional leaders.
Board Practice
For boards to be effective and meet the needs of all stakeholders, their members need to work together effectively towards shared goals. Swann reviews, develops and advises the boards of natural resources clients worldwide. Our role is to improve the performance of your board. We help you establish the optimum composition of expertise, skills and diversity so your board works in unison to drive growth and benefit shareholders. Our Board Practice services include:
• Board-Level Search • Board Effectiveness Review • Board Advisory
Diversity and inclusion
Swann’s specialist diversity consultants advise clients on how to attract and retain a diverse team. We help you establish a culture, processes and support systems to ensure your diverse workforce flourishes and employees become advocates for your organisation.
Sustainability
Mining companies need to work closely with communities to establish the benefits of a project and create sustainable relationships. This requires a particular blend of leadership skills which are not always easy to find. The demand for executive and non-executive talent with the relevant experience has never been greater. Our team of experts can work with you to find experienced professionals to help meet your sustainability needs.

White Paper
Get in touch If you would like to discuss this white paper or talk about Swann’s executive search, board practice and coaching and advisory services please get in touch. You can email [email protected] or contact your local office
AUSTRALIA
T: +61 3 9621 3388 Level 5, 171 Collins Street Melbourne, VIC 3000
CHINA
T: +86 21 3120 3227 Level 29, Tower 1, Jing An Kerry Centre 1515 Nanjing West Rd, Jing An District, Shanghai 200000 PRC
UNITED KINGDOM
T: +44 20 7770 6799 Level 5, 2 More London Riverside London, SE1 2AP
CANADA
T:+1 647 260 0299 140 Yonge Street, Suite 200 Toronto, ON, M5C 1X6
CHILE
T: +56 9 2594 7475 Av. El Golf 40, 12th. floor, Las Condes, Santiago
PERU
T: +51 1 711 3152 Calle Las Begonias 415, Level 10 San Isidro, L27 Lima

PrPrivate& Confistional
[Type here]
London | Melbourne | Santiago | Shanghai | Toronto | Lima
SWANNGLOBAL.COM