metal segment analysis presentation (24 jul 2014)
TRANSCRIPT

METALS SEGMENT[24/7/2014]
© SKF Group 18 April 2023
Objectives of project
1) Provide a top-down macro-economic overview of the performance of the steel industry in each chosen focus market (Japan, India, South Korea, Taiwan, Vietnam)
2) Assess the potential of the industry by predicting future steel production output by
• Identifying significant predictor variables that quantitatively account for steel production output
• Performing multiple regressions with these variables to produce forecasts up to year 2019
Slide 2
© SKF Group 18 April 2023
Limitations of project scope
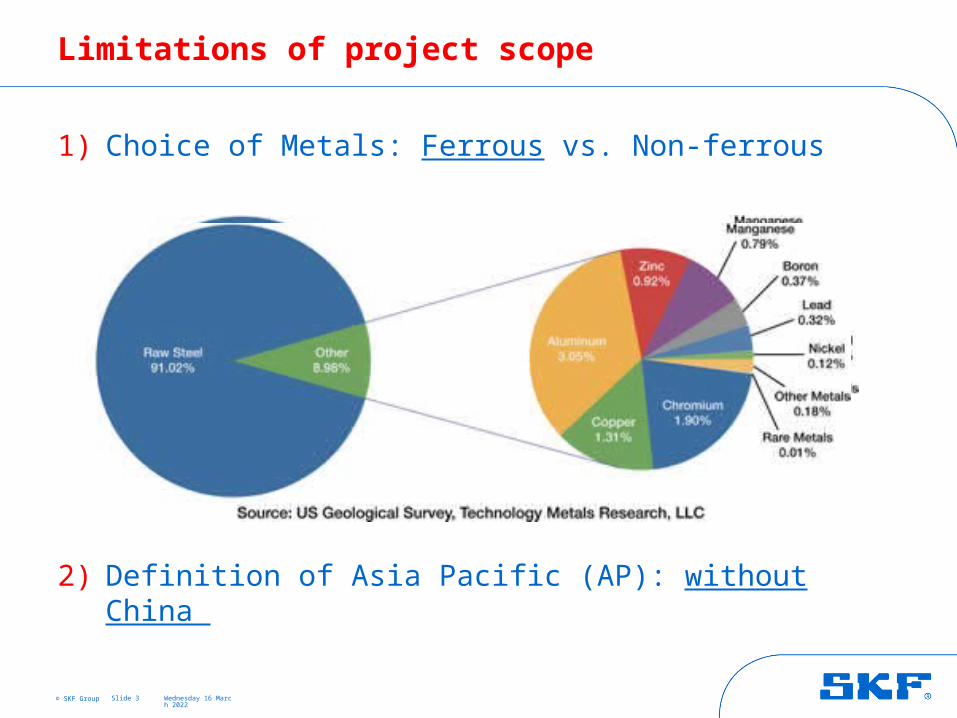
1) Choice of Metals: Ferrous vs. Non-ferrous
2) Definition of Asia Pacific (AP): without China
Slide 3

© SKF Group
Presentation Outline
A. Introduction to the steel industry• Overview of the Global Steel market• Choice of focus markets
B. Analysis of focus markets • Combined overview of focus markets • Data analysis and forecast of steel production output

INTRODUCTION TO THE STEEL INDUSTRY
Part A.
18 April 2023Slide 5

© SKF Group
Global Steel Industry
Over-capacity and decreasing steel prices driven by China 48.5% of world production in 2013, increase from 46.7% in 2012
Continuing robust production Year 2013: 779 mil tonnes vs. Year 2014 (expected): 817 mil tonnes
Jan Feb Mar Apr May56,000
58,000
60,000
62,000
64,000
66,000
68,000
70,000
72,000
Monthly steel production in China (Source: World Steel Organization)
2014
2013
© SKF Group 18 April 2023
Global Steel Industry
Over-capacity and decreasing steel prices driven by China
Low production costs- Heavy subsidization for state-owned steel companies;- Companies’ connection network helps dodge environmental laws
Denting prices around the world - China’s carbon and alloy steel wire rods were sold in the US at “110 percent below fair market value”
Perpetuating supply surplus- High inventories throughout the supply chain - Slow-down of economic growth at sub-7.5 percent
Slide 7
© SKF Group 18 April 2023
Global Steel Industry
Over-capacity and decreasing steel prices driven by China
Increasing steel exports: - Mar 2014, export volume: 6.76 mil tonnes - Q1 2014, export volume: 17.3 mil tonnes, y-o-y increase of 22%- Expected 2014 export volume: 70 mil tonnes, 23% of 309 mil tonnes estimated for AP region in 2013
- South Korea is a top importer for Chinese steel and 6 other AP countries are in top 10 importers of Chinese steel
Slide 8
© SKF Group 18 April 2023
Global Steel Industry
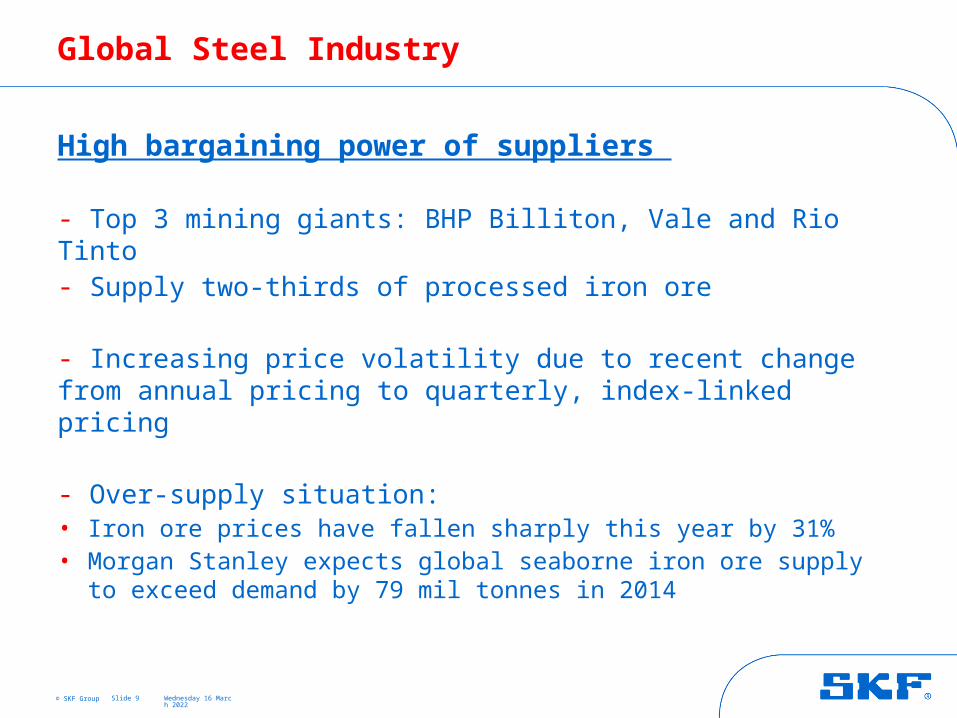
High bargaining power of suppliers
- Top 3 mining giants: BHP Billiton, Vale and Rio Tinto- Supply two-thirds of processed iron ore
- Increasing price volatility due to recent change from annual pricing to quarterly, index-linked pricing
- Over-supply situation: • Iron ore prices have fallen sharply this year by 31% • Morgan Stanley expects global seaborne iron ore supply to exceed demand
by 79 mil tonnes in 2014
Slide 9
© SKF Group 18 April 2023
Global Steel Industry
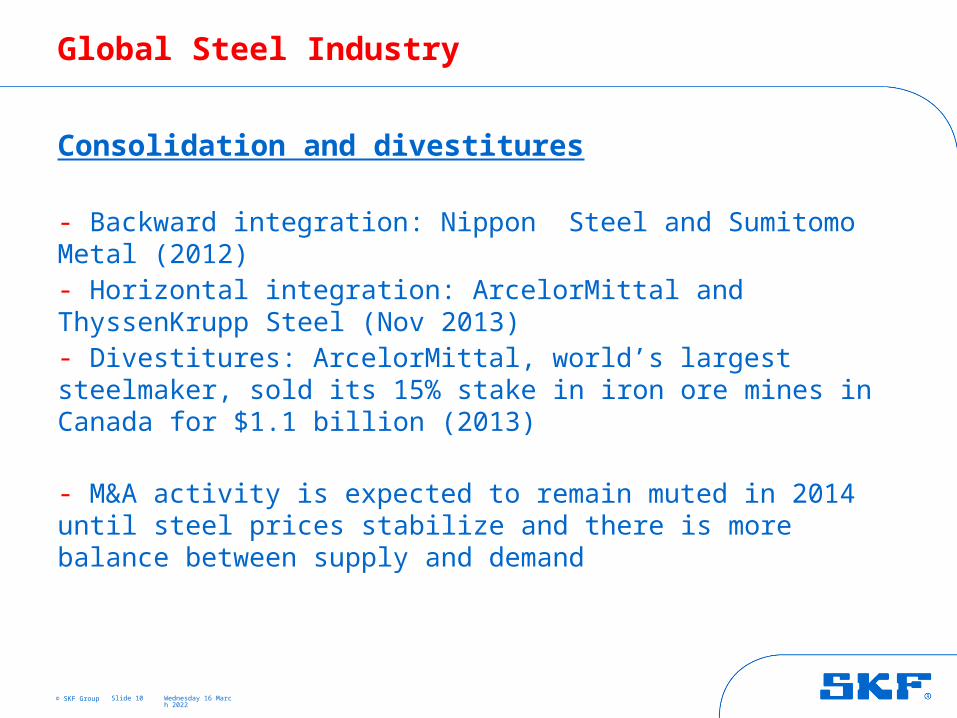
Consolidation and divestitures
- Backward integration: Nippon Steel and Sumitomo Metal (2012)- Horizontal integration: ArcelorMittal and ThyssenKrupp Steel (Nov 2013)- Divestitures: ArcelorMittal, world’s largest steelmaker, sold its 15% stake in iron ore mines in Canada for $1.1 billion (2013)
- M&A activity is expected to remain muted in 2014 until steel prices stabilize and there is more balance between supply and demand
Slide 10
© SKF Group 18 April 2023
Asia Pacific Steel Industry
Slide 11
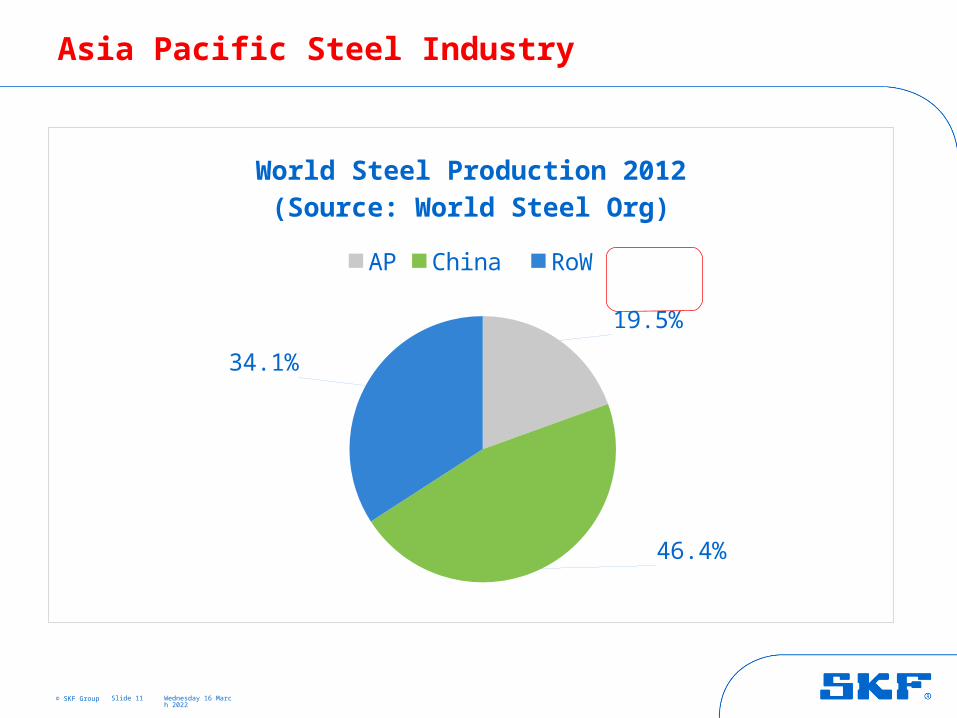
19.5%
46.4%
34.1%
World Steel Production 2012(Source: World Steel Org)
AP China RoW
© SKF Group 18 April 2023
Asia Pacific Steel Industry (cont)
Slide 12
Europ
ean
Union
Other
Eur
ope
C.I.S
North
Am
erica
South
Am
erica
Africa
Midd
le Eas
t
China
Asia P
acific
(les
s Chin
a)
Wor
ld 0
200000
400000
600000
800000
1000000
1200000
1400000
1600000
1800000
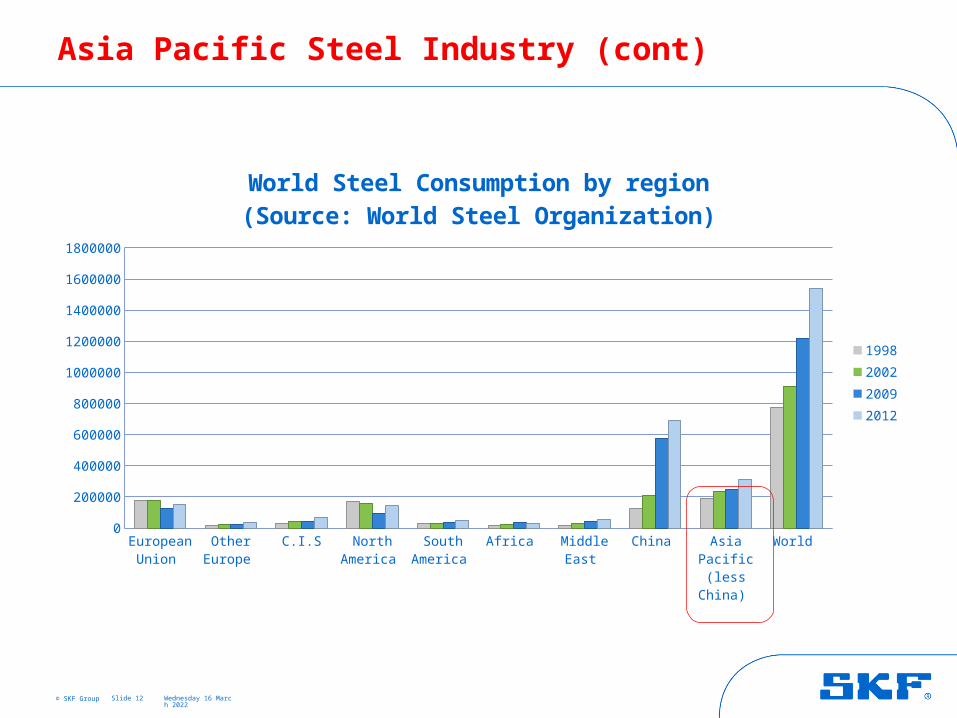
World Steel Consumption by region(Source: World Steel Organization)
1998
2002
2009
2012
© SKF Group 18 April 2023
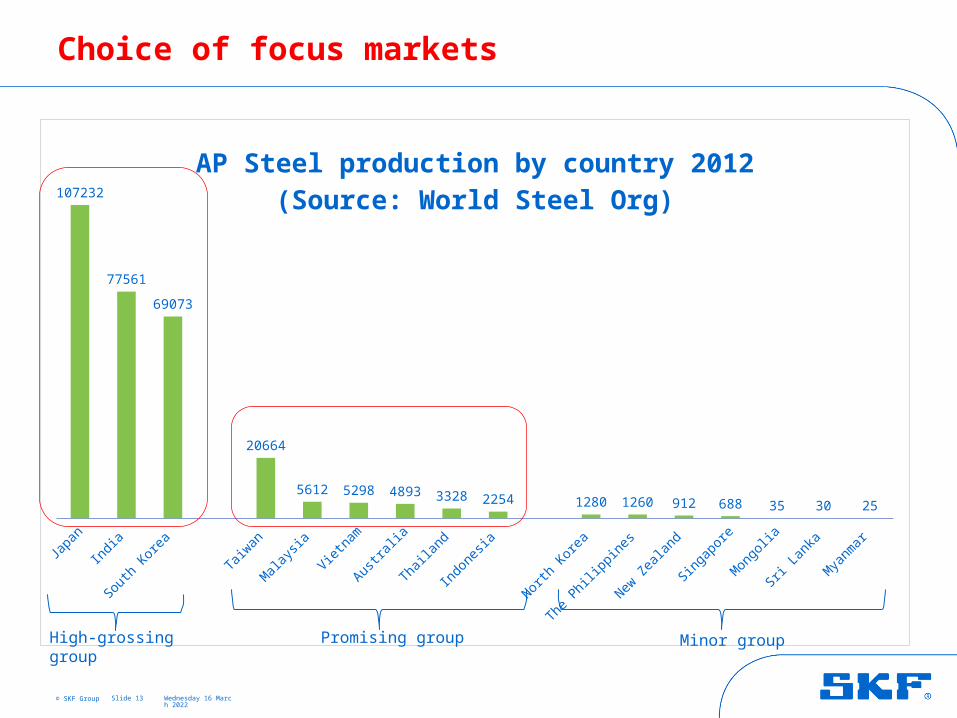
Choice of focus markets
Slide 13
Japa
nIn
dia
South
Kor
ea
Taiwan
Mala
ysia
Vietna
m
Austra
lia
Thaila
nd
Indo
nesia
North
Kor
ea
The P
hilipp
ines
New Z
ealan
d
Singap
ore
Mon
golia
Sri La
nka
Mya
nmar
107232
77561
69073
20664
5612 5298 4893 3328 2254 1280 1260 912 688 35 30 25
AP Steel production by country 2012(Source: World Steel Org)
High-grossing group Promising group Minor group
© SKF Group 18 April 2023
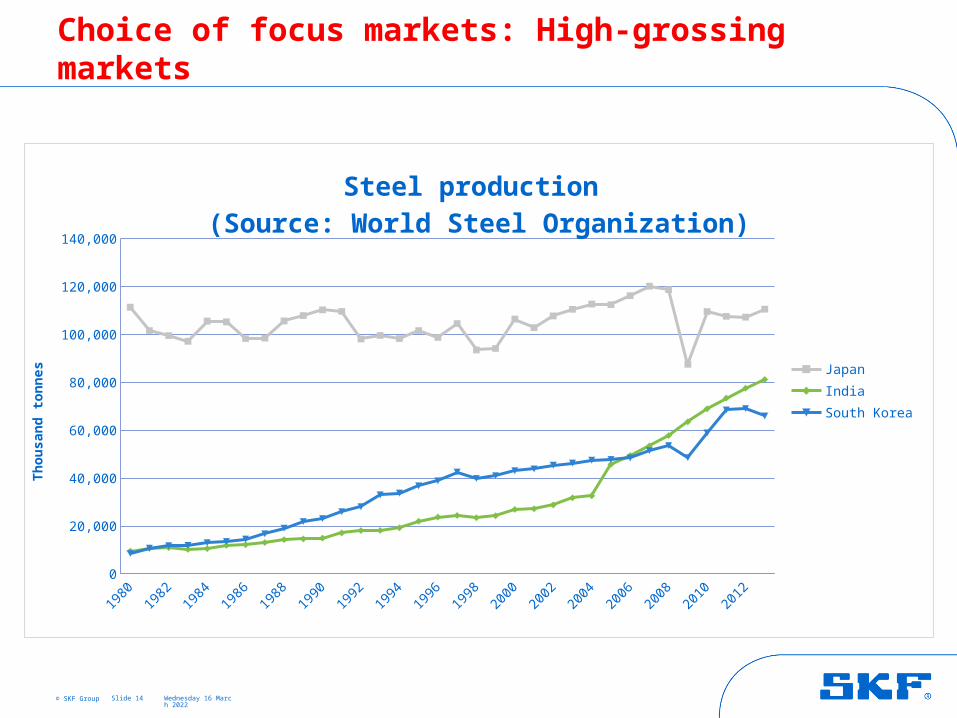
Choice of focus markets: High-grossing markets
Slide 14
1980
1982
1984
1986
1988
1990
1992
1994
1996
1998
2000
2002
2004
2006
2008
2010
2012
0
20,000
40,000
60,000
80,000
100,000
120,000
140,000
Steel production (Source: World Steel Organization)
Japan
India
South Korea
Th
ou
san
d t
on
nes
© SKF Group 18 April 2023
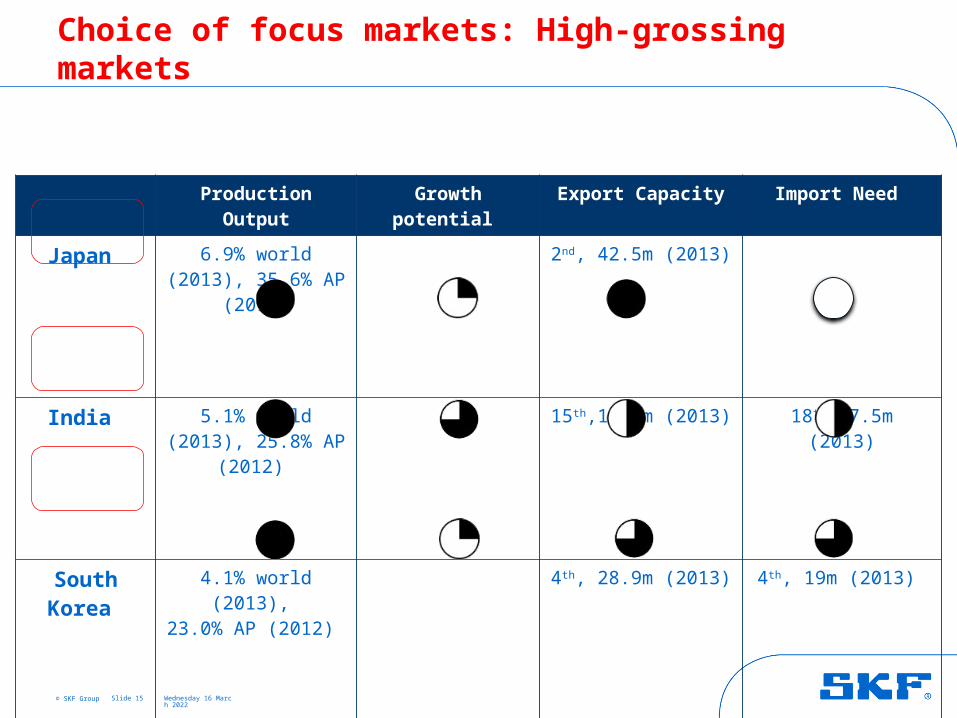
Choice of focus markets: High-grossing markets
Slide 15
Production Output Growth potential Export Capacity Import Need
Japan 6.9% world (2013), 35.6% AP (2012)
2nd, 42.5m (2013)
India 5.1% world (2013), 25.8% AP (2012)
15th,10.1m (2013) 18th, 7.5m (2013)
South Korea
4.1% world (2013), 23.0% AP (2012)
4th, 28.9m (2013) 4th, 19m (2013)
© SKF Group 18 April 2023
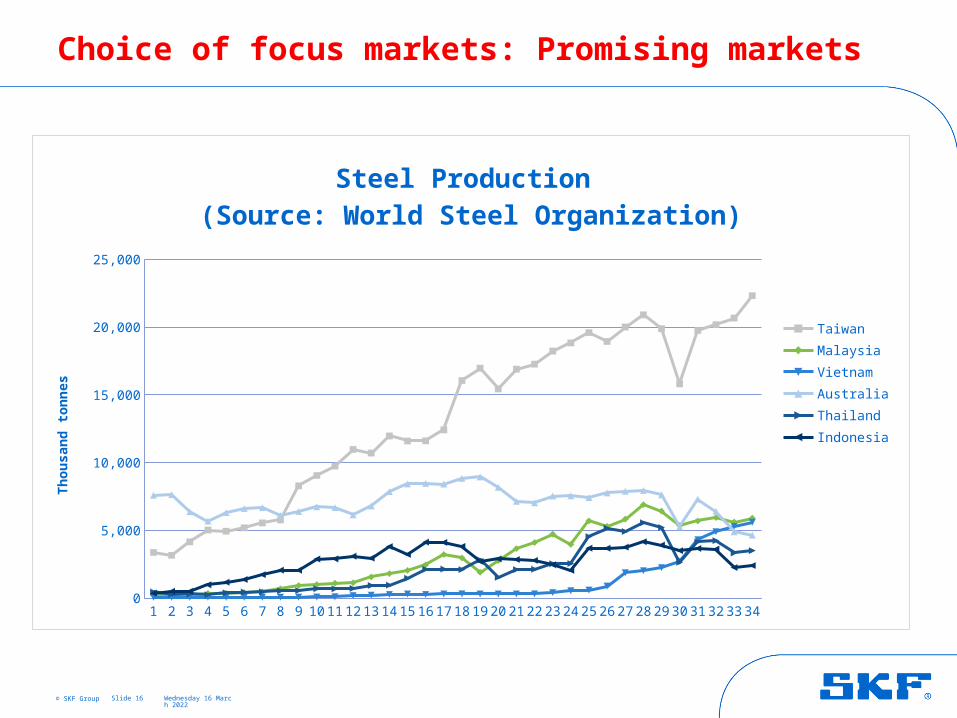
Choice of focus markets: Promising markets
Slide 16
1 2 3 4 5 6 7 8 9 10 11 12 13 14 15 16 17 18 19 20 21 22 23 24 25 26 27 28 29 30 31 32 33 340
5,000
10,000
15,000
20,000
25,000
Steel Production (Source: World Steel Organization)
Taiwan
Malaysia
Vietnam
Australia
Thailand
Indonesia
Th
ou
san
d t
on
nes

© SKF Group
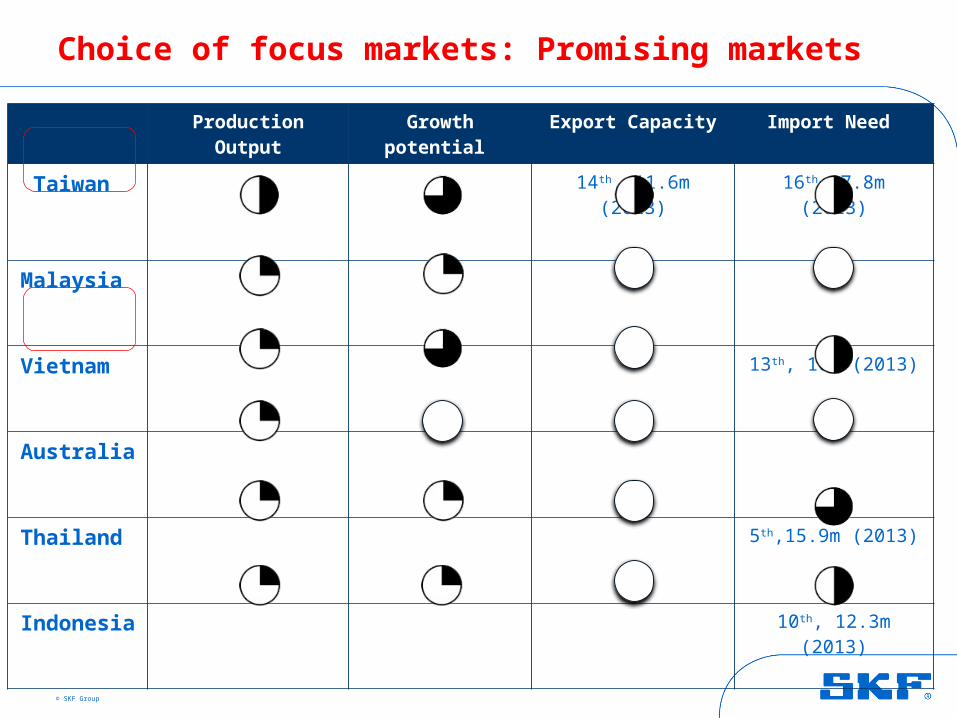
Choice of focus markets: Promising markets
Production Output Growth potential Export Capacity Import Need
Taiwan 14th, 11.6m (2013) 16th, 7.8m (2013)
Malaysia
Vietnam 13th, 10m (2013)
Australia
Thailand 5th,15.9m (2013)
Indonesia 10th, 12.3m (2013)
© SKF Group
Choice of focus markets: Promising markets
Production Output Growth potential Export Capacity Import Need
Taiwan 14th, 11.6m (2013) 16th, 7.8m (2013)
Malaysia
Vietnam 13th, 10m (2013)
Australia
Thailand 5th,15.9m (2013)
Indonesia 10th, 12.3m (2013)
© SKF Group 18 April 2023
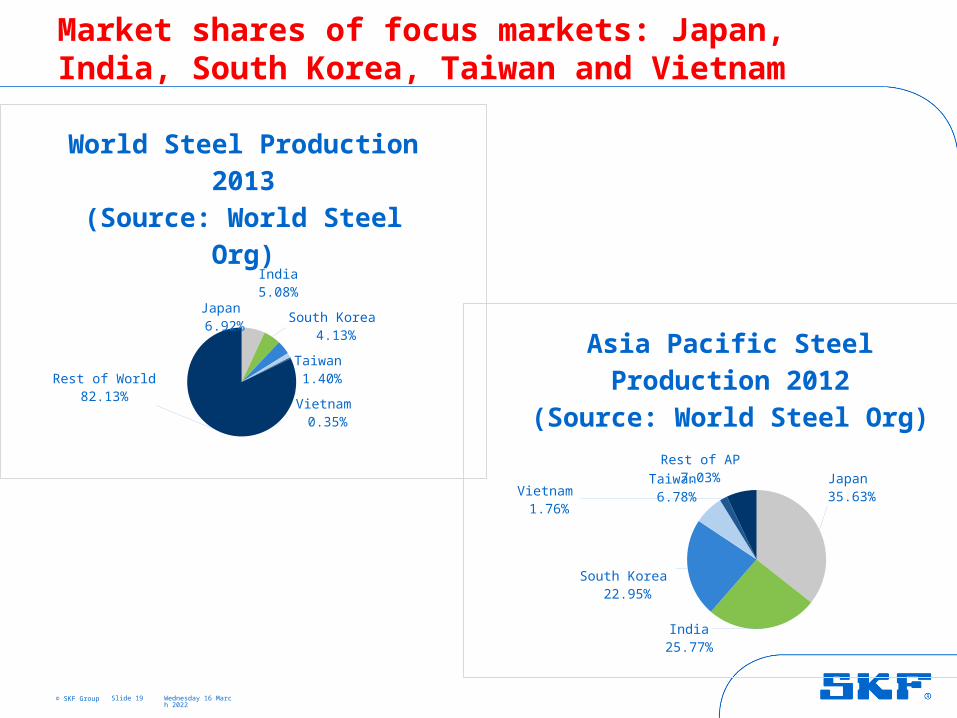
Market shares of focus markets: Japan, India, South Korea, Taiwan and Vietnam
Slide 19
Japan 6.92%
India5.08%
South Korea 4.13%Taiwan 1.40%
Vietnam 0.35%
Rest of World82.13%
World Steel Production 2013(Source: World Steel Org)
Japan 35.63%
India25.77%
South Korea 22.95%
Taiwan 6.78%Vietnam
1.76%
Rest of AP7.03%
Asia Pacific Steel Production 2012
(Source: World Steel Org)

ANALYSIS OF FOCUS MARKETS
Part B.
18 April 2023Slide 20

Overview of focus markets
18 April 2023Slide 21
© SKF Group 18 April 2023
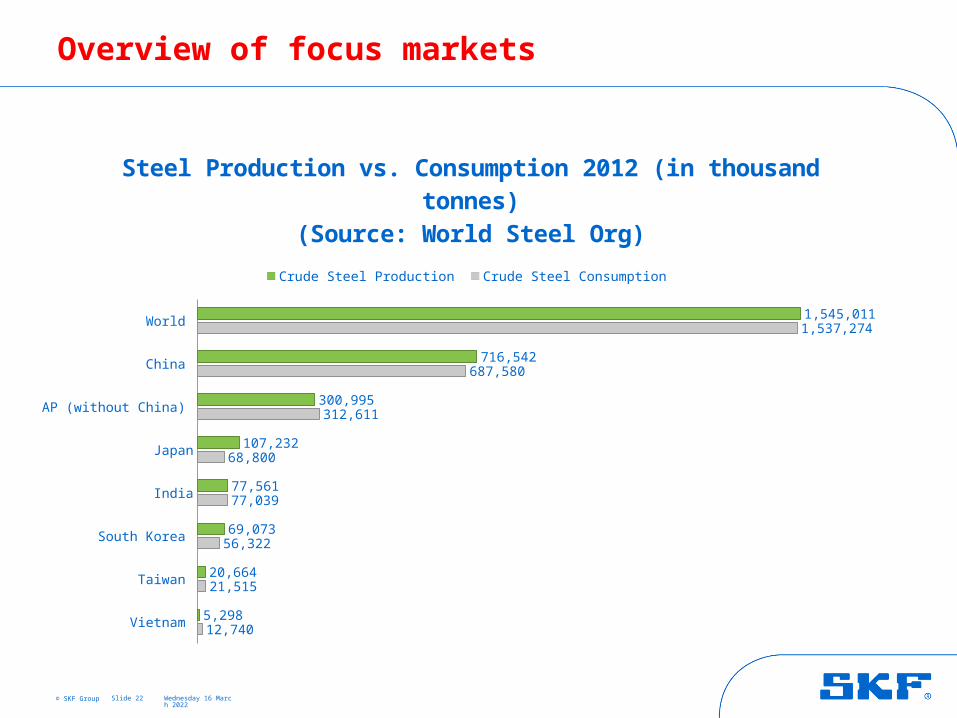
Overview of focus markets
Slide 22
Vietnam
Taiwan
South Korea
India
Japan
AP (without China)
China
World
12,740
21,515
56,322
77,039
68,800
312,611
687,580
1,537,274
5,298
20,664
69,073
77,561
107,232
300,995
716,542
1,545,011
Steel Production vs. Consumption 2012 (in thousand tonnes)(Source: World Steel Org)
Crude Steel Production Crude Steel Consumption
© SKF Group 18 April 2023
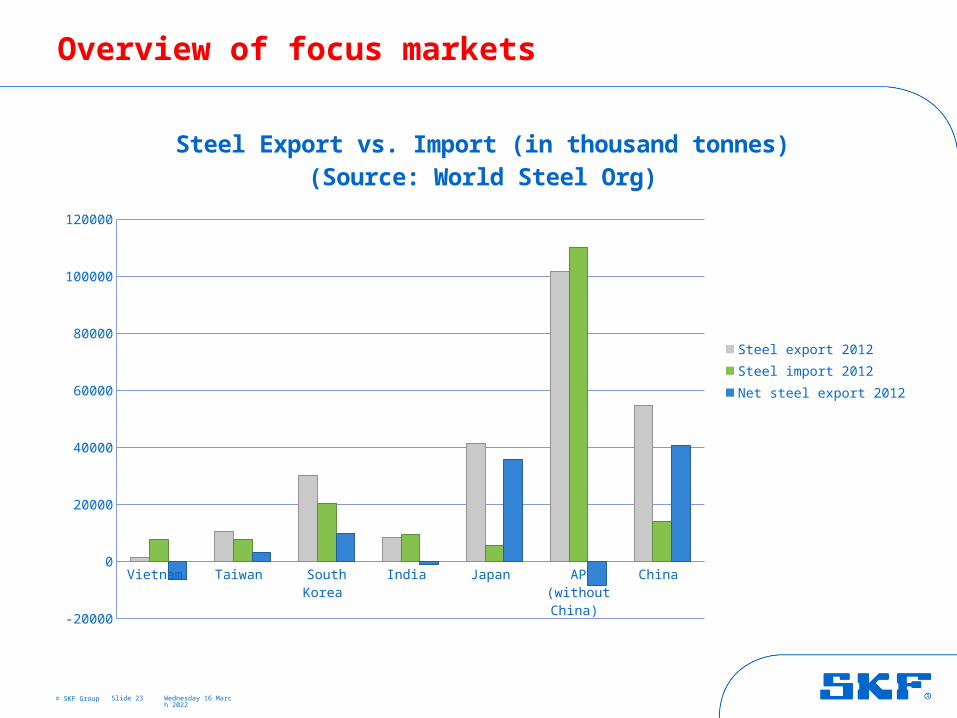
Overview of focus markets
Slide 23
Vietnam Taiwan South Korea India Japan AP (without China)
China
-20000
0
20000
40000
60000
80000
100000
120000
Steel Export vs. Import (in thousand tonnes)(Source: World Steel Org)
Steel export 2012
Steel import 2012
Net steel export 2012
Introduction to Multiple Regression Forecasting method
18 April 2023Slide 24
© SKF Group 18 April 2023
Data Analysis – Overview of Regression forecasting method
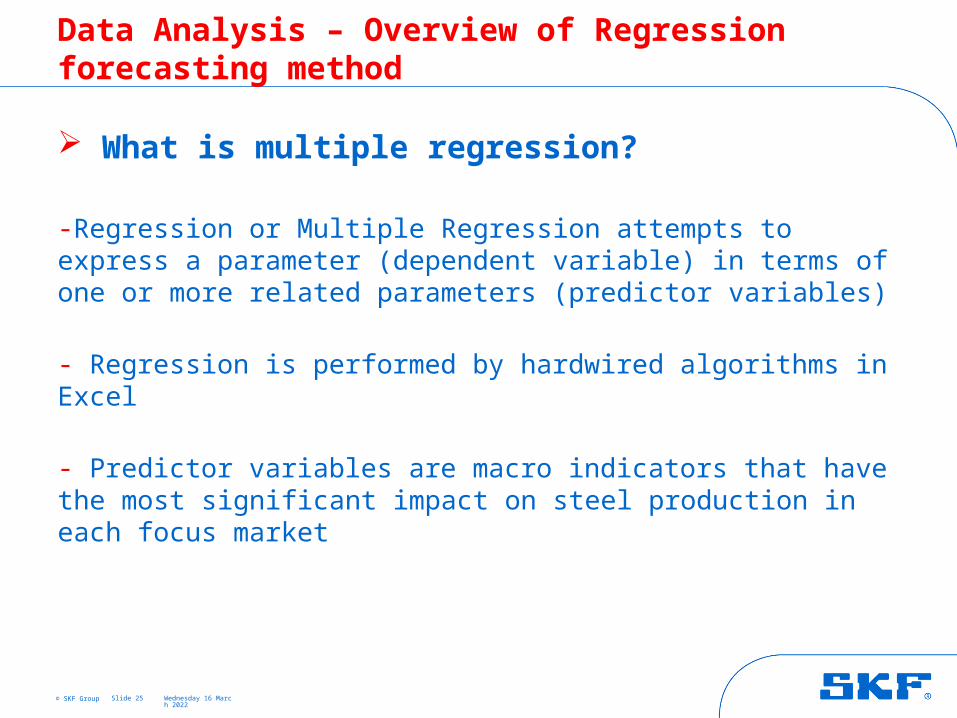
What is multiple regression?
-Regression or Multiple Regression attempts to express a parameter (dependent variable) in terms of one or more related parameters (predictor variables)
- Regression is performed by hardwired algorithms in Excel
- Predictor variables are macro indicators that have the most significant impact on steel production in each focus market
Slide 25
© SKF Group 18 April 2023
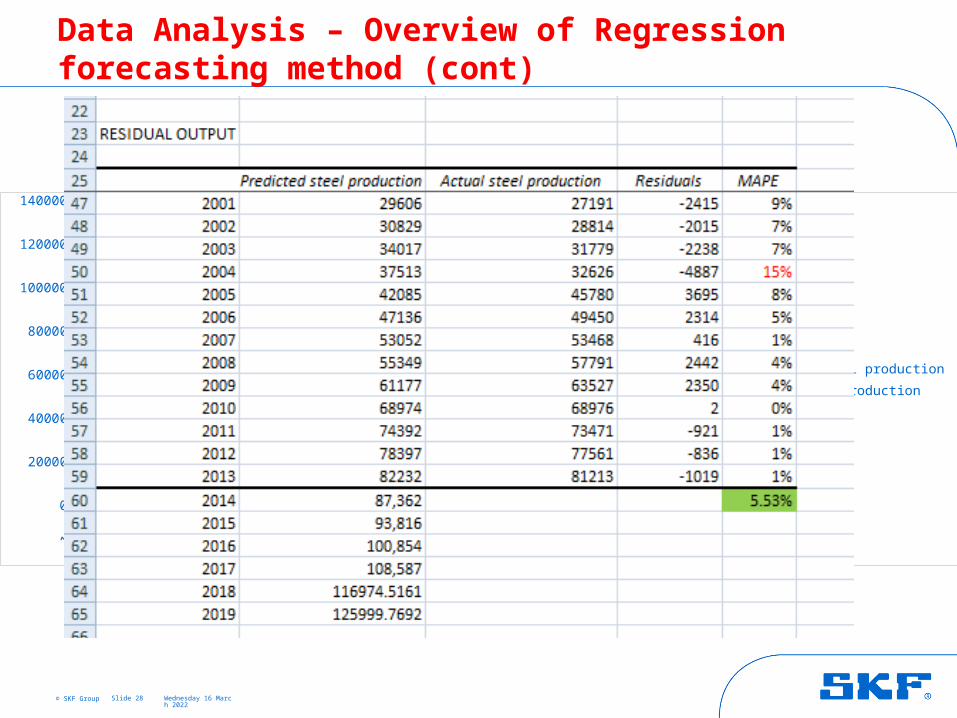
Data Analysis – Overview of Regression forecasting method (cont)
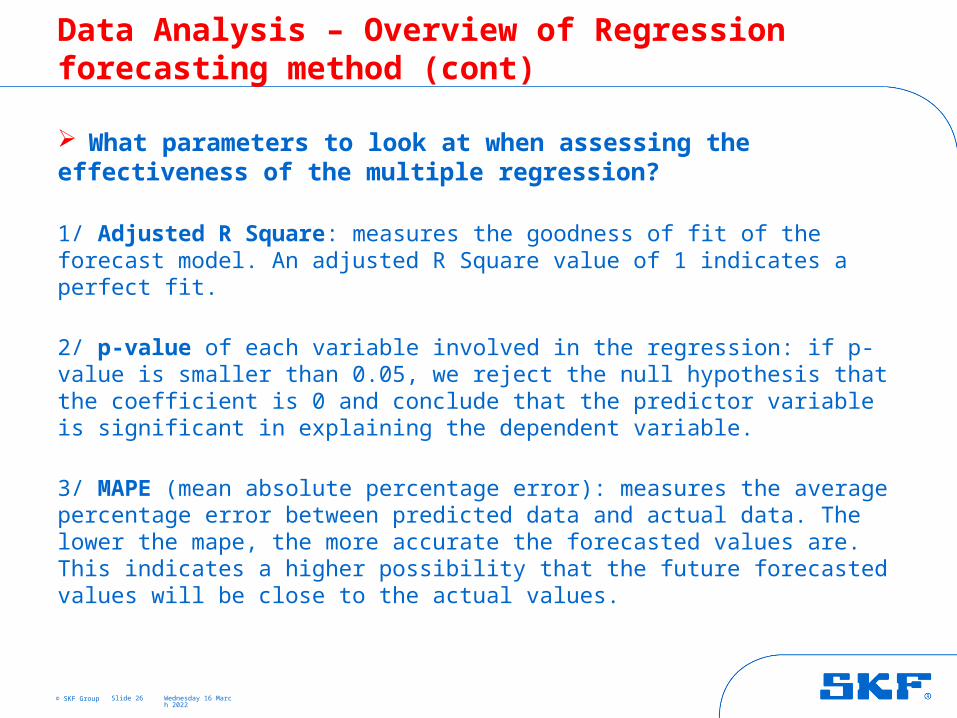
What parameters to look at when assessing the effectiveness of the multiple regression?
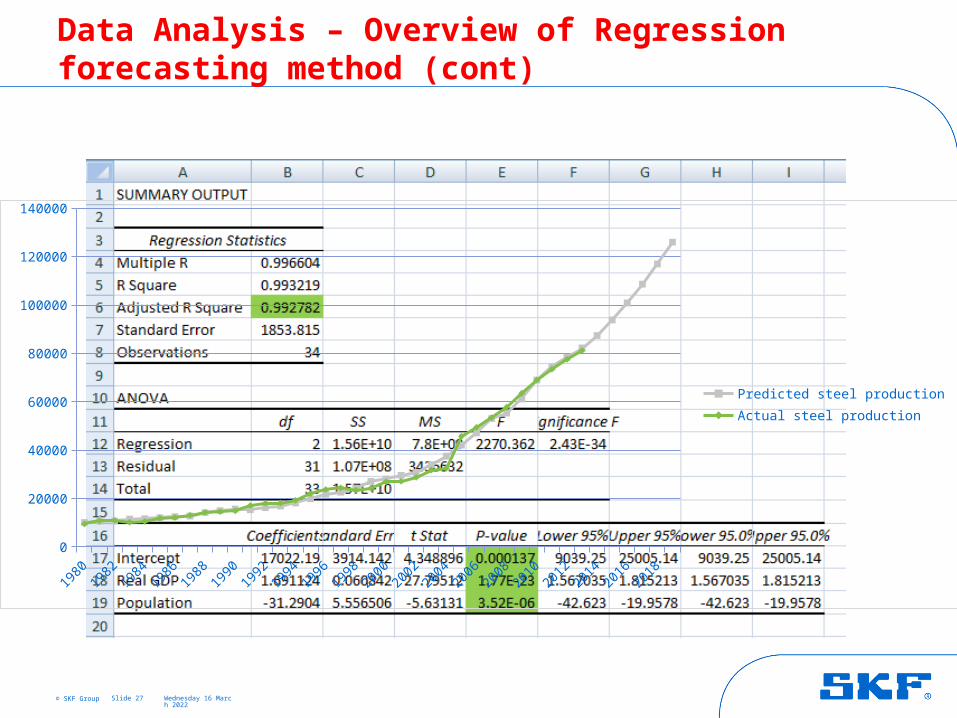
1/ Adjusted R Square: measures the goodness of fit of the forecast model. An adjusted R Square value of 1 indicates a perfect fit.
2/ p-value of each variable involved in the regression: if p-value is smaller than 0.05, we reject the null hypothesis that the coefficient is 0 and conclude that the predictor variable is significant in explaining the dependent variable.
3/ MAPE (mean absolute percentage error): measures the average percentage error between predicted data and actual data. The lower the mape, the more accurate the forecasted values are. This indicates a higher possibility that the future forecasted values will be close to the actual values.
Slide 26
© SKF Group 18 April 2023
Data Analysis – Overview of Regression forecasting method (cont)
Slide 27
1980
1982
1984
1986
1988
1990
1992
1994
1996
1998
2000
2002
2004
2006
2008
2010
2012
2014
2016
2018
0
20000
40000
60000
80000
100000
120000
140000
Predicted steel production
Actual steel production
© SKF Group 18 April 2023
Data Analysis – Overview of Regression forecasting method (cont)
Slide 28
1980
1982
1984
1986
1988
1990
1992
1994
1996
1998
2000
2002
2004
2006
2008
2010
2012
2014
2016
2018
0
20000
40000
60000
80000
100000
120000
140000
Predicted steel production
Actual steel production
© SKF Group 18 April 2023
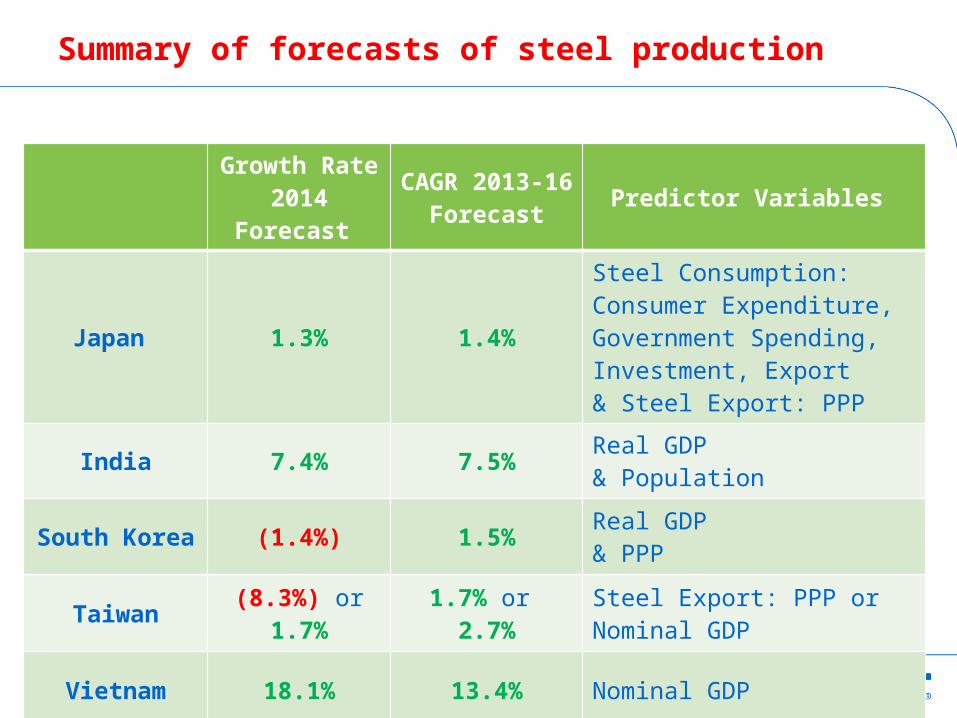
Summary of forecasts of steel production
Slide 29
Growth Rate 2014 Forecast
CAGR 2013-16 Forecast
Predictor Variables
Japan 1.3% 1.4%
Steel Consumption: Consumer Expenditure, Government Spending, Investment, Export& Steel Export: PPP
India 7.4% 7.5%Real GDP & Population
South Korea (1.4%) 1.5%Real GDP & PPP
Taiwan(8.3%) or
1.7%1.7% or
2.7%Steel Export: PPP or Nominal GDP
Vietnam 18.1% 13.4% Nominal GDP
Analysis of Japan
18 April 2023Slide 30

© SKF Group 18 April 2023
Data Analysis – Predictor Variables
Slide 31
Steel Production
Steel ExportSteel
Consumption
1/ Export (bil current USD)2/ Household Consumption (bil current LCU) 3/ Government Expenditure (bil current LCU)4/ Investment (bil current LCU)
1/ Purchasing Power Parity (LCU per international $)
Steel Import
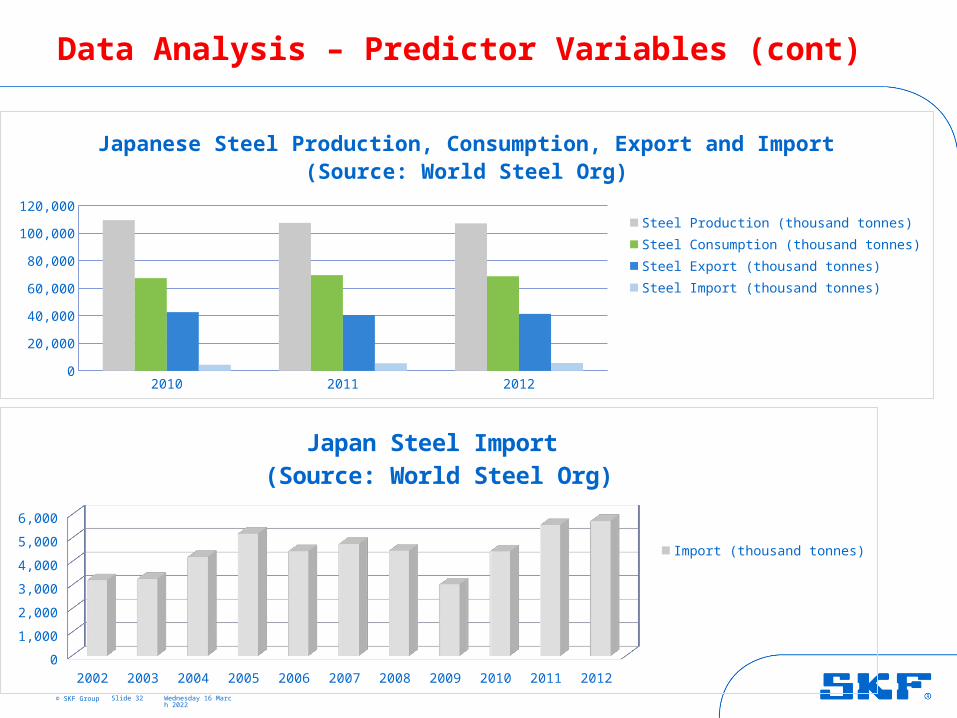
. Import volume is equal to only 5.3% of production in 2012. Import remains relatively stable throughout the years
© SKF Group 18 April 2023
Data Analysis – Predictor Variables (cont)
Slide 32
2002 2003 2004 2005 2006 2007 2008 2009 2010 2011 20120
1,000
2,000
3,000
4,000
5,000
6,000
Japan Steel Import (Source: World Steel Org)
Import (thousand tonnes)
2010 2011 20120
20,000
40,000
60,000
80,000
100,000
120,000
Japanese Steel Production, Consumption, Export and Import(Source: World Steel Org)
Steel Production (thousand tonnes)
Steel Consumption (thousand tonnes)
Steel Export (thousand tonnes)
Steel Import (thousand tonnes)
© SKF Group 18 April 2023
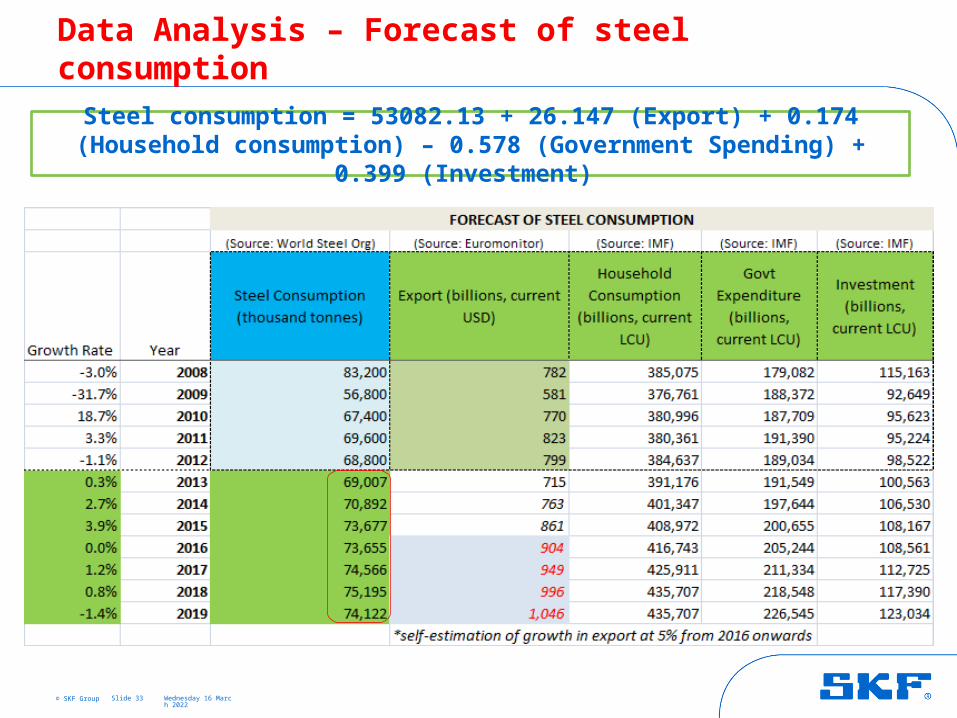
Data Analysis – Forecast of steel consumption
Slide 33
Steel consumption = 53082.13 + 26.147 (Export) + 0.174 (Household consumption) – 0.578 (Government Spending) + 0.399 (Investment)
© SKF Group 18 April 2023
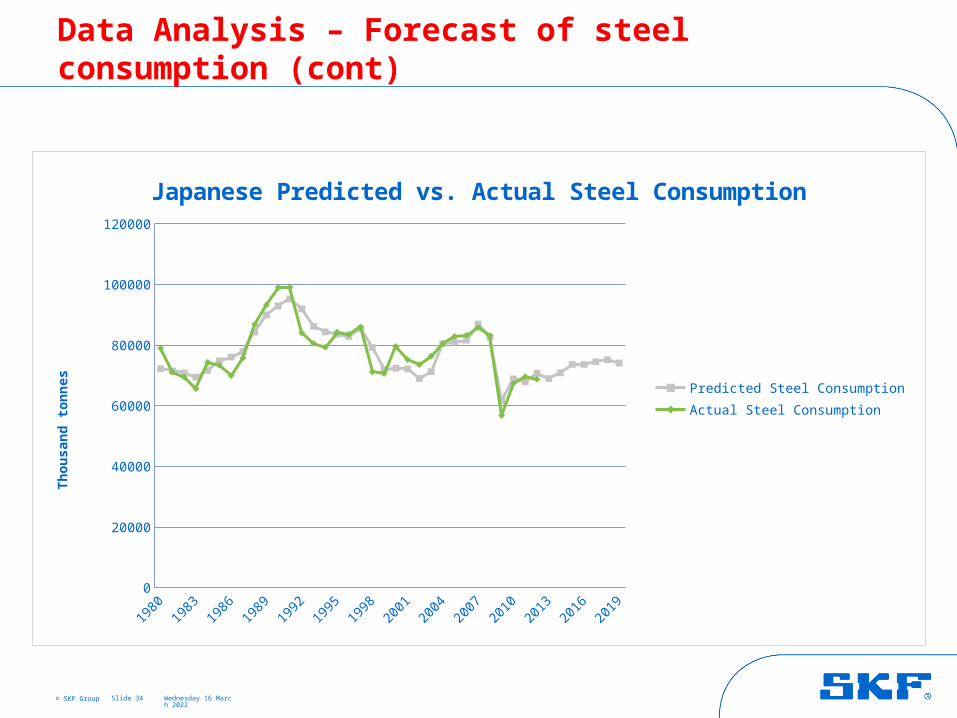
Data Analysis – Forecast of steel consumption (cont)
Slide 34
1980
1982
1984
1986
1988
1990
1992
1994
1996
1998
2000
2002
2004
2006
2008
2010
2012
2014
2016
2018
0
20000
40000
60000
80000
100000
120000
Japanese Predicted vs. Actual Steel Consumption
Predicted Steel Consumption
Actual Steel Consumption
Th
ou
san
d t
on
nes

© SKF Group 18 April 2023
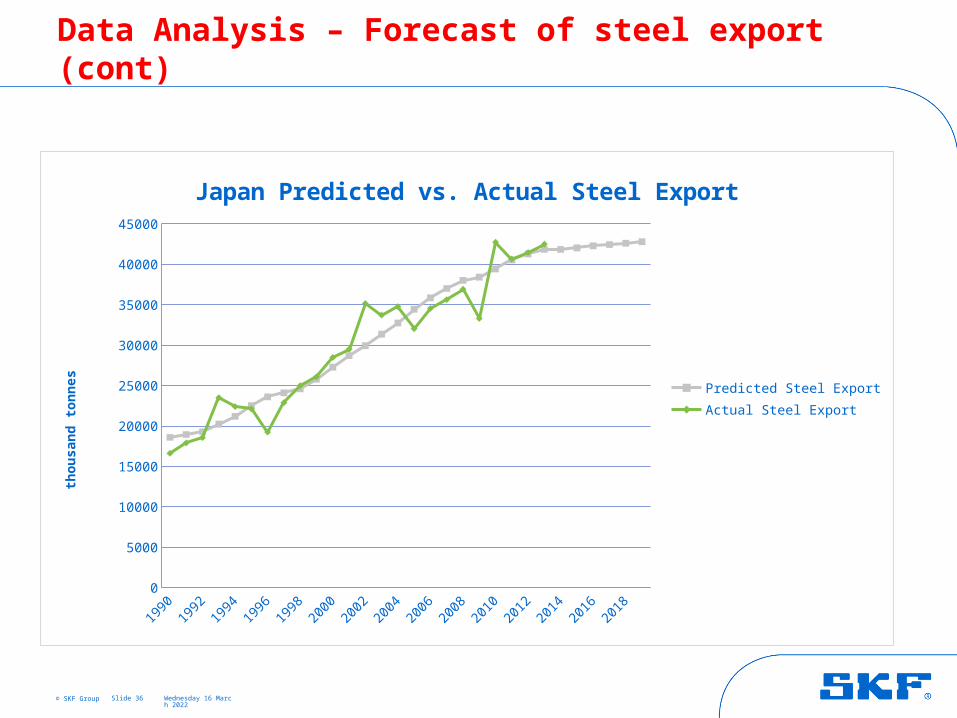
Data Analysis – Forecast of steel export
Slide 35
Steel export = 69042 – 267 (PPP)
© SKF Group 18 April 2023
Data Analysis – Forecast of steel export (cont)
Slide 36
1990
1992
1994
1996
1998
2000
2002
2004
2006
2008
2010
2012
2014
2016
2018
0
5000
10000
15000
20000
25000
30000
35000
40000
45000
Japan Predicted vs. Actual Steel Export
Predicted Steel Export
Actual Steel Export
tho
usa
nd
to
nn
es
© SKF Group 18 April 2023
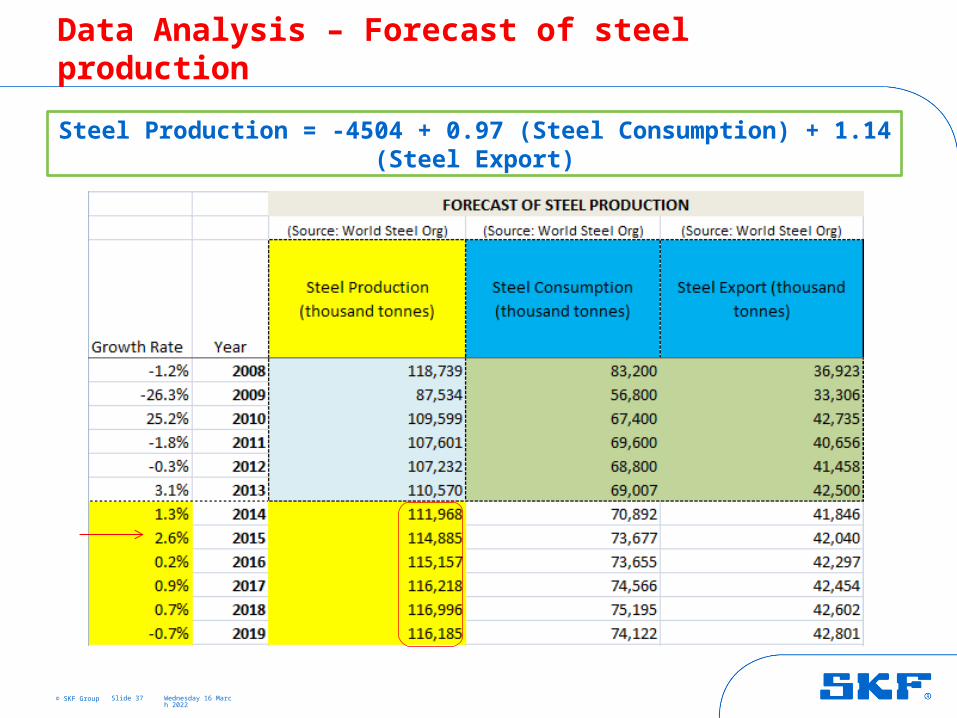
Data Analysis – Forecast of steel production
Slide 37
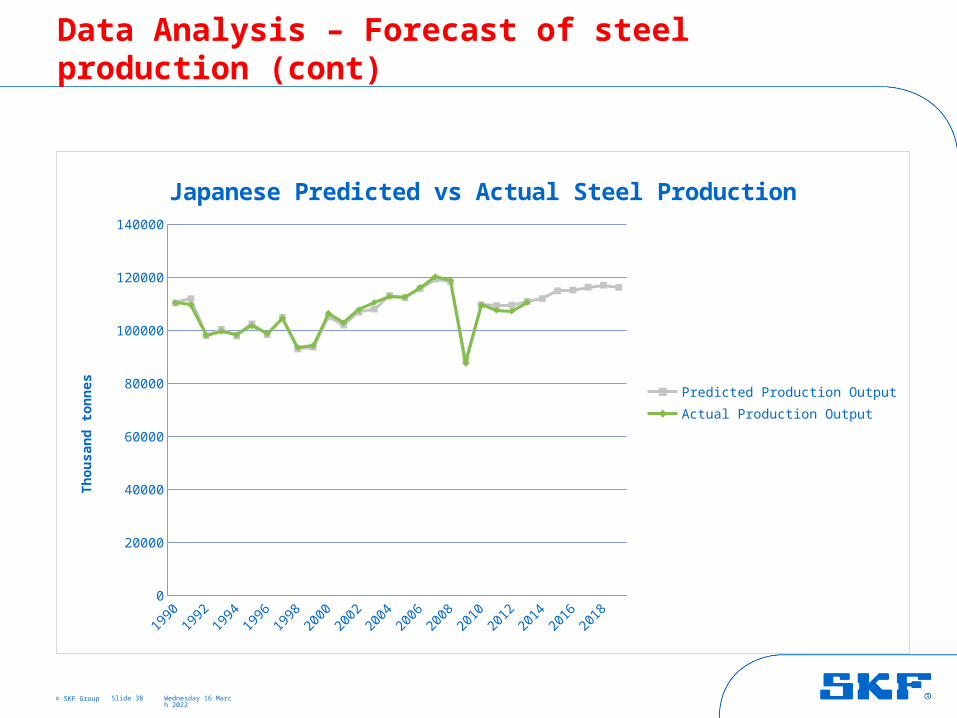
Steel Production = -4504 + 0.97 (Steel Consumption) + 1.14 (Steel Export)
© SKF Group 18 April 2023
Data Analysis – Forecast of steel production (cont)
Slide 38
1990
1992
1994
1996
1998
2000
2002
2004
2006
2008
2010
2012
2014
2016
2018
0
20000
40000
60000
80000
100000
120000
140000
Japanese Predicted vs Actual Steel Production
Predicted Production Output
Actual Production Output
Th
ou
san
d t
on
nes
© SKF Group 18 April 2023
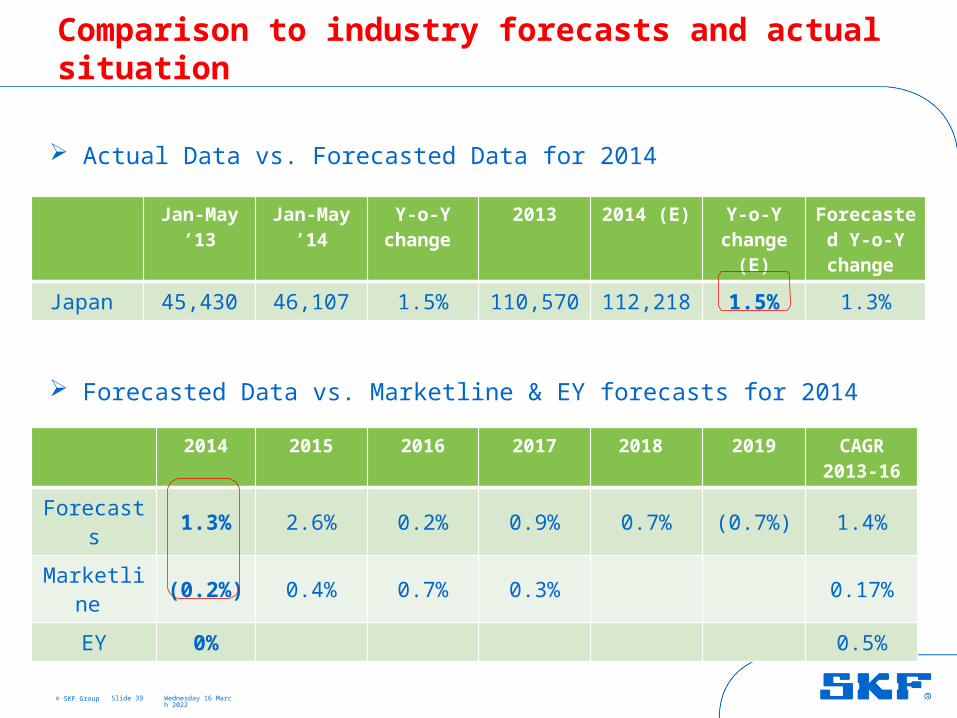
Comparison to industry forecasts and actual situation
Slide 39
Jan-May ‘13
Jan-May ’14
Y-o-Y change
2013 2014 (E) Y-o-Y change
(E)
Forecasted Y-o-Y
change
Japan 45,430 46,107 1.5% 110,570 112,218 1.5% 1.3%
2014 2015 2016 2017 2018 2019 CAGR2013-16
Forecasts 1.3% 2.6% 0.2% 0.9% 0.7% (0.7%) 1.4%
Marketline (0.2%) 0.4% 0.7% 0.3% 0.17%
EY 0% 0.5%
Actual Data vs. Forecasted Data for 2014
Forecasted Data vs. Marketline & EY forecasts for 2014

Analysis of India
18 April 2023Slide 40

© SKF Group 18 April 2023
Data Analysis – Predictor Variables
Slide 41
Steel Production 1/ Real GDP (bil constant LCU)2/ Population (mil)
1993 1994 1995 1996 1997 1998 1999 2000 2001 2002 2003 2004 2005 2006 2007 2008 2009 2010 2011 2012 20130
10,000
20,000
30,000
40,000
50,000
60,000
70,000
80,000
90,000
Indian Steel Production vs. Steel Export (in thousand tonnes)(Source: World Steel Org)
Steel Production
Steel Export

© SKF Group 18 April 2023
Data Analysis – Forecast of steel production
Slide 42
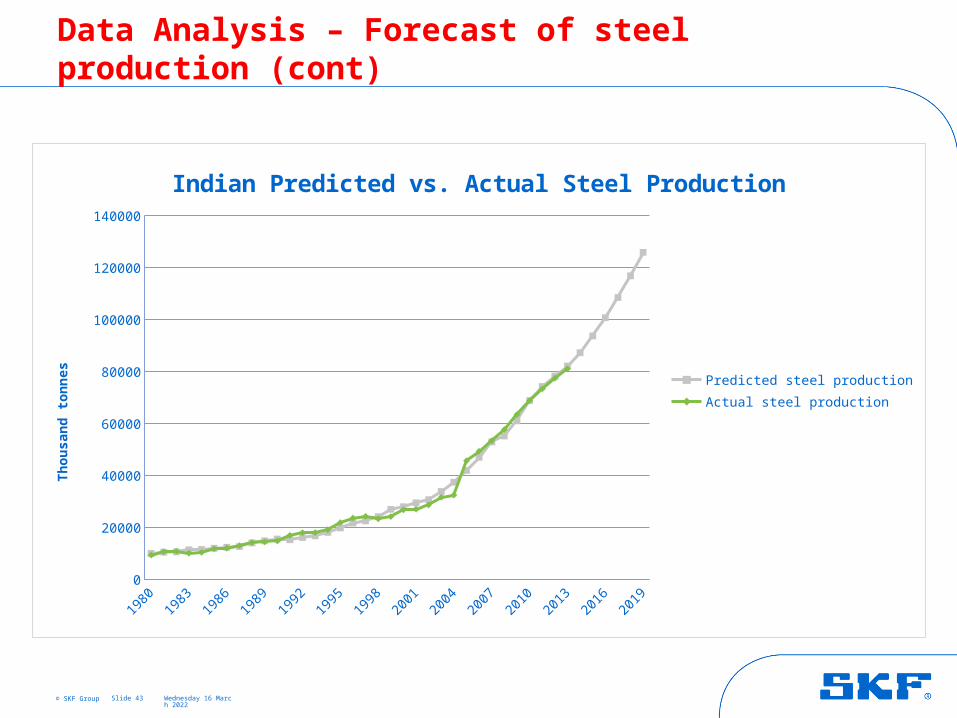
Steel production = 17022 + 1.7 (Real GDP) - 31.3 (Population)
GDP growth rate
10.3%
6.6%
4.7%
4.4%
5.4%
6.4%
6.5%
6.6%
6.7%
6.8%
© SKF Group 18 April 2023
Data Analysis – Forecast of steel production (cont)
Slide 43
1980
1982
1984
1986
1988
1990
1992
1994
1996
1998
2000
2002
2004
2006
2008
2010
2012
2014
2016
2018
0
20000
40000
60000
80000
100000
120000
140000
Indian Predicted vs. Actual Steel Production
Predicted steel production
Actual steel production
Th
ou
san
d t
on
nes
© SKF Group 18 April 2023
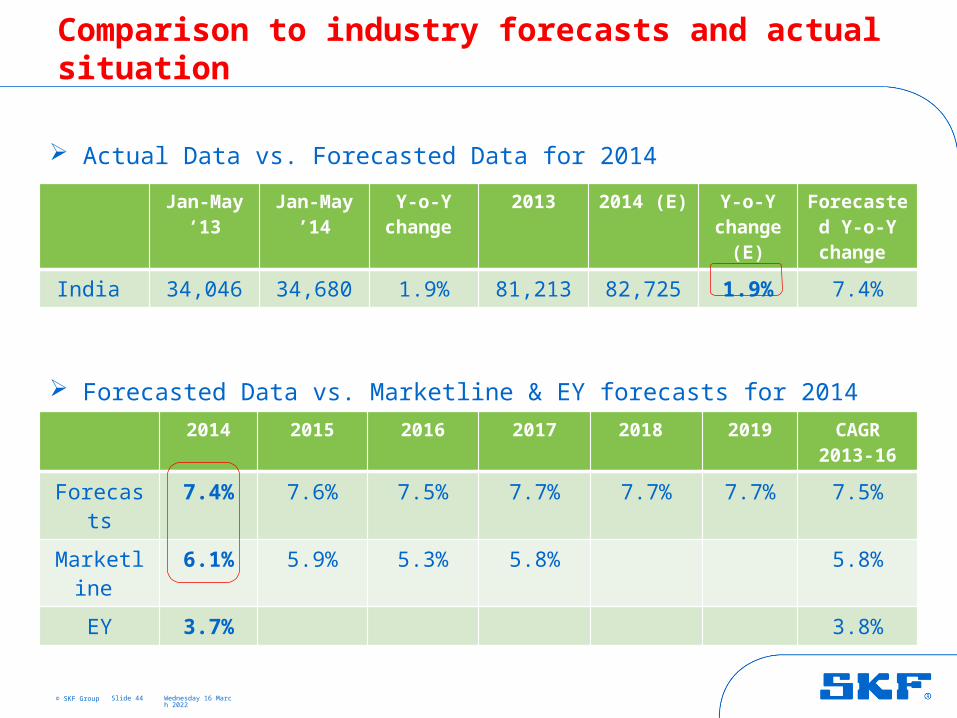
Comparison to industry forecasts and actual situation
Slide 44
Jan-May ‘13
Jan-May ’14
Y-o-Y change
2013 2014 (E) Y-o-Y change
(E)
Forecasted Y-o-Y
change
India 34,046 34,680 1.9% 81,213 82,725 1.9% 7.4%
2014 2015 2016 2017 2018 2019 CAGR2013-16
Forecasts 7.4% 7.6% 7.5% 7.7% 7.7% 7.7% 7.5%
Marketline 6.1% 5.9% 5.3% 5.8% 5.8%
EY 3.7% 3.8%
Actual Data vs. Forecasted Data for 2014
Forecasted Data vs. Marketline & EY forecasts for 2014
Analysis of South Korea
18 April 2023Slide 45
© SKF Group 18 April 2023
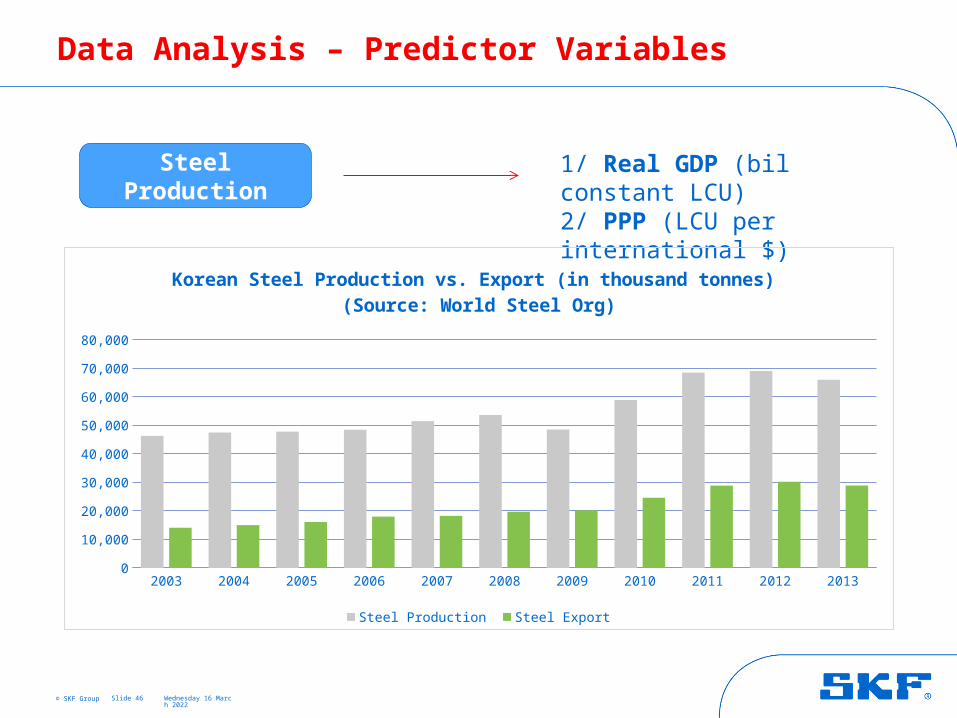
Data Analysis – Predictor Variables
Slide 46
Steel Production 1/ Real GDP (bil constant LCU)2/ PPP (LCU per international $)
2003 2004 2005 2006 2007 2008 2009 2010 2011 2012 20130
10,000
20,000
30,000
40,000
50,000
60,000
70,000
80,000
Korean Steel Production vs. Export (in thousand tonnes) (Source: World Steel Org)
Steel Production Steel Export
© SKF Group 18 April 2023
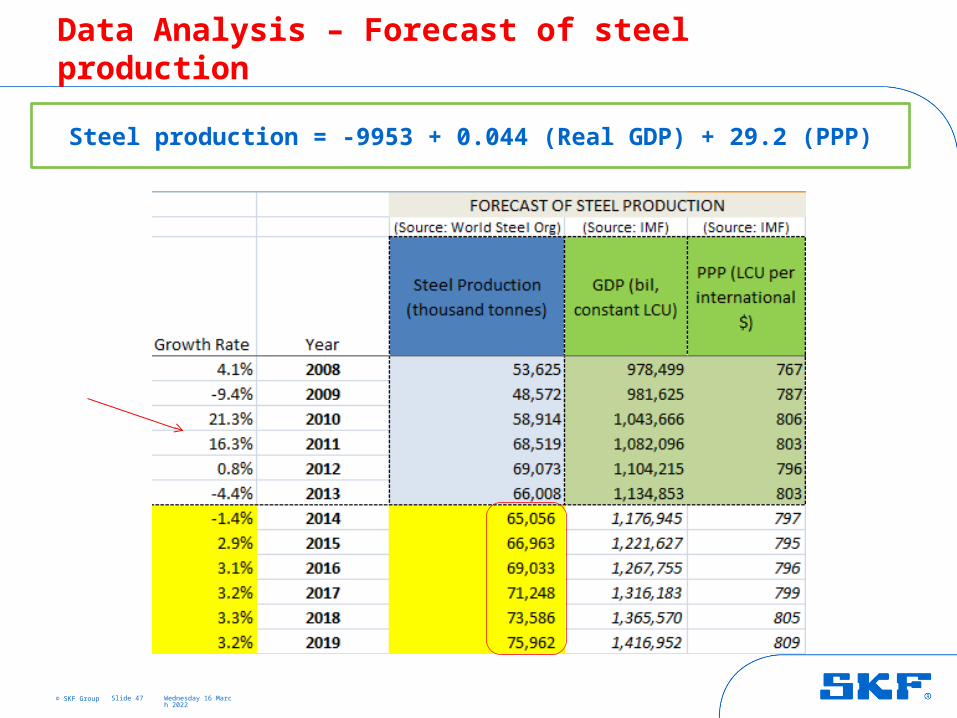
Data Analysis – Forecast of steel production
Slide 47
Steel production = -9953 + 0.044 (Real GDP) + 29.2 (PPP)
© SKF Group 18 April 2023
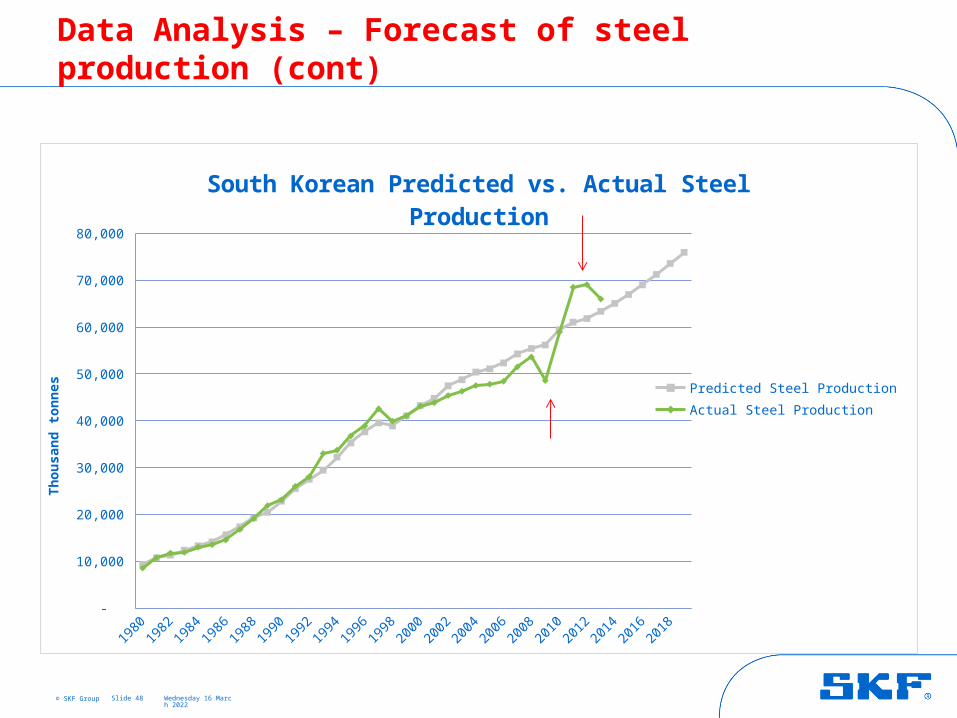
Data Analysis – Forecast of steel production (cont)
Slide 48
1980
1982
1984
1986
1988
1990
1992
1994
1996
1998
2000
2002
2004
2006
2008
2010
2012
2014
2016
2018
-
10,000
20,000
30,000
40,000
50,000
60,000
70,000
80,000
South Korean Predicted vs. Actual Steel Production
Predicted Steel Production
Actual Steel Production
Th
ou
san
d t
on
nes
© SKF Group
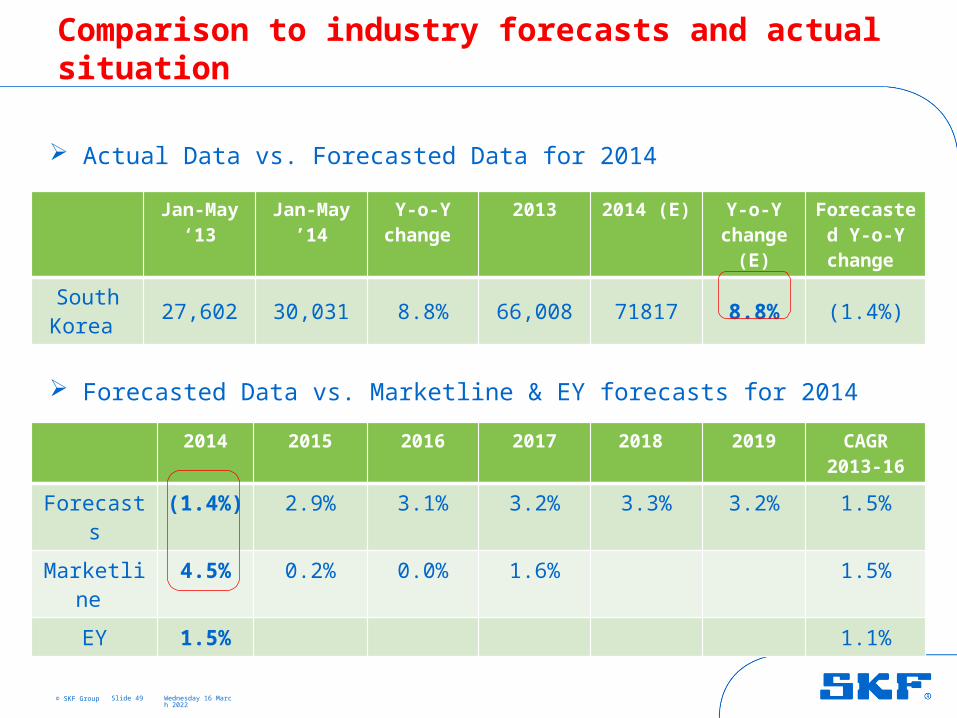
Comparison to industry forecasts and actual situation
18 April 2023Slide 49
Jan-May ‘13
Jan-May ’14
Y-o-Y change
2013 2014 (E) Y-o-Y change
(E)
Forecasted Y-o-Y
change
South Korea 27,602 30,031 8.8% 66,008 71817 8.8% (1.4%)
2014 2015 2016 2017 2018 2019 CAGR2013-16
Forecasts (1.4%) 2.9% 3.1% 3.2% 3.3% 3.2% 1.5%
Marketline 4.5% 0.2% 0.0% 1.6% 1.5%
EY 1.5% 1.1%
Actual Data vs. Forecasted Data for 2014
Forecasted Data vs. Marketline & EY forecasts for 2014
Analysis of Taiwan
18 April 2023Slide 50
© SKF Group 18 April 2023
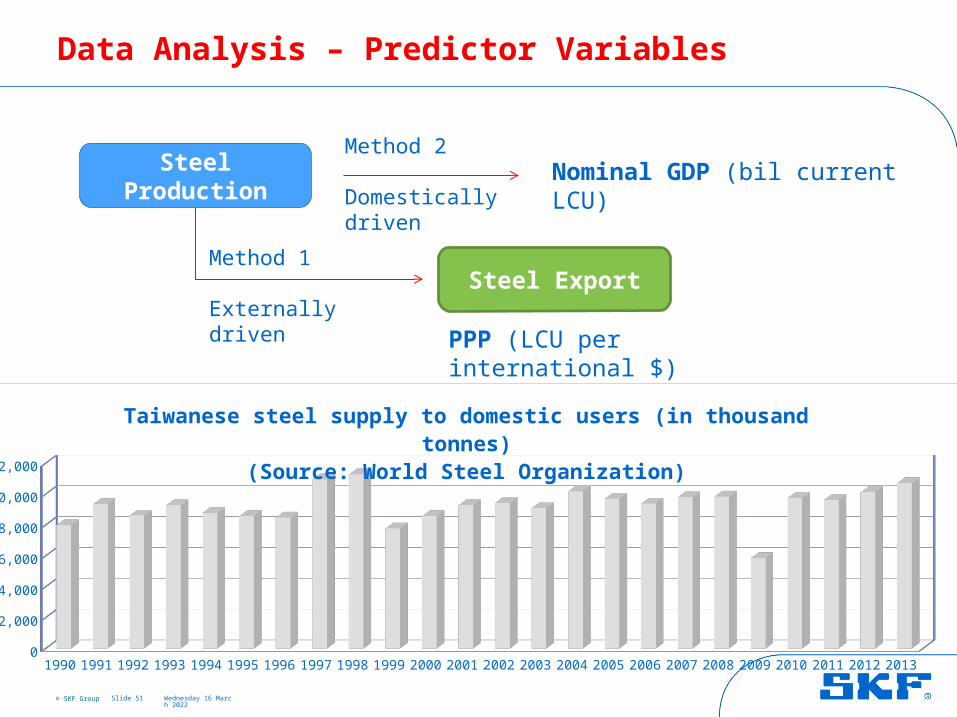
Data Analysis – Predictor Variables
Slide 51
Steel Production Nominal GDP (bil current LCU)
Steel Export
PPP (LCU per international $)
Method 2
Domestically driven
Method 1
Externally driven
1990 1991 1992 1993 1994 1995 1996 1997 1998 1999 2000 2001 2002 2003 2004 2005 2006 2007 2008 2009 2010 2011 2012 20130
2,000
4,000
6,000
8,000
10,000
12,000
Taiwanese steel supply to domestic users (in thousand tonnes)(Source: World Steel Organization)

© SKF Group 18 April 2023
Data Analysis – Predictor Variables (cont)
Slide 52
1990
1991
1992
1993
1994
1995
1996
1997
1998
1999
2000
2001
2002
2003
2004
2005
2006
2007
2008
2009
2010
2011
2012
2013
0
5,000
10,000
15,000
20,000
25,000
30,000
Taiwanese Steel Production, Export, Consumption and Import(Source: World Steel Org)
Steel Production (thousand tonnes)
Steel Export (thousand tonnes)
Steel Consumption (thousand tonnes)
Steel Import (thousand tonnes)
Th
ou
san
d t
on
nes

© SKF Group 18 April 2023
Data Analysis – Method 1: Forecast of steel export
Slide 53
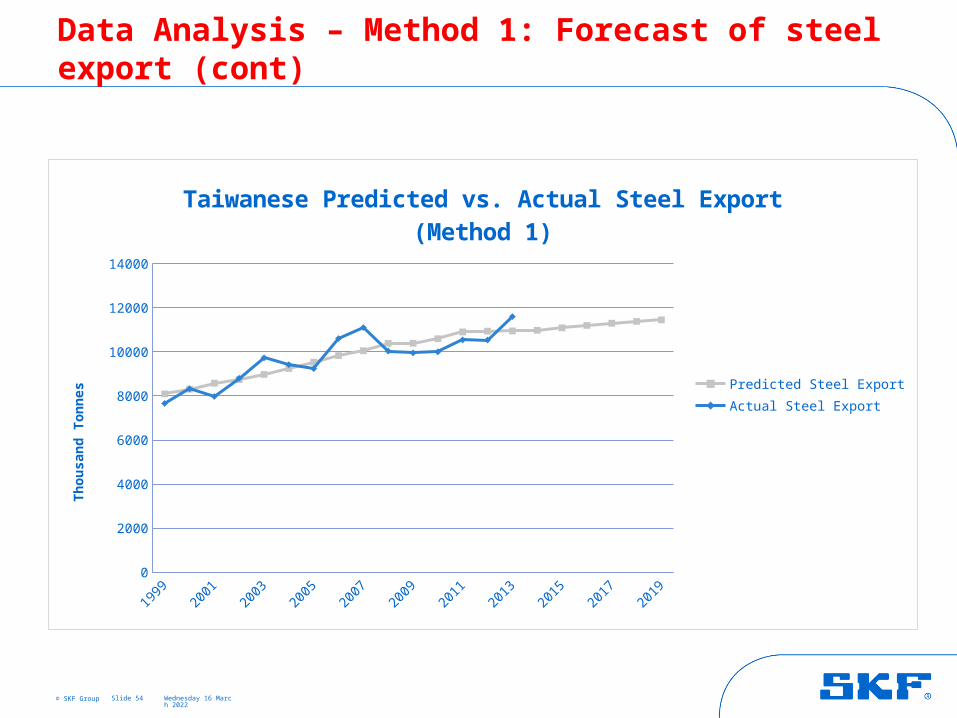
Steel export = 16997 – 386 (PPP)
© SKF Group 18 April 2023
Data Analysis – Method 1: Forecast of steel export (cont)
Slide 54
1999
2000
2001
2002
2003
2004
2005
2006
2007
2008
2009
2010
2011
2012
2013
2014
2015
2016
2017
2018
2019
0
2000
4000
6000
8000
10000
12000
14000
Taiwanese Predicted vs. Actual Steel Export (Method 1)
Predicted Steel Export
Actual Steel Export
Th
ou
san
d T
on
nes

© SKF Group 18 April 2023
Data Analysis – Method 1: Forecast of steel production
Slide 55
Steel production = 8983 + 1.0 (Steel Export)

© SKF Group 18 April 2023
Data Analysis – Method 1: Forecast of steel production (cont)
Slide 56
1991
1993
1995
1997
1999
2001
2003
2005
2007
2009
2011
2013
2015
2017
2019
0
5000
10000
15000
20000
25000
Taiwanese Predicted vs. Actual Steel Production (Method 1)
Predicted steel production
Actual Steel Production
Th
ou
san
d t
on
nes
© SKF Group 18 April 2023
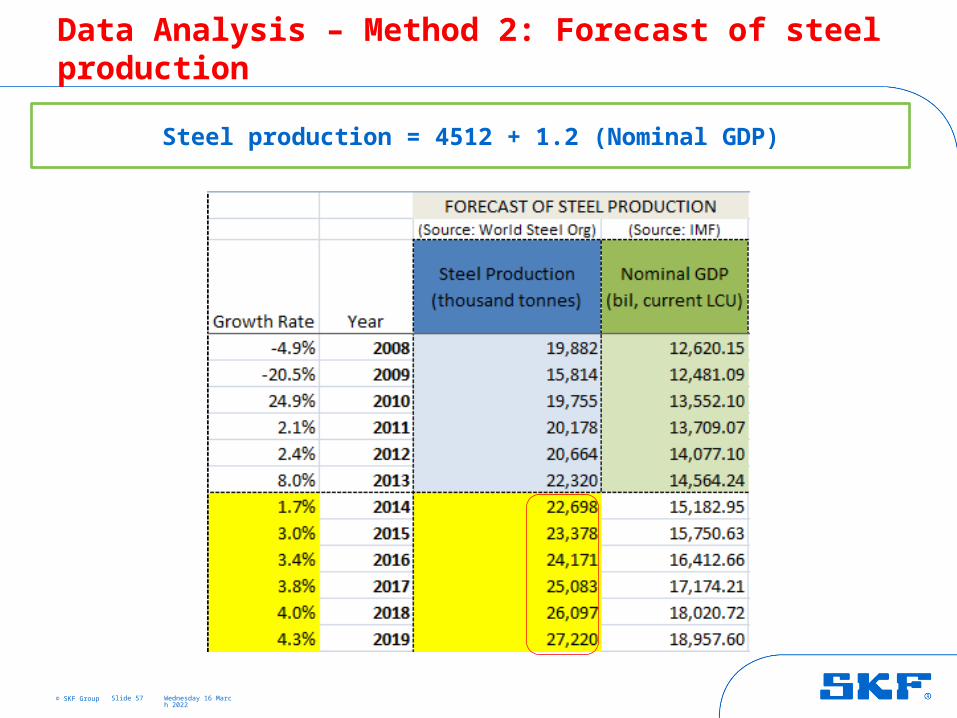
Data Analysis – Method 2: Forecast of steel production
Slide 57
Steel production = 4512 + 1.2 (Nominal GDP)
© SKF Group 18 April 2023
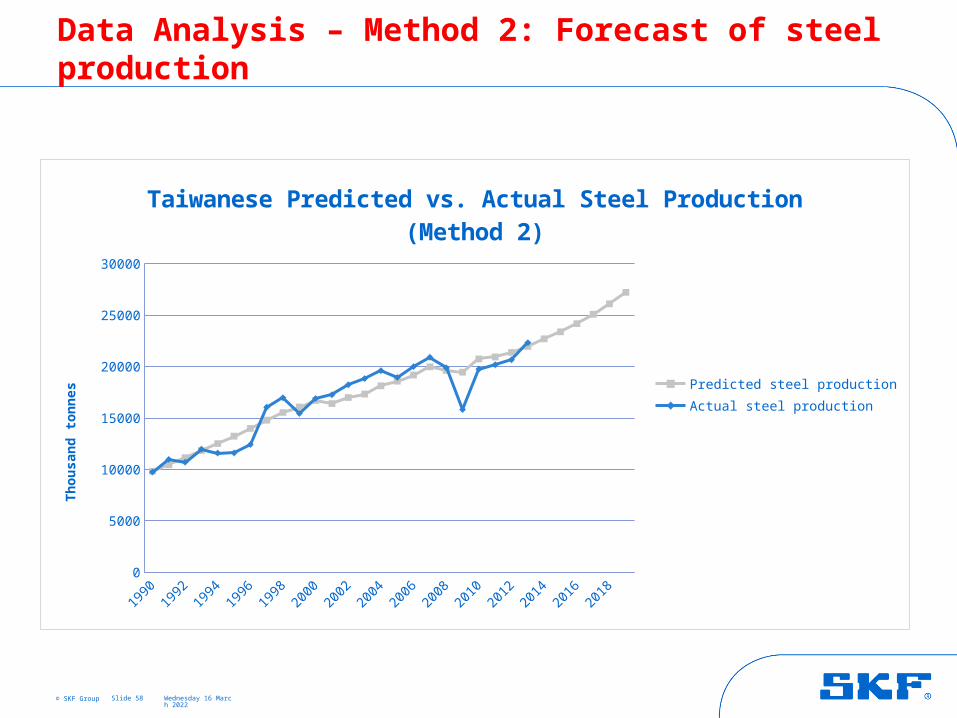
Data Analysis – Method 2: Forecast of steel production
Slide 58
1990
1992
1994
1996
1998
2000
2002
2004
2006
2008
2010
2012
2014
2016
2018
0
5000
10000
15000
20000
25000
30000
Taiwanese Predicted vs. Actual Steel Production (Method 2)
Predicted steel production
Actual steel production
Th
ou
san
d t
on
nes
© SKF Group
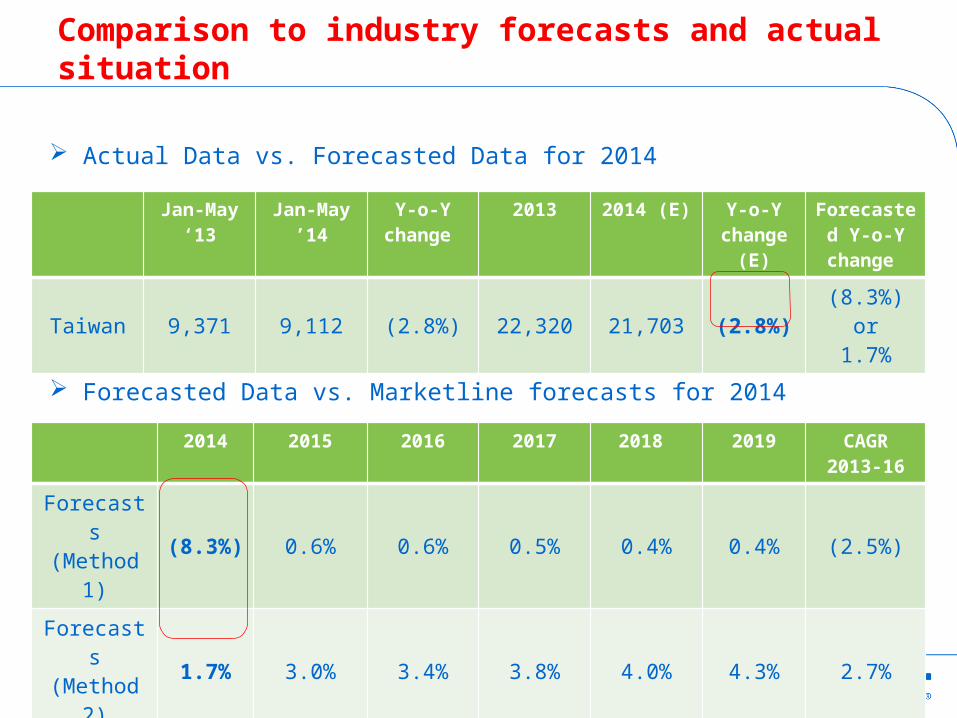
Comparison to industry forecasts and actual situation
18 April 2023Slide 59
Jan-May ‘13
Jan-May ’14
Y-o-Y change
2013 2014 (E) Y-o-Y change
(E)
Forecasted Y-o-Y
change
Taiwan 9,371 9,112 (2.8%) 22,320 21,703 (2.8%) (8.3%) or1.7%
2014 2015 2016 2017 2018 2019 CAGR2013-16
Forecasts (Method 1) (8.3%) 0.6% 0.6% 0.5% 0.4% 0.4% (2.5%)
Forecasts (Method 2) 1.7% 3.0% 3.4% 3.8% 4.0% 4.3% 2.7%
Marketline 6.1% 2.7% 6.5% 5.1% 5.1%
Actual Data vs. Forecasted Data for 2014
Forecasted Data vs. Marketline forecasts for 2014

Analysis of Vietnam
18 April 2023Slide 60

© SKF Group 18 April 2023
Data Analysis – Predictor Variables
Slide 61
Steel Production Nominal GDP (bil current LCU)
1987
1989
1991
1993
1995
1997
1999
2001
2003
2005
2007
2009
2011
2013
0
2,000
4,000
6,000
8,000
10,000
12,000
14,000
Vietnamese Steel Production, Consumption, Export & Import(Source: World Steel Org)
Steel production (thousand tonnes)
Steel Consumption (thousand tonnes)
Steel Import (thousand tonnes)
Steel Export (thousand tonnes)
tho
usa
nd
to
nn
es
© SKF Group 18 April 2023
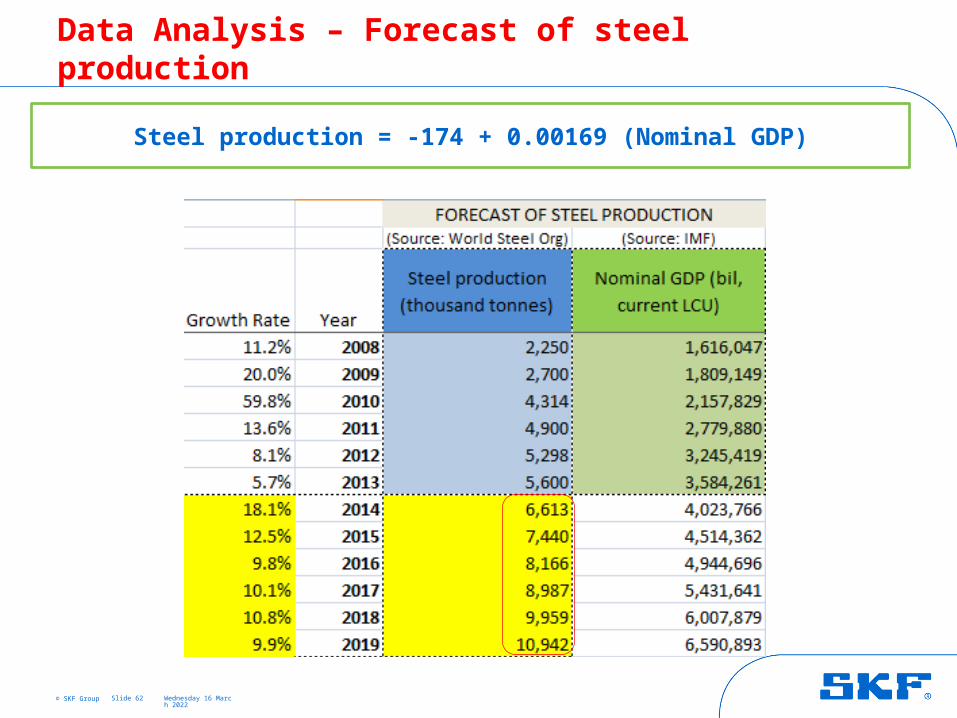
Data Analysis – Forecast of steel production
Slide 62
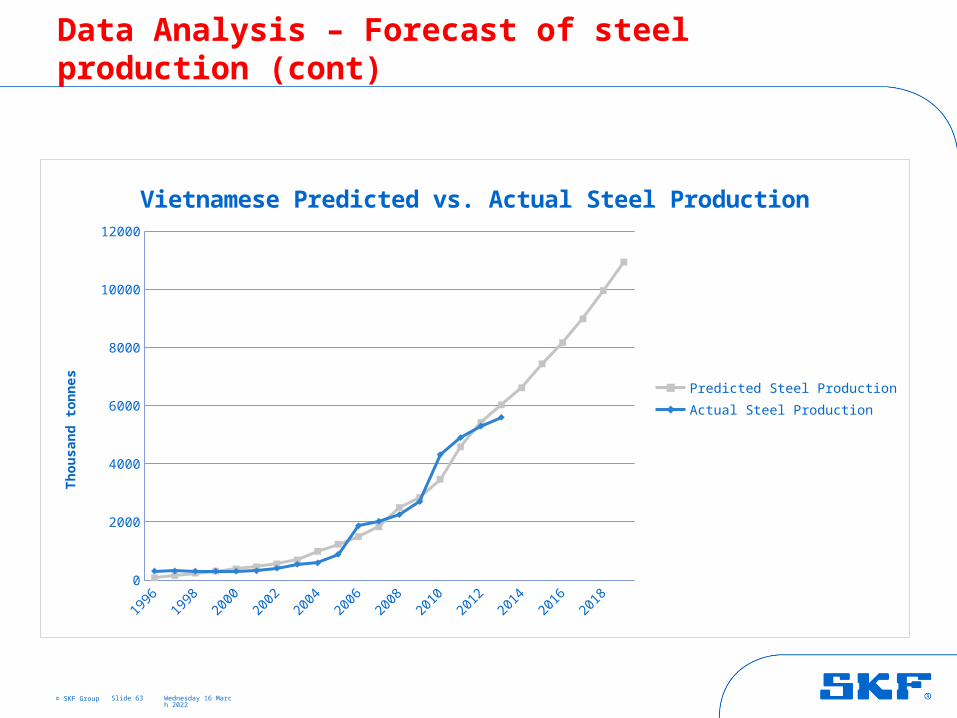
Steel production = -174 + 0.00169 (Nominal GDP)
© SKF Group 18 April 2023
Data Analysis – Forecast of steel production (cont)
Slide 63
1996
1997
1998
1999
2000
2001
2002
2003
2004
2005
2006
2007
2008
2009
2010
2011
2012
2013
2014
2015
2016
2017
2018
2019
0
2000
4000
6000
8000
10000
12000
Vietnamese Predicted vs. Actual Steel Production
Predicted Steel Production
Actual Steel Production
Th
ou
san
d t
on
nes