metallic amorphous thin films and...
TRANSCRIPT

ACTAUNIVERSITATIS
UPSALIENSISUPPSALA
2015
Digital Comprehensive Summaries of Uppsala Dissertationsfrom the Faculty of Science and Technology 1218
Metallic Amorphous Thin Filmsand Heterostructures with TunableMagnetic Properties
ATIEH ZAMANI
ISSN 1651-6214ISBN 978-91-554-9139-0urn:nbn:se:uu:diva-239950

Dissertation presented at Uppsala University to be publicly examined in 10134,Ångströmlaboratoriet, Polacksbacken, Uppsala, Friday, 27 February 2015 at 10:15 for thedegree of Doctor of Philosophy. The examination will be conducted in English. Facultyexaminer: Prof. Yves Idzerda (Montana state university).
AbstractZamani, A. 2015. Metallic Amorphous Thin Films and Heterostructures with TunableMagnetic Properties. Digital Comprehensive Summaries of Uppsala Dissertations from theFaculty of Science and Technology 1218. 60 pp. Uppsala: Acta Universitatis Upsaliensis.ISBN 978-91-554-9139-0.
The primary focus of this thesis is to study the effect of doping on magnetic propertiesin amorphous Fe100−xZrx alloys. Samples with compositions of x = 7,11.6 and 12 at.% wereimplanted with different concentrations of H. Moreover, the samples with a compositionof x = 7 at.% were also implanted with He, B, C and N. Magnetic measurements wereperformed, using SQUID magnetometry and MOKE, in order to compare the as-grown and theimplanted films. The Curie temperature (Tc) increases and the coercivity (Hc) decreases, withincreasing dopant volume. We also found that Hc increases with temperature for B and C dopedsamples. Magnetization curves at low temperature validate the presence of non-collinear spinconfigurations in the as-grown films, which is suppressed after doping, resulting in films withtunable soft magnetic properties. We have also studied the effect of interlayer mixing and finitesize effects on FeZr in Fe92Zr8/AlZr multilayer films, and found an anomalous increase of Tc
with decreasing thickness.Strain induced changes in the magnetization of an amorphous Co95Zr5 film at the orthorhombic
phase transition of the BaTiO3 substrate, was also studied. The results show that structuralmodifications of the substrate increases the stress and hence changes the magnetic anisotropyin the amorphous Co95Zr5 layer.
Finally, the magnetization reversal of Co and CoX heterostructures, with X being Cr, Fe, Ni,Pd, Pt and Ru, has been studied. For this purpose a synthetic antiferromagnet structure, FM/NM/FM, was used, where FM is a ferromagnetic Co or CoX layer and NM is a nonmagnetic Ruspacer layer. The FM layers are coupled antiferromagnetically across the NM layer. For a rangeof FM layer thicknesses, the exchange stiffness parameter Aex and the interlayer coupling (JRKKY )of the Co or CoX layers were obtained. This is done by fitting M(H) curves, measured by SQUIDmagnetometry, to a micromagnetic model. The alloying in CoX resulted in a decreasing Aex andalso a reduced MS. The experimental results are in a good agreement with DFT calculations.
Keywords: Amorphous, Thin Film, Magnetic properties, FeZr alloys, Ion implantation
Atieh Zamani, Department of Physics and Astronomy, Materials Physics, 516, UppsalaUniversity, SE-751 20 Uppsala, Sweden.
© Atieh Zamani 2015
ISSN 1651-6214ISBN 978-91-554-9139-0urn:nbn:se:uu:diva-239950 (http://urn.kb.se/resolve?urn=urn:nbn:se:uu:diva-239950)


List of papers
This thesis is based on the following papers, which are referred to in the textby their Roman numerals.
I Tuning magnetic properties by hydrogen implantation in
amorphous Fe100−xZrx thin films
Atieh Zamani, Anders Hallén, Per Nordblad, Gabriella Andersson,Björgvin Hjörvarsson and Petra E. JönssonJournal of Magnetism and Magnetic Materials, 346, 138-141 (2013)
II Magnetic properties of light ion implanted amorphous Fe93Zr7films
Atieh Zamani, Reda Moubah, Martina Ahlberg, Henry Stopfel, UnnarArnalds, Anders Hallén, Gabriella Andersson, Björgvin Hjörvarssonand Petra E. Jönsson(Submitted to Journal of Applied Physics)
III Soft Room-Temperature Ferromagnetism of Carbon-Implanted
Amorphous Fe93Zr7 Films
Reda Moubah, Atieh Zamani, Anders Olsson, Shengwei Shi, AndersHallén, Stefan Carlson, Dimitri Arvanitis, Per Nordblad, BjörgvinHjörvarsson, and Petra E. JönssonApplied Physics Express, 6, 053001 (2013)
IV Origin of the anomalous temperature dependence of coercivity in
soft ferromagnets
Reda Moubah, Martina Ahlberg, Atieh Zamani, Anders Olsson, S. Shi,Z. Sun, Stefan Carlson, Anders Hallén, Björgvin Hjörvarsson, andPetra E. JönssonJ. Appl. Phys. 116, 053906 (2014)
V Reversed interface effects in amorphous FeZr/AlZr multilayers
Martina Ahlberg, Atieh Zamani, Erik Östman, Hossein Fashandi,Björgvin Hjörvarsson and Petra E. JönssonPhys. Rev. B. 90, 184403 (2014)
VI Strain induced changes in magnetization of amorphous Co95Zr5based multiferroic heterostructures
Reda Moubah, Fridrik Magnus, Atieh Zamani, Vassilios Kapaklis, PerNordblad, and Björgvin HjörvarssonAIP Advances, 3, 022113 (2013)
VII Effects of substitution on the exchange stiffness and magnetization
of Co films
C. Eyrich, A. Zamani, W. Huttema, M. Arora, D. Harrison, F. Rashidi,D. Broun, B. Heinrich, O. Mryasov, M. Ahlberg, O. Karis, P. E.Jönsson, M. From, X. Zhu and E. GirtPhys. Rev. B. 90, 235408 (2014)
Reprints were made with permission from the publishers.
Papers not included:
I coauthored the following articles that are not included in this thesis:
Intense Quantum Confinement Effects in Cu2O Thin Films
Panagiotis Poulopoulos, Sotirios Baskoutas, Spiridon D. Pappas, Chris-tos S. Garoufalis, Sotirios A. Droulias, Atieh Zamani, and Vassilios Ka-paklisJournal of Physical Chemistry C, 115, 14839-14843 (2011)
Using light transmission to watch hydrogen diffuse
Gunnar K. Pálsson, Andreas Bliersbach, Max Wolff, Atieh Zamani, andBjörgvin HjörvarssonNature Communications 3, 892 (2012)
Thermally driven redistribution of phases and components in Cu/Sn
thin films
Anna Oleshkevych, Atieh Zamani, Igor Kotenkob, Svitlana Voloshkob,Sergey Sidorenkob, and Adrian R. RennieJournal of Alloys and Compounds, 535, 108-113 (2012)
Broadband ferromagnetic resonance system suitable for a wide range
of ultrathin films
Eric Montoya, Tommy McKinnon, Atieh Zamani, Erol Girt, and BretHeinrichJournal of Magnetism and Magnetic Materials 356, 12-20 (2014)
Comments on my own participation
I Responsible for the sample preparation, structural and magnetic measure-ments and manuscripts preparation.

II Responsible for the sample preparation and magnetic measurements andmanuscripts preparation.
III Responsible for the sample preparation and magnetic measurements.IV Responsible for the sample preparation and took part in structural and
magnetic measurements.V Responsible for sample preparation and took part in structural and mag-
netic characterizations.VI Took part in sample preparation.
VII Took part in sample preparation, structural and magnetic characterizationsand data analysis.

Contents
1 Introduction . . . . . . . . . . . . . . . . . . . . . . . . . . . . . . . . . . . . . . . . . . . . . . . . . . . . . . . . . . . . . . . . . . . . . . . . . . . . . . . . . . . . . . . . . . . . . . . . 11
2 Magnetic Properties . . . . . . . . . . . . . . . . . . . . . . . . . . . . . . . . . . . . . . . . . . . . . . . . . . . . . . . . . . . . . . . . . . . . . . . . . . . . . . . . . . . 142.1 Exchange Interaction and magnetic ordering . . . . . . . . . . . . . . . . . . . . . . . . . . . . . . . 15
Interlayer Exchange Coupling . . . . . . . . . . . . . . . . . . . . . . . . . . . . . . . . . . . . . . . . . . . . . . . . . . . . . . . 172.2 Exchange Stiffness Constant . . . . . . . . . . . . . . . . . . . . . . . . . . . . . . . . . . . . . . . . . . . . . . . . . . . . . . . . . 182.3 Magnetism of 3d metals and alloys . . . . . . . . . . . . . . . . . . . . . . . . . . . . . . . . . . . . . . . . . . . . . . 192.4 Anisotropy and Demagnetization Energies . . . . . . . . . . . . . . . . . . . . . . . . . . . . . . . . . . 222.5 A Micromagnetic Model . . . . . . . . . . . . . . . . . . . . . . . . . . . . . . . . . . . . . . . . . . . . . . . . . . . . . . . . . . . . . . . 242.6 Critical exponents and thin films . . . . . . . . . . . . . . . . . . . . . . . . . . . . . . . . . . . . . . . . . . . . . . . . . . . 26
3 Sample Preparation and Material Composition Analysis . . . . . . . . . . . . . . . . . . . . . . . 273.1 Sample deposition by magnetron sputtering . . . . . . . . . . . . . . . . . . . . . . . . . . . . . . . . 273.2 Rutherford Backscattering Spectroscopy . . . . . . . . . . . . . . . . . . . . . . . . . . . . . . . . . . . . . 283.3 Ion Implantation . . . . . . . . . . . . . . . . . . . . . . . . . . . . . . . . . . . . . . . . . . . . . . . . . . . . . . . . . . . . . . . . . . . . . . . . . . . . . 30
4 Sample Structural Characterization . . . . . . . . . . . . . . . . . . . . . . . . . . . . . . . . . . . . . . . . . . . . . . . . . . . . . . . . . . 334.1 Thin film thickness from X-ray reflectivity (XRR) . . . . . . . . . . . . . . . . . . . . . 33
5 Magnetic Characterization . . . . . . . . . . . . . . . . . . . . . . . . . . . . . . . . . . . . . . . . . . . . . . . . . . . . . . . . . . . . . . . . . . . . . . . . 35SQUID Magnetometry . . . . . . . . . . . . . . . . . . . . . . . . . . . . . . . . . . . . . . . . . . . . . . . . . . . . . . . . . . . . . . . . . . . 35MOKE Magnetometry . . . . . . . . . . . . . . . . . . . . . . . . . . . . . . . . . . . . . . . . . . . . . . . . . . . . . . . . . . . . . . . . . . . 35Magnetic Measurements . . . . . . . . . . . . . . . . . . . . . . . . . . . . . . . . . . . . . . . . . . . . . . . . . . . . . . . . . . . . . . . . 37
6 Summary of Results . . . . . . . . . . . . . . . . . . . . . . . . . . . . . . . . . . . . . . . . . . . . . . . . . . . . . . . . . . . . . . . . . . . . . . . . . . . . . . . . . . 416.1 Paper I, II, III, IV and V . . . . . . . . . . . . . . . . . . . . . . . . . . . . . . . . . . . . . . . . . . . . . . . . . . . . . . . . . . . . . . . . 416.2 Paper VI . . . . . . . . . . . . . . . . . . . . . . . . . . . . . . . . . . . . . . . . . . . . . . . . . . . . . . . . . . . . . . . . . . . . . . . . . . . . . . . . . . . . . . . . . . 456.3 Paper VII . . . . . . . . . . . . . . . . . . . . . . . . . . . . . . . . . . . . . . . . . . . . . . . . . . . . . . . . . . . . . . . . . . . . . . . . . . . . . . . . . . . . . . . . . 47
7 Summary and Conclusion . . . . . . . . . . . . . . . . . . . . . . . . . . . . . . . . . . . . . . . . . . . . . . . . . . . . . . . . . . . . . . . . . . . . . . . . . 50
8 Outlook . . . . . . . . . . . . . . . . . . . . . . . . . . . . . . . . . . . . . . . . . . . . . . . . . . . . . . . . . . . . . . . . . . . . . . . . . . . . . . . . . . . . . . . . . . . . . . . . . . . . . . . 51
9 Summary in Swedish . . . . . . . . . . . . . . . . . . . . . . . . . . . . . . . . . . . . . . . . . . . . . . . . . . . . . . . . . . . . . . . . . . . . . . . . . . . . . . . . . 52
10 Acknowledgement . . . . . . . . . . . . . . . . . . . . . . . . . . . . . . . . . . . . . . . . . . . . . . . . . . . . . . . . . . . . . . . . . . . . . . . . . . . . . . . . . . . . . 54
References . . . . . . . . . . . . . . . . . . . . . . . . . . . . . . . . . . . . . . . . . . . . . . . . . . . . . . . . . . . . . . . . . . . . . . . . . . . . . . . . . . . . . . . . . . . . . . . . . . . . . . . . 56


1. Introduction
Magnetism has been known since ancient times, when the property of mag-netism in lodestone mineral was discovered in Greece. To reveal and use thehidden forces of magnetism has since been an obsession to scientists. Theearly studies of magnetism gave a basis for understanding the origin of ferro-magnetism in metals such as Fe, Co and Ni. In general, pure single elementmetals are rarely used in applications. This is because any specific propertyof a metal can usually be tailored by alloying one or several other elements.Sometimes, these added elements not only affect the physical properties butcan also change the crystal structure, and amorphous alloys are a typical exam-ple of that. In amorphous (non-crystalline) solids, the positions of the atomsdo not form a well defined pattern, therefore, the amorphous solid lacks longrange order and has order only within a short-range (atomic-scale). [1–3] Thustheir internal random structure resembles a fluid but their external structure ex-hibits the rigidity of a solid. [4]
Metallic amorphous alloys were first synthesized in the 1960’s. The processrequired extremely fast cooling of the alloy melt (105 K/s) in such a way thatduring the solidification there is not enough time for ordering of the atoms intoa crystalline form. [4–6] The first amorphous and ferromagnetic alloy with asubstantial magnetization, Fe75P15C10, was prepared and reported by Duwezand Lin in 1967. [7]
There are several techniques to produce amorphous materials, such as con-densation of metal vapors and sputtering techniques. Recently, materials engi-neering has produced alloys which can be cooled by a few K/s and still exhibitan amorphous structure and therefore allows for the production of much largeramorphous structures. [8] Alloys that can be formed into an amorphous struc-ture at slow cooling rates are often called bulk metallic glasses (BMG). [4–6,9]Bulk metallic glasses contain two or more elements that show geometric sizedifferences between the constituent elements, where this size difference facil-itates the formation of the amorphous phase. Ferromagnetic amorphous al-loys are formed by combining transition metals (Fe, Co, Ni) with good glass-formers such as Zr and Pd. [10, 11] Systematic studies have been performedand multicomponent Fe [12]-, Ni [13]-, Al [14]-, Mg [15]- based bulk metallicglasses have been discovered and extensively investigated. The exact chemi-cal compositions of these compounds strongly influence the amorphization. Inthe present work, the formation of metallic amorphous iron is stabilized due tothe addition of Zr atoms in the growth process. Already a small amount of Zraddition (about 7 at. % [16,17]), is enough to form amorphous Fe100−xZrx due
11

Figure 1.1. Two-dimensional illustration of (a) substitutional disorder in a crystallinelattice, (b) atomic structure of a binary amorphous metallic alloy.
to the size-mismatch between these two elements, where the Zr atomic size isconsiderably larger than Fe.
Disorder is one of the main characteristics of amorphous alloys. An ex-ample of disorder within crystalline materials is chemical or substitutionaldisorder, illustrated in Fig. 1.1(a). Here the crystal structure is still preserveddespite the presence of the solute atoms. The atomic arrangements in amor-phous materials, illustrated in Fig. 1.1(b), have no long-range order, but stillshows short-range ordering between the near neighbors. Since amorphoussolids lack the basic unit cell found in crystalline structures, they cannot bedefined by the use of primitive vectors and a basis set. They can however bedescribed by the average number of atoms that are distributed within a shellof radius r around a central atom, as indicated in Fig. 1.1(b). Experimentally,determining atomic-level structure of amorphous materials is not an easy task.One may look at how the probability of finding atoms varies as a function ofdistance from a given reference atom, which defines the radial distribution.Specifically, it provides information on bond distances and the coordinationnumber of atoms located at various distances from a central atom. For struc-tural characterization in amorphous FeZr, this type of analysis has mainly beenused to obtain structural insight on the overall amorphous nature of our sam-ples.
Due to the spatial homogeneity of the disordered atomic structure, the amor-phous alloys ideally should exhibit isotropic magnetic properties. [18–21] Onthe other hand, in crystalline and nano-crystalline materials, the presence ofcrystalline grains strongly affect the magnetic properties. [22] This leads toa grain size effect on the magnetic hardness (the coercivity, Hc), where, inthe range 10-100 nm, the coercivity rapidly decreases with decreasing grainsize. [23–26] Both amorphous and nanocrystalline magnetic metallic materi-als are thus useful for applications that require soft magnetic properties. Forinstance, bulk Fe-based amorphous alloys are of potential use in inductors [8],in high power transformers [27], and magnetocaloric applications [28]. Since
12
such alloys can exhibit varying degrees of short-range order, from purelyamorphous to nanocrystalline, their properties are adjustable in a way thatis impossible for a crystalline bulk material. [18–21] The amorphous alloysalso exhibit properties which are very interesting for micro- and nano-scalepatterning. This is due to their lack of crystalline order and associated defectssuch as dislocations, hence there are no grain boundaries or lateral imperfec-tions that limit the structuring. Also, amorphous metals can be found in vari-ous applications such as sport equipment, and scalpels due to their mechanicalproperties. [8, 29]
In the field of material science, the ability to affect material properties bydecreasing the material thickness has had immense importance. [30–32] Thinfilms provide a good platform to study the properties of matter and has been thegeometry of many samples studied in this thesis. Thin film technology is todayused in many applications and is especially interesting for microelectronic andmagnetic recording-devices, having properties that are very sensitive to thethickness. [33, 34]
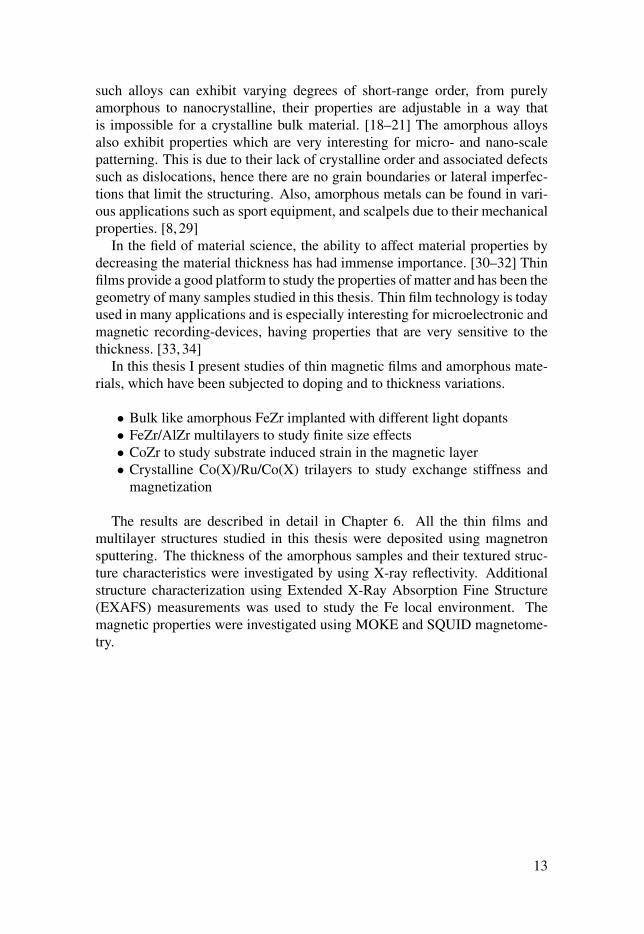
In this thesis I present studies of thin magnetic films and amorphous mate-rials, which have been subjected to doping and to thickness variations.
• Bulk like amorphous FeZr implanted with different light dopants• FeZr/AlZr multilayers to study finite size effects• CoZr to study substrate induced strain in the magnetic layer• Crystalline Co(X)/Ru/Co(X) trilayers to study exchange stiffness and
magnetization
The results are described in detail in Chapter 6. All the thin films andmultilayer structures studied in this thesis were deposited using magnetronsputtering. The thickness of the amorphous samples and their textured struc-ture characteristics were investigated by using X-ray reflectivity. Additionalstructure characterization using Extended X-Ray Absorption Fine Structure(EXAFS) measurements was used to study the Fe local environment. Themagnetic properties were investigated using MOKE and SQUID magnetome-try.
13

2. Magnetic Properties
Magnetism in solids can largely be reduced to atomic scale properties. Theearly description of magnetism was based on the magnetic field created bycharge traveling in a circular orbit around the nucleus of an atom. This mag-netic moment is associated with the orbital motion of electrons, called orbitalmagnetic moment. Moreover, electrons possess an intrinsic magnetic moment,called spin. The total magnetization of a material is therefore provided by thesum of these two principal sources, as illustrated in Fig. 2.1.
Figure 2.1. Picture of magnetism in the atomic level, illustrating the orbital and spincontributions to the magnetic moment.
The total magnetic moment of an atom is determined by the sum of mag-netic moments from all of its electrons. However, the inner electron shells willbe fully occupied. Since there is an equal amount of spin up and spin downstates in every shell, the magnetic moments in the filled shells are cancelledout. Therefore, only the outermost not fully occupied shell (or shells) is ofinterest for magnetic properties. For the 3d transition ferromagnetic metals(Fe, Co and Ni), there is an unfilled d-shell that has five orbitals, each can be
14
filled by two electrons. According to the Pauli exclusion principle, two elec-trons within one orbital must have opposite spin directions. The occupationof these orbitals for single atoms is determined by Hund’s rules. [35] Basedon Hund’s first rule, parallel spins will try to singly occupy different orbitalsand remain unpaired before any orbital becomes doubly occupied. This is nolonger valid once the single atom is placed within a bulk solid since the mag-netic moments are not isolated from one another and the interaction betweenthem is considerable.
Considering a crystal lattice, the surrounding electric field of the crystal, i.e.the electric field that one atom feels in the vicinity of other atoms, needs to betaken into account. A very important consequence of this is a quenched orbitalmagnetic moment. For example in 3d metals, the orbital magnetic moment issmall and the magnetization is mainly carried by spin moments. In a simplis-tic picture the quenched orbital magnetic moment is associated with a new setof orbitals, due to breaking of spherical symmetry inside the crystal. Impor-tantly, these new orbitals have zero orbital angular momentum and thereforeno orbital magnetic moment. However, spin-orbit coupling will generate thesmall orbital magnetic moment found in 3d metals. Spin-orbit coupling willalso couple the spin magnetic moment to the lattice. The symmetry of thelattice then determines the preferred magnetization direction (the easy axisdirections), known as the magnetocrystalline anisotropy. [36–38]
There are two especially important models when describing the magneticbehavior of materials: the Heisenberg model and the Stoner model. TheHeisenberg model describes the exchange interactions between localized mag-netic moments and Stoner model describes the interaction between itinerantmoments (delocalized moments). The two different models are successful indescribing different aspects of magnetic properties. For instance Stoner modelcan describe the formation of magnetic moments however it does not describethe temperature effects very well, while the Heisenberg model can capturelocal variations in magnetic interactions and can estimate the ferromagneticordering temperature (TC). We begin with a discussion on Heisenberg modeland itinerant behavior will be discussed in section 2.3.
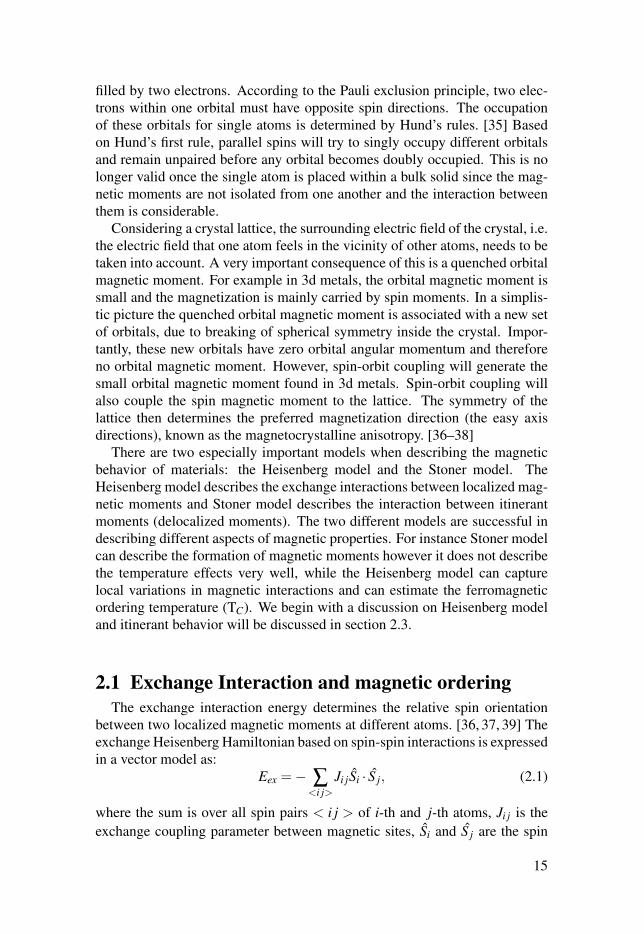
2.1 Exchange Interaction and magnetic ordering
The exchange interaction energy determines the relative spin orientationbetween two localized magnetic moments at different atoms. [36, 37, 39] Theexchange Heisenberg Hamiltonian based on spin-spin interactions is expressedin a vector model as:
Eex =− ∑<i j>
Ji jSi · S j, (2.1)
where the sum is over all spin pairs < i j > of i-th and j-th atoms, Ji j is theexchange coupling parameter between magnetic sites, Si and S j are the spin
15

unit vectors of atoms at sites i and j respectively. [36] If Ji j has a positivevalue, the lowest energy state results from a parallel alignment of the spinmoments which gives rise to ferromagnetic (FM) order. If Ji j has a negativevalue, the spins of adjacent atoms align antiparallel, i.e., giving rise to anti-ferromagnetic (AF) order. The Heisenberg model is strictly speaking validfor magnetic insulators where the magnetic moments are localized at atomicsites and where these local magnetic moments are coupled by a pair exchangeinteraction. However, it can also be applied to 3d transition metals.
The Bethe-Slater curve (Fig. 2.2) qualitatively describes the variations instrength of the direct exchange as a function of the ratio of the interatomicseparation (D) to the radius of the 3d shell (d). [40] The main trend can be ex-plained by using a simple pair interaction of two atoms sharing two electrons.For the parameter D/d <1.5 the electrons from two neighboring atoms areforced to stay close to each other and the Pauli exclusion principle requires thespins of electrons to be antiparallel, which will result in an antiferromagneticinteraction between the atoms. Once the D/d ratio increases, 3d electronsmove away from each other, occupying two different orbital states. Therefore,a ferromagnetic state with the exchange coupling (J) becoming increasinglypositive, is allowed. After reaching a maximum, the exchange coupling startsto decrease due to a decreasing spatial overlap of the wave functions of theelectrons. At large interatomic distances, the atoms cannot feel each otherspresence, hence the exchange energy goes to zero. As an example, the ex-change interaction between Fe atoms is very sensitive to their interatomic dis-tance and generally shows an increased ferromagnetic (FM) interaction withincreasing atomic separation.
The Curie temperature is proportional to the pair exchange interaction en-ergy J, [41]
TC =J ·Z · �S�2
3kB, (2.2)
where J =�Ji j(ri j)
�is the mean value of the exchange coupling parameter,
Z is the coordination number, �S� is the magnitude of the magnetic momentand kB is the Boltzmann constant. The ferromagnetic transition temperature istherefore determined by the exchange interactions, where a stronger exchangeinteraction leads to a higher TC. [39] According to the Bethe-Slater curve,the exchange interaction for Fe is around the zero-crossing point of the curveand increases almost linearly with increased interatomic separation and alsochanges the sign from negative to positive. E.g., fcc-Fe is AF with a Néeltemperature of 70K, while bcc-Fe is FM with a Curie temperature of 1043K.[42]
The amorphous Fe100−xZrx system has been considered as a model systemto study the magnetic properties of Fe in an amorphous environment. [43–55]It behaves as a ferromagnet, due to a dominance of FM direct exchange cou-
16

Figure 2.2. The Bethe-Slater curve, shows the dependence of the exchange interactionon the ratio of interatomic separation to the diameter of the 3d shell. [40]
pling, even though the atomic arrangement allows a co-existence of both FMand AF exchange interactions due to variations of the Fe-Fe interatomic dis-tances. The atoms at the shortest distance are antiferromagnetically coupledand the more distant ones are ferromagnetically coupled. This inhomogeneityof magnetic interactions creates an exchange frustration, which leads to non-collinear ferromagnetism in amorphous FeZr. Figures 2.3 a and b summarizesthe values of TC and MS, respectively, for several studies of the amorphousFe100−xZrx system. The magnetic ordering temperature and the magnetic mo-ment of Fe100−xZrx are both dependent on the alloy composition. The Curietemperature and saturation moment increases with Fe concentration, up to amaximum value at about x ∼13. For low Zr concentrations (x < 13), the an-tiferromagnetic interactions rises with increased Fe concentration and makesit harder to reach the saturation magnetization. Also, since the average J de-creases, the TC goes down as well. Furthermore, there are varying resultsregarding the evolution of the magnetic moment per Fe atom, as indicated bymeasurements using very high magnetic fields (up to 11T), showing an in-crease of the as determined moment above the composition of x ∼13 (see Fig.2.3 b). [45, 48–55]
Interlayer Exchange Coupling
Layered structures consisting of two magnetic layers separated by a metallicnon-magnetic spacer layer, are found to experience an interlayer exchange
17

40 50 60 70 80 90 1000
40
80
120
160
200
240
280 our groupbuschow81shirakawa83fukamichi81castano97coey84heiman79unruh84ryan87ma91T C
(K)
Fe (at%)
a40 50 60 70 80 90 100
0.0
0.5
1.0
1.5
2.0
2.5heiman79heiman79fukamichi81shirakawa83coey84unruh84ryan87castano97buschow81
Mag.mom.(µ B/Fe)
Fe (at%)
b
Figure 2.3. Literature results on a) the Curie temperature and b) the magnetic momentin amorphous Fe100−xZrx. [43–55]
coupling of Ruderman-Kittel-Kasuya-Yosida (RKKY) type. The interlayerexchange coupling energy [56, 57]
ERKKY = JRKKY · Mi · Mj, (2.3)
depends on the exchange coupling constant JRKKY and the angle between thedirections of the magnetic moments in the two magnetic layers at their respec-tive spacer layer interface. Mi and Mj are the unit vectors for the magnetizationat layer i and layer j, respectively. RKKY interaction between the magneticlayers is mediated by spin polarization of conduction electrons in the metal-lic spacer layer. The coupling strength is given by JRKKY , which oscillates insign as a function of the non-magnetic spacer thickness, i.e. leading to eithera parallel or antiparallel magnetization alignment of the magnetic layers withrespect to each other. [56, 57]
2.2 Exchange Stiffness Constant
The coupling term J from Equation 2.1 is a measure of the interactionstrength between the two neighboring atomic spins, which does not considerthe number of nearest neighbor pairs. To describe how variation in magnetiza-tion directions between atoms, for example in domain walls, evolve spatiallythere exists a parameter called exchange stiffness constant (Aex). [39] The ex-change stiffness serves as a material specific parameter of a ferromagnet andit scales with the exchange energy (Eex). It can be derived from the Heisen-berg model by an appropriate averaging process using a magnetization densitywhich is slowly varying in space
Aex =nJ �S�2
a, (2.4)
18

where n is the number of nearest neighbors, and a is the interatomic latticeparameter. [39] This is for instance important when describing the exchangeenergy in spin waves, which have spatially varying directions of the magneti-zation. Moreover, Aex has important role in the magnetization reversal processand can be applied to spintronic devices, where the switching current densityis very sensitive to the exchange stiffness constant. Typically in a bulk sample,Aex can be quantified using experimental techniques like ferromagnetic reso-nance (FMR), Brillouin Light Scattering (BLS), or neutron scattering (NS) bymagnon excitations. The energy for such excitations is inversely proportionalto the film thickness. As a result, Aex is difficult to measure in thin films, sincethe mentioned techniques cannot probe the required energy range. Thereforea method has been developed [58] for estimating the exchange stiffness in thinfilms, which has been used in paper VII, by measuring the magnetization inantiferromagnetically coupled FM Co layers. The basis for this method is themicromagnetic model, described in detail in section 2.5.
2.3 Magnetism of 3d metals and alloys
Generally, the magnetic behavior of an atom in solids and compounds isdifferent from that of a single atom. This is because the exchange interac-tion will correlate the magnetic moments between neighboring atoms, so themagnetism becomes a collective effect. The only pure metals that are ferro-magnetic at room temperature are Fe, Co & Ni, which exhibit strong perma-nent (spontaneous) magnetization even in the absence of any applied magneticfield. The magnetic moment of these 3d-metals can only be explained by non-localized 3d electrons, as shown by Stoner. [35] These itinerant electrons canbe described by band structures as shown for bcc Fe in Fig. 2.4. The partiallyfilled d-bands are split into two sub-sets, which contains the majority (spin-up)and minority (spin-down) states. Stoner first proposed a basic model for de-scribing the itinerant ferromagnetism based on the partial occupation of thesestates. The occupation number (N) of electrons for each spin direction canbe expressed by: N↑↓ =
� EF−∞ D↑↓(E)dE, where D(E)↑↓ is either the majority
(↑) or minority (↓) electron density of states (DOS). Finally the magnetization(M) arises from the fact that there are more majority than minority electronsbelow the Fermi level (M = µB(N↑ −N↓)).
The Stoner criterion (N(εF) · Iex ≥ 1), where Iex is the Stoner exchange in-tegral, gives the necessary condition for ferromagnetism. [35] The d-bands oftransition metals have a large density of states at the Fermi level N(εF), whichis necessary for stabilizing a ferromagnetic order. However, a high DOS atthe Fermi level is not enough to establish ferromagnetism, there also needs toexist a sufficient exchange interaction (Iex). For Fe, Co and Ni the Stoner cri-terion is fulfilled, which gives an exchange splitting of about 1-2 eV between
19

Figure 2.4. Density of states (DOS) of bcc Fe, for both spin up (majority) and spindown (minority) states. The non-magnetic state and ferromagnetic state correspondto the dashed and solid lines, respectively. The Fermi level is indicated by εF . Thedensity of states at the Fermi level, in the non-magnetic state, is large enough to fulfillthe Stoner criterion. The figure is adopted from [35].
the spin sub-bands. This results in a large magnetic moment per atom andconsequently an appreciable magnetization.
The magnetization of these 3d metals can be controlled by alloying. The3d transition metal alloys (combining different transition metals) follow theSlater-Pauling curve, shown in Fig. 2.5. According to the Slater-Pauling curve,there is a relation between the magnetization (average magnetic moment) andthe number of valence electrons per atom. For the left side of the curve one canfind the weak ferromagnetic Fe based alloys, while the right side of the curveis based on the strong Co and Ni based alloys. Strong ferromagnet refers tothe case where the majority band (spin up) is fully occupied, while the weakferromagnet has empty states in the majority band which can be further filled.This is illustrated for bcc Fe (weak ferromagnet) in Fig. 2.4. The Fe magneticmoment for some selected Fe based compounds found in the Slater-Paulingcurve are shown in Table 2.1, where one finds that the Fe magnetic moment hasvariation depending on the crystalline structure, concentration and the alloyingelement. Since Fe generally has the highest magnetic moment, these values arehigher than the average magnetic moment per atom found in the Slater-Paulingcurve. As an example, for the case of Fe in Ni80Fe20, there is a significantenhanced magnetic moment compared to both fcc and bcc- Fe.
There is some degree of charge-transfer between the alloying element andthe host metal which can affect the magnetization. Similarly, it has been pro-posed that charge transfer from Zr to Fe in amorphous FeZr alloys has an
20

Figure 2.5. The Slater-Pauling curve shows how the net magnetic moment per atomvaries as a function of the number of valence electrons per atom. The figure is adoptedfrom [35].
Element Structure Ms(µB/Fe atom)Fe∗ fcc 1.5Fe bcc 2.23
Fe50Co50 bcc 2.7Fe90Ni10 bcc 2.41Ni80Fe20 fcc 2.7
Table 2.1. The magnetic moment per Fe atom for different Fe alloys. The resultsare for bulk samples [59–64], except for Fe∗ which is obtained from Fe grown onNi [60, 61].
impact on the magnetization. [65–67] As illustrated in Fig. 2.6, neither themajority or minority bands of Fe are completely filled, and the presence of Zrpartially fills these bands due to charge transfer. Therefore, the magnetic mo-ments of the amorphous FeZr alloys become smaller than those of the Slater-Pauling curve. After doping with C or B, these dopant atoms can act as ac-ceptors for electrons, as illustrated in Fig. 2.6. This can decrease the numberof electrons in the minority band, resulting in increased magnetic moment.Figure 2.6 illustrates the above descriptions, however it may not capture thefull complexity. Regarding the influence of other dopants in the amorphous
21

Figure 2.6. Density of states (DOS) of Fe to describe the magnetic properties ofamorphous Fe(Zr) and FeZr-B or -C alloys, where alloying will affect the occupationof spin up and down states.
FeZr system, it is not yet known if charge transfer effects has any influence onmagnetic properties.
2.4 Anisotropy and Demagnetization Energies
The magnetic anisotropy energy defines the directional dependence of mag-netic properties in a ferromagnet, and arises from two different effects: magne-tocrystalline anisotropy (MCA) and shape anisotropy. [39] MCA is an intrinsicproperty of a ferromagnet, that arises from the crystalline structure of the ma-terial. The energetically preferred direction for the magnetization is called theeasy axis. The easy and hard axis arise from the interaction of the spin mag-netic moment with the crystal lattice (through spin-orbit coupling). In Fig. 2.7,we show how the easy axis directions (red/grey arrows) direction depends onthe crystal structure and also how the magnetization generally depends on themagnetic field direction relative to the easy axis.
Figure 2.7. The easy axes and hard axes denotes the preferred and unfavorable direc-tions of the magnetization respectively. Magnetization is in the direction which corre-sponds to an energy minimum. For single-crystal hcp Co, the easy axis is parallel tothe hexagonal c-axis of the crystal. In bulk single-crystal bcc Fe (cubic anisotropy),the easy directions are <100> and the hard directions are <111>. [38]
22

When a material has only one easy axis, it is said to have uniaxial magneticanisotropy. According to eq. 2.5, the uniaxial anisotropy energy (EAn) can beidentified in terms of the anisotropy constants (Kui).
EAn =−Ku1(n · S)2 −Ku2(n · S)4 − ... (2.5)
where n is the direction of the easy axis and S the magnetization direction.EAn governs the energy cost of rotating the magnetization away from its easyaxis, which is consequently an influencing factor for the size and shape of thehysteresis curve in ferromagnetic materials. [39]
As an example, for the single-crystal hcp Co, the easy axis is parallel to thehexagonal c-axis of the crystal. At room temperature, Ku1 for Co is 2.1×10⁶
erg/cm3 and MS is 1247 emu/cm3 (paper VII), the anisotropy field (HK = 2Ku1Ms
)is then 3.4 kOe in the direction of the c-axis (Ku2 and higher order terms aresmall and can be neglected). The anisotropy field determines the effective fieldwhich is trying to line up the magnetic moment along the easy axis. Thereforeone needs an appreciable field in the bulk Co to rotate the magnetic momentaway from the c-axis.
The other effect one has to consider is shape anisotropy, which depends onthe shape of the sample. In a magnetic sample, the magnetic field produced bythe free poles at the exterior surface of the sample opposes the magnetizationin the sample, creating a demagnetizing (opposing) field of �Hdem = −N �M,where N is a tensor that depends on the sample shape. In the case of thin films,when the thickness of the film is very small compared to the lateral size, thedemagnetizing field becomes negligible for in-plane magnetization (N� = 0).When the magnetization is oriented perpendicular to the film surface, by anexternal field, then the magnetic surface charges create a strong demagnetizingfield (N⊥ = 4π) in the out-of-plane direction. For Co films fully saturatedalong the surface normal the demagnetization field is approximately
Hdem =−NMS = 4π ×1247 emu/cm3 = 15.7 kOe.(2.6)
As an example, for the thin Co films presented in paper VII, since the demag-netization field is four times larger than the anisotropy field perpendicular tothe film plane, the orientation of the magnetic moment will be in-plane.
The shape of a ferromagnetic material can change when the magnetizationis aligned along an external magnetic field. This phenomenon is called mag-netostriction. A related effect, called magnetoelastic anisotropy, occurs whenmagnetic materials are subjected to stress that can change the magnetizationdirection. [39] The magnetoelastic energy per unit volume in an isotropic elas-tic material with uniaxial stress σ , is given by [68]
Eme =−Kme(σ · S)2, where Kme =−32
λσ , (2.7)
23

where λ is the magnetostriction coefficient, σ is the unit vector along the stressand S is the unit vector along the magnetization. Magnetoelastic anisotropyplays an important role in thin magnetic films, since stress can be inducedby the substrate. [39] Magnetoelastic anisotropy in CoZr grown on BaTiO3 isstudied in paper VI.
2.5 A Micromagnetic Model
We have used a micromagnetic model [58] for obtaining the exchange stiff-ness of Co thin films studied in Paper VII. This model is based on the for-mation of spin spirals within two ferromagnetic layers that are antiferromag-netically coupled across a non-magnetic spacer layer. The magnetization isassumed to be in-plane, which is reasonable since the shape anisotropy in theCo layers is higher than the magnetocrystalline and surface anisotropies. Inthis model, each Co layer consists of N atomic planes, where each plane isacting as a macro spin that interacts only with its nearest neighbors throughthe direct exchange interaction shown in Fig. 2.8.
!!!!!!!!!!!!!!!!
!"#!!!$%!!!"#!!!$%!!!"#!
Figure 2.8. This figure qualitatively demonstrates the formation of exchange-spring inCoX(FM)/Ru(NM)/CoX(FM) trilayer, when subjected to an external magnetic field.An index i, is used for labeling the atomic planes in FM layers. As assumed by themicromagnetic model, the spins within each atomic plane rotate coherently. Thisfigure is re-printed from [69].
24

One should note that the micromagnetic model does not consider the mag-netocrystalline anisotropy (MCA) contribution. All the layers are texturedalong the [0001] direction of the hcp crystal structure, i.e. the [0001] easyaxis is oriented perpendicular to the film surface. Therefore, in-plane rotationof magnetic moment is not affected by the presence of MCA in CoX films,with X being Cr, Fe, Ni, Pd, Pt and Ru. Moreover it is assumed that the mag-netic moments in each atomic plane rotate coherently. By applying the fieldin-plane, the total energy per unit area is
EMag = ERKKY −Eex −Ez
ERKKY = JRKKY cos(θN −θN+1)
Eex =2Aex
d
�N−1
∑i=1
cos(θi −θi+1)+2N−1
∑i=N+1
cos(θi −θi+1)
�
Ez = MsHd2N
∑i=1
cos(θi),
(2.8)
where ERKKY is the (here antiferromagnetic) coupling between the ferromag-netic sub-layers separated by non-magnetic spacer layers. Eex refers to thedirect exchange interaction between nearest neighbor atomic planes. θi is themagnetization angle of plane i with respect to the applied magnetic field. Ezis the Zeeman energy acting on all magnetic atomic planes per unit area. H isthe applied magnetic field and d is the thickness of each magnetic layer.
In order to calculate M(H), first the magnetization angles of each sublayerwithin the Co layers as a function of the external field is determined. This canbe done by minimizing eq. 2.8 with respect to θi, i.e. ∂Emag
∂θi= 0. Since each
atomic layer forms its own angle with respect to the direction of the externalfield, one can calculate the total magnetic moment M(H) according to
M(H) =Ms
2N
2N
∑i=1
cos(θi), (2.9)
which can be directly compared to magnetization measurements. When H = 0,then θi =−π/2 for i = 1 to N and θi = π/2 for i = N+1 to 2N, and M(H) = 0due to the antiferromagnetic RKKY coupling across the non-magnetic spacer.The saturation magnetization MS was obtained by measuring M(H) in veryhigh fields using a sensitive magnetometer. The only remaining and unknownparameters in eq. 2.8 are Aex and JRKKY , which are used as fitting parameters.The fitted values of Aex, from paper VII are presented in section 6.3.
25

2.6 Critical exponents and thin films
Close to the magnetic phase transition, ferromagnetic systems exhibit criti-cal behavior that can be characterized by a set of critical exponents. The mag-netization (M), susceptibility (χ), and correlation length (ξ ), vary as powerlaws, in the vicinity of TC [38]:
M(T ) ∝(TC −T )β T < TC
χ(T ) ∝(T −TC)−γ T > TC
ξ ∝ | TC −T |−ν T �= TC
(2.10)
The spin correlation length (ξ ), is the maximum distance over which the mag-netic moments (or spins) are correlated. The critical exponents can be ob-tained, for example, from mean field calculations, which gives β = 1/2, γ = 1and ν = 1/2. [38]
Thin films consist of a single or a few layers of atoms, where the spatialdimension in the out-of-plane direction is much smaller than in the in-planedirection. The out-of-plane dimensional reduction leads to a reduced spincorrelation in that direction. The magnetic ordering temperature decreases dueto the geometric confinement and this is known as a finite size effect, which isrelated to the reduced spin-spin correlation length (ξ ). [30] The ferromagnettransition temperature then has a power law behavior
TC(d)/TC(∞) = 1− c0d−λ , (2.11)
where TC(∞) is the bulk Curie temperature and TC(d) is the transition temper-ature of the material with thickness d, c0 is a constant and λ = 1/ν is a shiftexponent. [70]
26

3. Sample Preparation and MaterialComposition Analysis
3.1 Sample deposition by magnetron sputtering
For the purpose of thin film sample preparation, sputtering is a standard tooland the most commercially practiced coating method, resulting in films withthe same stoichiometry as the source. [71, 72] The deposition process takesplace under vacuum condition, which reduces possible impurities in the film.Originally sputtering was performed by the diode sputtering method. How-ever it was found that a magnetic field can improve the deposition process,providing a new technique called magnetron sputtering. A magnetron consistsof a target to be deposited on a substrate, with permanent magnets located be-hind the target, as illustrated in Fig. 3.1. The target atoms are sputtered by gasions, and deposited onto the substrate. Generally a chemically inert (noble)gas is used, e.g. Ar, to avoid unwanted chemical reactions during the growthprocess.
The target material is held at a negative potential up to a couple of hundredvolts, which constitutes a cathode. Positively charged Ar ions are acceleratedtoward the negatively biased target (cathode), creating secondary electronswhen Ar+ ions bombard the target. These secondary electrons gain energyfrom the applied potential and will continue to further ionize the Ar gas byinelastic scattering. As illustrated in Fig. 3.1, the magnetic field confines theseelectrons in a close vicinity of the target, leading to creation of a dense plasmain front of the sputtering target. Consequently the Ar+ ion bombardment ofthe target is increased. When collisions between target atoms and the inci-dent Ar+ ions takes place, the atoms are knocked out from the target if thekinetic energy is large enough. Since these sputtered atoms are not charged,they travel straight out of the magnetic trap to coat the substrate and form thefilm. The target composition is maintained during the process and the depo-sition rate scales with the Ar pressure and the electrical power used to sustainthe plasma. The planar rotation of the substrate during growth creates filmsof uniform coating thickness. The main advantage of magnetron sputtering isthat the magnets, which are located behind the target plate, cause the electronsto be trapped in a helical path (see Fig. 3.1), until striking the Ar atoms and
27
! !
!"#
$%&'(")(*
!"
$
+
$
+
+
$
$
+
$
+
+
$
,-
,./
,./
!"#
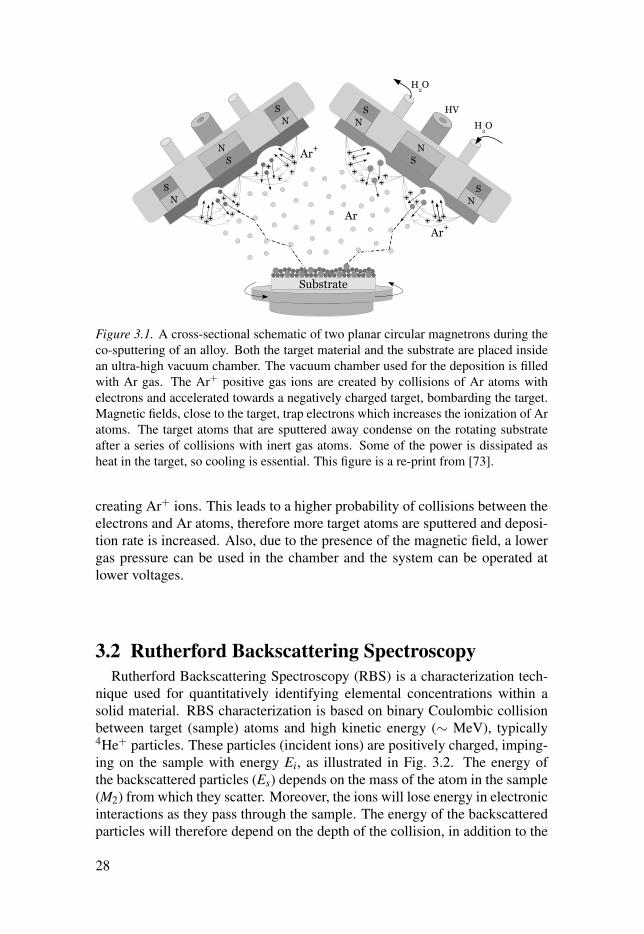
Figure 3.1. A cross-sectional schematic of two planar circular magnetrons during theco-sputtering of an alloy. Both the target material and the substrate are placed insidean ultra-high vacuum chamber. The vacuum chamber used for the deposition is filledwith Ar gas. The Ar+ positive gas ions are created by collisions of Ar atoms withelectrons and accelerated towards a negatively charged target, bombarding the target.Magnetic fields, close to the target, trap electrons which increases the ionization of Aratoms. The target atoms that are sputtered away condense on the rotating substrateafter a series of collisions with inert gas atoms. Some of the power is dissipated asheat in the target, so cooling is essential. This figure is a re-print from [73].
creating Ar+ ions. This leads to a higher probability of collisions between theelectrons and Ar atoms, therefore more target atoms are sputtered and deposi-tion rate is increased. Also, due to the presence of the magnetic field, a lowergas pressure can be used in the chamber and the system can be operated atlower voltages.
3.2 Rutherford Backscattering Spectroscopy
Rutherford Backscattering Spectroscopy (RBS) is a characterization tech-nique used for quantitatively identifying elemental concentrations within asolid material. RBS characterization is based on binary Coulombic collisionbetween target (sample) atoms and high kinetic energy (∼ MeV), typically4He+ particles. These particles (incident ions) are positively charged, imping-ing on the sample with energy Ei, as illustrated in Fig. 3.2. The energy ofthe backscattered particles (Es) depends on the mass of the atom in the sample(M2) from which they scatter. Moreover, the ions will lose energy in electronicinteractions as they pass through the sample. The energy of the backscatteredparticles will therefore depend on the depth of the collision, in addition to the
28

Figure 3.2. An incident ion with mass M1 and initial kinetic energy Ei impinging thesample is scattered out of the sample (backscattered) with energy Es and is registeredby a detector. The detector records their energy and the number of backscatteredparticles in a certain solid angle. Due to conservation of momentum and energy, themass of the target atom can be extracted. Furthermore, since the Rutherford crosssection is well known and the number of incident particles can be determined, thedepth profile (concentration) of mass M2 can be determined from the yield measuredin the detector.
mass M2. Since the energy of the scattered ion is measured, the electronic lossof the incident ion is obtained and can be used to calculate the depth where thecollision took place, if the target material is known. Thick layers will exhibit abroad peak in the RBS spectrum, where the low energy edge provides informa-tion on the depth of the inner interface and the high energy edge correspondsto the scattering from the interface closer to the surface. The energy of thebackscattered particles from a light element is lower than particles scatteredfrom a heavy element, which makes it possible to separate various masses incomposite targets. The probability that the incident particle backscatter bythe sample atoms can be determined by the interaction cross section, whichis known for all elements in the periodic table. The number of backscatteredparticles is proportional to the concentration of atoms in the sample and bycomparing to computer simulations, quantitative depth profiles can be derivedfrom experimental data. RBS is ideally suited for analyzing films containingheavy elements on a substrate of light elements, for instance metal layers ona Si substrate. For multi-elemental samples and films of lower mass elementson a heavier substrate it can be difficult to resolve the individual elements.
As an example, the RBS spectra of FeZr-film on a Si substrate, with a 4 nmbuffer and a 5 nm capping layers of AlZr is illustrated in Figure 3.3. The yield
29

Figure 3.3. The figure shows an RBS spectrum (red/grey dotted line) from a sampleconsisting of a FeZr (40 nm) layer sandwiched between AlZr capping (5 nm) andbuffer (4 nm) layers on a Si substrate. The analysis was done with a normal incidence2.0 MeV 4He ion beam and the detector at a backscattering angle of 170 ◦. By fittingthe experimental data using SIMNRA software [74] (black thicker line), it can beconcluded that the film composition is Fe89Zr11.
of backscattered particles is seen as a function of their energy, expressed in”Channel no.”. By fitting the spectrum using the SIMNRA software [74], theFe and Zr concentration and the film thickness can be extracted.
3.3 Ion Implantation
The ion implantation technique has been developed for introducing atomicdopant elements embedded in the near-surface region of a material. The im-plantation process is based on accelerating ions and injecting them into a target(the sample). The most widespread use of ion implantation can be found inthe semiconductor field, but the technology enables all elements in the periodictable to be implanted into any crystalline or amorphous host material. [75,76]
The ion implantation process starts by electrostatic extraction of ions froman ion source, which typically is a plasma containing the species in ionizedform, illustrated in Figure 3.4. After pre-acceleration of ions from the plasma,these ions are analyzed in a magnet to select the correct ion mass, energyand charge state. Various magnetic and electrostatic lenses and steering de-
30

vices guide the ions in the form of a mono-energetic, isotope-pure beam, downalong the beam line to the target. Before hitting the target the beam is typicallyraster scanned in horizontal and vertical directions to obtain a homogeneousareal coverage of the sample surface. In the sample, the ions gradually losetheir kinetic energy in random elastic collisions with the host matrix atomsand inelastic interactions with the target electrons. Interactions with targetatoms results in large angular deviations from the ion trajectory and also todisplacements of target atoms from their positions, so called damage. If suf-ficient momentum is transferred in the elastic collisions, the displaced targetatoms can also create new recoils and increase the damage. Eventually theions comes to rest and most of the deposited kinetic energy of the ions hasbeen transferred to the target phonon system (heat).
The ion penetration depth and the width of the distribution depend on theion species, the ion energy and the target material. The two stopping mecha-nisms mentioned above are termed nuclear collisions (elastic scattering) andelectronic collisions (inelastic scattering), and these depend on the energy, orthe velocity of the ion. The total energy loss during the ion trajectory is givenby the sum of nuclear and electronic losses.
Figure 3.4. A simplified figure of the basic constituents of a typical ion implanter.Positive ions are extracted from the ion source and mass analyzed on the high voltageplatform and then accelerated through the acceleration tube towards the ground poten-tial at the target. The beam is raster scanned to obtain a homogeneous coverage acrossthe sample surface.
The range distribution of implanted ions and the damage caused by the col-lisions can readily be estimated by simulations, using for instance the SRIMsoftware [76]. This is a Monte Carlo program based on the binary collisionapproximation for amorphous targets. Figure 3.5a demonstrates the concen-tration profile of the implanted ions along the sample thickness.
The main disadvantages with this technique is structural damage due to thedisplacement collisions. Figure 3.5b demonstrates the damage profile of theimplanted ions along the sample thickness. This is particularly problematic
31

Figure 3.5. a) SRIM simulation [76] of ion implantation profiles in amorphous FeZrtargets, where the film is implanted with ≈ 11 at.% of N, C, B, He and H. b) Vacancy(damage) profile within the amorphous FeZr target and the implanted ions distributionfor a dose of 4.75× 10¹⁶ ions/cm2. The implantation dose (fluence) is controlled bythe ion current and the implantation time.
in crystalline materials and, for high enough doses, amorphisation may occur.Therefore, thermal annealing is often needed to return the damaged materialto a crystalline phase. For the case of amorphous material, the arrangement ofatoms is not ordered and therefore small changes of structural disorder uponimplantation is less relevant. Other potential problems with ion implantationis beam heating, which may occur at a combination of high energy and highflux and/or fluence. In such cases, self-heating of the sample during the im-plantation may induce diffusion, or other unwanted effects. Sputtering of thesurface can also be substantial for large fluence of heavier ions. In spite ofthese drawbacks, ion implantation is today widely used for introducing dopantelements and optimizing alloying composition with excellent control of depthdistribution and concentration of the implanted species.
In this thesis ion implantation has been used for doping amorphous FeZrfilms in Papers I-IV with the aim to investigate the effect of dopant elementson the structural, electronic, and magnetic properties of the amorphous FeZrsystem. Our results show this method to be specially useful because it allowsprecise local tuning of the magnetic properties.
32

4. Sample Structural Characterization
4.1 Thin film thickness from X-ray reflectivity (XRR)
Crystalline solids are formed when atoms are stacked together in a fixed ge-ometric pattern. There is a periodicity and long-range order in a crystallinesolid, i.e. a unit cell exists that repeats itself and fills the space. It is possi-ble to structurally characterize crystalline materials to describe the arrange-ment of atoms with X-Ray Diffraction (XRD), with suitably chosen X-raysources. The wavelength of these x-rays are about the atomic size (λ ∼ 1Å) that makes them suitable for structural characterization. For details on thestructural characterization by XRD and analysis the reader is referred to theliterature [77, 78].
The X-Ray Reflectivity (XRR) can be used for the film thickness measure-ment of crystalline and amorphous films. The XRR measurements are basedon the reflected intensity of incident X-rays by a sample. During X-ray re-flectivity measurement, the sample is rotated at a grazing angle θ (to increasepathway of the the X-rays through the sample) in a range of zero to a fewdegrees while the detector rotates 2θ . From each interface of the multilayerfilm, a fraction of the X-rays are reflected. The reflection at the surface andinterfaces corresponds to electron density variations between the different filmlayers. Ultimately, the interference of the reflected X-rays from all interfacescreates an oscillating pattern, where the peaks correspond to the total filmthickness are called Kiessig fringes. [79] The thickness of the film is thenobtained from the distance between these fringes, where the thickness is in-versely proportional to this distance. Moreover, from the amplitude of thefringes, the film density and roughness (originating from uneven surface orinterface) can be calculated. To extract the above mentioned quantities, thedata are compared to a model structure for which the reflectivity is obtainedby solving the Fresnel equations. These equations describe the behavior ofelectromagnetic waves when traveling from one medium to another mediumof a different density, hence with differing indices of refraction. We have usedthe XRR followed by simulations, for determination of the film thickness andinterface roughness of multilayer structures.
As an example, Figure 4.1 demonstrates the use of a structural model toobtain the thickness of each layer in the multilayer structure used in paper V.
33

The multilayers consist of bilayers repeated in a sequence. The spacing of themultilayers Λ, correspond to the respective layers thicknesses (Λ = LFeZr +LAlZr), as for the structure shown in Figure 4.1. Due to the periodicity ofmultilayer structures it is possible to study their layer thickness by using XRRmeasurements. Figure 4.1 shows representative examples of data together withthe fits for multilayer structure of [FeZr (d)/AlZr (30 Å)]×10 investigated byXRR. The notation of the samples is for FeZr/AlZr nominal thicknesses. Thesamples were grown on native oxide Si substrates, using 100 Å and 40 Å AlZras buffer and capping layers, respectively. The nominal values and the valuesobtained from XRR are presented in paper V.
Figure 4.1. X-ray reflectivity from [FeZr (d)/AlZr (30 Å)]×10 multilayer films il-lustrated on the right side of this figure, and a single 250 Å thick FeZr layer film.Experimental data are presented as black lines and the fits as cyan lines. The datawere fitted using the GenX software [80]. Kiessig fringes come from the interferencebetween film surface and the substrate.
34

5. Magnetic Characterization
Two types of magnetometers have been used for the magnetic measurements:SQUID (Superconducting Quantum Interference Device) and MOKE (Magneto-Optic Kerr Effect). All investigations are performed on ferromagnetic thinfilms which require specific protocols and precautions to derive the charac-terizing parameters: Curie temperature, Tc, saturation magnetization, Ms(T ),remanence, Mr(T ) and coercivity, Hc(T ).
Strictly, Tc is only defined in zero magnetic fields for ferromagnets, it is thusnecessary to use low field experiments to derive the Curie temperature. Suit-able protocols and methods are: M(T ), Mr(T ) or χ(T ), where M labels mag-netization and χ susceptibility. In-plane measurements of M(H) at differenttemperatures provide measures of Ms(T ), Hc(T ) and Mr(T ). Demagnetizingeffects are negligible for magnetic field in-plane experiments.
The following sections are divided into three categories. First, a brief de-scription of the experimental setups, i.e., SQUID and MOKE magnetometersis given. Secondly, hysteresis loop (M(H)) experiments for determination ofremanent magnetization (Mr(T )), coercivity (Hc(T )) and saturation magneti-zation (Ms(T )) are discussed. Finally, for Curie temperature (Tc) determina-tions, results of magnetization as a function of temperature (M(T )), remanentmagnetization (Mr(T )) or magnetic susceptibility (χ(T )) measurements arepresented.
SQUID Magnetometry
SQUID magnetometers provide a sensitive method to obtain magnetizationdata over a wide temperature range and with applied magnetic fields up toseveral Tesla. The magnetic moment from the sample couples inductively toa superconducting pick up coil. The magnetic flux in the pick up coil is trans-ferred to the SQUID detector. The SQUID detector is an extremely sensitiveflux-to-voltage converter, allowing very small magnetic moments ( ≈ 10−8
electromagnetic unit (emu)) to be measured. SQUID magnetometers are oftenused for obtaining the saturation magnetizations (Ms) of thin magnetic films,since they often provide both high external fields and give absolute magneticmoments. Details of SQUID magnetometers are given in Ref. [81].
MOKE Magnetometry
The rotation of the polarization plane of light at the surface of a metal,the Magneto-optic Kerr effect, is employed in (MOKE) magnetometry. An
35

experimental MOKE setup is illustrated in Fig. 5.1, where linearly polarizedlaser light is reflected on a magnetic sample and then goes through the ana-lyzer before arriving at the detector. A magnetized sample induces rotation ofthe initial polarization of the light. The rotation angle, is proportional to themagnetization of the film. [82] MOKE experiment can be performed in three
Figure 5.1. A laboratory MOKE setup configuration is shown. The magnetic fieldis provided either by a pair of Helmholtz coils or conventional electromagnets. Theangle of the analyzer is 90◦ to that of the polarizer.
different geometries: transverse, polar and longitudinal MOKE, illustrated inFig. 5.2. [82] To probe the magnetization of the samples, we have used thelongitudinal geometry because the magnetization of the thin films is orientedin the film plane. In the longitudinal geometry, the induced rotation is onlysensitive to the magnetization parallel to the plane of incidence. The polar
Figure 5.2. Upon reflection from the surface of a magnetized medium, the rotationof the incident polarized light depends on the direction of magnetization. The figureillustrates the different MOKE geometries provided.
and transverse configurations are used when the magnetization is perpendicu-lar to the sample plane and the magnetization is perpendicular to the plane of
36

incidence and parallel to the surface, respectively. MOKE is a surface sensi-tive method (penetration depth about 100 nm). The method does not provideabsolute values of the magnetization.
Magnetic Measurements
A ferromagnetic material shows a hysteretic M(H) curve, where magne-tization traces out a loop as a function of applied field. MOKE or SQUIDmeasurement can both be used to record M(H) loops, for determining charac-teristics of ferromagnetic materials such as coercivity (Hc), remanence (Mr),and saturation magnetization (MS). Since the SQUID magnetometer probesthe entire volume of a sample, the initial experimental value of the saturationmagnetic moment from M(H) loop, provides the total magnetic moment fromboth magnetic film and the substrate. After approaching the saturation field,the contributions from the para- or diamagnetic substrate gives a positive ornegative slope of the M(H) curve. As an example of this behavior, an M vs.
Figure 5.3. M vs. H measured at 10 K on a Co/Si sample, where a) shows the rawdata and b) the M-H loop after the diamagnetic contribution has been subtracted.
H curve of a Co (8.14 Å) film grown on Si substrate is shown in Fig. 5.3 a.In this case, due to the diamagnetic Si substrate contribution, the Mdia(H) issubtracted in order to obtain the magnetic moment of the ferromagnetic film,see Fig. 5.3b. Finally, to obtain the absolute magnetization (magnetic momentper volume), the magnetic moment of the sample is divided by its volume.
The maximum field that can be applied by a specific magnetometer canlimit the possibility of reaching the saturation magnetization of the sample, asshown in Fig. 5.4, for different Zr concentrations in Fe100−xZrx. The magne-tization does not always saturate at the knee of the M vs. H, but they show asteady increase up to the highest applied field, which indicates magnetizationin a non-collinear phase (for the 7.6 and 9.7 at.%, Zr samples).
37

Figure 5.4. M vs. H measured at 5 K on Fe100−xZrx samples with different Zr content(x). The magnetic saturation is not reached at the maximum applied field of (0.5 T)for the samples with 7.6 and 9.7 at.% Zr.
The Curie temperatures of the investigated films have been determined us-ing different methods: M(T ), Mr(T ) and χac(T ).
50 100 150 200 250 3000
50
100
150
200
250
300
350
400
450
T (K)
M (
em
u/c
m3)
x=7.6at.%
x=9.7at.%
x=11.6at.%
x=12.0at.%
x=12.9at.%
Figure 5.5. Field cooled (FC), magnetization vs. T measured on Fe100−xZrx films withdifferent Zr content. The applied magnetic field is 10 Oe for the x = 7.6 at.% sampleand 5 Oe for the other samples.
In paper I, by using SQUID magnetometry, the Tc of Fe100−xZrx films wereobtained from the field-cooled (FC) magnetization versus temperature shownin Fig. 5.5.
38
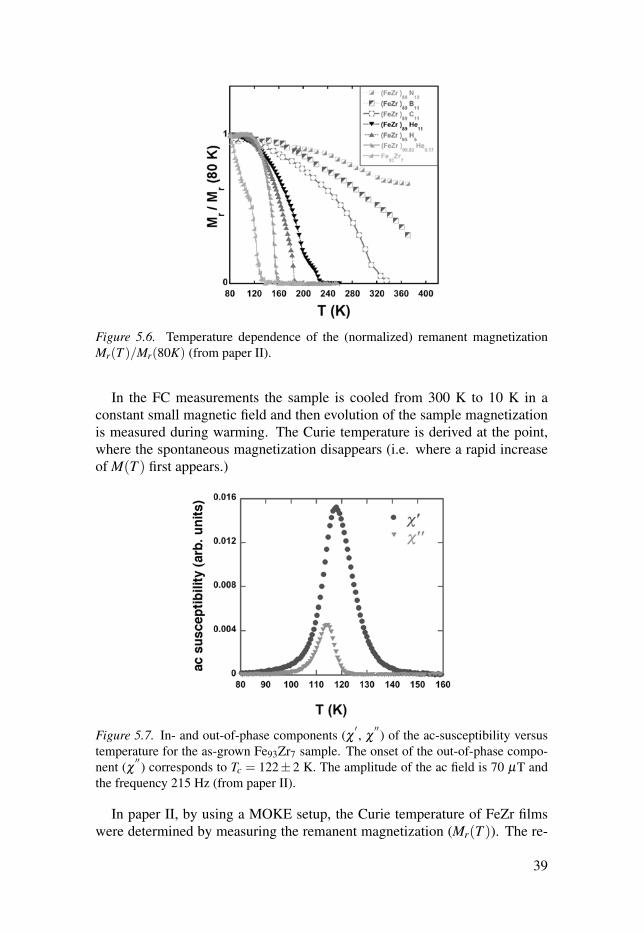
Figure 5.6. Temperature dependence of the (normalized) remanent magnetizationMr(T )/Mr(80K) (from paper II).
In the FC measurements the sample is cooled from 300 K to 10 K in aconstant small magnetic field and then evolution of the sample magnetizationis measured during warming. The Curie temperature is derived at the point,where the spontaneous magnetization disappears (i.e. where a rapid increaseof M(T ) first appears.)
Figure 5.7. In- and out-of-phase components (χ � , χ �� ) of the ac-susceptibility versustemperature for the as-grown Fe93Zr7 sample. The onset of the out-of-phase compo-nent (χ �� ) corresponds to Tc = 122± 2 K. The amplitude of the ac field is 70 µT andthe frequency 215 Hz (from paper II).
In paper II, by using a MOKE setup, the Curie temperature of FeZr filmswere determined by measuring the remanent magnetization (Mr(T )). The re-
39

manence Mr(T ) values were extracted from M(H) loops measured at differ-ent temperatures. The value of the Curie temperature is obtained at the pointwhere Mr(T ) reaches zero. Figure 5.6 shows the temperature dependence ofthe normalized remanence Mr(T )/Mr(80K) for the as-grown FeZr and someof the implanted films.
Along with the two methods presented above to determine the Curie tem-perature, a third method is by alternating current (ac)-susceptibility measure-ments. The ac-susceptibility has been measured on an as-grown FeZr sample.The temperature dependence of in-phase ( χ �) and out-of-phase ( χ ��) com-ponents of the ac-susceptibility were measured over the temperature range of80-160 K. Fig. 5.7 shows low field ac-susceptibility vs. temperature curves forthis sample, where the applied ac field is 70 µT and the frequency is 215 Hz.The Curie temperature is estimated from the onset of the out-of-phase compo-nent ( χ ��) which corresponds to Tc = 122 K.
40

6. Summary of Results
6.1 Paper I, II, III, IV and V
Amorphous FeZr (Fe100−xZrx) films were synthesized by dc-magnetron sput-tering. A single amorphous layer was used for the films investigated in papersI, II, III, IV and a multilayer structure was used in paper V. All FeZr films aresandwiched between a buffer and a cap layer of AlZr. Amorphous Fe100−xZrxexhibits Curie temperatures (Tc) that changes with the Zr concentration butare below room temperature (see Figure 6.1, paper I and references therein),therefore they can not be adopted for room-temperature applications. In or-der to use these materials for room temperature applications, increasing theCurie temperature is crucial. We report on two different approaches to manip-ulate the magnetic behavior of these amorphous Fe100−xZrx alloys. For thispurpose, we first study the dependency of the Curie temperature upon varia-tion in chemical composition through dopant incorporation (paper I, II, III,
IV), where the process of introducing dopant atoms into these films was ac-complished by ion implantation technique. In the next step we look into the
Figure 6.1. The Curie temperature as a function of Zr concentration for amorphousFe100−xZrx films.
41
dependency of the critical temperature upon FeZr thickness variations (pa-per V). Composition and thickness variations, such as those investigated here,show that a significant increase in Curie temperature (Tc) is obtained in bothcases, resulting in Curie temperatures above room temperature.
For paper I, the Fe100−xZrx samples were deposited by co-sputtering of Feand Zr targets, to make films with the compositions of x = 7.6 - 12.9 at.%.The Curie temperature changes with varying Zr contents and has a maximumat about 12.0 at.% Zr, as illustrated in Figure 6.1. Afterwards, the films withcompositions of x = 11.6 and 12.0 at.%, were doped with H, using ion implan-tation.
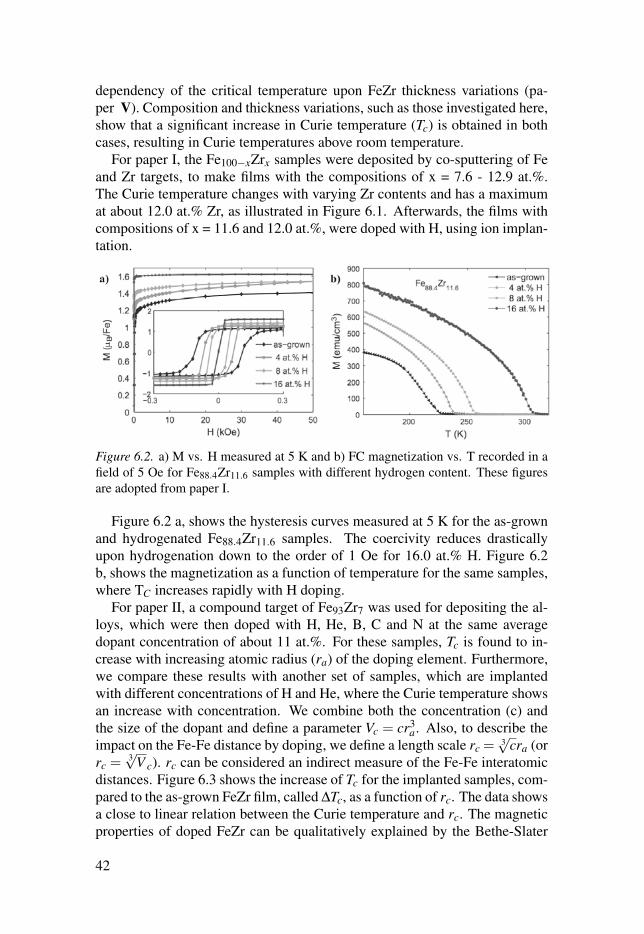
Figure 6.2. a) M vs. H measured at 5 K and b) FC magnetization vs. T recorded in afield of 5 Oe for Fe88.4Zr11.6 samples with different hydrogen content. These figuresare adopted from paper I.
Figure 6.2 a, shows the hysteresis curves measured at 5 K for the as-grownand hydrogenated Fe88.4Zr11.6 samples. The coercivity reduces drasticallyupon hydrogenation down to the order of 1 Oe for 16.0 at.% H. Figure 6.2b, shows the magnetization as a function of temperature for the same samples,where TC increases rapidly with H doping.
For paper II, a compound target of Fe93Zr7 was used for depositing the al-loys, which were then doped with H, He, B, C and N at the same averagedopant concentration of about 11 at.%. For these samples, Tc is found to in-crease with increasing atomic radius (ra) of the doping element. Furthermore,we compare these results with another set of samples, which are implantedwith different concentrations of H and He, where the Curie temperature showsan increase with concentration. We combine both the concentration (c) andthe size of the dopant and define a parameter Vc = cr3
a. Also, to describe theimpact on the Fe-Fe distance by doping, we define a length scale rc = 3
√cra (or
rc =3√V c). rc can be considered an indirect measure of the Fe-Fe interatomic
distances. Figure 6.3 shows the increase of Tc for the implanted samples, com-pared to the as-grown FeZr film, called ∆Tc, as a function of rc. The data showsa close to linear relation between the Curie temperature and rc. The magneticproperties of doped FeZr can be qualitatively explained by the Bethe-Slater
42

Figure 6.3. The increase in Curie temperature ∆Tc for the implanted samples (relativeto the as-grown FeZr film) versus rc =
3√V c, where Vc = cr3a (paper II).
curve [40], described earlier in section 2.1. The exchange interaction in theFeZr system is close to the zero-crossing point of the curve. The direct ex-change depends on the Fe-Fe interatomic distance and Tc is proportional tothe exchange energy. The presence of dopants, drives the exchange interac-tion towards stronger FM coupling as Fe-Fe distance increases, hence greatlyenhancing Tc.
In Paper III, the Fe93Zr7 films were doped with C at 5.5 and 11 at.%. Theenhanced Curie temperature and decrease of the coercivity are very similar tothe effects of H doping (as in Paper I and II). The Curie temperature reacheswell above room temperature and the films become magnetically soft. Thechemical bonding of Fe for as-grown and implanted films were characterizedby X-ray photoelectron spectroscopy (XPS) that reveals the electronic effects(electron transfer from Fe to C). This is due to the presence of Fe-C bonds thatare formed upon the implantation.
Paper IV reports an additional electronic effect in C and B doped Fe93Zr7films, where the coercivity enhances with increasing temperature, as shown inFig. 6.4. This is interpreted as the result of charge-transfer effects, where dueto the large electron affinity of C and B, electron transfer from Fe to C and Boccurs. As a result of this formation of interatomic covalent bonds, the localanisotropies increase, as evidenced by an increase of coercivity with tempera-ture. XPS measurements were carried out, which show that the binding energypeaks shift to higher energies.
43

Figure 6.4. The coercivity as a function of temperature for the as-grown FeZr filmsand implanted by H, He, B, C and N. Inset shows a zoom of the curve for B-implantedsample, showing an anomalous temperature dependence of the coercivity. This figureis a adopted from paper IV.
Paper V investigates the dependence of the critical temperature on the thick-ness of the FeZr layer, and reveals an anomalous increase of TC when the thick-ness of the magnetic layer (FeZr) is decreased from 60 Å to 20 Å, as shownin Fig. 6.5. Amorphous Fe92Zr8/AlZr multilayer structures were deposited byco-sputtering of Fe and Zr targets. The critical temperature enhancement islinked to a reversed interface effect, wherein changes in the Fe-Fe distanceand coordination number favors a higher effective magnetic coupling at theinterfaces compared to the interior of the bulk layer. This indicates the in-evitable intermixing of the layers, i.e., interfacial mixing of AlZr and FeZrlayers, that occurs during the sample deposition, resulting in Al entering theFeZr layer. The results are explained with a model where such interface effectsare combined with finite size scaling. In order to explain why in this model Tcincreases as the thickness decrease, we assume that the FeZr layer consists oftwo regions: the interior FeZr layer and the interface region between the FeZrand AlZr. XRR results provide the thickness of the interface region (inter-mixed region). The average exchange interactions in the interior layer (J1) issmaller than that at the interface (Ji) layer. As the result, the average effectiveexchange interactions (Je f f ) increases as the FeZr layer thickness decreases.Along with a decreasing layer thickness, the enhancement of Je f f results in arise in Tc. At the interface, Fe92Zr8 becomes doped with small amounts of Aland Zr. By comparing to Fig. 2.3 a and the results in paper I-IV, this impliesthat for small Al/Zr doping levels, Tc increases. However, when the FeZr layerbecomes thin, Tc decreases again due to the finite size effects.
44

10 20 30 40 50 60 70150
160
170
180
190
200
0.8
1.0
1.2
1.4
1.6
T C (K
)
FeZr thickness (Å)
bulk
Mag. m
om. (μ
B /Fe)
Figure 6.5. The Curie temperature (solid squares) and magnetic moment (open circles)as a function of the FeZr layer thickness. The bulk (250 Å) values of both propertiesare represented by the dotted horizontal line. The solid line and the dash-dotted linerepresent fits. This figure is a adopted from paper V.
6.2 Paper VIIn paper VI, a different approach to control the magnetization is investi-
gated, where the structural transitions of a ferroelectric substrate govern themagnetic properties of a deposited ferromagnetic thin film. We have studiedferromagnetic amorphous CoZr grown on a ferroelectric BaTiO3 substrate, tounderstand strain induced coupling between these materials by making use oftemperature dependent structural transitions of the substrate.
During the deposition process of the structure BaTiO3 (001)/ Al70Zr30 (3nm) / Co95Zr5 (15 nm) / Al70Zr30 (3 nm), an external magnetic field of 0.01 Twas applied parallel to the [010] BaTiO3 (001) substrate direction. This resultsin an in-plane magnetic anisotropy in the amorphous Co95Zr5 layer. To assistthe growth of an amorphous Co95Zr5 (15 nm) layer, an amorphous Al70Zr30(3 nm) seed layer was used. Another functionality of the seed layer is thesuppression of direct interface effects between the BaTiO3 substrate and theCo95Zr5 film on top.
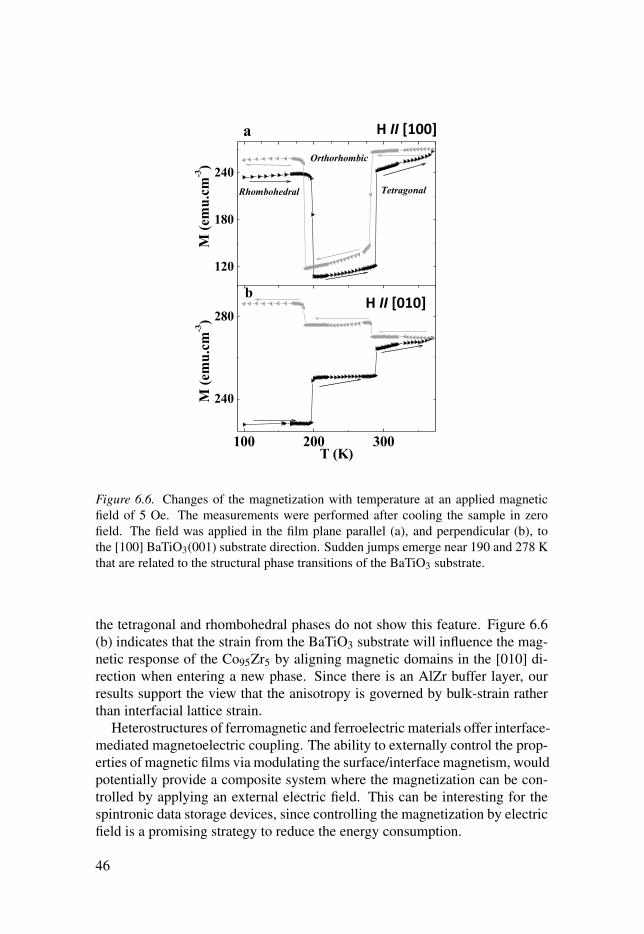
The results in paper VI, show changes in the magnetic anisotropy of theamorphous Co95Zr5 layer at the structural phase transitions of the BaTiO3 sub-strate. Once the orthorhombic phase transition of the BaTiO3 substrate occurs(220 K), this will induce an enhancement of the uniaxial magnetic anisotropyin the amorphous Co95Zr5 film. Therefore, the magnetic moment orients to-wards the easy uniaxial axis. The strain induced in the Co95Zr5 thin film, whenentering any of BaTiO3 structural phases, is derived from the change of the lat-tice parameters of BaTiO3. Figure 6.6 (a) indicates that in the orthorhombicBaTiO3 phase, the strain induced hard axis is along the [100] direction while
45
120
180
240
a
M (e
mu.
cm-3
) Orthorhombic
Tetragonal
H//[010]
!
!
Rhombohedral
100 200 300
240
280
b
M (e
mu.
cm-3
)! !
!
T (K)
H//[100]
!"!!"#$%%&"
!"!!"#%$%&"
Figure 6.6. Changes of the magnetization with temperature at an applied magneticfield of 5 Oe. The measurements were performed after cooling the sample in zerofield. The field was applied in the film plane parallel (a), and perpendicular (b), tothe [100] BaTiO3(001) substrate direction. Sudden jumps emerge near 190 and 278 Kthat are related to the structural phase transitions of the BaTiO3 substrate.
the tetragonal and rhombohedral phases do not show this feature. Figure 6.6(b) indicates that the strain from the BaTiO3 substrate will influence the mag-netic response of the Co95Zr5 by aligning magnetic domains in the [010] di-rection when entering a new phase. Since there is an AlZr buffer layer, ourresults support the view that the anisotropy is governed by bulk-strain ratherthan interfacial lattice strain.
Heterostructures of ferromagnetic and ferroelectric materials offer interface-mediated magnetoelectric coupling. The ability to externally control the prop-erties of magnetic films via modulating the surface/interface magnetism, wouldpotentially provide a composite system where the magnetization can be con-trolled by applying an external electric field. This can be interesting for thespintronic data storage devices, since controlling the magnetization by electricfield is a promising strategy to reduce the energy consumption.
46

6.3 Paper VII
The aim of paper VII is to determine the exchange stiffness (Aex) in pureand alloyed Co layers by fitting the M(H) dependence of a FM/NM/FM filmstructure to the one dimensional micromagnetic model described in section2.5. For this study, the synthetic antiferromagnetic structure (SAF) of Co (2.4-20 nm)/Ru (0.5 nm)/Co (2.4-20 nm) trilayers was selected as shown in Fig.6.7 a. A Ru layer is sandwiched between two Co layers, which are antiferro-
Figure 6.7. a) The cross section of the multilayer system prepared for the measure-ments of Aex in Co and CoX alloys. The layer structure consists of: a seed layer of Cufollowed by Ru, two ferromagnetic CoX layers (antiferromagnetically coupled by aRu spacer layer) and a Ru capping layer. b) Experimental data (SQUID measurement)from measured M(H) curves of Co (10 nm) / Ru / Co (10nm). Fits to the experimen-tal data points were carried out using the micromagnetic model outlined in text. Thefilled red/grey circles are the measured values while the line is the fitted curve. Bothfigures are adopted from [69].
magnetically coupled. The films are textured with the [0001] oriented perpen-dicular to the surface. Consequently, the uniaxial anisotropy has no effect onmagnetization reversal in these films. Moreover, by using the micromagneticmodel, Aex of the alloyed CoX thin films in CoX (10 nm) / Ru (0.38 nm) /CoX (10 nm) were determined, where X refers to the alloying elements of Cr,Fe, Ni, Pd, Pt and Ru. Figure 6.7 b shows the calculated fit and the measuredM(H) curve of Co (10 nm) / Ru / Co (10 nm). The data is normalized to thesaturation magnetization, MS. The fit was performed by using Eq. 2.8 and Eq.2.9, using JRKKY and Aex as fitting parameters.
The results show that the thickness dependence of Aex for the Co layerswhich are thicker than 80 Å is very weak. In the case of thinner films, theexchange stiffness drops. This accordingly makes the interface contributionmore prominent. The MS values of these Co films do not show the same sharp
47

Figure 6.8. a) The effect of alloying on the MS of CoX films, where X refers to thealloying elements of Cr, Fe, Ni, Pd, Pt and Ru. The MS values are normalized to theMS of Co b) Alloying effect on Aex. The values are normalized to Aex of pure Co. Thelines are linear fits through the points. Figures are adopted from paper VII.
decrease with the Co film thickness as found for the exchange stiffness, i.e Aexdecreases even when the MS is relatively constant. Comparing these resultsto Equation 2.4, one can understand by varying the thickness of the Co layer,we are varying only one parameter, which is the exchange coupling (J). Thissuggest that the exchange coupling is decreased at the Co/Ru interface, whichis consistent with a strongly reduced Aex in CoRu alloys. By using this micro-magnetic model, we were able to estimate the exchange stiffens (Aex) for thinfilms, which is difficult to obtain by any other method.
Using the results of the Co films of different thickness, a thickness of theCoX layers of 10 nm was chosen for a systematic study of MS and Aex of thesealloys. The results of these measurements are shown in Fig. 6.8. Aex of Cois reduced closely linearly by 1-5 % per atomic % of dopant, depending onthe alloying element (Fig. 6.8 b). The saturation magnetization (MS) follows asimilar trend as Aex (Fig. 6.8 a). The decreases in Aex and MS, with increasingalloy concentrations are supported by first principles DFT calculations. This
48

method and these alloys are of particular interest to the recording industry andstorage media.
49

7. Summary and Conclusion
This thesis describes the tuning of magnetic properties in metallic amorphousfilms and heterostructures by varying the chemical composition (doping), thick-ness and structure (via strain). In this context, amorphous FeZr alloy filmswere doped with H, He, B, C and N ions by the means of ion implantation.The Tc can be controlled by varying the size and concentration of the dopant.Both high concentrations and/or large dopant sizes can push Tc above roomtemperature, which is necessary for potential applications. Our results sug-gest that volume changes is the dominant effect, since different atomic species(with varying electronic contributions) show a similar volume dependance onthe Curie temperature. However, anomalous temperature dependence of thecoercivity is observed for C and B doped samples, which is attributed to elec-tron charge transfer from Fe to C and B. The coercivity and the non-collinearmagnetization of the amorphous alloys can be controlled by ion implantationwhere the coercivity can be strongly suppressed, which makes it suitable forsoft-magnetic applications.
The magnetic properties of thin films can also be controlled by changingthe thickness of the amorphous layer. In amorphous Fe92Zr8/AlZr multilayerstructures, an anomalous increase of Tc is found when the thickness of themagnetic layer is decreased. The Tc enhancement is related to interlayer mix-ing at FeZr/AlZr interfaces, which can be explained with a model where theinterface effects are combined with finite size scaling.
The magnetization of the amorphous thin film can be controlled via theinduced strain coming from the substrate. The strain controlled magnetizationcan be obtained by using a ferroelectric BaTiO3 substrate. The structural phasetransitions of the BaTiO3 substrate changes the stress in the amorphous thinfilm of Co95Zr5, hence influencing its magnetization and magnetic anisotropy.
For tailoring magnetic properties of alloys to match practical applications,such as spin-transfer-torque magnetic random access memories (STT-MRAM),one need to fully characterize the magnetic properties. The exchange stiffnessis a key parameter that controls magnetization reversal, which is not trivial tostudy, especially in thin films. For this purpose a series of CoX/Ru/CoX filmswere fabricated, where Co layers are coupled antiferromagnetically and X isone of the following elements: Cr, Fe, Ni, Pd, Pt, or Ru. By using a micromag-netic model and fitting to M(H) curves measured by SQUID magnetometry,the exchange stiffness of CoX films can be fully determined.
50

8. Outlook
In this thesis, I presented a series of experimental studies that have contributedto the understanding of magnetic properties of amorphous magnetic alloys.My work has advanced the understanding of what we can do to tune and opti-mize their magnetic properties. The main thematic focus of this work was tostudy the greatly improved magnetic properties of amorphous Fe(Zr) alloys,upon doping. Since we have shown that the ion implantation technique cansuccessfully be used to accurately control the magnetic properties, it opens uppossibilities to explore a wide range of dopants and their effect on the magneticproperties for different concentrations and depth profiles.
But what are the unsolved problems and future challenges? The questionof whether the increased Curie temperature is due to the volume effect, chargetransfer effect or both, is not fully resolved. It would be interesting to investi-gate B- and C-doped FeZr samples more in detail for a wide range of dopingconcentrations to explore to which extent the change in magnetic propertiescould be a combination of both structural effects (an increase of the Fe-Fedistance) and electronic effects. Moreover, one could systematically studythe changes in iron magnetic moment (Ms) induced by these dopants, wherethe variation of Ms would reflect the charge transfer between the Fe and thedopant atoms. This would provide a better understanding of the origin ofthe soft magnetic properties and increased Tc in amorphous magnetic alloys.Also, the large range of tunable Tc along with reasonable magnetization couldbe explored for magnetocaloric applications at room temperature.
Further research on these promising materials could be patterning the mag-netic film by ion implantation using a mask. During ion implantation throughthe mask, specific regions can be implanted using a variety of masking pat-terns and dopant types, hence obtaining patterned magnetic regions within thefilm that can provide nanoscale control of the magnetization of the system.
51

9. Summary in Swedish
Vår planet består till en tredjedel av järn (Fe), varav det mesta är begravt djupti jordens inre. Järn har varit en mycket viktig metall för mänskligheten sedanjärnåldern, och magnetit, som är en järnoxid, gav upphov till de första kom-passerna för ungefär 1000 år sedan. Andra magnetiska metaller är nickel (Ni)och kobolt (Co).
Genom att tillföra andra ämnen till en metall skapas en legering. Genom attskapa legeringar av magnetiska metaller går det att skräddarsy de magnetiskaegenskaperna så att de passar en specifik tillämpning. Om ett magnetisk mate-rial ska användas som permanentmagnet (t.ex. kylskåpsmagnet) är det viktigtatt mättnadsmagnetiseringen och koerciviteten är höga. Permanentmagneterär en typ av hårda magneter. I en transformator vill man snabbt kunna än-dra magnetiseringsriktningen. Då efterfrågas istället hög permeabilitet ochlåg koercivitet. Magnetiska material med dessa egenskaper kallas för mjukamagneter. Det finns ett starkt samband mellan de magnetiska egenskapernaoch ett materials kristallstrukur, men det finns också amorfa magnetiska met-aller som helt saknar kristallstruktur. Amorfa magnetiska metaller upptäcktespå 60-talet. De uppvisar en struktur som liknar den hos en vätska, men i fastform, och deras magnetiska egenskaper är i allmänhet mjukmagnetiska.
Legeringar mellan järn och zirkonium Fe100−xZrx (FeZr) är amorfa för 7 <x < 13 at.% Zr. FeZr har studerats mycket med avsikten att nå en djupareförståelse för de grundläggande principer som styr de magnetiska egenskapernahos amorft järn. FeZr är inte ferromagnetiskt vid rumstemperatur utan param-agnetiskt. För att det ska ske en fasövergång till ett ferromagnetiskt tillståndbehöver FeZr kylas ungefär 100◦. Genom att tillsätta ytterligare legeringsäm-nen i små mängder kan den kritiska temperaturen vid vilken fasövergångensker höjas avsevärt.
Materialen som har studerats i denna avhandling har främst varit tunnafilmer framställda genom en teknik som kallas sputtring. Det är möjligt attsyntetisera amorft FeZr med olika tjocklekar och olika järnhalter med dennateknik. Jonimplantering har använts för att dopa amorfa FeZr-filmer med väte(H), helium (He), kol (C), bor (B) och kväve (N) med avsikt att studera hurde magnetiska egenskaperna påverkas. Vi fann att den magnetiska övergång-stemperaturen ökar i relation till den volymökning som sker. Orsaken är attnär avståndet mellan närliggande järnatomer ökar blir den ferromagnetiska ut-bytesväxelverkan starkare.
Vi har även undersökt utbytesväxelverkans styvhet i tunna kobolt-filmer.Detta är en egenskap som är svår att mäta för tunna filmer, men som är viktig
52

eftersom den beskriver hur mycket energi som krävs för att rotera det mag-netiska momentet. För detta ändamål har strukturer som kallas för syntetiskaantiferromagneter och består av tunna skikt av Co/Ru/Co skapats. Tjocklekenpå Ru-skiktet måste väljas rätt för att Co skikten ska vara antiferromagnetisktkopplade. Vi har även undersökt utbytesväxelverkans styvhet i olika Co-legeringar (med Cr, Fe, Ni, Ru, Pd, Pt) och jämfört resultaten mot teoretiskaberäkningar. Eftersom koboltlegeringar används för att spara data magnetiskt ihårddiskar finns det ett stort intresse för att kunna kontrollera deras magnetiskaegenskaper.
53

10. Acknowledgement
I would like to thank my PhD advisors Prof. Per Nordblad, Prof. Olof Karisand Petra Jönsson for your mentorship. Thank you for encouraging my re-search and for allowing me to grow as a research scientist. Charlie and Per,even though you became my supervisors later along the way, you have beengreat role models as scientists, mentors, and teachers.
Special thank to Prof. Bret Heinrich and Prof. Erol Girt for valuable ad-vices and discussions during my study and for hosting me at Simon FraserUniversity.
My sincere thanks goes to Prof. Anders Hallén for endless support.I would also like to thank Vassilios Kapaklis who always encouraged me.A special thanks to Emil for being thoughtful and good friend.I would like to thank Lennard for being a good friend and keeping up a
positive attitude.I am very thankful to Anders Olsson for always willing to help, specially
the days of helping me when I had a broken leg.I am truly thankful to Ronny for proof reading my thesis, your support has
been invaluable.Klas Gunnarsson thanks for your time and helpful comments for improving
my thesis.I thank all my fellow colleagues: Franz, Hauke, Sebastian, Unnar, Maja,
Erik, Spyridon, Sotirios, Martina, Vangelis, Masoud, Panos, Gunnar, Fridrik,Rimantas, Anna, Ian, Junaid, Tanveer, Vancho, Stefano, Teresa, Shirin, Matthias,Magnus, Sofia, Andreas, Cristina, Nina, Ieva, Rebecka, Erna, Andrea, Hos-sein, Reda, Henry, Ola, Max, Lennart, Tore, Lars, Roger, Bengt, Gabriella andBjörgvin.
My special thanks are for Prof. Adrian Rennie, Prof. Mattias Klintenberg,Prof. Kristina Edström, Per Löwdin, Marja Fahlander, Prof. Olle Eriksson,Prof. Yvonne Andersson, Dr. Martin Sahlberg, Prof. Peter Svedlindh, Prof.Hans Siegbahn, Prof. Göran Possnert and Prof. Erik Karlsson who are alwayswilling to help.
I would like to extend my gratitude to my Canadian friends Dorna, Shane,Colin, Eric, Rachelle, Tommy, Monika, Ricky, Aj, Farnaz, Bobo and Nataliefor your valuable friendship and helping out with various things during mystay in Beautiful British Columbia.
Kati, Måns, Hannah, Julia, Åke, Pia, Soile, Jukka, Jouko, Joni, Matti, Hugo,Marit, I am eternally grateful for all your constant and unwavering love, whichwill forever be a part of me. I feel fortunate to have an extensive Swedishfamily.
54

Marianne thank you for being so wonderful and for taking such great careof me in SOS-Whistler, one of a kind, wonderful experience!!! Louise andFelicia thank you for always being there for me!
Ostad Maghami va khanome Maghami besyar aziz az nazare lotfe hamishegieshoma samimane sepasgozaram. Groohe Vahdat, mamnoon az lotfe hamegit-oon.
Parisa and Ali, you are beautiful and loving souls who have always beenthere for me throughout my life, thank you for your unconditional love, Merci.Asheghetoonam!
I am deeply indebted to my Mom and Dad, thanks for giving me both rootsand wings, thank you for everything you’ve done to help me get where I amtoday. Asheghetoonam!
I also want to thank C F Liljewalchs resestipendier, Anna Maria Lundinsstipendiefond and GradSAM21 for travel support through my doctoral fellow-ship.
55

References
[1] C. Kittel. Introduction to Solid State Physics. Wiley, 2004.[2] R. Zallen. The Physics of Amorphous Solids. Wiley, 1983.[3] S.R. Elliot. Physics of Amorphous Materials. Longman, 1990.[4] W. Klement, R.H. Willens, and P. Duwez. Non-crystalline structure in solidified
gold-silicon alloys. Nature, 187(4740):869–870, 1960.[5] H.S Chen and D Turnbull. Formation, stability and structure of
palladium-silicon based alloy glasses. Acta Metallurgica, 17(8):1021 – 1031,1969.
[6] J.P. Chu, J.S.C. Jang, J.C. Huang, H.S. Chou, Y. Yang, J.C. Ye, Y.C. Wang, J.W.Lee, F.X. Liu, P.K. Liaw, Y.C. Chen, C.M. Lee, C.L. Li, and C. Rullyani. Thinfilm metallic glasses: Unique properties and potential applications. Thin SolidFilms, 520(16):5097–5122, 2012.
[7] P. Duwez and S.C.H. Lin. Amorphous ferromagnetic phase iniron-carbon-phosphorus alloys. Journal of Applied Physics, 38(10):4096–4097,1967.
[8] A. Inoue and A. Takeuchi. Recent development and application products ofbulk glassy alloys. Acta Materialia, 59(6):2243–2267, 2011.
[9] H.W. Kui, A.L. Greer, and D. Turnbull. Formation of bulk metallic glass byfluxing. Applied Physics Letters, 45(6):615–616, 1984.
[10] A. Inoue, B. Shen, and A. Takeuchi. Developments and applications of bulkglassy alloys in late transition metal base system. Materials Transactions,47(5):1275–1285, 2006.
[11] D. Wang, Y. Li, B.B. Sun, M.L. Sui, K. Lu, and E. Ma. Bulk metallic glassformation in the binary Cu-Zr system. Applied Physics Letters,84(20):4029–4031, 2004.
[12] Z.P. Lu, C.T. Liu, and W.D. Porter. Role of yttrium in glass formation ofFe-based bulk metallic glasses. Applied Physics Letters, 83(13):2581–2583,2003.
[13] M.H. Lee, J.Y. Lee, D.H. Bae, W.T. Kim, D.J. Sordelet, and D.H. Kim. Adevelopment of Ni-based alloys with enhanced plasticity. Intermetallics,12(10-11 SPEC. ISS.):1133–1137, 2004.
[14] M.C. Gao, F. Guo, S.J. Poon, and G.J. Shiflet. Development of fcc-Alnanocrystals in Al-Ni-Gd metallic glasses during continuous heating DSC scan.Materials Science and Engineering A, 485(1-2):532–543, 2008.
[15] G. Yuan and A. Inoue. The effect of Ni substitution on the glass-forming abilityand mechanical properties of Mg-Cu-Gd metallic glass alloys. Journal of Alloysand Compounds, 387(1-2):134–138, 2005.
[16] H. Geisler, U. Herr, T. Lorenz, and K. Samwer. Thickness- andconcentration-dependent crystal-to-amorphous transition of Fe100−xZrx inZr/Fe100−xZrx/Zr trilayers. Thin Solid Films, 275(1-2):176–179, 1996.
56

[17] S.G. Mayr and K. Samwer. Surface morphology, stress, and volume changeduring growth and crystallization of interface-stabilized amorphous Fe100−xZrxfilms. Physical Review B, 65(11):1154081–1154087, 2002.
[18] F. E. Lubrosky, editor. Amorphous Magnetic Alloys. Butterworths, London,1983.
[19] R. Hesegawa, editor. Glassy Metals: Magetic, Chemical and StructuralProperties. CRC, Baca Raton, Florida, 1983.
[20] A. R. Ferchmin and S. Kobe. Amorphous Magnetism and Metallic MagneticMaterials - Digest, Selected topics in Solid State Physics. North-Holland,Amsterdam, 1983.
[21] T. Kaneyoshi. Amorphous magnetism. CRC, Baca Raton, 1984.[22] G. A. Petrakovskii. Amorphous magnetic materials. Soviet Physics Uspekhi,
24:511, 1981.[23] G. Herzer. Chapter 3 nanocrystalline soft magnetic alloys. Handbook of
Magnetic Materials, 10:415–462, 1997.[24] G. Herzer and H. R. Hilzinger. Surface crystallization and magnetic properties
of iron-based metallic glasses. Physica Scripta, 39:639, 1989.[25] G. Herzer. Grain size dependence of coercivity and permeability in
nanocrystalline ferromagnets. IEEE Transactions on Magnetics,26(5):1397–1402, 1990.
[26] G. Herzer. Nanocrystalline soft magnetic materials. Journal of Magnetism andMagnetic Materials, 112(1-3):258–262, 1992.
[27] R. Hasegawa and D. Azuma. Impacts of amorphous metal-based transformerson energy efficiency and environment. Journal of Magnetism and MagneticMaterials, 320(20):2451–2456, 2008.
[28] P. Álvarez, J.S. Marcos, P. Gorria, L.F. Barquín, and J.A. Blanco.Magneto-caloric effect in FeZrB amorphous alloys near room temperature.Journal of Alloys and Compounds, 504(SUPPL. 1):S150–S154, 2010.
[29] http://www.liquidmetal.com.[30] C. A. F. Vaz, J. A. C. Bland, and G. Lauhoff. Magnetism in ultrathin film
structures. Reports on Progress in Physics, 71(5):056501, 2008.[31] P. Poulopoulos and K. Baberschke. Magnetism in thin films. Journal of
Physics: Condensed Matter, 11(48):9495, 1999.[32] K. L. Chopra. Thin Film Phenomena. McGraw Hill, New York, 1969.[33] T. Miyazaki and N. Tezuka. Giant magnetic tunneling effect in Fe/Al2O3/Fe
junction. Journal of Magnetism and Magnetic Materials, 139(3):L231–L234,1995.
[34] J.S. Moodera, J. Nowak, and R.J.M. Van De Veerdonk. Interface magnetismand spin wave scattering in ferromagnet-insulator-ferromagnet tunnel junctions.Physical Review Letters, 80(13):2941–2944, 1998.
[35] Peter Mohn. Magnetism in the solid state. Springer, 2003.[36] B. D. Cullity and C. D. Graham. Introduction to Magnetic Materials. IEEE
Press, Wiley, 2009.[37] J.C. Lodder. Chapter 2: Magnetic recording hard disk thin film media.
volume 11 of Handbook of Magnetic Materials, pages 291 – 405. Elsevier,1998.
[38] S. Blundell. Magnetism in Condensed Matter. Oxford Master Series in
57
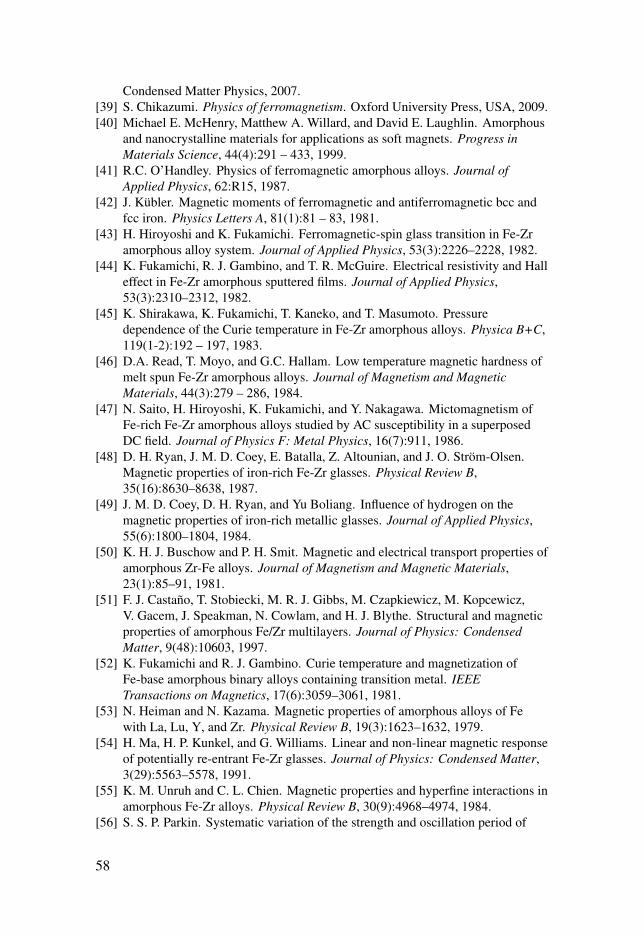
Condensed Matter Physics, 2007.[39] S. Chikazumi. Physics of ferromagnetism. Oxford University Press, USA, 2009.[40] Michael E. McHenry, Matthew A. Willard, and David E. Laughlin. Amorphous
and nanocrystalline materials for applications as soft magnets. Progress inMaterials Science, 44(4):291 – 433, 1999.
[41] R.C. O’Handley. Physics of ferromagnetic amorphous alloys. Journal ofApplied Physics, 62:R15, 1987.
[42] J. Kübler. Magnetic moments of ferromagnetic and antiferromagnetic bcc andfcc iron. Physics Letters A, 81(1):81 – 83, 1981.
[43] H. Hiroyoshi and K. Fukamichi. Ferromagnetic-spin glass transition in Fe-Zramorphous alloy system. Journal of Applied Physics, 53(3):2226–2228, 1982.
[44] K. Fukamichi, R. J. Gambino, and T. R. McGuire. Electrical resistivity and Halleffect in Fe-Zr amorphous sputtered films. Journal of Applied Physics,53(3):2310–2312, 1982.
[45] K. Shirakawa, K. Fukamichi, T. Kaneko, and T. Masumoto. Pressuredependence of the Curie temperature in Fe-Zr amorphous alloys. Physica B+C,119(1-2):192 – 197, 1983.
[46] D.A. Read, T. Moyo, and G.C. Hallam. Low temperature magnetic hardness ofmelt spun Fe-Zr amorphous alloys. Journal of Magnetism and MagneticMaterials, 44(3):279 – 286, 1984.
[47] N. Saito, H. Hiroyoshi, K. Fukamichi, and Y. Nakagawa. Mictomagnetism ofFe-rich Fe-Zr amorphous alloys studied by AC susceptibility in a superposedDC field. Journal of Physics F: Metal Physics, 16(7):911, 1986.
[48] D. H. Ryan, J. M. D. Coey, E. Batalla, Z. Altounian, and J. O. Ström-Olsen.Magnetic properties of iron-rich Fe-Zr glasses. Physical Review B,35(16):8630–8638, 1987.
[49] J. M. D. Coey, D. H. Ryan, and Yu Boliang. Influence of hydrogen on themagnetic properties of iron-rich metallic glasses. Journal of Applied Physics,55(6):1800–1804, 1984.
[50] K. H. J. Buschow and P. H. Smit. Magnetic and electrical transport properties ofamorphous Zr-Fe alloys. Journal of Magnetism and Magnetic Materials,23(1):85–91, 1981.
[51] F. J. Castaño, T. Stobiecki, M. R. J. Gibbs, M. Czapkiewicz, M. Kopcewicz,V. Gacem, J. Speakman, N. Cowlam, and H. J. Blythe. Structural and magneticproperties of amorphous Fe/Zr multilayers. Journal of Physics: CondensedMatter, 9(48):10603, 1997.
[52] K. Fukamichi and R. J. Gambino. Curie temperature and magnetization ofFe-base amorphous binary alloys containing transition metal. IEEETransactions on Magnetics, 17(6):3059–3061, 1981.
[53] N. Heiman and N. Kazama. Magnetic properties of amorphous alloys of Fewith La, Lu, Y, and Zr. Physical Review B, 19(3):1623–1632, 1979.
[54] H. Ma, H. P. Kunkel, and G. Williams. Linear and non-linear magnetic responseof potentially re-entrant Fe-Zr glasses. Journal of Physics: Condensed Matter,3(29):5563–5578, 1991.
[55] K. M. Unruh and C. L. Chien. Magnetic properties and hyperfine interactions inamorphous Fe-Zr alloys. Physical Review B, 30(9):4968–4974, 1984.
[56] S. S. P. Parkin. Systematic variation of the strength and oscillation period of
58
indirect magnetic exchange coupling through the 3d, 4d, and 5d transitionmetals. Physical Review Letters, 67:3598–3601, 1991.
[57] M.D. Stiles. Interlayer exchange coupling. Journal of Magnetism and MagneticMaterials, 200(1-3):322 – 337, 1999.
[58] E. Girt, W. Huttema, O. N. Mryasov, E. Montoya, B. Kardasz, C. Eyrich,B. Heinrich, A. Y. Dobin, and O. Karis. A method for measuring exchangestiffness in ferromagnetic films. Journal of Applied Physics, 109(7):07B765,2011.
[59] Richard M. Bozorth. Ferromagnetism. D. Van Nostrand Company Inc., 1956.[60] M. A. Tomaz H. Chen Tao Lin, M. M. Schwickert and G. R. Harp. Phys. Rev. B,
59:13911, 1999.[61] J. P. Teter K. B.Hathaway S. F. Cheng, A. N. Mansour and L. T. Kabacoff.
Phys. Rev. B, 47:206, 1993.[62] R.D. Lowde M.F. Collins, R.V. Jones. J. Phys. Soc. Japan, 17 (Suppl. B-III),
1962.[63] R Richter and H Eschrig. Spin-polarised electronic structure of disordered bcc
feco alloys from lcao-cpa. Journal of Physics F: Metal Physics, 18(8):1813,1988.
[64] M. F. Collins and J. B. Forsyth. The magnetic moment distribution in sometransition metal alloys. Philosophical Magazine, 8(87):401–410, 1963.
[65] S. Krompiewski, U. Krauss, and U. Krey. Computer studies of magnetizationfor amorphous Fe1−xZrxHy alloys. Phys. Rev. B, 39:2819–2821, 1989.
[66] J M Barandiarán, P Gorria, I Orúe, M L Fernández-Gubieda, F Plazaola,J C Gómez Sal, L Fernández Barquín, and L Fournes. Magnetic and transportproperties of Fe - Zr - B - (Cu) amorphous alloys. J. Phys.:Condens. Matter,9(26):5671–5685, 1997.
[67] J. M. Barandiarán, P. Gorria, I. Orúe, M. L. Fdez-Gubieda, F. Plazaola, andA. Hernando. Tensile stress dependence of the curie temperature and hyperfinefield in Fe-Zr-B-(Cu) amorphous alloys. Phys. Rev. B, 54:3026–3029, 1996.
[68] M. T. Johnson, P. J. H. Bloemen, F. J. A. den Broeder, and J. J. de Vries.Magnetic anisotropy in metallic multilayers. Reports on Progress in Physics,59(11):1409, 1996.
[69] Charles Eyrich. Exchange stiffness in thin-film cobalt alloys. Master’s thesis,Dalhousie University.
[70] H. E. Stanley. Introduction to Phase Transitions and Critical Phenomena.Oxford University Press, 1993.
[71] Peter M. Martin. Handbook of Deposition Technologies for Films and Coatings.Elsevier, 2009.
[72] D. L. Smith. Thin-Film Deposition. McGraw Hill, 1995.[73] Panagiotis Korelis. Uncovering Magnetic Order in Nanostructured Disordered
Materials: A Study of Amorphous Magnetic Layered Structures. PhD thesis,Uppsala University, Uppsala, 2011.
[74] M. Mayer. SIMNRA User’s Guide, Report IPP 9/113. Max-Planck-Institut furPlasmaphysik, Garching, Germany, 1997.
[75] B. Schmidt and K. Wetzig. Ion beams in material processing and analysis.Springer, 2013.
[76] J. F. Ziegler. The stopping and range of ions in matter. www.srim.org.
59

[77] J. Als-Nielsen and D. McMorrow. Elements of Modern X-ray Physics. JohnWiley & Sons Ltd., Chichester, 2001.
[78] E. Fullerton, I.K. Schuller, and H. Vanderstraeten. Structural refinement ofsuperlattices from x-ray diffraction. Physical Review B, 46:9292, 1992.
[79] H. Kiessig. Untersuchungen zur totalreflexion von röntgenstrahlen. Annalender physik (Leipzig), 10:715, 1931.
[80] M. Björck and G. Andersson. GenX: an extensible X-ray reflectivity refinementprogram utilizing differential evolution. Journal of Applied Crystallography,40:1174, 2007.
[81] D. Koelle, R. Kleiner, F. Ludwig, E. Dantsker, and J. Clarke.High-transition-temperature superconducting quantum interference devices.Reviews of Modern Physics, 71(3):631–686, 1999.
[82] Z. Q. Qiu and S. D. Bader. Surface magneto-optic Kerr effect. Review ofScientific Instruments, 71(3):1243–1255, 2000.
60


Acta Universitatis UpsaliensisDigital Comprehensive Summaries of Uppsala Dissertationsfrom the Faculty of Science and Technology 1218
Editor: The Dean of the Faculty of Science and Technology
A doctoral dissertation from the Faculty of Science andTechnology, Uppsala University, is usually a summary of anumber of papers. A few copies of the complete dissertationare kept at major Swedish research libraries, while thesummary alone is distributed internationally throughthe series Digital Comprehensive Summaries of UppsalaDissertations from the Faculty of Science and Technology.(Prior to January, 2005, the series was published under thetitle “Comprehensive Summaries of Uppsala Dissertationsfrom the Faculty of Science and Technology”.)
Distribution: publications.uu.seurn:nbn:se:uu:diva-239950
ACTAUNIVERSITATIS
UPSALIENSISUPPSALA
2015