metals sap: middle blackfoot, nevada creek, jefferson
TRANSCRIPT
MONITORING SUPPORT FOR MONTANA TMDLS EPA TASK ORDER 1, AMENDMENT 1, TASKS 2 AND 3
Middle Blackfoot/Nevada Creek, Jefferson, Tobacco, and Kootenai Watersheds Metals Monitoring 2012-2013
Sampling and Analysis Plan/Quality Assurance Project Plan Prepared by: ATKINS Water Resources Group 820 North Montana Avenue Helena, MT 59601 Approvals __________________ Jason Gildea, EPA Project Officer Date __________________ Lisa Kusnierz, EPA TMDL Coordinator Date __________________ Ron Steg, Tetra Tech Project Manager Date __________________ Gary Ingman, Atkins Project Manager Date __________________ Erich Weber, Atkins Quality Assurance Manager Date Linda Himmelbauer, EPA Quality Assurance Officer Date
Task Order 1 Tasks 2 and 3 SAP-01
Rev. 03 4/15/2013
TABLE OF CONTENTS
1.0 SAP/QAPP Distribution List ............................................................ 1
2.0 Project/Task Organization ............................................................... 1
3.0 Project Description ............................................................................ 2
4.0 Objectives and Design ....................................................................... 3
5.0 Training Requirements/Certifications .......................................... 11
6.0 Documentation and Records .......................................................... 12
7.0 Field Sampling Methods ................................................................. 13
8.0 Sample Handling and Laboratory Analytical Procedures .......... 16
9.0 Quality Assurance and Quality Control Requirements .............. 17
10.0 Instrument/Equipment Maintenace and Calibration .................. 20
11.0 Inspection and Acceptance Requirements for Supplies .............. 20
12.0 Data Analysis, Record Keeping, and Reporting Requirements..21
13.0 Assessments, Response Actions and Status Reports …………… 22
14.0 Data Review, Verification, and Validation ……………………. 22
15.0 Schedule for Completion ……………………………………….. 22
16.0 References ………………………………………………………..23
i
Task Order 1 Tasks 2 and 3 SAP-01
Rev. 03 4/15/2013
LIST OF TABLES
Table 1. Water body segments and number of monitoring stations in the Middle Blackfoot/Nevada
Creek, Jefferson, Tobacco, and Kootenai TMDL Planning Areas Table 2. Sampling locations in the Middle Blackfoot/Nevada Creek, Jefferson, Tobacco, and Kootenai
TMDL Planning Areas Table 3. Sampling timeframe for 2012-2013 monitoring Table 4. Monitoring parameters for impaired streams Table 5. Surface water and sediment sample parameters to be analyzed, by TPA or stream Table 6. Repository for project data records Table 7. Analyte suite for water column and stream-bed sediment samples
LIST OF FIGURES
Figure 1. Middle Blackfoot/Nevada Creek, Jefferson, Tobacco, and Kootenai Watersheds Monitoring and TMDLs Organizational Chart
Figure 2. Middle Blackfoot/Nevada Creek TPA sampling locations Figure 3. Jefferson TPA sampling locations Figure 4. Tobacco TPA sampling locations Figure 5. Kootenai TPA sampling locations
LIST OF APPENDICES
Appendix A. Analyte Checklist Appendix B. QA/QC Checklist Appendix C. Example of Site Visit/Chain of Custody Form Appendix D. Links to On-Line Field equipment Manuals Appendix E. Water Sample Collection Procedures for Low-Level Total Mercury
ii
Task Order 1 Tasks 2 and 3 SAP-01
Rev. 03 4/15/2013
1.0 SAP/QAPP Distribution List
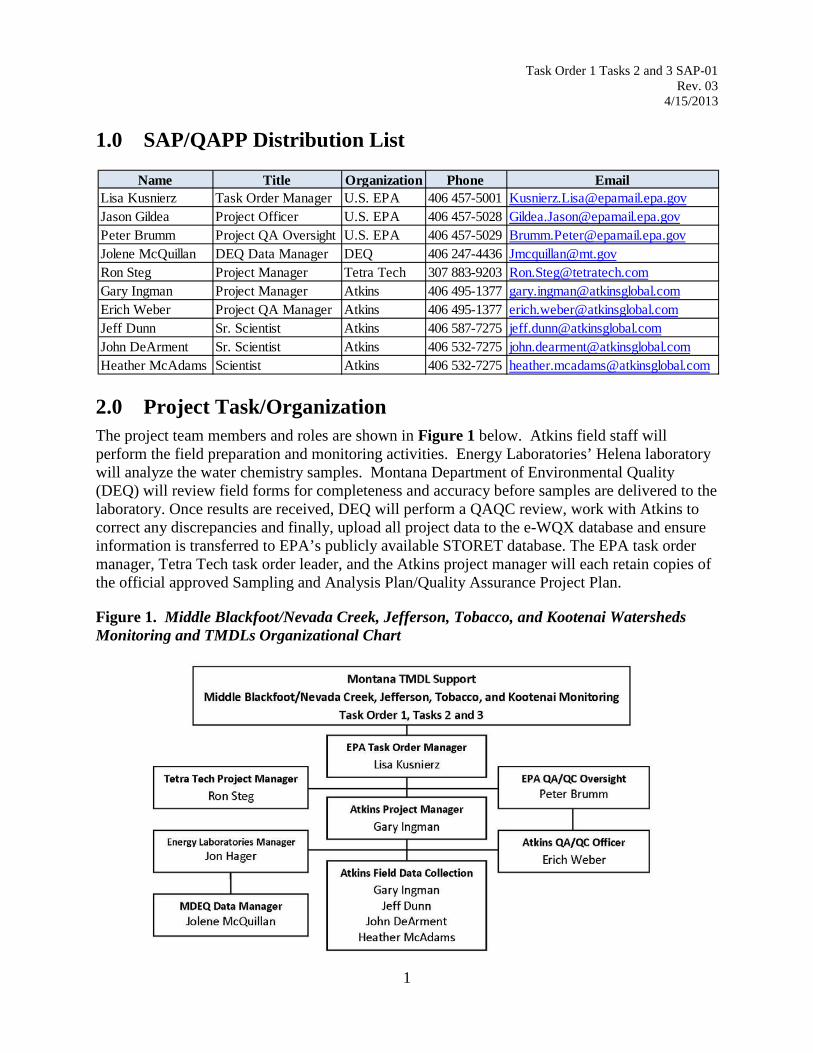
2.0 Project Task/Organization The project team members and roles are shown in Figure 1 below. Atkins field staff will perform the field preparation and monitoring activities. Energy Laboratories’ Helena laboratory will analyze the water chemistry samples. Montana Department of Environmental Quality (DEQ) will review field forms for completeness and accuracy before samples are delivered to the laboratory. Once results are received, DEQ will perform a QAQC review, work with Atkins to correct any discrepancies and finally, upload all project data to the e-WQX database and ensure information is transferred to EPA’s publicly available STORET database. The EPA task order manager, Tetra Tech task order leader, and the Atkins project manager will each retain copies of the official approved Sampling and Analysis Plan/Quality Assurance Project Plan.
Figure 1. Middle Blackfoot/Nevada Creek, Jefferson, Tobacco, and Kootenai Watersheds Monitoring and TMDLs Organizational Chart
Name Title Organization Phone EmailLisa Kusnierz Task Order Manager U.S. EPA 406 457-5001 [email protected] Gildea Project Officer U.S. EPA 406 457-5028 [email protected] Brumm Project QA Oversight U.S. EPA 406 457-5029 [email protected] McQuillan DEQ Data Manager DEQ 406 247-4436 [email protected] Steg Project Manager Tetra Tech 307 883-9203 [email protected] Ingman Project Manager Atkins 406 495-1377 [email protected] Weber Project QA Manager Atkins 406 495-1377 [email protected] Dunn Sr. Scientist Atkins 406 587-7275 [email protected] DeArment Sr. Scientist Atkins 406 532-7275 [email protected] McAdams Scientist Atkins 406 532-7275 [email protected]
1
Task Order 1 Tasks 2 and 3 SAP-01
Rev. 03 4/15/2013
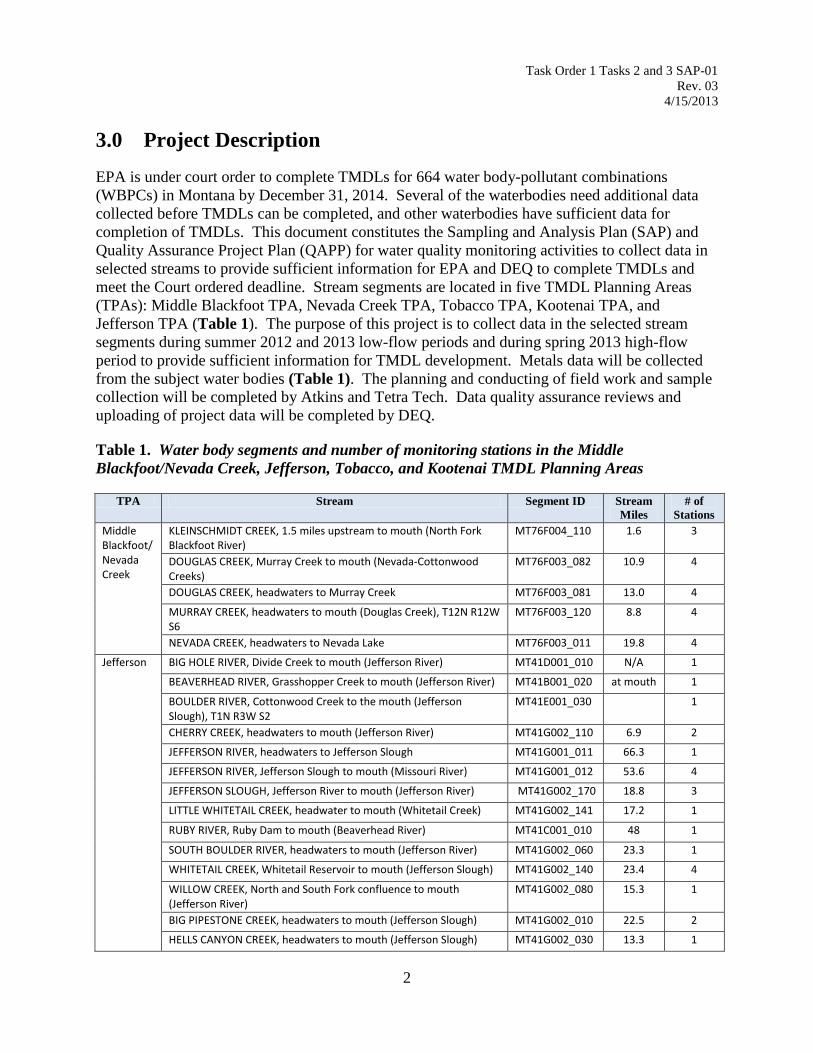
3.0 Project Description EPA is under court order to complete TMDLs for 664 water body-pollutant combinations (WBPCs) in Montana by December 31, 2014. Several of the waterbodies need additional data collected before TMDLs can be completed, and other waterbodies have sufficient data for completion of TMDLs. This document constitutes the Sampling and Analysis Plan (SAP) and Quality Assurance Project Plan (QAPP) for water quality monitoring activities to collect data in selected streams to provide sufficient information for EPA and DEQ to complete TMDLs and meet the Court ordered deadline. Stream segments are located in five TMDL Planning Areas (TPAs): Middle Blackfoot TPA, Nevada Creek TPA, Tobacco TPA, Kootenai TPA, and Jefferson TPA (Table 1). The purpose of this project is to collect data in the selected stream segments during summer 2012 and 2013 low-flow periods and during spring 2013 high-flow period to provide sufficient information for TMDL development. Metals data will be collected from the subject water bodies (Table 1). The planning and conducting of field work and sample collection will be completed by Atkins and Tetra Tech. Data quality assurance reviews and uploading of project data will be completed by DEQ.
Table 1. Water body segments and number of monitoring stations in the Middle Blackfoot/Nevada Creek, Jefferson, Tobacco, and Kootenai TMDL Planning Areas
TPA Stream Segment ID Stream Miles
# of Stations
Middle Blackfoot/ Nevada Creek
KLEINSCHMIDT CREEK, 1.5 miles upstream to mouth (North Fork Blackfoot River)
MT76F004_110 1.6 3
DOUGLAS CREEK, Murray Creek to mouth (Nevada-Cottonwood Creeks)
MT76F003_082 10.9 4
DOUGLAS CREEK, headwaters to Murray Creek MT76F003_081 13.0 4
MURRAY CREEK, headwaters to mouth (Douglas Creek), T12N R12W S6
MT76F003_120 8.8 4
NEVADA CREEK, headwaters to Nevada Lake MT76F003_011 19.8 4
Jefferson BIG HOLE RIVER, Divide Creek to mouth (Jefferson River) MT41D001_010 N/A 1
BEAVERHEAD RIVER, Grasshopper Creek to mouth (Jefferson River) MT41B001_020 at mouth 1
BOULDER RIVER, Cottonwood Creek to the mouth (Jefferson Slough), T1N R3W S2
MT41E001_030 1
CHERRY CREEK, headwaters to mouth (Jefferson River) MT41G002_110 6.9 2
JEFFERSON RIVER, headwaters to Jefferson Slough MT41G001_011 66.3 1
JEFFERSON RIVER, Jefferson Slough to mouth (Missouri River) MT41G001_012 53.6 4
JEFFERSON SLOUGH, Jefferson River to mouth (Jefferson River) MT41G002_170 18.8 3
LITTLE WHITETAIL CREEK, headwater to mouth (Whitetail Creek) MT41G002_141 17.2 1
RUBY RIVER, Ruby Dam to mouth (Beaverhead River) MT41C001_010 48 1
SOUTH BOULDER RIVER, headwaters to mouth (Jefferson River) MT41G002_060 23.3 1
WHITETAIL CREEK, Whitetail Reservoir to mouth (Jefferson Slough) MT41G002_140 23.4 4
WILLOW CREEK, North and South Fork confluence to mouth (Jefferson River)
MT41G002_080 15.3 1
BIG PIPESTONE CREEK, headwaters to mouth (Jefferson Slough) MT41G002_010 22.5 2
HELLS CANYON CREEK, headwaters to mouth (Jefferson Slough) MT41G002_030 13.3 1
2
Task Order 1 Tasks 2 and 3 SAP-01
Rev. 03 4/15/2013
Table 1. (continued)
TPA Stream Segment ID Stream Miles
# of Stations
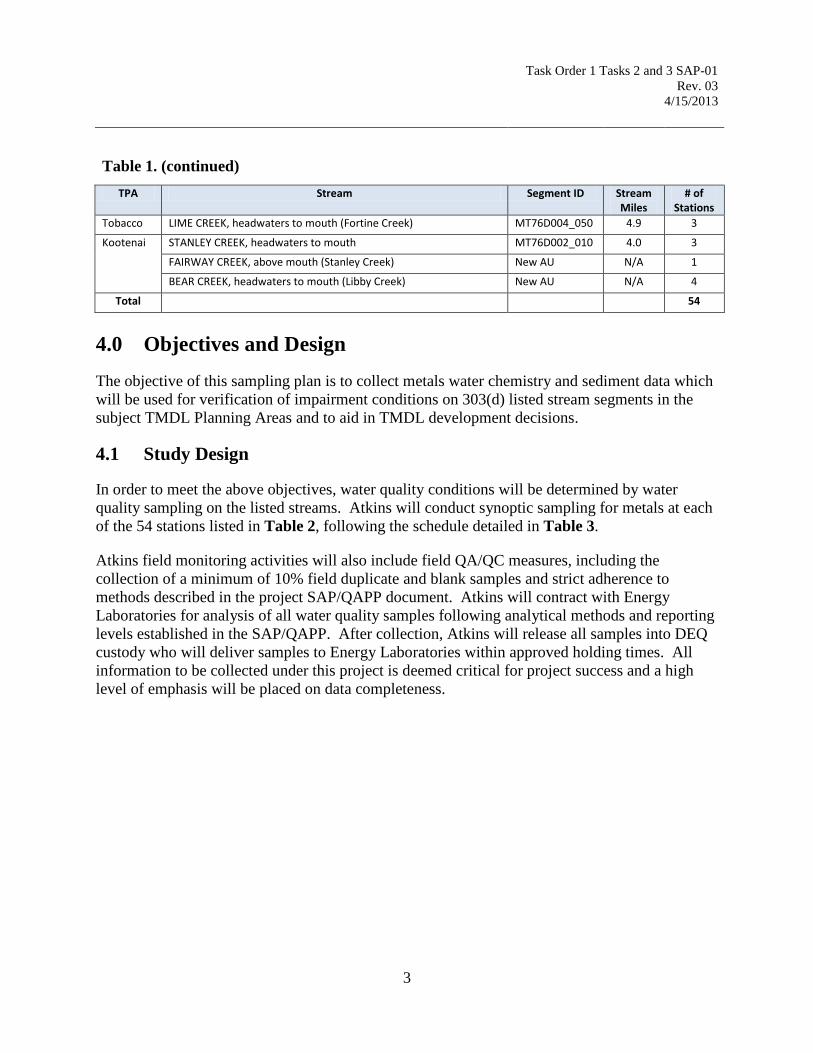
Tobacco LIME CREEK, headwaters to mouth (Fortine Creek) MT76D004_050 4.9 3
Kootenai STANLEY CREEK, headwaters to mouth MT76D002_010 4.0 3
FAIRWAY CREEK, above mouth (Stanley Creek) New AU N/A 1
BEAR CREEK, headwaters to mouth (Libby Creek) New AU N/A 4
Total 54
4.0 Objectives and Design The objective of this sampling plan is to collect metals water chemistry and sediment data which will be used for verification of impairment conditions on 303(d) listed stream segments in the subject TMDL Planning Areas and to aid in TMDL development decisions.
4.1 Study Design
In order to meet the above objectives, water quality conditions will be determined by water quality sampling on the listed streams. Atkins will conduct synoptic sampling for metals at each of the 54 stations listed in Table 2, following the schedule detailed in Table 3.
Atkins field monitoring activities will also include field QA/QC measures, including the collection of a minimum of 10% field duplicate and blank samples and strict adherence to methods described in the project SAP/QAPP document. Atkins will contract with Energy Laboratories for analysis of all water quality samples following analytical methods and reporting levels established in the SAP/QAPP. After collection, Atkins will release all samples into DEQ custody who will deliver samples to Energy Laboratories within approved holding times. All information to be collected under this project is deemed critical for project success and a high level of emphasis will be placed on data completeness.
3
Task Order 1 Tasks 2 and 3 SAP-01
Rev. 03 4/15/2013
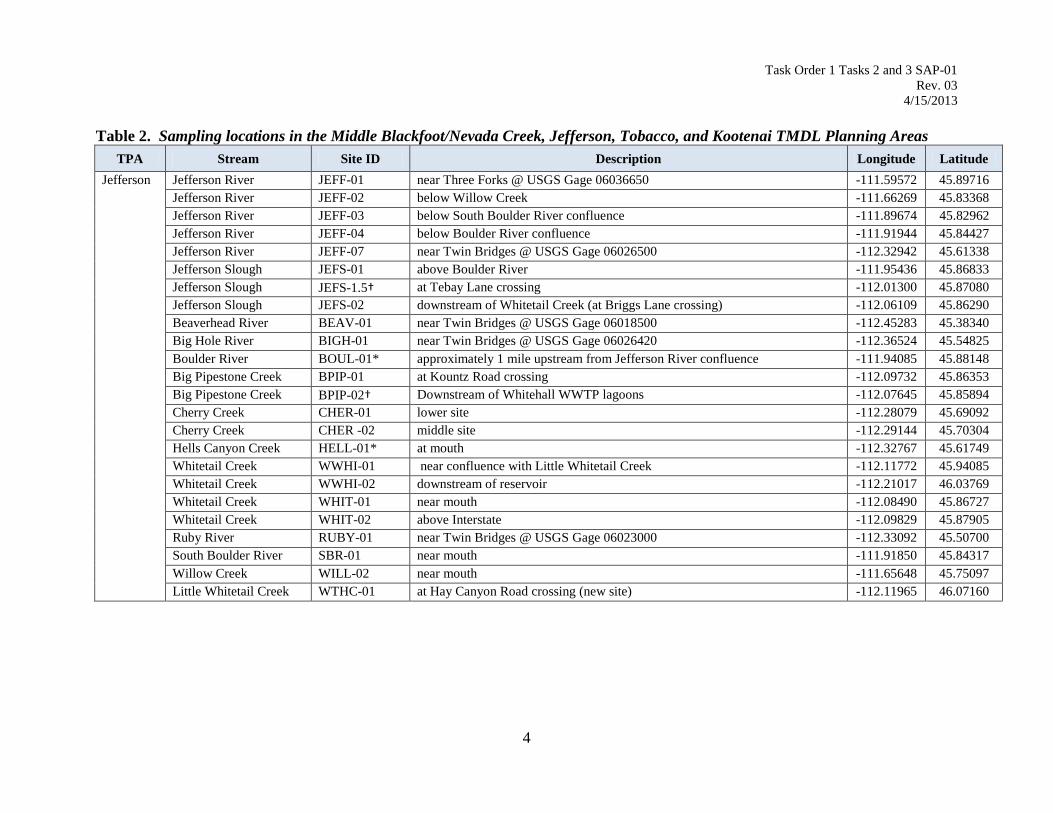
Table 2. Sampling locations in the Middle Blackfoot/Nevada Creek, Jefferson, Tobacco, and Kootenai TMDL Planning Areas
TPA Stream Site ID Description Longitude Latitude Jefferson
Jefferson River JEFF-01 near Three Forks @ USGS Gage 06036650 -111.59572 45.89716 Jefferson River JEFF-02 below Willow Creek -111.66269 45.83368 Jefferson River JEFF-03 below South Boulder River confluence -111.89674 45.82962 Jefferson River JEFF-04 below Boulder River confluence -111.91944 45.84427 Jefferson River JEFF-07 near Twin Bridges @ USGS Gage 06026500 -112.32942 45.61338 Jefferson Slough JEFS-01 above Boulder River -111.95436 45.86833 Jefferson Slough JEFS-1.5† at Tebay Lane crossing -112.01300 45.87080 Jefferson Slough JEFS-02 downstream of Whitetail Creek (at Briggs Lane crossing) -112.06109 45.86290 Beaverhead River BEAV-01 near Twin Bridges @ USGS Gage 06018500 -112.45283 45.38340 Big Hole River BIGH-01 near Twin Bridges @ USGS Gage 06026420 -112.36524 45.54825 Boulder River BOUL-01* approximately 1 mile upstream from Jefferson River confluence -111.94085 45.88148 Big Pipestone Creek BPIP-01 at Kountz Road crossing -112.09732 45.86353 Big Pipestone Creek BPIP-02† Downstream of Whitehall WWTP lagoons -112.07645 45.85894 Cherry Creek CHER-01 lower site -112.28079 45.69092 Cherry Creek CHER -02 middle site -112.29144 45.70304 Hells Canyon Creek HELL-01* at mouth -112.32767 45.61749 Whitetail Creek WWHI-01 near confluence with Little Whitetail Creek -112.11772 45.94085 Whitetail Creek WWHI-02 downstream of reservoir -112.21017 46.03769 Whitetail Creek WHIT-01 near mouth -112.08490 45.86727 Whitetail Creek WHIT-02 above Interstate -112.09829 45.87905 Ruby River RUBY-01 near Twin Bridges @ USGS Gage 06023000 -112.33092 45.50700 South Boulder River SBR-01 near mouth -111.91850 45.84317 Willow Creek WILL-02 near mouth -111.65648 45.75097 Little Whitetail Creek WTHC-01 at Hay Canyon Road crossing (new site) -112.11965 46.07160
4
Task Order 1 Tasks 2 and 3 SAP-01
Rev. 03 4/15/2013
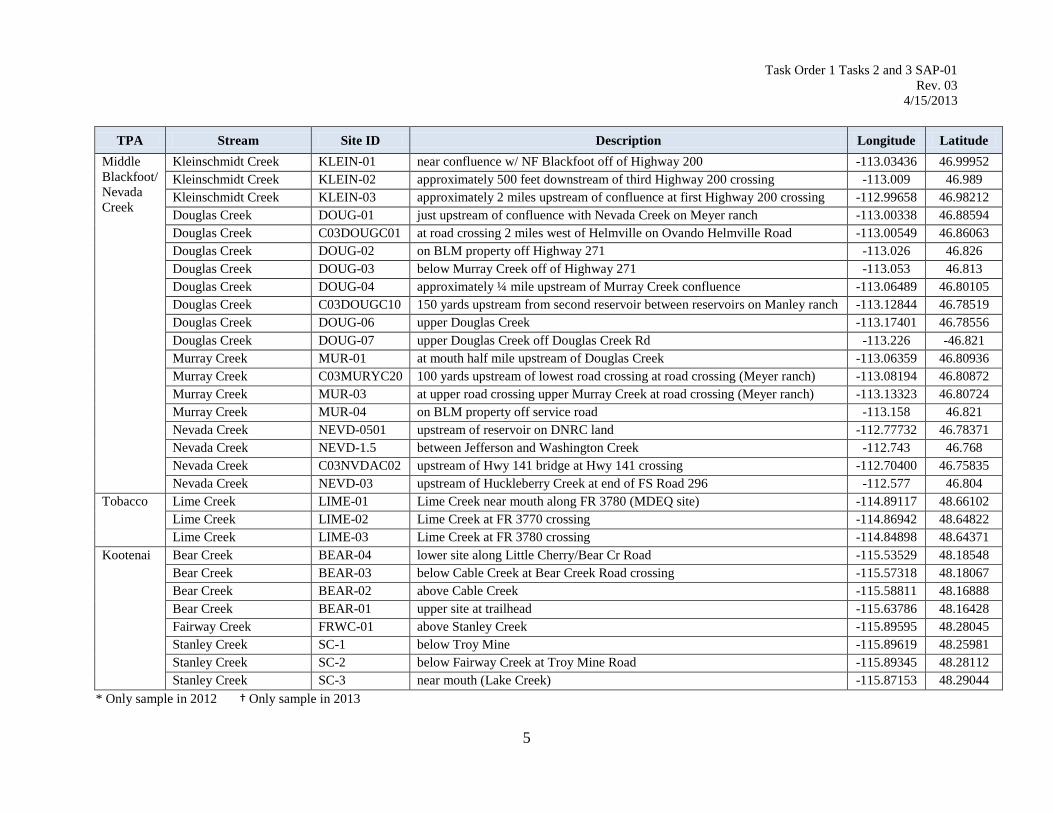
TPA Stream Site ID Description Longitude Latitude
Middle Blackfoot/ Nevada Creek
Kleinschmidt Creek KLEIN-01 near confluence w/ NF Blackfoot off of Highway 200 -113.03436 46.99952 Kleinschmidt Creek KLEIN-02 approximately 500 feet downstream of third Highway 200 crossing -113.009 46.989 Kleinschmidt Creek KLEIN-03 approximately 2 miles upstream of confluence at first Highway 200 crossing -112.99658 46.98212 Douglas Creek DOUG-01 just upstream of confluence with Nevada Creek on Meyer ranch -113.00338 46.88594 Douglas Creek C03DOUGC01 at road crossing 2 miles west of Helmville on Ovando Helmville Road -113.00549 46.86063 Douglas Creek DOUG-02 on BLM property off Highway 271 -113.026 46.826 Douglas Creek DOUG-03 below Murray Creek off of Highway 271 -113.053 46.813 Douglas Creek DOUG-04 approximately ¼ mile upstream of Murray Creek confluence -113.06489 46.80105 Douglas Creek C03DOUGC10 150 yards upstream from second reservoir between reservoirs on Manley ranch -113.12844 46.78519 Douglas Creek DOUG-06 upper Douglas Creek -113.17401 46.78556 Douglas Creek DOUG-07 upper Douglas Creek off Douglas Creek Rd -113.226 -46.821 Murray Creek MUR-01 at mouth half mile upstream of Douglas Creek -113.06359 46.80936 Murray Creek C03MURYC20 100 yards upstream of lowest road crossing at road crossing (Meyer ranch) -113.08194 46.80872 Murray Creek MUR-03 at upper road crossing upper Murray Creek at road crossing (Meyer ranch) -113.13323 46.80724 Murray Creek MUR-04 on BLM property off service road -113.158 46.821 Nevada Creek NEVD-0501 upstream of reservoir on DNRC land -112.77732 46.78371 Nevada Creek NEVD-1.5 between Jefferson and Washington Creek -112.743 46.768 Nevada Creek C03NVDAC02 upstream of Hwy 141 bridge at Hwy 141 crossing -112.70400 46.75835 Nevada Creek NEVD-03 upstream of Huckleberry Creek at end of FS Road 296 -112.577 46.804
Tobacco Lime Creek LIME-01 Lime Creek near mouth along FR 3780 (MDEQ site) -114.89117 48.66102 Lime Creek LIME-02 Lime Creek at FR 3770 crossing -114.86942 48.64822 Lime Creek LIME-03 Lime Creek at FR 3780 crossing -114.84898 48.64371
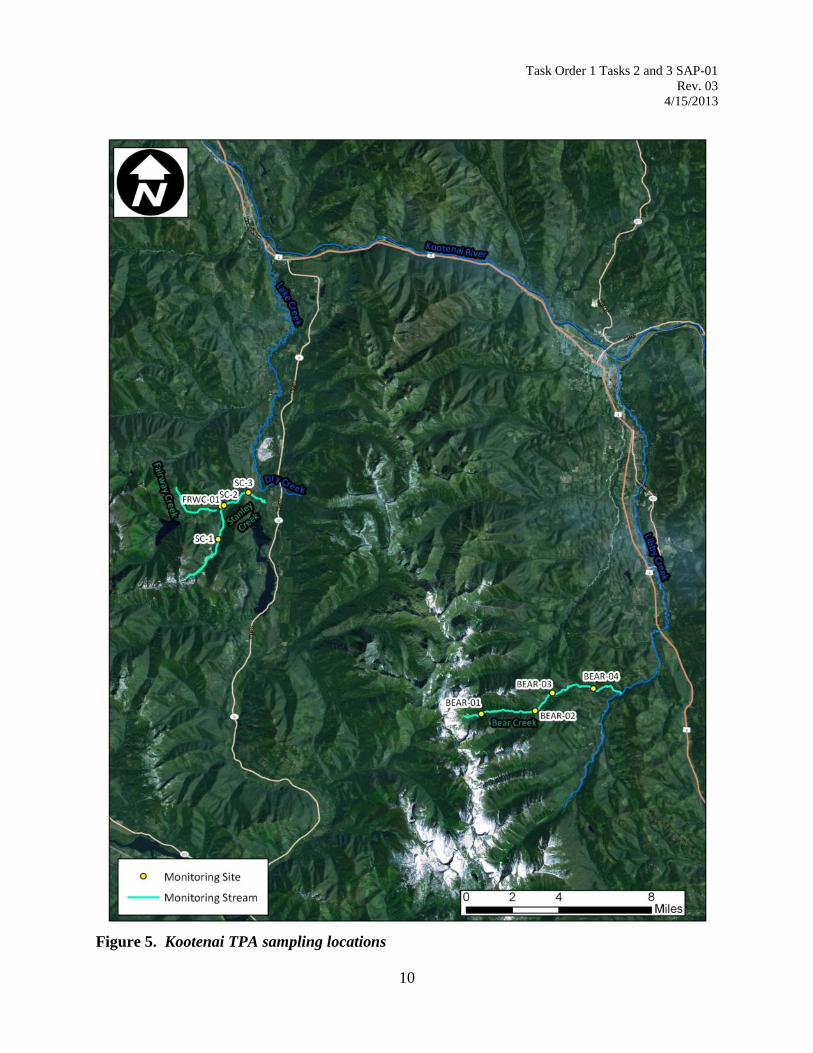
Kootenai Bear Creek BEAR-04 lower site along Little Cherry/Bear Cr Road -115.53529 48.18548 Bear Creek BEAR-03 below Cable Creek at Bear Creek Road crossing -115.57318 48.18067 Bear Creek BEAR-02 above Cable Creek -115.58811 48.16888 Bear Creek BEAR-01 upper site at trailhead -115.63786 48.16428 Fairway Creek FRWC-01 above Stanley Creek -115.89595 48.28045 Stanley Creek SC-1 below Troy Mine -115.89619 48.25981 Stanley Creek SC-2 below Fairway Creek at Troy Mine Road -115.89345 48.28112 Stanley Creek SC-3 near mouth (Lake Creek) -115.87153 48.29044
* Only sample in 2012 † Only sample in 2013
5
Task Order 1 Tasks 2 and 3 SAP-01
Rev. 03 4/15/2013
Table 3. Sampling Timeframe for 2012-2013 Monitoring
Sampling Event
Water Column Sediment
Low flow 2012 Kootenai, Jefferson, Tobacco Bear Creek (Kootenai) High flow 2013 Jefferson , Middle Blackfoot/Nevada Creek, Tobacco Low flow 2013 Middle Blackfoot/Nevada Creek, Tobacco Middle Blackfoot/ Nevada Creek
4.2 Sampling Sites
Sampling sites within each of the impaired stream segments were chosen based on consideration of the following factors:
• Ability to bracket known sources • Previous monitoring at the site by federal or state agencies. • Site access (Atkins will contact all relevant landowners to obtain permission for
sampling at all sites except those on the Middle Blackfoot/Nevada Creek, which will be handled by the Blackfoot Challenge. Alternate sites may be needed if access is denied).
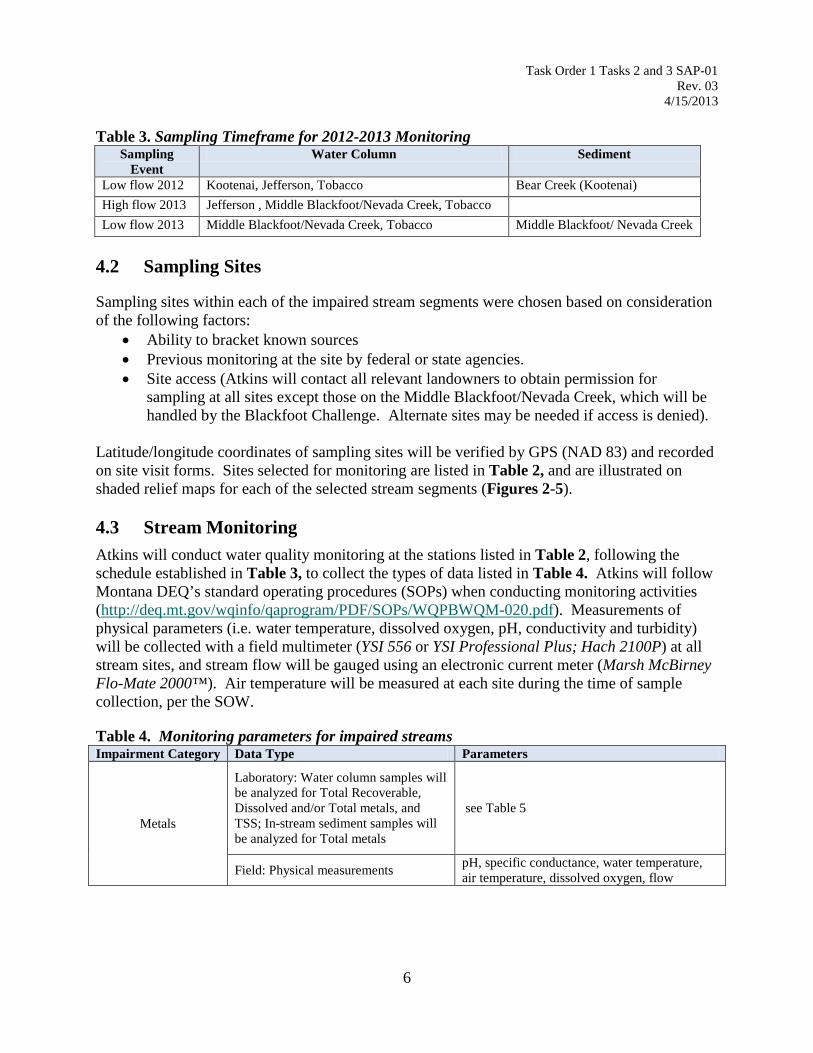
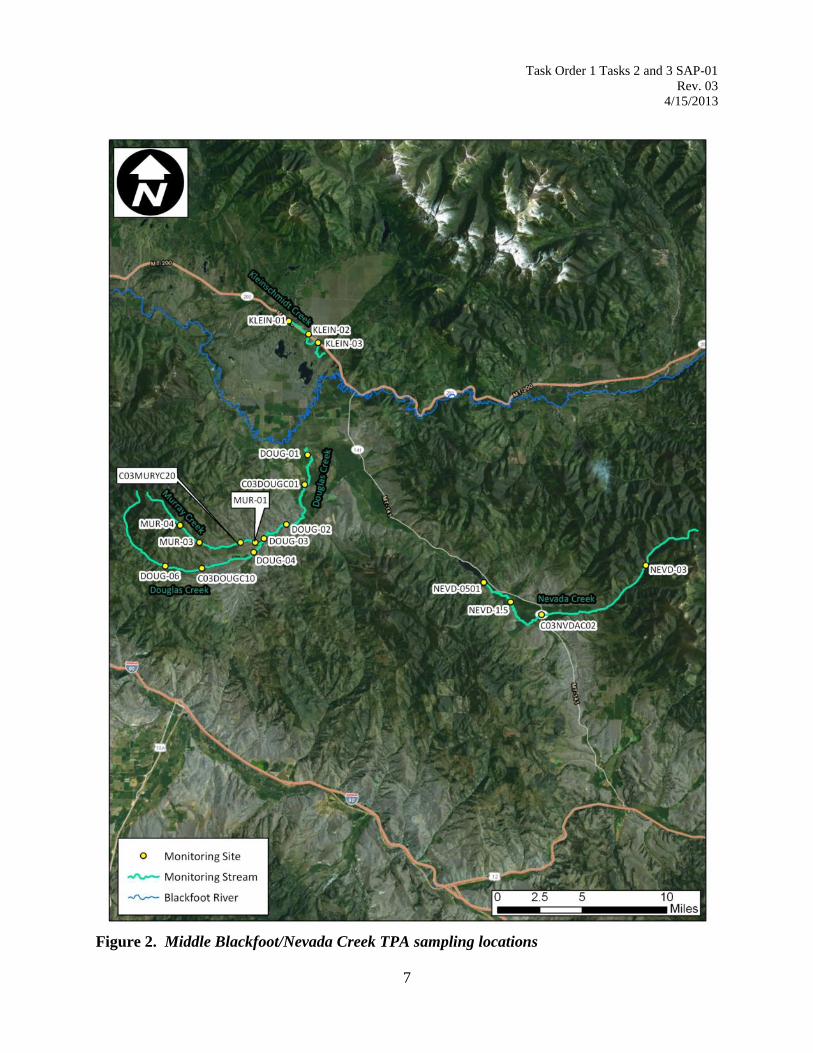
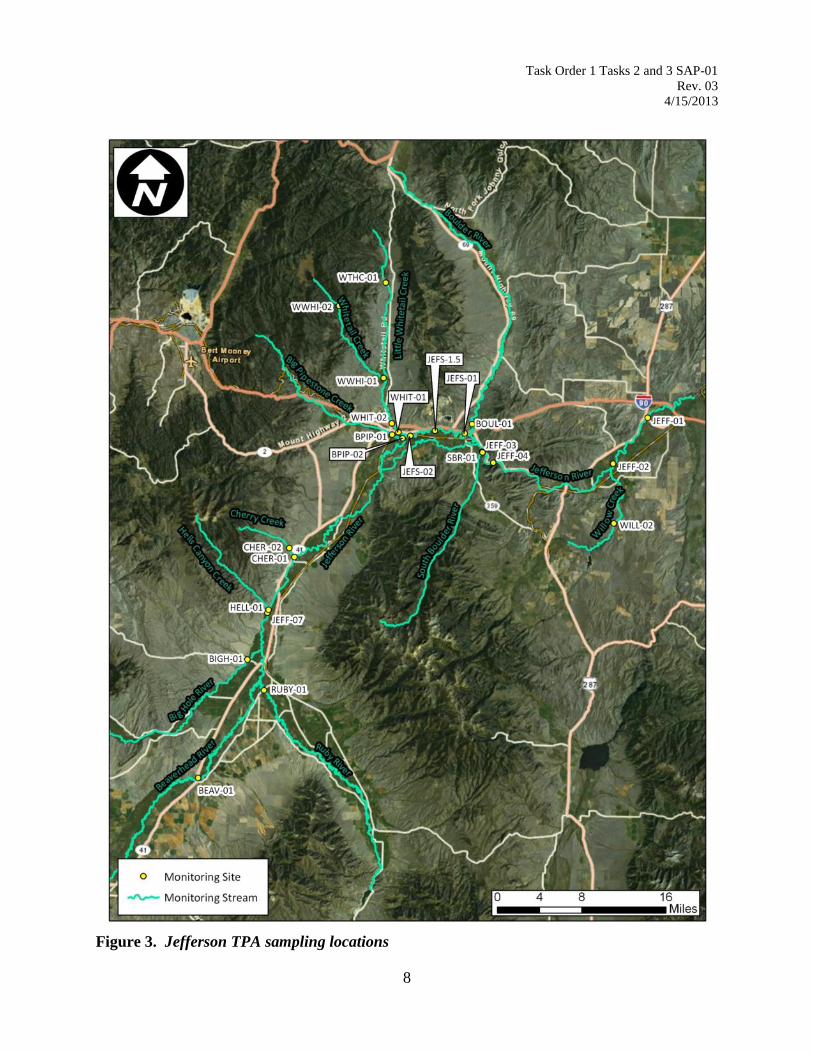
Latitude/longitude coordinates of sampling sites will be verified by GPS (NAD 83) and recorded on site visit forms. Sites selected for monitoring are listed in Table 2, and are illustrated on shaded relief maps for each of the selected stream segments (Figures 2-5). 4.3 Stream Monitoring Atkins will conduct water quality monitoring at the stations listed in Table 2, following the schedule established in Table 3, to collect the types of data listed in Table 4. Atkins will follow Montana DEQ’s standard operating procedures (SOPs) when conducting monitoring activities (http://deq.mt.gov/wqinfo/qaprogram/PDF/SOPs/WQPBWQM-020.pdf). Measurements of physical parameters (i.e. water temperature, dissolved oxygen, pH, conductivity and turbidity) will be collected with a field multimeter (YSI 556 or YSI Professional Plus; Hach 2100P) at all stream sites, and stream flow will be gauged using an electronic current meter (Marsh McBirney Flo-Mate 2000™). Air temperature will be measured at each site during the time of sample collection, per the SOW.
Table 4. Monitoring parameters for impaired streams Impairment Category Data Type Parameters
Metals
Laboratory: Water column samples will be analyzed for Total Recoverable, Dissolved and/or Total metals, and TSS; In-stream sediment samples will be analyzed for Total metals
see Table 5
Field: Physical measurements pH, specific conductance, water temperature, air temperature, dissolved oxygen, flow
6
Task Order 1 Tasks 2 and 3 SAP-01
Rev. 03 4/15/2013
Figure 2. Middle Blackfoot/Nevada Creek TPA sampling locations
7
Task Order 1 Tasks 2 and 3 SAP-01
Rev. 03 4/15/2013
Figure 3. Jefferson TPA sampling locations
8
Task Order 1 Tasks 2 and 3 SAP-01
Rev. 03 4/15/2013
Figure 4. Tobacco TPA sampling locations
9
Task Order 1 Tasks 2 and 3 SAP-01
Rev. 03 4/15/2013
Figure 5. Kootenai TPA sampling locations
10
Task Order 1 Tasks 2 and 3 SAP-01
Rev. 03 4/15/2013
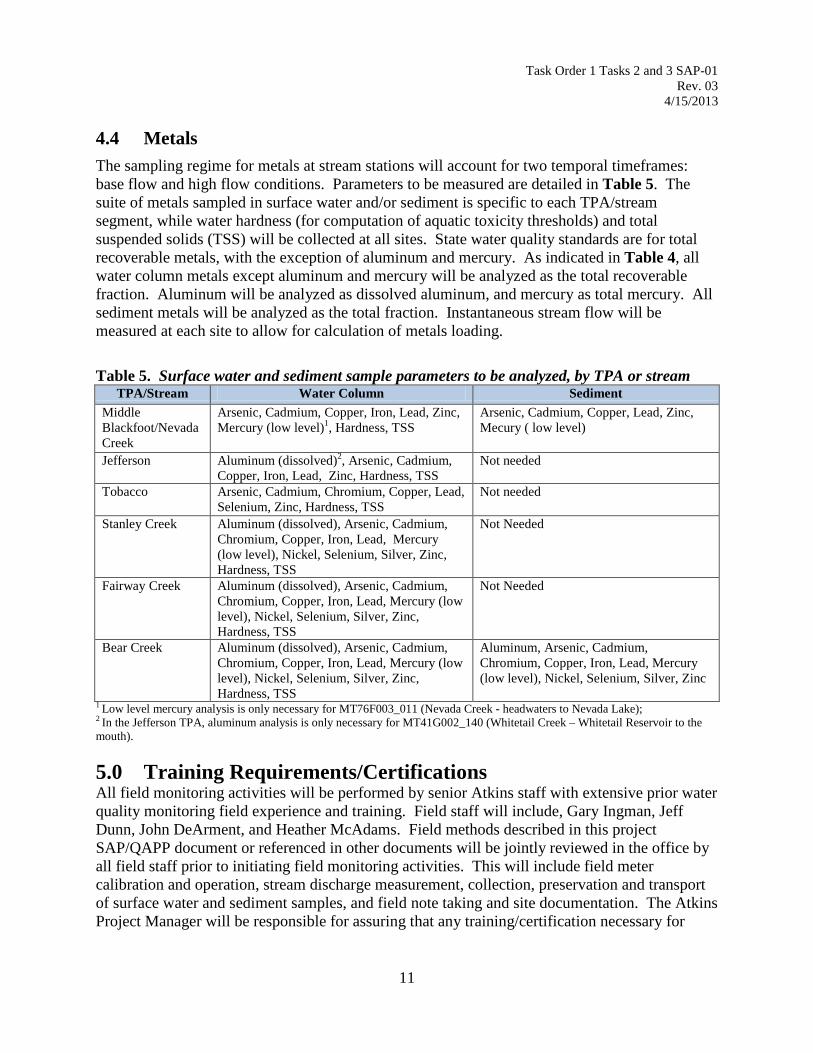
4.4 Metals The sampling regime for metals at stream stations will account for two temporal timeframes: base flow and high flow conditions. Parameters to be measured are detailed in Table 5. The suite of metals sampled in surface water and/or sediment is specific to each TPA/stream segment, while water hardness (for computation of aquatic toxicity thresholds) and total suspended solids (TSS) will be collected at all sites. State water quality standards are for total recoverable metals, with the exception of aluminum and mercury. As indicated in Table 4, all water column metals except aluminum and mercury will be analyzed as the total recoverable fraction. Aluminum will be analyzed as dissolved aluminum, and mercury as total mercury. All sediment metals will be analyzed as the total fraction. Instantaneous stream flow will be measured at each site to allow for calculation of metals loading.
Table 5. Surface water and sediment sample parameters to be analyzed, by TPA or stream
TPA/Stream Water Column Sediment Middle Blackfoot/Nevada Creek
Arsenic, Cadmium, Copper, Iron, Lead, Zinc, Mercury (low level)1, Hardness, TSS
Arsenic, Cadmium, Copper, Lead, Zinc, Mecury ( low level)
Jefferson Aluminum (dissolved)2, Arsenic, Cadmium, Copper, Iron, Lead, Zinc, Hardness, TSS
Not needed
Tobacco Arsenic, Cadmium, Chromium, Copper, Lead, Selenium, Zinc, Hardness, TSS
Not needed
Stanley Creek Aluminum (dissolved), Arsenic, Cadmium, Chromium, Copper, Iron, Lead, Mercury (low level), Nickel, Selenium, Silver, Zinc, Hardness, TSS
Not Needed
Fairway Creek Aluminum (dissolved), Arsenic, Cadmium, Chromium, Copper, Iron, Lead, Mercury (low level), Nickel, Selenium, Silver, Zinc, Hardness, TSS
Not Needed
Bear Creek Aluminum (dissolved), Arsenic, Cadmium, Chromium, Copper, Iron, Lead, Mercury (low level), Nickel, Selenium, Silver, Zinc, Hardness, TSS
Aluminum, Arsenic, Cadmium, Chromium, Copper, Iron, Lead, Mercury (low level), Nickel, Selenium, Silver, Zinc
1 Low level mercury analysis is only necessary for MT76F003_011 (Nevada Creek - headwaters to Nevada Lake); 2 In the Jefferson TPA, aluminum analysis is only necessary for MT41G002_140 (Whitetail Creek – Whitetail Reservoir to the mouth).
5.0 Training Requirements/Certifications All field monitoring activities will be performed by senior Atkins staff with extensive prior water quality monitoring field experience and training. Field staff will include, Gary Ingman, Jeff Dunn, John DeArment, and Heather McAdams. Field methods described in this project SAP/QAPP document or referenced in other documents will be jointly reviewed in the office by all field staff prior to initiating field monitoring activities. This will include field meter calibration and operation, stream discharge measurement, collection, preservation and transport of surface water and sediment samples, and field note taking and site documentation. The Atkins Project Manager will be responsible for assuring that any training/certification necessary for
11
Task Order 1 Tasks 2 and 3 SAP-01
Rev. 03 4/15/2013
Atkins field staff to properly conduct monitoring activities is satisfied. Documentation of training/certifications for all Atkins field staff will be maintained in the project file.
One or more field audits will be performed by U.S. EPA project staff during completion of the monitoring activities by Atkins staff. The audits will address site selection, field measurements, sample collection, filtration and preservation, and record keeping.
6.0 Documentation and Records The Atkins project manager will be responsible for hand delivering a copy of the final approved QA Project Plan to project team members listed in Section 1.0. Revisions to the QAPP will be drafted by the Atkins quality assurance officer and approved by the Atkins project manager. The Atkins quality assurance officer will save the revised QAPP document in electronic file form, and will be responsible for distributing electronic copies in pdf format to all team members. All required field site visit forms will be completed on-site by field personnel prior to leaving each field monitoring location. Site visit/chain of custody (COC) forms, discharge measurement field forms, and any supplemental field forms shall be compiled by field personnel with associated surface water and sediment samples, and hand delivered or shipped by UPS to the pre-arranged individual at Montana DEQ. Following a review of sample COCs and field forms for accuracy and completeness, DEQ will submit samples to the appropriate laboratories for analysis. Photocopies of all site visit/COC field forms submitted to DEQ shall be retained by field personnel and submitted to the Atkins quality assurance officer upon return to the office, along with photograph field logs and electronic files of digital field photographs. The Atkins quality assurance officer will review and compile field photographs and photo logs, and submit copies to appropriate parties as project data deliverables.
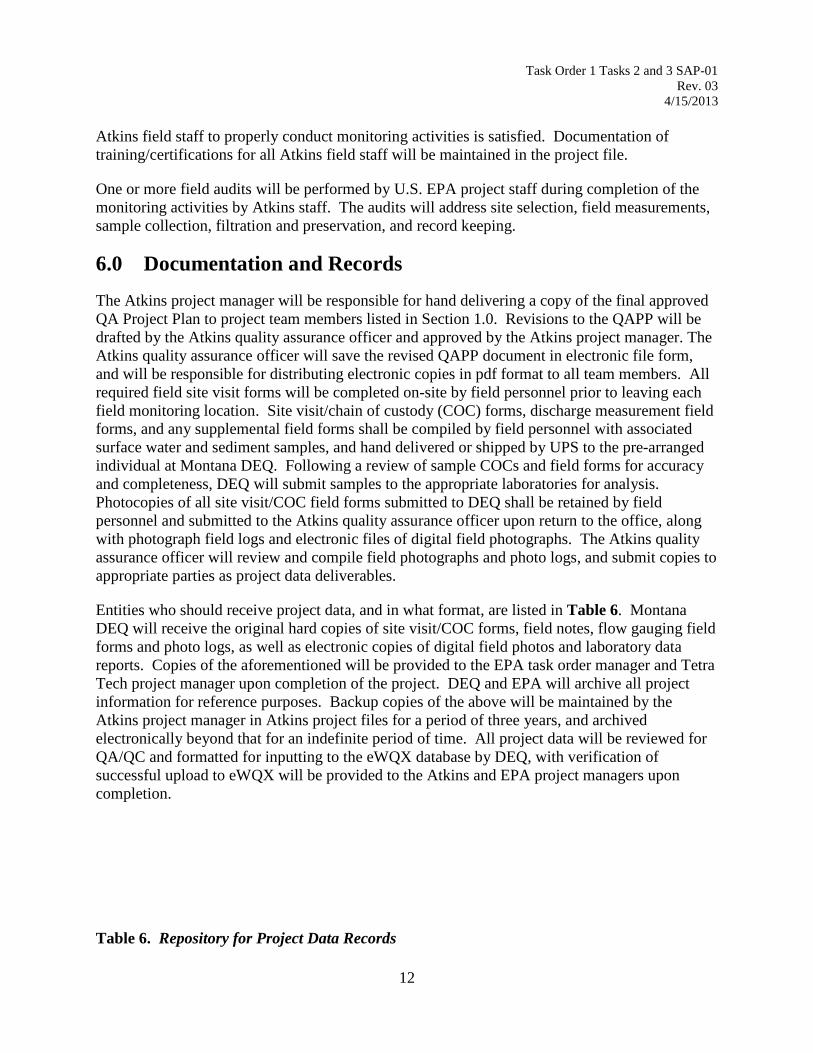
Entities who should receive project data, and in what format, are listed in Table 6. Montana DEQ will receive the original hard copies of site visit/COC forms, field notes, flow gauging field forms and photo logs, as well as electronic copies of digital field photos and laboratory data reports. Copies of the aforementioned will be provided to the EPA task order manager and Tetra Tech project manager upon completion of the project. DEQ and EPA will archive all project information for reference purposes. Backup copies of the above will be maintained by the Atkins project manager in Atkins project files for a period of three years, and archived electronically beyond that for an indefinite period of time. All project data will be reviewed for QA/QC and formatted for inputting to the eWQX database by DEQ, with verification of successful upload to eWQX will be provided to the Atkins and EPA project managers upon completion.
Table 6. Repository for Project Data Records
12
Task Order 1 Tasks 2 and 3 SAP-01
Rev. 03 4/15/2013
7.0 Field Sampling Methods
7.1 Stream Sites
Monitoring will be done in accordance with the MDEQ’s Field Procedures Manual which is available on the internet at: http://deq.mt.gov/wqinfo/qaprogram/PDF/SOPs/WQPBWQM-020.pdf (DEQ, 2012). Each sampling site was selected to be representative of the specific reach of interest in each stream segment, as detailed in Section 4.2. Every effort will be made to collect samples from a specified location; however, the final sampling location may require adjustment due to circumstances encountered in the field. Samples will be collected in a well-mixed portion of each stream, or, if the stream has ceased flowing (intermittent), the sample will be collected at the surface in a pool without disturbing the sediments. 7.2 Metals The metals analysis suite for water column and stream-bed sediment samples for this project is shown in Table 7. Grab samples of water for total recoverable (TR) metals and TSS analysis will be collected at all sites. Total hardness will be calculated by the laboratory using calcium and magnesium values determined from the TR metals sample. Where required, grab samples for total mercury, field-filtered samples for dissolved aluminum, and composite samples of in-stream sediment for total metals analysis will be collected following DEQ protocols, and analyzed according to approved methods included in Appendix A. Grab samples of stream water for all Total Recoverable (TR) metals parameters and TSS will be collected directly into the required bottle (See Appendix A, Analyte Checklist for this information). Bottles shall be rinsed three times with native water prior to sampling. During sampling, the sample bottle opening should face upstream and should be drawn through the water column once, carefully avoiding disturbance of bottom sediments. Samples for dissolved aluminum analysis will be collected from the same location as the grab samples, using a 60 mL poly syringe and a 0.45 µm PES-membrane filter disc. The filter will be purged with a 50 mL volume of stream water, and the sample bottle rinsed three times with filtrate prior to collecting the filtered sample. Grab samples for low-level total mercury will be collected without exposure to the air in pre-preserved 250 mL glass bottles, according the clean hands/dirty hands procedures described in Appendix E. Samples of fine-grained stream-bed sediment for total metals analysis will be will be composited from 6-10 separate underwater locations at each site, using a large plastic spoon and/or a plastic turkey baster, and sieved through a 60 µm nylon mesh into pre-cleaned 1L glass jars.
Data Report Original to: Copy or pdf to: EDD to:Site Visit/COC Forms DEQ Data Manager EPA TO Manager, TetraTech PM, Atkins PM EPADigital Field Photos/Photo Logs DEQ Data Manager EPA TO Manager, TetraTech PM, Atkins PM EPAField Data Forms /Field Notes DEQ Data Manager EPA TO Manager, TetraTech PM, Atkins PM EPALaboratory Reports DEQ Data Manager EPA TO Manager, TetraTech PM, Atkins PM MDEQ, eWQX, EPADEQ QA/QC Review Forms EPA TO Manager TetraTech PM, Atkins QA Officer EPA
13
Task Order 1 Tasks 2 and 3 SAP-01
Rev. 03 4/15/2013
• Grab samples for TR metals and filtered samples for dissolved aluminum will be
acidified to a pH of less than 2 by adding concentrated nitric acid (HNO3). • Samples for low-level mercury (Hg) by analytical method 245.7 will be collected in glass
bottles pre-preserved with concentrated hydrochloric acid (HCl); both a trip blank and field blank are required for each sampling event.
• Stream-bed sediment samples for total metals analysis do not require field preservation, but will be transported to the laboratory on ice.
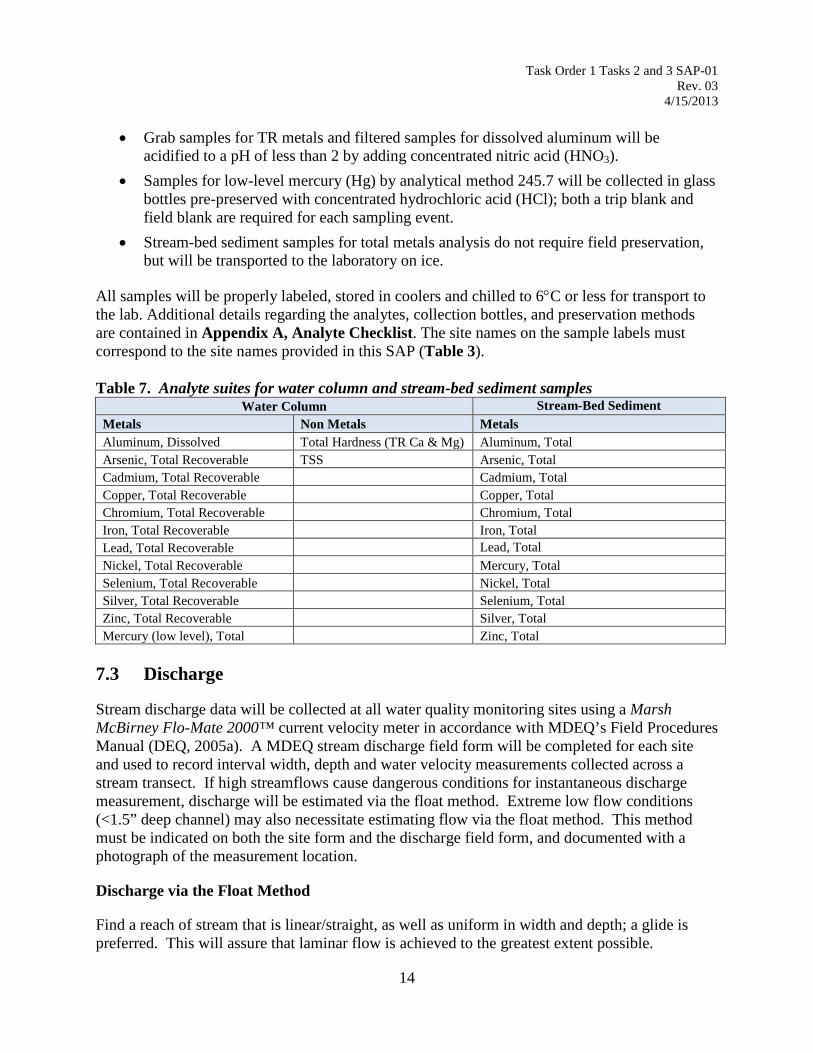
All samples will be properly labeled, stored in coolers and chilled to 6°C or less for transport to the lab. Additional details regarding the analytes, collection bottles, and preservation methods are contained in Appendix A, Analyte Checklist. The site names on the sample labels must correspond to the site names provided in this SAP (Table 3). Table 7. Analyte suites for water column and stream-bed sediment samples
Water Column Stream-Bed Sediment Metals Non Metals Metals Aluminum, Dissolved Total Hardness (TR Ca & Mg) Aluminum, Total Arsenic, Total Recoverable TSS Arsenic, Total Cadmium, Total Recoverable Cadmium, Total Copper, Total Recoverable Copper, Total Chromium, Total Recoverable Chromium, Total Iron, Total Recoverable Iron, Total Lead, Total Recoverable Lead, Total Nickel, Total Recoverable Mercury, Total Selenium, Total Recoverable Nickel, Total Silver, Total Recoverable Selenium, Total Zinc, Total Recoverable Silver, Total Mercury (low level), Total Zinc, Total
7.3 Discharge
Stream discharge data will be collected at all water quality monitoring sites using a Marsh McBirney Flo-Mate 2000™ current velocity meter in accordance with MDEQ’s Field Procedures Manual (DEQ, 2005a). A MDEQ stream discharge field form will be completed for each site and used to record interval width, depth and water velocity measurements collected across a stream transect. If high streamflows cause dangerous conditions for instantaneous discharge measurement, discharge will be estimated via the float method. Extreme low flow conditions (<1.5” deep channel) may also necessitate estimating flow via the float method. This method must be indicated on both the site form and the discharge field form, and documented with a photograph of the measurement location.
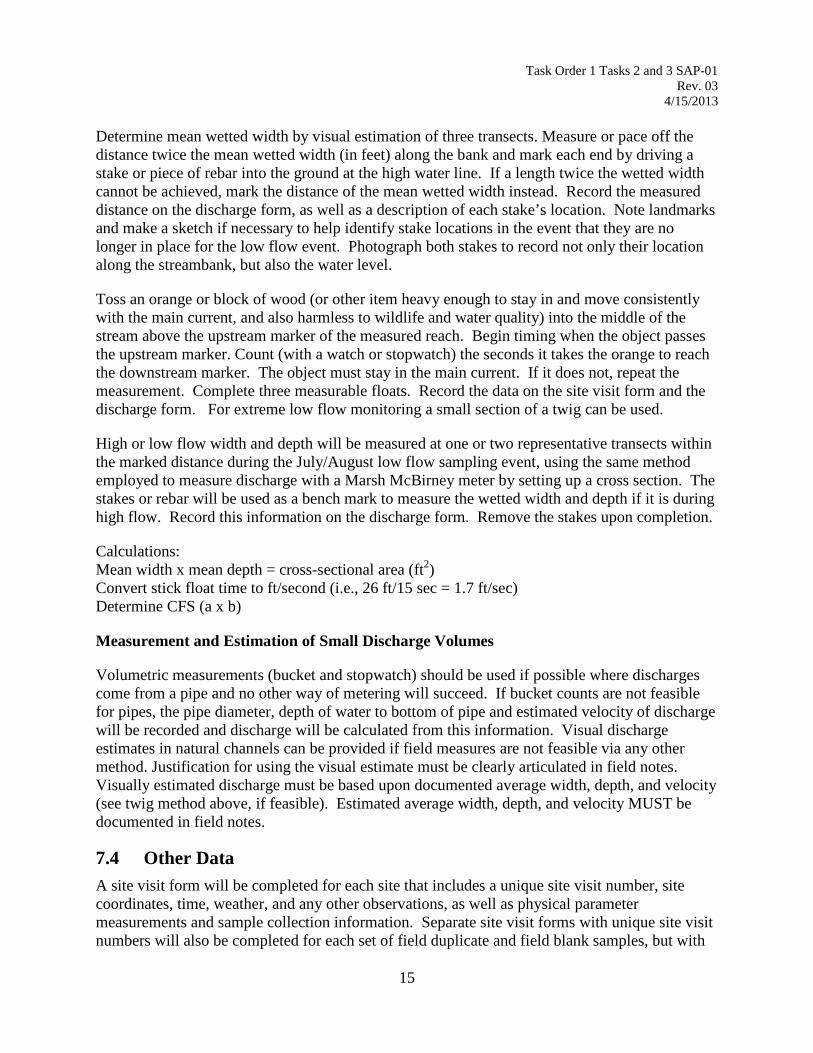
Discharge via the Float Method
Find a reach of stream that is linear/straight, as well as uniform in width and depth; a glide is preferred. This will assure that laminar flow is achieved to the greatest extent possible.
14
Task Order 1 Tasks 2 and 3 SAP-01
Rev. 03 4/15/2013
Determine mean wetted width by visual estimation of three transects. Measure or pace off the distance twice the mean wetted width (in feet) along the bank and mark each end by driving a stake or piece of rebar into the ground at the high water line. If a length twice the wetted width cannot be achieved, mark the distance of the mean wetted width instead. Record the measured distance on the discharge form, as well as a description of each stake’s location. Note landmarks and make a sketch if necessary to help identify stake locations in the event that they are no longer in place for the low flow event. Photograph both stakes to record not only their location along the streambank, but also the water level.
Toss an orange or block of wood (or other item heavy enough to stay in and move consistently with the main current, and also harmless to wildlife and water quality) into the middle of the stream above the upstream marker of the measured reach. Begin timing when the object passes the upstream marker. Count (with a watch or stopwatch) the seconds it takes the orange to reach the downstream marker. The object must stay in the main current. If it does not, repeat the measurement. Complete three measurable floats. Record the data on the site visit form and the discharge form. For extreme low flow monitoring a small section of a twig can be used.
High or low flow width and depth will be measured at one or two representative transects within the marked distance during the July/August low flow sampling event, using the same method employed to measure discharge with a Marsh McBirney meter by setting up a cross section. The stakes or rebar will be used as a bench mark to measure the wetted width and depth if it is during high flow. Record this information on the discharge form. Remove the stakes upon completion.
Calculations: Mean width x mean depth = cross-sectional area (ft2) Convert stick float time to ft/second (i.e., 26 ft/15 sec = 1.7 ft/sec) Determine CFS (a x b)
Measurement and Estimation of Small Discharge Volumes
Volumetric measurements (bucket and stopwatch) should be used if possible where discharges come from a pipe and no other way of metering will succeed. If bucket counts are not feasible for pipes, the pipe diameter, depth of water to bottom of pipe and estimated velocity of discharge will be recorded and discharge will be calculated from this information. Visual discharge estimates in natural channels can be provided if field measures are not feasible via any other method. Justification for using the visual estimate must be clearly articulated in field notes. Visually estimated discharge must be based upon documented average width, depth, and velocity (see twig method above, if feasible). Estimated average width, depth, and velocity MUST be documented in field notes.
7.4 Other Data A site visit form will be completed for each site that includes a unique site visit number, site coordinates, time, weather, and any other observations, as well as physical parameter measurements and sample collection information. Separate site visit forms with unique site visit numbers will also be completed for each set of field duplicate and field blank samples, but with
15
Task Order 1 Tasks 2 and 3 SAP-01
Rev. 03 4/15/2013
parent sample IDs and location IDs that indicate where the duplicate and/or blank sample was collected. Each sample container for a surface water sample, duplicate sample or blank sample shall be affixed with a site visit number that agrees with the corresponding site visit form.
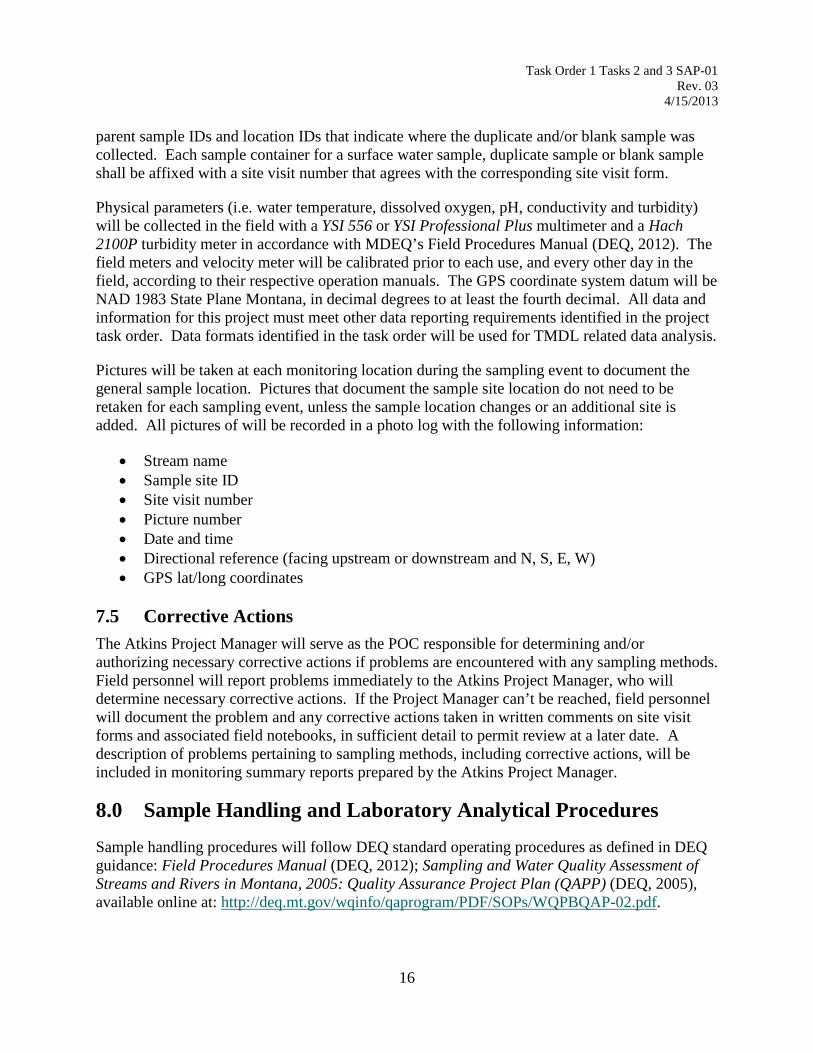
Physical parameters (i.e. water temperature, dissolved oxygen, pH, conductivity and turbidity) will be collected in the field with a YSI 556 or YSI Professional Plus multimeter and a Hach 2100P turbidity meter in accordance with MDEQ’s Field Procedures Manual (DEQ, 2012). The field meters and velocity meter will be calibrated prior to each use, and every other day in the field, according to their respective operation manuals. The GPS coordinate system datum will be NAD 1983 State Plane Montana, in decimal degrees to at least the fourth decimal. All data and information for this project must meet other data reporting requirements identified in the project task order. Data formats identified in the task order will be used for TMDL related data analysis.
Pictures will be taken at each monitoring location during the sampling event to document the general sample location. Pictures that document the sample site location do not need to be retaken for each sampling event, unless the sample location changes or an additional site is added. All pictures of will be recorded in a photo log with the following information:
• Stream name • Sample site ID • Site visit number • Picture number • Date and time • Directional reference (facing upstream or downstream and N, S, E, W) • GPS lat/long coordinates
7.5 Corrective Actions The Atkins Project Manager will serve as the POC responsible for determining and/or authorizing necessary corrective actions if problems are encountered with any sampling methods. Field personnel will report problems immediately to the Atkins Project Manager, who will determine necessary corrective actions. If the Project Manager can’t be reached, field personnel will document the problem and any corrective actions taken in written comments on site visit forms and associated field notebooks, in sufficient detail to permit review at a later date. A description of problems pertaining to sampling methods, including corrective actions, will be included in monitoring summary reports prepared by the Atkins Project Manager.
8.0 Sample Handling and Laboratory Analytical Procedures Sample handling procedures will follow DEQ standard operating procedures as defined in DEQ guidance: Field Procedures Manual (DEQ, 2012); Sampling and Water Quality Assessment of Streams and Rivers in Montana, 2005: Quality Assurance Project Plan (QAPP) (DEQ, 2005), available online at: http://deq.mt.gov/wqinfo/qaprogram/PDF/SOPs/WQPBQAP-02.pdf.
16
Task Order 1 Tasks 2 and 3 SAP-01
Rev. 03 4/15/2013
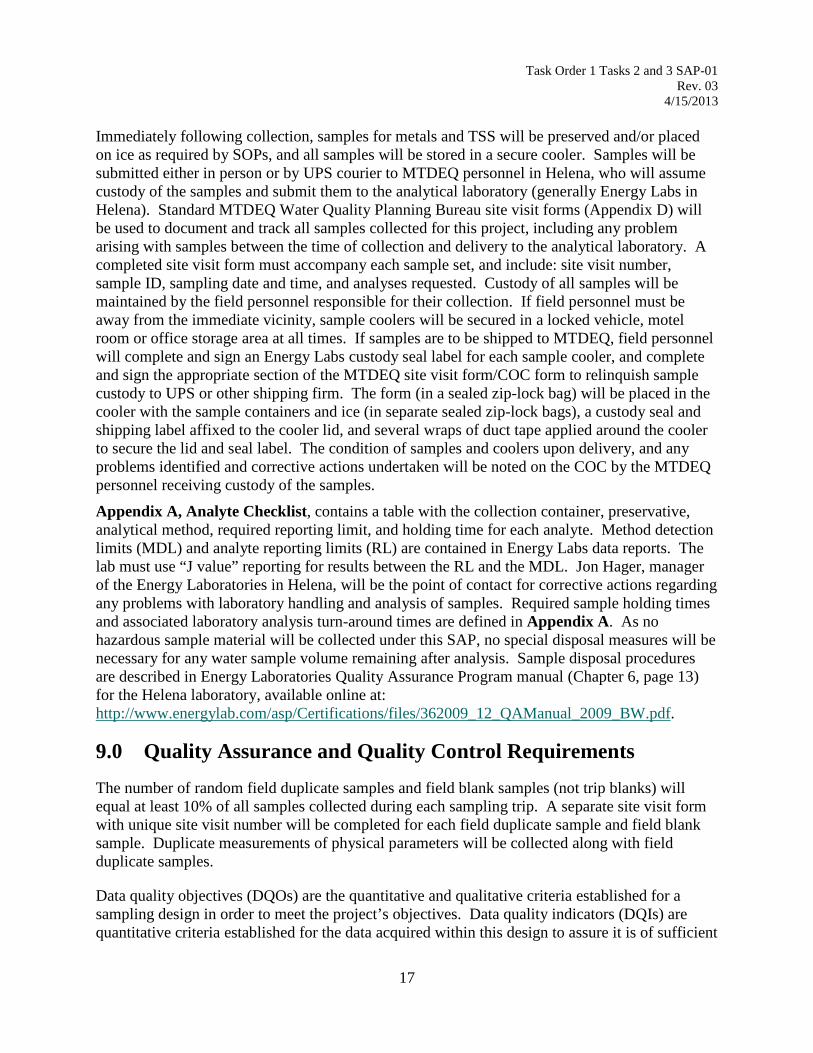
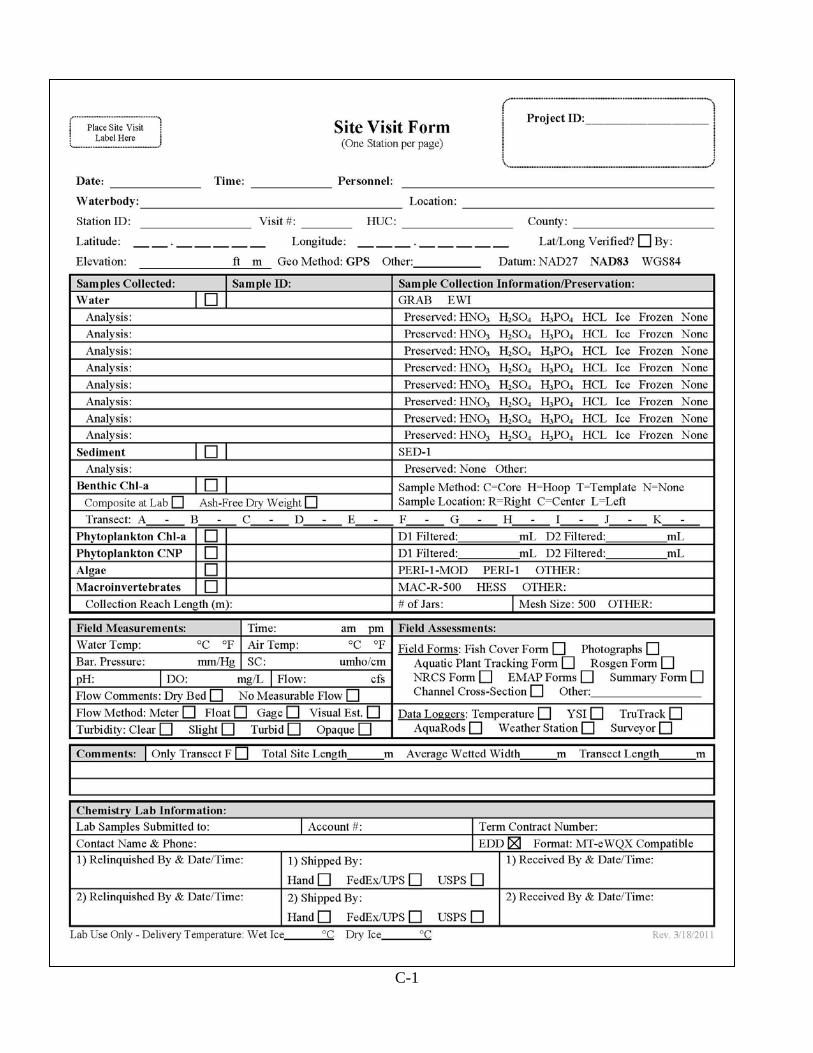
Immediately following collection, samples for metals and TSS will be preserved and/or placed on ice as required by SOPs, and all samples will be stored in a secure cooler. Samples will be submitted either in person or by UPS courier to MTDEQ personnel in Helena, who will assume custody of the samples and submit them to the analytical laboratory (generally Energy Labs in Helena). Standard MTDEQ Water Quality Planning Bureau site visit forms (Appendix D) will be used to document and track all samples collected for this project, including any problem arising with samples between the time of collection and delivery to the analytical laboratory. A completed site visit form must accompany each sample set, and include: site visit number, sample ID, sampling date and time, and analyses requested. Custody of all samples will be maintained by the field personnel responsible for their collection. If field personnel must be away from the immediate vicinity, sample coolers will be secured in a locked vehicle, motel room or office storage area at all times. If samples are to be shipped to MTDEQ, field personnel will complete and sign an Energy Labs custody seal label for each sample cooler, and complete and sign the appropriate section of the MTDEQ site visit form/COC form to relinquish sample custody to UPS or other shipping firm. The form (in a sealed zip-lock bag) will be placed in the cooler with the sample containers and ice (in separate sealed zip-lock bags), a custody seal and shipping label affixed to the cooler lid, and several wraps of duct tape applied around the cooler to secure the lid and seal label. The condition of samples and coolers upon delivery, and any problems identified and corrective actions undertaken will be noted on the COC by the MTDEQ personnel receiving custody of the samples.
Appendix A, Analyte Checklist, contains a table with the collection container, preservative, analytical method, required reporting limit, and holding time for each analyte. Method detection limits (MDL) and analyte reporting limits (RL) are contained in Energy Labs data reports. The lab must use “J value” reporting for results between the RL and the MDL. Jon Hager, manager of the Energy Laboratories in Helena, will be the point of contact for corrective actions regarding any problems with laboratory handling and analysis of samples. Required sample holding times and associated laboratory analysis turn-around times are defined in Appendix A. As no hazardous sample material will be collected under this SAP, no special disposal measures will be necessary for any water sample volume remaining after analysis. Sample disposal procedures are described in Energy Laboratories Quality Assurance Program manual (Chapter 6, page 13) for the Helena laboratory, available online at: http://www.energylab.com/asp/Certifications/files/362009_12_QAManual_2009_BW.pdf.
9.0 Quality Assurance and Quality Control Requirements The number of random field duplicate samples and field blank samples (not trip blanks) will equal at least 10% of all samples collected during each sampling trip. A separate site visit form with unique site visit number will be completed for each field duplicate sample and field blank sample. Duplicate measurements of physical parameters will be collected along with field duplicate samples.
Data quality objectives (DQOs) are the quantitative and qualitative criteria established for a sampling design in order to meet the project’s objectives. Data quality indicators (DQIs) are quantitative criteria established for the data acquired within this design to assure it is of sufficient
17
Task Order 1 Tasks 2 and 3 SAP-01
Rev. 03 4/15/2013
quality for its intended use. Descriptions of data qualifiers and common QC terms and acronyms are included in Appendix B.
9.1 Representativeness Representativeness refers to the extent to which measurements represent an environmental condition in time and space. This is a judgmental sampling design using the following rationale:
Spatial representation: Sampling sites were chosen to represent the potential of landscape characteristics and land use/land cover influences existing in the watershed to influence pollutant concentrations in the listed waters, as well as the contribution of major tributaries. Sampling sites were identified by both assessment of aerial images, by reviewing past data collection efforts on these stream segments, and by considering potential pollution sources and land ownership and uses.
Temporal representation: Two time periods (low summer flow and high spring runoff flow) will be used to represent water quality conditions for the selected stream segments. These data will be used along with previously collected data for data analysis.
9.2 Comparability Comparability is the applicability of the project’s data to the project’s decision rule. The decision rules used for this project are the acute and chronic aquatic life criteria for metals, and the human health/drinking water standards listed in Department Circular DEQ-7. All methods selected conform to the requirement listed in footnotes 3, 4, 9, 12, 19, and 29 of DEQ-7. 9.3 Completeness Completeness is a measure of the amount of data prescribed for assessment activities and the usable data actually collected, expressed as a percentage.
Completeness as % = (No. Valid Data Points or Samples / Total # Data Points or Samples) x 100
The overall project goal is 95% completeness. Sites lost due to inaccessibility will reduce the total number of sites in the equation but not the completeness goal. Although, alternative sites will be considered if original site access cannot be obtained. Most data with B and J flags will not affect completeness, although some may. If flagged data is not fully useful to the project and the flag was caused by field or laboratory error which could have been prevented by following standard procedures, it will be counted against completeness. If any listed stream has less than 50% of its planned sites sampled due to accessibility issues, the project conclusions will note this fact and account for the increased uncertainty in the TMDLs margin of safety. An assessment of completeness, and what circumstances contributed to incomplete project results will be compiled during the project report.
18
Task Order 1 Tasks 2 and 3 SAP-01
Rev. 03 4/15/2013
9.4 Sensitivity Sensitivity refers to the limit of a measurement to reliably detect a characteristic of a sample. For analytical methods, sensitivity is expressed as the method detection limit (MDL). Laboratories must determine their MDL’s annually and routinely check each method’s ability to achieve this level of sensitivity using negative controls (e.g., Method Blanks, Continuing Calibration Blanks, and Laboratory Reagent Blanks).
Sensitivity quality controls for all laboratory methods will follow the frequency and criteria specified in the analytical method or as described in the Laboratory’s Quality Assurance Plan (LQAP).
The criteria used to assess field method sensitivity for water and sediment samples shall be: • Field method controls (Field Blank) < Reporting Limit in Appendix B
Frequency of de-ionized water field blank samples will be 10% of samples collected in the field.
Corrective Action: If analytical method controls fail the specified limit, check with the laboratory manager (Jon Hager) to see how they addressed the non-conformance and qualify data as necessary. If Field Blanks fail, qualify all associated project data < 10x the detected value with B flags.
9.5 Precision Precision refers to the degree of agreement among repeated measurements of the same characteristic. This project will rely on analytical and field duplicates to assess precision based on their relative percent difference (RPD).
RPD as % = ((D1 – D2)/((D1 + D2)/2)) x 100
Where: D1 is first replicate result D2 is second replicate result
Lab precision (laboratory duplicates) Precision quality control for all laboratory methods will follow the frequency specified in the analytical method or as described in the LQAP. The criteria used to assess analytical method precision shall be:
• Water samples: 20% RPD for duplicate results > 5 times the reporting limit • Sediment samples: 35% RPD for duplicate results > 5 times the reporting limit
Overall precision (field duplicates) Frequency of field co-located duplicates will be 10% of samples collected in the field. The criteria used to assess overall precision shall be:
• Water samples: 25% RPD for duplicate results > 5 times the RL • Sediment samples: 40% RPD for duplicate results > 5 times the RL
19
Task Order 1 Tasks 2 and 3 SAP-01
Rev. 03 4/15/2013
Corrective Action: If laboratory duplicates fail this limit, check with the laboratory manager (Jon Hager) to see how they addressed or qualified the data and add additional qualifiers and notes as needed. If the field duplicates fail this limit, qualify all associated with a “J”. 9.6 Bias and Accuracy Bias is systematic nonrandom error from the true value. In this context, it is an extension of the representativeness concept applied to an individual sample. Bias can occur either at sample collection or during measurement.
Accuracy is the combination of high precision and low bias. Accuracy of individual measurements will be assessed by reviewing the analytical method controls (i.e. Laboratory Control Sample, Continuing Calibration Verification, Laboratory Fortified Blank, Standard Reference Material) and the analytical batch controls (i.e. Matrix Spike and Matrix Spike Duplicate). The criteria used for this assessment will be the limits that the laboratory has developed through control charting of each method’s performance or based on individual method requirements. Method QC descriptions are contained in Table B-2 in Appendix B.
Corrective Action: For any QC value outside of the recovery range, check with the laboratory manager (Jon Hager) to see how they addressed the non-conformance and qualify data as necessary.
10.0 Instrument/Equipment Maintenance and Calibration A Hach 2100P portable turbidity meter, Marsh-McBirney FlowMate 2000 electronic flow meter, and YSI Professional Plus and YSI Model 556 MPS field multi-meters will be maintained by the Atkins quality assurance officer for use during this project. A maintenance and calibration log book will be kept with each meter and maintained by the Atkins quality assurance officer. The meters will be calibrated prior to each monitoring event and every other day during an event following the manufacturer’s instructions and, in the case of the field multi-meters, using approved, non-expired calibration standards. Calibration documentation will be recorded in the meter log books. Calibration procedures and calibration standards are described in the manufacturer’s manuals, and are kept with each instrument and in the Atkins Helena office field staging room. Instrument manuals are also available online at each manufacturer’s web site (Appendix D). Atkins field staff will notify the Atkins quality assurance officer of any instrument malfunctions or calibration failures in a timely fashion to allow for prompt repairs and/or replacement prior to the next field monitoring event. A record of all problems, corrective actions, repairs and maintenance will be kept in the field meter log book. The Atkins quality assurance officer will attend to all field meters during the off season, conduct periodic battery and calibration checks, and make arrangements for any required repairs and maintenance.
11.0 Inspection and Acceptance Requirements for Supplies Extra buffers and calibration standards are ordered periodically by the Atkins quality assurance coordinator from a familiar supplier (generally Cole Parmer) before supplies on hand expire or
20
Task Order 1 Tasks 2 and 3 SAP-01
Rev. 03 4/15/2013
are depleted, and each shipment is inspected upon arrival for correctness and condition. The supplier will be notified if damaged or expired containers are received and replacements requested. Buffers and calibration standards will be marked with the date received and the manufacturer’s expiration date noted, and will be routinely inspected by the quality assurance coordinator prior to their use for instrument calibration to ensure they have not expired.
12.0 Data Analysis, Record Keeping, and Reporting Requirements
12.1 QC Review and Documentation A review of all field and analytical data, including all items on the QC Checklist in Appendix B, will be conducted by MTDEQ following receipt of the laboratory data package1. A QA/QC Review will be prepared by MTDEQ that evaluates all water quality data collected under this SAP against the criteria listed in Section 9.0. Data qualifiers to be assigned to data that do not meet these target quality control criteria are provided in Appendix B (Table B-1), and will be included in both the hardcopy and electronic forms of the data. EPA’s QA oversight personnel will review DEQ’s QA/QC exercise and perform corrective actions if necessary.
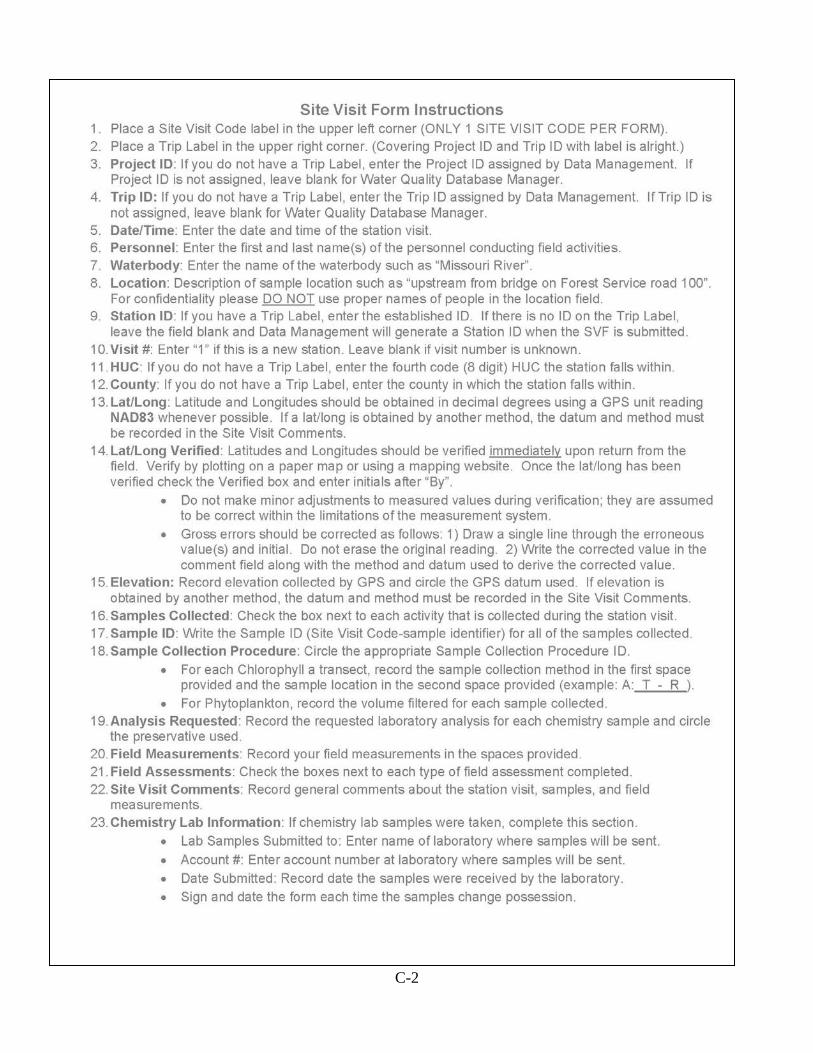
12.2 Data Management A standard MTDEQ Site Visit Form will be properly completed for each sampling site at the time of sample collection (Appendix C). Requests for field forms should be submitted to MTDEQ. Field data recorded on the Site Visit Forms will be entered into and saved in Excel spreadsheet format. Energy Laboratories analysis reports will be kept in electronic (pdf) formats and as lab-generated Excel spreadsheets containing analyses results. Field and laboratory data will be managed by MTDEQ in spreadsheet or database table format compatible with the MT-eWQX database. Data tables will be maintained and managed in record format, retaining the unaltered field-recorded metadata and laboratory analyses results reported in electronic data deliverable (EDD) form. MTDEQ will perform a QA/QC review and prepare a summary report described under Section 12.1; following approval by the MTDEQ Quality Assurance Officer and EPA Task Order Project Manager, data will be formatted for final submission to MT-eWQX and entry into the database.
All monitoring data will be entered into a Montana DEQ’s MT-eWQX EDD spreadsheet format, validated using Electronic Data Processor (EDP) data management software, and uploaded into EPA’s Water Quality Exchange (WQX) National Warehouse database via the MT-eWQX portal. Formatting requirements for data entry into MT-eWQX EDD are specified in the MT-eWQX Guidance Manual (MT-eWQX Guidance Manual) found on the Montana EQuIS Water Quality Exchange webpage: http://deq.mt.gov/wqinfo/datamgmt/MTEWQX.mcpx. Data management tools, including the EDP application and instructions for submittal of validated EDD to the MT-eWQX system also can be found on the above website. All data will be submitted under DEQ’s Organization ID: MDEQ_WQ_WQX. Atkins and EPA will receive verification from the DEQ system administrator of a successful data upload to MT-eWQX.
1 An Energy Laboratories data package includes Laboratory Analytical Reports for each sample, in electronic (.pdf) and hardcopy formats and including QC summary and completed chain of custody, and the electronic data deliverable (EDD) files in MT-eWQX-compliant, Excel spreadsheet format.
21
Task Order 1 Tasks 2 and 3 SAP-01
Rev. 03 4/15/2013
Field notes, stream flow measurement forms, and digital photos will be processed by MTDEQ with attention to QA/QC procedures and the requirements set forth in the project’s Scope of Work. Copies of all project forms and reports will be submitted to the EPA Task Order Manager upon the completion of this project, following the Scope of Work deliverable dates.
13.0 Assessments, Response Actions and Status Reports An assessment of each monitoring effort included within this SAP/QAPP will be conducted immediately prior to initiation of field work, and again following completion of field activities. Assessments will consist of a review of monitoring requirements contained in the Scope of Work, and the specific sampling protocols detailed in the SAP, for each TMDL Planning Area. The goal of these assessments will be to assure completeness and quality of monitoring activities, sample collection, sample processing and analysis, and data handling. When multiple visits to monitoring locations are specified in the SOW within a single monitoring season, an interim assessment of the previous monitoring effort will be conducted prior to initiating the next visit. The Atkins Project Manager will conduct all assessments, with the direct participation of field and lab personnel involved in sample collection and analysis.
Any problems, omissions, or modifications identified through the post-monitoring assessment will be documented, and significant issues brought to the attention of the Atkins Project Officer and EPA Task Order Manager. Corrective actions, if applicable, will be addressed by the Atkins Project Manager, and documented in the project files following their implementation.
Status reports will be prepared by Atkins field personnel following completion of field work on each monitoring activity, and provided to the Atkins Project Manager for the development of QA assessments.
14.0 Data Review, Verification, and Validation Sub-sections 9.1 through 9.6 of Section 9.0, Quality Assurance and Quality Control Requirements, contain data quality objectives (DQOs), quantitative and qualitative criteria established in order to meet the project’s objectives, and data quality indicators (DQIs), quantitative criteria established for the data acquired to assure it is of sufficient quality for its intended use. These include representativeness, comparability, completeness, sensitivity, precision, and bias and accuracy.
All field data, chain of custody information, instrument calibration logs, and laboratory analysis results will be reviewed and verified following the criteria defined in Section 9, and reiterated above. The designated Atkins Quality Assurance person will be responsible for conducting all data reviews, verifying whether or not criteria are met, and validating the appropriateness of data for their intended uses. Any data that fail to meet established criteria will be qualified with appropriate comments in the MT-eWQX EDD spreadsheets, or flagged as specified by standard laboratory practice.
22

Task Order 1 Tasks 2 and 3 SAP-01
Rev. 03 4/15/2013
15.0 Schedule for Completion The monitoring will be completed by October 30, 2013. Reporting will be fully completed by January 31, 2014.
23
Task Order 1 Tasks 2 and 3 SAP-01
Rev. 03 4/15/2013
16.0 References Montana Department of Environmental Quality. 2012. Water Quality Planning Bureau Field
Procedures Manual For Water Quality Assessment Monitoring Version 3.0. Helena, MT: Montana Dept. of Environmental Quality. Available at http://deq.mt.gov/wqinfo/qaprogram/PDF/SOPs/WQPBWQM-020.pdf
Montana Department of Environmental Quality. 2005. Quality Assurance Project Plan (QAPP)
Sampling and Water Quality Assessment of Streams and Rivers in Montana, 2005. Available at: http://www.deq.mt.gov/wqinfo/qaprogram/PDF/WQPBQAP-02.pdf
24

Appendix A
Analyte Checklist
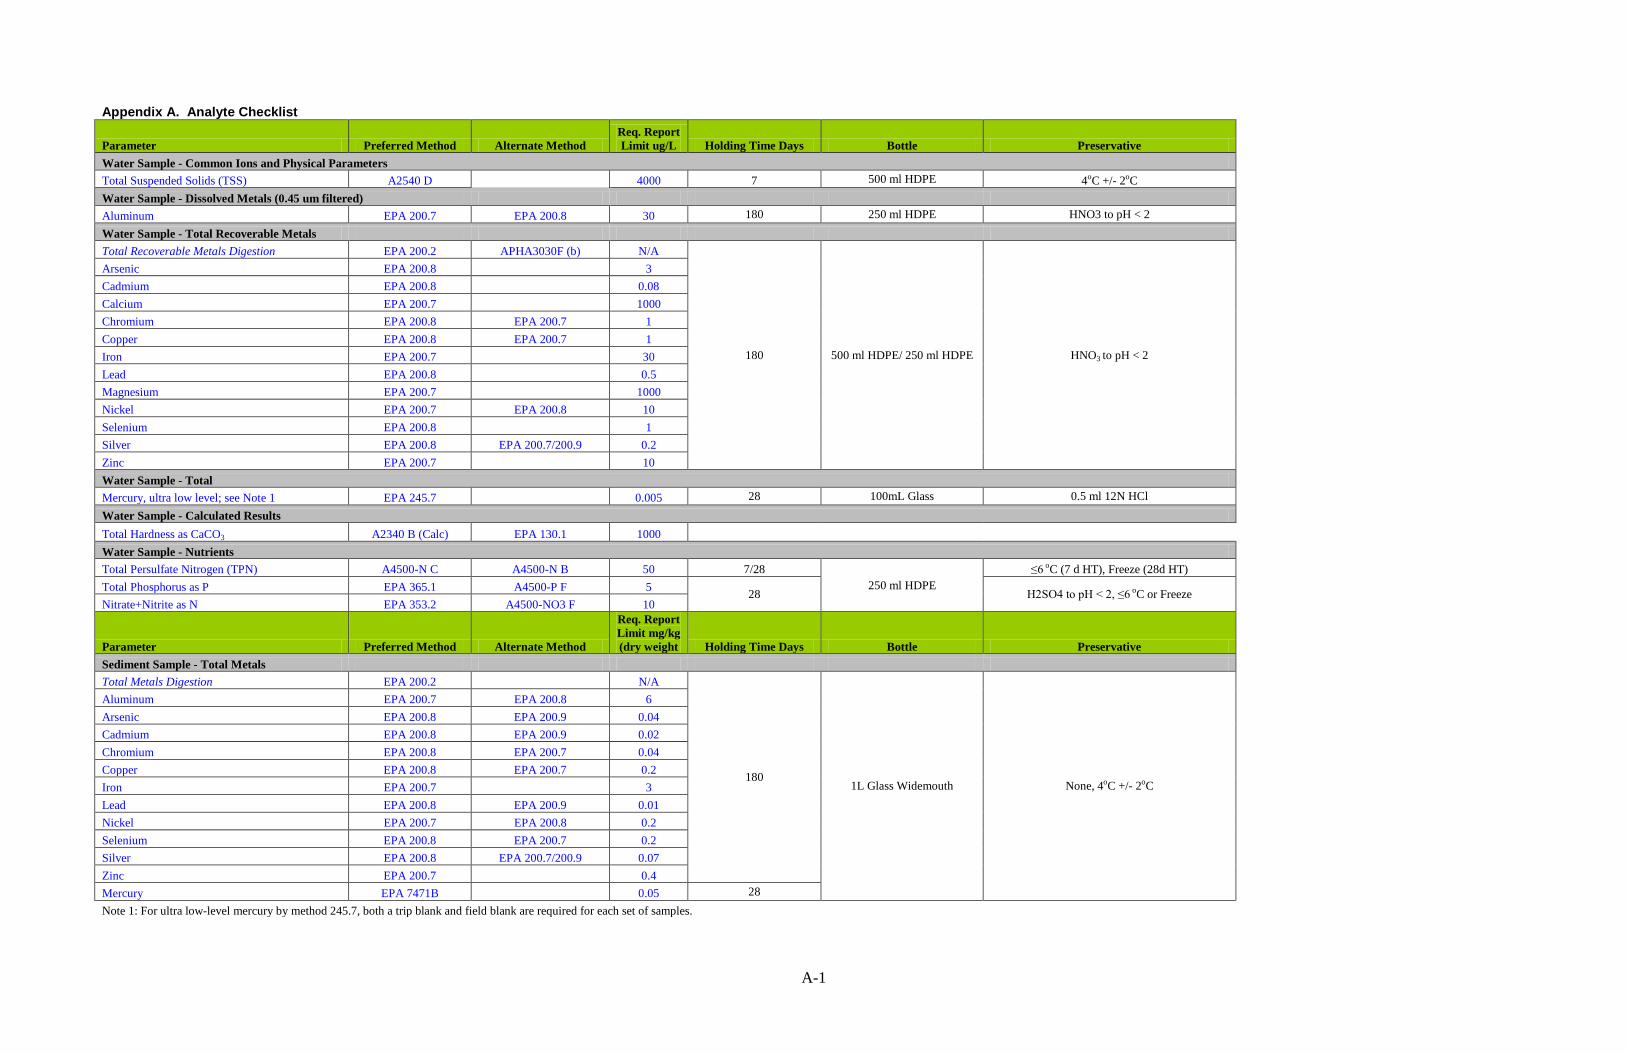
Appendix A. Analyte Checklist
Parameter Preferred Method Alternate Method
Req. Report Limit ug/L Holding Time Days Bottle Preservative
Water Sample - Common Ions and Physical Parameters Total Suspended Solids (TSS) A2540 D
4000 7 500 ml HDPE 4oC +/- 2oC
Water Sample - Dissolved Metals (0.45 um filtered) Aluminum EPA 200.7 EPA 200.8 30 180 250 ml HDPE HNO3 to pH < 2 Water Sample - Total Recoverable Metals Total Recoverable Metals Digestion EPA 200.2 APHA3030F (b) N/A
180 500 ml HDPE/ 250 ml HDPE HNO3 to pH < 2
Arsenic EPA 200.8 3 Cadmium EPA 200.8 0.08 Calcium EPA 200.7 1000 Chromium EPA 200.8 EPA 200.7 1 Copper EPA 200.8 EPA 200.7 1 Iron EPA 200.7 30 Lead EPA 200.8 0.5 Magnesium EPA 200.7 1000 Nickel EPA 200.7 EPA 200.8 10 Selenium EPA 200.8
1
Silver EPA 200.8 EPA 200.7/200.9 0.2 Zinc EPA 200.7 10 Water Sample - Total Mercury, ultra low level; see Note 1 EPA 245.7 0.005 28 100mL Glass 0.5 ml 12N HCl Water Sample - Calculated Results Total Hardness as CaCO3 A2340 B (Calc) EPA 130.1 1000
Water Sample - Nutrients Total Persulfate Nitrogen (TPN) A4500-N C A4500-N B 50 7/28
250 ml HDPE ≤6 oC (7 d HT), Freeze (28d HT)
Total Phosphorus as P EPA 365.1 A4500-P F 5 28 H2SO4 to pH < 2, ≤6 oC or Freeze Nitrate+Nitrite as N EPA 353.2 A4500-NO3 F 10
Parameter Preferred Method Alternate Method
Req. Report Limit mg/kg (dry weight Holding Time Days Bottle Preservative
Sediment Sample - Total Metals Total Metals Digestion EPA 200.2
N/A
180 1L Glass Widemouth None, 4oC +/- 2oC
Aluminum EPA 200.7 EPA 200.8 6 Arsenic EPA 200.8 EPA 200.9 0.04 Cadmium EPA 200.8 EPA 200.9 0.02 Chromium EPA 200.8 EPA 200.7 0.04 Copper EPA 200.8 EPA 200.7 0.2 Iron EPA 200.7
3
Lead EPA 200.8 EPA 200.9 0.01 Nickel EPA 200.7 EPA 200.8 0.2 Selenium EPA 200.8 EPA 200.7 0.2 Silver EPA 200.8 EPA 200.7/200.9 0.07 Zinc EPA 200.7
0.4
Mercury EPA 7471B
0.05 28 Note 1: For ultra low-level mercury by method 245.7, both a trip blank and field blank are required for each set of samples.
A-1
Appendix B
QA/QC Checklist and Data Qualifiers
Quality Control Checklist
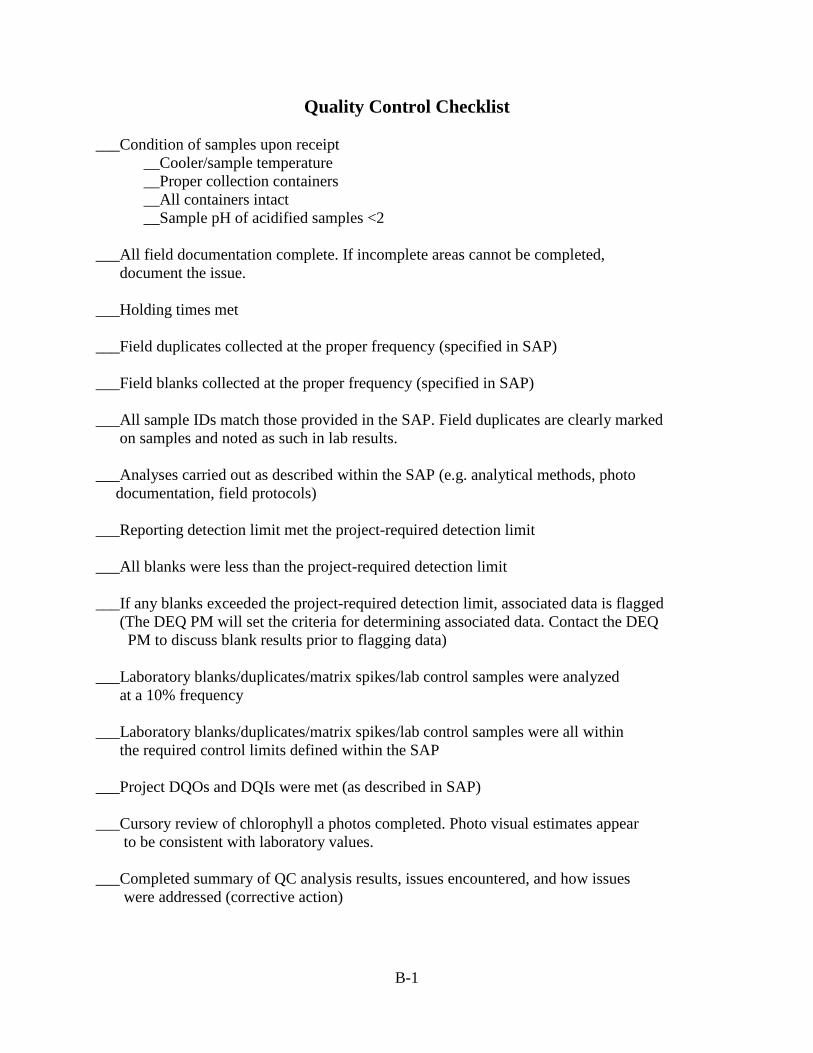
___Condition of samples upon receipt __Cooler/sample temperature __Proper collection containers __All containers intact __Sample pH of acidified samples <2 ___All field documentation complete. If incomplete areas cannot be completed, document the issue. ___Holding times met ___Field duplicates collected at the proper frequency (specified in SAP) ___Field blanks collected at the proper frequency (specified in SAP) ___All sample IDs match those provided in the SAP. Field duplicates are clearly marked on samples and noted as such in lab results. ___Analyses carried out as described within the SAP (e.g. analytical methods, photo documentation, field protocols) ___Reporting detection limit met the project-required detection limit ___All blanks were less than the project-required detection limit ___If any blanks exceeded the project-required detection limit, associated data is flagged (The DEQ PM will set the criteria for determining associated data. Contact the DEQ PM to discuss blank results prior to flagging data) ___Laboratory blanks/duplicates/matrix spikes/lab control samples were analyzed at a 10% frequency ___Laboratory blanks/duplicates/matrix spikes/lab control samples were all within the required control limits defined within the SAP ___Project DQOs and DQIs were met (as described in SAP) ___Cursory review of chlorophyll a photos completed. Photo visual estimates appear to be consistent with laboratory values. ___Completed summary of QC analysis results, issues encountered, and how issues were addressed (corrective action)
B-1
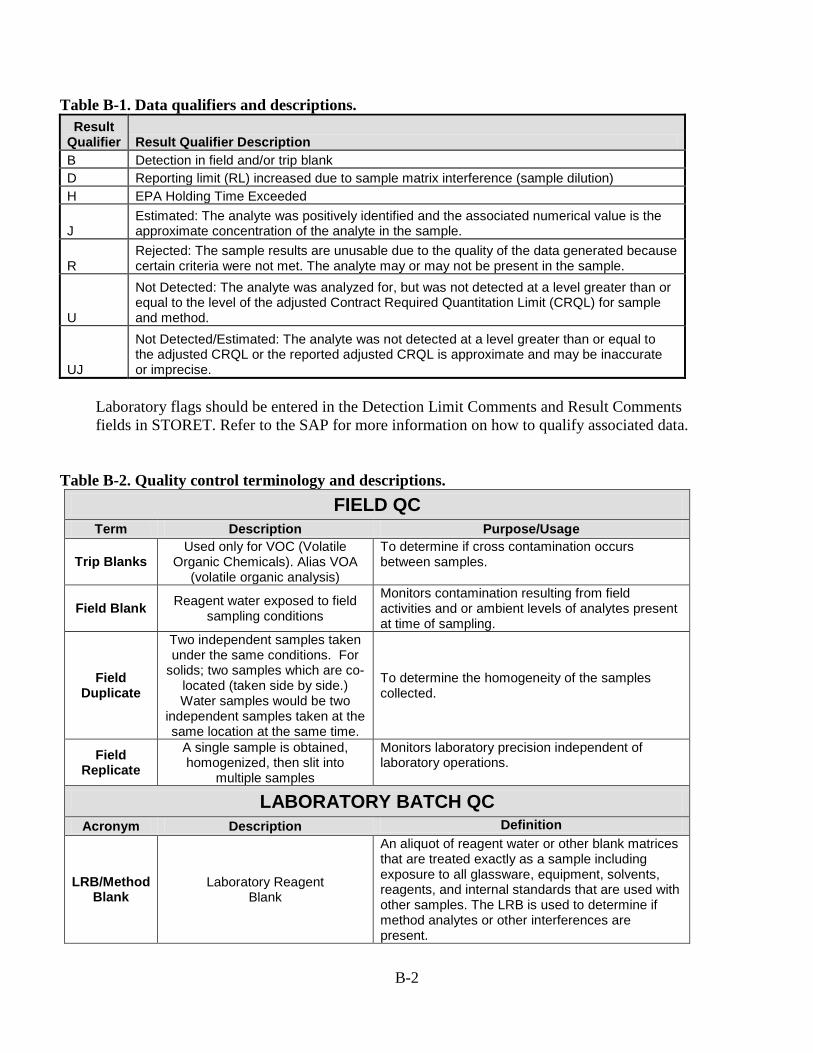
Table B-1. Data qualifiers and descriptions. Result
Qualifier Result Qualifier Description B Detection in field and/or trip blank D Reporting limit (RL) increased due to sample matrix interference (sample dilution) H EPA Holding Time Exceeded
J Estimated: The analyte was positively identified and the associated numerical value is the approximate concentration of the analyte in the sample.
R Rejected: The sample results are unusable due to the quality of the data generated because certain criteria were not met. The analyte may or may not be present in the sample.
U
Not Detected: The analyte was analyzed for, but was not detected at a level greater than or equal to the level of the adjusted Contract Required Quantitation Limit (CRQL) for sample and method.
UJ
Not Detected/Estimated: The analyte was not detected at a level greater than or equal to the adjusted CRQL or the reported adjusted CRQL is approximate and may be inaccurate or imprecise.
Laboratory flags should be entered in the Detection Limit Comments and Result Comments fields in STORET. Refer to the SAP for more information on how to qualify associated data.
Table B-2. Quality control terminology and descriptions.
FIELD QC Term Description Purpose/Usage
Trip Blanks Used only for VOC (Volatile
Organic Chemicals). Alias VOA (volatile organic analysis)
To determine if cross contamination occurs between samples.
Field Blank Reagent water exposed to field sampling conditions
Monitors contamination resulting from field activities and or ambient levels of analytes present at time of sampling.
Field Duplicate
Two independent samples taken under the same conditions. For
solids; two samples which are co-located (taken side by side.) Water samples would be two
independent samples taken at the same location at the same time.
To determine the homogeneity of the samples collected.
Field Replicate
A single sample is obtained, homogenized, then slit into
multiple samples
Monitors laboratory precision independent of laboratory operations.
LABORATORY BATCH QC Acronym Description Definition
LRB/Method Blank
Laboratory Reagent Blank
An aliquot of reagent water or other blank matrices that are treated exactly as a sample including exposure to all glassware, equipment, solvents, reagents, and internal standards that are used with other samples. The LRB is used to determine if method analytes or other interferences are present.
B-2
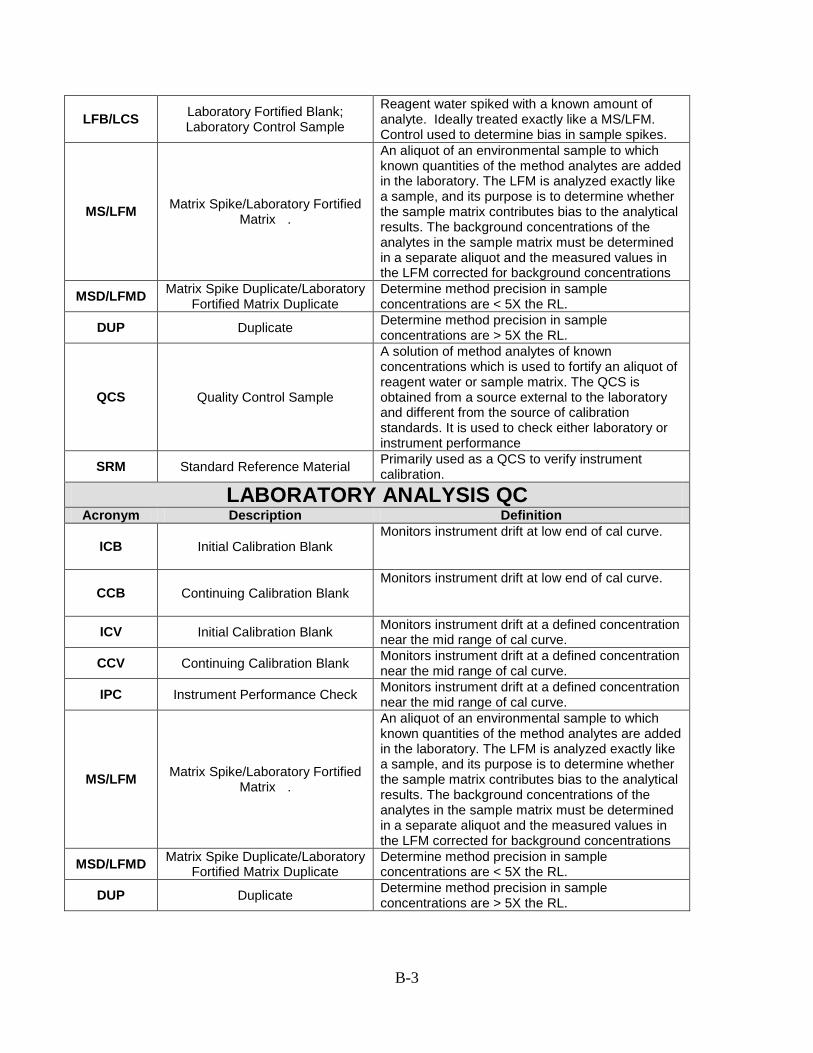
LFB/LCS Laboratory Fortified Blank; Laboratory Control Sample
Reagent water spiked with a known amount of analyte. Ideally treated exactly like a MS/LFM. Control used to determine bias in sample spikes.
MS/LFM Matrix Spike/Laboratory Fortified Matrix .
An aliquot of an environmental sample to which known quantities of the method analytes are added in the laboratory. The LFM is analyzed exactly like a sample, and its purpose is to determine whether the sample matrix contributes bias to the analytical results. The background concentrations of the analytes in the sample matrix must be determined in a separate aliquot and the measured values in the LFM corrected for background concentrations
MSD/LFMD Matrix Spike Duplicate/Laboratory Fortified Matrix Duplicate
Determine method precision in sample concentrations are < 5X the RL.
DUP Duplicate Determine method precision in sample concentrations are > 5X the RL.
QCS Quality Control Sample
A solution of method analytes of known concentrations which is used to fortify an aliquot of reagent water or sample matrix. The QCS is obtained from a source external to the laboratory and different from the source of calibration standards. It is used to check either laboratory or instrument performance
SRM Standard Reference Material Primarily used as a QCS to verify instrument calibration.
LABORATORY ANALYSIS QC Acronym Description Definition
ICB
Initial Calibration Blank
Monitors instrument drift at low end of cal curve.
CCB
Continuing Calibration Blank
Monitors instrument drift at low end of cal curve.
ICV Initial Calibration Blank Monitors instrument drift at a defined concentration near the mid range of cal curve.
CCV Continuing Calibration Blank Monitors instrument drift at a defined concentration near the mid range of cal curve.
IPC Instrument Performance Check Monitors instrument drift at a defined concentration near the mid range of cal curve.
MS/LFM Matrix Spike/Laboratory Fortified Matrix .
An aliquot of an environmental sample to which known quantities of the method analytes are added in the laboratory. The LFM is analyzed exactly like a sample, and its purpose is to determine whether the sample matrix contributes bias to the analytical results. The background concentrations of the analytes in the sample matrix must be determined in a separate aliquot and the measured values in the LFM corrected for background concentrations
MSD/LFMD Matrix Spike Duplicate/Laboratory Fortified Matrix Duplicate
Determine method precision in sample concentrations are < 5X the RL.
DUP Duplicate Determine method precision in sample concentrations are > 5X the RL.
B-3
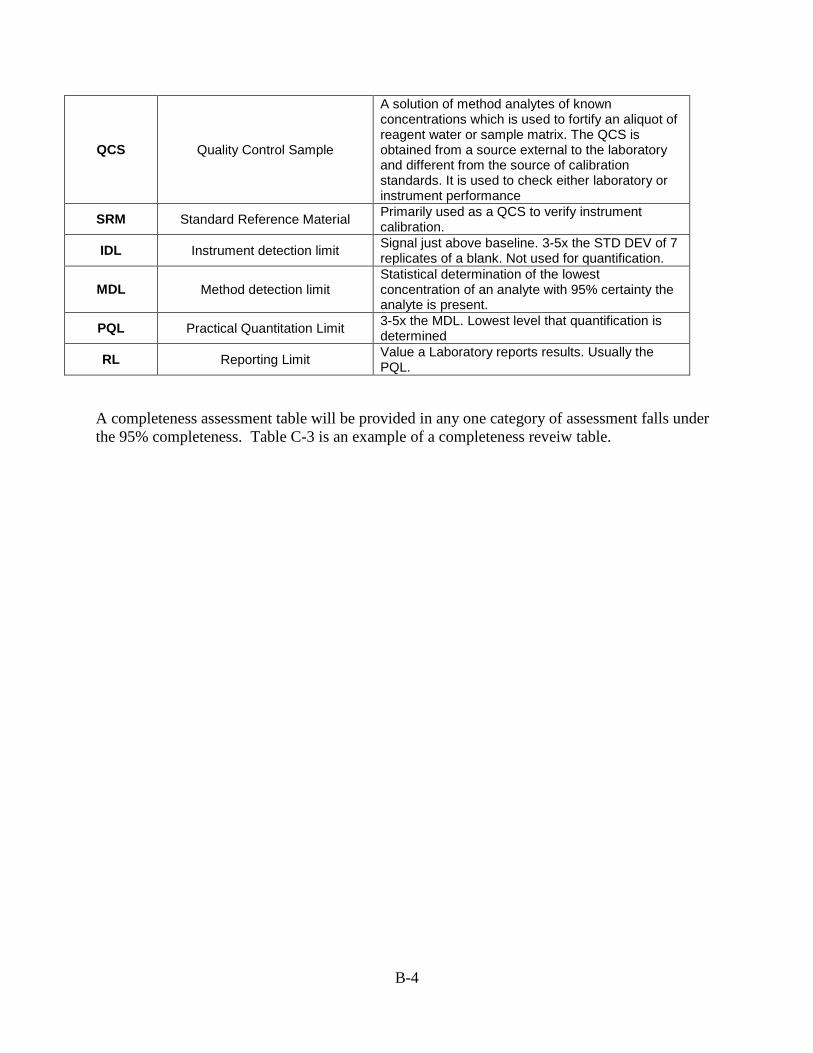
QCS Quality Control Sample
A solution of method analytes of known concentrations which is used to fortify an aliquot of reagent water or sample matrix. The QCS is obtained from a source external to the laboratory and different from the source of calibration standards. It is used to check either laboratory or instrument performance
SRM Standard Reference Material Primarily used as a QCS to verify instrument calibration.
IDL Instrument detection limit Signal just above baseline. 3-5x the STD DEV of 7 replicates of a blank. Not used for quantification.
MDL Method detection limit Statistical determination of the lowest concentration of an analyte with 95% certainty the analyte is present.
PQL Practical Quantitation Limit 3-5x the MDL. Lowest level that quantification is determined
RL Reporting Limit Value a Laboratory reports results. Usually the PQL.
A completeness assessment table will be provided in any one category of assessment falls under the 95% completeness. Table C-3 is an example of a completeness reveiw table.
B-4
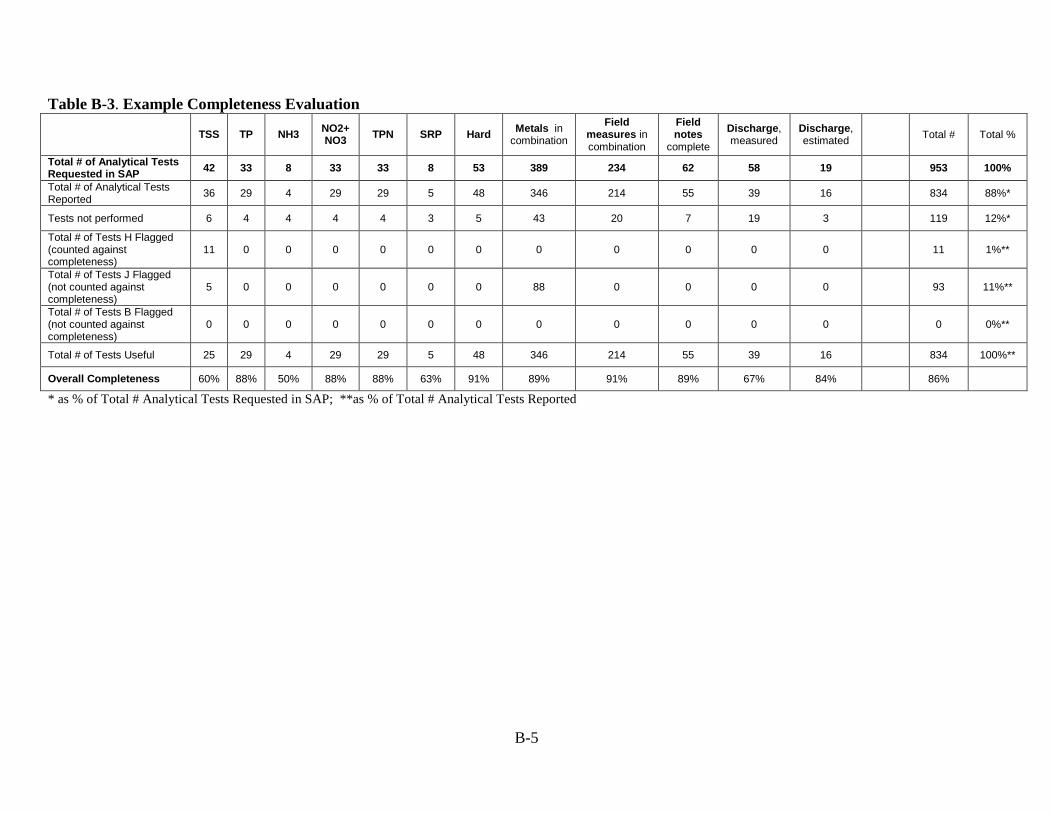
Table B-3. Example Completeness Evaluation
TSS TP NH3 NO2+NO3 TPN SRP Hard Metals in
combination Field
measures in combination
Field notes
complete Discharge, measured
Discharge, estimated
Total # Total %
Total # of Analytical Tests Requested in SAP 42 33 8 33 33 8 53 389 234 62 58 19 953 100%
Total # of Analytical Tests Reported 36 29 4 29 29 5 48 346 214 55 39 16 834 88%*
Tests not performed 6 4 4 4 4 3 5 43 20 7 19 3 119 12%*
Total # of Tests H Flagged (counted against completeness)
11 0 0 0 0 0 0 0 0 0 0 0
11 1%**
Total # of Tests J Flagged (not counted against completeness)
5 0 0 0 0 0 0 88 0 0 0 0
93 11%**
Total # of Tests B Flagged (not counted against completeness)
0 0 0 0 0 0 0 0 0 0 0 0
0 0%**
Total # of Tests Useful 25 29 4 29 29 5 48 346 214 55 39 16 834 100%**
Overall Completeness 60% 88% 50% 88% 88% 63% 91% 89% 91% 89% 67% 84% 86%
* as % of Total # Analytical Tests Requested in SAP; **as % of Total # Analytical Tests Reported
B-5

Appendix C
Examples of Site Visit/Chain of Custody Form
C-1
C-2

Appendix D
Internet Links to On-Line Field Equipment Manuals
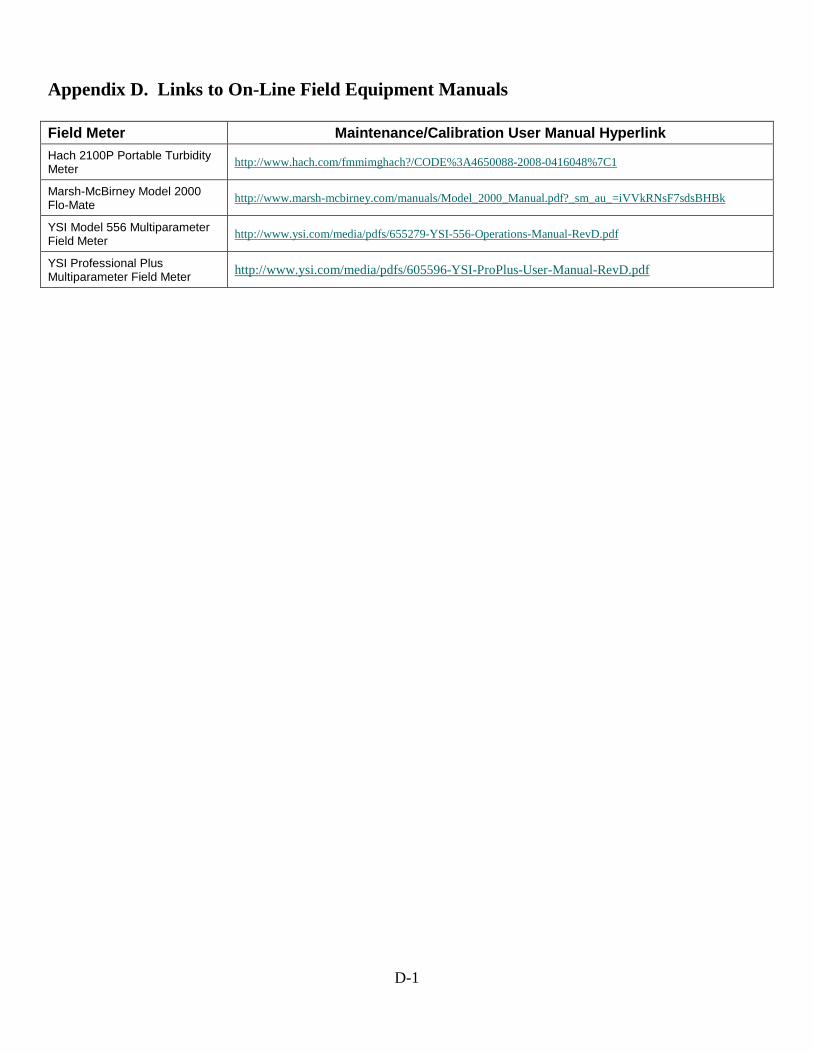
Appendix D. Links to On-Line Field Equipment Manuals Field Meter Maintenance/Calibration User Manual Hyperlink Hach 2100P Portable Turbidity Meter http://www.hach.com/fmmimghach?/CODE%3A4650088-2008-0416048%7C1
Marsh-McBirney Model 2000 Flo-Mate http://www.marsh-mcbirney.com/manuals/Model_2000_Manual.pdf?_sm_au_=iVVkRNsF7sdsBHBk
YSI Model 556 Multiparameter Field Meter http://www.ysi.com/media/pdfs/655279-YSI-556-Operations-Manual-RevD.pdf
YSI Professional Plus Multiparameter Field Meter http://www.ysi.com/media/pdfs/605596-YSI-ProPlus-User-Manual-RevD.pdf
D-1

Appendix E
Water Sample Collection Procedures for Low-Level Total Mercury

The MT DEQ procedure is based on U.S. E.P.A method 1669: Sampling Ambient Water for Trace Metals at EPA Water Quality Criteria Levels (1996). A clean hands/dirty hands sampling technique for low-level mercury is necessary because the analysis has an inherent sensitivity to unintentional sample contamination from sources other than the ambient water being sampled. The procedure requires a two-person sampling team. One person is designated as “dirty hands” and the second person is designated as “clean hands”. "Dirty hands" is responsible for all activities that do not involve direct contact with the sample bottles and sample water.
Sampling operations need to minimize the risk of sample contamination by human contact or atmospheric exposure. When multiple sites are scheduled for sampling, the field crew needs to determine the appropriate order for site visits. Sites visit order should not be determined simply through considerations of convenience (i.e. travel distance, proximity to other sample sites). The crew needs to assess two main components in determining sample site order: 1) whether individual sites have differing likelihoods of experiencing contamination; and 2) whether there are certain sites that are suspected to have relatively high levels of mercury in the ambient water since contamination of samples at such sites may pose less of a risk of causing erroneous results than at sites with very low levels of mercury. Sites suspected to have the greatest risk of contamination should be sampled first while sites suspected of having the greatest levels of mercury should be sampled last whenever possible in order to reduce the risk of cross-contamination of samples among sites. Vehicles should be fueled and ice obtained the day prior to the commencement of sampling activities. During a sampling day, “clean hands” must not smoke cigarettes and should not fuel the field vehicle prior to sampling. Hand wipes should be used regularly to clean hands and surfaces such as the vehicle steering wheel. If fuel or ice is needed after sampling activities have begun, it needs to be acquired at the end of the day once sampling for that day has been completed. Whenever possible, the sampling team should approach a site from downwind and downstream to reduce the risk of contamination. The sample bottle must be opened, filled, and closed while submerged in the ambient water to avoid atmospheric contamination. For laboratory preservation of sample, samples need to be delivered to the analyzing lab within 24 hours of sample collection with sufficient time allotted for the lab to meet the 48 hour sample preservation deadline. Materials:
1. Gloves: Clean, non-talc (i.e. powder-free) polyethylene, latex, vinyl, or PVC; one pair of gloves per site for “dirty hands”, two pairs of gloves per site worn by “clean hands”. Gloves must be bagged by the analyzing lab or in a clean indoor environment and then stored in a clean cooler. Under no circumstances will non-bagged gloves be stored in the field vehicle, e.g. do not store open boxes of gloves in the vehicle cab, storage space, or in a cooler. The pair of gloves for “dirty hands” is stored separately from the gloves for “clean hands” in a sealed plastic bag. The two pairs of gloves for “clean hands” are double-bagged. The inner gloves for “clean hands” may be wrist-length while the outer gloves must be at least elbow-length. For dexterity purposes, thin outer length gloves are preferable.
2. Sample bottles: borosilicate glass or fluoropolymer bottles; individual bottles are pre-cleaned and double-bagged by the analyzing laboratory.
3. Plastic coolers, hard-sided, clean: for unused sampling equipment, e.g. glove sets, sample bottles, preservatives, glove bag. Store gloves for dirty hands in a separate cooler. Small enough to carry to sample site.
4. Plastic coolers, hard-sided, clean: for completed samples. Small enough to carry to sample site, large enough to house bags of ice and one or more sample bottles.
5. Ice, “wet”: Completed samples must never become immersed in ice water. Upon acquisition, the ice must go directly from the store to the sealable bags, to the designated sample cooler. Bags should not be temporarily set on the ground, on a vehicle, or in a shopping cart. Gloves should be worn whenever placing items into the sample cooler. First, a large garbage bag is placed in the cooler. Second, ice packed in sealable gallon-size plastic bags is placed in the garbage bag, lining the bottom and also the sides of the cooler. Third, a second large garbage bag is placed inside the first garbage bag containing
E-1
the ice bags- this is the bag that in which completed samples will be placed. Fourth, the inner and outer garbage bags are closed.
6. Chest high waders: optional; worn by “clean hands”. 7. Plastic bags, clean: stored in a clean plastic bag within sample supply cooler; zip-type, non-vented,
colorless polyethylene. 8. Garbage bags, large, clean: stored in a clean cooler, for lining sample cooler. 9. Garbage bags, small: stored in a plastic bag within the sample supply cooler; for discarding used
supplies. 10. Hand-wipes. 11. Paper towels: for drying sample bottles prior to affixing labels; prior to the field trip, the paper towel is
placed in a sealable plastic bag in a clean indoor environment. 12. Labeling supplies: labels, clear tape, black sharpies, and pencil. 13. Field forms, clipboard, pencils, erasers, sharpies. 14. GPS unit. 15. Digital camera. 16. Field Blank Supplies: De-ionized water stored in a borosilicate glass or fluoropolymer bottle; additional
empty borosilicate glass or fluoropolymer bottle for preparing field blank; individual bottles are pre-cleaned and double-bagged by the analyzing laboratory. These bottles are to be stored in the sample supplies cooler.
17. Glove bag: for preparing field blank 18. “Dry” ice: for inflating the glove bag. 19. Tongs, nonmetallic: for handling dry ice; stored in a clean cooler.
Additional Materials required if field preservation of samples is necessary
1. Glove bags for in situ sample preservation; one glove bag per day of sampling; store in a garbage bag within a plastic cooler
2. Garbage bags, small: stored in a plastic bag within the sample supply cooler; for transporting samples from the site to the vehicle.
3. Plastic bags, clean: for lining the bottom of the glove bag; stored in a clean plastic bag within a clean plastic cooler; zip-type, non-vented, colorless polyethylene.
4. Extra gloves, clean for using the glove bag. Stored in a sealed plastic bag within the cooler containing the glove bags
5. “Dry” ice: for inflating the glove bag. 6. Cooler, small, clean: for storage of dry ice. 7. Tongs, nonmetallic: for handling dry ice; stored in a clean cooler. 8. Trace-pure HCl for preserving samples; double-bagged by lab.
Procedure: Stage 1: Arrival at the site
• At the vehicle, “dirty hands” puts on a clean pair of gloves. “Clean hands” puts on chest high waders as
necessary.
E-2
• For lab preservation, carry the sample supply cooler and the completed samples cooler to the sample site. For field preservation, leave the completed sample cooler at the vehicle and instead bring a clean garbage bag (stored within the sample supply cooler) to the sample site. “Dirty hands” also carries the field forms, pencils, GPS unit and camera to the site.
Stage 2: Sampling Preparation
• Upon reaching the water’s edge at the location where the water body will be entered for sample collection, “dirty hands” carries the sample supply cooler to the water’s edge and “clean hands” enters the water.
• Standing at the water’s edge, “dirty hands” opens the cooler, removes the bag of gloves, opens the outer sealed plastic bag containing the gloves and holds the bag open without touching the inside of the outer bag. “Clean hands” reaches into the outer bag, opens the inner plastic bag, extracts, and puts on the inner gloves, followed by the elbow or shoulder length gloves. After this point, if “clean hands” touches anything besides the sample bottle, cap, stream water, paper towel, and sample label (e.g. waders, branches, rocks, etc.), the outer gloves must immediately be removed.
• "Dirty hands" unzips the outer sample bag containing the sample bottle and holds the bag open without touching the inside of the bag. Without removing the inside bag from the outside bag, "clean hands" opens the inside bag containing the sample bottle and removes the bottle, and if possible, reseals the inside bag. "Dirty hands" then reseals the outer bag and returns it to the sampler supply cooler.
Stage 3: Sample Collection
• "Clean hands" wades into the stream and locates the thalweg. Facing directly upstream, the sample bottle is positioned upstream of their standing position. If the stream is not flowing (pool or glide systems), wade the stream carefully to avoid disturbing the sediment. Meanwhile, “dirty hands” will be completing the field form, preparing the sample label, and completing site photographs.
• “Clean hands” submerges the bottle completely beneath the water surface, taking care not to disturb the channel substrate. Once the bottle is completely submerged into the stream flow, “clean hands” unscrews the cap underwater and allows the bottle to fill with water. During filling of the bottle, the cap should remain underwater to minimize atmospheric exposure. The sample bottle is not rinsed with ambient water prior to sample collection.
• The bottle should be filled as completely with water as possible. After the bottle has filled and is still completely underwater, "clean hands" seals the cap on the bottle. In this way, the sample water has never contacted the atmosphere. REFER TO STAGE 4B FOR INSTRUCTIONS ON SAMPLE BOTTLE FILLING WHEN FIELD PRESERVATION IS NECESSARY.
Stage 4A: Sample Completion, assuming lab preservation of samples
E-3
• “Dirty hands” removes the paper towel bag from the sample supply cooler and opens the plastic bag. While holding the sample bottle, “clean hands” removes the outer sample gloves and then removes a paper towel and dries the sample bottle. If it is raining and the sample bottle cannot be dried at the stream, the bottle is put into the inner sample bag following the procedure below and is taken to the vehicle where it can be labeled inside the vehicle.
• “Clean hands” moves to the edge of the stream channel.
• “Dirty hands” gives the completed sample label and tape to “clean hands” who affixes the label to the
bottle. • "Dirty hands" removes the sealed sample bag from the cooler, opens the outer sample bag, and holds it
open. "Clean hands" opens the inner sample bag removes bottle and submerges bottle into water column. The lid is removed and the bottle is allowed to fill. The cap is replaced while the bottle is submerged. The bottle is removed from the water column then the sample bottle is placed into the inner bag. "Clean hands" reseals the inner bag. "Dirty hands" seals the outer sample bag.
• “Clean hands” opens the completed samples cooler and places the sample bottle inside the inner garbage
bag. “Clean hands” closes all garbage bags and closes the samples cooler. “Dirty hands” discards used sample supplies in a small garbage bag.
• Upon reaching the vehicle, the used garbage bag is discarded into a large garbage bag designated for the
disposal of used equipment. Gloves can now be removed.
• NOTE: Samples need to be delivered to the analyzing lab within 24 hours of sample collection with sufficient time allotted for the lab to meet the 48 hour sample preservation deadline.
Stage 4B: Sample Completion assuming field preservation of samples ATTENTION: AS OF LATE SUMMER 2012, MONTANA DEQ HAD TENTATIVELY APPROVED AN ALTERNATE FIELD METHOD THAT EMPLOYS PRE-PRESERVED SAMPLE BOTTLES. Approved HCl preservative is added to clean, empty sample bottles under controlled conditions in the laboratory, and Hg samples are collected following exactly the same procedures described above. This alternative eliminates the need to ship samples within 24 hours to meet the 48 hour holding time, a requirement that posed serious limitations on monitoring in remote locations of Montana. – Erich Weber, Atkins QA/QC Officer
• NOTE: FOR FIELD PRESERVATION OF SAMPLES FILL THE SAMPLE BOTTLE WITH AMBIENT WATER TO WITHIN ONE TO TWO CENTIMETERS OF THE TOP INSTEAD OF FILLING THE BOTTLE COMPLETELY.
• After filling the bottle, “clean hands” moves to the edge of the stream channel. • “Dirty hands” removes the paper towel bag from the sample supply cooler and opens the bag. While
holding the sample bottle, “clean hands” removes the outer sample gloves and then removes a paper towel and dries the sample bottle. "Dirty hands" removes the sealed sample bag from the garbage bag, opens the outer sample bag, and holds it open. "Clean hands" opens the inner sample bag. “Clean hands”
E-4
then places the sample bottle into the inner bag, and reseals the inner bag. "Dirty hands" seals the outer sample bag.
• “Dirty hands” takes two small garbage bags out of the sample supply cooler. “Clean hands” places the
sample bottle within one garbage bag while “dirty hands” discards used sample supplies in the second small garbage bag. “Clean hands” carries the completed sample to the vehicle while “dirty hands" carries the rest of the supplies.
• Upon reaching the vehicle, “dirty hands” removes a clean garbage bag from a cooler and places it on a
flat surface.
• “Dirty hands” removes the glove bag from a clean cooler and sets them on the garbage bag. “Dirty hands” takes out the bag of extra gloves and opens the bag. “Clean hands” discards their inner gloves and puts on a new pair of gloves.
• “Dirty hands” opens the cooler containing the dry ice. “Dirty hands” removes a piece of dry ice from the
small cooler using the tongs. “Clean hands” opens the glove bag and “dirty hands” inserts the ice using the tongs. Once the bag is inflated, “clean hands” opens the glove bag and “dirty hands” removes and discards the remaining dry ice. The tongs are then stored in a clean cooler.
• “Dirty hands” removes the bag of plastic liner bags from a cooler. “Dirty hands” opens the plastic bag
containing uncontaminated plastic bags and holds it open. “Clean hands” withdraws a plastic bag, opens the glove bag, and places the liner in the bottom of the glove bag in order to catch any fluid that may spill during the sample preservation. The glove bag is then sealed.
• “Dirty hands” removes the preservative bag from the cooler, opens the outer preservative bag and holds it open while “clean hands” removes the inner bag, opens the glove bag, and places the inner preservative bag inside the glove bag.
• "Dirty hands" opens the outer sample bag and holds it open. "Clean hands" opens the inner sample bag
containing the sample bottle and places the bottle inside the glove bag, then seals the glove bag. Clean hands seals the inner sample bag, then “dirty hands” seals the outer sample bag.
• “Clean hands” uses the gloves attached to the glove bag to unscrew the sample bottle, open the inner
preservative bag, open the preservative aliquot, pour the preservative into the sample bottle, and reseal the sample bottle. “Clean hands” puts the used aliquot into the inner preservative bag and seals it.
• “Clean hands” then opens the glove bag and removes the sample bottle from the glove bag. Dirty
hands” gives the completed sample label and tape to “clean hands” who affixes the label to the bottle. "Dirty hands" opens the outer sample bag and holds it open. "Clean hands" opens the inner sample bag, places the sample bottle into the inner bag, then seals the inner bag. "Dirty hands" seals the outer sample bag.
• “Dirty hands” places the sample bag containing the completed sample into the cooler containing the ice.
• “Clean hands” extracts the used preservative and liner bag from the glove bag and gives them to “dirty
hands” who discards them in a garbage bag designated for the disposal of used equipment. “Dirty
E-5
hands” also discards the used gloves and paper towels into the garbage bag. “Clean hands” deflates the glove bag and stores it in a clean garbage bag. Gloves can now be removed.
QA/QC Procedure
• For every field trip, one field blank and one field duplicate must be prepared. • The duplicate sample may be performed at any sample site during the field trip.
Field Blank Requirements for Low-Level Total Hg Sampling Per the Guidance for Implementation and Use of EPA Method 1631 for the Determination of Low-Level Mercury, EPA Method 1631 requires collection of a field blank at a 10% frequency. To meet Method requirements, a field blank should be collected for low-level Hg samples. Although a grab sample for the DEQ method does not allow the sample to be exposed to atmosphere and there is no filtering or sampling equipment involved, there are other processes during the sampling and analysis process (including storage, transport, preservation and analysis) that could potentially introduce contamination. Collecting a field blank (lab preserved method):
1. An empty sample bottle for the field blank should be requested from the analyzing laboratory when the sampling kit is requested. A separate sample bottle filled with mercury-free reagent water will be used to collect the field blank. The bottle containing reagent water needs to be double-bagged by the lab. These will be shipped to the field in the sample bottle cooler and treated as a sample in most respects.
2. “Dirty hands” puts on a clean pair of gloves stored in sealed plastic bag in a sample supplies cooler and
then removes a clean garbage bag from a supplies cooler and places it on a flat surface.
3. “Dirty hands” removes a glove bag from a sample supplies cooler and sets them on the garbage bag. “Dirty hands” takes out the bag of extra gloves and opens the bag. “Clean hands” reaches in and puts on a pair of gloves.
4. Dirty hands” opens the cooler containing the dry ice. “Dirty hands” removes a piece of dry ice from the
small cooler using the tongs. “Clean hands” opens the glove bag and “dirty hands” inserts the ice using the tongs. Once the bag is inflated, “clean hands” opens the glove bag and “dirty hands” removes and discards the remaining dry ice. The tongs are then stored in a clean cooler.
5. Dirty hands” removes the bag of plastic liner bags from a cooler. “Dirty hands” opens the plastic bag
containing uncontaminated plastic bags and holds it open. “Clean hands” withdraws a plastic bag, opens the glove bag, and places the liner in the bottom of the glove bag in order to catch any fluid that may spill during the sample preservation. The glove bag is then sealed by “dirty hands”.
6. “Dirty hands” removes the bag containing the bottle with reagent water from the cooler, opens the outer
bag and holds it open while “clean hands” removes the inner bag, opens it and removes the reagent bottle. “Dirty hands” opens the glove bag. “Clean hands” places the reagent bottle inside the glove bag. “Dirty hands” then seals the glove bag.
E-6
7. Dirty hands" removes a double-bagged sample bottle from a sample supplies cooler, opens the outer sample bag and holds it open. "Clean hands" removes the inner sample bag containing the sample bottle. “Dirty hands” opens the glove bag and “clean hands” opens the inner bag and places sample bottle inside the glove bag. “Dirty hands” then seals the glove bag. “Clean hands” re-seals the inner bag. “Dirty hands” holds open the outer bag and “clean hands” puts the sealed inner bag into the outer bag. “Dirty hands” then reseals the outer bag. “Dirty hands” prepares the sample bottle label.
8. “Clean hands” uses the gloves attached to the glove bag to unscrew the cap on the sample bottle and sets
the cap to one side of the glove bag. “Clean hands” uses the attached gloves to unscrew the cap on the reagent bottle and sets its cap to an opposite side of the glove bag. “Clean hands” pours the reagent water into the sample bottle and then screws the cap back onto the sample bottle.
9. “Clean hands” then opens the glove bag and removes the sample bottle from the glove bag. “Dirty
hands” gives the completed sample label and tape to “clean hands” who affixes the label to the bottle. "Dirty hands" opens the outer sample bag and holds it open. "Clean hands" opens the inner sample bag, places the sample bottle into the inner bag, then seals the inner bag. "Dirty hands" seals the outer sample bag. “Dirty hands” places the sample bag containing the completed field blank sample into the cooler containing the ice.
“Clean hands” extracts the liner bag from the glove bag and gives them to “dirty hands” who discards them in a garbage bag designated for the disposal of used equipment. “Clean hands” deflates the glove bag and stores it in a clean garbage bag in a clean cooler. Gloves can now be removed.
E-7