metastable copper chromium thin films
TRANSCRIPT

7/21/2019 Metastable Copper Chromium Thin Films
http://slidepdf.com/reader/full/metastable-copper-chromium-thin-films 1/7http://journals.cambridge.org Downloaded: 23 Apr 2015 IP address: 129.49.232.120
Metastable copper-chromium alloy films
A: P. Payne and
B.
M. Clemens
Department of Materials Science and Engineering, Stanford University, Stanford, California 94305-2205
(Received 21 November 1991 ; accepted 18 February 1992)
Due to the large positive heat of mixing associated with the Cu-Cr binary system, solid
solutions exist only as nonequilibrium states. In this study, a series of metastable Cu-Cr
alloys ranging in composition from 14.1 to 75.4% copper was fabricated by sputter
deposition. Symm etric, asym metric, and grazing incidence x-ray diffraction geom etries
were used to trace the phase transition from bcc to fee crystal structures with increasing
Cu fraction. It is shown that the transition takes place not by a two-phase region
suggested by equilibrium thermodynamics, but rather through gradual disordering of the
bcc lattice as copper atoms are substitutionally accommodated. At a critical saturation
near 7 1 % Cu, the bcc structure beco mes unstable relative to the fee and a phase transition
occurs. The free energies of the kinetically constrained Cu-Cr system are modeled and
the results are found to agree well with observed behavior.
I. INTRODUCTION
A notable aspect of the copper-chromium phase
diagram is the strong chemical aversion between the
two elements. At room temperature, the solubility of
chromium in copper is limited to 0.02%, while that of
copper in chromium is believed to be even less.
1
The
elements are even immiscible in the liquid state, exhibit-
ing a miscibility gap that persists to an undetermined
temperature. Cu-Cr alloys are of technological interest
in applications ranging from electrical switches
2
to catal-
ysis. Study of Cu—Cr alloys over a wide composition
range is hindered, however, by the large positive heat of
mixing exhibited by the system.
Several efforts have been made toward extending
the solubility of chromium in copper. Rapid quenching
techniques such as splat cooling and melt spinning have
produced supersaturations as high as 1.8 .
3
Pulsed laser
irradiation has pushe d solubility as high as 4%.
4
Electron
and ion beam irradiation have also been employed with
limited success.
5
Each of the above techniques encoun-
ters difficulty in mitigating the liquid phase immiscibility
of the Cu-Cr system. In this regard, direct deposition
from the vapor phase has been shown to dramatically
increase solid solubility. Co-evaporation of copper and
chromium has previously been shown to restrict the
two-phase region to between 60 and 70% copper.
6
In
the present study it was found that sputter deposition
completely suppressed the formation of a two-phase
region, resulting in a continuous range of metastable
alloys.
II. FILM PREPARATION AND ANALYTICAL
TECHNIQUES
Cu-Cr alloy films were produced by co-deposition
of Cu and Cr onto two 3" stationary (100) silicon wafers
positioned between the magnetron sputter sources. The
base pressure of the system was 1 x 10"
7
Torr, while
sputtering was carried out in a 2.3 mT argon ambient
at a deposition rate of 6 A /s . The source-substrate
distance is 13 cm for normal incidence sputtering in this
system. Because the wafers were positioned between the
sources, however, the source substrate distance varied
from approxima tely 13 to 22 cm across the pair of
wafers. The path length difference induced a spatial
variation in flux from each source across the wafers,
resulting in a continuous range of compositions between
14.1 and 75.4% Cu. The wafers were cleaved into a total
of 27 segm ents, each 5 mm wide by 2 cm long . The
average composition of each slab was then determined
using an electron beam microprobe.
The use of several x-ray diffraction techniques en-
abled complete structural determination. The diffraction
geometries are shown in Fig. 1. Symmetric Bragg geom-
etry (SB), where the scattering vector (q) is parallel to
the surface normal, was used to measure crystallographic
structure of atomic planes parallel to the surface. Due
to texture in our samples, however, this technique is
able to access only a single reciprocal lattice point
and its higher harmonics. To investigate other plane
spacings, asymmetric Bragg geometry (AB), where q
forms an angle 10 to the surface norm al, was used to
measure atomic planes inclined at various angles to the
surface. Grazing incidence x-ray scattering (GIXS) was
used to measure lattice spacings for planes with normals
lying in the surface. Here q is nearly perpendicular to
the sample normal.
7
The combination of these three
techniques allowed us to track phases over a wide range
of compositions in the Cu-Cr system. In addition to the
x-ray techniques, high resolution transmission electron
microscopy was also used to study the structure of the
alloys.
1370
J. Mater. Res. Vo l. 7 No. 6 Jun 1992 1992 Materia ls Research Soc ie ty

7/21/2019 Metastable Copper Chromium Thin Films
http://slidepdf.com/reader/full/metastable-copper-chromium-thin-films 2/7http://journals.cambridge.org Downloaded: 23 Apr 2015 IP address: 129.49.232.120
A
P. Payne and B. M. Clemens: Metastable copper-chromium alloy films
III.
RESULTS
A. Microprobe analysis
Results of the electron beam microprobe analysis in-
dicated a smooth and approximately linear concentration
gradient across the wafers, with compositions ranging
from 14.1 to 75.4 Cu. Composition variations within
each cleaved sample were determined to be less than
4
in all cases.
B Diffraction analysis
Symmetric Bragg diffraction revealed only one peak
and its higher harmonics for each of the compositions
studied, indicating a growth direction texture and sug-
gesting the presence of only a single phase at each
composition. Figure 2 shows a plot of growth direc-
tion J-spacing as a function of composition. On the
chromium-rich side, the ^-spacing was found to be
120-
(a) Symmetric Bragg
(b) Asymmetric Bragg
(c)
Grazing Incidence
FIG. 1. Scattering geometries used in this study. Collective imple-
mentation of the SB, AB, and GIXS geometries allows full structural
determination
in textured
films,
(a) Symmetric Bragg, (b) asymmetric
Bragg , and (c) grazing incidence.
1-2.09
Bulk Cr (110)-
2 04
20 30 40 50
Atomic Cu
60
70
FIG. 2. Growth direction rf-spacing (A), grain size (A), and peak
intensity (arbitrary linear scale) as function of Cu content (Cu K
o
radiation).
Note the rapid change in growth direction d-spacing, the
reduced grain size, and the diminished peak intensity in the region
between 50 and 70 Cu.
0.5 larger than the bulk value of 2.040 A for Cr(110).
With increasing Cu content, the ^-spacing exhibits a
gradual decrease up to roughly 53 Cu, at which point
it increases rapidly though continuously toward that of
Cu(lll) .
In addition to the rapid change in ^-spacing and
low intensity between 50 and 70 Cu, the peaks also
attain their greatest width in this region. This is shown
in Fig. 2 in which peak widths have been translated via
the Scherrer relation into average grain size in the growth
direction. Analysis of first and second order harmonics
indicated that finite size effects are the primary source of
broadening. The small grain size was confirmed in the
orthogonal direction (film plane) with high resolution
TEM, which revealed a nanocrystalline grain structure
in the alloys. Figure 3 shows a 20 A grain from a 60.5
Cu specimen. As Fig. 2 shows, the average grain size is
largest for the Cr-rich alloys but decreases to a minimum
in the transition region and rises again only slightly for
the Cu-rich alloys.
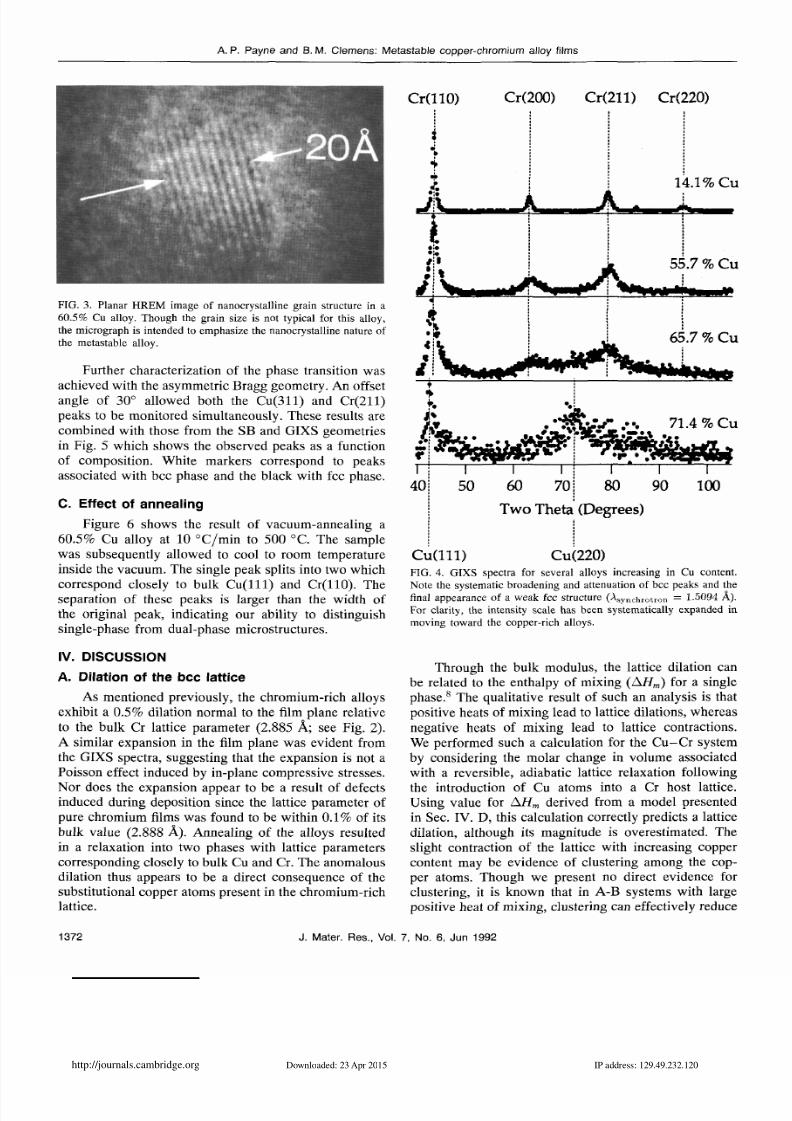
Figure 4 shows a series of GIXS measurements
taken for representative alloys. For the chromium-rich
alloys (top spectra), a well-developed bcc structure is
evident. As more copper is added to the bcc lattice,
however, the structure gradually disorders, as evidenced
both by broadening of the peaks and reduction of their
intensity. Between approximately 66 and 71 Cu, a
transition occurs from a disordered bcc structure to
a disordered fee structure. This is manifested by the
appearance of a broad Cu(220) peak in the lowermost
spectrum in Fig. 4, as well as by the movement of the
growth direction peak toward lower angles correspond-
ing to Cu(lll). A well-ordered fee phase was not evident
within the composition range studied.
J.
Mater. Res. Vol. 7 No. 6 Jun 1992
1371
7/21/2019 Metastable Copper Chromium Thin Films
http://slidepdf.com/reader/full/metastable-copper-chromium-thin-films 3/7http://journals.cambridge.org Downloaded: 23 Apr 2015 IP address: 129.49.232.120
A. P. Payne and B. M. Clemens: Metastable copper-chromium alloy films
FIG. 3. Planar HREM image of nanocrystalline grain structure in a
60.5%
Cu alloy. Though the grain size is not typical for this alloy,
the micrograph is intended to emphasize the nanocrystalline nature of
the metastable alloy.
Further characterization of the phase transition was
achieved with the asymmetric Bragg geometry. An offset
angle of 30° allowed both the Cu(311) and Cr(211)
peaks to be monitored simultaneously. These results are
combined with those from the SB and GIXS geometries
in Fig. 5 which shows the observed peaks as a function
of composition. White markers correspond to peaks
associated with bcc phase and the black with fee phase.
C. Effect of annealing
Figure 6 shows the result of vacuum-annealing a
60.5%
Cu alloy at 10 °C /m in to 500 °C. The sam ple
was subsequently allowed to cool to room temperature
inside the vacuum. The single peak splits into two which
correspond closely to bulk Cu(lll) and Cr(110). The
separation of these peaks is larger than the width of
the original peak, indicating our ability to distinguish
single-phase from dual-phase microstructures.
IV. DISCUSSION
A. Dilation of the bcc lattice
As mentioned previously, the chromium-rich alloys
exhibit a 0.5% dilation normal to the film plane relative
to the bulk Cr lattice parameter (2.885 A; see Fig. 2).
A similar expansion in the film plane was evident from
the GIXS spectra, suggesting that the expansion is not a
Poisson effect induced by in-plane compressive stresses.
Nor does the expansion appear to be a result of defects
induced during deposition since the lattice parameter of
pure chromium films was found to be within 0.1% of its
bulk value (2.888 A). Annealing of the alloys resulted
in a relaxation into two phases with lattice parameters
corresponding closely to bulk Cu and Cr. The anomalous
dilation thus appears to be a direct consequence of the
substitutional copper atoms present in the chromium-rich
lattice.
M l 10)
1
•
J
•i f
Cr(200)
\
to*
Cr(211) Cr(220)
1
SI
65
4.1%
«_
i .7
».7
Midi
Cu
C u
Cu
r
r
40
71.4 %Cu
50
I T; I I I
60 70 80 90 100
Two Theta' (Degrees)
Cu(l l l ) Cu(220)
FIG. 4. GIXS spectra for several alloys inc reasing in Cu con tent.
Note the systematic broadening and attenuation of bcc peaks and the
final appearance of a weak fee structure (As y n c h r o t r o n = 1-5094 A ).
For clarity, the intensity scale has been systematically expanded in
moving toward the copper-rich alloys.
Through the bulk modulus, the lattice dilation can
be related to the enthalpy of mixing AHm) for a single
phase.8 The qualitative result of such an analysis is that
positive heats of mixing lead to lattice dilations, whereas
negative heats of mixing lead to lattice contractions.
We performed such a calculation for the Cu-Cr system
by considering the molar change in volume associated
with a reversible, adiabatic lattice relaxation following
the introduction of Cu atoms into a Cr host lattice.
Using value for AHm derived from a mo del presented
in Sec. IV. D, this calculation correctly predicts a lattice
dilation, although its magnitude is overestimated. The
slight contraction of the lattice with increasing copper
content may be evidence of clustering among the cop-
per atoms. Though we present no direct evidence for
clustering, it is known that in A-B systems with large
positive heat of mixing, clustering can effectively reduce
1372
J. Mater. Res., Vol. 7, No. 6, Jun 1992

7/21/2019 Metastable Copper Chromium Thin Films
http://slidepdf.com/reader/full/metastable-copper-chromium-thin-films 4/7http://journals.cambridge.org Downloaded: 23 Apr 2015 IP address: 129.49.232.120
A. P. Payne and B. M. Clemen s: M etastable copper-chromium alloy films
o Cr(llO)
• Cu( l l l )
o Cr(200)
• Cu(220)
2.0 —
60
u 1-6-
en
Q
1.2 —
0.8
C8XCCCCQ000 O OOOOO
BCC
n Cr(211)
• Cu(311)
FC C
0
o o
man
an
D D D D D
10 20 30
40 50
60
70 80 90 100
Atomic
%
Cu
FIG. 5. Summary of all observed reflections and rf-spacings via SB,
AB , and GIXS geometries. Phase transition from bcc to fee structures
occurs near 7 1 % Cu. Light and dark shading indicates composition
regime of bcc and fee phases, respectively. White and dark markers
indicate observed bcc and fee reflections, respectively.
the number of A-B pairs from that in a conventional reg-
ular solution.
9
Thermodynamic models for this behavior
involve a reduction in the AH
m
and hence lattice dilation
which is most severe at the 50% composition: this trend
is observed in the data.
B. Texture of the bcc and fee phases
The symmetric Bragg spectra revealed only Cr(M0)
and Cu hhh) type reflections across the entire composi-
tion range studied, suggesting texturing of the close(est)
packed planes perpendicular to the growth direction.
This was confirmed by the in-plane GIXS measurements.
In this geometry, allowed reflections are determined
by both the usual structure factors as well as by the
requirement of a zero scalar product with the Miller
indices of the planes perpendicular to the growth di-
rection. All of the allowed reflections for bcc chromium
are evident in the GIXS spectra for the chromium-rich
alloy (top spectrum, Fig. 4). As the bcc lattice becomes
increasingly disordered, these peaks broaden and their
intensity wanes. For the most copper-rich alloy (bottom
spectrum, Fig. 4), a broad (220) peak appears, signaling
the evolution of a disordered fee phase. A C u ( ll l)
reflection is also evident in this spectrum, resulting from
mosaic spread in texture. Since conjugate (111) type
planes form an angle of 70.53°, misorientation of the
plane through 19.5° renders the peak accessible to the
GIXS geometry. Figure 7 shows the rocking curve from
the fee (111) phase of the 75.4% Cu alloy obtained in the
SB geometry. The FWHM of 16° confirms the mosaic
spread in the disordered fee phase.
C. X-ray visibility of second phases
The observation of only a single peak and its higher
orders in the SB diffraction geometry suggests that the
alloys are single phase. Further confirmation comes from
observation in other directions in reciprocal space where
the peak separations are greater. For example, in GIXS
geometry the Cr(200) and (220) peaks are separated by
several degrees from the Cu(2 20), as shown in Fig. 4,
where there is no indication of the presence of two
phases. A question nevertheless remains about the x-ray
S
0)
BulkCu(l l l ) -
Pre Anneal
Post Anneal
1 r
40
1
I '
42
Bulk C r (110)
i i r
44
46 48
Two Theta (Degrees)
FIG. 6 . Effect of vacuum annealing to 500 °C at 10 °C /m in and
subsequent cooling to room temperature. Note the bifurcation of the
growth direction peak into peaks corresponding closely to bulk Cu
and Cr.
1
10
1
15
1
20
Theta
1
25
(Degrees)
1
30
1
35
40
FIG. 7. Rocking curve on fee (111) for 75.4% Cu alloy, indicating
partial texturing of the fee Cu phase. The breadth of the peak
explains the presence of the technically forbidden Cu(lll) peak in
the lowermost GIXS spectrum shown in Fig. 4 .
J. Mater. Res. Vol. 7 No. 6 Jun 1992
1373

7/21/2019 Metastable Copper Chromium Thin Films
http://slidepdf.com/reader/full/metastable-copper-chromium-thin-films 5/7http://journals.cambridge.org Downloaded: 23 Apr 2015 IP address: 129.49.232.120
A. P. Payne and B M. Cleme ns: M etastable copp er-chromium alloy films
visibility
of a second phase, and we address this with a
simple volumetric argument. We estimate the intensity
and peak width of reflections from the hypothetical fee
Cu phase relative to those observed in the bec peaks,
and demonstrate that this leads to a contradiction with
the observed data.
Suppose the alloy is a two-phase mixture in which
one constituent (arbitrarily Cr) exists as a precipitate
in a matrix of the other. We idealize this hypothetical
microstructure as a simple cubic array of spherical bec
Cr precipitates of radius r^ and spacin g s in a fee Cu
matrix. W hile other arrays are possible, this one gives the
same order of magnitude results as other choices. The
assumption of spherical grains is not egregious, since
grain sizes for Cr-rich alloys measured perpendicular
and parallel to the film plane yielded dimensions of
120 and 90 A, respec tively (aspect ratio x, 0.75). We
assume that the coherence length of x-rays within the
copper matrix does not exceed the precipitate spacing 5.
While it may in fact exceed s, our assumption leads to
an overestimation in peak width which would degrade,
rather than enhance, peak visibility. Reversing the roles
of Cu and Cr as precipitate and matrix does not affect
the result of the calculation.
Since the prospect of a two-phase region is most
likely in the region between 60 and 70% Cu, the
65.7% Cu alloy is selected to test this. The bec peaks
from this alloy (Fig. 4) are fitted to gauss ian profiles
to determine their amplitude and width. These widths,
together with the alloy composition, are used to calculate
r
Cr
and 5 for the hypothetical microstructure. From these
dimensions, the widths of the fee Cu reflections are
estimated. The amplitude of the Cu reflections relative to
the observed Cr peaks are calculated according to atomic
fraction, structure factor, scattering factor, and in-plane
multiplicity for the particular Cu reflection. The result of
the calculation for the hypothetical fee Cu(220) reflection
is shown in Fig. 8. The Cu(220) reflection is predicted to
be much more intense than those of the neighboring bec
Cr peaks, in contradiction with the data. The calculation
also predicts that, if present, crystalline clusters of fee
Cu as small as 11 A in diameter would produce a (220)
reflection of equal amplitude and comparable width to
the observed Cr(220) peak. We interpret this as further
evidence for the single phase nature of the alloys.
D. Thermodynamics aspects of relative
phase stability
Experimentally, we find the bec phase to dominate
over nearly the entire composition range studied. It is
noteworthy that an alloy of roughly 70% Cu adopts the
bec structure of chromium. A theoretical basis for this
finding is afforded by simple thermodynamic concepts.
The free energy (g) vs composition x) curves for each
60
Two Theta (degrees)
FIG. 8. Observe d in-plane structure (circles) and hypo thetical Cu(2 20)
reflection predicted by two-phase model (line) for a 65.4% Cu alloy.
The intense Cu peak predicted by the model is not evident in the data,
indicating a single phase bec structure despite the high concentration
of copper.
of the phases can be modeled to determine their relative
stability. This is carried out by first determining the
endpoints for the
g-x
curves. The free energies of the
pure constituents in their naturally occurring phases are
known, while the free energy difference between the bec
and fee structures of each of the pure constituents can be
estimated using the lattice stability parameters developed
by Kaufman.
10
Enthalpy of mixing is determined using
the Miedema model,
11
and the entropy of mixing is
calculated after an ideal solution model.
The results of these calculations for the Cu-Cr
system at 300 K are presented in Fig. 9. The stable
phases at this temperature are determined by constructing
the common tangent between the lowest curves. In this
case this would indicate nearly pure Cu and Cr to be the
stable phases, in agreement with the equilibrium phase
diagram. The resulting metastable phases, however, are
determined by accessing the lowest free energy curve
at a particular com position. Figu re 9 shows that the
metastable bec phase is favored over all others up to
roughly 78% Cu. Experimentally, the bec phase was
found to dom inate up to roughly 7 1 % Cu (Fig. 5). The
discrepancy probably results from inaccuracies in the
estimated lattice stabilities. These parameters essentially
determine the vertical positions of the curves; since
the bec and fee
g-x
curves are nearly horizontal near
their point of intersection, small vertical displacements
of the curves can lead to large horizontal variations in
their point of intersection. Despite this, the experimental
results agree remarkably well with those of the model.
One important aspect of these results is that they are
specific to the growth conditions. How wel l the Cu -C r
1374
J.
Mater. Res. Vol. 7 No. 6 Jun 1992

7/21/2019 Metastable Copper Chromium Thin Films
http://slidepdf.com/reader/full/metastable-copper-chromium-thin-films 6/7http://journals.cambridge.org Downloaded: 23 Apr 2015 IP address: 129.49.232.120
A. P. Payne and B. M. Cleme ns: M etastable copper-chromium alloy films
BCC
0.0
T
0.2 0.4 0.6
Atom ic Fraction Cu
FIG. 9. Calculated g-x diagram for several phases of the Cu-Cr
system. For a completely kinetically constrained system, the calcu-
lation predicts an abrupt transition from bcc to fee structures around
78 % Cu, in reasonable agreement with experiment (7 1% Cu).
system follows the behavior described by the above
model depends largely on the kinetics of deposition;
fabrication techniques approaching equilibrium growth
conditions obviously would not lead to metastable final
products. Perhaps this explains the existence of the
two-phase region described by other researchers.
6
Ther-
malization of sputtered atoms often results in arrival en-
ergies less than those by evaporation techniques.
12
These
factors would be expected to foster highly nonequilib-
rium growth conditions at the film surface. In light of
the excellent agreement of the observed behavior with
the model, this indeed seems to be the case; sputter
deposition is quite effective in completely preventing the
growth of the thermodynamically stable products.
V. CONCLUSIONS
A. Single phase solid solution
Although a two-phase field between 60 and 70% Cu
was described in earlier studies on metastable Cu-Cr
alloys,
6
no evidence of such a region was found in
this study; we maintain that under appropriate sputter-
ing conditions the two-phase region can be completely
suppressed. The evidence for this conclusion is summa-
rized below.
(1) Though a two-phase region will exhibit peaks
from both structures, nowhere in Fig. 5 are the bcc and
fee phases observed to coexist. While it is conceivable
that one of the constituents be dispersed on such a fine
scale that it is rendered indiscernible with x-rays, we
have presented arguments to the contrary.
(2) The growth direction ^-spacing exhibits no dis-
continuities. A two-phase region would necessarily show
a discontinuity in the lattice parameter since by definition
each phase can adopt only one of the two values.
Figure 2 shows, however, that the ^-spacing varies con-
tinuously, indicative of a single phase solid solution.
(3) Annealing leads to a distinct bifurcation of the
growth direction Brag g peak (Fig. 6) and relaxation
toward Cr(110) and Cu(110) d-spacings. This is the
expected behavior of a metastable single phase supplied
with sufficient activation energy for phase separation.
Arguments suggesting that this is strictly a result of
grain coarsening are addressed with the same concepts
presented in Sec. IV. C of the discussion.
B. The bcc/fcc transition via disordering
The transition from bcc to fee structures with in-
creasing copper content apparently does not occur by
the relative growth and diminution of components in a
two-phase field. We maintain that it occurs through the
gradual disordering of the bcc chromium lattice as an
increasing number of copper atoms are substitutionally
accommodated. At some critical saturation, the bcc lat-
tice becomes unstable relative to the fee and the alloy
adopts this structure. Evidence for these conclusions is
summarized below.
(1) The breadth and intensity of crystalline peaks
are direct measures of the extent of crystalline order in
a solid. Both the symmetric Bragg and the GIXS spectra
clearly depict the gradual broadening and weakening of
the bcc peaks with increasing Cu fraction. Beyond the
transition region, a broad, weak fee peak emerges.
(2) The reduced grain size in the transition region
(Fig. 2) is com men surate w ith a disordered structure.
Since the relative energy cost associated with grain
boundary surface is less for a disordered phase than for
an ordered one, the disordered phase is able to support
a larger ratio of interfacial area to grain volume, as
manifested in reduced grain size.
(3) For a kinetically constrained binary system, the
relative stability of one phase over the other changes
abruptly at a critical concentration. Both the mode of the
bcc to fee transition and the Cu concentration at which
it occurs are in excellent agreement with the kinetically
constrained thermodynamic model.
ACKNOWLEDGMENTS
We would like to thank Y.T. Chang at General
Motors Research Labs for his efforts in motivating this
study. We would also like to thank Rick Waldo, also
at GMR, for his assistance with the microprobe work.
We would like to acknowledge the Hertz Foundation
for its support of on e of us (A. P.). Finally, we wo uld
like to thank Sean Brennan at the Stanford Synchrotron
Radiation Laboratory for his help in carrying out the
GIXS experiments.
R F R N S
1. M. Hansen, Constitution of Binary Alloys, 2nd ed. (McGraw-Hill ,
New York, 1958).
J. Mater. Res. Vol. 7 No. 6 Jun 1992
1375

7/21/2019 Metastable Copper Chromium Thin Films
http://slidepdf.com/reader/full/metastable-copper-chromium-thin-films 7/7htt //j l b id D l d d 23 A 2015 IP dd 129 49 232 120
A. P. Payne and B .M. Clemens: Metastable copper-chromium alloy films
2.
J.F . Hamm an, Siemens Forsch. Entwicklungsber. 9 , 210 (1980). 7 . M. F. Doerner and S. Brennan, J. Appl. Phys. 63, 126 (1988).
3.
G. Falkenh agen and W. Hofmann , Z. Metallkd . 43 , 69 (1952 ). 8. R.A . Swalin, Thermodynamics of Solids, 2nd ed. (John Wiley,
4.
J. F. M. Wes tendorp , W. Koelewijn, W. G. J. H. M. van Sark, F. W. New York, 1972).
Saris, N. M. van der Pers, and Th. H. de Keijser, J. Mater. Res. 9. E. A. Gug genh eim, Mixtures (Oxford Press, Lond on, 1952).
1, 652 (198 6). 10. L. Kaufman and H. Bernstein, Computer Calculation of Phase
5.
C. W. Drape r, D. C. J acobse n, J. M. Gibson , J. M. Poate, J. M. Diagrams (Academic Press, New York, 1970).
Vanden berg, and A . G. Cu llis, in Laser and Electron Beam 11 . A. R. Miede ma, Philips Tech. Rev. 8, 36 (1976 ).
Interactions with Solids, edited by B. R. App leton and G. K. Cellar 12. K. Meyer, I. K. Schuller, and C M . Falco, J. Appl. Phy s. 52,
(North Holland, New York, 1982). 5803 (1981).
6. A. G. Dirks an d J. J. van den B roek, J. V ac. Sci Technol. A 3 ,
2618 (1985).
1376 J. Mater. Res. Vol. 7 No. 6 Jun 1992