meteoroid/debris shielding
TRANSCRIPT
TP−2003-210788
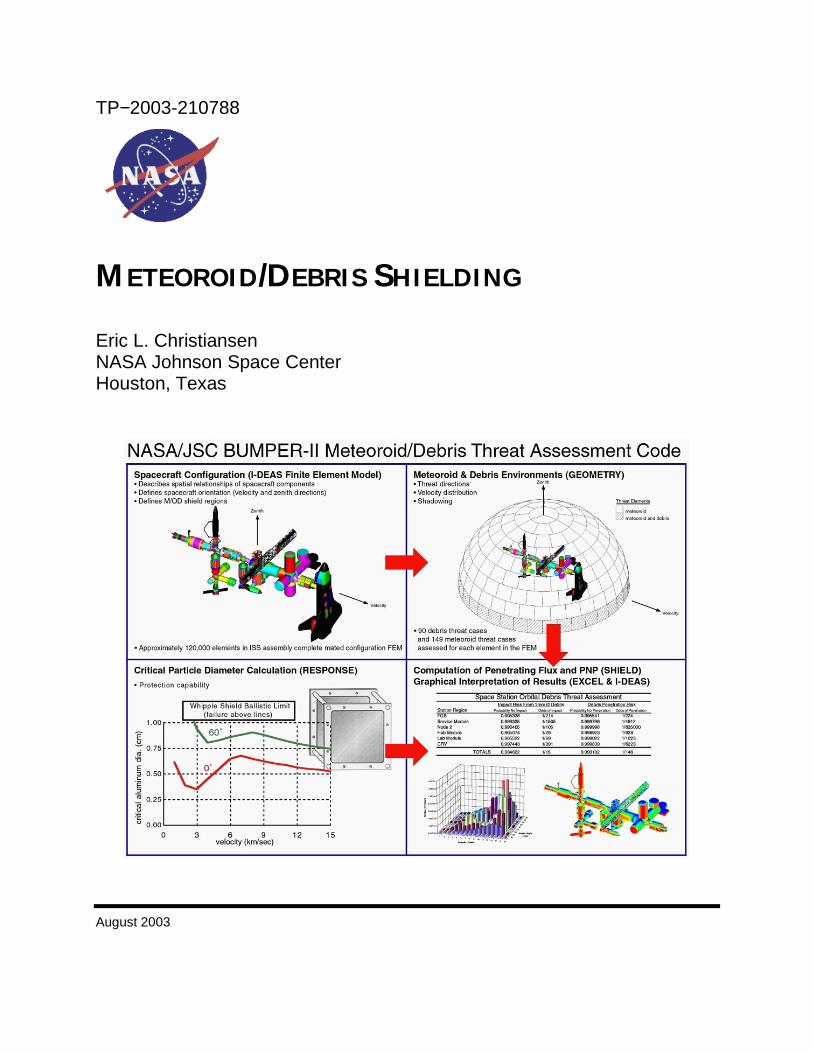
METEOROID/DEBRIS SHIELDING Eric L. Christiansen NASA Johnson Space Center Houston, Texas
August 2003

THE NASA STI PROGRAM OFFICE . . . IN PROFILE
Since its founding, NASA has been dedicated to the advancement of aeronautics and space science. The NASA Scientific and Technical Information (STI) Program Office plays a key part in helping NASA maintain this important role. The NASA STI Program Office is operated by Langley Research Center, the lead center for NASA’s scientific and technical information. The NASA STI Program Office provides access to the NASA STI Database, the largest collection of aeronautical and space science STI in the world. The Program Office is also NASA’s institutional mechanism for disseminating the results of its research and development activities. These results are published by NASA in the NASA STI Report Series, which includes the following report types: • TECHNICAL PUBLICATION. Reports of
completed research or a major significant phase of research that present the results of NASA programs and include extensive data or theoretical analysis. Includes compilations of significant scientific and technical data and information deemed to be of continuing reference value. NASA’s counterpart of peer-reviewed formal professional papers but has less stringent limitations on manuscript length and extent of graphic presentations.
• TECHNICAL MEMORANDUM. Scientific and technical findings that are preliminary or of specialized interest, e.g., quick release reports, working papers, and bibliographies that contain minimal annotation. Does not contain extensive analysis.
• CONTRACTOR REPORT. Scientific and technical findings by NASA-sponsored contractors and grantees.
• CONFERENCE PUBLICATION. Collected papers from scientific and technical conferences, symposia, seminars, or other meetings sponsored or cosponsored by NASA.
• SPECIAL PUBLICATION. Scientific, technical, or historical information from NASA programs, projects, and mission, often concerned with subjects having substantial public interest.
• TECHNICAL TRANSLATION. English-language translations of foreign scientific and technical material pertinent to NASA’s mission.
Specialized services that complement the STI Program Office’s diverse offerings include creating custom thesauri, building customized databases, organizing and publishing research results . . . even providing videos. For more information about the NASA STI Program Office, see the following: • Access the NASA STI Program Home
Page at http://www.sti.nasa.gov • E-mail your question via the Internet to
[email protected] • Fax your question to the NASA Access
Help Desk at (301) 621-0134 • Telephone the NASA Access Help Desk
at (301) 621-0390 • Write to:
NASA Access Help Desk NASA Center for AeroSpace Information 7121 Standard Hanover, MD 21076-1320

TP−2003-210788
METEOROID/DEBRIS SHIELDING Eric L. Christiansen NASA Johnson Space Center Houston, Texas
National Aeronautics and Space Administration Lyndon B. Johnson Space Center Houston, Texas
August 2003

ii
ACKNOWLEDGMENTS This work was greatly enhanced by the advice and assistance provided by NASA Johnson Space Center personnel, particularly Jeanne Crews, Kornel Nagy, Justin Kerr, and Burt Cour-Palais. The work was supported by International Space Station Program Office, Orbiter Vehicle Engineering Project Office, and by the NASA Safety and Mission Assurance Office at NASA HQ. Documentation of Shuttle damage due to meteoroid/debris impact was supported by the Orbital Debris Program Office. CONTOUR shielding development was supported by NASA HQ, John Hopkins Applied Physics Laboratory, and the Goddard Space Flight Center. A well deserved thanks goes to the Lockheed-Houston and GB-Tech personnel at the NASA Johnson Space Center Hypervelocity Impact Technology Facility for their dedicated service, including Dana Lear, Tom Prior, Frankel Lyons, Freeman Bertrand, Jay Laughman, Ron Bernhard, Jim Hyde, Alan Davis, Bill Davidson, and Bobbie Simpson. Also assisting this work were the NASA and contractor personnel at the NASA White Sands Test Facility Hypervelocity Test Laboratory including Mike Kirsch, Don Henderson, Tony Carden, Ed Denzler, Grant Dyer, and Gary Peyton. In addition, my appreciation for the helpful advice from Prof. Dr. Eduard Igenbergs of the Technical University of Munich and Dr. Eric Fahrenthold of The University of Texas at Austin.
Available from:
NASA Center for AeroSpace Information National Technical Information Service 7121 Standard 5285 Port Royal Road Hanover, MD 21076-1320 Springfield, VA 22161
This report is also available in electronic form at http://techreports.larc.nasa.gov/cgi-bin/NTR
iii
CONTENTS PAGE Section 1 Introduction........................................................................................................................................................ 1
1.1 Meteoroid and Debris Environments............................................................................................................ 3
1.2 Meteoroid and Debris Impacts on Shuttle .................................................................................................... 5
1.3 Shuttle Operational and Design Changes to Improve M/D Protection ......................................................... 9
Section 2 Meteoroid/Debris Risk Assessment and Improving Spacecraft Survivability .................................................... 12
2.1 Definition of Spacecraft Geometry ............................................................................................................... 13
2.2 Spacecraft Failure Criteria ........................................................................................................................... 14
2.3 Hypervelocity Impact Tests .......................................................................................................................... 15
2.4 Ballistic Limit Equations ............................................................................................................................... 16
2.5 Spacecraft M/D Environment ....................................................................................................................... 16
2.6 Bumper Code ............................................................................................................................................... 17
2.7 Probability of No Penetration ....................................................................................................................... 17
2.8 Design Requirements................................................................................................................................... 17
2.9 Analysis Iteration and Shield Qualification ................................................................................................... 19
2.10 Shielding Practices....................................................................................................................................... 19
2.11 Objective 1 ................................................................................................................................................... 20
Section 3 Shielding Development and Material Selection .................................................................................................. 21
3.1 Development of Whipple Shield Ballistic Limit Equations ............................................................................ 21
3.2 Enhanced Shielding Material Selection........................................................................................................ 26
3.3 Enhanced Shield Development .................................................................................................................... 36
Section 4 Ballistic Limit Equations for Spacecraft Meteoroid/Debris Shielding ................................................................. 42
4.1 Ballistic Limit Equation Formulation ............................................................................................................. 42
4.2 Whipple Shield Ballistic Limit Equations....................................................................................................... 45
4.3 Nextel/Kevlar Stuffed Whipple Ballistic Limit Equations............................................................................... 49
4.4 Multi-Shock Shield Ballistic Limit Equations................................................................................................. 52
4.5 Adjustments to Shielding and Changes to Equations .................................................................................. 56
Section 5 Shielding Applications ........................................................................................................................................ 57
5.1 Whipple Shield Applications for ISS............................................................................................................. 57
5.2 Nextel/Kevlar Enhanced Whipple Applications on ISS ................................................................................ 61
5.3 Nextel/Kevlar Toughened Thermal Blankets................................................................................................ 62
5.4 Flexible Multi-Shock Shield Applications...................................................................................................... 66
Section 6 Summary ............................................................................................................................................................ 72
Section 7 Forward Work ..................................................................................................................................................... 74
REFERENCES .................................................................................................................................................................... 77
Appendix A Procedure for Estimating Particle Size Causing Shuttle Damage................................................................... 81
Appendix B Description of Shield Materials Evaluation Analytical Model........................................................................... 88
Appendix C Hypervelocity Impact (HVI) Database for Whipple Shields............................................................................. 94
iv
CONTENTS (CONTINUED) PAGE FIGURES Fig. 1-1. Report organization .............................................................................................................................................. 2
Fig. 1-2. Meteoroid and debris cumulative flux................................................................................................................... 4
Fig. 1-3. Debris velocity distribution.................................................................................................................................... 5
Fig. 1-4. Orbiter surfaces inspected for meteoroid/debris impact damage......................................................................... 6
Fig. 1-5. Location of radiator external line impact............................................................................................................... 7
Fig. 1-6. Hole in beta-cloth sleeve over radiator line .......................................................................................................... 8
Fig. 1-7. Crater on external radiator aluminum line found after STS-86.............................................................................. 8
Fig. 1-8. Crater profile in external line ................................................................................................................................ 8
Fig. 1-9. Attitude dependence on radiator leak risk due to M/D impact.............................................................................. 9
Fig. 1-10. Cross-section of reinforced carbon-carbon (RCC) used in Orbiter’s wing leading edge.................................... 10
Fig. 1-11. Orbiter wing leading edge internal configuration ................................................................................................ 10
Fig. 1-12. Radiator doubler modification............................................................................................................................. 11
Fig. 2-1. Meteoroid/debris risk assessment methodology .................................................................................................. 12
Fig. 2-2. BUMPER geometry finite element model of the International Space Station, excluding solar arrays.................. 13
Fig. 2-3. Probability of impact from debris .......................................................................................................................... 14
Fig. 2-4. NASA Johnson Space Center White Sands Test Facility two-stage light-gas gun .............................................. 15
Fig. 2-5. Southwest Research Institute’s inhibited shaped charge launcher ....................................................................... 16
Fig. 3-1. Whipple shield ...................................................................................................................................................... 22
Fig. 3-2. Modified Cour-Palais “K” factor ............................................................................................................................ 23
Fig. 3-3. Shielding concepts comparison............................................................................................................................ 26
Fig. 3-4. Initial shock pressures generated by impacts from aluminum projectiles at 7 km/s on various target materials . 29
Fig. 3-5. Shield materials screening test setup................................................................................................................... 33
Fig. 3-6. Bumper material screening results from hypervelocity impact tests .................................................................... 33
Fig. 3-7a. FRONT VIEW: Response of baseline aluminum shield to a 3.2-mm-diameter aluminum projectile, 6.8 km/s, normal impact .......................................................................................................................................... 35
Fig. 3-7b. BACK: Response of baseline aluminum shield to a 3.2-mm-diameter aluminum projectile, 6.8 km/s, normal impact .......................................................................................................................................... 35
Fig. 3-8. FRONT VIEW: Mesh double-bumper shield results after impact by 3.2-mm-diameter aluminum sphere at 6.8 km/s, normal impact .......................................................................................................................................... 35
Fig. 3-9. Mesh double-bumper shield ................................................................................................................................. 36
Fig. 3-10. Multi-shock shield concept ................................................................................................................................. 38
Fig. 3-11. Stuffed Whipple shield cross-sectional diagram................................................................................................. 39
Fig. 3-12. Comparison of equivalent mass stuffed Whipple and Whipple .......................................................................... 40
Fig. 3-13. Nextel/Kevlar stuffed Whipple shield ballistic limits compared to equivalent mass 3-wall all-aluminum shield... 41
Fig. 4-1. Meteoroid/debris shield types................................................................................................................................ 42
Fig. 4-2. Typical rear wall failure modes after Cour-Palais and Dahl .................................................................................. 43
Fig. 4-3. Ballistic limits for equal mass monolithic target and Whipple shield...................................................................... 44
v
CONTENTS (CONTINUED) PAGE FIGURES Fig. 4-4. Bumper and rear wall thickness required to prevent perforation and detached spall from rear wall for a 100-m2
spacecraft with a PNP=0.99 for 10 years in 400-km-altitude orbit .......................................................................... 47
Fig. 4-5. Ballistic limits for a Whipple shield with a 0.127-cm Al6061T6 bumper, 10.7-cm standoff, 0.32-cm Al 2219T87 rear wall ................................................................................................................................. 47
Fig. 4-6. Predicted ballistic limits for Whipple Shield with and without MLI ......................................................................... 48
Fig. 4-7. Predictions from Eqn. 4-10 through 4-15 for 200 different Whipple shield HVI tests ............................................ 49
Fig. 4-8. Stuffed Whipple ballistic limit................................................................................................................................ 52
Fig. 4-9. Multi-shock shield configurations ......................................................................................................................... 54
Fig. 4-10. Multi-shock shield ballistic limit curves ................................................................................................................ 55
Fig. 4-11. Equal weight Whipple and multi-shock shield ballistic limits, for 1.9 g/cm2 shield mass per unit area, 22 cm overall standoff, 0 deg impacts..................................................................................................................... 55
Fig. 5-1. ISS after assembly Flight 5A (solar arrays removed for clarity) ............................................................................ 57
Fig. 5-2. U.S. Laboratory module shield locations.............................................................................................................. 58
Fig. 5-3. Russian Service Module shield locations ............................................................................................................. 58
Fig. 5-4. U.S. Lab cylinder Whipple ballistic limits @ 0 deg impact angle .......................................................................... 60
Fig. 5-5. U.S. Lab cylinder Whipple ballistic limits @ 45 deg impact angle ......................................................................... 60
Fig. 5-6. U.S. Lab cylinder (S=10.7 cm) and endcone (S=22 m) ballistic limits................................................................... 61
Fig. 5-7. Service Module Zone 6 Whipple shield ballistic limits at 45 deg and 60 deg impact angles................................ 61
Fig. 5-8. Nextel/Kevlar enhanced Whipple shield configurations on ISS............................................................................. 62
Fig. 5-9. ISS Nextel/Kevlar stuffed Whipple shield ballistic limits ....................................................................................... 62
Fig. 5-10. Soyuz finite element model used in BUMPER calculations ............................................................................... 63
Fig. 5-11. Breakdown of Soyuz meteoroid/debris penetration risks from BUMPER assessment, before and after proposed modification using a toughened thermal blanket in the Orbital Module region........................................ 63
Fig. 5-12. Ballistic limits for MLI over aluminum ................................................................................................................. 65
Fig. 5-13. Ballistic limits for Nextel/Kevlar enhanced MLI over aluminum ......................................................................... 65
Fig. 5-14. Comparison of MLI options ................................................................................................................................ 66
Fig. 5-15. CONTOUR multi-shock shield............................................................................................................................ 67
Fig. 5-16. Ballistic limits for CONTOUR MS shield............................................................................................................. 67
Fig. 5-17. Flexible multi-shock shield for an inflatable module ........................................................................................... 69
Fig. 5-18. Results of HVI test on full-size flexible multi-shock shield for TransHab............................................................ 70
Fig. 5-19. 1/5th-scale flexible MS test article for TransHab................................................................................................ 71
Figure A-1. STS-50 predicted orbital debris velocity distribution for diameters of 0.2 mm and greater based on ORDEM96 ............................................................................................................................................... 86
Figure A-2. Cumulative debris velocity distribution predicted for STS-50 with mean velocity (8 km/s) and 1-sigma velocity interval indicated........................................................................................................................... 86
Figure A-3. Particle diameter estimate causing STS-50 window #4 impact damage assuming 45 deg impact by a titanium orbital debris particle.......................................................................................................................... 87
Figure B-1. Bumper performance from analytical model, aluminum 2024T3 projectile impacting Al 6061T6 bumper....... 92
Figure B-2. Hugoniot parameters for materials evaluated in analytical model ................................................................... 93

vi
CONTENTS (CONTINUED) PAGE TABLES Table 1-1. Top 20 Hits ........................................................................................................................................................ 6
Table 2-1. Damage Modes and Failure Criteria for Space Station Elements..................................................................... 14
Table 2-2. Historical Meteoroid/Debris Shielding Requirements ........................................................................................ 18
Table 3-1. Hypervelocity Impact Data Range..................................................................................................................... 23
Table 3-2. Comparison of Whipple Shield Sizing Equations .............................................................................................. 25
Table 3-3. Shield Development Steps ................................................................................................................................ 27
Table 3-4. Results of Analytical Model to Evaluate Bumper Materials ............................................................................... 29
Table 3-5. Bumper Material Figure of Merit........................................................................................................................ 30
Table 3-6. Bumper Material Properties for Figure of Merit Analysis................................................................................... 31
Table 3-7. Rear Wall Material’s Ability to Absorb Mechanical Energy of Impact................................................................ 32
Table 3-8. Secondary Ejecta Characteristics for Various Bumper Materials...................................................................... 36
Table 3-9. Whipple, Multi-Shock and Mesh Double-Bumper Impact Data ......................................................................... 39
Table 4-1. Summary of CALE Hydrocode Calculations of Projectile Solid/Liquid Fraction in the Debris Cloud................. 45
Table 4-2. Stuffed Whipple and All-Aluminum Shield Impact Data .................................................................................... 51
Table 5-1. BLE Coefficients and Variables for ISS Whipple Shields ................................................................................... 59
Table 5-2. Coefficients for Soyuz Baseline and Enhanced Thermal Blanket ..................................................................... 65
Table 5-3. PNP for Soyuz Protection Options .................................................................................................................... 65
Table 5-4. Predicted Ballistic Limit Particle Size and Shield Layer Damage....................................................................... 68
Table 5-5. Comparison of HVI Test Results for Full-Scale and 1/5th-Scale Multi-Shock Shields ...................................... 69
Table 5-6. Multi-Shock Test Results to Optimize MS Shield Parameters .......................................................................... 71
Table A-1. Flight Parameters for Missions With M/D Survey ............................................................................................. 82
Table A-2. Average Impact Parameters ............................................................................................................................. 83
Table A-3. Estimated Size of Projectiles Causing Significant Window Damage ................................................................ 84

vii
TERMS AND ABBREVIATIONS Al aluminum
ARC NASA Ames Research Center
areal density mass per unit area
BLE ballistic limit equation
BUMPER BUMPER code is used to perform meteoroid/debris risk assessments
bumper outer-most layer in a shield
CONTOUR Comet Nucleus Tour mission
DEA Deployed Electronics Assembly of Shuttle Ku-Band Antenna
debris orbital debris or space debris (manmade material in Earth orbit)
design BLE Equations used to size shield elements for design purposes. The equations relate thickness and/or areal density of bumpers and rear wall to various impact parameters (impact velocity, particle size) and shield variables (such as standoff).
DN damage number (index for comparing rear wall and witness plate damage)
EC end cone of module
ESA European Space Agency
Ext external
FEM finite element model
FOM figure of merit
FRSI Flexible Reusable Surface Insulation (coated Nomex felt)
Hab Habitation Module on ISS
HVI hypervelocity impact
ISCL Inhibited Shaped Charge Launcher
ISS International Space Station
JEM Japanese Experimental Module
JSC NASA Johnson Space Center
K.E. kinetic energy
K_KM2 Kevlar KM2 style CS-705 fabric. Kevlar is a registered trademark of E.I. DuPont de Nemours Co., Inc. CS-705 is a Kevlar fabric manufactured by Clark-Schwebel, Anderson, South Carolina, with an areal density of 0.023 g/cm2.
K_120 Kevlar FDI-120 is a fabric manufactured by Fabric Development Inc., Quakertown, Pennsylvania, with an areal density of 0.032 g/cm2.
Lab NASA laboratory module on ISS
LDEF Long-Duration Exposure Facility satellite
LGG light gas-gun hypervelocity impact launcher
LH left-hand (port side)
M/D meteoroid/debris
MDB mesh double-bumper shield
MLI multilayer insulation thermal blanket
M/OD meteoroid/orbital debris
viii
MS multi-shock shield
MSFC NASA Marshall Space Flight Center
N_AF10 NextelTM type AF10 fabric (areal density 0.027 g/cm2). Nextel is a ceramic fabric and registered trademark of 3M Corporation.
N_AF62 NextelTM type AF62 fabric (areal density 0.1 g/cm2).
NASA National Aeronautics and Space Administration
NASDA Japanese Space Agency
Node ISS Node modules. Node 1 (Unity) was launched on Flight 2A in December 1998. Node 2 will be launched on Flight 10A.
ORDEM Orbital Debris Engineering Model
Pnl panel
PNP probability of no penetration
POI probability of impact
RCC reinforced carbon-carbon
Rear wall last layer of a shield
RH right-hand (starboard side)
R&R repair and replacement
RTV room temperature vulcanized rubber
SEM/EDX scanning electron microscope and energy dispersive X-ray analysis
Shield all layers providing meteoroid/debris protection (i.e., including all bumpers and rearwall)
SM Service Module (Zvezda)
STS Space Transportation System
SW Stuffed Whipple Shield
Ti titanium
TransHab an inflatable module concept proposed by NASA for ISS and Mars missions (Transportation Module)
TUM Technical University of Munich
UDRI University of Dayton Research Institute
Witness plates plate(s) added to HVI test article to record damage from penetration of rear wall (witness plates added behind target), or damage from secondary ejecta (witness plates added in front of target)
WS Whipple Shield
WSTF NASA White Sands Test Facility
ix
NOTATIONS C speed of sound in target (km/s)
d projectile diameter (cm)
dc critical projectile diameter causing shield failure (cm)
E elastic modulus in tension (MPa)
ρ density (g/cm3)
H Brinell hardness of target (BHN)
m areal density (g/cm2)
M projectile mass (g)
P penetration depth (cm)
S overall spacing between outer bumper and rear wall (cm)
σ rear wall yield stress (ksi) (Note: 1ksi = 1,000 lbf/in2 = 6.895 MPa)
σ’ normalized rear wall yield stress (unitless)
t thickness (cm)
θ impact angle measured from normal to surface (deg)
V projectile velocity (km/s)
Vn normal component of impact velocity (km/s)
Subscripts:
b all bumpers
p projectile
t target
w rear wall
1..3 individual bumpers, layers or spacings


1
Whipple shield
Shuttle Orbiter Vehicle Finite Element Model used in BUMPER code
SECTION 1
INTRODUCTION This report provides innovative, low-weight shielding solutions for spacecraft and the ballistic limit
equations (BLEs) that define the shield’s performance in the meteoroid/debris (M/D) environment. I describe analyses and hypervelocity impact (HVI) testing results that have been used to develop the shields and equations. Spacecraft shielding design and operational practices described in this report are used to provide effective spacecraft protection from meteoroid and debris impacts [1-4]. Specific M/D shielding applications for the International Space Station (ISS), Space Shuttle Orbiter, and the CONTOUR (Comet Nucleus Tour) space probe are provided. Whipple, multi-shock and stuffed Whipple shields provide the M/D protection.
Figure 1-1 describes the organization of this report. In this section, I provide a description of the meteoroid and debris environments and implications for spacecraft, using the Space Shuttle Orbiter vehicles as an example. Design practices to provide effective spacecraft protection from M/D impacts have evolved over the history of spaceflight. Design and operational changes in the Space Shuttle have been incorporated to reduce M/D risks. They became necessary as the orbital debris environment was first recognized as a potential threat only after Shuttle operations began. We derive Shuttle improvements from implementing the risk assessment and reduction methodology detailed in Section 2. The major aspects of current M/D protection practice include: (1) a methodology to assess risks and verify protection requirements, (2) development of BLEs based on HVI test results, (3) implementation of low-weight shielding and other design techniques to reduce risks, and (4) use of validated software tools to assess M/D risks (i.e., BUMPER code). Section 3 covers previous work in developing low-weight shielding solutions to defend from M/D impact. BLEs for conventional and enhanced shielding options are given in Section 4. Applications of the shielding and resolutions to issues arising during shielding implementation will be discussed in Section 5.
The primary purpose of this report is to document the methods and techniques used to improve the M/D protection of space vehicles and their crews. The report shows that existing spacecraft can be retrofitted to improve survivability (such as the Shuttle) or designed from the beginning to withstand the debris environment such as ISS. I hope that this document will assist engineers improve spacecraft M/D protection now and in the future.
bumper rear wall

2
Fig. 1-1. Report organization.
1. Introduction • Meteoroid/Debris Environment • Space Shuttle M/D Impacts, Design and Operations to Reduce M/D
2. Process for Meteoroid/Debris Risk Assessment and Spacecraft Survivability Improvement
• Risk Assessment Process • Probability of No Penetration • Design Requirements • Techniques to Improve Spacecraft Survivability
3. Shielding Development and Material Selection • Whipple Shield • Shield Development Plan • Analytical Evaluations of Shielding Materials: Bumpers and Rear Walls • Secondary Ejecta • Enhanced Shields: Mesh Double-Bumper, Multi-Shock, Stuffed Whipple
4. Ballistic Limit Equations for Spacecraft Shielding • Whipple Shield • Multi-Shock Shield • Stuffed Whipple Shield
5. Shielding Applications • International Space Station (ISS) • Toughened Thermal Blankets (Soyuz) • Nextel-Kevlar Multi-Shock Shield for Comet Probe (CONTOUR) • Deployable Multi-Shock Shield for Inflatable Modules (TransHab)
6. Summary 7. Forward Work
*Objective 1 Develop low-weight and effective shielding
methods for protecting spacecraft from meteoroid and debris impact.
*Objective 2 Develop design and performance equations
to allow implementation of conventional and enhanced shielding for spacecraft M/D
protection.
Objective 1*
Objective 2*

3
1.1 Meteoroid and Debris Environments Meteoroids are natural particles in orbit about the Sun. Debris are human-made objects in orbit
about Earth. Both represent a threat to spacecraft survivability and crew safety primarily because of the potentially high-impact speeds and energy involved in collisions between spacecraft and meteoroid/debris particles.
Meteoroid and debris impacts are random events, and it is not possible to precisely determine exactly when or where an impact will occur on a spacecraft. However, statistical techniques valid for random events have been applied to predicting meteoroid and debris impact spacecraft probabilities. These methods are explained in Section 2. Generally, meteoroid/debris impacts are more likely the larger the spacecraft and the longer the exposure duration. Impact rates can be modified by spacecraft orientation. Operational procedures can therefore affect a spacecraft’s M/D protection capability by, for instance, maneuvering into spacecraft attitudes to reduce exposure to the threat flux (meteoroid and/or debris).
We determine effects of HVIs by meteoroid and debris particles on spacecraft shielding and/or systems through test and analysis techniques described in more detail later (Sections 2 and 3). The objective of the tests/analyses is to determine the meteoroid and debris particle size that will be on the failure threshold for the particular spacecraft surface that is impacted. This relies on a clear definition of failure, referred to as the “failure criteria.” The results of the test/analysis efforts are “ballistic limit equations” (BLEs) for the spacecraft shielding that define the particle size on the failure threshold as a function of target and impact parameters. This report provides several BLEs useful for defining the protection limits of conventional and advanced spacecraft shields.
Meteoroid and debris environment models provide the cumulative flux of particles (i.e., the number per unit area and time) that exceed a given particle size, the impact velocity distribution of the particles, and their impact direction relative to spacecraft orbital motion. The M/D models show that flux is inversely proportional to particle size. We calculate the probability that the ballistic limits are exceeded (i.e., that failure occurs) for a particular spacecraft surface from the M/D models, the BLEs, and exposure duration/time. Basically, the larger the particle size that can be stopped by a shield, the lower the meteoroid/debris impact rates and the less likely failure can occur.
We then compare the failure probability to requirements for the spacecraft. Shielding design of the spacecraft is iterated to meet requirements while achieving minimum shielding mass and meeting other design constraints (such as allowable volume or shielding “standoff”). This process is automated to a certain extent by use of the BUMPER code, which has relevant BLEs and environment models imbedded within it. We also use BUMPER results to verify spacecraft requirements compliance for the final shielding design [3-4].
Meteoroid Environment Model. The meteoroid environment model to be used for shielding design is defined in the NASA document SSP-30425 [5]. The cumulative flux for particles of the given diameter and larger is plotted versus diameter in Figure 1-2. Meteoroid velocities range from 11 km/s to 72 km/s, with an average for Earth-orbiting spacecraft of 19 km/s. Particle densities range from 2 g/cm3 (for particles 1 micro-gram and less) to 0.5 g/cm3 (particle mass 0.01 g and greater).
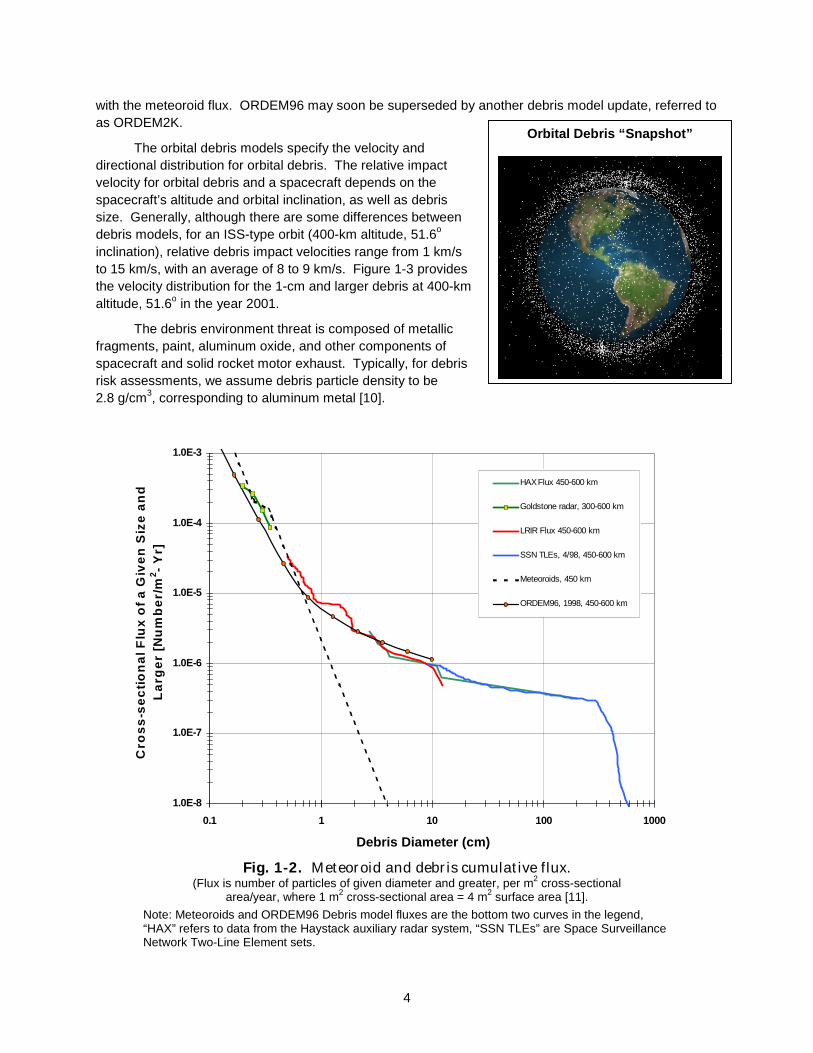
Debris Environment Model. The debris environment model for purposes of shielding design on ISS is given in the Reference [6]. This debris model is referred to as the 1991 debris model, and is more conservative than the 1996 debris model [7]. Space Station shielding performance is assessed against the latest debris model, although because of the uncertainty in future debris environment growth, the ISS Program has specified the older 1991 model be used for shield design [8-9]. The 1996 model is also referred to as ORDEM96 for “Orbital Debris Engineering Model 1996.” The cumulative flux of debris particles from ORDEM96 for an ISS orbit (400-km altitude, 51.6o inclination) is plotted in Figure 1-2 along
4
Orbital Debris “Snapshot”
with the meteoroid flux. ORDEM96 may soon be superseded by another debris model update, referred to as ORDEM2K.
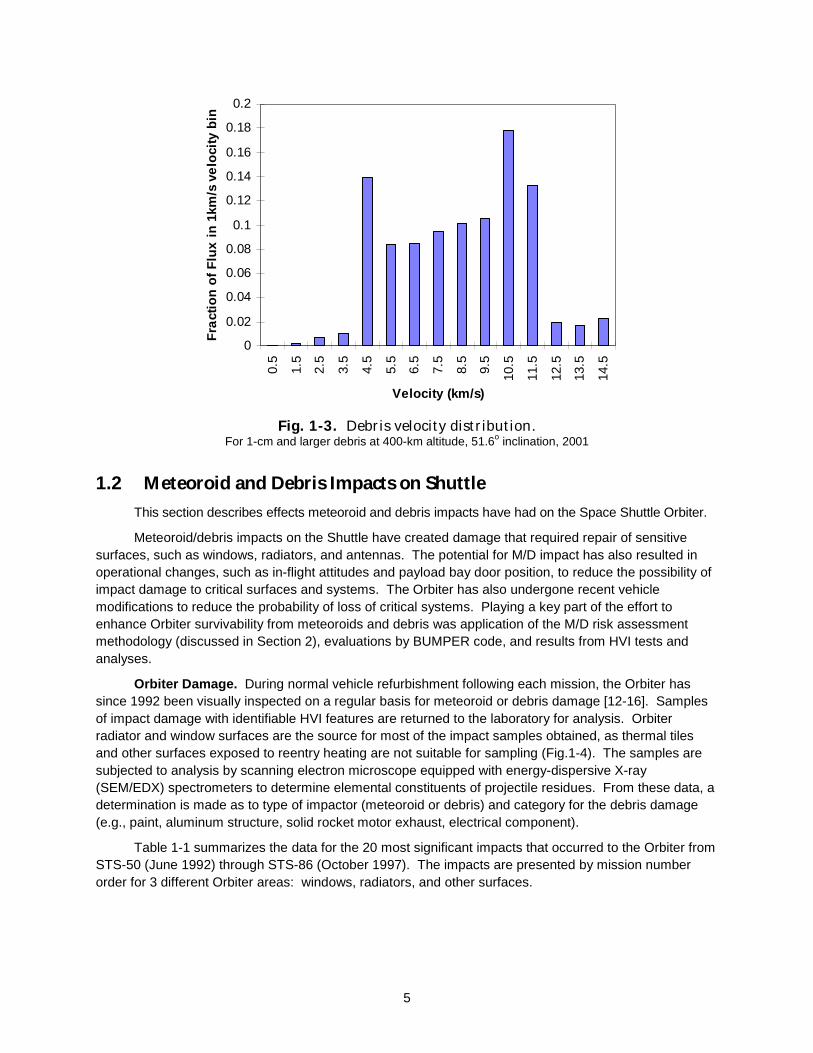
The orbital debris models specify the velocity and directional distribution for orbital debris. The relative impact velocity for orbital debris and a spacecraft depends on the spacecraft’s altitude and orbital inclination, as well as debris size. Generally, although there are some differences between debris models, for an ISS-type orbit (400-km altitude, 51.6o inclination), relative debris impact velocities range from 1 km/s to 15 km/s, with an average of 8 to 9 km/s. Figure 1-3 provides the velocity distribution for the 1-cm and larger debris at 400-km altitude, 51.6o in the year 2001.
The debris environment threat is composed of metallic fragments, paint, aluminum oxide, and other components of spacecraft and solid rocket motor exhaust. Typically, for debris risk assessments, we assume debris particle density to be 2.8 g/cm3, corresponding to aluminum metal [10].
Fig. 1-2. Meteoroid and debris cumulative flux. (Flux is number of particles of given diameter and greater, per m2 cross-sectional
area/year, where 1 m2 cross-sectional area = 4 m2 surface area [11].
Note: Meteoroids and ORDEM96 Debris model fluxes are the bottom two curves in the legend, “HAX” refers to data from the Haystack auxiliary radar system, “SSN TLEs” are Space Surveillance Network Two-Line Element sets.
1.0E-8
1.0E-7
1.0E-6
1.0E-5
1.0E-4
1.0E-3
0.1 1 10 100 1000
Cro
ss
-se
cti
on
al F
lux
of
a G
ive
n S
ize
an
d
La
rge
r [N
um
be
r/m
2-
Yr]
HAX Flux 450-600 km
Goldstone radar, 300-600 km
LRIR Flux 450-600 km
SSN TLEs, 4/98, 450-600 km
Meteoroids, 450 km
ORDEM96, 1998, 450-600 km
Debris Diameter (cm)
5
0
0.02
0.04
0.06
0.08
0.1
0.12
0.14
0.16
0.18
0.2
0.5
1.5
2.5
3.5
4.5
5.5
6.5
7.5
8.5
9.5
10.5
11.5
12.5
13.5
14.5
Velocity (km/s)
Fra
ctio
n o
f F
lux
in
1km
/s v
elo
city
bin
Fig. 1-3. Debris velocity distribution. For 1-cm and larger debris at 400-km altitude, 51.6o inclination, 2001
1.2 Meteoroid and Debris Impacts on Shuttle This section describes effects meteoroid and debris impacts have had on the Space Shuttle Orbiter.
Meteoroid/debris impacts on the Shuttle have created damage that required repair of sensitive surfaces, such as windows, radiators, and antennas. The potential for M/D impact has also resulted in operational changes, such as in-flight attitudes and payload bay door position, to reduce the possibility of impact damage to critical surfaces and systems. The Orbiter has also undergone recent vehicle modifications to reduce the probability of loss of critical systems. Playing a key part of the effort to enhance Orbiter survivability from meteoroids and debris was application of the M/D risk assessment methodology (discussed in Section 2), evaluations by BUMPER code, and results from HVI tests and analyses.
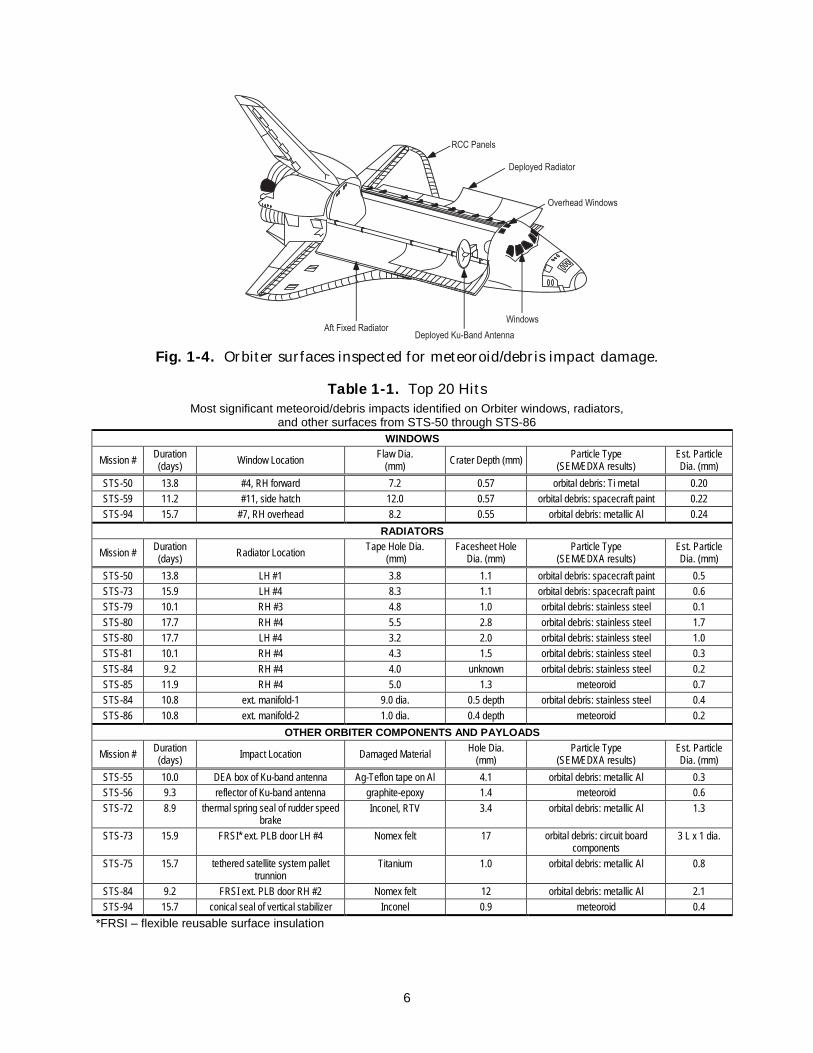
Orbiter Damage. During normal vehicle refurbishment following each mission, the Orbiter has since 1992 been visually inspected on a regular basis for meteoroid or debris damage [12-16]. Samples of impact damage with identifiable HVI features are returned to the laboratory for analysis. Orbiter radiator and window surfaces are the source for most of the impact samples obtained, as thermal tiles and other surfaces exposed to reentry heating are not suitable for sampling (Fig.1-4). The samples are subjected to analysis by scanning electron microscope equipped with energy-dispersive X-ray (SEM/EDX) spectrometers to determine elemental constituents of projectile residues. From these data, a determination is made as to type of impactor (meteoroid or debris) and category for the debris damage (e.g., paint, aluminum structure, solid rocket motor exhaust, electrical component).
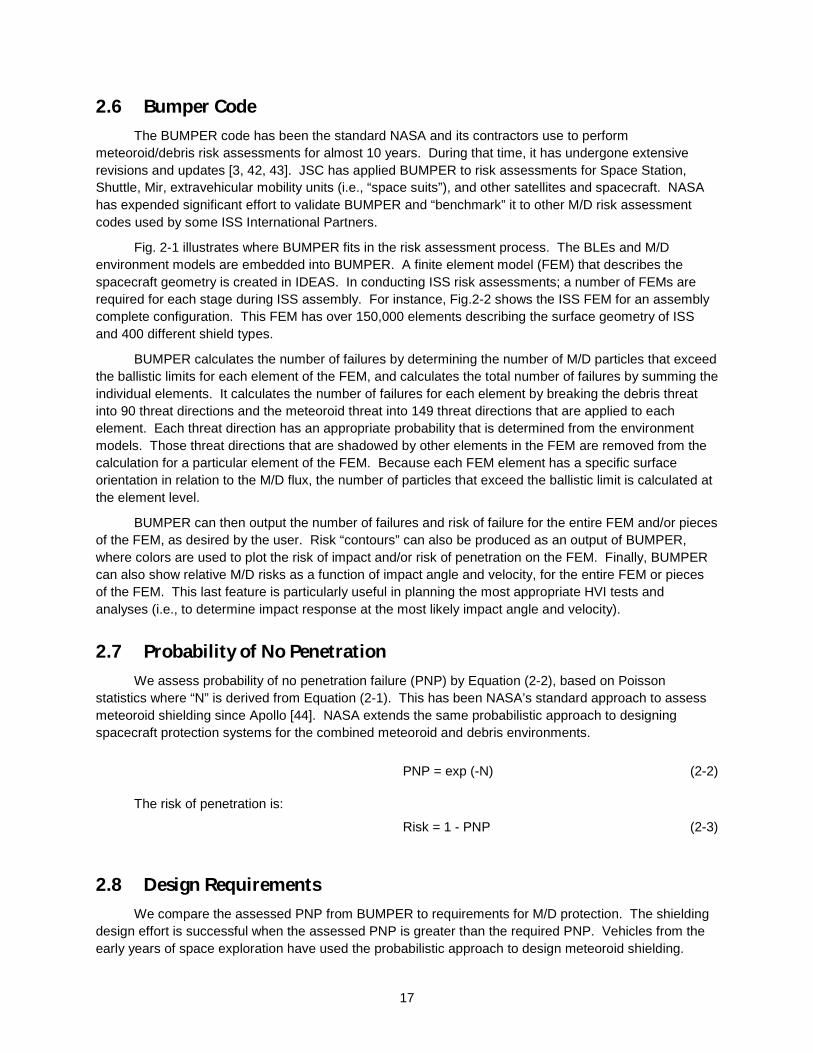
Table 1-1 summarizes the data for the 20 most significant impacts that occurred to the Orbiter from STS-50 (June 1992) through STS-86 (October 1997). The impacts are presented by mission number order for 3 different Orbiter areas: windows, radiators, and other surfaces.
6
RCC Panels
Deployed Radiator
Overhead Windows
Windows
Deployed Ku-Band AntennaAft Fixed Radiator
Fig. 1-4. Orbiter surfaces inspected for meteoroid/debris impact damage.
Table 1-1. Top 20 Hits Most significant meteoroid/debris impacts identified on Orbiter windows, radiators,
and other surfaces from STS-50 through STS-86 WINDOWS
Mission # Duration (days) Window Location
Flaw Dia. (mm) Crater Depth (mm)
Particle Type (SEM/EDXA results)
Est. Particle Dia. (mm)
STS-50 13.8 #4, RH forward 7.2 0.57 orbital debris: Ti metal 0.20
STS-59 11.2 #11, side hatch 12.0 0.57 orbital debris: spacecraft paint 0.22
STS-94 15.7 #7, RH overhead 8.2 0.55 orbital debris: metallic Al 0.24
RADIATORS
Mission # Duration (days) Radiator Location
Tape Hole Dia. (mm)
Facesheet Hole Dia. (mm)
Particle Type (SEM/EDXA results)
Est. Particle Dia. (mm)
STS-50 13.8 LH #1 3.8 1.1 orbital debris: spacecraft paint 0.5
STS-73 15.9 LH #4 8.3 1.1 orbital debris: spacecraft paint 0.6
STS-79 10.1 RH #3 4.8 1.0 orbital debris: stainless steel 0.1
STS-80 17.7 RH #4 5.5 2.8 orbital debris: stainless steel 1.7
STS-80 17.7 LH #4 3.2 2.0 orbital debris: stainless steel 1.0
STS-81 10.1 RH #4 4.3 1.5 orbital debris: stainless steel 0.3
STS-84 9.2 RH #4 4.0 unknown orbital debris: stainless steel 0.2
STS-85 11.9 RH #4 5.0 1.3 meteoroid 0.7
STS-84 10.8 ext. manifold-1 9.0 dia. 0.5 depth orbital debris: stainless steel 0.4
STS-86 10.8 ext. manifold-2 1.0 dia. 0.4 depth meteoroid 0.2
OTHER ORBITER COMPONENTS AND PAYLOADS
Mission # Duration (days) Impact Location Damaged Material
Hole Dia. (mm)
Particle Type (SEM/EDXA results)
Est. Particle Dia. (mm)
STS-55 10.0 DEA box of Ku-band antenna Ag-Teflon tape on Al 4.1 orbital debris: metallic Al 0.3 STS-56 9.3 reflector of Ku-band antenna graphite-epoxy 1.4 meteoroid 0.6
STS-72 8.9 thermal spring seal of rudder speed brake
Inconel, RTV 3.4 orbital debris: metallic Al 1.3
STS-73 15.9 FRSI* ext. PLB door LH #4 Nomex felt 17 orbital debris: circuit board components
3 L x 1 dia.
STS-75 15.7 tethered satellite system pallet trunnion
Titanium 1.0 orbital debris: metallic Al 0.8
STS-84 9.2 FRSI ext. PLB door RH #2 Nomex felt 12 orbital debris: metallic Al 2.1
STS-94 15.7 conical seal of vertical stabilizer Inconel 0.9 meteoroid 0.4
*FRSI – flexible reusable surface insulation

7
Particle Size Estimates. An estimated projectile size for each impact is determined using penetration equations, provided in Appendix A, that have been developed from HVI tests and analyses. SEM/EDX analysis results were used to specify the density of the particle for the penetration equations used to estimate particle size. In addition, the projectile size estimates are based on the average impact velocity conditions for the meteoroid and debris environment. The calculations assume a 45o average impact angle. Potential particle sizes causing the damage can be higher or lower, depending on assumed velocity of impact. A sensitivity analysis on estimated projectile size is also included in Appendix A. The sensitivity analysis indicates that the range of potential projectile sizes for a particular impact (within a 1-sigma velocity range centered on the mean) is influenced more by the low-velocity component than the high end of the velocity range, implying the average particle size causing the damage is biased toward the lower end of the potential size range.
Near Perforation of Radiator Line. Probably the severest impact to the Shuttle fleet, as it represents a “near miss” of a major problem, is the impact found on a radiator line after STS-86 [15]. Postflight inspection of OV-104 (Atlantis) radiator panels after mission STS-86 found a significant M/D impact in the external manifold hard line that extends along the two forward panels (Figure 1-5). The impact penetrated through a beta cloth cover, crossed a 6.4-mm (0.25-inch) gap, and left a 0.8-mm-diameter by 0.47-mm-deep crater in the manifold hard line (Figures 1-6 and 1-7). The aluminum external hard lines are 0.9-mm (0.035-inch) thick in the impacted region. From HVI data, the crater depth to wall thickness ratio of 0.52 indicated spall effects were likely on the inside of the line at the point of impact [17]. A boroscope inspection of the line interior was conducted to assess internal damage and a small area of detached spall was found on the inside of the tube under the impact site (Figure 1-8). This indicates the impact very nearly put a hole in the external manifold that would have caused a leak of Freon coolant, potentially shortening the mission. Mission rules dictate that a leak in one of the Orbiter’s two radiator systems will result in a next primary landing site abort. The Orbiter Project Office determined that an upgrade to the M/D protection of the radiator external lines was prudent. This change and other vehicle changes to reduce M/D risks are discussed in the following section.
Fig. 1-5. Location of radiator external line impact.
Samples obtained for SEM/EDX analysis included the perforated beta cloth thermal cover and tape pull samples from the external line. Analysis found iron, chromium, and nickel on the beta cloth (Teflon-glass background) and in the external line samples, indicating the damage was caused by a stainless steel orbital debris particle (approximately 0.4 mm diameter as indicated in Table 1-1).
.. ..
.. .... .... ..
.. .. .. ..
.. ..
.. ..
.. ..
.. ..
Pnl 1 Pnl 2 Pnl 3 Pnl 4
0.8mm ID x 0.47mm deep crater#1 Radiator External Line impact(panel LH1)
7/8” OD x 0.035” Wall Tube
0.020” ThkManifold Cover
X
Note : All External Lines Are Covered With Beta ClothHard lines are Al 5083-H32, 7/8” OD x 0.035” wall
.. .... ....
.. .... ...... .... ...... .... ....
.. .. .. .... .... .... .. .... ....
.. .... ....
.. .... ....
.. .... ....
.. .... ....
Pnl 1 Pnl 2 Pnl 3 Pnl 4
0.8mm ID x 0.47mm deep crater#1 Radiator External Line impact(panel LH1)
7/8” OD x 0.035” Wall Tube
0.020” ThkManifold Cover0.020” ThkManifold Cover
X
Note : All External Lines Are Covered With Beta ClothHard lines are Al 5083-H32, 7/8” OD x 0.035” wall

8
Fig. 1-6. Hole in beta-cloth sleeve over radiator line.
SEM analysis indicated the impact was due to a steel impactor.
Fig. 1-7. Crater on external radiator aluminum line found after STS-86.
Crater depth was over halfway through the tube.
Fig. 1-8. Crater profile in external line. Detached spall found on inside of line in boroscope inspection. Small metal pieces were found in a coolant pump
strainer postflight.
1.01 mm
0.96 mm
0.8 mm Dia.
0.47 mm Deept = 0.9mm
Detached Spall
Coolant Side

9
1.3 Shuttle Operational and Design Changes to Improve M/D Protection Changes in Shuttle mission operations, flight rules, and flight planning have been adopted to
reduce meteoroid and debris risks. In addition, NASA has implemented design modifications to improve M/D protection of the Orbiter vehicle. These improvements relied on quantification of M/D risks to the Orbiter, which was then used as a metric for assessing and deciding what design and operational changes made the most sense to implement. M/D impact risks to the Orbiter are assessed beginning one year before each flight. Three types of M/D risk assessments are conducted:
1. Critical impact risks, where “critical” is defined as damage that could endanger the crew during on-orbit or reentry/landing phases of the mission.
2. Early mission abort risks from a penetration that causes a leak in either of the two radiator systems.
3. Window replacement risks from impacts that exceed each windowpane’s repair/replacement criteria.
NASA performs Shuttle mission risk calculations using BUMPER code (explained in Section 2), based on the mission attitude time line. M/D risks are attitude-dependent, as shown in Figure 1-9 for radiator leak risks. The best overall attitude for minimizing Orbiter risks (critical, radiator, and window) is payload bay toward Earth, with tail forward into the velocity vector. Shuttle flight rules and mission planning rules dictate that Orbiter attitude be adjusted to meet program requirements for minimizing M/D impact risks [18].
0.02%0.05% 0.05%
0.07% 0.07%0.09%
0.18% 0.18% 0.18% 0.18%
0.23%
0.29% 0.29%
0.50%
0.61% 0.61%
0.22%
0.00%
0.10%
0.20%
0.30%
0.40%
0.50%
0.60%
0.70%
% R
isk
of
Pen
etra
tio
n
space
directionof motion
Space Shuttle Orientation
Average
Fig. 1-9. Attitude dependence on radiator leak risk due to M/D impact. (10-day duration, year 2000, altitude 500 km, inclination 51.6o)

10
Shuttle Design Modifications to Reduce M/D Risks. The BUMPER risk assessments allowed the Shuttle Program to determine the areas of the Orbiter that were the “weak links” from meteoroid debris and effectively expend resources to reduce M/D by selective modifications [19-20].
For instance, critical impact risks were driven in large measure by impact penetrations of the reinforced carbon-carbon (RCC) leading edge of the wings. The RCC in this area of the vehicle is 6 mm (Fig. 1-10) and relatively easily penetrated by small hypervelocity projectiles. Penetrations of RCC become an issue during reentry, when hot atmospheric gases enter the RCC cavity, burning the carbon substrate that leads to expansion of the RCC hole, and heats the internal structural supports to unacceptable levels. Loss of RCC panel structural support could lead to loss of vehicle control during reentry (if part of a panel loosens and interferes with smooth airflow over the wing). Analysis indicated it was not feasible to modify the RCC panels without undue expense or significant additional mass. Therefore, NASA decided to add ceramic cloth (i.e., Nextel) to the existing wing internal insulator (Fig. 1-11), so that larger impacts could be tolerated without loss of integrity in the structural supports for the RCC panels. Critical impact risks for the wing leading edge have decreased by a factor of 3 with the modifications.
Fig. 1-10. Cross-section of reinforced carbon-carbon (RCC) used in
Orbiter’s wing leading edge. RCC typical overall thickness is 6.3 mm, consisting of 4.3-mm- to 5.3-mm-thick all-carbon substrate
(with a density of 1.44 g/cm3 to 1.6 g/cm3) that has been coated on either side with a dense 0.5-mm- to 1.0-mm-thick silicon-carbide layer formed in a diffusion reaction process. [21, 22].
Fig. 1-11. Orbiter wing leading edge internal configuration. Nextel fabric added to the Cerachrome insulation at the four locations where
each RCC panel mounts to the wing leading edge spar structure.
Silicon-carbide coating
Silicon-carbide coating
Carbon-carbon composite
Nextel 440 fabric (3200 oF) between the Inconel foil face sheet & the Cerachromebatting insulation
WING LEADING EDGE
RCC PANELS22 LH22 RH
RCC T-SEAL STRIP 22 LH22 RH
Panels 5 -13
Wing LE Spar
INCONEL 601Cerachrome
Insulation
Tiles
INCONEL 718
A-286
OV-102 Configuration
RCC
ViewCutaway looking outboard
EarmuffCerachrome Inconel 601
Fwd.
Aft.

11
Early mission abort risk due to M/D-induced radiator leak was decreased by a factor of 5 by adding “doublers” to the existing radiator loops in each of 8 panels (Fig. 1-12). Also, the external radiator connection lines (hard and flexible) were “toughened” by an additional beta-cloth cover sleeve that was sewn (with a standoff) into the existing thermal sleeve on the external manifolds.
Al Doubler(0.02” H x 0.4” W)
0.005” Silver-Teflon Type VI Tape
F21 Tube
FWD Radiator (Typ.)34 0.187” OD Tubes/Panel/Side15.1 ft x 10.5 ft/Panel4 Panels/Vehicle
0.011” Facesheet3/16” Cell 3.1 Pcf Al Core
0.9”
0.5”
1.9”
AFT Radiator (Typ.)26 0.236” OD Tubes/ Panel15.1 ft x 10.5 ft/ Panel4 Panels/Vehicle
0.005” Silver-Teflon Type IV Tape
0.020” WallF21 Tube
BEFORE MOD AFTER MOD
0.011 “ Facesheet
Fig. 1-12. Radiator doubler modification.

12
SECTION 2
METEOROID/DEBRIS RISK ASSESSMENT AND IMPROVING SPACECRAFT SURVIVABILITY
The M/D analyst’s job is to determine the probability of spacecraft damage or failure due to meteoroid and debris impact. Once this is done, another important task is to solve the problem of improving the spacecraft’s survivability from meteoroid/debris impact.
Meteoroid/debris risk assessments are essentially a spacecraft systems engineering function. Because spacecraft are often extremely complex, the M/D analyst must thoroughly know the spacecraft in terms of systems operations, failure modes and effects, subsystem design details, materials of construction, and operational parameters. In addition, the M/D analyst must select and develop shielding to improve spacecraft survivability. This requires an understanding of HVI physics, statistics, experimental design, and analysis.
The meteoroid/debris shielding task can be restated as:
1. Determine what to fix…not everything is broken.
2. Find the best ways to fix the problem; that is, pick the most capable protection solution that fits within spacecraft and program constraints for weight, cost, schedule, risk.
3. Communicate results effectively in order to have the best solutions implemented.
Risk Assessment Methodology. Fundamental tools in developing spacecraft M/D shielding are
encompassed by the Meteoroid/Debris Risk Assessment Methodology given in Figure 2-1 [9].
By using this methodology, the analyst will be able to accurately evaluate spacecraft risks from M/D impact, identify zones or areas of the spacecraft that are the “risk drivers” that control the M/D risk, and evaluate options to reduce risk. Each major step in the risk assessment process is described in the following sections.
Probability ofNo Failure
Environment Models- Debris & Meteoroid
SpacecraftGeometry
Ballistic LimitEquations
M/D Probability Analysis Code
Failure Criteria
HVI Test &Analysis
Meet Requirements?
QualifyYes
IterateNo
S/C Operating
Parameters
ProtectionRequirement
P
R
P > R
P < R
BUMPER
Fig. 2-1. Meteoroid/debris risk assessment methodology.

13
LDEF
2.1 Definition of Spacecraft Geometry Spacecraft geometry, including its overall size and shape, is defined in the first step. Spacecraft
size is directly proportional to the number of impacts as given in Equation 2-1 [23]. Risk of M/D impact failure increases as the area and time exposed to the M/D flux increases by the following.
n n
N = ∑ Ni = ∑ (F A t)i (2-1) i=1 i=1
where N is the number of impacts causing failure and is equal to the sum of the impact failures in each region (Ni) over all regions (i = 1 to n) of the geometry model. Ni is found from the product of flux (F, number/m2-year) of meteoroid and debris impacts that exceed the failure ballistic limits of a region, exposed area (A, m2) and time (t, year).
Impact Directionality. Spacecraft shape can reduce the exposure of certain areas of the spacecraft to M/D due to shadowing. The front and sides of a spacecraft are more exposed to debris impact, while the front, sides, and top (zenith) are more exposed to meteoroid impact. Consider for instance that the Long-Duration Exposure Facility (LDEF) had 20 times more craters observed on the forward face compared to the aft, and 200 times more craters on the forward than the Earth-facing side [24]. In addition, the geometry model is broken down into different regions, each with similar materials of construction, configurations, and thickness. Figure 2-2 illustrates a geometry model of ISS after Flight 20A used in M/D risk assessments. There are over 400 different regions in this model representing different shield configurations protecting ISS habitable modules and external critical items (pressure vessels, control moment gyros).
Fig. 2-2. BUMPER geometry finite element model of the International Space Station, excluding solar arrays. Approximately 150,000 elements are in the ISS model, with an
average size of 20 cm x 20 cm. Each color represents a different shield type, 400 shields protect Station critical items.
Velocity Direction
Earth

14
Figure 2-3 demonstrates the directionality of the orbital debris environment, which is the design driver for ISS shielding as it represents ~80% of the total penetrating flux for >1-cm-diameter-capable shields.
Fig. 2-3. Probability of impact from debris. Note: Expect higher impact rate in “red” areas & have more capable shielding;
“blue” areas expect lower impact rate & have less shielding
2.2 Spacecraft Failure Criteria The next step is to define damage modes due to M/D impact that can lead to failure of spacecraft
subsystems. Based on this knowledge, we assign a failure criterion to each region of the geometry model. For instance, M/D damage modes and failure criteria for elements of the Space Station are given in Table 2-1.
Table 2-1. Damage Modes and Failure Criteria for Space Station Elements
(note: critical failure criteria marked with *)
Velocity Direction
Earth
Critical Elements
Thermal Protection
System (TPS) Damage
Spall/Perforation of Shield exterior of
Pressure ShellPerforation of Pressure Shell
Uncontrolled Decompression
Catastrophic Rupture Detonation
Crew Modules X* X XPressure Vessels (Liquids & Gases) X*1 X*1 X XControl Moment Gyros (Rotating Equipment) X* XCrew Return Vehicles X X* X X1 Failure criterion for Russian PVs is perforation of pressure shell. Failure criterion of other designs is perforation or detached spall of shielding surrounding PV.
Functional ElementsSurface
Degradation LeakShort or Open
CircuitRadiator Panels X X Radiator Flex/Hard Lines XThermal loop lines & exchangers XPower cables XBatteries X XSolar Arrays X XData lines/cables XWindow outer panes X

15
There are two broad classes of hardware on ISS: (1) functional hardware and (2) critical elements.
Sufficient redundancy exists in the design of the ISS thermal, power, and data subsystems such that no single impact will lead to a loss of station or crew. The components of these systems are defined as functional equipment. Risk assessments for functional equipment are conducted to determine potential means to reduce failure rates, thereby decreasing maintenance and spares costs [25-27].
In contrast, the inhabited modules and pressurized vessels on the exterior of ISS are defined as critical equipment [8, 9, 23]. A loss of pressure and/or structural integrity of these elements could endanger the crew or station survivability. Definitive requirements for protecting critical elements are specified and risk assessments rigorously applied [23]. Risk assessment calculations for Space Station critical elements use the failure criteria defined in Table 2-1. For example, any perforation of the pressure shell of any module that is pressurized and accessible by crew is deemed a critical failure, no matter how small.
The failure modes indicated in Table 2-1 to the right of the selected failure criteria for critical elements are more severe damage modes. Subsets of the selected failure criteria have more catastrophic consequences (e.g., uncontrolled decompression is not possible without first having a perforation of the pressure shell). It should be noted that a critical penetration does not necessarily lead to loss of station or crew. In the case of habitable modules, crew hazards from a penetration of the pressure shell depend in part on the size of the puncture and quantity of debris released into the interior, the configuration of the module’s internal components, whether the module is occupied, and the location of the crew in relation to the puncture. Based on the fact that some station modules will be occupied infrequently (such as airlock and pressurized mating adapters), it is possible that a penetration, if it occurs, will not cause loss or injury to the crew. But, even in best case, a critical penetration would likely have significant repercussions, such as an on-orbit repair of a pressure shell or isolation of the penetrated module.
2.3 Hypervelocity Impact Tests HVI tests are an integral part of the analyses conducted to ensure adequate design of spacecraft
M/D shielding [3-4, 28-32]. Two-stage light-gas guns (LGGs), which accelerate projectiles up to 7 km/s (Fig. 2-4), are capable of launching a variety of different and well-controlled projectile shapes. A disadvantage is that LGGs are capable of velocities that cover only a fraction of the orbital debris threat. Average orbital debris velocity in low-Earth orbit is on the order of 9 km/s. Thus, LGG can directly simulate only 40% of the orbital debris threat.
Fig. 2-4. NASA Johnson Space Center White Sands Test Facility two-stage light-gas gun.

16
Other techniques exist to launch projectiles over 10 km/s [60]. For instance, NASA Johnson Space Center (JSC) has sponsored development of an inhibited shaped charge launcher (ISCL) at Southwest Research Institute. The ISCL’s disadvantage is that it is more constrained in launching well-controlled projectile shapes. Typically, the ISCL projectile is in the shape of a hollow cylinder with overall length to outside diameter ratio (L/d) of 2-3 (Fig.2-5) [33]. We can use hydrocode simulations to assess projectile shape effects on shield response [28, 34-36].
Another high-speed launcher that provides useful information on shield capabilities in excess of 10 km/s is the 3-stage hypervelocity launcher developed at Sandia National Laboratories [37]. This launches thin disks (L/d=0.1-0.2, mass=0.2g-1g) of aluminum and titanium from 10-15 km/s with some bowing and tilting of the projectile.
Fig. 2-5. Southwest Research Institute’s inhibited shaped charge launcher.
Various size charges are available that are capable of launching 0.25-g to 2-g aluminum projectiles up to 11.5 km/s (right view). Projectiles are typically in the shape of a hollow cylinder (left view).
2.4 Ballistic Limit Equations BLEs, or “penetration” equations, are developed based on the HVI test results, numerical
simulations, and analytical assessments. BLEs describe the particle sizes that are on the failure threshold of a particular spacecraft component, and predict a particular shield’s ability to withstand HVI. BLEs are a function of the target “failure criteria”; target configuration, materials, and thickness; and projectile parameters such as velocity, angle, shape, and density. M/D risk assessments require a BLE defined for each surface of a spacecraft, for each failure criterion assessed. Because of the complexity of spacecraft and their HVI failure modes, a wide range of BLEs has been defined [38-41].
Shield design equations have also been developed that provide a means to estimate shielding parameters needed to defend against specific projectile threats [17].
2.5 Spacecraft M/D Environment NASA standard meteoroid and debris environment models are used in the risk assessments to
determine the flux of particles with a diameter that exceeds the ballistic limits [5-7].
Spacecraft operating parameters, including flight altitude, year of flight (i.e., solar activity), and orbital inclination, influence the debris flux. Meteoroid activity is less sensitive to operational parameters.
Flight Direction
17
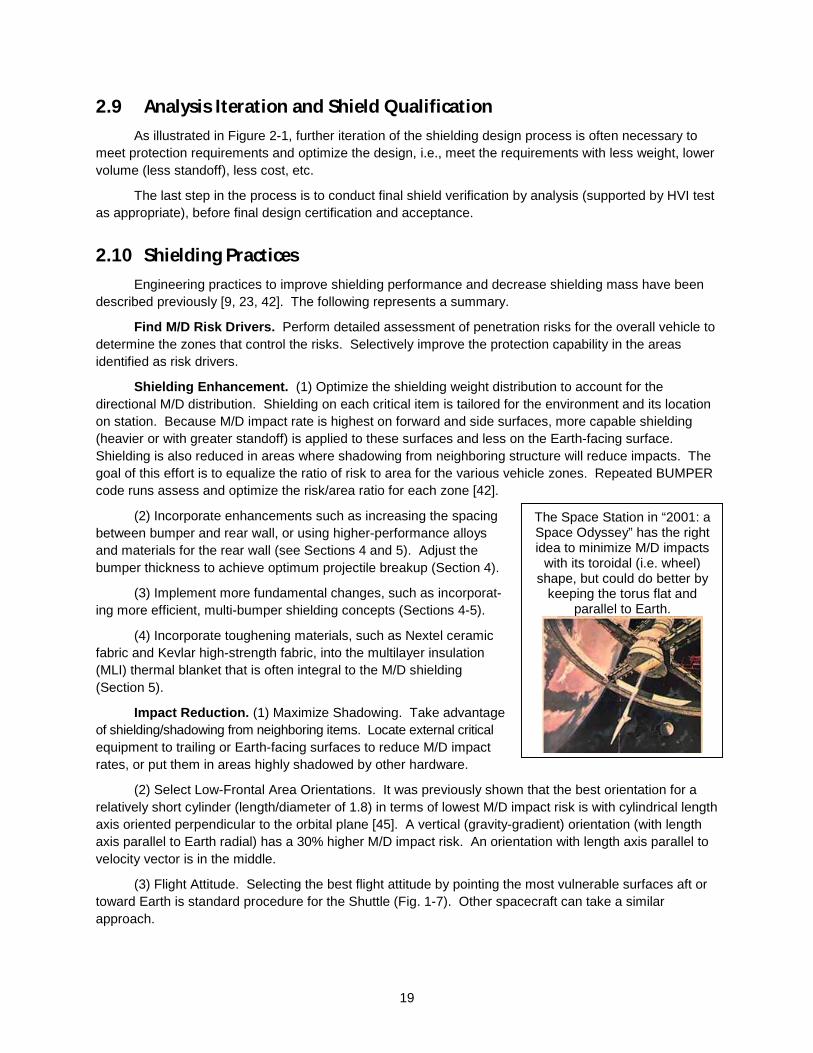
2.6 Bumper Code The BUMPER code has been the standard NASA and its contractors use to perform
meteoroid/debris risk assessments for almost 10 years. During that time, it has undergone extensive revisions and updates [3, 42, 43]. JSC has applied BUMPER to risk assessments for Space Station, Shuttle, Mir, extravehicular mobility units (i.e., “space suits”), and other satellites and spacecraft. NASA has expended significant effort to validate BUMPER and “benchmark” it to other M/D risk assessment codes used by some ISS International Partners.
Fig. 2-1 illustrates where BUMPER fits in the risk assessment process. The BLEs and M/D environment models are embedded into BUMPER. A finite element model (FEM) that describes the spacecraft geometry is created in IDEAS. In conducting ISS risk assessments; a number of FEMs are required for each stage during ISS assembly. For instance, Fig.2-2 shows the ISS FEM for an assembly complete configuration. This FEM has over 150,000 elements describing the surface geometry of ISS and 400 different shield types.
BUMPER calculates the number of failures by determining the number of M/D particles that exceed the ballistic limits for each element of the FEM, and calculates the total number of failures by summing the individual elements. It calculates the number of failures for each element by breaking the debris threat into 90 threat directions and the meteoroid threat into 149 threat directions that are applied to each element. Each threat direction has an appropriate probability that is determined from the environment models. Those threat directions that are shadowed by other elements in the FEM are removed from the calculation for a particular element of the FEM. Because each FEM element has a specific surface orientation in relation to the M/D flux, the number of particles that exceed the ballistic limit is calculated at the element level.
BUMPER can then output the number of failures and risk of failure for the entire FEM and/or pieces of the FEM, as desired by the user. Risk “contours” can also be produced as an output of BUMPER, where colors are used to plot the risk of impact and/or risk of penetration on the FEM. Finally, BUMPER can also show relative M/D risks as a function of impact angle and velocity, for the entire FEM or pieces of the FEM. This last feature is particularly useful in planning the most appropriate HVI tests and analyses (i.e., to determine impact response at the most likely impact angle and velocity).
2.7 Probability of No Penetration We assess probability of no penetration failure (PNP) by Equation (2-2), based on Poisson
statistics where “N” is derived from Equation (2-1). This has been NASA’s standard approach to assess meteoroid shielding since Apollo [44]. NASA extends the same probabilistic approach to designing spacecraft protection systems for the combined meteoroid and debris environments.
PNP = exp (-N) (2-2)
The risk of penetration is:
Risk = 1 - PNP (2-3)
2.8 Design Requirements We compare the assessed PNP from BUMPER to requirements for M/D protection. The shielding
design effort is successful when the assessed PNP is greater than the required PNP. Vehicles from the early years of space exploration have used the probabilistic approach to design meteoroid shielding.

18
Table 2-2 provides a listing of historical M/D protection design requirements [23]. Generally, each program defines “penetrations” as critical penetrations that would endanger the survivability of the vehicle and/or crew.
Table 2-2. Historical Meteoroid/Debris Shielding Requirements
Vehicle Environments Required Probability of No Penetration
Apollo Command Module Meteoroid 0.996 per 8.3-day mission
Skylab Module Meteoroid 0.995 for 8-month mission
Shuttle Orbiter Meteoroid 0.95 for 500 missions
Spacelab Module Meteoroid 0.999 for 7-day mission
Hubble Space Telescope Meteoroid and Debris 0.95 for 2 years
ISS Meteoroid and Debris 0.98 to 0.998 per critical element over 10 years
Space Station Design Requirements. The Space Station has M/D protection requirements
consistent with past programs, yet because ISS is larger and exposed longer than other space vehicles, and because ISS will operate at higher altitudes in general than other spacecraft it also carries increased risk and probability of meteoroid and debris impacts. To meet comparable protection requirements, ISS shielding must be more effective: it will carry by far the most capable M/D shields ever flown. For instance, most ISS critical hardware exposed to the M/D flux in the velocity vector (front) or port/starboard (sides) directions will be protected by shields effective at stopping 1-cm- to 1.3-cm-diameter aluminum debris particles at typical impact velocity and angle (9 km/s, 45o). In comparison, the Mir space station was able to stop 0.3-cm particles, the Space Shuttle Orbiter is capable of stopping 0.2-cm to 0.5-cm particles, and Apollo and Skylab were able to stop 0.15- to 0.2-cm particles under similar impact conditions.
ISS also will have the ability to maneuver from ground-trackable debris particles (typically >10 cm diameter). By virtue of its large internal volume, ISS crews will have time to locate and isolate leaks by closing hatches. Hole repair kits will be manifested and crews will be trained to repair a leak in a module if it occurs. Crew escape vehicles will be docked to ISS in the event of a major event requiring evacuation.
Functional Equipment M/D Requirements. Besides crew safety/vehicle survivability M/D requirements, other spacecraft and component requirements are given for functionality. These are expressed for a given system, such as thermal control/radiator fluid loops, as a probability of no failure (PNF) and are analogous to the PNP. PNF is calculated in exactly the same fashion as described above.
Crew Return Vehicle and Extravehicular Activity M/D Requirements. M/D requirements for crew return vehicles attached to station are based on two different failure modes: (1) PNP for penetrations that cause immediate loss of pressure in crew cabins or pressure vessel failure while docked to ISS, and (2) PNP for penetrations that could result in loss of vehicle during reentry. M/D requirements for extravehicular activity space suits are expressed in terms of (1) PNP for any size leak/penetration, and (2) PNCP for probability of no “critical” penetration that results in hole sizes in the bladder that exceed the purge capability of the secondary oxygen system [31]. Requirements and failure modes may differ, but the approach to evaluating and designing protection systems to meet the requirements is the same as given in Figure 2-1.
19
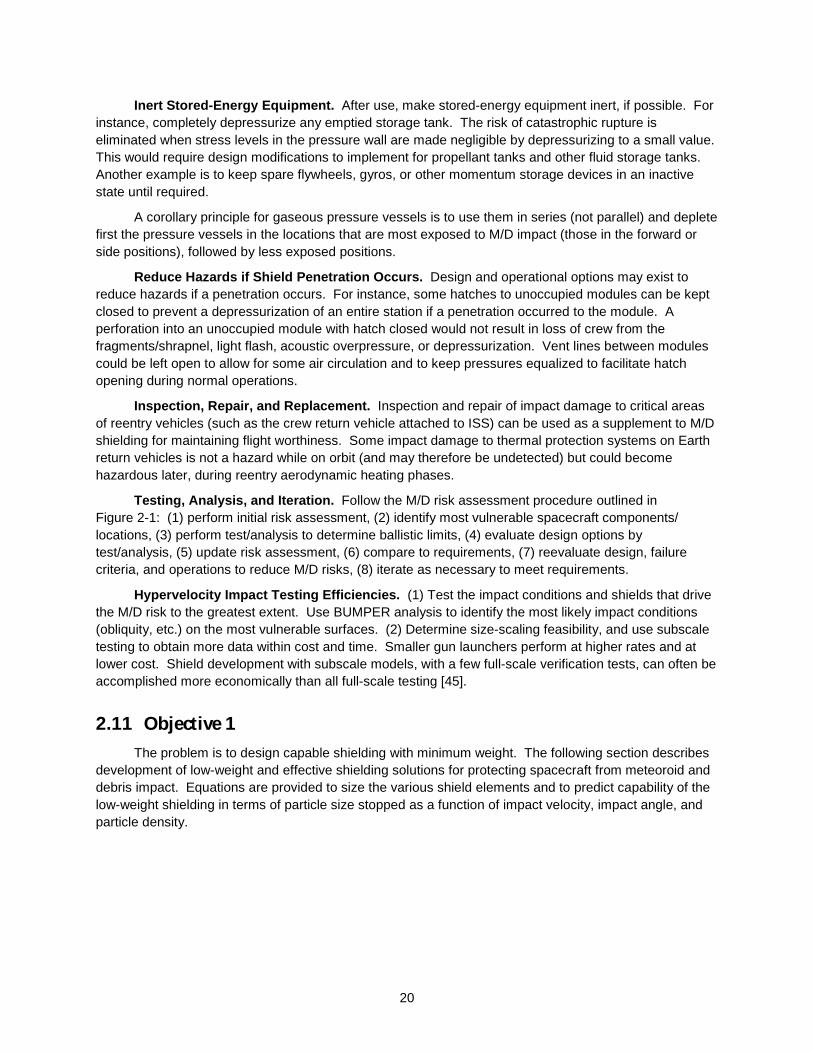
The Space Station in “2001: a Space Odyssey” has the right idea to minimize M/D impacts
with its toroidal (i.e. wheel) shape, but could do better by
keeping the torus flat and parallel to Earth.
2.9 Analysis Iteration and Shield Qualification As illustrated in Figure 2-1, further iteration of the shielding design process is often necessary to
meet protection requirements and optimize the design, i.e., meet the requirements with less weight, lower volume (less standoff), less cost, etc.
The last step in the process is to conduct final shield verification by analysis (supported by HVI test as appropriate), before final design certification and acceptance.
2.10 Shielding Practices Engineering practices to improve shielding performance and decrease shielding mass have been
described previously [9, 23, 42]. The following represents a summary.
Find M/D Risk Drivers. Perform detailed assessment of penetration risks for the overall vehicle to determine the zones that control the risks. Selectively improve the protection capability in the areas identified as risk drivers.
Shielding Enhancement. (1) Optimize the shielding weight distribution to account for the directional M/D distribution. Shielding on each critical item is tailored for the environment and its location on station. Because M/D impact rate is highest on forward and side surfaces, more capable shielding (heavier or with greater standoff) is applied to these surfaces and less on the Earth-facing surface. Shielding is also reduced in areas where shadowing from neighboring structure will reduce impacts. The goal of this effort is to equalize the ratio of risk to area for the various vehicle zones. Repeated BUMPER code runs assess and optimize the risk/area ratio for each zone [42].
(2) Incorporate enhancements such as increasing the spacing between bumper and rear wall, or using higher-performance alloys and materials for the rear wall (see Sections 4 and 5). Adjust the bumper thickness to achieve optimum projectile breakup (Section 4).
(3) Implement more fundamental changes, such as incorporat-ing more efficient, multi-bumper shielding concepts (Sections 4-5).
(4) Incorporate toughening materials, such as Nextel ceramic fabric and Kevlar high-strength fabric, into the multilayer insulation (MLI) thermal blanket that is often integral to the M/D shielding (Section 5).
Impact Reduction. (1) Maximize Shadowing. Take advantage of shielding/shadowing from neighboring items. Locate external critical equipment to trailing or Earth-facing surfaces to reduce M/D impact rates, or put them in areas highly shadowed by other hardware.
(2) Select Low-Frontal Area Orientations. It was previously shown that the best orientation for a relatively short cylinder (length/diameter of 1.8) in terms of lowest M/D impact risk is with cylindrical length axis oriented perpendicular to the orbital plane [45]. A vertical (gravity-gradient) orientation (with length axis parallel to Earth radial) has a 30% higher M/D impact risk. An orientation with length axis parallel to velocity vector is in the middle.
(3) Flight Attitude. Selecting the best flight attitude by pointing the most vulnerable surfaces aft or toward Earth is standard procedure for the Shuttle (Fig. 1-7). Other spacecraft can take a similar approach.
20
Inert Stored-Energy Equipment. After use, make stored-energy equipment inert, if possible. For instance, completely depressurize any emptied storage tank. The risk of catastrophic rupture is eliminated when stress levels in the pressure wall are made negligible by depressurizing to a small value. This would require design modifications to implement for propellant tanks and other fluid storage tanks. Another example is to keep spare flywheels, gyros, or other momentum storage devices in an inactive state until required.
A corollary principle for gaseous pressure vessels is to use them in series (not parallel) and deplete first the pressure vessels in the locations that are most exposed to M/D impact (those in the forward or side positions), followed by less exposed positions.
Reduce Hazards if Shield Penetration Occurs. Design and operational options may exist to reduce hazards if a penetration occurs. For instance, some hatches to unoccupied modules can be kept closed to prevent a depressurization of an entire station if a penetration occurred to the module. A perforation into an unoccupied module with hatch closed would not result in loss of crew from the fragments/shrapnel, light flash, acoustic overpressure, or depressurization. Vent lines between modules could be left open to allow for some air circulation and to keep pressures equalized to facilitate hatch opening during normal operations.
Inspection, Repair, and Replacement. Inspection and repair of impact damage to critical areas of reentry vehicles (such as the crew return vehicle attached to ISS) can be used as a supplement to M/D shielding for maintaining flight worthiness. Some impact damage to thermal protection systems on Earth return vehicles is not a hazard while on orbit (and may therefore be undetected) but could become hazardous later, during reentry aerodynamic heating phases.
Testing, Analysis, and Iteration. Follow the M/D risk assessment procedure outlined in Figure 2-1: (1) perform initial risk assessment, (2) identify most vulnerable spacecraft components/ locations, (3) perform test/analysis to determine ballistic limits, (4) evaluate design options by test/analysis, (5) update risk assessment, (6) compare to requirements, (7) reevaluate design, failure criteria, and operations to reduce M/D risks, (8) iterate as necessary to meet requirements.
Hypervelocity Impact Testing Efficiencies. (1) Test the impact conditions and shields that drive the M/D risk to the greatest extent. Use BUMPER analysis to identify the most likely impact conditions (obliquity, etc.) on the most vulnerable surfaces. (2) Determine size-scaling feasibility, and use subscale testing to obtain more data within cost and time. Smaller gun launchers perform at higher rates and at lower cost. Shield development with subscale models, with a few full-scale verification tests, can often be accomplished more economically than all full-scale testing [45].
2.11 Objective 1 The problem is to design capable shielding with minimum weight. The following section describes
development of low-weight and effective shielding solutions for protecting spacecraft from meteoroid and debris impact. Equations are provided to size the various shield elements and to predict capability of the low-weight shielding in terms of particle size stopped as a function of impact velocity, impact angle, and particle density.

21
High-Speed Camera Film (Cordin) 0.32 cm projectile impacts bumper at 6.8 km/s, left to right, 1µs between frames.
SECTION 3
SHIELDING DEVELOPMENT AND MATERIAL SELECTION This section reports on work to improve the accuracy of the BLEs for conventional Whipple shields.
With the modified equation, Whipple shields were designed to provide protection for parts of ISS. However, Whipple shields proved inadequate for providing complete M/D protection for ISS. Whipple shields are used in shadowed areas of ISS or where meteoroids are mainly expected to hit. Areas exposed to the highest debris impact rates (front and side areas) require enhanced shielding. Because Whipple shields would weigh too much if applied to all areas of ISS, we need new, low-weight shield solutions to meet protection requirements. Evaluations of alternative shielding materials for improving spacecraft protection have been completed, and results of the studies are reported in this section. The most favorable shielding configurations have been applied to ISS protection as discussed in later sections.
3.1 Development of Whipple Shield Ballistic Limit Equations Fred Whipple proposed in the 1940s a meteoroid shield for spacecraft consisting of a thin “sacrificial”
bumper followed at a distance by a rear wall [46]. The Whipple shield is shown in Figure 3-1. The function of the first sheet or “bumper” is to break up the projectile into a cloud of material containing both projectile and bumper debris. This cloud expands while moving across the standoff, resulting in the impactor momentum being distributed over a wide area of the rear wall. The back sheet must be thick enough to withstand the blast loading from the debris cloud and any solid fragments that remain. For most conditions, a Whipple shield results in a significant weight reduction over a single plate, which must contend with deposition of the projectile kinetic energy in a very localized area.
Whipple shields were used to protect the Apollo Command Module and Lunar Lander. Cour-Palais developed Equations 3-1 and 3-2, which were used in the design of these shields [47]. At the time of the development of these equations, meteoroids were the only recognized HVI threat to spacecraft. As melt conditions in the debris cloud were desired compared to solid fragments, bumper thickness was sized by Equation 3-1 to result in both projectile and bumper melt above 10 km/s, considering normal impact, for both aluminum and glass projectiles. As melt conditions in the debris cloud could not always be assured due to impact obliquity angle and non-spherical projectile effects, rear wall design included the effect of solid bumper/projectile fragment impacts. Based on analysis of impact test results to assess the variation of target standoff, rear wall material strength, impact diameter, and projectile density on required rear wall thickness, Equation 3-2 was derived for rear wall thickness to prevent perforation and detached spall.
ejecta
debris cloud

22
Rear wall after impact
tb = 0.2 d (3-1)
tw = 0.055 (ρb ρp)1/6 M1/3 V S-0.5 (70/σ)0.5 (3-2)
Apollo shields were capable of stopping 0.16-cm-diameter aluminum particles at 7 km/s, normal
impact angle (0o). Accuracy of Equations 3-1 and 3-2 was satisfactory, given the database of HVI tests with particle diameters up to about 0.16cm.
bumper
standoff
rear wall
Ejecta
debris cloud
Detached Spall
Craters & holes
a) Whipple shields consist of a bumper, standoff (gap or spacing),
and rear wall.
b) Hypervelocity impacts will generate a cloud of bumper and projectile
debris that can contain solid fragments, liquid, and vapor particles.
c) The rear wall must survive the fragments and debris cloud impulsive
loading. It could fail by perforation from solid fragments, spall, or tear and
petal from the impulsive loading.
Fig. 3-1. Whipple shield.
Modified Cour-Palais Equation. HVI tests of Whipple shields for
the Space Station showed that a significant modification was necessary in the rear wall predictor (Equation 3-2) used to size shielding for critical components. The HVI data showed that the equation was nonconservative, and underestimated the rear wall thickness, tw, needed to stop impact threats larger than 0.16 cm diameter. To meet requirements, Station shielding needed to stop up to 1.3-cm-diameter aluminum projectiles impacting at 7 km/s, 0o.
We developed a modified equation from a database of tests with a large range of shield parameters (Table 3-1), such as particle diameter, d, which varied from 0.04 cm to 1.9 cm in the data. All tests were with projectile impacts at a normal angle to the target (0o). The data set was selected to be at or near the ballistic limit of the rear wall. Perforation or detached spall of the rear wall was selected as the ballistic limit failure criteria. The data are provided in the literature [48] and are included in Appendix C. Of the 55 data points in the database, 23 were on the failure side of the ballistic limit and 32 had rear walls thick enough to prevent failure.
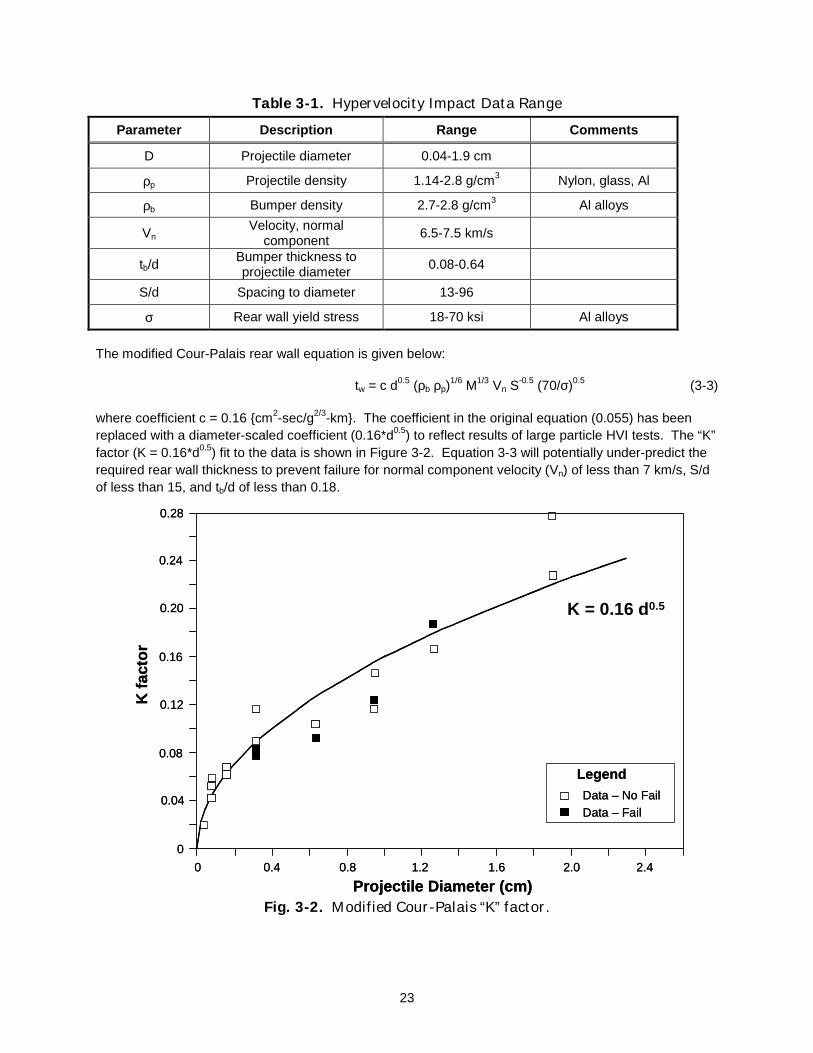
23
Table 3-1. Hypervelocity Impact Data Range
Parameter Description Range Comments
D Projectile diameter 0.04-1.9 cm
ρp Projectile density 1.14-2.8 g/cm3 Nylon, glass, Al
ρb Bumper density 2.7-2.8 g/cm3 Al alloys
Vn Velocity, normal
component 6.5-7.5 km/s
tb/d Bumper thickness to projectile diameter 0.08-0.64
S/d Spacing to diameter 13-96
σ Rear wall yield stress 18-70 ksi Al alloys
The modified Cour-Palais rear wall equation is given below:
tw = c d0.5 (ρb ρp)1/6 M1/3 Vn S
-0.5 (70/σ)0.5 (3-3) where coefficient c = 0.16 {cm2-sec/g2/3-km}. The coefficient in the original equation (0.055) has been replaced with a diameter-scaled coefficient (0.16*d0.5) to reflect results of large particle HVI tests. The “K” factor (K = 0.16*d0.5) fit to the data is shown in Figure 3-2. Equation 3-3 will potentially under-predict the required rear wall thickness to prevent failure for normal component velocity (Vn) of less than 7 km/s, S/d of less than 15, and tb/d of less than 0.18.
Projectile Diameter (cm)
K f
acto
r
K = 0.16 d0.5
Data – No FailData – Fail
Legend
0.04
0
0.08
0.12
0.16
0.20
0.24
0.28
0 0.4 0.8 1.2 1.6 2.0 2.4
Projectile Diameter (cm)
K f
acto
r
K = 0.16 d0.5
Data – No FailData – Fail
Legend
0.04
0
0.08
0.12
0.16
0.20
0.24
0.28
0 0.4 0.8 1.2 1.6 2.0 2.4
Fig. 3-2. Modified Cour-Palais “K” factor.
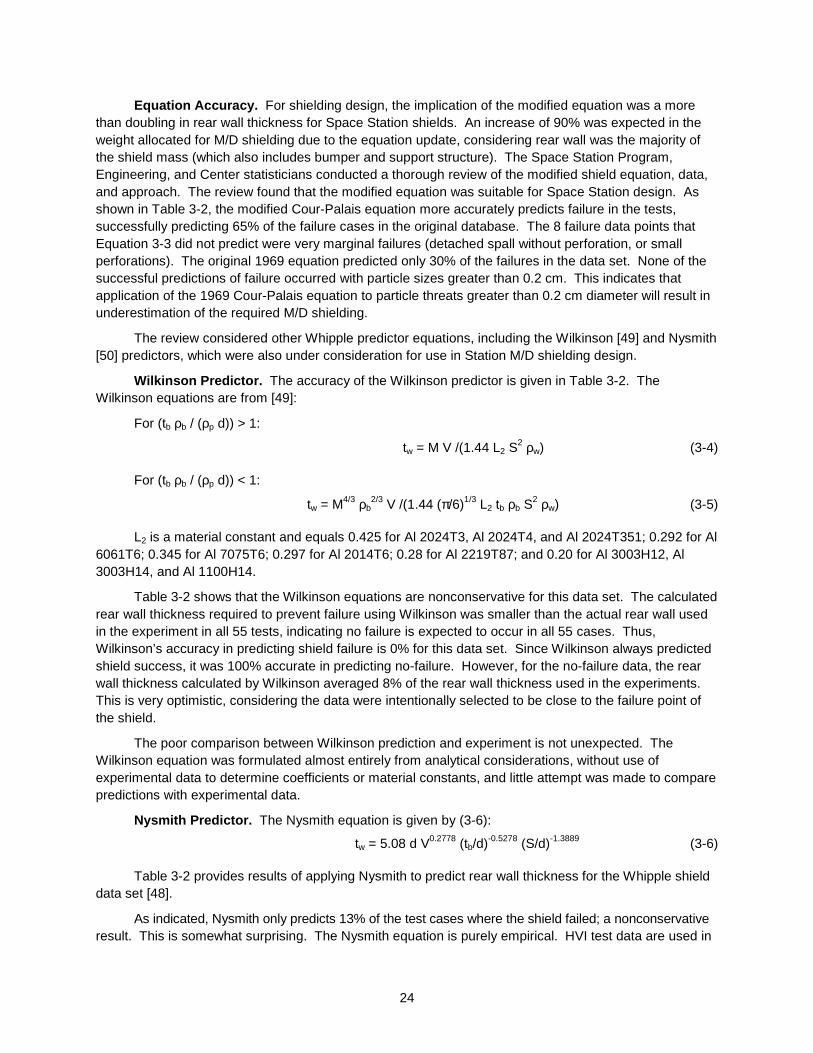
24
Equation Accuracy. For shielding design, the implication of the modified equation was a more than doubling in rear wall thickness for Space Station shields. An increase of 90% was expected in the weight allocated for M/D shielding due to the equation update, considering rear wall was the majority of the shield mass (which also includes bumper and support structure). The Space Station Program, Engineering, and Center statisticians conducted a thorough review of the modified shield equation, data, and approach. The review found that the modified equation was suitable for Space Station design. As shown in Table 3-2, the modified Cour-Palais equation more accurately predicts failure in the tests, successfully predicting 65% of the failure cases in the original database. The 8 failure data points that Equation 3-3 did not predict were very marginal failures (detached spall without perforation, or small perforations). The original 1969 equation predicted only 30% of the failures in the data set. None of the successful predictions of failure occurred with particle sizes greater than 0.2 cm. This indicates that application of the 1969 Cour-Palais equation to particle threats greater than 0.2 cm diameter will result in underestimation of the required M/D shielding.
The review considered other Whipple predictor equations, including the Wilkinson [49] and Nysmith [50] predictors, which were also under consideration for use in Station M/D shielding design.
Wilkinson Predictor. The accuracy of the Wilkinson predictor is given in Table 3-2. The Wilkinson equations are from [49]:
For (tb ρb / (ρp d)) > 1:
tw = M V /(1.44 L2 S2 ρw) (3-4)
For (tb ρb / (ρp d)) < 1:
tw = M4/3 ρb2/3 V /(1.44 (π/6)1/3 L2 tb ρb S
2 ρw) (3-5)
L2 is a material constant and equals 0.425 for Al 2024T3, Al 2024T4, and Al 2024T351; 0.292 for Al 6061T6; 0.345 for Al 7075T6; 0.297 for Al 2014T6; 0.28 for Al 2219T87; and 0.20 for Al 3003H12, Al 3003H14, and Al 1100H14.
Table 3-2 shows that the Wilkinson equations are nonconservative for this data set. The calculated rear wall thickness required to prevent failure using Wilkinson was smaller than the actual rear wall used in the experiment in all 55 tests, indicating no failure is expected to occur in all 55 cases. Thus, Wilkinson’s accuracy in predicting shield failure is 0% for this data set. Since Wilkinson always predicted shield success, it was 100% accurate in predicting no-failure. However, for the no-failure data, the rear wall thickness calculated by Wilkinson averaged 8% of the rear wall thickness used in the experiments. This is very optimistic, considering the data were intentionally selected to be close to the failure point of the shield.
The poor comparison between Wilkinson prediction and experiment is not unexpected. The Wilkinson equation was formulated almost entirely from analytical considerations, without use of experimental data to determine coefficients or material constants, and little attempt was made to compare predictions with experimental data.
Nysmith Predictor. The Nysmith equation is given by (3-6):
tw = 5.08 d V0.2778 (tb/d)-0.5278 (S/d)-1.3889 (3-6)
Table 3-2 provides results of applying Nysmith to predict rear wall thickness for the Whipple shield data set [48].
As indicated, Nysmith only predicts 13% of the test cases where the shield failed; a nonconservative result. This is somewhat surprising. The Nysmith equation is purely empirical. HVI test data are used in

25
its formulation. The poor comparison here can be explained by noting that Nysmith formulated his equation using HVI data for glass projectiles on aluminum targets. Because the density of glass is less than aluminum, this correlation would underestimate the effect of aluminum projectiles. However, of more concern is use of the Nysmith equation to extrapolate beyond test conditions. The Nysmith equation is derived strictly from HVI data, and contains no theoretical justification for extrapolating beyond test conditions.
Table 3-2. Comparison of Whipple Shield Sizing Equations
Predictor: Modified
Cour-Palais Original 1969 Cour-Palais
Wilkinson Nysmith
Predicted Failures (out of 23 in data set)
15 7 0 3
Prediction Accuracy 65% 30% 0% 13%
Mean tw calc / tw exp’t 1.15 0.82 0.15 0.58
Std deviation in tw calc / tw exp’t 0.45 0.81 0.18 0.39
Predicted No-Failures (out of 32 in data set)
23 27 32 32
Prediction Accuracy 72% 84% 100% 100%
Mean tw calc / tw exp’t 0.90 0.63 0.08 0.37
Std deviation in tw calc / tw exp’t 0.36 0.55 0.05 0.16
Technical Basis. Further technical rationale for using the modified Cour-Palais equation includes
the following:
• The approach is a semi-analytical/empirical approach. It uses test data to “anchor” the prediction at the highest impact velocities attainable in the laboratory. It uses a conservative analytical approach to extrapolate to higher velocities.
• The basis of the velocity scaling is that the ballistic limit of a given structure scales with constant impactor kinetic energy (i.e., tw ∝ K.E.1/3). This is consistent with NASA practice for conservatively extrapolating beyond HVI test conditions [Ref.44], as well as the presumption that the debris cloud will contain solid particulates in a significant fraction of real on-orbit encounters at velocities in excess of 7 km/s. These solid particles are the determining factor in sizing the rear wall. Cratering theory for the penetration of solid particles into the rear wall is consistent with a constant kinetic energy scaling rule. Solid particulates in the debris cloud occur in a number of high-velocity impact scenarios (for single-bumper Whipple shields), such as impacts of irregular-shaped debris, impacts with too-thin bumpers (tb/d < 0.15), late time fragments from the bumper when tb/d > 0.5 or if the wall thickness is less than or equal to bumper thickness, and fragments from projectile or bumper generated in oblique impact.
• The approach is a conservative method for predicting HVI response of Whipple shields to impact conditions beyond test capability. A conservative approach is appropriate for designing protection systems of critical equipment on Space Station, since crew safety and vehicle survivability depend on the shielding. The equations will be modified as test data and detailed analyses become available for shield response to impacts above 10 km/s.

26
3.2 Enhanced Shielding Material Selection In this subsection, I discuss the results from analytical and HVI evaluations of new shielding
materials and configurations. The approach taken was to break the problem in two pieces: first examining materials and configurations to improve the projectile breakup performance of the bumper(s), and then to evaluate improved rear wall materials. The analytical work is supported by HVI tests.
Rationale for Improved Shielding. The primary purpose of developing improved shielding is to provide higher levels of spacecraft M/D protection with less weight.
To illustrate the issue, consider the shielding required to stop 1-cm-diameter aluminum projectiles at 7 km/s, 0o impact angle. Figure 3-3 gives four shield concepts to meet the requirement: a conventional aluminum Whipple shield with a 10.2-cm standoff, a Nextel/Kevlar stuffed Whipple shield with the same standoff, a Whipple shield with a 30-cm standoff, and a Nextel multi-shock shield concept.
Areal Density (kg/m2)
Whipple S=10 cm
Stuffed Whipple S=10 cm
Whipple S=30 cm
Multi-shock S=30 cm
Bumper: 7.0 10.6 5.6 5.2 Rear wall: 17.2 6.6 7.5 3.8
Total: 24.2 17.3 13.1 9.0 Surface Area (m2)
Bumper: 152 152 175 175 Rear wall: 141 141 141 141
Mass (kg) including 30% of bumper for support mass Bumper: 1060 1620 980 910 Support: 320 490 300 270
Rear wall: 2420 940 1060 540 Total:
(include support) 3800 3050 2340 1720
Fig. 3-3. Shielding concepts comparison.
t=0.26cm Al bumper
t=0.6cm Al2219T87
10.2cmstandoff
WHIPPLE10.2cm standoff
t=0.15cm Al bumper
Nextel/KevlarStuffed WhipplemN-K=0.6g/cm2
Nextel bumpersmb = 0.52 g/cm2
Multi-Shock30cm standoff
Nextel ceramic cloth
Kevlar fabric
Projectile in all cases: 1cm diameter aluminum, 1.5g, 7km/s, normal impact
10.2cmstandoff
t=0.21cm Al bumper
t=0.26cm Al2219T87
30 cm standoff
WHIPPLE30cm standoff
30 cm standoff
t=0.14cm Al2219T87
t=0.23cm Al2219T87

27
We make the shielding mass estimates assuming the shielding encloses a cylinder, with 4.2 m inside diameter by 8.5 m long. Sections 4 and 5 describe stuffed Whipple and multi-shock shields in detail, but it is clear for this example that using advanced shielding concepts (up to 50% reduction) provide significant mass savings.
Also, it is possible to trade weight for protection capability (i.e., capability and shield PNP are related as explained in Section 2, Equations 2-1 through 2-3), so it can be shown that lower weight and more effective protection in terms of higher PNP are possible using Nextel/Kevlar stuffed Whipple and multi-shock shields compared to conventional Whipple shields.
Evaluation of New Shielding Materials. New shielding development takes place in phases, as given in Table 3-3. Early phases involve applying analytical techniques supported by screening/ optimization HVI tests to select shielding candidates and develop design equations. Later phases concentrate on developing BLEs that are then programmed into BUMPER code (section 2) for spacecraft M/D risk assessments. Further HVI analysis/test work is required to confirm BLEs for a particular application on a spacecraft, as the actual application may differ in some important aspect (standoff, material types, thickness) from the existing test database. Final qualification tests on flight-like shield samples leading to protection system certification for flight complete the program.
Table 3-3. Shield Development Steps
Phase HVI Test Objectives Approx. Number of Tests Analytical Tasks
1. Shield Screening and Optimization
• Select superior shield candidates • Optimize shield parameters • Perform size-scaling studies • Confirm/update analytical models
1-2 per candidate to select best one(s), followed by 5-20 to optimize and scale
• Materials screening evaluations • Analytical/semi-empirical models • Design equations • Scaling relationships
2. Ballistic Limit Study
• Determine ballistic limits: LGG (2-8 km/s), oblique impacts, projectile density effects, target variations; ISCL (10-12 km/s)
20-40 per shield (LGG)
• Develop ballistic limit equations • Perform M/D risk assessments using
analytical models and hydrocodes evaluation of high-velocity capability, predict performance beyond testable range
3. Engineering Application
• Update ballistic limit curves for actual materials and configurations used in spacecraft application
10-20 per shield • Data analysis • Update ballistic limit equations • Update M/D risk assessments
4. Qualification • Test near ballistic limit curves using
“flight-like” materials and configurations
2-10 per shield • Select test conditions • Work contingencies, repeat tests, update
analysis, modify design if necessary
Alternative Bumper Materials. Aluminum is the standard material used for a spacecraft bumper in a Whipple shield. We evaluated alternative materials using aluminum as the baseline for comparison. Desirable characteristics of an effective spacecraft bumper include:
1. Good projectile breakup
2. Low shielding weight
3. Low penetration threat to rear wall from bumper fragments
4. Large dispersion angle of debris cloud
5. Low expansion speed of debris cloud
6. Minimal secondary ejecta
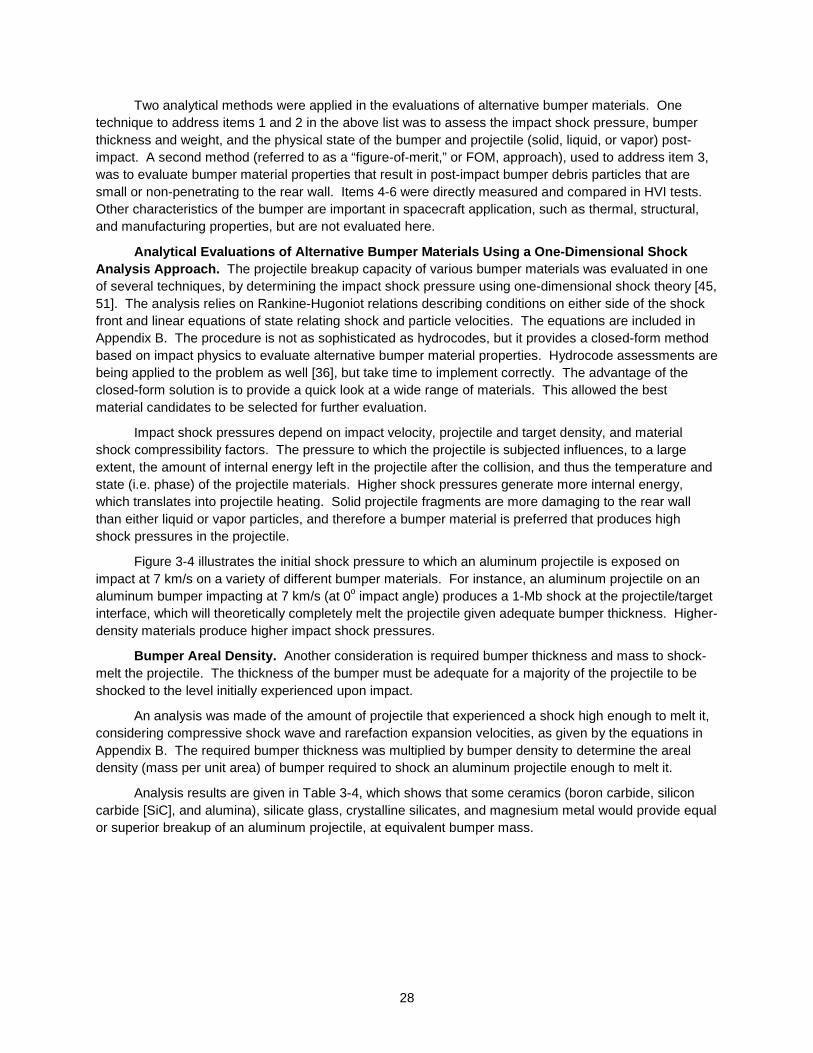
28
Two analytical methods were applied in the evaluations of alternative bumper materials. One technique to address items 1 and 2 in the above list was to assess the impact shock pressure, bumper thickness and weight, and the physical state of the bumper and projectile (solid, liquid, or vapor) post-impact. A second method (referred to as a “figure-of-merit,” or FOM, approach), used to address item 3, was to evaluate bumper material properties that result in post-impact bumper debris particles that are small or non-penetrating to the rear wall. Items 4-6 were directly measured and compared in HVI tests. Other characteristics of the bumper are important in spacecraft application, such as thermal, structural, and manufacturing properties, but are not evaluated here.
Analytical Evaluations of Alternative Bumper Materials Using a One-Dimensional Shock Analysis Approach. The projectile breakup capacity of various bumper materials was evaluated in one of several techniques, by determining the impact shock pressure using one-dimensional shock theory [45, 51]. The analysis relies on Rankine-Hugoniot relations describing conditions on either side of the shock front and linear equations of state relating shock and particle velocities. The equations are included in Appendix B. The procedure is not as sophisticated as hydrocodes, but it provides a closed-form method based on impact physics to evaluate alternative bumper material properties. Hydrocode assessments are being applied to the problem as well [36], but take time to implement correctly. The advantage of the closed-form solution is to provide a quick look at a wide range of materials. This allowed the best material candidates to be selected for further evaluation.
Impact shock pressures depend on impact velocity, projectile and target density, and material shock compressibility factors. The pressure to which the projectile is subjected influences, to a large extent, the amount of internal energy left in the projectile after the collision, and thus the temperature and state (i.e. phase) of the projectile materials. Higher shock pressures generate more internal energy, which translates into projectile heating. Solid projectile fragments are more damaging to the rear wall than either liquid or vapor particles, and therefore a bumper material is preferred that produces high shock pressures in the projectile.
Figure 3-4 illustrates the initial shock pressure to which an aluminum projectile is exposed on impact at 7 km/s on a variety of different bumper materials. For instance, an aluminum projectile on an aluminum bumper impacting at 7 km/s (at 0o impact angle) produces a 1-Mb shock at the projectile/target interface, which will theoretically completely melt the projectile given adequate bumper thickness. Higher-density materials produce higher impact shock pressures.
Bumper Areal Density. Another consideration is required bumper thickness and mass to shock-melt the projectile. The thickness of the bumper must be adequate for a majority of the projectile to be shocked to the level initially experienced upon impact.
An analysis was made of the amount of projectile that experienced a shock high enough to melt it, considering compressive shock wave and rarefaction expansion velocities, as given by the equations in Appendix B. The required bumper thickness was multiplied by bumper density to determine the areal density (mass per unit area) of bumper required to shock an aluminum projectile enough to melt it.
Analysis results are given in Table 3-4, which shows that some ceramics (boron carbide, silicon carbide [SiC], and alumina), silicate glass, crystalline silicates, and magnesium metal would provide equal or superior breakup of an aluminum projectile, at equivalent bumper mass.

29
Fig. 3-4. Initial shock pressures generated by impacts from aluminum projectiles
at 7 km/s on various target materials.
Table 3-4. Results of Analytical Model to Evaluate Bumper Materials
Note: Calculations based on impact with a 1-g aluminum projectile (0.88 cm diameter) at 7 km/s, bumper areal density is 0.61 g/cm2
Rank* Material Density (g/cm3)
Impact Pressure
(Mb)
Bumper thickness
(cm) t/d
Minimum bumper areal
density** (g/cm2)
1 Aluminum oxide 3.66 1.15 0.17 0.19 0.61
2 Silicon carbide 3.12 1.09 0.20 0.22 0.56
3 Al 6061T6 alloy 2.71 0.95 0.22 0.25 0.45
4 Basalt 2.86 0.89 0.21 0.24 0.42
5 Mullite 2.67 0.86 0.23 0.26 0.40
6 Silica, quartz 2.65 0.81 0.23 0.26 0.37
7 Mg AZ31B alloy 1.78 0.72 0.34 0.39 0.30
8 Glass 2.20 0.69 0.28 0.31 0.31 * Rank based on highest impact pressure with bumpers of adequate thickness to shock the projectile completely, **Minimum areal density required for shock wave to transverse the complete projectile before attenuation by rarefaction wave
Comparative Analysis of Bumper Fragment Size. Another factor to consider in bumper material
evaluations is the state of the bumper material in the debris cloud. Solid bumper fragments of sufficient size and velocity will penetrate the rear wall, and a methodology to assess this effect is given in the next section. Thermodynamic properties of the bumper determine the phase of the bumper material in the debris cloud to a large extent. The most important is heat of fusion. Others include melting temperature,
Al6061T6
0.0
0.5
1.0
1.5
2.0
2.5
0.0 5.0 10.0 15.0 20.0 25.0
Target Material Density (g/cm3)
Imp
act P
ress
ure
(M b
ar)

30
vaporization energy, and vaporization temperature. The lower these properties are, the more likely the debris cloud will contain molten or vaporized bumper particles, which are less damaging to the protected surfaces than solid fragments. An additional parameter is the thickness of the bumper, as larger bumper fragments will occur with increased bumper thickness. An analysis of bumper materials was completed based on a FOM, which ranks alternative materials on the basis of thermodynamic parameters by Equations 3-7 through 3-8 [51]. The FOM analysis is applicable for metals. Table 3-5 lists the results of the analysis, which indicates tin and magnesium will perform better than aluminum, while tantalum and tungsten perform worse. The FOM analysis compares favorably with previous work on bumper material properties [52]. The previous work was experimental in nature, and provides confirmation that the FOM is consistent with HVI data. Tin was not assessed in the experimental work [52], but the FOM analysis indicates it will make a good bumper material from a HVI perspective. The FOM is determined by:
FOM = ρ’ (Hm (Tm)0.5 Hv0.1 (Tv)0.1 + R/4) (3-7)
Material properties for the bumper material candidates are given in Table 3-6 and are normalized in Equation 3-7 to aluminum as follows:
ρ’ = ρ(Al) / ρ ; density ρ (g/cm3)
Hm = Hf (Al) / Hf ; latent heat of fusion Hf (Btu/lbm)
Tm = Tf (Al) / Tf ; melting temperature Tf (oC)
Hv = Hv (Al) / Hv ; heat of vaporization Hv (Btu/lbm)
Tv = Tv (Al) / Tv ; vaporization temperature Tv (
oC)
R = [C/C(Al)]0.67 [H/H(Al)]0.25 [ρ/ρ(Al)]0.5
where H is the Brinell hardness, and C {km/s}, the speed of sound in the material, is calculated from the elastic modulus, E {MPa}, and the density, ρt, i.e.,
C = [E/(103 ρt)]0.5 (3-8)
Table 3-5. Bumper Material Figure of Merit [51] Note: Materials with higher values are expected to perform better as bumper.
Material Figure of Merit Mg AZ31B alloy 2.4 Tin 1.99 Lead 1.90 Cadmium 1.86 Aluminum alloy 1.25 Antimony 0.87 Titanium 0.56 Iron/Steel 0.46 Copper 0.42 Nickel 0.42 Tungsten 0.17 Tantalum 0.15

31
Table 3-6. Bumper Material Properties for Figure of Merit Analysis [51]
Material Melting Temp (C)
Heat of Fusion
(BTU/lb)
Boiling Temp (C)
Heat of Vap.
(BTU/lb)
Brinell Hard.
Density (lb/in3)
Elastic Mod (psi)
Sound Speed (km/s)
Mg AZ31B alloy 532 142 1093 2407 73 0.064 6.5E6 5.03
Tin 232 26.1 2260 1023 5 0.264 6.4E6 2.46
Lead 327 10.6 1725 365 5 0.41 2.0E6 1.10
Cadmium 321 23.4 767 382 38 0.312 8.0E6 2.53
Aluminum alloy 660 170 1800 3591 73 0.098 9.9E6 5.02
Antimony 631 70.5 1380 671 42 0.249 1.13E7 3.36
Titanium 1649 188 3260 3591 345 0.161 1.65E7 5.05
Iron/Steel 1535 86.4 3000 2926 385 0.286 2.80E7 4.94
Copper 1083 88.0 2300 2061 100 0.322 1.70E7 3.63
Nickel 1438 129 2899 2677 370 0.298 3.0E7 5.01
Tungsten 3367 82.2 5899 1722 290 0.697 5.3E7 4.35
Tantalum 2996 68 5425 3591 123 0.599 2.7E7 3.35
Material Tm(Al) /Tm Hm(Al) /Hm Tv(Al) /Tv Hv(Al) /Hv H /H(Al) ρρρρ/ρρρρ(Al) C/C(Al) R
Mg AZ31B alloy 1.16 1.20 1.52 1.49 1.0 0.65 1.0 0.81
Tin 0.29 2.50 0.36 1.0 0.07 2.69 0.49 0.52
Lead 1.56 16.1 1.0 9.8 0.07 4.18 0.22 0.38
Cadmium 1.57 7.27 1.99 9.4 0.52 3.18 0.50 0.96
Aluminum alloy 1.0 1.0 1.0 1.0 1.0 1.0 1.0 1.0
Antimony 1.03 2.41 1.25 5.35 0.58 2.54 0.67 1.06
Titanium 0.49 0.91 0.59 1.0 4.73 1.64 1.01 1.90
Iron/Steel 0.52 1.97 0.63 1.23 5.27 2.92 0.98 2.56
Copper 0.69 1.93 0.81 1.74 1.37 3.29 0.72 1.58
Nickel 0.55 1.32 0.65 1.34 4.73 1.64 1.01 1.90
Tungsten 0.26 2.07 0.34 2.09 3.97 7.11 0.87 3.42
Tantalum 0.29 2.50 0.36 1.0 1.68 6.11 0.67 2.15
Cratering Equations [17]: Cratering equations for hypervelocity particles impacting monolithic
structures are given in Equations 3-9 through 3-10. These are applied to assessment of M/D impacts directly on monolithic, or single-layer systems [17]. They also can be applied to cratering and penetration of the rear wall by fragments in the debris cloud. Examining the equations, it is evident that thinner, lower-density bumpers will generate particles in the debris cloud that are less penetrating to the rear wall.
For ρp/ρt < 1.5,
P∞ = 5.24 d19/18 H-0.25 (ρp/ρt)0.5 (Vn/C)2/3 (3-9a)
For ρp/ρt ≥ 1.5,
P∞ = 5.24 d19/18 H-0.25 (ρp/ρt)2/3 (Vn/C)2/3 (3-9b)
For rear wall penetration calculations by bumper fragments of diameter, d, the “projectile” density ρp is the density of the bumper, and the minimum rear wall thickness to prevent perforation is given by the following equation,
tw = 1.8 P∞ (3-10a)

32
and to prevent detached spall:
tw = 2.2 P∞ (3-10b)
Although not used in the bumper materials evaluations, the maximum fragment diameter for aluminum bumpers is expected to be controlled by bumper thickness, dmax ≤ tb, and the velocity of the bumper fragments is related to impact velocity by:
Vbumper fragments = 0.8 Vn * exp (- tb/d) (3-11)
Aluminum Bumpers. The analyses of projectile breakup ability and bumper fragment size indicate aluminum is a reasonably good choice for a bumper material for M/D shields based on its material characteristics. However, the analyses indicate other materials, in particular ceramics, promise to improve the breakup of hypervelocity projectiles compared to conventional aluminum bumpers.
Analytical Evaluations of Rear Wall Materials. A comparative tool used to evaluate capacity of various rear wall materials to absorb debris cloud loads is based on the following formula:
Fc/Mw = σt_ult2 103 / (2 tw ρw E) = σt_ult
2 103 / (2 mw E) (3-12)
where Fc/Mw is the critical load per mass that the rear wall can absorb before failure (N/kg), σt_ult is the ultimate tensile stress for the material (MPa), mw is the rear wall areal density (g/cm2) and E is the elastic modulus (MPa).
This function assumes rear wall effectiveness depends on the ability of the material to absorb the mechanical energy of the impact. Assuming the various rear wall materials have linear stress-strain relationships to the ultimate stress (σt_ult) or strain (εf), the area under the strain-strain curve is proportional to the strain energy to failure of the material, i.e.,
Strain energy/volume = 0.5 σt_ult εf
Equation 3-12 results from substituting εf = σt_ult / E, and dividing by areal density of the material. Higher Fc/Mw values suggest rear wall materials that have the ability to absorb greater loading from the debris cloud before failing. As shown in Table 3-7, high-strength fabrics such as Kevlar and Spectra have material properties that should contribute to improve rear wall performance over high-strength aluminum alloys typically used in spacecraft (for example, Al 2219T87 and Al 7075T6).
Table 3-7. Rear Wall Material’s Ability to Absorb Mechanical Energy of Impact Calculated based on rear wall areal density of 7.5 kg/m2
Rank* Material Density (g/cm3)
Tensile strength
(MPa)
Strength/weight (MPa-m3/kg)
Elastic tensile modulus
(MPa)
Critical failure load per unit mass
rear wall (N/kg)
1 Kevlar 29 1.44 3620 2.51 82740 105580
2 Spectra 900 0.97 2620 2.70 117215 39045
3 Nextel 312 2.70 1724 0.64 151690 13059
4 Al 7075T6 2.80 524 0.19 71708 2553
5 Al 2219T87 2.85 462 0.16 73087 1947
6 Al 6061T6 2.71 310 0.11 68950 931
Results of Hypervelocity Impact Screening Tests. HVI tests were conducted to evaluate candidate shielding materials and configurations [39, 40, 45, 51]. The tests compared shield candidates to Whipple shields having the same overall areal density (i.e., mass per unit area) and standoff.
A first series of tests focused on bumper materials. Based on the analytical studies, a matrix of materials including ceramics, laminates, and fiber-reinforced composites were evaluated in an initial series of screening tests [45]. The tests were performed with equal areal density targets under the same
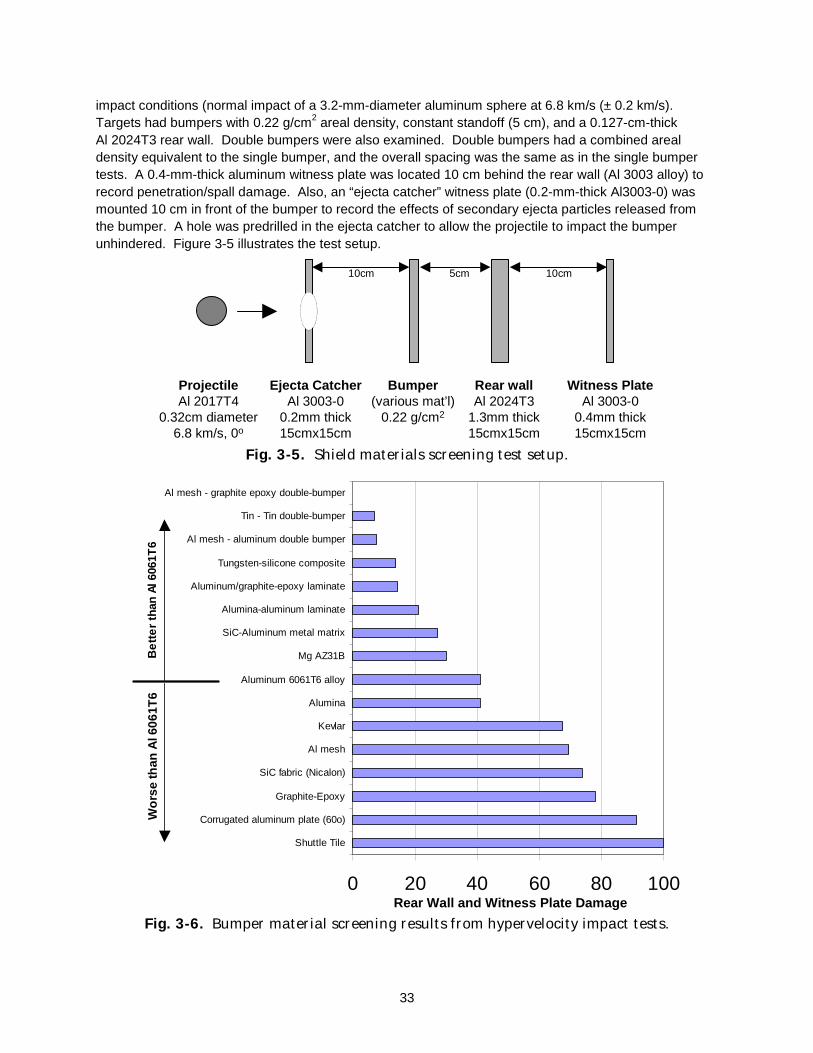
33
impact conditions (normal impact of a 3.2-mm-diameter aluminum sphere at 6.8 km/s (± 0.2 km/s). Targets had bumpers with 0.22 g/cm2 areal density, constant standoff (5 cm), and a 0.127-cm-thick Al 2024T3 rear wall. Double bumpers were also examined. Double bumpers had a combined areal density equivalent to the single bumper, and the overall spacing was the same as in the single bumper tests. A 0.4-mm-thick aluminum witness plate was located 10 cm behind the rear wall (Al 3003 alloy) to record penetration/spall damage. Also, an “ejecta catcher” witness plate (0.2-mm-thick Al3003-0) was mounted 10 cm in front of the bumper to record the effects of secondary ejecta particles released from the bumper. A hole was predrilled in the ejecta catcher to allow the projectile to impact the bumper unhindered. Figure 3-5 illustrates the test setup.
ProjectileAl 2017T4
0.32cm diameter6.8 km/s, 0o
Ejecta CatcherAl 3003-0
0.2mm thick15cmx15cm
10cm
Bumper(various mat’l)
0.22 g/cm2
Rear wallAl 2024T3
1.3mm thick15cmx15cm
Witness PlateAl 3003-0
0.4mm thick15cmx15cm
10cm5cm
Fig. 3-5. Shield materials screening test setup.
0 20 40 60 80 100
Shuttle Tile
Corrugated aluminum plate (60o)
Graphite-Epoxy
SiC fabric (Nicalon)
Al mesh
Kevlar
Alumina
Aluminum 6061T6 alloy
Mg AZ31B
SiC-Aluminum metal matrix
Alumina-aluminum laminate
Aluminum/graphite-epoxy laminate
Tungsten-silicone composite
Al mesh - aluminum double bumper
Tin - Tin double-bumper
Al mesh - graphite epoxy double-bumper
Be
tte
r th
an A
l 606
1T6
Wo
rse
than
Al 6
061T
6
Fig. 3-6. Bumper material screening results from hypervelocity impact tests.
Rear Wall and Witness Plate Damage

34
Figure 3-6 gives the rankings from the tests. Rankings were made in terms of a damage number (DN) derived from measurements of rear wall and witness plate damage. DN is an index that ranges from 0 to 100, with the lowest numbers indicating the better-performing bumpers. Total area of all holes in the back wall was given a 75% weighting factor in DN, while witness plate damage makes up the remaining 25%. Damage to the witness plate was used as a discriminator because the rear wall spalled in some tests but was not penetrated. Because spall can cause substantial damage to interior components of a spacecraft and represents a danger to crew for inhabited spacecraft, I felt it was important to include the effects of spall in the comparisons. More detailed data from the tests and data analyses are presented elsewhere [45, 51].
As shown in Figure 3-6, double-bumper shields, especially those containing aluminum mesh, were far superior to the baseline Whipple shield (single-aluminum bumper). Graphite-epoxy as an intermediate bumper was more effective than an equal areal density aluminum plate.
Tungsten microspheres imbedded in a silicone rubber matrix performed well. Tungsten provides high shock pressures in the projectile, but typically would be expected to produce high-density, damaging fragments if constructed in a solid plate. Using microspheres (2-4 micron diameter) solves this problem, since the tungsten in the debris cloud will already be in a finely divided state. Tungsten was 77 weight percent by weight with the remainder a silicone rubber (type VMQ) matrix and a light (0.012 g/cm2) Nomex cloth backing material.
Bumper materials performing somewhat better than Al 6061-T6 were laminates of aluminum (0.2 mm thick) bonded to graphite-epoxy (1.1 mm thick), and 0.38-thick alumina (Al2O3) bonded to aluminum (0.2 mm thick), and a ceramic metal-matrix composite containing 35 volume percent SiC whiskers in a Al 6061-T6 matrix. Bumper materials that were less successful than aluminum included non-reinforced alumina, SiC fabric (Nicalon), Kevlar cloth, graphite-epoxy, corrugated aluminum (60o corrugations) and a ceramic Shuttle tile (glass coating followed by low-density silica ceramic). Typical results from the baseline tests are shown in Figure 3-7. The rear wall was cracked and penetrated (2-mm x 3-mm hole, four through-cracks 4 mm to 7 mm long) with detached spall from a 1.3-mm-diameter area on back. The witness plate has numerous holes and deep dimples/craters. In comparison, the mesh/graphite-epoxy double-bumper target is shown in Figure 3-8. The rear wall is bulged, but not penetrated or spalled.
External Secondary Ejecta. Ejecta particles (Fig. 3-1) produced by HVI are capable of damaging other nearby structures [53]. The “ejecta catcher” used in the screening tests (Fig. 3-5) registered characteristics of ejecta from various shielding materials. As shown in Figure 3-9, an impact on an aluminum bumper produced many, relatively large holes, while the SiC/Al metal matrix composite produced more craters and smaller holes. The particle sizes in the ejecta were estimated from the crater and hole sizes, and the ejecta impact velocity, which was measured from ultra-high-speed camera film. A Cordin shadowgraph camera captured 80 frames of the impact process for each test, with 1 microsecond between frames [3, 54]. Table 3-8 provides data on ejecta characteristics from the various bumper materials based on velocity data obtained from the high-speed camera and visual observations.
Almost no ejecta of any significance (only faint dust) were observed from the tests on aluminum mesh and Kevlar. The ejecta expansion velocity was very low as well from these materials. Also, I observed very little damage on the ejecta catcher from the alumina/aluminum laminate bumper (no holes, only tiny marks). It appears that mesh and ceramics will not typically produce damaging ejecta because HVIs result in small particle size and low velocity from these materials.
Ejecta Risk Reduction. Test data indicate that selecting appropriate shielding materials or surface treatments could substantially decrease or potentially eliminate secondary impact damage from ejecta. For example, an outer fiberglass cloth layer, or ceramic fabric or aluminum mesh layers will result in minimal secondary ejecta production as indicated in HVI tests.

35
Bumper Rear Wall Witness
Fig. 3-7a. FRONT VIEW: Response of baseline aluminum shield to a 3.2-mm-diameter aluminum projectile, 6.8 km/s, normal impact.
Shield comprises 0.8-mm-thick Al 6061T6 bumper (L), 5-cm gap, 1.27-mm-thick Al2024T3 rear wall (C), 0.58-g/cm2 areal density for bumper and rear wall, 0.4-mm-thick witness plate (R). All shield and witness plates were perforated.
Bumper Rear Wall Witness
Fig. 3-7b. BACK: Response of baseline aluminum shield to a 3.2-mm-diameter aluminum projectile, 6.8 km/s, normal impact.
Shield comprises 0.8-mm-thick Al 6061T6 bumper (L), 5-cm gap, 1.27-mm-thick Al2024T3 rear wall (C), 0.58-g/cm2 areal density for bumper and rear wall, 0.4-mm-thick witness plate (R). All shield and witness plates were perforated. Bumper 2nd Bumper Rear Wall
Fig. 3-8. FRONT VIEW: Mesh double-bumper shield results after impact by 3.2-mm-diameter aluminum sphere at 6.8 km/s, normal impact.
No penetration or spall resulted to the rear wall. No damage occurred to the witness plate (not pictured).
front
5cm
Back
5cm
Front
5cm

36
Table 3-8. Secondary Ejecta Characteristics for Various Bumper Materials Data from HVI of 0.32 cm Al projectile at 6.8 km/s, normal impact, on 0.22g/cm2 bumpers
Rank* Bumper Material Ejecta Maximum Velocity (km/s) Damage to Ejecta Catcher
1 Aluminum mesh 2.1 No holes
2 Kevlar 2.4 No holes
3 Alumina/aluminum laminate 4.2 No holes, small scratches
4 Aluminum/graphite-epoxy laminate 3.9 A few holes (<20)
5 SiC-aluminum metal matrix composite 5.2 130 small holes (0.46 mm max hole dia.), estimate largest secondary particle size is 0.2 mm
6 Aluminum 6061T6 alloy 6.7 Many holes > 1 mm diameter
* Rank based on damage to ejecta catcher; highest rank (#1) bumper material results in secondary ejecta causing the least amount of damage to ejecta catcher.
3.3 Enhanced Shield Development From initial screening tests and analytical work, three types of shields have been developed to
improve spacecraft M/D protection (i.e., reduce weight and increase PNP): (1) mesh double-bumper (MDB), (2) multi-shock, and (3) Nextel/Kevlar stuffed Whipple.
Mesh Double-Bumper Shields. The results from the analytical models and screening tests led to further development of the MDB shield [40, 45]. The MDB shield (Fig. 3-9) comprises four components: a mesh bumper, a second continuous bumper, a high-strength fabric intermediate layer, and a rear wall. The mesh provides an efficient method to breakup projectiles. Due to the overlap of the wires, it provides the same breakup capability as a thicker continuous bumper. HVI tests demonstrated that the debris cloud after impact on a wire mesh is greater than an equivalent areal density solid aluminum bumper [40]. The mesh in the screening tests [45] was composed of 0.3-mm-diameter aluminum 5056 wires in a square pattern, 30 by 30 wires every 2.5 cm by 2.5 cm, 0.56 mm gap between wires, with a 0.051 g/cm2 areal density. Bumper fragments from mesh bumpers are smaller and less damaging to the rear wall due to the small wire diameter.
Θ
Projectile:Diameter, dVelocity, VImpact angle, Θ
Mesh• disrupt projectile• spread debris cloud• reduce secondary ejecta• no contribution of fragments to debris cloudSecond bumper
• disrupt fragments• melt/vaporize fragments
Rear Wall• Resist impulsive load
• Resist fragment penetration
High-Strength Fabric Layer• decrease debris cloud expansion• stop residual fragmentsS3 = 4 d
S1 = 4 d
S (overall standoff)
Fig. 3-9. Mesh double-bumper shield.

37
The purpose of the second bumper is to produce a second shock in the projectile fragments remaining after impact with the first bumper. This increases the thermal state of the particles, melting or further pulverizing them. This was evident both in the experimental impact results (far more melt on the rear wall of the mesh double-bumper tests) and from computational results [40, 55].
Kevlar or Spectra high-strength fabrics are used in the intermediate layer. From analytical studies discussed earlier, these fabrics work well to slow fragments and debris cloud expansion lower in the shield (near or at the rear wall), but are not effective as an outer bumper to break up hypervelocity aluminum projectiles.
The MDB shield was modified and used to protect areas of ISS. In particular, steel mesh is used to protect parts of the Russian manufactured modules, such as the FGB Module (“Zarya”) [56]. Equations 3-13 through 3-16 are used for sizing the MDB elements. Equations 3-17 through 3-19 are MDB BLEs used in the BUMPER code (section 2).
Shield Sizing Equations [40]. The mesh areal density is given by:
mmesh =cm d ρp (3-13) where cm= 0.04. The mesh has wires in a square pattern with a wire diameter to projectile diameter ratio of from 0.07 to 0.1. The first to second bumper spacing is four times the projectile diameter: S1 = 4d.
The second bumper is a continuous aluminum sheet that is sized by the following equation:
m2 = 0.093 d ρp (3-14)
A high-strength fabric intermediate layer (for example: Spectra or Kevlar) is mounted a distance S3 = 4d in front of the rear wall. For Spectra or Kevlar, the intermediate layer areal density is:
mK = 0.064 d ρp (3-15a)
If Nextel ceramic cloth is used for the intermediate layer, the areal density is:
mI = 0.095 d ρp (3-15b)
The rear wall area density to prevent perforation and detached spall is determined by:
mw = cw M Vn S-3/2 (40/σ)0.5 (3-16)
where cw = 9 {cm-1/2 km-1 s}. Equations 3-13 through 3-16 are applied when impact velocity component (V cos1/3θ) is greater than 6.4 km/s. The equations are valid for all impact angles.
Performance Equations [40]. For V ≥ 6.4 cos-1/3θ,
dc = 0.6 (tw ρw)1/3ρp-1/3 (V cosθ)-1/3 S1/2 (σ/40)1/6 (3-17)
For 2.8cos-0.5θ < V < 6.4cos-1/3θ,
dc = 1.11 ρp-0.5 (tw (σ/40)0.5 + 0.37 (mb + mK)) cos-4/3θ
(6.4cos-1/3θ - V)/(6.4cos-1/3θ - 2.8cos-0.5θ)
+ 0.323 (tw ρw)1/3 ρp-1/3 cos-2/9θ S0.5 (σ/40)1/6
(V - 2.8cos-0.5θ)/(6.4cos-1/3θ - 2.8cos-0.5θ) (3-18)
For V ≤ 2.8 cos-0.5θ,

38
dc = 2.2 (tw (σ/40)0.5 + 0.37 (mb+ mK)) cos-5/3θ ρp-0.5 V-2/3 (3-19)
where mb = m1 + m2.
Multi-Shock Shields Using Ceramic Fabric Bumpers. The bumper materials evaluations indicated that ceramics produce a higher shock pressure in the projectile than conventional aluminum bumpers, which translates into better projectile breakup.
A ceramic used in HVI shielding is Nextel, a ceramic fabric of polycrystalline metal oxide fibers [39]. Ceramic fabrics have been applied in spacecraft shielding instead of monolithic ceramic plates because fabrics are more damage tolerant. The damage to ceramic fabrics is approximately the same as an equivalent weight aluminum plate. But ceramics shock metal impactors to a greater extent than aluminum, which improves shield performance. The fibers from ceramic fabrics are small and non-damaging to the rear wall, and they generate very little damaging secondary ejecta particles. Monolithic ceramics tend to disintegrate upon impact [45].
As was determined by HVI screening tests [39, 45, 51], multiple bumpers are more successful at M/D protection because they provide greater breakup of HVI projectiles than equivalent-weight single bumpers. The MS shield originated by Cour-Palais and Crews is illustrated in Figure 3-10.
Projectile:Diameter, dVelocity, VImpact angle, Θ
Θ
Rear Wall• Resist impulsive load
• Resist fragment penetration
Ceramic Fabric (NextelTM) Bumpers (4)• disrupt projectile• melt/vaporize projectile fragments• slow expansion of debris cloud• reduce secondary ejecta• no contribution of fragments to debris cloud
S1 = 8 d (optimum)
S (overall standoff)
S2 = 8 d
S3 = 8 d
S4 = 8 d
Fig. 3-10. Multi-shock shield concept [1].
Weight Advantages for MDB and MS Shielding. As indicated in Table 3-9, test data demonstrate there are clear weight advantages with enhanced shielding (Mesh Double-Bumper and multi-shock) when standoffs are relatively large (30 times projectile diameter).
However for ISS, Whipple shielding is not adequate (too heavy and/or will not meet PNP requirements) and there is often not enough standoff for MS/MDB shields to be suitable (i.e., S is often < 15d). Low-weight, higher-performance shielding is needed when standoffs are short (i.e., S ≤ 15d). The stuffed Whipple shield is the solution for this situation.
Multi-Shock Shield with Nextel Ceramic Bumpers
(double-aluminized Mylar added to top layer)
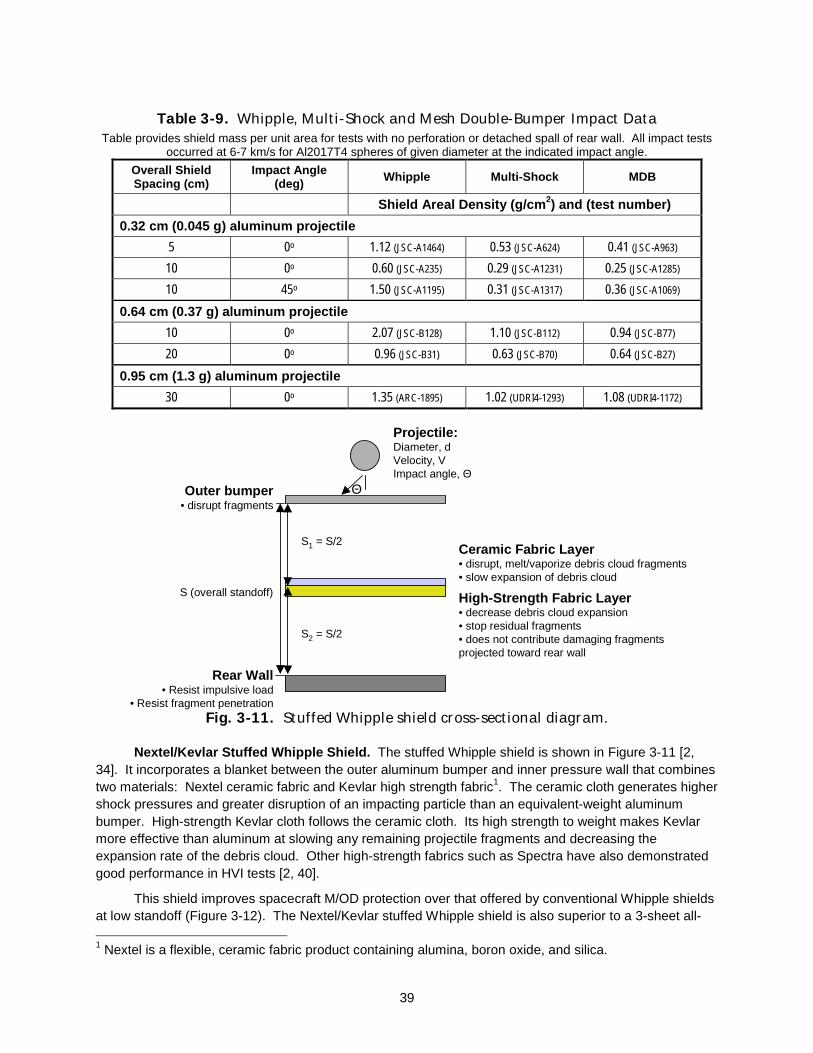
39
Table 3-9. Whipple, Multi-Shock and Mesh Double-Bumper Impact Data
Table provides shield mass per unit area for tests with no perforation or detached spall of rear wall. All impact tests occurred at 6-7 km/s for Al2017T4 spheres of given diameter at the indicated impact angle.
Overall Shield Spacing (cm)
Impact Angle (deg) Whipple Multi-Shock MDB
Shield Areal Density (g/cm2) and (test number)
0.32 cm (0.045 g) aluminum projectile
5 0o 1.12 (JSC-A1464) 0.53 (JSC-A624) 0.41 (JSC-A963)
10 0o 0.60 (JSC-A235) 0.29 (JSC-A1231) 0.25 (JSC-A1285)
10 45o 1.50 (JSC-A1195) 0.31 (JSC-A1317) 0.36 (JSC-A1069)
0.64 cm (0.37 g) aluminum projectile
10 0o 2.07 (JSC-B128) 1.10 (JSC-B112) 0.94 (JSC-B77)
20 0o 0.96 (JSC-B31) 0.63 (JSC-B70) 0.64 (JSC-B27)
0.95 cm (1.3 g) aluminum projectile
30 0o 1.35 (ARC-1895) 1.02 (UDRI4-1293) 1.08 (UDRI4-1172)
Projectile:Diameter, dVelocity, VImpact angle, Θ
Θ
Rear Wall• Resist impulsive load
• Resist fragment penetration
S (overall standoff) High-Strength Fabric Layer• decrease debris cloud expansion• stop residual fragments• does not contribute damaging fragments projected toward rear wall
S2 = S/2
S1 = S/2Ceramic Fabric Layer• disrupt, melt/vaporize debris cloud fragments• slow expansion of debris cloud
Outer bumper• disrupt fragments
Fig. 3-11. Stuffed Whipple shield cross-sectional diagram.
Nextel/Kevlar Stuffed Whipple Shield. The stuffed Whipple shield is shown in Figure 3-11 [2, 34]. It incorporates a blanket between the outer aluminum bumper and inner pressure wall that combines two materials: Nextel ceramic fabric and Kevlar high strength fabric1. The ceramic cloth generates higher shock pressures and greater disruption of an impacting particle than an equivalent-weight aluminum bumper. High-strength Kevlar cloth follows the ceramic cloth. Its high strength to weight makes Kevlar more effective than aluminum at slowing any remaining projectile fragments and decreasing the expansion rate of the debris cloud. Other high-strength fabrics such as Spectra have also demonstrated good performance in HVI tests [2, 40].
This shield improves spacecraft M/OD protection over that offered by conventional Whipple shields at low standoff (Figure 3-12). The Nextel/Kevlar stuffed Whipple shield is also superior to a 3-sheet all- 1 Nextel is a flexible, ceramic fabric product containing alumina, boron oxide, and silica.
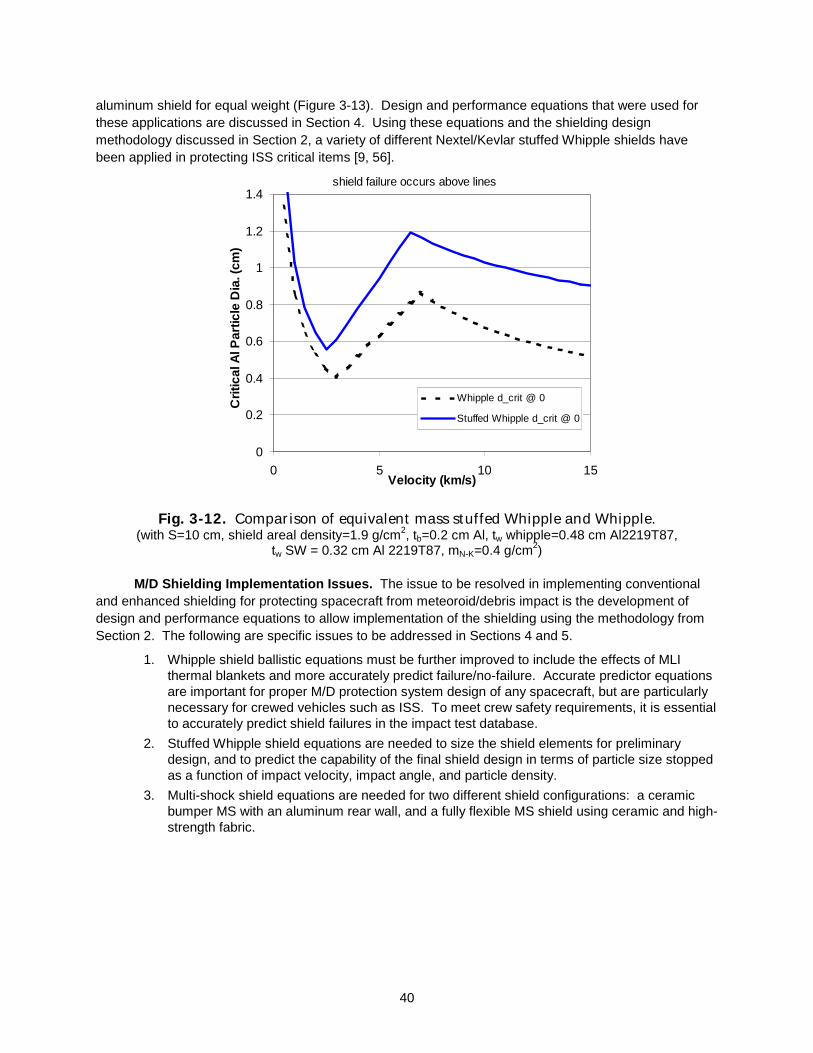
40
aluminum shield for equal weight (Figure 3-13). Design and performance equations that were used for these applications are discussed in Section 4. Using these equations and the shielding design methodology discussed in Section 2, a variety of different Nextel/Kevlar stuffed Whipple shields have been applied in protecting ISS critical items [9, 56].
Fig. 3-12. Comparison of equivalent mass stuffed Whipple and Whipple.
(with S=10 cm, shield areal density=1.9 g/cm2, tb=0.2 cm Al, tw whipple=0.48 cm Al2219T87, tw SW = 0.32 cm Al 2219T87, mN-K=0.4 g/cm2)
M/D Shielding Implementation Issues. The issue to be resolved in implementing conventional and enhanced shielding for protecting spacecraft from meteoroid/debris impact is the development of design and performance equations to allow implementation of the shielding using the methodology from Section 2. The following are specific issues to be addressed in Sections 4 and 5.
1. Whipple shield ballistic equations must be further improved to include the effects of MLI thermal blankets and more accurately predict failure/no-failure. Accurate predictor equations are important for proper M/D protection system design of any spacecraft, but are particularly necessary for crewed vehicles such as ISS. To meet crew safety requirements, it is essential to accurately predict shield failures in the impact test database.
2. Stuffed Whipple shield equations are needed to size the shield elements for preliminary design, and to predict the capability of the final shield design in terms of particle size stopped as a function of impact velocity, impact angle, and particle density.
3. Multi-shock shield equations are needed for two different shield configurations: a ceramic bumper MS with an aluminum rear wall, and a fully flexible MS shield using ceramic and high-strength fabric.
shield failure occurs above lines
0
0.2
0.4
0.6
0.8
1
1.2
1.4
0 5 10 15Velocity (km/s)
Cri
tical
Al P
artic
le D
ia. (
cm)
Whipple d_crit @ 0
Stuffed Whipple d_crit @ 0
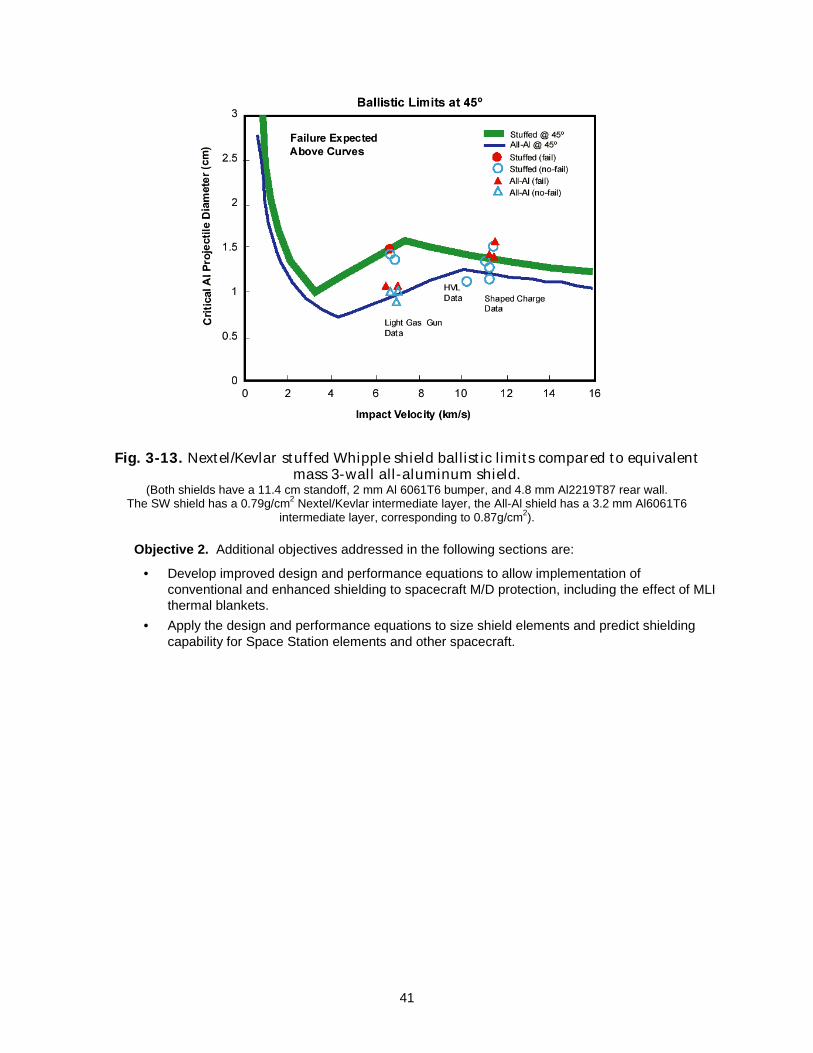
41
Fig. 3-13. Nextel/Kevlar stuffed Whipple shield ballistic limits compared to equivalent mass 3-wall all-aluminum shield.
(Both shields have a 11.4 cm standoff, 2 mm Al 6061T6 bumper, and 4.8 mm Al2219T87 rear wall. The SW shield has a 0.79g/cm2 Nextel/Kevlar intermediate layer, the All-Al shield has a 3.2 mm Al6061T6
intermediate layer, corresponding to 0.87g/cm2).
Objective 2. Additional objectives addressed in the following sections are:
• Develop improved design and performance equations to allow implementation of conventional and enhanced shielding to spacecraft M/D protection, including the effect of MLI thermal blankets.
• Apply the design and performance equations to size shield elements and predict shielding capability for Space Station elements and other spacecraft.

42
SECTION 4
BALLISTIC LIMIT EQUATIONS FOR SPACECRAFT METEOROID/DEBRIS SHIELDING
Based on previous work described in Section 3, it was shown that improved BLEs must be developed for the Whipple shield and enhanced shielding.
This section provides BLEs characterizing the performance of meteoroid/debris shields given in Figure 4-1. These include Whipple, Nextel/Kevlar stuffed Whipple, and multi-shock shields. Whipple shields have 2 layers: an outer “bumper” and inner “rear wall” with a “standoff” or gap between the two. A SW shield has a blanket of Nextel ceramic cloth and Kevlar ballistic protection fabric between the bumper and rear wall. MS shields have multiple bumpers (4 typically) followed by a rear wall.
The BLEs are of two general types:
1. Design equations used to size the shielding elements for a particular threat particle and impact conditions, and
2. Performance equations used to define the particle size on the ballistic limit of a particular shield as a function of impact conditions (impact velocity, particle density, impact angle, particle shape).
These equations have been applied to development and verification of M/D shielding for ISS as will be seen in Section 5.
Fig. 4-1. Meteoroid/debris shield types.
4.1 Ballistic Limit Equation Formulation The BLEs presented here are semi-empirical equations; that is, they have been developed from
HVI tests and analysis. For the BLEs presented here, the impacting particle is assumed to be spherical and homogenous. Although some experimental and theoretical work has been performed to evaluate shield performance from threats by non-spherical and composite impactors, the effects are complex and require additional study.
Al bumper
Al rear wall
stand
off
WHIPPLE
Al bumper
Al rear wall
stand
off
Nextel/KevlarStuffed Whipple
Nextel bumpers
Kevlar rear wall
stand
off
FlexibleMulti-Shock
Nextel ceramic cloth
Kevlar fabric

43
Hypervelocity Impact Test Facilities. The test data for developing the BLEs were obtained at a number of NASA and non-NASA impact facilities. Two-stage LGG were used to provide test data in the 2 km/s to 7 km/s range. LGG ranges at NASA JSC, NASA Ames Research Center, NASA Marshal Space Flight Center, and University of Dayton Research Institute were used to perform HVI tests on shielding. LGG launcher bore diameters range from 1.7 mm to 25.4 mm. The 12.7 mm LGG at the NASA JSC White Sands Test Facility is shown in Fig. 2-4. In addition, HVI test data have been obtained on the shields described in this study up to 12 km/s using the ISCL at Southwest Research Institute and the hypervelocity launcher at Sandia National Laboratories.
Failure Criteria. “Failure” of the shield is defined as either complete penetration (i.e., perforation) or detached spall from the back of the shield’s rear wall. In the case of ISS, the crew module's pressure shell is considered the rear wall and a part of the shield. A detached spall failure would result in release of hot, fast fragments within the crew cabin. The potential to endanger the crew is the reason that detached spall has been considered a shield failure, even though pressure losses would not occur in this situation (i.e., no complete penetration as in Damage Class C3, Fig. 4-2). Fig. 4-2 provides cross-sectional diagrams of typical failure modes for rear walls after Cour-Palais and Dahl [61]. Generally, Whipple shields exhibit detached spall failures combined with or instead of perforation failure. Detached spall failures do not generally occur with Nextel/Kevlar stuffed Whipple and multi-shock shields.
Damage Class C3: Detached Spall Damage Class C4: Perforation
Fig. 4-2. Typical rear wall failure modes after Cour-Palais and Dahl [61].
Impact Physics. Fig. 4-3 illustrates a typical ballistic limit curve for a Whipple shield for normal impact by an aluminum sphere. The Whipple shield ballistic limit is compared to a monolithic, single aluminum plate of same mass as the combined Whipple shield’s bumper and rear wall. Protection capabilities are defined for three penetration regimes based on normal component velocity for an aluminum impact on a Whipple shield. Important shield physical and material properties vary as a function of impact velocity. Important properties that influence ballistic limits of the shield are included in the BLEs.
A key factor governing the performance of spaced shields is the “state” of the debris cloud projected from the bumper toward the rear wall. The debris cloud may contain solid, liquid, or vaporized projectile and bumper materials, or a combination of the three states, depending on the initial impact pressure. Solid fragments in the debris cloud are generally more penetrating when they contact the rear wall than liquid or vapor particles. The pressures generated in the projectile and bumper at impact, and the resulting state of the material after release from compression, are a function of a number of variables, including projectile velocity, impact obliquity angle, projectile and shield thickness and material properties. Blast loading in the rear wall is a function of shield standoff.
Deforming Projectile Regime. As indicated in Fig. 4-3, at low impact velocities, below Vn of 3 km/s, Whipple shield performance is less effective because impact shock pressures are low and the projectile remains essentially intact after bumper impact. A deformed but substantially intact projectile then impacts the shield’s rear wall. The projectile is more damaging as velocity increases in the low velocity regime.
Projectile Fragmentation Regime. As velocities increase from 3 km/s to 7 km/s, the projectile fragments to a larger extent upon impact on the bumper and will begin to melt above Vn of 5.5 km/s for aluminum on aluminum impacts. An aluminum projectile begins to melt when shocked to impact

44
pressures of 0.65Mb, which is generated by normal impact at 5.5 km/s [57]. Damage to the rear wall decreases as the projectile is fragmented and partially melted. Thus, the protection capability of the shield, in terms of the “critical particle size” on the failure threshold of the shield, increases with velocity in the intermediate velocity regime.
0
0.1
0.2
0.3
0.4
0.5
0.6
0.7
0.8
0 2 4 6 8 10 12 14Velocity (km/s)
Crit
ical
Al D
iam
eter
(cm
)
Whipple dcrit @ 0 deg
monoli thic dcrit @ 0 deg
Ballistic RegimeFragmentation &
Partial Melt Regime Complete Melt RegimeVelocity Range:
State of Debris Cloud:(for Al on Al impacts)
Few solid fragments
Many (increasing with velocity) solid fragments & liquid
droplets
Fine droplets, few solid fragments, some vapor
Important Shield & Material Properties:
Strength Bumper : strength, density, EOS, thermal
characteristicsStandoff
Rear Wall Strength
Bumper density, EOSStandoff
Rear Wall Strength
Ballistic Limit Improvement due to Shield Standoff
∆∆∆∆ dCrit
“failure” occurs above curves
Fig. 4-3. Ballistic limits for equal mass monolithic target and Whipple shield.
Failure criterion is threshold perforation or detached spall from rear wall. Monolithic target is 0.44-cm-thick Al 6061T6. Whipple shield consists of 0.12-cm-thick Al 6061T6 bumper followed at
10-cm- by 0.32-cm-thick Al 6061T6 rear wall.
Projectile Melt/Vaporization Regime. At high velocities of Vn > 7 km/s, the debris cloud impacting the rear wall will contain various fractions of solid, liquid and vapor components of the projectile and bumper depending on impact conditions (bumper thickness, density, projectile diameter, density, shape, impact obliquity, etc.). Table 4-1 provides a summary of CALE hydrocode calculations on the fraction of projectile in either solid or liquid states as a function of velocity and other impact conditions [55, 59] (CALE is a two-dimensional arbitrary Lagrangian Eulerian material dynamics computer program). A significant conclusion from the results of these calculations is that for impacts at and above 8 km/s, there is a significant fraction of projectile material that does not reach complete melt state.

45
As explained in Section 3, a constant kinetic energy scaling law forms the basis of scaling to velocities beyond 7 km/s for Whipple shields, near the upper limit of two-stage LGG capability. As such, the critical particle diameter decreases with increasing velocity in the high velocity regime. The ballistic limit curve continues in the downward trend through the theoretical limits [57] for incipient vaporization (10 km/s for Al on Al impacts) and complete vaporization (24 km/s) because the expansion rate of the debris cloud with remaining particulates increases and loads the rear wall to a greater extent. As discussed in Section 3, and as indicated in hydrocode calculations, the theoretical velocity limits derived from 1-dimensional models cannot be assumed to correctly predict phase transformations for all material in the debris cloud when considering projectile shape effects, projectile size/obliquity, and 3-dimensional effects.
Table 4-1. Summary of CALE Hydrocode Calculations of Projectile Solid/Liquid Fraction
in the Debris Cloud as a Function of Velocity (V) and Bumper Thickness to Projectile Diameter Ratio (tb/d) [55,59]
For normal impacts of aluminum projectiles into aluminum plates Fraction of Projectile in debris cloud that is completely melted
tb/d V=6 km/s V=8 km/s V=10 km/s V=12 km/s V=14 km/s
0.05 0.05 0.15 0.31 0.42 0.55
0.1 0.05 0.28 0.55 0.75 0.89
0.2 0.06 0.29 0.75 0.97 0.99
0.3 0.06 0.31 0.77
0.5 0.06 0.32 0.82
0.8 0.06 0.95
4.2 Whipple Shield Ballistic Limit Equations Two sets of BLEs have been developed for the Whipple shield. First are Design Equations (4-1
through 4-3) used to size the Whipple shield elements (bumper thickness, rear wall thickness and materials) for a particular shield standoff (i.e., gap from bumper to rear wall) and threat particle (i.e., diameter, density, velocity, and impact angle). These are particularly useful when initially determining shield parameters to meet a particular design requirement. You would then perform more detailed analyses using the Performance Equations and BUMPER code to verify requirements have been met. The verification steps can include additional HVI tests to confirm BLEs and to provide data to update the BLEs for the particular shield configuration.
Design Equations. The Whipple shield consists of a front bumper at a standoff distance, S, from a rear wall. Bumper and rear wall thickness to defeat a given threat particle are determined by the following equations (assuming Vn≥7 km/s).
tb = cb mp / ρb = cb d ρp / ρb (4-1)
tw = cw d0.5 M1/3 (ρp ρb)1/6 ρw
-1 (V cosθ) S-3/4 σ’h-1/2 (4-2)
where cb = 0.25 when S/d<30, cb = 0.20 when S/d≥30, and cw=0.79 {cm-3/4 sec g1/3 km-1}. Normalized yield stress (unitless) σ’h = (σ/70ksi).
The ballistic limit criterion is no perforation or spall of the rear wall. Bumper fragments become the primary source of rear wall damage at impact angles greater than 65o. Therefore, for oblique angles over 65o, the calculated rear wall thickness should be constrained to 65o.
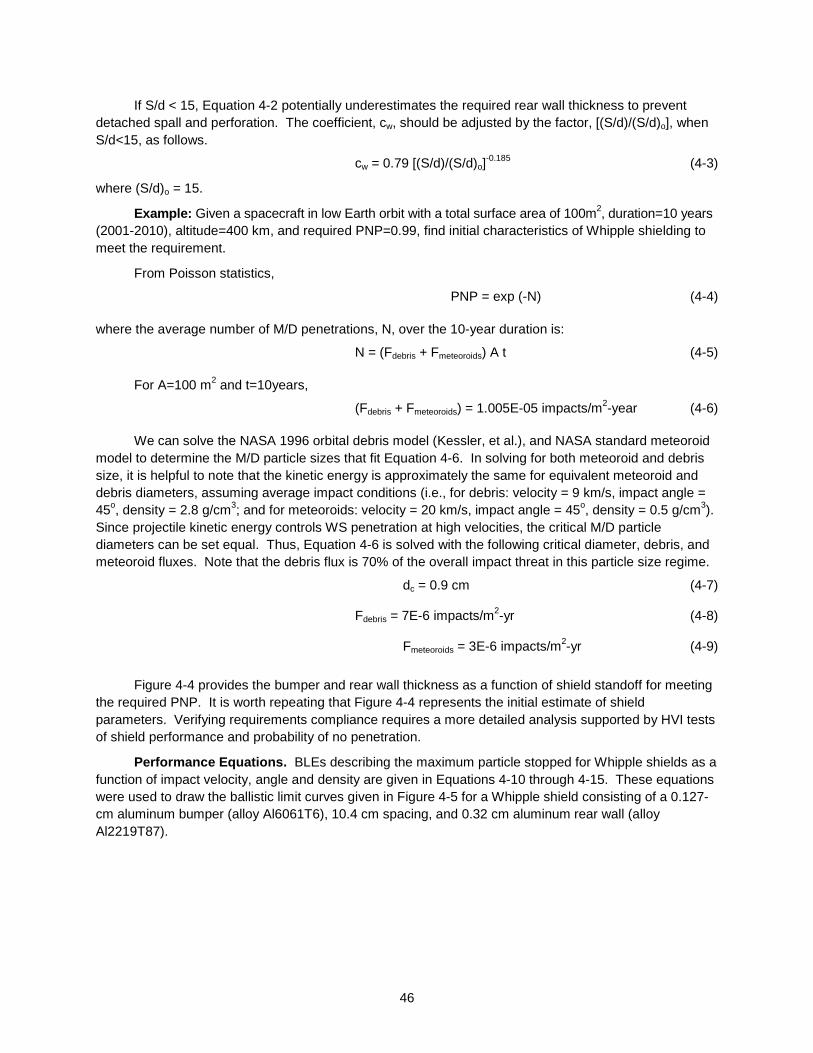
46
If S/d < 15, Equation 4-2 potentially underestimates the required rear wall thickness to prevent detached spall and perforation. The coefficient, cw, should be adjusted by the factor, [(S/d)/(S/d)o], when S/d<15, as follows.
cw = 0.79 [(S/d)/(S/d)o]-0.185 (4-3)
where (S/d)o = 15.
Example: Given a spacecraft in low Earth orbit with a total surface area of 100m2, duration=10 years (2001-2010), altitude=400 km, and required PNP=0.99, find initial characteristics of Whipple shielding to meet the requirement.
From Poisson statistics,
PNP = exp (-N) (4-4) where the average number of M/D penetrations, N, over the 10-year duration is:
N = (Fdebris + Fmeteoroids) A t (4-5)
For A=100 m2 and t=10years,
(Fdebris + Fmeteoroids) = 1.005E-05 impacts/m2-year (4-6)
We can solve the NASA 1996 orbital debris model (Kessler, et al.), and NASA standard meteoroid model to determine the M/D particle sizes that fit Equation 4-6. In solving for both meteoroid and debris size, it is helpful to note that the kinetic energy is approximately the same for equivalent meteoroid and debris diameters, assuming average impact conditions (i.e., for debris: velocity = 9 km/s, impact angle = 45o, density = 2.8 g/cm3; and for meteoroids: velocity = 20 km/s, impact angle = 45o, density = 0.5 g/cm3). Since projectile kinetic energy controls WS penetration at high velocities, the critical M/D particle diameters can be set equal. Thus, Equation 4-6 is solved with the following critical diameter, debris, and meteoroid fluxes. Note that the debris flux is 70% of the overall impact threat in this particle size regime.
dc = 0.9 cm (4-7)
Fdebris = 7E-6 impacts/m2-yr (4-8)
Fmeteoroids = 3E-6 impacts/m2-yr (4-9)
Figure 4-4 provides the bumper and rear wall thickness as a function of shield standoff for meeting
the required PNP. It is worth repeating that Figure 4-4 represents the initial estimate of shield parameters. Verifying requirements compliance requires a more detailed analysis supported by HVI tests of shield performance and probability of no penetration.
Performance Equations. BLEs describing the maximum particle stopped for Whipple shields as a function of impact velocity, angle and density are given in Equations 4-10 through 4-15. These equations were used to draw the ballistic limit curves given in Figure 4-5 for a Whipple shield consisting of a 0.127-cm aluminum bumper (alloy Al6061T6), 10.4 cm spacing, and 0.32 cm aluminum rear wall (alloy Al2219T87).

47
00.20.40.60.8
11.21.41.61.8
2
0 10 20 30
Standoff (cm)
Thic
knes
s (c
m)
bumper thickness (cm)
rear wall thickness (cm)
Fig. 4-4. Bumper and rear wall thickness required to prevent perforation and detached spall from rear wall for a 100-m2 spacecraft with a PNP=0.99 for 10 years in 400-km-
altitude orbit. Assumes Al 6061T6 bumper and rear wall.
Fig. 4-5. Ballistic limits for a Whipple shield with a 0.127-cm Al6061T6 bumper, 10.7-cm
standoff, 0.32-cm Al 2219T87 rear wall.
0
0.1
0.2
0.3
0.4
0.5
0.6
0.7
0.8
0.9
1
0 2 4 6 8 10 12 14Velocity (km/s)
Cri
tica
l A
l P
art
icle
Dia
. (c
m)
d_crit @ 0d_crit @ 45d_crit @ 60data @ 0data @ 45data @ 30
Shield failure (perforation or detached spall of rear wall) predicted to occur above lines. Open data points = no failure, Closed = fail.

48
0.2cm Al
MLI
0.48cm Al2219T87
10.7cm
solid data points ind ica te fai lure, open no-failure
0
0.1
0.2
0.3
0.4
0.5
0.6
0.7
0.8
0.9
1
0 5 10 15
Cri
tica
l A
l Pa
rtic
le D
ia (
cmPredic ted BL wit h ML I @ 0 deg
Pred . BL w /ou t MLI @ 0 d eg
Data wit h ML I @ 0 deg
Fig. 4-6. Predicted ballistic limits for Whipple Shield with and without MLI. This shield is used on portions of the U.S. Laboratory Module on Space Station.
High-Velocity: when V ≥ VH/(cosθ),
dc = kh ρp-1/3 (V cosθ)-2/3 ρb
-1/9 S1/2 (tw ρw)2/3 σ’h1/3 + ∆MLI (4-10)
where VH = 7 km/s, kh = 1.35 unless tb/(tw
2/3 S1/2) < 0.126, then kh = 7.451 tb/(tw2/3 S1/3) + 0.411. The units
on kh are {cm1/2 km2/3 g-2/9 s-2/3}. Also, normalized yield stress (unitless) σ’h = (σ/70ksi).
The effect of MLI on the critical particle size is given by ∆MLI (cm). MLI is more effective in raising critical particle size the closer it is to the rear wall (SMLI is the distance from the bumper to the MLI). The delta critical particle size due to MLI is found from the following equation where mMLI is the areal density of the MLI (g/cm2) and kMLI =1.4 cm2:
∆MLI = kMLI mMLI (SMLI/S)1/2 (4-11)
Intermediate-Velocity: when VL/(cosθ)1.5 < V < VH/(cosθ),
dc = [khi ρp-1/3 ρb
-1/9 S1/2 (tw ρw)2/3 σ’h1/3 + ∆MLI ]
[V – VL(cosθ)-1.5] / [VH(cos θ)-1 - VL(cosθ)-1.5]
+ kli (tw σ’L0.5 + CL tb ρb) ρp
-0.5 (cosθ)(-5/6)
[VH(cosθ)-1 - V] / [VH(cos θ)-1 - VL(cosθ)-1.5] (4-12)
where VL = 3 km/s with no MLI present and VL = 2 km/s when MLI is present,
khi {cm1/2 g-2/9} = VH-2/3 kh (4-13)
kli {g
0.5 cm-3/2} = VL-2/3 kl (4-14)
CL=0.37 cm3/g, and normalized yield stress (unitless) σ’L = (σ / 40ksi).
Low-Velocity: when V ≤ VL/(cosθ)1.5,
dc = kl (tw σ’L0.5 + CL tb ρb) (cosθ)-11/6 ρp
-0.5 V-2/3 (4-15)
Graphic on left shows shield with MLI, ballistic limit curves on right shows effect of MLI on 0o ballistic limits.

49
where kl = 1.9 {g0.5 km2/3 cm-3/2 s-2/3}. There is an impact angle cutoff for oblique impacts above 65o to account for the increased damage to the rear wall from bumper fragments at extreme impact angles, i.e., dc (θ>65o) = dc (θ=65o).
Figure 4-7 illustrates the ability of the generalized equations to predict the ballistic limit particle size for about 200 tests in the JSC Whipple shield database (Appendix C). The database varies over a large range of impact velocities and target parameters. The projectiles in these tests varied from 0.02 cm diameter to 1.9 cm diameter, impact velocities from 2 km/s to over 8 km/s, and impact angles from normal (0o) to the surface to 75o. Most of the tests used aluminum spherical impacts although copper, steel, and nylon projectiles are also represented in the database. The Whipple shields varied in this database from bumper thickness to projectile diameter (tb/d) ratios of less than 0.05 to over 1.0, and S/d (shield spacing to projectile diameter ratio) from 3 to over 140. The targets in these tests did not contain MLI thermal blankets. Figure 4-7 provides the ratio of test projectile diameter to the predicted particle size using the Whipple performance BLEs, as a function of normal component velocity of the tests. Shield failure is predicted when the diameter ratio is larger than 1.0, and no failure below the ratio=1.0 line. For this database, there are very few actual test failures when a no-failure is predicted. Over 90% of the database was predicted accurately from a safety standpoint (failures predicted accurately), whereas the same figure of merit was 77% using the previous equations.
Fig. 4-7. Predictions from Eqn. 4-10 through 4-15 for 200 different Whipple shield HVI tests.
4.3 Nextel/Kevlar Stuffed Whipple Ballistic Limit Equations As given in Figure 3-10, the stuffed Whipple shield includes NextelTM ceramic fabric and KevlarTM
high-strength fabric as “stuffing” between an outer aluminum bumper and inner pressure wall (or shield rear wall). This shield provides better protection from meteoroid/debris impact than conventional all-aluminum shielding [2, 40]. Semi-empirical/semi-analytical design and performance equations have been developed for Nextel/Kevlar stuffed Whipple shields.
Design Equations. A set of design equations for the stuffed Whipple shield is given in Equations 4-16 through 4-19.
0.00
0.50
1.00
1.50
2.00
2.50
3.00
2.00 3.00 4.00 5.00 6.00 7.00 8.00
Vn, Normal Comp. Velocity (km/s)
Rat
io P
roje
ctile
Dia
met
er in
Tes
t to
P
red
icte
d C
ritic
al D
iam
eter
Shield FailedShield Passed
Pre
dict
Shi
eld
Fai
lure
abo
ve 1
.0
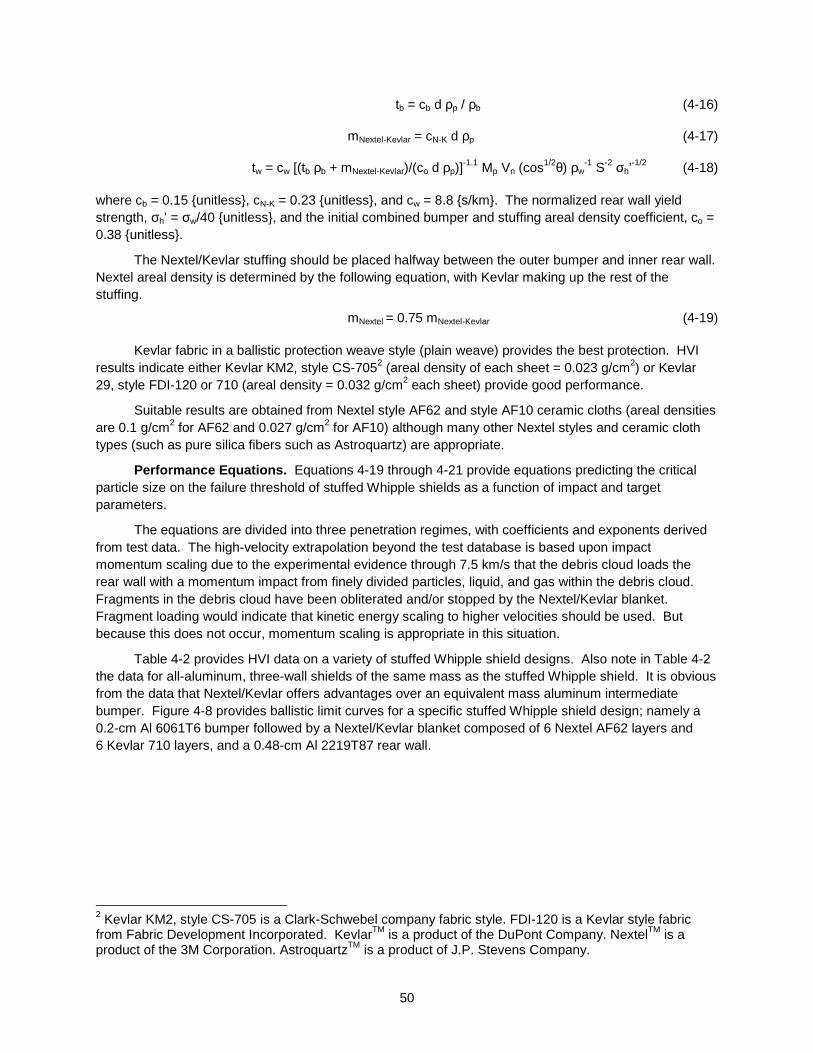
50
tb = cb d ρp / ρb (4-16)
mNextel-Kevlar = cN-K d ρp (4-17)
tw = cw [(tb ρb + mNextel-Kevlar)/(co d ρp)]-1.1 Mp Vn (cos1/2θ) ρw
-1 S-2 σh’-1/2 (4-18)
where cb = 0.15 {unitless}, cN-K = 0.23 {unitless}, and cw = 8.8 {s/km}. The normalized rear wall yield strength, σh’ = σw/40 {unitless}, and the initial combined bumper and stuffing areal density coefficient, co = 0.38 {unitless}.
The Nextel/Kevlar stuffing should be placed halfway between the outer bumper and inner rear wall. Nextel areal density is determined by the following equation, with Kevlar making up the rest of the stuffing.
mNextel = 0.75 mNextel-Kevlar (4-19)
Kevlar fabric in a ballistic protection weave style (plain weave) provides the best protection. HVI results indicate either Kevlar KM2, style CS-7052 (areal density of each sheet = 0.023 g/cm2) or Kevlar 29, style FDI-120 or 710 (areal density = 0.032 g/cm2 each sheet) provide good performance.
Suitable results are obtained from Nextel style AF62 and style AF10 ceramic cloths (areal densities are 0.1 g/cm2 for AF62 and 0.027 g/cm2 for AF10) although many other Nextel styles and ceramic cloth types (such as pure silica fibers such as Astroquartz) are appropriate.
Performance Equations. Equations 4-19 through 4-21 provide equations predicting the critical particle size on the failure threshold of stuffed Whipple shields as a function of impact and target parameters.
The equations are divided into three penetration regimes, with coefficients and exponents derived from test data. The high-velocity extrapolation beyond the test database is based upon impact momentum scaling due to the experimental evidence through 7.5 km/s that the debris cloud loads the rear wall with a momentum impact from finely divided particles, liquid, and gas within the debris cloud. Fragments in the debris cloud have been obliterated and/or stopped by the Nextel/Kevlar blanket. Fragment loading would indicate that kinetic energy scaling to higher velocities should be used. But because this does not occur, momentum scaling is appropriate in this situation.
Table 4-2 provides HVI data on a variety of stuffed Whipple shield designs. Also note in Table 4-2 the data for all-aluminum, three-wall shields of the same mass as the stuffed Whipple shield. It is obvious from the data that Nextel/Kevlar offers advantages over an equivalent mass aluminum intermediate bumper. Figure 4-8 provides ballistic limit curves for a specific stuffed Whipple shield design; namely a 0.2-cm Al 6061T6 bumper followed by a Nextel/Kevlar blanket composed of 6 Nextel AF62 layers and 6 Kevlar 710 layers, and a 0.48-cm Al 2219T87 rear wall.
2 Kevlar KM2, style CS-705 is a Clark-Schwebel company fabric style. FDI-120 is a Kevlar style fabric from Fabric Development Incorporated. KevlarTM is a product of the DuPont Company. NextelTM is a product of the 3M Corporation. AstroquartzTM is a product of J.P. Stevens Company.

51
Table 4-2. Stuffed Whipple and All-Aluminum Shield Impact Data
TypeShield
AD (g/cm2)
Spacing (cm)
Test No.*Proj. Dia. (cm)
Proj. Mass (g)
Velocity (km/s)
Impact Angle (deg)
Rear Wall Damage
All-Al-1 1.82 7.6 JSC B562 0.71 0.52 6.42 45 Perf: 4mm, cracksAll-Al-1 1.82 7.6 JSC B560 0.71 0.52 6.94 45 Perf, 15mm cracksAll-Al-1 1.82 7.6 JSC B563 0.67 0.44 6.96 45 No perf, bulge, BLSW-1 1.75 7.6 JSC B305 0.95 1.26 6.70 45 No perf, bulge 7mm
All-Al-2 2.66 11.4 JSC B535 0.95 1.26 6.64 15 Perf, 32mm thru-crackSW-2 2.16 11.4 JSC B536 1.00 1.46 6.85 15 No Perf, slight dishSW-2 2.16 11.4 JSC B537 1.00 1.46 4.86 15 No Perf, crater
All-Al-3 1.73 7.6 JSC B520 0.75 0.62 6.99 60 Perf, 6x5mmSW-1 1.75 7.6 JSC B549 1.00 1.46 6.60 60 No Perf, bulge 6mm
Inhibited Shaped Charge Launcher (ISCL) Tests [34, 28]
All-Al-3 1.73 7.6SwRI-ISCL-
5993-120.84 0.84 11.03 0 Perf: 4.3cm petalled hole
SW-3 1.78 7.6SwRI-ISCL-
5993-100.85 0.87 11.18 0 No Perf, bulge, BL
All-Al-3 1.73 7.6SwRI-ISCL-
5993-130.92 1.11 11.32 45 Perf: large petalled hole
SW-3 1.78 7.6SwRI-ISCL-
5993-141.01 1.46 11.42 45 No Perf, bulge
Hypervelocity Launcher Flyer Plate Tests [28]All-Al-3 1.73 7.6 SNL-HVL-3 0.81 0.75 10.20 0 PerforatedSW-3 1.78 7.6 SNL-HVL-5 0.74 0.56 10.00 0 No Perf
SW-2 2.16 11.4 MSFC 1455 1.27 3.00 5.82 0 Perf: 1.6cmSW-3 1.78 7.6 SNL-HVL-6 0.73 0.56 10.10 45 No PerfSW-4 2.67 11.4 JSC B654 1.00 1.46 6.84 0 No Perf, very slight dish
SW-Lab 2.78 11.4 ARC2139 1.19 2.49 7.03 0 No Perf, bulgeSW-Lab 2.78 11.4 ARC2141 1.27 3.01 7.03 0 No Perf, 1.7cm bulgeSW-Lab 2.78 11.4 JSC B890 0.95 1.27 2.94 0 No Perf, bumpSW-Lab 2.78 11.4 JSC B875 1.00 1.47 4.87 0 No Perf, no bulgeSW-Lab 2.78 11.4 ARC2140 1.19 2.49 7.07 45 No Perf, slight bulgeSW-Lab 2.78 11.4 ARC2127 1.59 5.87 5.2 60 No Perf, small craters
SW-cupola
2.21 17.78 JSC 20274 1.27 3.00 6.68 0 No Perf, deep bulge
SW-cupola
2.21 17.78 JSC 20310 1.27 3.00 6.82 45 No Perf, bulge
SW-ATV 1.37 12.7 JSC 20254 0.71 0.53 7 0 No perf, slight bulge
TypeShield
AD (g/cm2)
Spacing (cm)
Al6061T6 tb (cm)
Interm. AD
(g/cm2)tw (cm) Rear wall material
Nextel/Kevlar Stuffed Whipple ShieldsSW-1 1.75 7.6 0.1 0.56 0.32 Al 2219T87SW-2 2.16 11.4 0.16 0.82 0.48 Al 2219T87SW-3 1.78 7.6 0.13 0.53 0.32 Al 2219T87SW-4 2.67 11.4 0.19 0.79 0.48 Al 2219T87
SW-Lab 2.78 11.4 0.2 0.85 0.48 Al 2219T87SW-
cupola2.21 17.78 0.2 0.97 0.25 Al 6061T6
SW-ATV 1.37 12.7 0.13 0.12 0.32 Al 2219T87All Aluminum Shields
All-Al-1 1.82 7.6 0.13 0.56 0.32 Al 2219T87All-Al-2 2.66 11.4 0.19 0.91 0.48 Al 2219T87All-Al-3 1.73 7.6 0.1 0.54 0.32 Al 2219T87
0.32cm Al 2219T870.2cm Al 6061T6
MLI/6 Nextel/6 Kevlar3 Nextel/1.27mm Al/14
Kev KM22 Nextel AF10/3 Kev KM2
0.2cm Al 2024T3
Mesh/4 Nextel/4 KevlarMesh/6 Nextel/6 Kevlar
4 Nextel/4 Kevlar6 Nextel/6 Kevlar
All-Aluminum and Nextel/Kevlar Comparisons
Nextel/Kevlar Stuffed Whipple Ballistic Limit Data
SHIELD PARAMETERS
Intermediate Bumper Description

52
High-Velocity: when V ≥ 6.5/(cosθ)3/4,
dc = KH-SW (tw ρw)1/3 ρp-1/3 V-1/3 (cosθ)-0.5 S2/3 σ’1/6 (4-19)
where the normalized rear wall yield strength, σ’ = σ/40, and the coefficient, KH-SW = 0.6 {km1/3/s1/3}.
Intermediate-Velocity: when 2.6/(cosθ)0.5 < V < 6.5/(cosθ)3/4,
dc = KHi-SW (tw ρw)1/3 ρp-1/3 (cosθ)-0.25 S2/3 σ’1/6
[(V - 2.6/(cosθ)0.5)/(6.5/(cosθ)3/4 - 2.6/(cosθ)0.5)]
+ KLi-SW ρp-1/2 [tw σ’0.5 + CL mb] (cosθ)-1
[[(6.5/(cosθ)3/4 - V)/(6.5/(cosθ)3/4 - 2.6/(cosθ)0.5)] (4-20)
where KHi-SW = 0.321, CL=0.37 {cm3/g} and KLi-SW = 1.243 {g0.5/cm3/2}.
Low-Velocity: when V ≤ 2.6/(cosθ)0.5,
dc = KL-SW V-2/3 (cosθ)-4/3 ρp-1/2 [tw σ’0.5 + CL mb-total] (4-21)
where KL-SW = 2.35 {g0.5 km2/3 cm-3/2 s-2/3}, CL=0.37 {cm3/g}, and the total bumper areal density is the sum of the areal densities of the outer bumper, Nextel, Kevlar and MLI: mb-total = mb + mNextel + mKevlar + mMLI .
Fig. 4-8. Stuffed Whipple ballistic limits. 0.2-cm Al6061T6 bumper, 6Nextel AF62/6 Kevlar
710 intermediate bumper, 10.7-cm overall standoff, 0.48-cm Al2219T87 rear wall
4.4 Multi-Shock Shield Ballistic Limit Equations As discussed in Section 3, MS shields consist of ultra-thin-spaced bumper elements that
repeatedly shock an impacting projectile. By doing so, the projectile thermal state will be driven higher than that achieved by the single shock provided by a Whipple shield [39, 55]. By raising the state of the projectile, a MS shield will raise the ballistic limit curve in the projectile fragmentation regime (3-7+ km/s). Over all velocity ranges, the debris cloud expansion speed is reduced by each encounter with a bumper,
Predict rear wall perforation above curvesopen data = no fail, closed data = fail
0.00
0.20
0.40
0.60
0.80
1.00
1.20
1.40
1.60
1.80
2.00
0 2 4 6 8 10 12 14
Velocity (km/s)
Alu
min
um
Cri
t. D
ia.
(cm
)
pred.dcrit @ 0 deg
dcrit @ 45 deg
dcrit @ 60 degdata @ 0 deg
data @ 45 deg
data @ 60 deg

53
which reduces the blast loading delivered to the rear wall [1, 17, 37]. These factors contribute to make multi-shock shielding more effective at meteoroid/debris protection than Whipple shields for the weight.
The current work has focused on establishing BLEs for two types of multi-shock shields (Fig. 4-9):
1. Four equally spaced ceramic fabric bumpers with an aluminum rear wall
2. An all-flexible shield consisting of four equally spaced ceramic fabric bumpers and a high-strength fabric rear wall.
A ceramic fabric that has been tested extensively in HVI tests as well as other tests related to space environment effects for spacecraft application is Nextel. However, other ceramic fabrics have also been evaluated in HVI tests with comparable results to Nextel when weight is held constant (e.g. Astroquartz).
Design Equations. We use equations 4-22 through 4-24 to size the MS shield elements for impacts with velocity greater than 6.4 cos-0.25θ km/s and S/d > 15. In these equations, the combined areal density of all four Nextel bumpers is given by mb, and the overall spacing from outermost bumper to the rear wall is given by S. The areal density for all MS bumpers is approximately equal to the areal density of the single bumper in a Whipple shield. A MS shield provides superior protection performance to an equivalent weight Whipple shield. We can obtain major weight savings by reducing the rear wall thickness for stopping a given threat particle when sufficient spacing is available (S ≥ 30d). Equation 4-22 provides the areal density of all 4 ceramic bumpers.
mb = 0.185 d ρp (4-22)
The thickness for an aluminum rear wall is determined by the following equation, where k = 41.6 s/km and normalized rear wall yield strength, σ’=σ/40 {unitless}.
tw = k M Vn ρw-1 S-2 σ’-0.5 (4-23)
For a high-strength Kevlar fabric rear wall, the areal density of the Kevlar is determined by
Equation 4-24, where K = 29 s/km. As with the stuffed Whipple shield, good shield performance is obtained by a ballistic protection style of Kevlar cloth, such as Kevlar KM2, style CS-7053 or Kevlar 29, style FDI-120 or 710.
mw = K M Vn S-2 (4-24)
No limits are necessary on oblique impacts because the ceramic fabric bumpers do not produce
damaging fragments. Particles produced by impacts on the ceramic fabrics are short fibers up to several millimeters long but only 10-12 microns in diameter. Nextel bumper fragments ejected normal to the bumper during oblique impact do not penetrate subsequent bumper layers and therefore do not damage the rear wall. Bumper fragments from a Whipple shield are far more damaging to the rear wall for two reasons: (1) An oblique impact on a Whipple shield bumper 4 times heavier than a MS bumper will produce bumper fragments that are larger and more penetrating than the fiber particles from a MS fabric bumper; (2) Whipple bumper fragments impinge directly on the rear wall, while MS shield bumper fragments are stopped by lower layers of the MS shield.
3 Kevlar KM2, style CS-705 is a Clark-Schweibel company fabric style with an areal density of 0.023 g/cm2. FDI-120 is a Kevlar 29 style fabric from Fabric Development Incorporated with an areal density of 0.032 g/cm2.
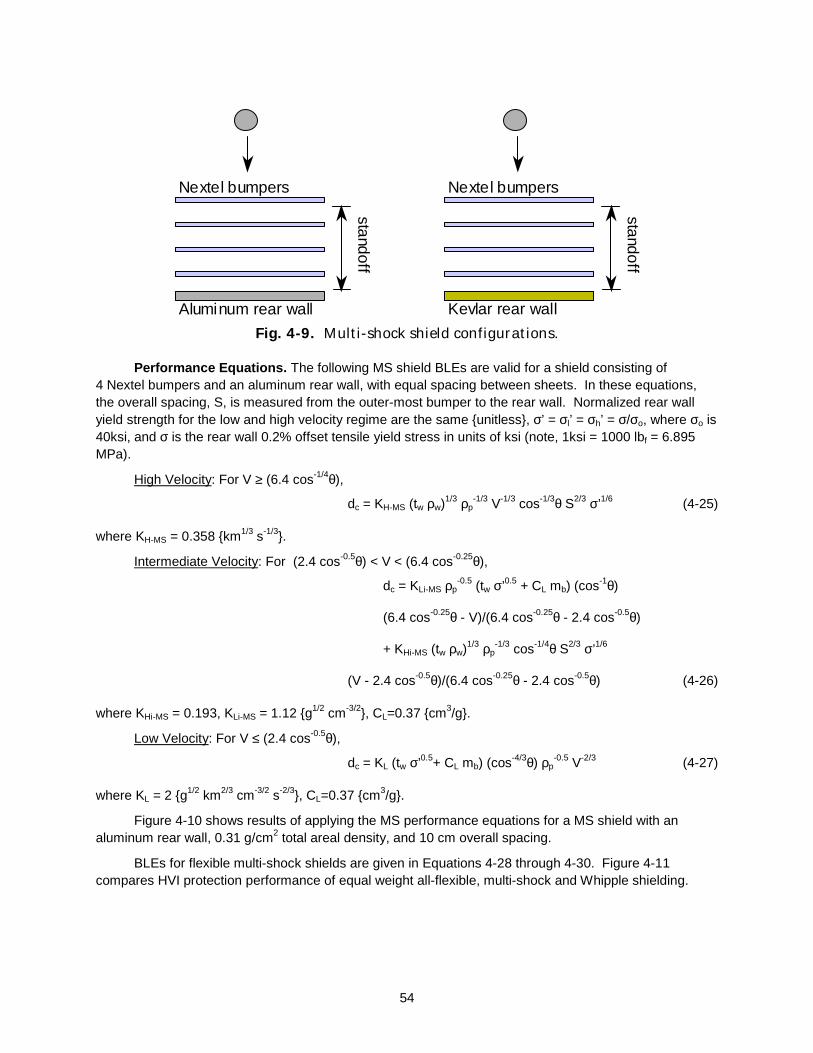
54
Fig. 4-9. Multi-shock shield configurations.
Performance Equations. The following MS shield BLEs are valid for a shield consisting of 4 Nextel bumpers and an aluminum rear wall, with equal spacing between sheets. In these equations, the overall spacing, S, is measured from the outer-most bumper to the rear wall. Normalized rear wall yield strength for the low and high velocity regime are the same {unitless}, σ’ = σl’ = σh’ = σ/σo, where σo is 40ksi, and σ is the rear wall 0.2% offset tensile yield stress in units of ksi (note, 1ksi = 1000 lbf = 6.895 MPa).
High Velocity: For V ≥ (6.4 cos-1/4θ),
dc = KH-MS (tw ρw)1/3 ρp-1/3 V-1/3 cos-1/3θ S2/3 σ’1/6 (4-25)
where KH-MS = 0.358 {km1/3 s-1/3}.
Intermediate Velocity: For (2.4 cos-0.5θ) < V < (6.4 cos-0.25θ),
dc = KLi-MS ρp-0.5 (tw σ’0.5 + CL mb) (cos-1θ)
(6.4 cos-0.25θ - V)/(6.4 cos-0.25θ - 2.4 cos-0.5θ)
+ KHi-MS (tw ρw)1/3 ρp
-1/3 cos-1/4θ S2/3 σ’1/6
(V - 2.4 cos-0.5θ)/(6.4 cos-0.25θ - 2.4 cos-0.5θ) (4-26)
where KHi-MS = 0.193, KLi-MS = 1.12 {g1/2 cm-3/2}, CL=0.37 {cm3/g}.
Low Velocity: For V ≤ (2.4 cos-0.5θ),
dc = KL (tw σ’0.5+ CL mb) (cos-4/3θ) ρp-0.5 V-2/3 (4-27)
where KL = 2 {g1/2 km2/3 cm-3/2 s-2/3}, CL=0.37 {cm3/g}.
Figure 4-10 shows results of applying the MS performance equations for a MS shield with an aluminum rear wall, 0.31 g/cm2 total areal density, and 10 cm overall spacing.
BLEs for flexible multi-shock shields are given in Equations 4-28 through 4-30. Figure 4-11 compares HVI protection performance of equal weight all-flexible, multi-shock and Whipple shielding.
Nextel bumpers
Aluminum rear wall
standoff
Nextel bumpers
Kevlar rear wall
standoff
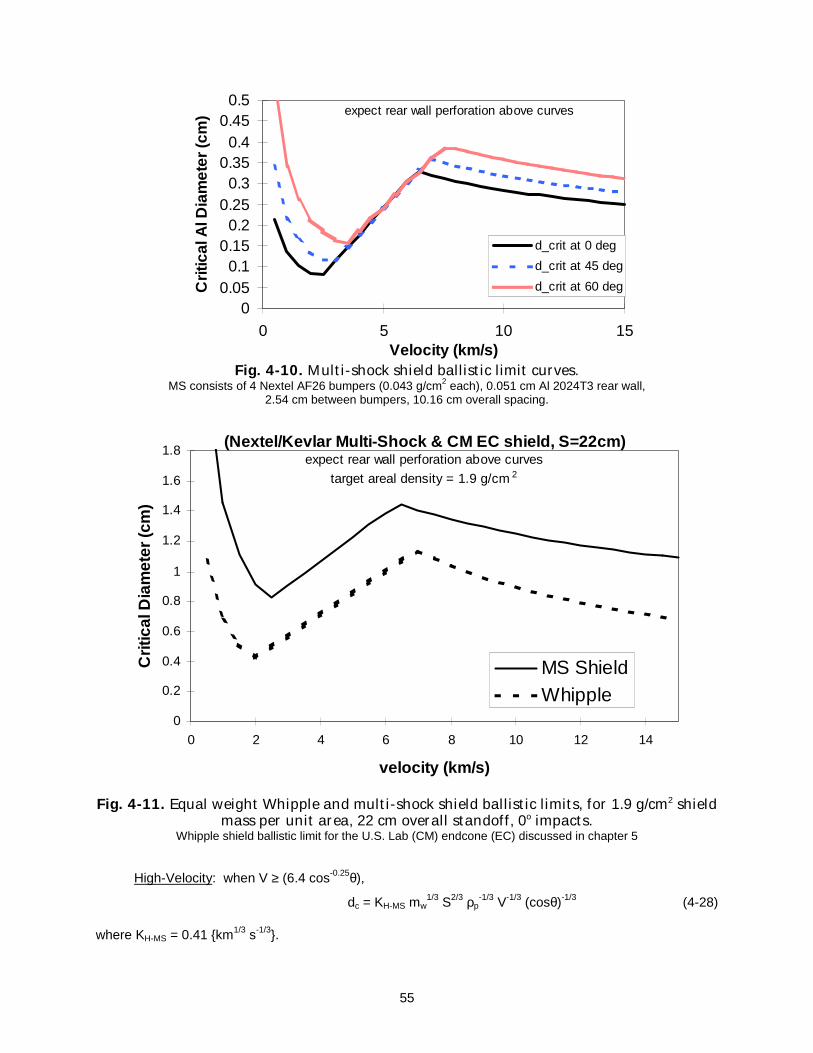
55
Fig. 4-10. Multi-shock shield ballistic limit curves. MS consists of 4 Nextel AF26 bumpers (0.043 g/cm2 each), 0.051 cm Al 2024T3 rear wall,
2.54 cm between bumpers, 10.16 cm overall spacing.
Fig. 4-11. Equal weight Whipple and multi-shock shield ballistic limits, for 1.9 g/cm2 shield
mass per unit area, 22 cm overall standoff, 0o impacts. Whipple shield ballistic limit for the U.S. Lab (CM) endcone (EC) discussed in chapter 5
High-Velocity: when V ≥ (6.4 cos-0.25θ),
dc = KH-MS mw1/3 S2/3 ρp
-1/3 V-1/3 (cosθ)-1/3 (4-28) where KH-MS = 0.41 {km1/3 s-1/3}.
expect rear wall perforation above curves
00.05
0.10.15
0.20.25
0.30.35
0.40.45
0.5
0 5 10 15Velocity (km/s)
Cri
tical
Al D
iam
eter
(cm
)
d_crit at 0 deg
d_crit at 45 deg
d_crit at 60 deg
(Nextel/Kevlar Multi-Shock & CM EC shield, S=22cm)expect rear wall perforation above curves
target areal density = 1.9 g/cm 2
0
0.2
0.4
0.6
0.8
1
1.2
1.4
1.6
1.8
0 2 4 6 8 10 12 14
velocity (km/s)
Cri
tical
Dia
met
er (c
m)
MS ShieldWhipple

56
Intermediate-Velocity: when (2.4 cos-0.5θ) < V < (6.4 cos-0.25θ),
dc = KHi-SW mw1/3 S2/3 ρp
-1/3 (cos-0.25θ)
(V - 2.4 cos-0.5θ) / (6.4 cos-0.25θ - 2.4 cos-0.5θ)
+ KLi-SW ρp-1/2 [CW mw + CL mb] (cos-1θ)
(6.4 cos-0.25θ - V)/(6.4 cos-0.25θ - 2.4 cos-0.5θ) (4-29)
where KHi-MS = 0.221, KLi-MS = 1.506 {g1/2 cm-3/2}, CW = 0.5 {cm3/g}, CL=0.37 {cm3/g}.
Low-Velocity: when V ≤ 2.4 cos-0.5θ),
dc = KL V-2/3 (cos-4/3θ) ρp
-1/2 [CW mw + CL mb] (4-30)
where KL = 2.7 {g1/2 km2/3 cm-3/2 s-2/3}, CW = 0.5 {cm3/g}, CL=0.37 {cm3/g}.
4.5 Adjustments to Shielding and Changes to Equations One can use the shielding methodology from Section 2 and the design/performance equations just
provided to provide adequate spacecraft meteoroid/debris shielding that meets and exceeds requirements. However, as shown in Section 2, the shielding design process is iterative. Change and rework is necessary to make the shielding design work.
The following examples illustrate some of the reasons for an iterative M/D shield design process. Details and solutions are discussed in Section 5.
1. The BLEs for ISS in the final certification step must correctly account for all data resulting in shielding failure in the test database. This is necessary to satisfy safety requirements for human-occupied spacecraft. The approach taken to satisfy this requirement is to update the BLEs one final time to match all available test data on a particular shield.
2. The potential for improving the shielding of some spacecraft is severely limited by weight and available volume. A method explored for improving the protection of the Soyuz spacecraft was to add Nextel ceramic cloth to the upper part of the existing thermal blanket, and Kevlar at the bottom of the existing thermal blanket. This provided significant improvements in protection capability with a mass increase one-fifth that originally estimated.
3. A Nextel/Kevlar multi-shock shield application to the CONTOUR (Comet Nucleus Tour) spacecraft was based on the design equations formulated in this section, with appropriate adjustment for uncertainty in the impact environment of cometary debris that the spacecraft will encounter during close approaches of the comet nuclei. Also, because the spacecraft swings by more than one comet, the shielding design must recognize the potential of shield degradation due to multiple impacts.
4. Developing a deployable multi-shock shield is the M/D protection design challenge for inflatable modules such as the proposed TransHab module. The use of subscale models in shielding development was of particular benefit to fully utilize scarce research funds.
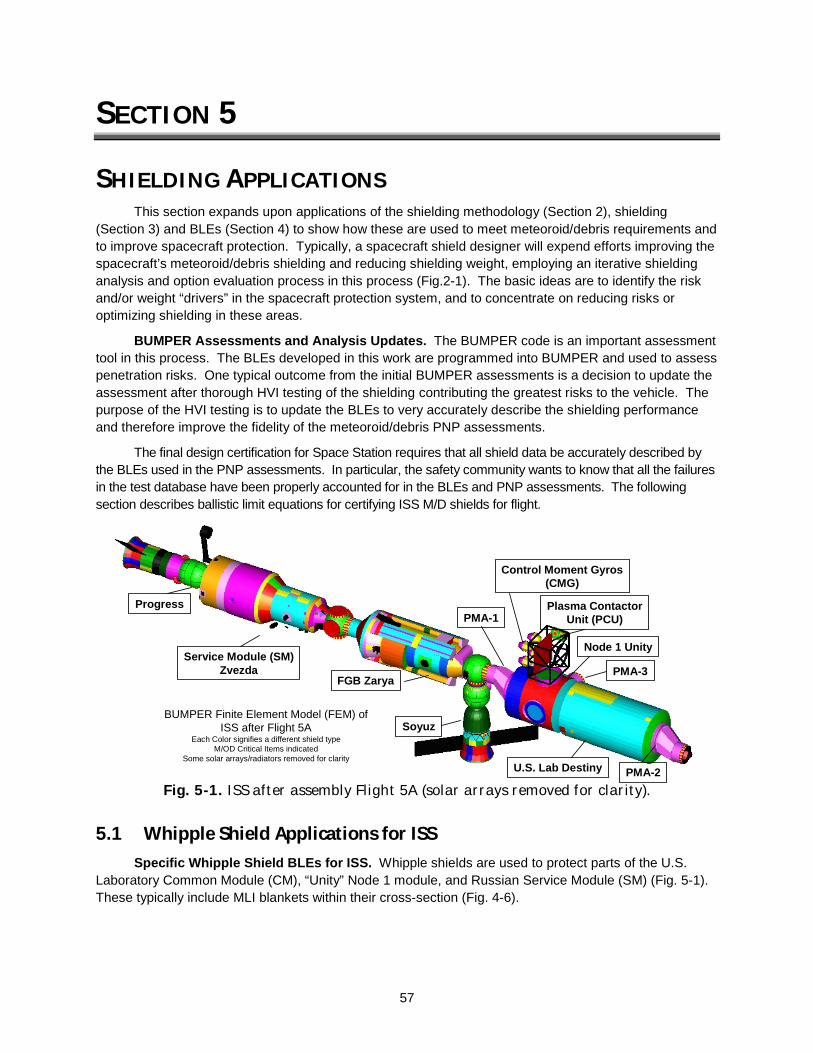
57
SECTION 5
SHIELDING APPLICATIONS This section expands upon applications of the shielding methodology (Section 2), shielding
(Section 3) and BLEs (Section 4) to show how these are used to meet meteoroid/debris requirements and to improve spacecraft protection. Typically, a spacecraft shield designer will expend efforts improving the spacecraft’s meteoroid/debris shielding and reducing shielding weight, employing an iterative shielding analysis and option evaluation process in this process (Fig.2-1). The basic ideas are to identify the risk and/or weight “drivers” in the spacecraft protection system, and to concentrate on reducing risks or optimizing shielding in these areas.
BUMPER Assessments and Analysis Updates. The BUMPER code is an important assessment tool in this process. The BLEs developed in this work are programmed into BUMPER and used to assess penetration risks. One typical outcome from the initial BUMPER assessments is a decision to update the assessment after thorough HVI testing of the shielding contributing the greatest risks to the vehicle. The purpose of the HVI testing is to update the BLEs to very accurately describe the shielding performance and therefore improve the fidelity of the meteoroid/debris PNP assessments.
The final design certification for Space Station requires that all shield data be accurately described by the BLEs used in the PNP assessments. In particular, the safety community wants to know that all the failures in the test database have been properly accounted for in the BLEs and PNP assessments. The following section describes ballistic limit equations for certifying ISS M/D shields for flight.
Fig. 5-1. ISS after assembly Flight 5A (solar arrays removed for clarity).
5.1 Whipple Shield Applications for ISS Specific Whipple Shield BLEs for ISS. Whipple shields are used to protect parts of the U.S.
Laboratory Common Module (CM), “Unity” Node 1 module, and Russian Service Module (SM) (Fig. 5-1). These typically include MLI blankets within their cross-section (Fig. 4-6).
BUMPER Finite Element Model (FEM) ofISS after Flight 5A
Each Color signifies a different shield typeM/OD Critical Items indicated
Some solar arrays/radiators removed for clarity
Progress
Service Module (SM)Zvezda
FGB Zarya
Soyuz
PMA-1
PMA-2
PMA-3
Node 1 Unity
Plasma ContactorUnit (PCU)
Control Moment Gyros(CMG)
U.S. Lab Destiny
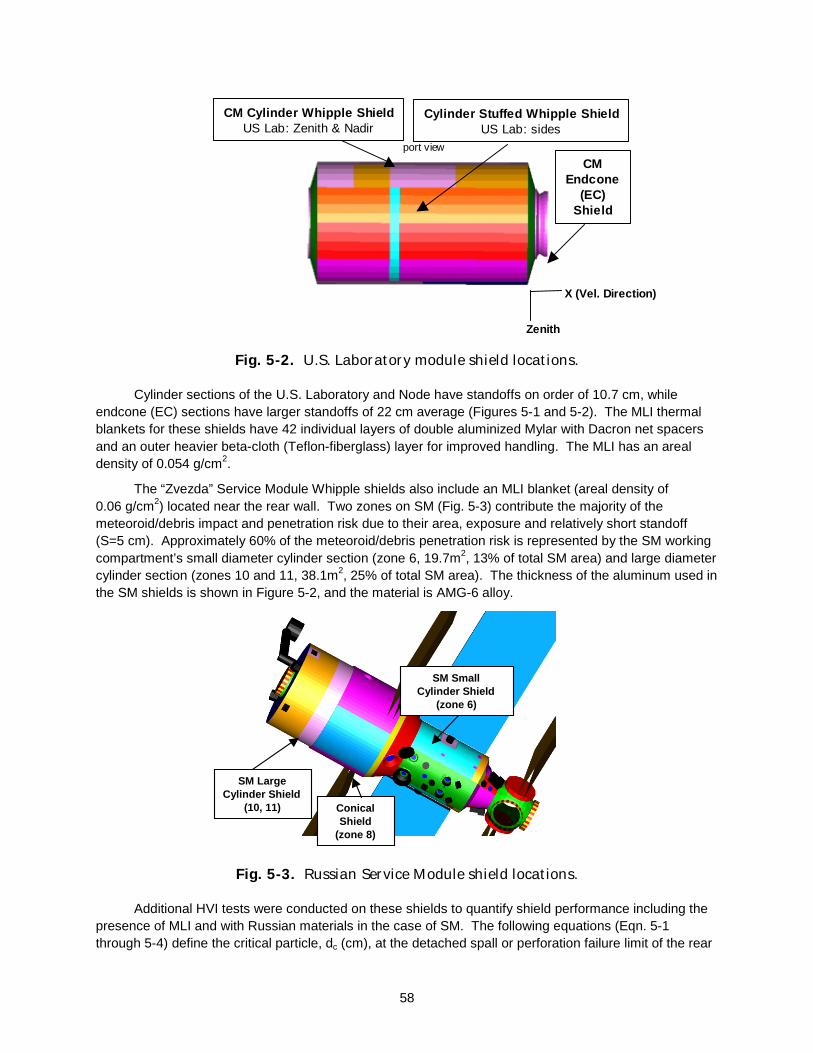
58
port view
Zenith
X (Vel. Direction)
CM Cylinder Whipple ShieldUS Lab: Zenith & Nadir
CM Endcone
(EC) Shield
Cylinder Stuffed Whipple ShieldUS Lab: sides
Fig. 5-2. U.S. Laboratory module shield locations.
Cylinder sections of the U.S. Laboratory and Node have standoffs on order of 10.7 cm, while endcone (EC) sections have larger standoffs of 22 cm average (Figures 5-1 and 5-2). The MLI thermal blankets for these shields have 42 individual layers of double aluminized Mylar with Dacron net spacers and an outer heavier beta-cloth (Teflon-fiberglass) layer for improved handling. The MLI has an areal density of 0.054 g/cm2.
The “Zvezda” Service Module Whipple shields also include an MLI blanket (areal density of 0.06 g/cm2) located near the rear wall. Two zones on SM (Fig. 5-3) contribute the majority of the meteoroid/debris impact and penetration risk due to their area, exposure and relatively short standoff (S=5 cm). Approximately 60% of the meteoroid/debris penetration risk is represented by the SM working compartment’s small diameter cylinder section (zone 6, 19.7m2, 13% of total SM area) and large diameter cylinder section (zones 10 and 11, 38.1m2, 25% of total SM area). The thickness of the aluminum used in the SM shields is shown in Figure 5-2, and the material is AMG-6 alloy.
Fig. 5-3. Russian Service Module shield locations.
Additional HVI tests were conducted on these shields to quantify shield performance including the presence of MLI and with Russian materials in the case of SM. The following equations (Eqn. 5-1 through 5-4) define the critical particle, dc (cm), at the detached spall or perforation failure limit of the rear
SM Small Cylinder Shield
(zone 6)
SM Large Cylinder Shield
(10, 11) Conical Shield
(zone 8)

59
wall. The rear wall for the ISS modules is the pressure shell itself. The coefficients for the equations are given in Table 5-1. As indicated, the coefficients are applicable for the specified shield only. But since they accurately represent all available HVI data, PNPs calculated with these BLEs provide the means to verify requirements compliance for the flight elements.
High-Velocity: when V ≥ VH/(cosθ)xh,
dc = KH ρp-1/3 (V cosθ)-2/3 (5-1)
Intermediate-Velocity: when VL/(cosθ)xl < V < VH/(cosθ)xh,
dc = Khi ρp-1/3 (cosθ)(-2/3 + xh * 2/3)
[V – VL(cosθ)-xl] / [VH(cos θ)-xh - VL (cosθ)-xl]
+ Kli ρp-0.5 (cosθ)(-4/3 + el + xl * 2/3)
[VH (cosθ)-xh - V] / [VH(cos θ)-xh - VL (cosθ)-xl] (5-2)
Low-Velocity: when V ≤ VL/(cosθ)xl,
dc = KL (cosθ)(-4/3 + el) ρp-0.5 V-2/3 (5-3)
There is an impact angle cutoff constraint for oblique impacts above 65o; i.e.,
dc (θ>65o) = dc (θ=65o) (5-4)
Table 5-1. BLE Coefficients and Variables for ISS Whipple Shields
CM
cylinder CM EC
tb=0.2cm Node fwd cylinder
Node aft cylinder
Node EC tb=0.13cm
Node EC tb=0.2cm
SM cylinder Zone 6
SM cylinder Zone 10&11
Mat'l tb Al6061T6 Al6061T6 Al6061T6 Al6061T6 Al6061T6 Al6061T6 AMG6 AMG6
Mat'l tw Al2219T87 Al2219T87 Al2219T87 Al2219T87 Al2219T87 Al2219T87 AMG6 AMG6
tb (cm) 0.20 0.2 0.13 0.13 0.13 0.2 0.1 0.1
S (cm) 10.7 22.2 10.7 10.9 22.2 22.1 5 5 tw (cm) 0.48 0.48 0.64 0.41 0.58 0.58 0.16 0.2
KH (g1/3 km2/3 s-2/3) 4.643 5.910 4.085 3.643 4.980 6.329 0.553 0.710
Khi (g1/3) 1.269 1.615 1.116 0.977 1.361 1.730 0.151 0.194
Kli (g1/2 cm-1/2) 0.892 0.891 0.685 0.524 0.679 0.736 0.074 0.093
KL (g1/2 cm-1/2 km2/3 s-2/3) 1.168 1.168 1.262 0.687 1.078 1.169 0.154 0.194
VH (km/s) 7 7 7 7.2 7 7 7 7
VL (km/s) 1.5 1.5 2.5 1.5 2 2 3 3
xh 1 1 1 1 1 1 1 1
xl 1.9 1.9 1.9 1.5 1 1 1 1
el <60o: -1/3 ≥60o: -2/3
-0.5 <60o: -1 ≥60o: -2/3
<60o: -1/3 ≥60o: -2/3
<60o: -1/6 ≥60o: -2/3
-0.5 -1/3 -1/3
Figures 5-4 and 5-5 provide the U.S. Laboratory cylinder Whipple shield ballistic limits and HVI data at normal (0o) and 45o impact angles. A comparison between the cylinder shield and endcone shield ballistic limits is given in Figure 5-6. This figure shows the effect of standoff on Whipple shield ballistic limits since the only difference between these two shields is that standoff is higher in the endcone (22 cm)

60
versus cylinder (11 cm). The Service Module small diameter cylinder shield (zone 6) was tested at NASA and data are successfully predicted by the ballistic limit curves as shown in Figure 5-7.
Fig. 5-4. U.S. Lab cylinder Whipple ballistic limits @ 0o impact angle.
Fig. 5-5. U.S. Lab cylinder Whipple ballistic limits @ 45o impact angle.
2.0mm Al6061T6 bumper, MLI, 107mm standoff, 4.8mm Al2219T87 wa llperforation/spal l of wall expected above curvessolid data points indicate failure, open no-failure
0
0.2
0.4
0.6
0.8
1
1.2
0 5 10 15
Velocity (km/s)
Cri
tical
Al P
arti
cle
Dia
(cm
)
Predic ted BL @ 0 deg
Data @ 0 deg
perforation/spall of wall expected above curvessolid data points indicate failure, open no-failure
0
0.2
0.4
0.6
0.8
1
1.2
0 5 10 15
Velocity (km/s)
Cri
tical
Al P
artic
le D
ia (c
m)
Predicted BL @ 45 deg
Data @ 45 deg

61
Fig. 5-6. U.S. Lab cylinder (S=10.7 cm) and endcone (S=22 m) ballistic limits.
Fig. 5-7. Service Module Zone 6 Whipple shield ballistic limits at
45o and 60o impact angles.
5.2 Nextel/Kevlar Enhanced Whipple Applications on ISS The application of Nextel/Kevlar “stuffed Whipple” shields is widespread on ISS. Typical shields
protecting forward/side areas of U.S. modules, ESA Columbus and NASDA Japanese Experimental Module are shown in Figure 5-8. Ballistic protection capability for the 3 types of stuffed Whipple shields is compared in Figure 5-9. The differences are explained mainly by the difference in areal density of the Nextel/Kevlar stuffing layer in the three configurations. ESA shields have a slightly larger spacing
perforation/spall of wall expected above curves
0
0.2
0.4
0.6
0.8
1
1.2
0 5 10 15
Velocity (km/s)
Cri
tical
Al P
artic
le D
ia (
cm)
CM ECCM Cylinder
perforation/spall of wall expected above curvessolid points fail, open points no fail
0
0.1
0.2
0.3
0.4
0.5
0.6
0.7
0.8
0.9
1
0 5 10 15Velocity (km/s)
Cri
tical
Al P
artic
le D
ia (c
m)
predicted BL @ 45 degpredicted BL @ 60 deg45deg data60deg data
0o ballistic limits
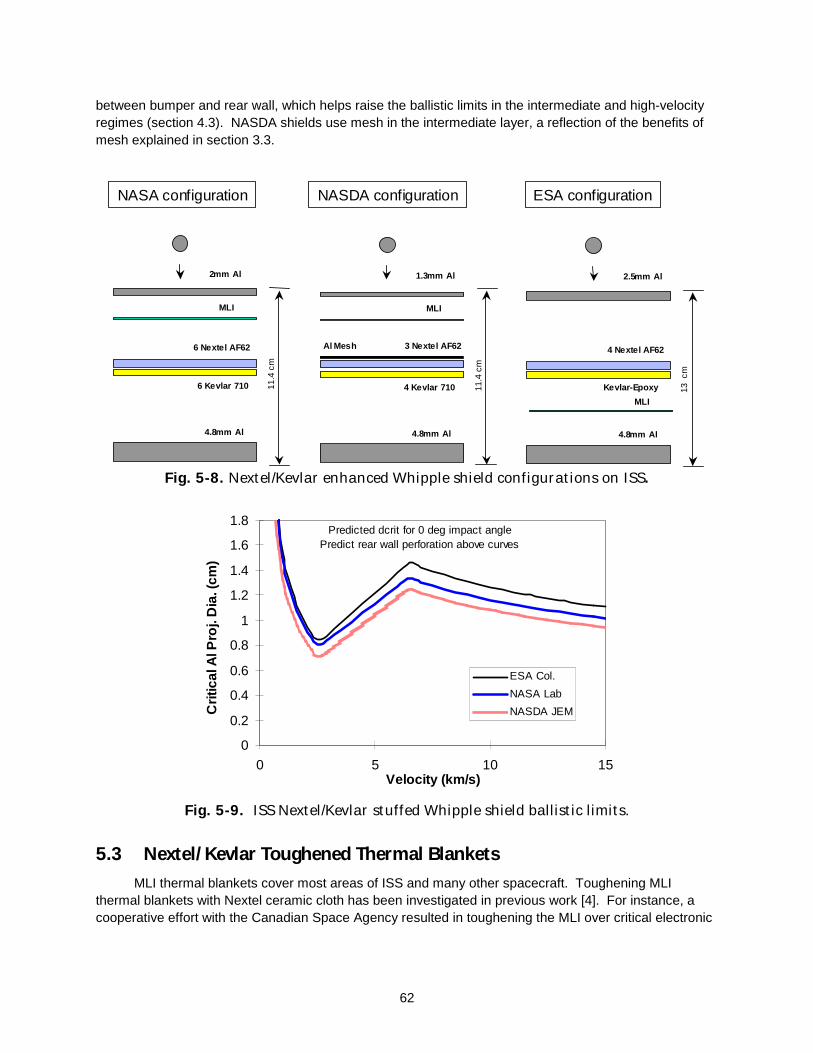
62
between bumper and rear wall, which helps raise the ballistic limits in the intermediate and high-velocity regimes (section 4.3). NASDA shields use mesh in the intermediate layer, a reflection of the benefits of mesh explained in section 3.3.
NASA configuration NASDA configuration ESA configuration
2mm Al
MLI
6 Nextel AF62
6 Kevlar 710
4.8mm Al
11.4
cm
1.3mm Al
MLI
3 Nextel AF62
4 Kevlar 710
4.8mm Al
11.4
cm
2.5mm Al
MLI
4 Nextel AF62
Kevlar-Epoxy
4.8mm Al
13 c
m
Al Mesh
Fig. 5-8. Nextel/Kevlar enhanced Whipple shield configurations on ISS.
Fig. 5-9. ISS Nextel/Kevlar stuffed Whipple shield ballistic limits.
5.3 Nextel/Kevlar Toughened Thermal Blankets MLI thermal blankets cover most areas of ISS and many other spacecraft. Toughening MLI
thermal blankets with Nextel ceramic cloth has been investigated in previous work [4]. For instance, a cooperative effort with the Canadian Space Agency resulted in toughening the MLI over critical electronic
Predicted dcrit for 0 deg impact anglePredict rear wall perforation above curves
0
0.2
0.4
0.6
0.8
1
1.2
1.4
1.6
1.8
0 5 10 15Velocity (km/s)
Cri
tical
Al P
roj.
Dia
. (cm
)
ESA Col.
NASA Lab
NASDA JEM

63
and propulsion systems on the RADARSAT satellite with 1 to 2 layers of Nextel AF10. The added mass was 0.25 to 0.5 kg/m2, while the risk of penetration dropped by a factor of 3 [58].
Current efforts are to extend this work by adding the equivalent of small-scale Nextel/Kevlar “stuffing” to the MLI for ISS applications. In one example, the PNP for the Russian Soyuz vehicle (Fig. 5-10) was assessed using BUMPER (Fig. 5-11).
The orbital module (OM) contributes the majority of the penetration risk for the vehicle. This is because of the relatively light protection in this area of the Soyuz. The Soyuz OM consists of an aluminum (AMG-6) pressure shell covered by an outer MLI thermal blanket. The baseline Soyuz thermal blanket consists of an outer fiberglass layer, an aluminized Mylar layer, a “shield” containing a 0.2-mm-thick aluminum plate sandwiched between fiberglass, followed by 50 layers of thin, aluminized Mylar and scrim separators. Total areal density of the baseline thermal blanket is 0.188 g/cm2. The AMG-6 pressure shell is 0.18 cm to 0.2 cm thick in the thinnest parts of the Soyuz OM.
The thin areas control the penetration risks of the OM and vehicle. Other areas of the OM are 0.4-cm to 0.6-cm thick aluminum.
HVI tests were conducted on the baseline thermal blanket and two concepts to increase meteoroid/debris protection. BLEs for the Orbital Module baseline MLI and enhanced options are given in Equations 5-5 through 5-10.
• Option 1 adds an additional 0.2-mm-thick aluminum plate to the “shield.” The plates are back-to-back, but not flat as each has a 2-mm-high rib. Total areal density is 0.243 g/cm2 and the option if implemented on the OM would add 9 kg mass.
Orbital Module
Propulsion Module
Descent Module
Pressure Vessels
Fig. 5-10. Soyuz finite element model used in BUMPER calculations.
0.0%
10.0%
20.0%
30.0%
40.0%
50.0%
60.0%
70.0%
80.0%
90.0%
orbitalmodule
descentmodule
propulsionmodule
pressurevessels
% o
f to
tal p
enet
ratio
n r
isk
Risk reduction expected with
Option 2 implementation
Fig. 5-11. Breakdown of Soyuz meteoroid/debris penetration risks from BUMPER assessment, before and after
proposed modification using a toughened thermal blanket in the Orbital Module region.
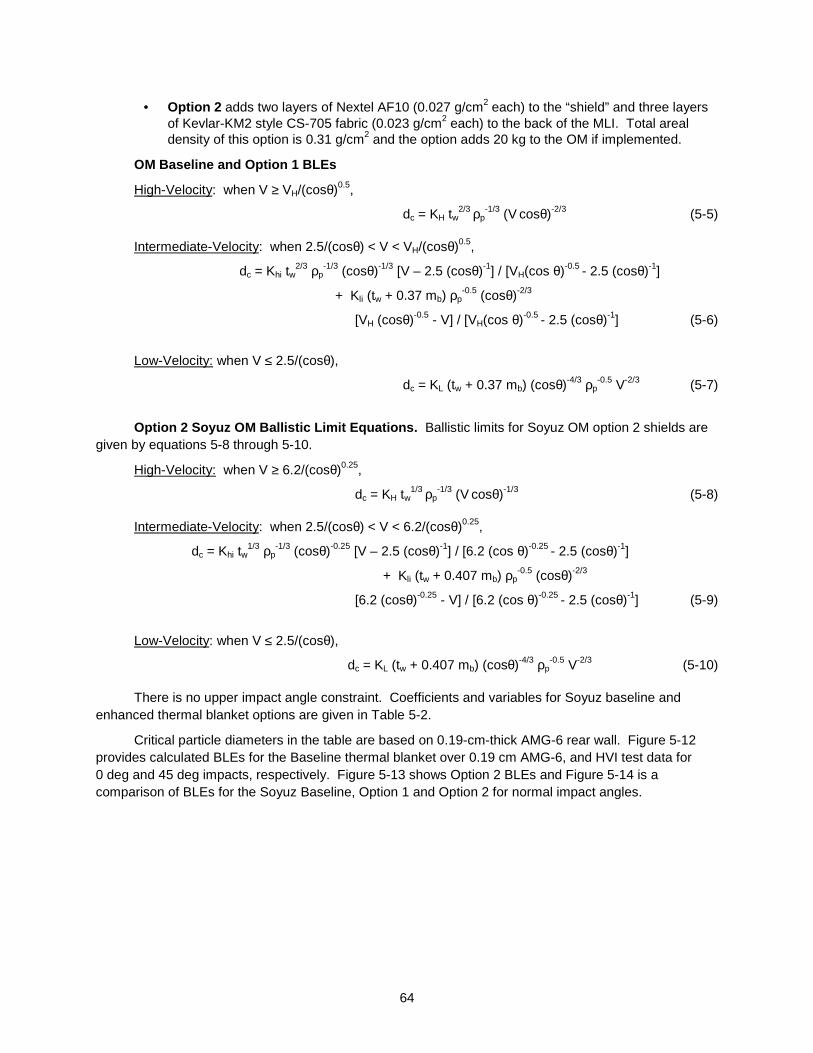
64
• Option 2 adds two layers of Nextel AF10 (0.027 g/cm2 each) to the “shield” and three layers of Kevlar-KM2 style CS-705 fabric (0.023 g/cm2 each) to the back of the MLI. Total areal density of this option is 0.31 g/cm2 and the option adds 20 kg to the OM if implemented.
OM Baseline and Option 1 BLEs
High-Velocity: when V ≥ VH/(cosθ)0.5,
dc = KH tw2/3 ρp
-1/3 (V cosθ)-2/3 (5-5)
Intermediate-Velocity: when 2.5/(cosθ) < V < VH/(cosθ)0.5,
dc = Khi tw2/3 ρp
-1/3 (cosθ)-1/3 [V – 2.5 (cosθ)-1] / [VH(cos θ)-0.5 - 2.5 (cosθ)-1]
+ Kli (tw + 0.37 mb) ρp-0.5 (cosθ)-2/3
[VH (cosθ)-0.5 - V] / [VH(cos θ)-0.5 - 2.5 (cosθ)-1] (5-6)
Low-Velocity: when V ≤ 2.5/(cosθ),
dc = KL (tw + 0.37 mb) (cosθ)-4/3 ρp-0.5 V-2/3 (5-7)
Option 2 Soyuz OM Ballistic Limit Equations. Ballistic limits for Soyuz OM option 2 shields are given by equations 5-8 through 5-10.
High-Velocity: when V ≥ 6.2/(cosθ)0.25,
dc = KH tw1/3 ρp
-1/3 (V cosθ)-1/3 (5-8)
Intermediate-Velocity: when 2.5/(cosθ) < V < 6.2/(cosθ)0.25,
dc = Khi tw1/3 ρp
-1/3 (cosθ)-0.25 [V – 2.5 (cosθ)-1] / [6.2 (cos θ)-0.25 - 2.5 (cosθ)-1]
+ Kli (tw + 0.407 mb) ρp-0.5 (cosθ)-2/3
[6.2 (cosθ)-0.25 - V] / [6.2 (cos θ)-0.25 - 2.5 (cosθ)-1] (5-9)
Low-Velocity: when V ≤ 2.5/(cosθ),
dc = KL (tw + 0.407 mb) (cosθ)-4/3 ρp-0.5 V-2/3 (5-10)
There is no upper impact angle constraint. Coefficients and variables for Soyuz baseline and
enhanced thermal blanket options are given in Table 5-2.
Critical particle diameters in the table are based on 0.19-cm-thick AMG-6 rear wall. Figure 5-12 provides calculated BLEs for the Baseline thermal blanket over 0.19 cm AMG-6, and HVI test data for 0 deg and 45 deg impacts, respectively. Figure 5-13 shows Option 2 BLEs and Figure 5-14 is a comparison of BLEs for the Soyuz Baseline, Option 1 and Option 2 for normal impact angles.
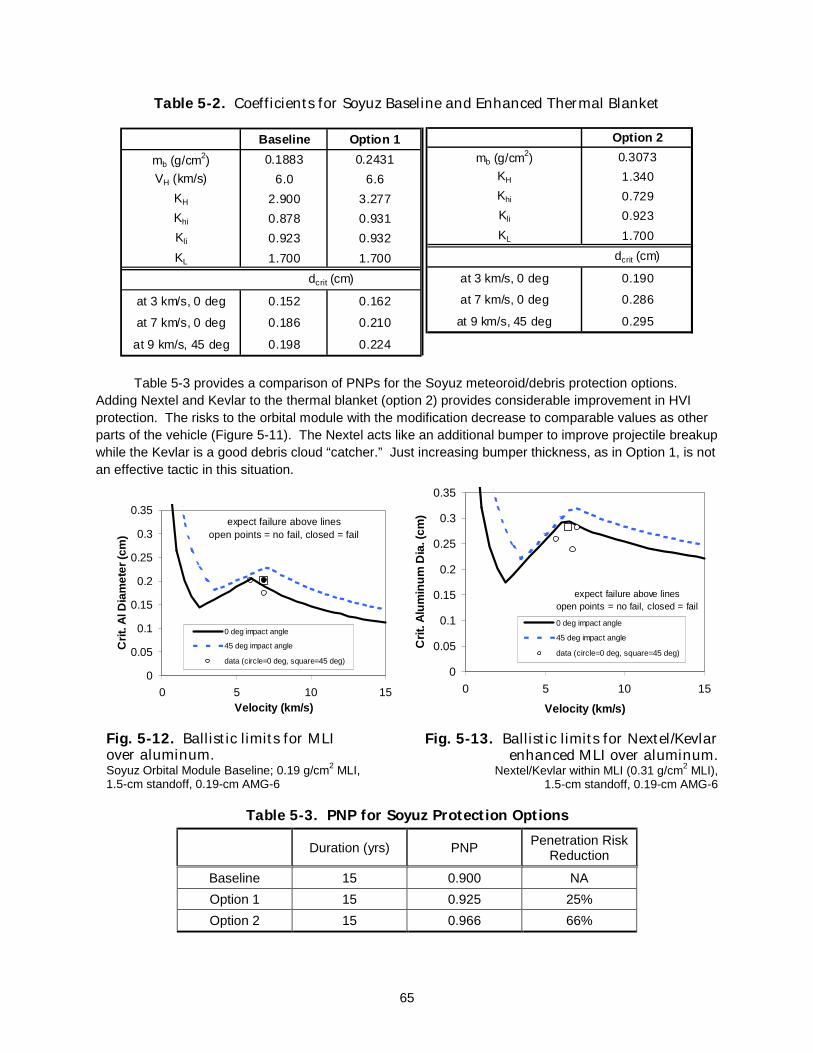
65
Table 5-2. Coefficients for Soyuz Baseline and Enhanced Thermal Blanket
Table 5-3 provides a comparison of PNPs for the Soyuz meteoroid/debris protection options.
Adding Nextel and Kevlar to the thermal blanket (option 2) provides considerable improvement in HVI protection. The risks to the orbital module with the modification decrease to comparable values as other parts of the vehicle (Figure 5-11). The Nextel acts like an additional bumper to improve projectile breakup while the Kevlar is a good debris cloud “catcher.” Just increasing bumper thickness, as in Option 1, is not an effective tactic in this situation.
expect failure above linesopen points = no fail, closed = fail
0
0.05
0.1
0.15
0.2
0.25
0.3
0.35
0 5 10 15Velocity (km/s)
Cri
t. A
l Dia
met
er (c
m)
0 deg impact angle
45 deg impact angle
data (circle=0 deg, square=45 deg)
expect failure above linesopen points = no fail, closed = fail
0
0.05
0.1
0.15
0.2
0.25
0.3
0.35
0 5 10 15
Velocity (km/s)
Cri
t. A
lum
inu
m D
ia. (
cm)
0 deg impact angle
45 deg impact angle
data (circle=0 deg, square=45 deg)
Fig. 5-13. Ballistic limits for Nextel/Kevlar
enhanced MLI over aluminum. Nextel/Kevlar within MLI (0.31 g/cm2 MLI),
1.5-cm standoff, 0.19-cm AMG-6
Table 5-3. PNP for Soyuz Protection Options
Duration (yrs) PNP Penetration Risk Reduction
Baseline 15 0.900 NA
Option 1 15 0.925 25%
Option 2 15 0.966 66%
Baseline Option 1
mb (g/cm2) 0.1883 0.2431
VH (km/s) 6.0 6.6
KH 2.900 3.277
Khi 0.878 0.931
Kli 0.923 0.932
KL 1.700 1.700
at 3 km/s, 0 deg 0.152 0.162
at 7 km/s, 0 deg 0.186 0.210
at 9 km/s, 45 deg 0.198 0.224
dcrit (cm)
Option 2
mb (g/cm2) 0.3073
KH 1.340
Khi 0.729
Kli 0.923
KL 1.700
dcrit (cm)
at 3 km/s, 0 deg 0.190
at 7 km/s, 0 deg 0.286
at 9 km/s, 45 deg 0.295
Fig. 5-12. Ballistic limits for MLI over aluminum. Soyuz Orbital Module Baseline; 0.19 g/cm2 MLI, 1.5-cm standoff, 0.19-cm AMG-6

66
expect fai lure above lines
0
0.05
0.1
0.15
0.2
0.25
0.3
0.35
0 5 10 15
Velocity (km/s)
Cri
tica
l Al P
art
icle
Dia
met
er (c
m)
baselineoption 1option 2
Fig. 5-14. Comparison of MLI options.
Baseline, Option 1 (0.2-mm Al plate), Option 2 (Nextel/Kevlar)
5.4 Flexible Multi-Shock Shield Applications Flexible MS shields are under consideration for protecting the CONTOUR spacecraft and inflatable
modules among other applications. These two provide useful examples of basic principles in shielding design.
CONTOUR MS Shield. A MS shield protects the CONTOUR (Comet Nucleus Tour) spacecraft as it flies by at 100 km distance from the nucleus of 3 separate comets: Encke in November 2003, Schwassmann-Wachmann 3 in June 2006, and d’Arrest. The spacecraft will fly by at the peak of each comet’s activity, when it is close to the Sun. A MS shield was selected to achieve maximum protection performance for the weight, and to maximize repeat hit protection capability. The CONTOUR MS shield design presented in Figure 5-15 was based on equations presented in Section 4, Eqs. 4-22, 4-24, and 4-28 through 4-30. CONTOUR will encounter the three comets at relative impact speeds of 11 km/s, 25 km/s and 32 km/s. Low-density projectiles were used to evaluate shield ballistic limits at maximum LGG velocities. HVI tests demonstrated that the shield successfully stops a 0.79 cm Nylon projectile (density of 1.14 g/cm3) at 7 km/s. Figure 5-16 shows the predicted ballistic limits for the CONTOUR shield based on impactors with density of 1g/cm3.
CONTOUR spacecraft
MS Shield
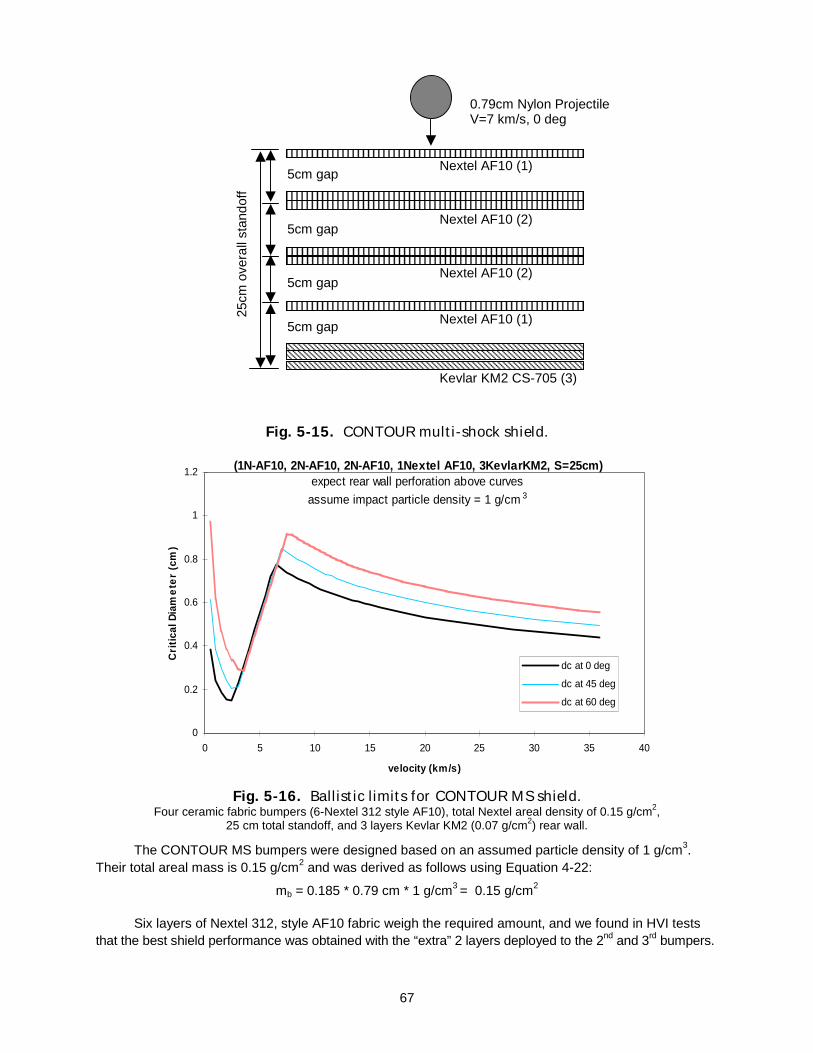
67
Fig. 5-15. CONTOUR multi-shock shield.
(1N-AF10, 2N-AF10, 2N-AF10, 1Nextel AF10, 3KevlarKM2, S=25cm)expect rear wall perforation above curves
assume impact particle density = 1 g/cm 3
0
0.2
0.4
0.6
0.8
1
1.2
0 5 10 15 20 25 30 35 40
velocity (km/s)
Cri
tica
l Dia
me
ter
(cm
)
dc at 0 deg
dc at 45 deg
dc at 60 deg
Fig. 5-16. Ballistic limits for CONTOUR MS shield. Four ceramic fabric bumpers (6-Nextel 312 style AF10), total Nextel areal density of 0.15 g/cm2,
25 cm total standoff, and 3 layers Kevlar KM2 (0.07 g/cm2) rear wall.
The CONTOUR MS bumpers were designed based on an assumed particle density of 1 g/cm3. Their total areal mass is 0.15 g/cm2 and was derived as follows using Equation 4-22:
mb = 0.185 * 0.79 cm * 1 g/cm3 = 0.15 g/cm2
Six layers of Nextel 312, style AF10 fabric weigh the required amount, and we found in HVI tests that the best shield performance was obtained with the “extra” 2 layers deployed to the 2nd and 3rd bumpers.
0.79cm Nylon Projectile V=7 km/s, 0 deg
Kevlar KM2 CS-705 (3)
Nextel AF10 (1)
Nextel AF10 (2)
Nextel AF10 (2)
Nextel AF10 (1)
5cm gap
5cm gap
5cm gap
5cm gap
25cm
ove
rall
stan
doff

68
Proposed ISS Inflatable Module
A material for the bumpers that is closer to the threat density of 1 g/cm3 (such as Kevlar) would work just as well as ceramic fabric in the HVI tests using nylon projectiles. Nextel has a fiber density of 2.5 g/cm3, and it will perform well against both low-density and higher-density threats. It is prudent for the CONTOUR bumpers because of the uncertainty in the particle shape and density during the encounters. The standoff of the CONTOUR shield was maximized at 25 cm and, based on Equation 4-24, the areal density of Kevlar in the rear wall should be 0.07 g/cm2. Three layers of Kevlar KM2, style CS-705, cloth were required.
Another issue that was successfully addressed with the MS shield is the ability to withstand expected degradation during the multiple cometary flybys. Multilayer shields have a greater resilience to multiple impact damage than single bumper systems. In Whipple shields, damage to the rear wall occurs with any impact on the bumper that causes detached spall and/or perforation. This occurs with particles on order of 10% of the critical particle size for the system. In MS shields, it takes a much larger particle to perforate the 4 bumpers and reach the rear wall (on order of 50% of the larger critical particle size for a MS shield compared to the equivalent-weight Whipple shield).
Table 5-4 provides an estimate of the ballistic limit particle size (relative to the ballistic limit particle size for all 5 layers) and estimated hole size for each layer of the CONTOUR shield. Hole sizes are relatively constant for each layer up to the ballistic limit for all 5 layers in the MS shield.
Table 5-4. Predicted Ballistic Limit Particle Size and Shield Layer Damage (assuming particle density of 1 g/cm3)
Damage condition
Relative Particle Size
Layer 1 Hole dia (cm)
Layer 2 Hole dia (cm)
Layer 3 Hole dia (cm)
Layer 4 Hole dia (cm)
Perforate 2 layers 0.1 0.1 0.1 0 0
Perforate 3 layers 0.25 0.3 1.8 0.1 0
Perforate 4 layers 0.5 0.7 2.8 3.7 0.1
Perforate 5 layers 1 1.3 2.8 5.5 5.5
MS Shielding for Inflatable Modules. Figure 5-17 presents a MS shield application for protecting an
inflatable module called the “TransHab.” TransHab is approximately 8 m diameter by 10 m long once deployed on orbit. It is carried to orbit within a 4.5-m-diameter package that fits within the payload bay of the NASA Space Shuttle Orbiter. The purpose of TransHab is to provide a large internal volume for crew and equipment. TransHab would use a flexible MS shield to provide a high level of protection from meteoroid and orbital debris impact. Current design requirements specify a PNP of 0.985 for a 10-year period4.
The current MS shield design for TransHab uses Nextel bumpers and a Kevlar rear wall. There is a restraint layer and multilayer (triple-redundant) bladder system that is protected by the MS shield. Open cell, low density, polyurethane foam is used between the Nextel bumpers to support the bumpers on orbit, and to deploy the bumpers after launch. The MS shield for TransHab is stowed into a 5-cm-high package
4 The debris environment model used in ISS protection system design is the 1991 debris model. Meteoroid and debris environment models are specified in SSP 30425 Rev.B by ISS requirements. The 1991 model is more conservative than the 1996 debris model [11].
TransHab

69
using vacuum bags to compress the foam spacers on the ground before launch. Straps constrain the package from expanding on orbit. Once delivered to orbit, the constraining straps are cut, and the foam is allowed to expand the bumpers to their final configuration.
Fig. 5-17. Flexible multi-shock shield for an inflatable module [41].
Table 5-5. Comparison of HVI Test Results for Full-Scale and 1/5th-Scale
Multi-Shock Shields Projectiles: Al2017T4 spheres, normal impact angle (0o)
Target Scale Test No.
Rear wall test
result
Proj. Dia. (cm)
Velocity (km/s)
Impact Angle (deg)
Overall Spacing
(cm)
Overall Areal
Density (g/cm 2 )
Proj. Size Scale factor
Target Size Scale factor
Target Mass Scale factor
Full-1 UDRI-8- 0126 perforated 1.67 6.17 0 o 30.5 1.32
1/5th-1 WSTF- 3724 perforated 0.32 6.50 0 o 6.1 0.285 19% 20% 22%
Full-1 UDRI-8- 0127 perforated 1.43 6.42 0 o 30.5 1.32
1/5th-1 WSTF- 3841 perforated 0.28 6.80 0 o 6.1 0.285 20% 20% 22%
Full-2 UDRI- 20137 no perf 1.67 5.99 0 o 40.6 1.64
1/5th-2 WSTF- 3654 no perf 0.32 6.20 0 o 8.1 0.285 19% 20% 17%
Full-2 UDRI- 20139 perforated 1.35 3.65 0 o 40.6 1.64
1/5th-2 JSC- 20210 perforated 0.28 3.80 0 o 8.1 0.285 21% 20% 17%
Full-2 UDRI- 20141 no perf 1.82 5.80 45 o 40.6 1.64
1/5th-2 WSTF- 3724 no perf 0.36 6.50 45 o 8.1 0.285 20% 20% 17%
Low-density foam
Low-density foam
Low-density foam
1.8cm Al2017T46 km/s, 45o
(4) Nextel
(4) Nextel
(2) Nextel
(2) Nextel
(7) KevlarRestraint layerBladder system
10cm
10cm
10cm
10cm
Low-density foam
(3) Kevlar
MLI
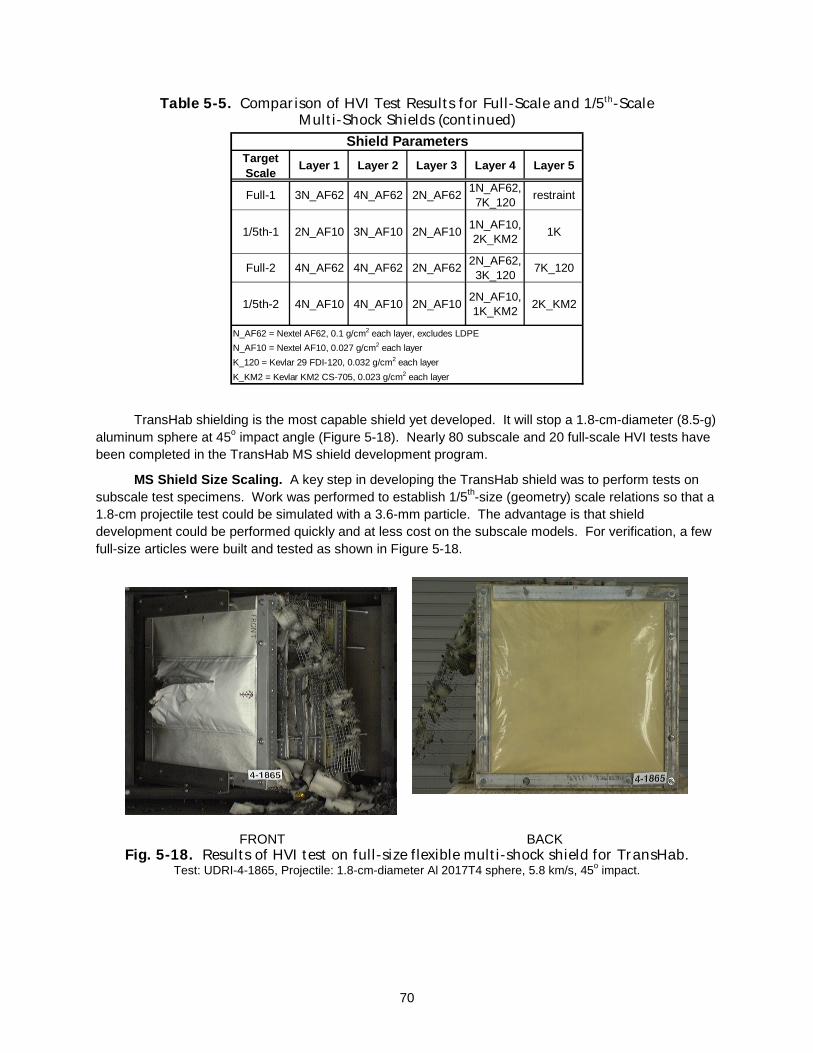
70
Table 5-5. Comparison of HVI Test Results for Full-Scale and 1/5th-Scale Multi-Shock Shields (continued)
Target Scale
Layer 1 Layer 2 Layer 3 Layer 4 Layer 5
Full-1 3N_AF62 4N_AF62 2N_AF621N_AF62,
7K_120restraint
1/5th-1 2N_AF10 3N_AF10 2N_AF101N_AF10, 2K_KM2
1K
Full-2 4N_AF62 4N_AF62 2N_AF622N_AF62,
3K_1207K_120
1/5th-2 4N_AF10 4N_AF10 2N_AF102N_AF10, 1K_KM2
2K_KM2
N_AF62 = Nextel AF62, 0.1 g/cm2 each layer, excludes LDPE
N_AF10 = Nextel AF10, 0.027 g/cm2 each layer
K_120 = Kevlar 29 FDI-120, 0.032 g/cm2 each layer
K_KM2 = Kevlar KM2 CS-705, 0.023 g/cm2 each layer
Shield Parameters
TransHab shielding is the most capable shield yet developed. It will stop a 1.8-cm-diameter (8.5-g) aluminum sphere at 45o impact angle (Figure 5-18). Nearly 80 subscale and 20 full-scale HVI tests have been completed in the TransHab MS shield development program.
MS Shield Size Scaling. A key step in developing the TransHab shield was to perform tests on subscale test specimens. Work was performed to establish 1/5th-size (geometry) scale relations so that a 1.8-cm projectile test could be simulated with a 3.6-mm particle. The advantage is that shield development could be performed quickly and at less cost on the subscale models. For verification, a few full-size articles were built and tested as shown in Figure 5-18.
FRONT BACK
Fig. 5-18. Results of HVI test on full-size flexible multi-shock shield for TransHab. Test: UDRI-4-1865, Projectile: 1.8-cm-diameter Al 2017T4 sphere, 5.8 km/s, 45o impact.

71
Fig. 5-19. 1/5th-scale flexible MS test article for TransHab.
Similar test results were obtained in comparable full-size and 1/5th-scale tests, as provided in Table 5-5. Figure 5-19 shows a sample subscale test article cross-section corresponding to the full-size test article in Figure 5-17. Parameters scaled by the 1/5th (20%) geometry factor include the Nextel bumper areal density, rear wall areal density, shield standoff, and projectile diameter. The foam spacer material and the bladder restraint layer were not used in the subscale test article because these have little influence on the ballistic performance of the full-size test article. Parameters that remain the same in the scaling tests between full size and 1/5th scale test articles include the projectile impact angle, speed, and material. Also, target materials (i.e., Nextel 312 bumpers and Kevlar rear wall) were kept constant, although finer fabric/weave styles were selected for the 1/5th-scale test articles (for instance, Nextel AF10 was substituted in the 1/5th-scale tests for Nextel AF62 in the full-scale tests).
Subscale testing was used to verify ballistic limits of the MS shield before full-scale verification testing. In addition, the subscale tests helped to establish the best bumper and shield configurations for the final test article (Table 5-6). The location and areal density (i.e., number of Nextel sheets) of the Nextel bumper layers was established after a series of alternatives were tested in the 1/5th-scale tests. It is clear from the subscale tests that one of the best configuration options was selected for full-scale development. This experience illustrates the savings in time and cost that are possible with a carefully planned subscale shield test program leading to more effective full-scale shield development.
Table 5-6. Multi-Shock Test Results to Optimize MS Shield Parameters Rank based on least damage to rear wall.
All 1/5th scale targets, 8.1 cm total standoff, 0.285 g/cm2 overall shield areal density, using 0.32-cm- and 0.36-cm-dia. aluminum projectiles, 6.5 km/s ±0.1 km/s, normal impact (0o)
Rank Layer 1 Layer 2 Layer 3 Layer 4 Layer 5
1 4 Nextel 4 Nextel 2 Nextel 2 Nextel, 1 Kevlar 2 Kevlar
2 4 Nextel 4 Nextel 2 Nextel 2 Nextel 3 Kevlar
3 3 Nextel 3 Nextel 3 Nextel 3 Nextel, 1 Kevlar 2 Kevlar
4 2 Nextel 4 Nextel 4 Nextel 2 Nextel, 1 Kevlar 2 Kevlar
5 1 Nextel 2 Nextel 4 Nextel 4 Nextel, 1 Kevlar 2 Kevlar
6 4 Nextel 4 Nextel 4 Nextel, 1 Kevlar 2 Kevlar
0.36cm Al2017T46 km/s, 45o
(4) Nextel AF10
(4) Nextel AF10
(2) Nextel AF10
(2) Nextel AF10
(2) Kevlar KM2Aluminized mylar
2cm
2cm
2cm
2cm(1) Kevlar KM2

72
Shielding Application: Nextel/Kevlar Enhanced Whipple for International
Space Station
11.4
cm
1.35cm Al 7 km/sec, 0 deg
0.2cm Al 6061-T6
6 Nextel AF626 Kevlar 710
MLI
0.48cm Al 2219T87
Hypervelocity Impact Data and Analyses Used to Develop Shielding Ballistic Limit Equations.
Expect no rearwall failure below curves
0
0.2
0.4
0.6
0.8
1
1.2
1.4
1.6
1.8
2
0 2 4 6 8 10 12 14 16
Velocity (km/s)
0 deg
30 deg
45 deg
60 deg
Light-Gas Gun DataShaped Charge & 3-stage launcher Data
Alu
min
um
Cri
tica
l Par
ticl
e D
ia. (
cm)
SECTION 6
SUMMARY This report presents tools for reducing risks to spacecraft from meteoroid and debris (M/D) impact,
which have been applied to the Space Shuttle and ISS. These include (1) a process to assess M/D impact risks and identify risk drivers, (2) analytical techniques to evaluate alternative shielding materials, (3) protocols for using HVI tests in the shielding development process, (4) design and operational guidelines to reduce M/D risks, (5) shielding alternatives to meet a variety of M/D requirements and spacecraft constraints, and (6) equations that can be used in sizing the various shield elements and predicting shielding performance.
The process has been successful in reducing critical and early mission termination risks to the Space Shuttle from meteoroid/debris impact by a factor of 3.
The equations presented in this work have been used to design and implement ISS shields. These are the best shields in terms of stopping power and the most efficient shields in terms of weight and volume than any others previously flown in space.
Shields protecting ISS critical areas from meteoroid/debris impact include the Whipple shield, Nextel/Kevlar stuffed Whipple shield, and multi-shock shield. In addition, effective methods have been established to add meteoroid/debris protection to the thermal blankets that often cover external equipment and components of satellites and spacecraft. Design and performance equations have been developed for the “impact toughened” thermal blankets as well.

73
The BLEs can be used to design similar shields
applicable for other spacecraft. For instance, a Nextel/Kevlar multi-shock shield was developed for protecting the CONTOUR (comet nucleus tour) spacecraft from meteoroid particles. This small satellite will be exposed to the same flux in the few minutes during the flybys of 3 different comet nuclei as an equivalent of 10,000 years exposure to the orbital debris environment in low Earth orbit.
Impact Toughened Multi-Layer Insulation (MLI) Thermal Blanket
fiberglass cloth (& Al foil with Soyuz)
Aluminum pressure shell
2 Nextel AF10
Nextel/Kevlar addition to MLI will Increase ballistic limit projectile size.
Multi-layer insulation (MLI)3 Kevlar KM2 (CS-705)
Nextel/Kevlar Enhanced Whipple Shield capability to stop large meteoroid/debris particles within a short standoff makes it ideal for application to protecting high-
impact risk areas of ISS.
Stuffed Whipple Shield
Earth
Stuffed Whipple Shield
Earth
VelocityDirection
NASDAJEM, CAM & JEM LM
ESAColumbus, Node 2 & 3

74
SECTION 7
FORWARD WORK Forward work in the area of meteoroid/debris protection is in three areas: (1) continue to develop
improved shielding, (2) support this effort with more data and analysis, particularly in the ultra-high-velocity regime (> 10 km/s), and (3) develop sensors to monitor shield health.
Enhanced Shielding Development and Implementation. The work in developing and implementing advanced, low-weight, high-performance shielding should be continued.
New materials are constantly under development. For instance, nanotubes offer the promise of strength-to-weight ratios far higher (by a factor of 5) than Kevlar [62]. They hold particular promise for intermediate and rear wall materials in M/D shielding.
Lightweight, deployable shielding will eventually become the M/D protection standard for future spacecraft. TransHab shielding is a good example of the best type of shielding to date. It combines multiple ceramic fabric bumpers to achieve excellent projectile disruption, high-strength Kevlar rear wall for efficiently stopping the debris cloud, and low-density open-cell foam that allows the shield to be packaged in a small volume for launch and deployed on orbit to provide an exceptionally large standoff (40 cm).
New materials will be required for shielding crews and critical equipment from meteoroid/debris impact for future missions. More effective and weight-efficient shielding is necessary to assure crew safety and mission success on long-duration human flights beyond low Earth orbit and to the Moon, Mars, and beyond. Mars is a very long distance from home, and stringent safety standards in terms of high PNP requirements are anticipated. Thus, weight savings in implementing improved shielding materials and techniques will be essential. Materials that combined meteoroid/debris and radiation protection would be advantageous.
New shielding configurations should be investigated. For instance, rear walls could be textured to suppress spall. Preliminary hydrocode and impact test data show positive results of the concept.
Test Capability. HVI tests will be required to support shielding development. In particular, impact data above 10 km/s are required. For instance, the electromagnetic and electrothermal launchers at the Lehrstuhl für Raumfahrttechnik (LRT) at the Technical University of Munich [60] hold promise. If plasma launched projectiles from the plasmadynamic accelerator can be scaled up to launch tenths of a gram to over 10 km/s, it would become a major gold mine of data on shield response. Inhibited shaped charge data (Fig. 2-5) should also be obtained, but more control of impactor shape is desired. Continued hydrocode studies will support the effort of interpreting high-speed test data; i.e., to back out shape-
View from STS-103. We will need better (lower weight, higher performance) meteoroid/debris shields to support exploration of the solar system.
Nanotubes and other carbon forms

75
effects from the >10 km/s impact data. BLEs will be verified with a combination of test and hydrocode assessments.
Smart Shields and Impact Detection. Impact detectors have been proposed as a “space weather station” for meteoroid/debris impacting ISS and other spacecraft [63, 69]. Impact detectors combined and imbedded within the shielding itself can provide similar ability to detect external impacts while also distinguishing the depth of the penetration, and thus monitoring the “health” of the shielding as well. Development of “smart shields” should be pursued. For instance, consider the CONTOUR type mission. A scientific instrument that counts impacts that penetrate each layer could be imbedded within the shielding. In principal, an impact detector the size of spacecraft can be flown. For instance, thin aluminized polymer sheets that are included in a make/break circuit within a multi-shock shield, would be useful to monitor impacts on the outer and inner layers of the shield. Of course, smaller impacts on the exterior will be more numerous, while larger impacts that penetrate deeper will be less numerous. Counts of both small and large impactors would be scientifically useful to calibrate dust models, while providing the ability to monitor shielding performance and health.
Textured Rear Surface Simulation Results Hydrocode simulation of 0.32-cm aluminum projectile impacting at 6.5 km/s on a 1.27-cm-thick aluminum target with textured rear surface (t=0 sec at right, t=20µs below) compared to an impact on aluminum target with a smooth rear surface (second below). The textured target is 95% of the mass of the smooth target, yet shows less detached spall than the smooth target.
t = 20 µs
t = 20µs
LRT/Technical University of Munich Plasmadynamic Accelerator [60]
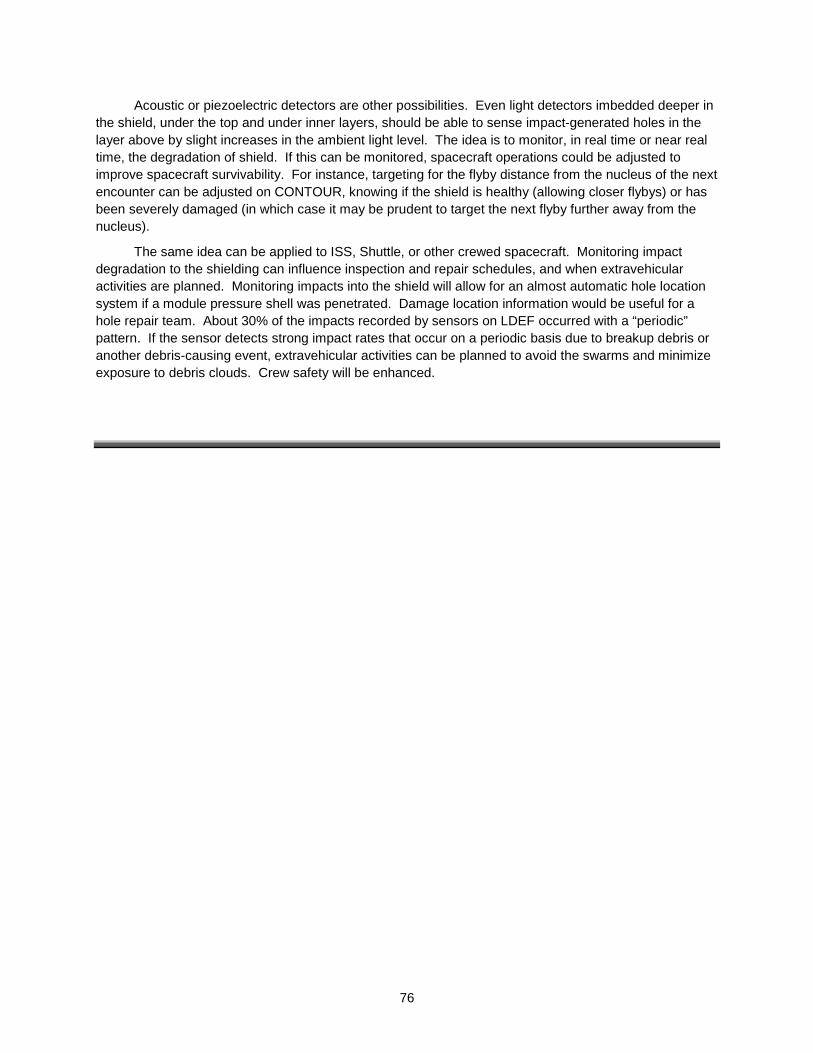
76
Acoustic or piezoelectric detectors are other possibilities. Even light detectors imbedded deeper in the shield, under the top and under inner layers, should be able to sense impact-generated holes in the layer above by slight increases in the ambient light level. The idea is to monitor, in real time or near real time, the degradation of shield. If this can be monitored, spacecraft operations could be adjusted to improve spacecraft survivability. For instance, targeting for the flyby distance from the nucleus of the next encounter can be adjusted on CONTOUR, knowing if the shield is healthy (allowing closer flybys) or has been severely damaged (in which case it may be prudent to target the next flyby further away from the nucleus).
The same idea can be applied to ISS, Shuttle, or other crewed spacecraft. Monitoring impact degradation to the shielding can influence inspection and repair schedules, and when extravehicular activities are planned. Monitoring impacts into the shield will allow for an almost automatic hole location system if a module pressure shell was penetrated. Damage location information would be useful for a hole repair team. About 30% of the impacts recorded by sensors on LDEF occurred with a “periodic” pattern. If the sensor detects strong impact rates that occur on a periodic basis due to breakup debris or another debris-causing event, extravehicular activities can be planned to avoid the swarms and minimize exposure to debris clouds. Crew safety will be enhanced.

77
REFERENCES 1. J.L. Crews and B.G. Cour-Palais, US Patent Number 5,067,388, Hypervelocity Impact
Shield, 1991.
2. J.L. Crews, E.L. Christiansen, J.H. Robinson, J.E. Williamsen, A.M. Nolen, US Patent Number 5,610,363, Enhanced Whipple Shield, 1997.
3. The NASA Johnson Space Center Hypervelocity Impact Technology Facility (HITF), web site, http://hitf.jsc.nasa.gov/hitfpub/main/index.html
4. J.L. Crews and E.L. Christiansen, “The NASA JSC HITF,” AIAA Paper No.92-1640, 1992.
5. NASA, Meteoroid Environment Model, “Space Station Program Natural Environment Definition for Design,” SSP-30425, Rev.B, 1993. Document available on ISS web site: http://ts0101r.jsc.nasa.gov:8800/cgi-bin/docchk?27023
6. NASA, Debris Environment Model, “Space Station Program Natural Environment Definition for Design,” SSP-30425, Rev.B, 1993. Document available on ISS web site: http://ts0101r.jsc.nasa.gov:8800/cgi-bin/docchk?27023
7. D.J. Kessler, et al., “A Computer-Based Orbital Debris Environment Model for Spacecraft Design and Observations in Low Earth Orbit,” NASA TM 104825, 1996. Document available on NASA web site: http://sn-callisto.jsc.nasa.gov/model/ordem96.html
8. National Research Council, Protecting the Space Station from Meteoroids and Orbital Debris, National Academy Press, 1997.
9. E.L. Christiansen, Design Practices for Spacecraft Meteoroid/Debris (M/D) Protection, Hypervelocity Shielding Workshop Proceedings, Institute of Advanced Technology Catalog Number IAT.MG-0004 (1999).
10. National Research Council, Orbital Debris-A Technical Assessment, National Academy Press, 1995.
11. D.J. Kessler, R.C. Reynolds, and P.D. Anz-Meador, Orbital Debris Environment for Spacecraft Designed to Operate in Low Earth Orbit, NASA TM-100471, 1989.
12. E.L. Christiansen, R.P. Bernhard, J.L. Hyde, J.H. Kerr, K.S. Edelstein, J. Ortega, J.L. Crews, Assessment of High Velocity Impacts on Exposed Space Shuttle Surfaces, Proceedings of the First European Conference on Space Debris, ESA SD-01, pp.447-452, 1993.
13. G. Levin and E.L. Christiansen, The Space Shuttle Program Pre-Flight Meteoroid and Orbital Debris Risk/Damage Predictions and Post-Flight Damage Assessments,” ESA SP-393, Proceedings of the Second European Conference on Space Debris, pp. 633-636, 1997.
14. R.P. Bernhard, E.L. Christiansen, and D.J. Kessler, Orbital Debris as Detected on Exposed Spacecraft, Int. Journal Impact Engineering, 20, pp.111-120, 1997.
15. E.L. Christiansen, R.P. Bernhard, N. Hartsough, Orbiter Meteoroid/Orbital Debris Impacts: STS-50 (6/1992) through STS-86 (10/1997), NASA JSC-28033, 1998.
16. J.H. Kerr, et al., STS-103 Orbiter Meteoroid/Orbital Debris Impact Damage Analysis, JSC-29136, 2000.
17. E.L. Christiansen, “Design and Performance Equations for Advanced Meteoroid and Debris Shields,” Int. Journal Impact Engineering, 14, pp. 145-156, 1993.
78
18. National Research Council, Protecting the Space Shuttle from Meteoroids and Orbital Debris, National Academy Press, 1997.
19. J.P. Loftus, E.L. Christiansen, W.C. Schneider, and M. Hasselbeck, Shuttle Modifications for Station Support, IAF-97-IAF.I.3.08, 48th International Astronautical Congress, October 6-10, 1997.
20. T.E. Jensen, S.E. Loyd, D.W. Whittle, E.L. Christiansen, Visible Effects of Space Debris on the Shuttle Program, IAA-97-IAA.6.4.02, 48th International Astronautical Congress, October 6-10, 1997.
21. E.L. Christiansen, D.M. Curry, J.H. Kerr, E. Cykowski, and J.L. Crews, Evaluation of the impact resistance of reinforced carbon-carbon, Proceedings of the ninth International Conference on Composite Materials (ICCM-9), Madrid Spain, 1993.
22. E.L. Christiansen and L. Friesen, “Penetration Equations for Thermal Protection Materials,” Int. Journal Impact Engineering, 20, pp.153-164, 1997.
23. E.L. Christiansen, J.H. Robinson, J.L. Crews, G.D. Olsen, and F. Vilas, "Space Station Freedom Debris Protection Techniques," Advances in Space Research, Vol.13, No.8, pp.(8)191-(8)200, 1993, (Proceedings of the 29th COSPAR, August 1992).
24. M.E. Zolensky, H.A. Zook, F. Horz, D.R. Atkinson, C.R. Coombs, A.J. Watts et al., Interim Report of Meteoroid and Debris Special Investigation Group, LDEF 69 Months in Space – 2nd Post-Retrieval Symposium, NASA CP-3194, 277-302 (1993).
25. J.L. Rhatigan, E.L. Christiansen and M.L. Fleming, On Protection of Freedom’s Solar Dynamic Radiator From the Orbital Debris Environment: Part II – Further Testing and Analysis, Journal of Solar Energy Engineering, 114, p.142, August 1992.
26. J.L. Rhatigan, E.L. Christiansen and M.L. Fleming, On Protection of Freedom’s Solar Dynamic Radiator From the Orbital Debris Environment: Part I – Preliminary Analysis and Testing, Journal of Solar Energy Engineering, 114, p.135, 1992.
27. E.L. Christiansen, Investigation of Hypervelocity Impact Damage to Space Station Truss Tubes, Int. Journal of Impact Engineering, 10, pp.125-133, 1990.
28. E.L. Christiansen, et al., “Hypervelocity Impact Testing Above 10 km/s of Advanced Orbital Debris Shields,” Shock Compression of Condensed Matter-1995, AIP Conference Proceedings 370, Part 2, pp. 1183-1186, 1995.
29. G. Sanchez and E.L. Christiansen, "FGB Energy Block Meteoroid and Orbital Debris (M/OD) Shield Test Report," NASA Johnson Space Center, JSC-27460, 1996.
30. G.A. Sanchez, R. Westberry, E.L. Christiansen, International Space Station Common Module, Node, and Cupola Windows Meteoroid/Debris Development Tests, Phase 1, NASA Report No. JSC-27509, August 1998.
31. E.L. Christiansen, B.G. Cour-Palais, L.J. Friesen, Extravehicular Activity Suit Penetration Resistance, Int. Journal of Impact Engineering, 23, pp. 113-124, 1999.
32. E.L. Christiansen, J.L. Crews, J.P. Whitney, Debris Cloud Ablation in Gas-Filled Pressure Vessels, Int. Journal of Impact Engineering, 20, pp.173-184, 1997.
33. J.D. Walker, D.J. Grosch, S.A. Mullin, “Experimental Impacts Above 10 km/s,” Int. J. Impact Engng, 17, pp.903-914, 1995.
34. E.L. Christiansen, J.L. Crews, J.E. Williamsen, J.H. Robinson, A.M. Nolen, “Enhanced Meteoroid and Orbital Debris Shielding,” Int. J. Impact Engng, 17, pp. 217-228, 1995.
79
35. J.H. Kerr, E.L. Christiansen, J.L. Crews, “Hydrocode Modelling of Advanced Debris Shield Designs,” Shock Compression of Condensed Matter-1995, AIP Conference Proceedings 370, Part 2, pp.1167-1170, 1995.
36. E.P. Fahrenthold, “Numerical Simulation of Impact on Hypervelocity Shielding,” presented at the 1998 Hypervelocity Shielding Workshop, Int. J. Impact Engng, 23, 1999.
37. M.B. Boslough, J.A. Ang, L.C. Chhabildas, B.G. Cour-Palais, E.L. Christiansen, and J.L. Crews, “Hypervelocity Testing of Advanced Shielding Concepts for Spacecraft Against Impacts to 10 km/s,” Int. J. Impact Engng, 14, pp. 95-106, 1993.
38. B.G. Cour-Palais, “Hypervelocity Impact in Metals, Glass, and Composites,” Int. J. Impact Engng, 5, pp. 221-237, 1987.
39. B.G. Cour-Palais and J.L. Crews, “A Multi-Shock Concept for Spacecraft Shielding,” Int. Journal of Impact Engineering, 10, pp. 135-146, 1990.
40. E.L Christiansen and J.H. Kerr, “Mesh Double-Bumper Shield: A Low-Weight Alternative for Spacecraft Meteoroid and Orbital Debris Protection,” Int. Journal of Impact Engineering, 14, pp. 169-180, 1993.
41. E.L Christiansen, J.H. Kerr, H.M. De La Fuente, W.C. Schneider, “Flexible and Deployable Meteoroid/Debris Shielding for Spacecraft,” presented at the 1998 Hypervelocity Shielding Workshop, Int. J. Impact Engng, 23, pp. 125-136, 1999.
42. E.L. Christiansen, J.L. Hyde and G. Snell, “Spacecraft Survivability in the Meteoroid and Debris Environment,” AIAA Paper No. 92-1409, 1992.
43. E.L. Christiansen, J.L. Hyde, D. Lear, “Meteoroid/Orbital Debris Impact Damage Prediction for the Russian Space Station Mir,” ESA SP-393, Proceedings of the Second European Conference on Space Debris, pp.503-508, March 1997.
44. NASA SP-8042, Meteoroid Damage Assessment, Space Vehicle Design Criteria (Structures), May 1970.
45. E.L. Christiansen, Advanced Meteoroid and Debris Shielding Concepts, AIAA Paper No. 90-1336, AIAA/NASA/DOD Orbital Debris Conference: Technical Issues and Future Directions, Baltimore, MD, April 16-19, 1990.
46. F.L. Whipple, Meteorites and Space Travels, Astronomical Journal, no.1161, p.131, 1947.
47. B.G. Cour-Palais, Meteoroid Protection by Multi-Wall Structures, AIAA Hypervelocity Impact Conference, AIAA Paper Number 69-372, 1969.
48. E.L. Christiansen, Whipple Shield Sizing Equations, NASA JSC Memorandum Number SN3-91-19, March 1991.
49. J.P.D. Wilkinson, A Penetration Criterion for Double-Walled Structures Subject to Meteoroid Impact, AIAA Journal, Vol. 7, No.10, pp.1937-1943, October 1969.
50. C.R. Nysmith, An Experimental Impact Investigation of Aluminum Double-Sheet Structures, AIAA Paper No. 69-375, AIAA Hypervelocity Impact Conference, April 30-May 2, 1969.
51. E.L. Christiansen, Evaluation of Space Station Meteoroid/Debris Shielding Materials, Eagle Engineering Report No. 87-163, 1987.
52. A.K. Hopkins, T.W. Lee, and H.F. Swift, Material Phase Transformation Effects Upon Performance of Spaced Bumper Systems, Journal of Spacecraft and Rockets, 9, pp.342-345, May 1972.
53. W.R. Stump and E.L. Christiansen, Secondary Impact Hazard Assessment, NASA PO-T-256M, Eagle Engineering Report No. 86-128, 1986.

80
54. P.D. White and J.L. Crews, Description and capabilities of a new ultra-high speed framing camera at NASA JSC’s Hypervelocity Impact Test Facility, Proceedings of the 44th Meeting of the Aeroballistic Range Association, 1992.
55. M.L. Alme, E.L. Christiansen and B.G. Cour-Palais, Hydrocode Simulations of the Multi-Shock Meteoroid and Debris Shield, Proceedings of the APS 1991 Topical Conference on Shock Compression on Condensed Matter, Williamsburg, VA, June 17-20, 1991.
56. E.L. Christiansen, International Space Station (ISS) Meteoroid/Orbital Debris Shielding, Cosmonautics and Rocket Engineering, Russian Academy of Sciences, TsNIIMASH, No.18, pp.166-180, 2000.
57. H.F. Swift, Hypervelocity Impact Mechanics, In: Impact Dynamics (Zukas, ed.), John Wiley & Sons, 1982.
58. F. Terrillon, H.R. Warren, and M.J. Yelle, Orbital Debris Shielding Design of the RADARSAT Spacecraft, IAF-91-283, 1991.
59. M.L. Alme and C.E. Rhoades, A Computational Study of Projectile Melt in Impact with Typical Whipple Shields, Int. Journal of Impact Engineering, 17, pp.1-12, 1995.
60. E. Igenbergs, J. Spörer, M. Rott, B. Dirr, and Kh. G. Schmitt-Thomas, Hypervelocity Impacts of High Pressure / High Density Plasma Pulses on Metallic Surfaces, Int. Journal of Impact Engineering, 17, pp.443-453, 1995.
61. B.G. Cour-Palais and K. Dahl, Standardization of Impact Damage Classification and measurements for metallic targets, NASA Johnson Space Center, 1990.
62. NASA JSC Nanotube Web site: http://mmpptdpublic.jsc.nasa.gov/jscnano/
63. E. Igenbergs, Personal Communication, June 1999.
64. D.E. Gault and E.D. Heitowit, The Partition of Energy for Hypervelocity Impact Craters formed in Rock, Sixth Symposium on Hypervelocity Impact, pp.419-456, 1963.
65. S.W. Kieffer and C.H. Simonds, The Role of Volatiles and Lithology in the Cratering Process, Rev. Geophysics and Space Physics,18, pp. 143-181, 1980.
66. C.J. Maiden, J.W. Gehring, A.R. McMillian, Investigation of Fundamental Mechanism of Damage to Thin Targets by Hypervelocity Projectiles, NASA TR-63-225, 1963.
67. S.P. Marsh, LASL Shock Hugoniot Data, University of California Press, Berkeley, California, 1980.
68. R. Kinslow (ed): High-Velocity Impact Phenomena, Academic Press, New York, 1970.
69. E. Igenbergs, et al., Mars Dust Counter, Earth Planets Space, 50, pp.241-245, 1998.

81
APPENDIX A
PROCEDURE FOR ESTIMATING PARTICLE SIZE CAUSING SHUTTLE DAMAGE
This section describes the methods used to estimate the particle size causing the largest identified Shuttle impact damage as given in Section 1. An assumption is made on probable impact conditions such as velocity, impact angle, particle density, and shape. Scanning electron microscope/energy dispersive X-ray (SEM/EDX) results are used to determine if the particle is orbital debris or meteoroid. The velocity is assumed to be the average velocity for the particular environment using the reference models [5, 7]. An average impact angle of 45o is used unless the circumstances of the impact or shape of the damage indicate another angle is more likely (location of impact, geometry of nearby structure, etc.).
The “average” or best estimate of impact conditions is used in appropriate penetration equations for the target material impacted to assess a particle size causing the damage [12, 15, 17, 22]. In some cases, two or more equations can be used to determine different estimates of the particle size. Engineering judgment is then employed to select the most appropriate result or the results are averaged. This is a simplified method that will generate an estimated particle size.
A more complex method to assess the environment flux involves predicting the damage in a probability analysis code such as the BUMPER code, which considers all impact angles and velocities to estimate the amount of damage, and then comparing the output to the damage found such as was completed with LDEF data [42] and with Shuttle craters/damage [12]. A.1A.1A.1A.1 Flight ParametersFlight ParametersFlight ParametersFlight Parameters Table A-1 provides flight parameters (year of flight, altitude, inclination, duration) and areas surveyed for meteoroid/debris impacts for the Shuttle flights assessed for meteoroid/debris impacts. The largest impactors from the analysis are reported in Section 1.

82
Table A-1. Flight Parameters for Missions With M/D Survey
Mission yearduration (days)
altitude (km)
inclination (deg)
Areas surveyed for M&OD impacts
Area surveyed
(m2)STS-50 1992 13.8 296 28.5 RCC, Windows, Radiators 161STS-51 1993 9.8 296 28.5 Windows, Radiators 120STS-52 1992 9.9 302 28.5 Radiators 117STS-55 1993 10.0 302 28.5 Ku-Band 2STS-56 1993 9.3 296 57 Windows, Ku-Band 5STS-59 1994 11.2 224 57 Windows, Radiators 120STS-60 1994 8.3 354 57 Thrusters 12STS-61 1993 10.8 594 28.5 Radiators 117STS-63 1995 8.3 394 51.6 Radiators 117STS-64 1994 11.0 259 57 RCC, Radiators 158STS-65 1994 14.7 296 28.5 RCC, betacloth 43STS-66 1994 10.9 304 57 Radiators 117STS-68 1994 11.2 222 57 Radiators 117STS-70 1995 8.9 296 28.5 Windows 3STS-71 1995 9.8 394 51.6 RCC, Windows, Radiators 161
STS-72 1996 8.9 463 28.5RCC, Windows, Radiators, speed
brake164
STS-73 1995 15.9 278 39RCC, Windows, Radiators, FRSI,
wing tile213
STS-75 1996 15.7 296 28.5RCC, Windows, Radiators, TSS
pallet175
STS-76 1996 9.2 394 51.6 RCC, Windows, Radiators, tile 163STS-77 1996 10.0 283 39 RCC, Windows, Radiators 161STS-79 1996 10.1 394 51.6 RCC, Windows, Radiators, FRSI 211STS-80 1996 17.7 404 28.5 RCC, Windows, Radiators, FRSI 211STS-81 1997 10.2 394 51.6 RCC, Windows, Radiators, FRSI 211STS-82 1997 10.0 580 28.5 RCC, Windows, Radiators, FRSI 211STS-83 1997 4.0 296 28.5 RCC, Windows, Radiators, FRSI 211STS-84 1997 9.2 394 51.6 RCC, Windows, Radiators, FRSI 211STS-85 1997 11.9 296 57 RCC, Windows, Radiators, FRSI 211STS-86 1997 10.8 394 51.6 RCC, Windows, Radiators, FRSI 211STS-94 1997 15.7 296 28.5 RCC, Windows, Radiators, FRSI 211missions not part of M&OD survey during period from STS-50 through STS-86: STS-46, STS-47, STS-53,
STS-54, STS-57, STS-58, STS-62, STS-67, STS-69, STS-74, STS-78
Table A-2 provides the average impact conditions used for the 20 significant impacts based on the environment models [5, 7], although some exceptions were made. For the STS-73 FRSI impact, an estimate of velocity and angle of impact was made based on the condition of the target damage, which indicated that the particle impacted at slower speed than the “average” and at a steeper angle (oblique impact effects observed in the surface hole and crater), as well as the size of the recovered fragments, which set a minimum size of the impactor. For the STS-86 exterior manifold impact, the condition of the target (hole in beta cloth and single crater in tube) and hypervelocity impact test results indicated the impact occurred at a slower speed and steeper angle than the “average.”
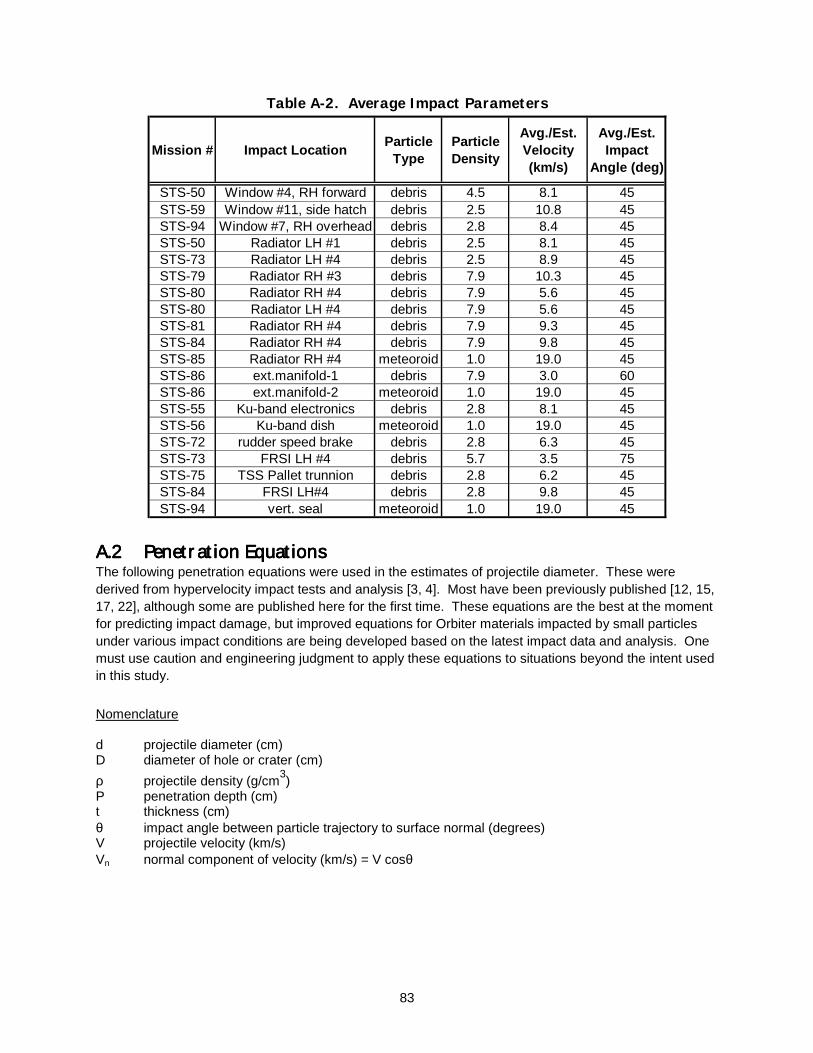
83
Table A-2. Average Impact Parameters
Mission # Impact LocationParticle
TypeParticle Density
Avg./Est. Velocity (km/s)
Avg./Est. Impact
Angle (deg)
STS-50 Window #4, RH forward debris 4.5 8.1 45STS-59 Window #11, side hatch debris 2.5 10.8 45STS-94 Window #7, RH overhead debris 2.8 8.4 45STS-50 Radiator LH #1 debris 2.5 8.1 45STS-73 Radiator LH #4 debris 2.5 8.9 45STS-79 Radiator RH #3 debris 7.9 10.3 45STS-80 Radiator RH #4 debris 7.9 5.6 45STS-80 Radiator LH #4 debris 7.9 5.6 45STS-81 Radiator RH #4 debris 7.9 9.3 45STS-84 Radiator RH #4 debris 7.9 9.8 45STS-85 Radiator RH #4 meteoroid 1.0 19.0 45STS-86 ext.manifold-1 debris 7.9 3.0 60STS-86 ext.manifold-2 meteoroid 1.0 19.0 45STS-55 Ku-band electronics debris 2.8 8.1 45STS-56 Ku-band dish meteoroid 1.0 19.0 45STS-72 rudder speed brake debris 2.8 6.3 45STS-73 FRSI LH #4 debris 5.7 3.5 75STS-75 TSS Pallet trunnion debris 2.8 6.2 45STS-84 FRSI LH#4 debris 2.8 9.8 45STS-94 vert. seal meteoroid 1.0 19.0 45
A.2A.2A.2A.2 Penetration EquationsPenetration EquationsPenetration EquationsPenetration Equations The following penetration equations were used in the estimates of projectile diameter. These were derived from hypervelocity impact tests and analysis [3, 4]. Most have been previously published [12, 15, 17, 22], although some are published here for the first time. These equations are the best at the moment for predicting impact damage, but improved equations for Orbiter materials impacted by small particles under various impact conditions are being developed based on the latest impact data and analysis. One must use caution and engineering judgment to apply these equations to situations beyond the intent used in this study.
Nomenclature d projectile diameter (cm) D diameter of hole or crater (cm)
ρ projectile density (g/cm3)
P penetration depth (cm) t thickness (cm) θ impact angle between particle trajectory to surface normal (degrees) V projectile velocity (km/s) Vn normal component of velocity (km/s) = V cosθ

84
Window Equations The projectile length, or perpendicular aspect to target, is related to penetration depth. Penetration depth (P) into semi-infinite glass is estimated as:
P = 0.53 ρ0.5 d1.06 Vn(2/3) (1)
d = [1.89 Pρ-0.5 Vn
-(2/3)]0.94 (2) The projectile diameter, or aspect parallel to target, is related to the crack & flaw (or surface spall) diameter. The crack/flaw diameter is predicted with the following equation:
D = 30.9 d1.33 ρ0.44 Vn0.44 (3)
Projectile diameter is:
d = 0.076 D0.75 ρ-0.33 Vn-0.33 (4)
Using Equations 2 and 4, and the parameters in Table A-2, the following particle estimates are made for the glass impacts described in Section 1.
Table A-3. Estimated Size of Projectiles Causing Significant Window Damage
Mission # WindowProj. Length (mm) Eq. 2
Proj. Diameter
(mm) Eq.3
STS-50 RH#4 0.20 0.20
STS-59 #11 0.22 0.33
STS-94 RH#7 0.24 0.26
Radiator Thermal Tape & Facesheet Hole Size Equation Hole size in the thermal tape can be estimated from the following equation:
Dtape = 1.028 d ρ(2/3) V(2/3) (5)
d = 0.97 Dtape ρ-(2/3) V-(2/3) (6)
The larger hits on the radiator all went through the facesheet. A minimum particle size to perforate the facesheet can be estimated from the following equation (where dperf is in units of <mm>):
dperf = 1.05 ρ-(1/3) Vn-(2/3) (7)
The hole size in the facesheet (DFS) can be used to access the impacting projectile size. The following equation is solved for projectile diameter by non-linear equation solving techniques (e.g., Newton-Raphson). For small facesheet hole diameters, this equation is not valid (i.e., if the hole size is less than 0.8 m).
DFS = 0.04 d(1/3) V + 0.9 d (8)

85
Particle Size Estimate for External Radiator Tube Cratering The following equation is used to evaluate particles leaving craters of depth P in the external radiator manifold hard lines (aluminum). This equation should not be used to predict particle size causing tube rupture/leak (it over-predicts the size causing leaks).
d = 2.7 P0.95 ρ-0.47 Vn-0.63 (9)
FRSI Hole Size Equation Equation 10 is used to assess holes created in FRSI on outside of the payload bay doors.
DFRSI = 2.85 d2 V
2/3 ρ0.5
(cos2/3θ + sin
1/3θ) (10) Titanium penetration Equation Penetration depth in semi-infinite titanium alloy (Ti 6Al 4V) predicted with the following equation:
Pti = 0.162 d1.06 ρ0.5 Vn(2/3) (11)
Through-Hole in Inconel Steel The Inconel hole predicter (Equation 12) is more accurate when the hole > 1.1 plate thickness. For holes near the ballistic limit, use the threshold perforation equation (Equation 13) to establish the minimum projectile diameter.
Dsteel = 2 d ρ1/3 Vn2/3 tsteel
1/3 (12)
dperf = 4.2 t0.95 ρ-0.47 Vn-0.63 (13)
Through-Holes in Graphite-Epoxy
d = DGr-Ep t-0.33 ρ-0.33 Vn
-2/3 (14) Sensitivity Assessment. As a sensitivity assessment, a 1-sigma range of orbital debris particle diameters was determined using the penetration equations for one impact (STS-50 window #4 impact) and a one standard deviation impact velocity variation from the mean velocity based on ORDEM96 velocity distributions. For the STS-50 operational profile, at a standard deviation from the mean of 8 km/s, 68% of the impacts are predicted to occur between 2.5 km/s and 12 km/s (Figures A-1 and A-2). Table 2 indicates the STS-50 impacting particle size was estimated to be a 0.2-mm-diameter titanium particle at 8.0 km/s average. At 2.5 km/s, the impact would be caused by a 0.42-mm titanium particle, and a 0.16-mm particle at 12 km/s. Therefore, using a 1-sigma velocity band, the damage is estimated to be caused by a 0.16-mm- to 0.42-mm-diameter titanium particle with a mean diameter of 0.2 mm (Figure A-3).
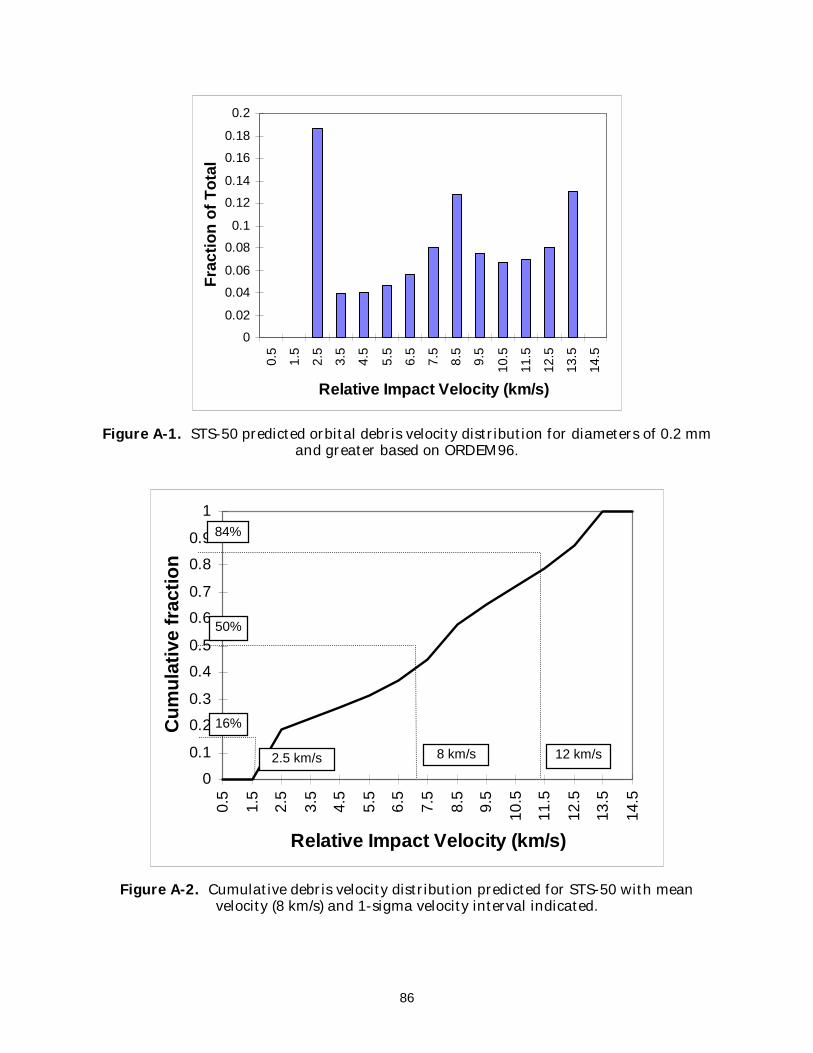
86
0
0.02
0.04
0.06
0.08
0.1
0.12
0.14
0.16
0.18
0.2
0.5
1.5
2.5
3.5
4.5
5.5
6.5
7.5
8.5
9.5
10.5
11.5
12.5
13.5
14.5
Relative Impact Velocity (km/s)
Fra
ctio
n o
f T
ota
l
Figure A-1. STS-50 predicted orbital debris velocity distribution for diameters of 0.2 mm and greater based on ORDEM96.
0
0.1
0.2
0.3
0.4
0.5
0.6
0.7
0.8
0.9
1
0.5
1.5
2.5
3.5
4.5
5.5
6.5
7.5
8.5
9.5
10.5
11.5
12.5
13.5
14.5
Relative Impact Velocity (km/s)
Cu
mu
lati
ve f
ract
ion
Figure A-2. Cumulative debris velocity distribution predicted for STS-50 with mean velocity (8 km/s) and 1-sigma velocity interval indicated.
84%
50%
16%
2.5 km/s 8 km/s 12 km/s

87
0
0.01
0.02
0.03
0.04
0.05
0.06
0.07
0.08
0 2 4 6 8 10 12 14 16
Impact Velocity (km/s)
Par
ticl
e D
iam
eter
(cm
)
Figure A-3. Particle diameter estimate causing STS-50 window #4 impact damage assuming 45o impact by a titanium orbital debris particle.
(particle size at the average impact velocity and at one-standard deviation velocity increment indicated)
0.42mm @ 1-sigma low velocity
0.2mm @ average velocity
0.16mm @ 1-sigma high

88
APPENDIX B
DESCRIPTION OF SHIELD MATERIALS EVALUATION ANALYTICAL MODEL
This appendix presents a “quick look” technique for evaluating the performance of candidate bumper systems when subjected to hypervelocity impact. The model predicts the fraction of the projectile that is shocked and the peak pressure to which the projectile and bumper are subjected. The criteria for a successful bumper are: (1) that impact with the shield material will deposit enough internal energy in the projectile to cause it to melt or vaporize, and (2) that the shield is thick enough to subject the projectile to shock pressures sufficient to melt the projectile. The calculations determine the following:
• Peak pressure experienced by the projectile and bumper. • Amount of internal energy left in the projectile after collision, in effect the temperature and state of
the projectile. • Minimum thickness of bumper necessary for the impact shock wave to traverse the entire length
of projectile before rarefaction waves dissipate the compressive shock.
The procedure follows well-trodden hypervelocity impact theory [64-66]. Rankine-Hugoniot relations describe conditions on either side of a shock front. Closed form solutions are given to these and other physical relationships. A one-dimensional approach is implemented. Although simplistic, the approach provides a method to allow rapid evaluation of a large number of projectile and shield materials, as a function of impact velocity, projectile size and bumper thickness. Symbols
c First term in the linear shock-velocity/particle-velocity Hugoniot (km/s) C Sound velocity, velocity of rarefaction wave (km/s) L Characteristic length or thickness of projectile or bumper (cm) s Second term in shock-velocity/particle-velocity Hugoniot (dimensionless) v Velocity (km/s) V Specific volume (cm3/g) = 1/ρ for equations 3, volume (cm3) for equations 17 and 18 ρ Density (g/cm3) P Pressure (kilobars) E Internal Energy (J/g) u Particle velocity (km/s) U Shock velocity (km/s) t time (micro-sec) subscripts: blank shocked state i impact o rest state t target p projectile
Details on the calculations and reference frames can be found elsewhere [51].

89
Peak Shock Pressure. The Rankine-Hugoniot equations for the conditions on either side of a shock front are the starting point. Conservation of momentum
P – P0 = 10 ρ U u (1) Conservation of mass
ρo U = ρ (U – u) (2) Conservation of energy
E – Eo = 100 (P + Po) (Vo – V)/2 (3) As a practical matter the initial pressures and internal energy can be assumed to be zero, thus equation 1 simplifies to
P = 10 ρ U u , (1a) and equation 3 becomes
E = 100 P (Vo – V)/2 . (3a) Or in terms of densities
E = 100 P ((1/ρo) – (1/ρ))/2 . (3b) The equation of state is in the form of a linear relation for shock velocity and particle velocity.
U = co + s u (4) This relation is satisfactory for virtually all solids free of phase changes over the range of interest and of substantial void space [67, 68]. Assuming the material within the shocked region on either side of the contact surface is at a single shock pressure and is moving as a single unit with one speed, the interface velocity and pressure can be expressed as:
Vi = up + ut (5) and
Pp = Pt . (6) Using equation 4 to eliminate the shock velocity in equation 1a
P = 10 ρo (co + su) u (7) and equation 5 to eliminate up results in the expressions:
Pp = 10 ρop (co + sp (vi – ut))(vi – ut) (8)
Pt = 10 ρot (co + st ut) ut (9) Peak shock pressures are calculated by solving a quadratic equation for particle velocity in the target, ut.
ρop (cop + sp (vi – ut))(vi – ut) = ρot ( cot + st ut) ut (10) The standard solution for the root of a quadratic equation is:
ut = (-b ± (b2 – 4ac)0.5)/2a (11)
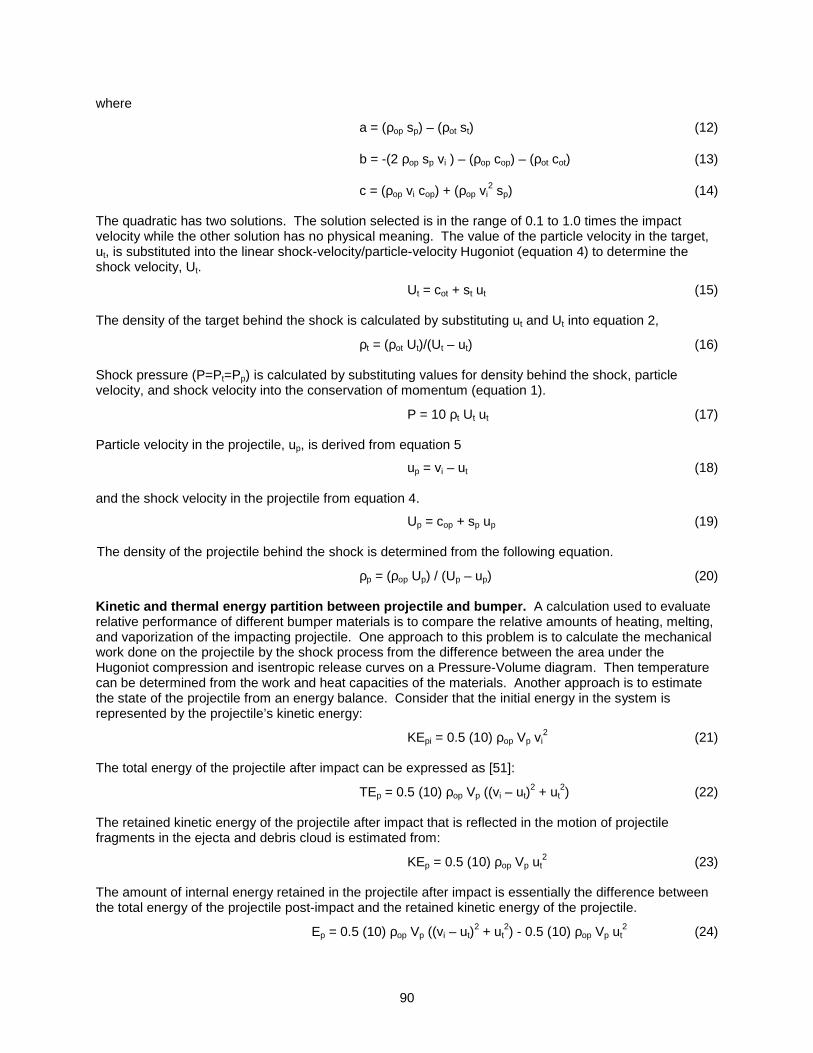
90
where
a = (ρop sp) – (ρot st) (12)
b = -(2 ρop sp vi ) – (ρop cop) – (ρot cot) (13)
c = (ρop vi cop) + (ρop vi2 sp) (14)
The quadratic has two solutions. The solution selected is in the range of 0.1 to 1.0 times the impact velocity while the other solution has no physical meaning. The value of the particle velocity in the target, ut, is substituted into the linear shock-velocity/particle-velocity Hugoniot (equation 4) to determine the shock velocity, Ut.
Ut = cot + st ut (15) The density of the target behind the shock is calculated by substituting ut and Ut into equation 2,
ρt = (ρot Ut)/(Ut – ut) (16) Shock pressure (P=Pt=Pp) is calculated by substituting values for density behind the shock, particle velocity, and shock velocity into the conservation of momentum (equation 1).
P = 10 ρt Ut ut (17) Particle velocity in the projectile, up, is derived from equation 5
up = vi – ut (18) and the shock velocity in the projectile from equation 4.
Up = cop + sp up (19) The density of the projectile behind the shock is determined from the following equation.
ρp = (ρop Up) / (Up – up) (20)
Kinetic and thermal energy partition between projectile and bumper. A calculation used to evaluate relative performance of different bumper materials is to compare the relative amounts of heating, melting, and vaporization of the impacting projectile. One approach to this problem is to calculate the mechanical work done on the projectile by the shock process from the difference between the area under the Hugoniot compression and isentropic release curves on a Pressure-Volume diagram. Then temperature can be determined from the work and heat capacities of the materials. Another approach is to estimate the state of the projectile from an energy balance. Consider that the initial energy in the system is represented by the projectile’s kinetic energy:
KEpi = 0.5 (10) ρop Vp vi2 (21)
The total energy of the projectile after impact can be expressed as [51]:
TEp = 0.5 (10) ρop Vp ((vi – ut)2 + ut
2) (22)
The retained kinetic energy of the projectile after impact that is reflected in the motion of projectile fragments in the ejecta and debris cloud is estimated from:
KEp = 0.5 (10) ρop Vp ut2 (23)
The amount of internal energy retained in the projectile after impact is essentially the difference between the total energy of the projectile post-impact and the retained kinetic energy of the projectile.
Ep = 0.5 (10) ρop Vp ((vi – ut)2 + ut
2) - 0.5 (10) ρop Vp ut2 (24)
91
In the evaluation, the ratios of retained internal energy to the energy required to melt and vaporize the projectile are calculated, yielding the estimated state of the projectile (i.e., whether solid, partially or fully melted, vaporized, etc.). Minimum required thickness of bumper. An estimate of the minimum shield thickness required to completely expose the projectile length to the impact shock is assessed. The basic methodology is to calculate the bumper thickness required to allow a compression shock wave to move throughout the length of the projectile before the arrival of the rarefaction wave that originates from the back of the bumper. Rarefaction waves move through shock-compressed bumper and projectile material where wave speeds are higher in compressed material compared to uncompressed material. Also, the compressed materials are thinner. Thus the rarefaction wave front is faster than the compression shock wave front moving through uncompressed projectile material. If a bumper is too thin, the rarefaction wave catches up with the shock wave moving through the projectile before the entire projectile is subjected to the shock. This leaves relatively lightly shocked projectile material that will travel through the bumper hole to crater and possibly penetrate the rear wall, or next layer in the shield. The optimum thickness bumper is one that is just thick enough to allow the compression shock to travel the entire projectile length before the arrival of the rarefaction. The equation to be solved is the time for the shock to travel through the unshocked projectile, top, which is to equal the time for the shock to travel to the back of the unshocked bumper, tot, plus the time for the rarefaction to travel through the compressed bumper, tt, and through the compressed projectile, tp.
top = tot + tt + tp (25)
where [51]: top = Lp / (10 Up) (26)
tot = Lt / (10 Ut) (27)
tt = Lt ρot / (10 ρt Ct) (28)
tp = Lp ρop / (10 ρp Cp) (29)
The following relation provides rarefaction velocity in highly compressed material.
C = U (0.49 + ((U-u)/U)2)0.5 (30) Combining these equations and solving for the ratio of bumper thickness to projectile length gives
Lt/Lp = ((1/Up) – [ρop/(ρp Cp)]) / [(ρot/(ρt Ct)]+(1/Ut)) (31) Equation 31 can be solved for the optimum bumper thickness, Lt, given projectile diameter, Lp. Figure B-1 shows results of the calculations for an aluminum-on-aluminum impact. Hugoniot parameters and other material properties are given in Figure B-2.

92
Figure B-1. Bumper performance from analytical model, aluminum 2024T3 projectile impacting Al 6061T6 bumper.
0.00
0.20
0.40
0.60
0.80
1.00
1.20
1.40
1.60
1.80
2.00
0.00 5.00 10.00 15.00
Impact Velocity km/sec
Pea
k P
res
(MB
), b
umpe
r th
k to
pro
ject
ile
diam
eter
rat
io &
pro
ject
ile m
elt
fract
ion
Pressure t/d fraction melt

93
Initial Temp. of Proj./Target (K) 173.00 Initial Temp. oMATERIAL PROPERTIES
Density c0 (eff) s (eff) K0 (eff)# g/cm3 km/s kbar
1 Alimina Coors Al2O3 15%SiO2 3.660 3.650 2.200 487.6042 Alumina Al2O3 Hot pressed 3.940 8.250 1.210 2681.6633 Aluminum 1100 2.714 5.392 1.341 789.0594 Aluminum 2024 Alloy 2.784 5.370 1.290 802.8195 Aluminum 6061 Alloy 2.703 5.350 1.340 773.6666 Aluminum 7075 Alloy 2.804 5.200 1.360 758.2027 Aluminum 921 T Alloy 2.833 5.041 1.420 719.9138 Aluminum (Gault&Heitowit) 2.750 5.300 1.370 772.0009 Anorthosite 2.730 4.170 1.120 474.717
10 Basalt (Gault&Heitowit) c0=2.60 2.860 2.310 1.620 193.00011 Boron Carbide (B4C) Lo Dens. 1.900 2.653 1.911 133.73012 Boron Carbide (B4C) Hi Dens. 2.400 7.409 1.307 1317.43913 Cadmium 8.639 2.480 1.640 531.33314 Carbon Graphite 3D fibers 1.519 2.52 1.14 96.61615 Composite 2D-CP C-PHEN. 1.350 3.900 2.200 205.33516 Copper 8.930 3.940 1.489 1386.25717 Feldspar Anorthosite NY 2.732 2.790 1.533 212.66218 Glass High Density (Shott) 5.085 1.813 1.611 167.14219 Glass Pyrex 2.230 1.730 1.550 66.74220 Glass Silica 2.204 3.180 0.990 222.87721 Gold 19.240 3.06 1.57 1796.85022 H2O Ice 0.910 1.280 1.560 15.02023 H2O Water 1.000 1.480 1.600 22.00024 Iron (Gault&Heitowit) 7.860 3.800 1.580 1135.0025 Iron Meteoroid (Gault) 7.88 3.46 1.72 943.36226 Lead 11.346 2.030 1.470 467.55727 Magnesium 1.740 4.492 1.263 351.09828 Magnesium AZ 31 B alloy 1.775 4.516 1.256 361.99829 Mullite Al6Si2O13 2.670 2.300 1.650 141.24330 Plastic Acrylic 1.185 2.527 1.536 75.67131 Plastic Epoxy 1.198 2.678 1.520 85.91732 Plastic Polyamide (Nylon) 1.146 3.910 1.180 175.20233 Plastic Polycarbonate 1.193 3.191 1.145 121.47734 Plastic Polyimide 1.414 1.615 1.490 36.88035 Plastic PVC (Boltron) 1.376 2.415 1.442 80.25136 Plastic Teflon 2.147 1.682 1.189 60.74137 Platinum 21.440 3.63 1.47 2829.79938 Sand - Sim. Lunar Regolith (Gault) 1.65 1.30 1.40 27.88539 Serpentine (Vermyen, Italy) 2.802 5.165 1.006 747.49640 Silica Quartz 2.650 4.030 0.990 430.38441 Silicon Carbide SiC 3.120 8.000 0.950 1996.80042 Steel 1018 7.850 3.357 1.920 884.86343 Steel 304 Stainless 7.896 4.569 1.490 1648.35044 Steel maraging(Vascomax250) 8.129 3.993 1.576 1296.09245 Titanium 4.528 5.220 0.767 1233.80846 Tuff, Nevada Test Site (dry) 1.646 1.320 1.410 28.68047 Tungsten Carbide WC 15.020 4.920 1.339 3635.80148 Uranium 97%U 3%Mo 18.450 2.565 1.531 1213.86749 Wood Douglas Fir 0.536 0.450 1.380 1.085
Figure B-2. Hugoniot parameters for materials evaluated in analytical model [51].
94
APPENDIX C HYPERVELOCITY IMPACT (HVI) DATABASE FOR
WHIPPLE SHIELDS NASA JSC Whipple Shield HVI Database Eric L. Christiansen/SN3/281-483-5311
test site test number
proj. diameter
(cm)
proj. density
(g/cm3) proj. matl
proj.mass
(g)velocity (km/s)
impact angle (deg)
bumperthknesstb (cm)
bump.Density
(g/cm3) S (cm) tw (cm) matl wall
wall dens.
(g/cm3)yield wall
(ksi)JSC 1644 0.018 8.25 Cu 2.519E-05 7.97 0 0.064 2.796 2.54 0.025 Al3003 2.78 18JSC 1791 0.079 2.796 Al2017T4 0.0007218 7.18 0 0.094 2.713 1.11 0.172 Al6061T6 2.78 36JSC 1792 0.115 2.796 Al2017T4 0.0022265 6.46 0 0.094 2.713 1.11 0.169 Al6061T6 2.796 36JSC 1794 0.159 2.796 Al2017T4 0.0058847 5.02 0 0.096 2.713 1.11 0.17 Al6061T6 2.796 36JSC 1796 0.159 2.796 Al2017T4 0.0058847 5.96 0 0.095 2.713 1.11 0.17 Al6061T6 2.713 36JSC 1797 0.159 2.796 Al2017T4 0.0058847 5.51 0 0.096 2.713 1.11 0.17 Al6061T6 2.796 36JSC 1817 0.06 2.796 Al2017T4 0.0003162 7 0 0.003 2.713 2.86 0.051 Al3003 2.78 18JSC 1830 0.018 8.25 Cu 2.519E-05 7.3 0 0.006 2.713 2.54 0.011 Al3003 2.78 18JSC 1881 0.079 2.796 Al2017T4 0.0007218 6.79 0 0.041 2.713 5.08 0.127 Al6061T6 2.852 36JSC A1342 0.318 2.796 Al2017T4 0.0471 3.96 0 0.127 2.713 10.16 0.318 Al2219T87 2.796 52JSC A1344 0.358 2.796 Al2017T4 0.0672 3.19 0 0.127 2.713 10.16 0.318 Al2219T87 2.852 52JSC A1347 0.358 2.796 Al2017T4 0.0672 2.93 0 0.127 2.713 10.16 0.318 Al2219T87 2.713 52JSC A1368 0.318 8.79 Cu 0.14731 5.04 0 0.064 2.713 10.16 0.159 Al2024T3 2.796 47JSC A1370 0.318 2.796 Al2017T4 0.04689 5.20 0 0.064 2.713 10.16 0.158 Al2024T3 2.713 47JSC A1371 0.299 2.796 Al2017T4 0.03918 6.56 0 0.063 2.713 10.16 0.125 Al2024T3 2.713 47JSC A1373 0.300 2.796 Al2017T4 0.03953 6.33 0 0.063 2.713 10.16 0.122 Al6061T6 2.796 36JSC A1374 0.299 2.796 Al2017T4 0.0392 6.55 0 0.064 2.713 10.16 0.125 Al2024T3 2.796 47JSC A1375 0.299 2.796 Al2017T4 0.0392 6.27 45 0.064 2.713 10.16 0.127 Al2024T3 2.78 47JSC A1376 0.300 2.796 Al2017T4 0.03935 6.41 45 0.064 2.713 10.16 0.127 Al6061T6 2.796 36JSC A1397 0.300 2.796 Al2017T4 0.03953 6.51 0 0.064 2.713 10.16 0.125 Al7075T3 2.78 68JSC A1458 0.238 2.796 Al2017T4 0.01974 6.74 0 0.203 2.713 1.98 0.203 Al6061T6 2.78 36JSC A1459 0.318 2.796 Al2017T4 0.04689 6.35 45 0.635 2.713 5.08 0.16 Al6061T6 2.796 36JSC A1462 0.317 2.796 Al2017T4 0.04683 6.39 0 0.064 2.713 5.08 0.254 Al2024T3 2.796 47JSC A1463 0.318 2.796 Al2017T4 0.04691 6.31 0 0.081 2.713 5.08 0.254 Al2024T3 2.796 47JSC A1464 0.317 2.796 Al2017T4 0.04684 6.43 0 0.081 2.713 5.08 0.318 Al2219T87 2.796 52JSC A1465 0.259 2.796 Al2017T4 0.02551 6.60 0 0.203 2.713 2 0.203 Al6061T6 2.796 36JSC A1466 0.281 2.796 Al2017T4 0.03232 6.54 45 0.203 2.713 1.98 0.203 Al6061T6 2.713 36JSC A1467 0.300 2.796 Al2017T4 0.03936 6.10 45 0.203 2.713 1.98 0.203 Al6061T6 2.796 36JSC A1468 0.318 2.796 Al2017T4 0.04689 6.39 45 0.203 2.713 1.98 0.203 Al6061T6 2.796 36JSC A1485 0.358 2.796 Al2017T4 0.06731 6.17 80 0.051 2.713 2.54 0.127 Al2024T3 2.796 47JSC A1486 0.358 2.796 Al2017T4 0.06739 5.45 85 0.051 2.713 2.54 0.127 Al2024T3 2.796 47JSC A1487 0.358 2.796 Al2017T4 0.06745 5.40 65 0.051 2.713 2.54 0.127 Al2024T3 2.796 47JSC A1488 0.358 2.796 Al2017T4 0.06741 6.19 65 0.051 2.713 2.54 0.127 Al2024T3 2.796 47JSC A1560 0.357 2.796 Al2017T4 0.06672 6.08 0 0.127 2.713 3.81 0.229 Al6061T6 2.713 36JSC A1603 0.318 2.796 Al2017T4 0.04686 6.35 0 0.081 2.713 10.16 0.16 Al2024T3 2.796 47JSC A1607 0.318 2.796 Al2017T4 0.04686 6.24 0 0.051 2.713 10.16 0.16 Al2024T3 2.796 47JSC A1672 0.318 2.796 Al2017T4 0.04686 6.05 0 0.064 2.713 10.16 0.16 Al2024T3 2.796 47JSC A1674 0.318 2.796 Al2017T4 0.04686 6.30 0 0.064 2.713 10.16 0.16 Al2024T3 2.796 47JSC A1676 0.318 2.796 Al2017T4 0.04686 6.07 0 0.064 2.713 10.16 0.16 Al2024T3 2.796 47JSC A1682 0.318 2.796 Al2017T4 0.04686 6.28 0 0.064 2.713 10.16 0.16 Al2024T3 2.796 47JSC B109 0.634 2.796 Al2017T4 0.37312 6.22 0 0.127 2.713 10.16 0.318 Al6061T6 2.78 36JSC B110 0.634 2.796 Al2017T4 0.3733 6.27 0 0.127 2.713 10.16 0.318 Al2219T87 2.713 52JSC B111 0.635 2.796 Al2017T4 0.37485 5.85 0 0.127 2.713 10.16 0.318 Al2219T87 2.796 52JSC B121 0.634 2.796 Al2017T4 0.3735 7.44 0 0.127 2.713 10.16 0.406 Al2024T3 2.713 47JSC B123 0.634 2.796 Al2017T4 0.37378 7.38 0 0.127 2.713 10.16 0.483 Al6061T6 2.796 36JSC B128 0.634 2.796 Al2017T4 0.37379 7.45 0 0.127 2.713 10.16 0.638 Al6061T6 2.796 36JSC B131 0.783 2.796 Al2017T4 0.70247 7.26 0 0.12 2.713 30.48 0.402 Al6061T6 2.796 36JSC B133 0.783 2.796 Al2017T4 0.70225 7.43 0 0.031 2.713 30.48 0.401 Al6061T6 2.796 36JSC B146 0.478 2.796 Al2017T4 0.16019 7.53 0 0.127 2.713 10.16 0.318 Al2219T87 2.852 52JSC B153 0.319 2.796 Al2017T4 0.04738 7.62 0 0.081 2.713 5.08 0.406 Al2024T3 2.852 47JSC B156 0.318 2.796 Al2017T4 0.04728 7.63 0 0.064 2.713 10.16 0.16 Al2024T3 2.78 47JSC B160 0.318 2.796 Al2017T4 0.04725 7.34 0 0.076 2.713 5.08 0.254 Al2024T3 2.852 47JSC B166 0.318 2.796 Al2017T4 0.04721 7.52 0 0.081 2.713 5.08 0.203 Al2024T3 2.796 47JSC B176 0.318 2.796 Al2017T4 0.0470779 7.05 0 0.08128 2.713 5.08 0.2286 Al 2024T3 2.852 47JSC B177 1.458 1.14 Nylon 1.85 7.34 0 0.483 2.796 5.08 0.635 Al1100 2.852 23JSC B184 0.476 2.796 Al2017T4 0.15814 7.59 0 0.229 2.713 5.08 0.102 Al6061T6 2.713 36JSC B294 0.634 2.796 Al2017T4 0.37356 7.51 0 0.127 2.713 15.24 0.318 Al2219T87 2.796 52JSC A358 0.04 2.25 glass 7.54E-05 5.56 0 0.015 2.78 2.54 0.015 Al2024T4 2.713 47JSC A337 0.079 2.25 glass 0.0005808 5.44 0 0.025 2.78 2.54 0.025 Al2024T4 2.713 47
JSCo AV26 0.127 2.25 glass 0.0024132 5.72 0 0.042 2.78 2.54 0.042 Al7178T6 2.713 70

95
test site test number Damage DescriptionDamage
classJSC 1644 No Perf, ring dimples E2JSC 1791 No perf or DS, no dimples, craters E1JSC 1792 No perf, slight bulge, ring crts E2JSC 1794 No perf, DS=0.24cm, 0.95cm ring E3JSC 1796 No perf, bulge, 1cm ring crts E2JSC 1797 No perf, bulge, 0.8cm ring crts E2JSC 1817 5 perf (0.1cm), dimples, 0.8cm ring E4JSC 1830 60perfs (0.2cm), 2.2cm ring E4JSC 1881 No perf, 2.2cm ring E1JSC A1342 No Perf, craters/dimples E2JSC A1344 1P=1mm,DS=8mm,C=4mm D4JSC A1347 1P=0.6mm,DS=6mm D4JSC A1368 1P,6.1mm E5JSC A1370 1P,1.5x2.9mm E5JSC A1371 1P,0.68x0.97mm E4JSC A1373 1P,0.8mm,DS E4JSC A1374 1P,0.6x0.8mm E4JSC A1375 4P,2.1x2.6mm E4JSC A1376 6P,2.9x3.1mm E4JSC A1397 No Perf, DS=1.5mm E3JSC A1458 No Perf, bulge E2JSC A1459 1 perf (0.2x0.3cm) E4JSC A1462 No Perf, DS=13x15mm E3JSC A1463 No Perf, DS=12mm E3JSC A1464 No Perf, DS=14mm E3JSC A1465 No Perf, DS=7x8mm E3JSC A1466 No Perf or DS, dimples (central) D2JSC A1467 No Perf or DS, dimples (central) D2JSC A1468 1 perf (0.1cm) D4JSC A1485 No Perf, dimples C2JSC A1486 No Perf, no dimples, molten splash C1JSC A1487 4 perfs (1.3mm) C2JSC A1488 3 perfs (10x4 mm) C5JSC A1560 No perf, DS=14mm E3JSC A1603 No perf or DS, ring craters/dimples E2JSC A1607 2 perfs (0.9mm), DS=1.5mm C4JSC A1672 1 perf (1.5mm), DS=4.2mm E4JSC A1674 No perf, BL DS E2JSC A1676 1 perf (0.7mm), DS (3mm) E4JSC A1682 1 perf (0.6mm), DS (3mm) E4JSC B109 1 perf (1cm), DS=3.2cm E5JSC B110 6 perfs (0.5cm), DS=3.4cm E5JSC B111 7 perfs (0.4cm), DS=3cm E5JSC B121 No perf, DS=3.6cm E3JSC B123 No perf, DS=3cm E3JSC B128 No perf, DS=2.5cm E3JSC B131 No perf or DS, bulge, dimples (ring) E2JSC B133 20 perfs (4.5cm max), DS=0.6cm E5JSC B146 No perf or DS, dimples (ring) E2JSC B153 No perf or DS, sm.craters E1JSC B156 No perf or DS, sm.craters E1JSC B160 No perf or DS, sm.craters E1JSC B166 No perf, DS=1.4cm, 4.5cm ring E3JSC B176 No perf or DS, no bulge E1JSC B177 1 perf (2mm), DS=2cm, 20cm ring C5JSC B184 Petalled perf (5-7cm) C4JSC B294 No perf or DS, dimples (rings) C2JSC A358 No Perf or DS E1JSC A337 No Perf or DS E1
JSCo AV26 No Perf or DS D1

96
test site test number
proj. diameter
(cm)
proj. density(g/cm3) proj. matl
proj.mass
(g)velocity (km/s)
impact angle (deg)
bumperthknesstb (cm)
bump.Density(g/cm3) S (cm) tw (cm) matl wall
wall dens.(g/cm3)
yield wall (ksi)
JSCo 4695 0.159 2.54 glass 0.0053459 7.56 0 0.051 2.78 5.09 0.064 Al2024T3 2.852 47JSCo 4709 0.159 2.54 glass 0.0053459 7.26 0 0.025 2.78 5.09 0.064 Al2024T3 2.713 47JSCo 4691 0.159 2.54 glass 0.0053459 7.25 0 0.051 2.78 7.62 0.041 Al2024T3 2.713 47JSC A1199 0.2 2.796 Al2017T4 0.0117119 5.7 0 0.016 2.713 6.4 0.483 Al2024T3 2.796 47JSC A1211 0.2 2.796 Al2017T4 0.0117119 5.06 0 0.036 2.713 6.4 0.483 Al2024T3 2.796 47JSC A1221 0.2 2.796 Al2017T4 0.0117119 5.42 0 0.036 2.713 6.4 0.318 Al2024T3 2.796 47JSC A1222 0.2 2.796 Al2017T4 0.0117119 4.48 0 0.036 2.713 6.4 0.318 Al2024T3 2.796 47JSC A1210 0.318 2.796 Al2017T4 0.0470779 6.27 0 0.051 2.713 10.18 0.2 Al2024T3 2.796 47JSC A481 0.318 2.796 Al2017T4 0.0470779 6.38 0 0.057 2.713 12.72 0.127 Al6061T6 2.713 36JSC A1193 0.318 2.796 Al2017T4 0.0470779 6.25 0 0.051 2.713 10.18 0.2 Al6061T6 2.713 36JSC A1114 0.318 2.796 Al2017T4 0.0470779 6.21 0 0.051 2.713 10.18 0.159 Al2024T3 2.796 47MDC MD13 0.884 2.78 Al 1.005542 7.15 0 0.080 2.78 35.36 0.792 Al2024T351 2.796 47MDC MD12 0.884 2.78 Al 1.005542 7.16 0 0.080 2.78 26.52 0.655 Al2024T351 2.796 47MDC MD14 0.884 2.78 Al 1.005542 7.27 0 0.044 2.78 26.52 1.26 Al2024T351 2.796 47MDC MD15 0.884 2.78 Al 1.005542 7.08 0 0.230 2.78 26.52 0.201 Al2024T351 2.796 47MDC MD11 0.884 2.78 Al 1.005542 7.09 0 0.080 2.78 13.26 1.618 Al2024T351 2.796 47ARC A1894 0.953 2.796 Al2017T4 1.2671105 6.74 45 0.162 2.78 30.5 0.792 Al2024T351 2.796 47JSC 1487 0.040 2.713 Al6061 9.091E-05 7.30 0 0.01 2.74 1.27 0.015 Al3003H12 2.78 18JSC 1481 0.040 2.796 Al2017T4 9.369E-05 7.10 0 0.01 2.74 1.27 0.01 Al3003H12 2.78 18JSC 1476 0.040 2.796 Al2017T4 9.369E-05 8.06 0 0.01 2.74 1.27 0.027 Al3003H14 2.78 21JSCo 4613 0.079 2.25 glass 0.0005808 7.13 0 0.025 2.78 5.08 0.025 Al2024T3 2.796 47JSCo 4637 0.079 2.25 glass 0.0005808 7.22 0 0.015 2.78 5.08 0.025 Al2024T3 2.796 47JSCo 4638 0.079 2.25 glass 0.0005808 7.53 0 0.015 2.78 7.62 0.025 Al2024T3 2.796 47JSCo A250 0.079 2.25 glass 0.0005808 6.52 0 0.03 2.78 2.54 0.03 Al7075T6 2.796 70JSCo A201 0.079 2.25 glass 0.0005808 6.70 0 0.03 2.78 7.62 0.03 Al1100H14 2.78 17JSCo 4681 0.079 2.713 Al6061 0.0007004 7.34 0 0.051 2.78 2.54 0.041 Al2024T3 2.796 47JSCo 4679 0.079 2.713 Al6061 0.0007004 7.16 0 0.051 2.78 7.62 0.025 Al2024T3 2.796 47JSCo 4658 0.079 2.713 Al6061 0.0007004 7.25 0 0.015 2.78 5.08 0.025 Al2024T3 2.796 47JSC 1435 0.080 2.796 Al2017T4 0.0007496 6.52 0 0.015 2.713 2.54 0.03 Al2024T3 2.796 47JSC 1468 0.081 2.796 Al2017T4 0.000778 6.70 0 0.015 2.713 2.54 0.03 Al2024T3 2.796 47JSCo 4695 0.159 2.54 glass 0.0053459 7.56 0 0.051 2.78 5.08 0.064 Al2024T3 2.796 47JSCo 4709 0.159 2.54 glass 0.0053459 7.26 0 0.025 2.78 5.08 0.064 Al2024T3 2.796 47JSCo 4691 0.159 2.54 glass 0.0053459 7.25 0 0.051 2.78 7.62 0.041 Al2024T3 2.796 47JSCo 4706 0.159 2.54 glass 0.0053459 7.26 0 0.025 2.78 7.62 0.041 Al2024T3 2.796 47JSCo 4738 0.159 2.71 Al6061 0.0057037 7.20 0 0.051 2.78 5.08 0.064 Al2024T3 2.796 47JSCo 4736 0.159 2.71 Al6061 0.0057037 7.31 0 0.051 2.78 7.62 0.041 Al2024T3 2.796 47JSC A1200 0.200 2.796 Al2017T4 0.0117119 6.93 0 0.015 2.78 6.4 0.483 Al6061T6 2.713 36JSC A1218 0.200 2.796 Al2017T4 0.0117119 6.93 0 0.015 2.78 6.4 0.318 Al2024T3 2.796 47JSC A1196 0.200 2.796 Al2017T4 0.0117119 7.20 0 0.036 2.78 6.4 0.159 Al2024T3 2.796 47JSC A1076 0.200 2.796 Al2017T4 0.0117119 6.37 0 0.064 2.713 6.0 0.041 Al6061T6 2.713 36JSC A1077 0.200 2.796 Al2017T4 0.0117119 6.77 0 0.41 2.713 6 0.064 Al6061T6 2.713 36JSC A1281 0.318 1.145 Nylon 0.019279 6.70 0 0.025 2.713 10.16 0.081 Al2024T3 2.796 47JSC A235 0.318 2.78 Al 0.0468085 6.98 0 0.056 2.78 10.16 0.159 Al2024T3 2.796 47JSC A240 0.318 2.78 Al 0.0468085 6.58 0 0.081 2.78 10.16 0.127 Al2024T3 2.796 47JSC A151 0.318 2.713 Al6061 0.0456804 6.60 0 0.081 2.78 5.08 0.127 Al2024T3 2.796 47JSC B31 0.635 2.796 Al2017T4 0.3748495 7.08 0 0.127 2.713 20.32 0.36 Al6061T6 2.713 36JSC B37 0.635 2.796 Al2017T4 0.3748495 6.39 0 0.159 2.796 10.16 0.5 Al6061T6 2.713 36
Boeing 85-24F 0.635 2.78 Al 0.3727045 6.00 0 0.159 2.713 15.24 0.318 Al2219T87 2.852 52Boeing 85-13 0.635 2.78 Al 0.3727045 5.88 0 0.159 2.713 15.24 0.318 Al2219T87 2.852 52Boeing 85-16 0.762 2.78 Al 0.6440333 7.00 0 0.159 2.713 15.24 0.318 Al2219T87 2.852 52Boeing 85-20C 0.762 2.78 Al 0.6440333 6.40 0 0.159 2.713 15.24 0.318 Al2219T87 2.852 52MSFC 86-2 0.793 2.71 Al 0.7075994 6.98 0 0.159 2.713 10.16 0.318 Al2219T87 2.852 52MSFC 86-1 0.793 2.71 Al 0.7075994 6.90 0 0.159 2.713 10.16 0.318 Al2219T87 2.852 52ARC A1895 0.953 2.796 Al2017T4 1.2671105 6.89 0 0.159 2.78 30.48 0.318 Al6061T6 2.713 36ARC A1868 0.953 2.796 Al2017T4 1.2671105 7.10 0 0.159 2.78 30.48 0.318 Al6061T6 2.713 36ARC A86/1 0.953 2.796 Al2017T4 1.2671105 6.65 0 0.159 2.78 30.48 0.635 Al2024T351 2.796 47ARC A1917 0.953 2.796 Al2017T4 1.2671105 6.72 0 0.159 2.78 22.86 0.483 Al2024T351 2.796 47ARC A1899 0.953 2.796 Al2017T4 1.2671105 6.83 0 0.159 2.78 15.24 0.635 Al2024T351 2.796 47ARC A1875 0.953 2.796 Al2017T4 1.2671105 6.75 0 0.159 2.78 30.48 0.318 Al6061T6 2.713 36ARC A86/3 0.953 2.796 Al2017T4 1.2671105 6.65 0 0.159 2.78 30.48 0.229 Al2024T3 2.796 47ARC A86/4 0.953 2.796 Al2017T4 1.2671105 6.40 0 0.483 2.78 30.48 0.229 Al2024T3 2.796 47ARC A1918 0.953 2.796 Al2017T4 1.2671105 6.83 0 0.159 2.78 38.1 0.318 Al2024T3 2.796 47ARC A86/2 0.953 2.796 Al2017T4 1.2671105 6.64 0 0.318 2.78 30.48 0.229 Al2024T3 2.796 47ARC A86/5 0.953 2.796 Al2017T4 1.2671105 6.47 0 0.159 2.78 30.48 0.318 Al2024T3 2.796 47ARC A1913 1.270 2.796 Al2017T4 2.9987962 6.71 0 0.318 2.78 50.8 0.483 Al6061T6 2.713 36ARC A1921 1.270 2.796 Al2017T4 2.9987962 6.80 0 0.159 2.78 22.86 0.635 Al2024T351 2.796 47ARC A1907 1.270 2.796 Al2017T4 2.9987962 6.53 0 0.318 2.78 50.8 0.483 Al2024T351 2.796 47MDC MD28 1.908 2.78 Al 10.110637 7.08 0 0.406 2.78 57.15 0.968 Al2024T351 2.796 47MDC MD31 1.908 2.78 Al 10.110637 7.15 0 0.813 2.78 57.15 0.8 Al2024T351 2.796 47

97
test site test number Damage DescriptionDamage
classJSCo 4695 No Perf or DS, craters (central) E2JSCo 4709 No Perf or DS, dimples (ring) E2JSCo 4691 3 small perfs E3JSC A1199 No Perf or DS, craters (central, ring) E1JSC A1211 No Perf or DS, craters (central, ring) E1JSC A1221 No Perf or DS, craters (central, ring) E1JSC A1222 No Perf or DS, s.dimples (cent, ring) E2JSC A1210 No perf, DS=2.5mm (thin) E3JSC A481 No perf or DS, attached spall (split) E2JSC A1193 1 perf, DS=2mm (thin) E3JSC A1114 2 perfs, DS=1cm (thin) E3MDC MD13 No perf or DS, attached spall (split) D2MDC MD12 No perf, DS=3.7cm D3MDC MD14 No perf, DS=6.4cm D3MDC MD15 No perf or DS, cratering E1MDC MD11 No perf, DS=5cm E3ARC A1894 2 Perfs (0.9cm & 0.5cm) C4JSC 1487 BL, bulge, impulsive w/ dimples F3JSC 1481 perfs, bulge, impulsive w/ dimples F4JSC 1476 v.slight bulge F2JSCo 4613 v.slight cratering E1JSCo 4637 small perfs, ring (2.7cm) E4JSCo 4638 small perfs, ring (4.4cm) E4JSCo A250 No perf or DS, near BL E2JSCo A201 1perf E4JSCo 4681 No perf or DS, small dimples (center) D2JSCo 4679 No perf or DS, small dimples (center) D2JSCo 4658 small perfs, ring (2.7cm) E4JSC 1435 No perf or DS, dimples E2JSC 1468 No perf or DS, dimples E2JSCo 4695 No perf or DS, small craters (center) E2JSCo 4709 No perf or DS, dimples (2cm ring) E2JSCo 4691 3 small perfs E4JSCo 4706 4 perfs (ring 3.4cm) E4JSCo 4738 No perf or DS, small craters (center) E1JSCo 4736 4 perfs (ring 5.6cm) E4JSC A1200 No perf or det spall, craters (center) E1JSC A1218 DS=4mm (thin) D3JSC A1196 No perf or det spall, craters (center) E2JSC A1076 numerous perfs, spall dimples E4JSC A1077 No perfs, dimples E2JSC A1281 numerous perfs (small, dispersed) E4JSC A235 No perfs or DS, 1 spall split E3JSC A240 No perfs or DS, dimples E2JSC A151 Hole, DS, cracks D4JSC B31 No perf or DS, central & ring dimples E2JSC B37 Small perf, DS=30mm E4
Boeing 85-24F E2Boeing 85-13 E2Boeing 85-16 E2Boeing 85-20C D4MSFC 86-2 F5MSFC 86-1 F5ARC A1895 No perf or DS, bulge F3ARC A1868 No perf or DS, bulge F3ARC A86/1 No perf or DS, cratering D1ARC A1917 No perf or DS, attached spall D2ARC A1899 DS=5cm (thin) D3ARC A1875 No perf or DS, bulge F3ARC A86/3 Bulge, crack=0.16cm F4ARC A86/4 perf ring, no central spall E4ARC A1918 No perf or DS, ring & central dimples E2ARC A86/2 No perf or DS, bulge F2ARC A86/5 Bulge, 3 cracks, 3 sm perfs, DS F4ARC A1913 No perf or DS, bulge F2/D2ARC A1921 No perf, DS=7.6cm (thin) D3ARC A1907 1 perf=0.48cm, attached spall E4MDC MD28 No perf or DS, dimples E2MDC MD31 No perf or DS, dimples E2

98
test site test number
proj. diameter
(cm)
proj. density(g/cm3) proj. matl
proj.mass
(g)velocity (km/s)
impact angle (deg)
bumperthknesstb (cm)
bump.Density(g/cm3) S (cm) tw (cm) matl wall
wall dens.(g/cm3)
yield wall (ksi)
MDC MD29 1.908 2.78 Al 10.110637 7.08 0 0.406 2.78 76.2 0.622 Al2024T351 2.796 47MDC MD27 1.908 2.78 Al 10.110637 7.15 0 0.406 2.78 28.575 2.827 Al2024T351 2.796 47MDC MD30 1.908 2.78 Al 10.110637 7.27 0 0.203 2.78 57.15 1.626 Al2024T351 2.796 47JSC B613 0.794 2.796 Al2017T4 0.73277 6.98 0 0.16002 2.713 10.16 0.318 Al2219T87 2.852 52JSC B614 0.627 2.796 Al2017T4 0.3612 7.05 30 0.127 2.713 10.16 0.318 Al2219T87 2.852 52JSC B615 0.631 2.796 Al2017T4 0.36786 7.05 45 0.127 2.713 10.16 0.318 Al2219T87 2.852 52JSC B606 0.953 2.796 Al2017T4 1.2654 6.89 65 0.08128 2.713 20.3 0.635 Al6061T6 2.713 36JSC B461 0.319 2.796 Al2017T4 0.04733 6.81 60 0.09652 2.78 14.2 0.198 Alclad7075T6 2.78 64.6JSC B488 0.318 2.796 Al2017T4 0.04722 6.94 65 0.1016 2.78 15.8 0.152 Alclad7075T6 2.78 64.6JSC A2010R2 0.200 2.796 Al2017T4 0.01171 6.76 16 0.1016 2.78 13.6 0.152 Alclad7075T6 2.78 64.6JSC A2017R2 0.219 2.796 Al2017T4 0.01535 4.45 16 0.1016 2.78 13.6 0.152 Alclad7075T6 2.78 64.6JSC A2019R2 0.217 2.796 Al2017T4 0.01505 3.86 16 0.1016 2.78 13.6 0.152 Alclad7075T6 2.78 64.6JSC A2025R2 0.159 2.796 Al2017T4 0.00586 3.40 16 0.1016 2.78 13.6 0.152 Alclad7075T6 2.78 64.6JSC A2033R2 0.180 2.796 Al2017T4 0.00851 3.36 16 0.1016 2.78 13.6 0.152 Alclad7075T6 2.78 64.6JSC B480 0.358 2.796 Al2017T4 0.0673 6.95 26 0.1016 2.78 13.6 0.152 Alclad7075T6 2.78 64.6JSC B460 0.358 2.796 Al2017T4 0.06717 6.77 65 0.1016 2.78 13.6 0.152 Alclad7075T6 2.78 64.6JSC B319 0.517 2.796 Al2017T4 0.20192 7.57 53.1 0.151 2.78 10.2 0.302 Alclad7075T6 2.78 64.6JSC B324 0.596 2.796 Al2017T4 0.30983 7.07 23 0.151 2.78 10.2 0.302 Alclad7075T6 2.78 64.6JSC B327 0.675 2.796 Al2017T4 0.4496 6.95 58.4 0.171 2.78 20.2 0.386 Alclad7075T6 2.78 64.6JSC B333 0.596 2.796 Al2017T4 0.30975 7.60 58.4 0.171 2.78 20.2 0.406 Al2024T3 2.796 47JSC B334 0.635 2.796 Al2017T4 0.3757 7.28 58.4 0.171 2.78 20.2 0.406 Al2024T3 2.796 47JSC B341 0.674 2.796 Al2017T4 0.44856 7.57 58.4 0.180 2.796 20.2 0.406 Al2024T3 2.796 47JSC B343 0.596 2.796 Al2017T4 0.30975 7.46 23 0.159 2.796 10.2 0.318 Al2024T3 2.796 47JSC B344 0.596 2.796 Al2017T4 0.30985 7.20 23 0.159 2.713 10.2 0.318 Al2219T87 2.852 52JSC B348 0.674 2.796 Al2017T4 0.4478 7.13 58.4 0.180 2.713 20.2 0.406 Al6061T6 2.713 36JSC B386 0.476 2.796 Al2017T4 0.15823 6.64 50 0.160 2.78 10.2 0.302 Alclad7075T6 2.78 64.6JSC A1916 0.318 2.796 Al2017T4 0.04716 3.16 20 0.151 2.78 23.6 0.302 Alclad7075T6 2.78 64.6JSC A1917 0.340 2.796 Al2017T4 0.05739 3.55 20 0.151 2.78 23.6 0.286 Alclad7075T6 2.78 64.6JSC A1965 0.289 2.796 Al2017T4 0.03529 6.29 15 0.112 2.713 10.2 0.191 Al6061CMG 2.713 28.7JSC A1967 0.318 2.796 Al2017T4 0.04717 6.22 15 0.112 2.713 10.2 0.191 Al6061CMG 2.713 28.7JSC A1969 0.358 2.796 Al2017T4 0.06737 6.29 30 0.112 2.713 10.2 0.191 Al6061CMG 2.713 28.7JSC A1971 0.318 2.796 Al2017T4 0.04708 6.17 45 0.112 2.713 10.2 0.191 Al6061CMG 2.713 28.7JSC B752 0.794 2.796 Al2017T4 0.732128 7.19 25 0.159 2.78 11.2 0.508 Al2219T851 2.852 52
JSC-WSTF JSC HD9820217 0.318 2.796 Al2017T4 0.04688 6.5 0 0.079 2.713 5.1 0.180 Al6061T6 2.713 36JSC-WSTF JSC HD9820004 0.314 2.796 Al2017T4 0.04521 6.4 0 0.079 2.713 5.1 0.203 Al6061T6 2.713 36JSC-WSTF JSC HD9820032 0.318 2.796 Al2017T4 0.04695 6.4 0 0.079 2.713 5.1 0.229 Al6061T6 2.713 36JSC-WSTF JSC HD9820065 0.318 2.796 Al2017T4 0.04705 6.4 0 0.079 2.713 5.1 0.254 Al6061T6 2.713 36JSC-WSTF JSC HD9820114 0.318 2.796 Al2017T4 0.0473 6.5 0 0.079 2.713 5.1 0.318 Al6061T6 2.713 36JSC-WSTF JSC HD9820151 0.313 2.796 Al2017T4 0.04509 6.6 0 0.079 2.713 5.1 0.406 Al6061T6 2.713 36JSC-WSTF JSC HD9820014 0.318 2.796 Al2017T4 0.04686 6 0 0.079 2.713 5.1 0.203 Al6061T6 2.713 36JSC-WSTF JSC HD9820058 0.314 2.796 Al2017T4 0.04544 5.9 0 0.079 2.713 5.1 0.229 Al6061T6 2.713 36JSC-WSTF JSC HD9820115 0.318 2.796 Al2017T4 0.0473 5.7 0 0.079 2.713 5.1 0.254 Al6061T6 2.713 36JSC-WSTF JSC HD9820152 0.314 2.796 Al2017T4 0.04554 5.9 0 0.079 2.713 5.1 0.318 Al6061T6 2.713 36JSC-WSTF JSC HD9820159 0.313 2.796 Al2017T4 0.04501 6 0 0.079 2.713 5.1 0.406 Al6061T6 2.713 36JSC-WSTF JSC HD9820003 0.3136 2.796 Al2017T4 0.04517 5.8 0 0.079 2.713 5.1 0.254 Al6061T6 2.713 36JSC-WSTF JSC HD9920057 0.314 2.796 Al2017T4 0.04546 5.5 0 0.079 2.713 5.1 0.318 Al6061T6 2.713 36JSC-WSTF JSC HD9820220 0.318 2.796 Al2017T4 0.04709 6.6 0 0.079 2.713 5.1 0.180 Al6061T6 2.713 36JSC-WSTF JSC HD9920009 0.317 2.796 Al2017T4 0.04672 6.7 0 0.079 2.713 5.1 0.180 Al6061T6 2.713 36JSC-WSTF JSC HD9920005 0.319 2.796 Al2017T4 0.04732 6.9 0 0.079 2.713 5.1 0.254 Al6061T6 2.713 36JSC-WSTF JSC HD9920034 0.318 2.796 Al2017T4 0.04699 6.9 0 0.079 2.713 5.1 0.318 Al6061T6 2.713 36JSC-WSTF JSC HD9920066 0.318 2.796 Al2017T4 0.04728 6.7 0 0.079 2.713 5.1 0.406 Al6061T6 2.713 36JSC-WSTF JSC HD9920116 0.318 2.796 Al2017T4 0.0473 6.9 0 0.079 2.713 5.1 0.457 Al6061T6 2.713 36JSC-WSTF JSC HD9820221 0.317 2.796 Al2017T4 0.04682 4.4 0 0.079 2.713 5.1 0.203 Al6061T6 2.713 36JSC-WSTF JSC HD9920030 0.318 2.796 Al2017T4 0.04709 4.5 0 0.079 2.713 5.1 0.229 Al6061T6 2.713 36JSC-WSTF JSC HD9920060 0.318 2.796 Al2017T4 0.04688 4.7 0 0.079 2.713 5.1 0.254 Al6061T6 2.713 36JSC-WSTF JSC HD9820222 0.317 2.796 Al2017T4 0.04682 3 0 0.079 2.713 5.1 0.318 Al6061T6 2.713 36JSC-WSTF JSC HD9920040 0.316 2.796 Al2017T4 0.04602 3.1 0 0.079 2.713 5.1 0.406 Al6061T6 2.713 36JSC-WSTF JSC HD9920117 0.319 2.796 Al2017T4 0.0474 3 0 0.079 2.713 5.1 0.457 Al6061T6 2.713 36JSC-WSTF JSC HD9820223 0.318 2.796 Al2017T4 0.0469 2.5 0 0.079 2.713 5.1 0.254 Al6061T6 2.713 36JSC-WSTF JSC HD9920028 0.317 2.796 Al2017T4 0.04683 2.6 0 0.079 2.713 5.1 0.318 Al6061T6 2.713 36JSC-WSTF JSC HD9920104 0.313 2.796 Al2017T4 0.04507 2.7 0 0.079 2.713 5.1 0.406 Al6061T6 2.713 36JSC-WSTF JSC HD9920118 0.315 2.796 Al2017T4 0.04586 2.6 0 0.079 2.713 5.1 0.457 Al6061T6 2.713 36

99
test site test number Damage DescriptionDamage
classMDC MD29 No perf, small dimples (split) E3MDC MD27 No perf or DS, dimples (split) D2MDC MD30 No perf or DS, dimples (split) D2JSC B613 Perf(2x1.7cm)w/cracks2.5cm, WPperf F5JSC B614 Perf(2.8cm), DS=3.6cm, WPperf 3mm D5JSC B615 Perf(2.9cm), WP 4perfs (9mm) D5JSC B606 Perf (1.4x0.8cm), 1mmWPperf:6mm D5JSC B461 No perf, bumps/dimples E2JSC B488 No perf, bumps/dimples E2JSC A2010R2 No perf, bumps/dimples E2JSC A2017R2 No perf, bumps/dimples E2JSC A2019R2 No perf, bumps/dimples E2JSC A2025R2 No perf, bumps/dimples E2JSC A2033R2 No perf, bumps/dimples E2JSC B480 No perf, bumps/dimples E2JSC B460 No perf, bumps/dimples E2JSC B319 No perf, bumps/dimples E2JSC B324 No perf, DS=4.8x2cm E3JSC B327 1 perf (5mm) D3JSC B333 No perf or DS E2JSC B334 No perf or DS E2JSC B341 No perf or DS E2JSC B343 No perf, DS=1.9cm E3JSC B344 No perf, DS=2.1cm E3JSC B348 No perf, tiny DS=1mm E2JSC B386 1perf (3mm) D3JSC A1916 No perf or DS D2JSC A1917 No perf, DS=0.5x0.6cm D3JSC A1965 No perf or DS, dimples E2JSC A1967 No perf or DS, dimples E2JSC A1969 No perf or DS, dimples E2JSC A1971 1 perf (1.5mm) E3JSC B752 1 perf (2mm) D2
JSC-WSTF JSC HD9820217 No Perf, DS=13x15mm E3JSC-WSTF JSC HD9820004 No Perf, DS=14mm E3JSC-WSTF JSC HD9820032 No Perf, DS=12x13mm E3JSC-WSTF JSC HD9820065 No Perf, DS=12mm E3JSC-WSTF JSC HD9820114 No Perf, DS=12x11mm E3JSC-WSTF JSC HD9820151 No Perf, bump on back E2JSC-WSTF JSC HD9820014 No Perf, DS=12x13mm E3JSC-WSTF JSC HD9820058 No Perf, DS=11x12mm E3JSC-WSTF JSC HD9820115 Perf=0.5mm, DS=8mm E4JSC-WSTF JSC HD9820152 No Perf, DS=8x6mm E3JSC-WSTF JSC HD9820159 No Perf, bump on back E2JSC-WSTF JSC HD9820003 No Perf, DS=7mm E3JSC-WSTF JSC HD9920057 No Perf, bump on back E2JSC-WSTF JSC HD9820220 Perf=0.8mm, DS=17mm E4JSC-WSTF JSC HD9920009 No Perf, DS=16mm E3JSC-WSTF JSC HD9920005 No Perf, DS=13mm E3JSC-WSTF JSC HD9920034 No Perf, DS=14x13mm E3JSC-WSTF JSC HD9920066 No Perf, DS=7mm E3JSC-WSTF JSC HD9920116 No Perf, bump on back E3JSC-WSTF JSC HD9820221 Perf=2x3mm E4JSC-WSTF JSC HD9920030 Perf=1.5x0.8mm, DS=4mm E4JSC-WSTF JSC HD9920060 No Perf, bump on back E2JSC-WSTF JSC HD9820222 Perf=2mm, DS=8mm E4JSC-WSTF JSC HD9920040 No Perf, DS=8mm E3JSC-WSTF JSC HD9920117 No Perf, bump on back E2JSC-WSTF JSC HD9820223 Perf=5x4mm D4JSC-WSTF JSC HD9920028 Perf=4mm D4JSC-WSTF JSC HD9920104 No Perf, DS=7mm E3JSC-WSTF JSC HD9920118 No Perf, bump on back D2

REPORT DOCUMENTATION PAGE Form Approved OMB No. 0704-0188
Public reporting burden for this collection of information is estimated to average 1 hour per response, including the time for reviewing instructions, searching existing data sources, gathering and maintaining the data needed, and completing and reviewing the collection of information. Send comments regarding this burden estimate or any other aspect of this collection of information, including suggestions for reducing this burden, to Washington Headquarters Services, Directorate for Information Operations and Reports, 1215 Jefferson Davis Highway, Suite 1204, Arlington, VA 22202-4302, and to the Office of Management and Budget, Paperwork Reduction Project (0704-0188), Washington, DC 20503.
1. AGENCY USE ONLY (Leave Blank) 2. REPORT DATE 3. REPORT TYPE AND DATES COVERED August 2003 NASA Technical Paper
4. TITLE AND SUBTITLE 5. FUNDING NUMBERS Meteoroid/Debris Shielding
6. AUTHOR(S) Eric L. Christiansen
7. PERFORMING ORGANIZATION NAME(S) AND ADDRESS(ES) 8. PERFORMING ORGANIZATION REPORT NUMBERS
Lyndon B. Johnson Space Center Houston, Texas 77058
S-898
9. SPONSORING/MONITORING AGENCY NAME(S) AND ADDRESS(ES) 10. SPONSORING/MONITORING AGENCY REPORT NUMBER
National Aeronautics and Space Administration Washington, DC 20546-0001
TP-2003-210788
11. SUPPLEMENTARY NOTES
12a. DISTRIBUTION/AVAILABILITY STATEMENT 12b. DISTRIBUTION CODE
Unclassified/Unlimited Available from the NASA Center for AeroSpace Information (CASI) 7121 StandardHanover, MD 21076-1320 Subject Category: 39
13. ABSTRACT (Maximum 200 words) This report provides innovative, low-weight shielding solutions for spacecraft and the ballistic limit equations that define the shield's performance in the meteoroid/debris environment. Analyses and hypervelocity impact testing results are described that have been used in developing the shields and equations. Spacecraft shielding design and operational practices described in this report are used to provide effective spacecraft protection from meteoroid and debris impacts. Specific shield applications for the International Space Station (ISS), Space Shuttle Orbiter and the CONTOUR (Comet Nucleus Tour) space probe are provided. Whipple, Multi-Shock and Stuffed Whipple shield applications are described.
14. SUBJECT TERMS 15. NUMBER OF PAGES
16. PRICE CODE
orbital debris, meteoroids, hypervelocity impact, shielding, ISS, Shuttle, Orbiter, CONTOUR, impact protection, Hypervelocity Impact Technology Facility 111
17. SECURITY CLASSIFICATION OF REPORT
18. SECURITY CLASSIFICATION OF THIS PAGE
19. SECURITY CLASSIFICATION OF ABSTRACT
20. LIMITATION OF ABSTRACT
Unclassified Unclassified Unclassified Unlimited Standard Form 298 (Rev Feb 89) (MS Word Mar 97) Prescribed by ANSI Std. 239-18 298-102
NSN 7540-01-280-5500