meteorology applications of satellite imagerymeteorology applications of satellite imagery 1169 with...
TRANSCRIPT
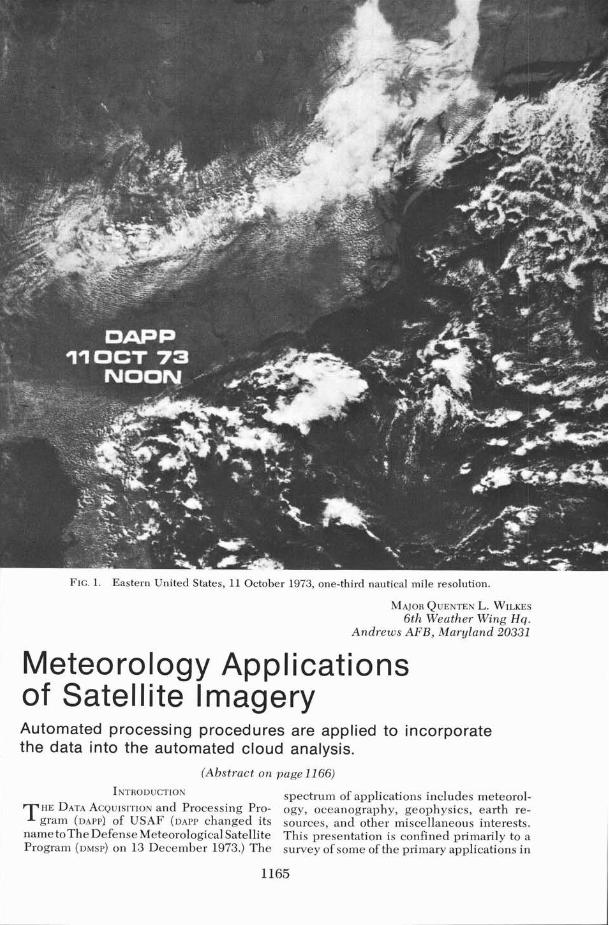
FIG. 1. Eastern United States, 11 October 1973, one-third nautical mile resolution.
MAJOR QUENTEN L. WILKES 6th Weather Wing H q .
Andrews AFB, Maryland 20331
Meteorology Applications of Satellite Imagery Automated processing procedures are applied to incorporate the data into the automated cloud analysis.
(Abstract on page 11 66)
INTRODUCTION spectrum of applications includes meteorol- HE DATA ACQUISITION and Processing Pro- ogy, oceanography, geophysics, earth re-
T g r a m (DAPP) of USAF (DAFT changed its sources, and other miscellaneous interests. name toTheDefenseMeteorologica1 Satellite This presentation is confined primarily to a Program (DMSP) on 13 December 1973.) The survey of some of the primary applications in
1166 PHOTOGRAMMETRIC ENGINEERING, 1974
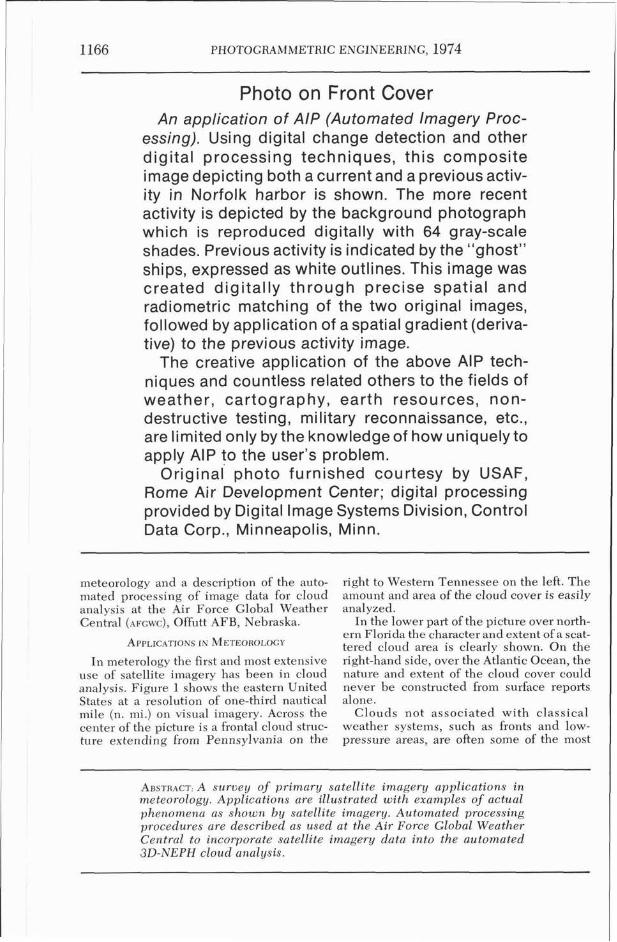
Photo on Front Cover An application of AIP (Automated Imagery Proc-
essing). Using digital change detection and other digital processing techniques, this composite image depicting both a current and a previous activ- ity in Norfolk harbor is shown. The more recent activity is depicted by the background photograph which is reproduced digitally with 64 gray-scale shades. Previous activity is indicated by the "ghost" ships, expressed as white outlines. This image was created digitally through precise spatial and radiometric matching of the two original images, followed by application of a spatial gradient (deriva- tive) to the previous activity image.
The creative application of the above AIP tech- niques and countless related others to the fields of weather, cartography, earth resources, non- destructive testing, military reconnaissance, etc., are limited only by the knowledge of how uniquely to apply AIP to the user's problem.
Original photo furnished courtesy by USAF, Rome Air Development Center; digital processing provided by Digital Image Systems Division, Control Data Corp., Minneapolis, Minn.
meteorology and a description of the auto- mated processing of image data for cloud analysis at the Air Force Global Weather Central (AFGWC), Offutt AFB, Nebraska.
In meterology the first and most extensive use of satellite imagery has been in cloud analysis. Figure 1 shows the eastern United States at a resolution of one-third nautical mile (n. mi.) on visual imagery. Across the center of the picture is a frontal cloud struc- ture extending from Pennsylvania on the
right to Western Tennessee on the left. The amount and area of the cloud cover is easily analyzed.
In the lower part of the picture over north- ern Florida the character and extent of a scat- tered cloud area is clearly shown. On the right-hand side, over the Atlantic Ocean, the nature and extent of the cloud cover could never be constructed from surface reports alone.
Clouds not associated with classical weather systems, such as fronts and low- pressure areas, are often some of the most
ABSTRACT: A survey of primary satellite imagery applications in meteorology. Applications are illustrated with examples of actual phenomena as shown by satellite imagery. Automated processing procedures are described as used at the Air Force Global Weather Central to incorporate satellite imagery data into the automated 3D-NEPH cloud analysis.
I METEOROLOGY APPLICATIONS OF SATELLITE IMAGERY 1167
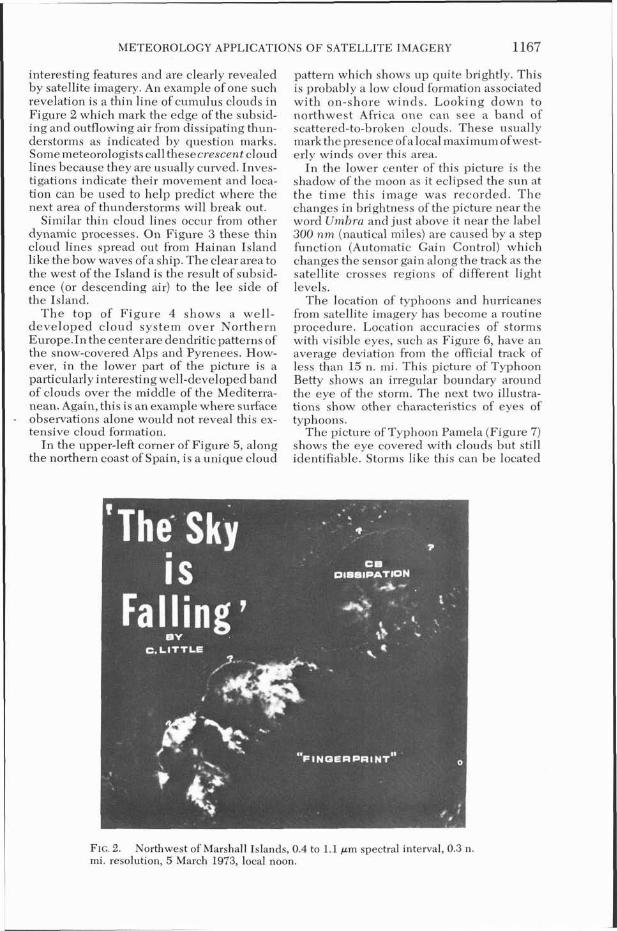
interesting features and are clearly revealed by satellite imagery. An example of one such revelation is a thin line of cumulus clouds in Figure 2 which mark the edge of the subsid- ing and outflowing air from dissipating thun- derstorms as indicated by question marks. Some meteorologists call thesecrescent cloud lines because they are usually curved. Inves- tigations indicate their movement and loca- tion can be used to help predict where the next area of thunderstorms will break out.
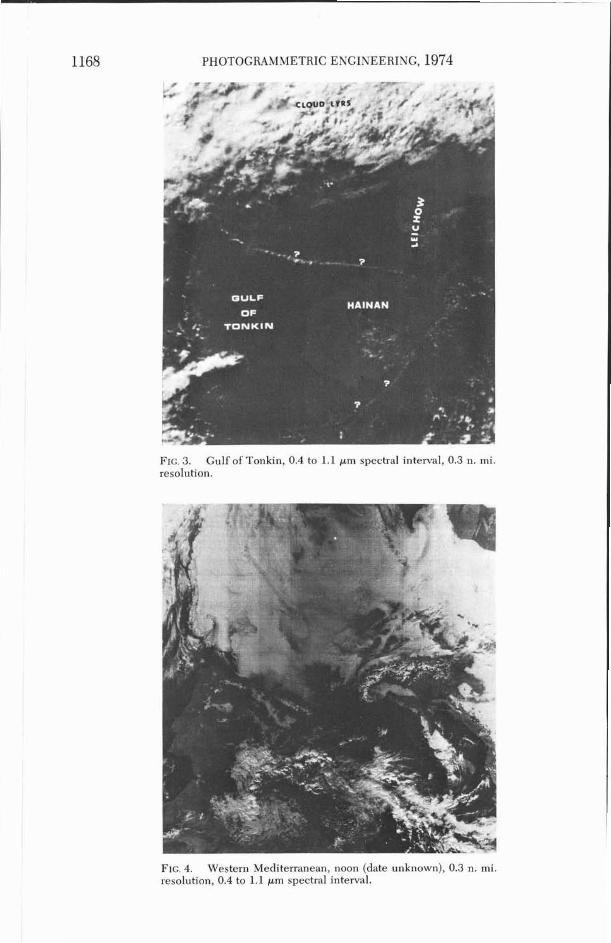
Similar thin cloud lines occur from other dynamic processes. On Figure 3 these thin cloud lines spread out from Hainan Island like the bow waves of a ship. The clear area to the west of the Island is the result of subsid- ence (or descending air) to the lee side of the Island.
T h e top of Figure 4 shows a well- developed cloud system over Northern Europe.In the center are dendritic patterns of the snow-covered Alps and Pyrenees. How- ever, in the lower part of the picture is a particularly interesting well-developed band of clouds over the middle of the Mediterra- nean. Again, this is an example where surface
- observations alone would not reveal this ex- tensive cloud formation.
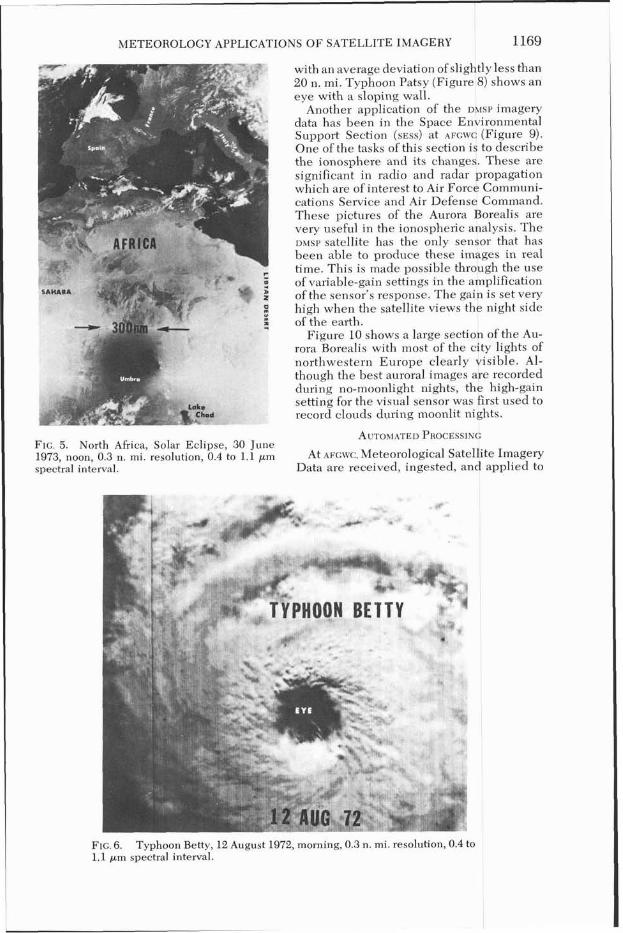
In the upper-left corner of Figure 5, along the northern coast of Spain, is a unique cloud
pattern which shows up quite brightly. This is probably a low cloud formation associated with on-shore winds. Looking down to northwest Africa one can see a band of scattered-to-broken clouds. These usually mark the presence ofa local maximum ofwest- erly winds over this area.
In the lower center of this picture is the shadow of the moon as it eclipsed the sun at the time this image was recorded. The changes in brightness of the picture near the word Umbra and just above it near the label 300 nm (nautical miles) are caused by a step function (Automatic Gain Control) which changes the sensor gain along the track as the satellite crosses regions of different light levels.
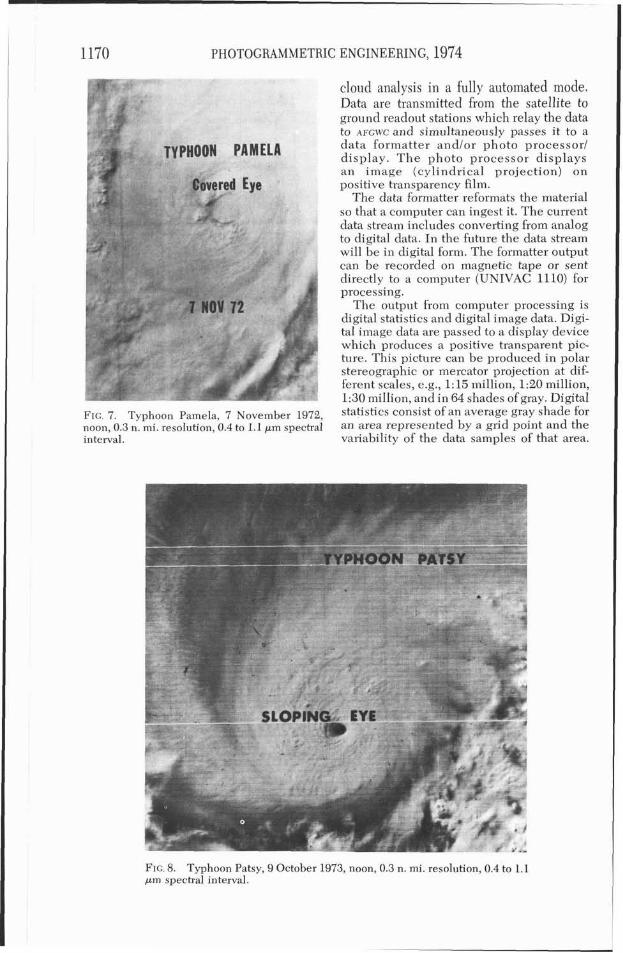
The location of typhoons and hurricanes from satellite imagery has become a routine procedure. Location accuracies of storms with visible eyes, such as Figure 6, have an average deviation from the official track of less than 15 n. mi. This picture of Typhoon Betty shows an irregular boundary around the eye of the storm. The next two illustra- tions show other characteristics of eyes of typhoons.
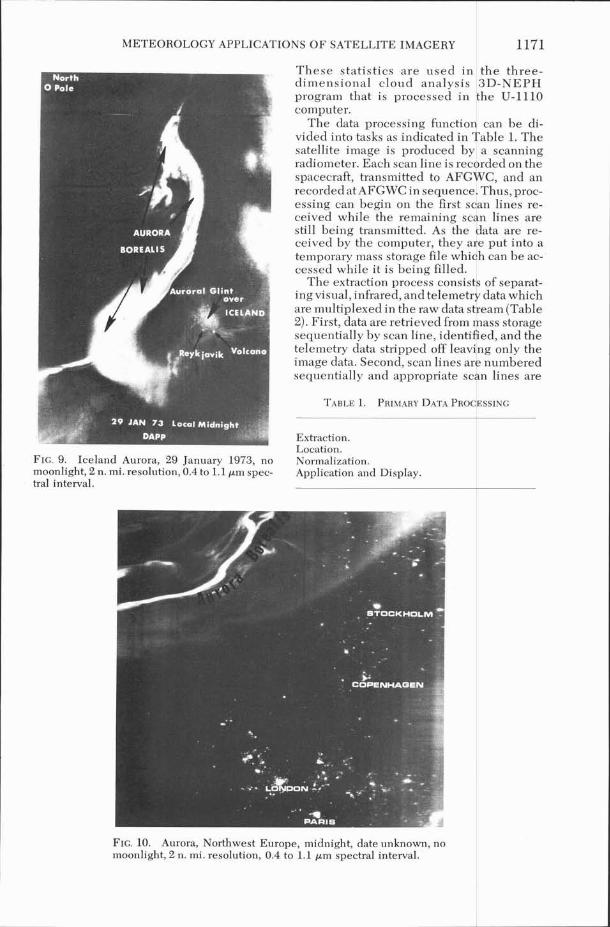
The picture of Typhoon Pamela (Figure 7) shows the eye covered with clouds but still identifiable. Storms like this can be located
FIG. 2. Northwest of Marshall Islands, 0.4 to 1.1 pm spectral interval, 0.3 n. mi. resolution, 5 March 1973, local noon.
1168 PHOTOGRAMMETRIC ENGINEERING, 1974
FIG. 3. Gulf of Tonkin, 0.4 to 1.1 pm spectral interval, 0.3 n. mi. resolution.
FIG. 4. Western Mediterranean, noon (date unknown), 0.3 n. mi. resolution, 0.4 to 1.1 p m spectral interval.
METEOROLOGY APPLICATIONS O F SATELLITE IMAGERY 1169
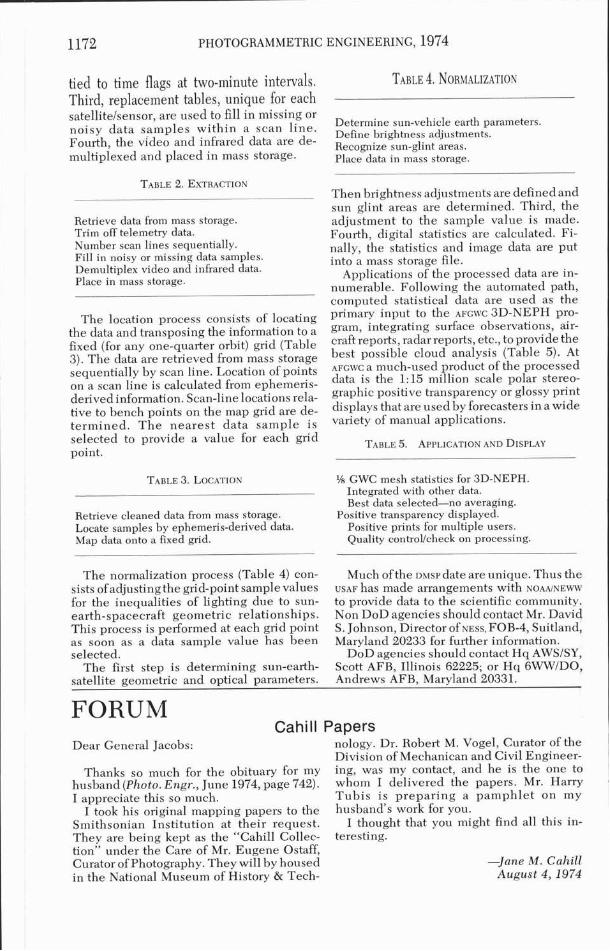
with an average deviation of slightly less than 20 n. mi. Typhoon Patsy (Figure 8) shows an eye with a sloping wall.
Another application of the DMSP imagery data has been in the Space Environmental Support Section ( s ~ s s ) at AFGWC (Figure 9). One of the tasks of this section is to describe the ionosphere and its changes. These are significant in radio and radar propagation which are of interest to Air Force Communi- cations Service and Air Defense Command. These pictures of the Aurora Borealis are very useful in the ionospheric analysis. The DMSP satellite has the only sensor that has been able to produce these images in real time. This is made possible through the use of variable-gain settings in the amplification of the sensor's response. The gain is set very high when the satellite views the night side of the earth.
Figure 10 shows a large section of the Au- rora Borealis with most of the city lights of northwestern Europe clearly visible. Al- though the best auroral images are recorded during no-moonlight nights, the high-gain setting for the visual sensor was first used to record clouds during moonlit nights.
AUTOMATED PROCESSING FIG. 5. North Africa, Solar Eclipse, 30 June 1973, noon, 0.3 n. mi. resolution, 0.4 to 1.1 pm At AFGWC. Meteorological Satellite Imagery spectral interval. Data are received, ingested, and applied to
FIG. 6. Typhoon Betty, 12 August 1972, morning, 0.3 n. mi. resolution, 0.4 to 1.1 p,m spectral interval.
1170 PHOTOGRAMMETRIC ENGINEERING, 1974
cloud analysis in a fully automated mode. Data are transmitted from the satellite to ground readout stations which relay the data to AFGWC and simultaneously passes it to a data formatter and/or photo processor1 display. T h e photo processor displays an image (cylindrical projection) on positive transparency film.
The data formatter reformats the material so that a computer can ingest it. The current data stream includes converting from analog to digital data. In the future the data stream will be in digital form. The formatter output can be recorded on magnetic tape or sent directly to a computer (UNIVAC 1110) for processing.
The output from computer processing is digital statistics and digital image data. Digi- tal image data are passed to a display device which produces a positive transparent pic- ture. This picture can be produced in polar stereographic or mercator projection at dif- ferent scales, e.g., 1:15 million, 1:20 million, 1:30 milIion, and in 64 shades of gray. Digital
F ~ ~ , 7, ~~~h~~~ pamela, 7 ~~~~~b~~ 1972, statistics consist of an average gray shade for noon, 0.3 n. mi. resolution, 0.4 to 1.1 pm spectral an area represented by a grid point and the interval. variability of the data samples of that area.
FIG. 8. Typhoon Patsy, 9 October 1973, noon, 0.3 n. mi. resolution, 0.4 to 1.1 pm spectral interval.
METEOROLOGY APPLICATIONS O F SATELLITE IMAGERY 1171
These statistics are used in the three- dimensional cloud analysis 3D-NEPH program that is processed in the U-1110 computer.
The data processing function can be di- vided into tasks as indicated in Table 1. The satellite image is produced by a scanning radiometer. Each scan line is recorded on the spacecraft, transmitted to AFGWC, and an recorded at AFGWC in sequence. Thus, proc- essing can begin on the first scan lines re- ceived while the remaining scan lines are still being transmitted. As the data are re- ceived by the computer, they are put into a temporary mass storage file which can be ac- cessed while it is being filled.
The extraction process consists of separat- ing visual, infrared, and telemetry data which are multiplexed in the raw data stream (Table 2). First, data are retrieved from mass storage sequentially by scan line, identified, and the telemetry data stripped off leaving only the image data. Second, scan lines are numbered sequentially and appropriate scan lines are
Extraction. T .nratinn - - - - - - - - -.
FIG. 9. Iceland Aurora, 29 January 1973, no Normalization. moonlight, 2 n. mi. resolution, 0.4 to 1.1 pm spec- Application and Display. tral interval.
FIG. 10. Aurora, Northwest Europe, midnight, date unknown, no moonlight, 2 n. mi. resolution, 0.4 to 1.1 pm spectral interval.
1172 PHOTOGRAMMETRIC ENGINEERING, 1974
tied to time flags at two-minute intervals. TABLE 4. NORMALIZATION Third. replacement tables, unique for each , A
satelliteIsensor, are used to fill in missing or Determine sun-vehicle earth parameters. noisy data samples within a scan line. Define brightness adjustments, Fourth, the video and infrared data are de- Recognize sun-glint areas. multiplexed and placed in mass storage. Place data in mass storage.
Retrieve data from mass storage. Trim off telemetry data. Number scan lines sequentially. Fill in noisy or missing data samples. Demultiplex video and infrared data. Place in mass storage.
The location process consists of locating the data and transposing the information to a fixed (for any one-quarter orbit) grid (Table 3). The data are retrieved from mass storage sequentially by scan line. Location of points on a scan line is calculated from ephemeris- derived information. Scan-line locations rela- tive to bench points on the map grid are de- termined. T h e nearest data sample is
Then brightness adjustments are defined and sun glint areas are determined. Third, the adjustment to the sample value is made. Fourth, digital statistics are calculated. Fi- nally, the statistics and image data are put into a mass storage file.
Applications of the processed data are in- numerable. Following the automated path, c o m ~ u t e d statistical data are used as the pri&ry input to the AFGWC 3D-NEPH pro- gram, integrating surface observations, air- craft reports, radar reports, etc., to ~ r o v i d e the best possible cloud analysis (Table 5). At AFGWC a much-used product of the processed data is the 1:15 million scale polar stereo- graphic positive transparency or glossy print displays that are used by forecasters in a wide variety of manual applications.
selected to provide a value for each grid TABLE 5. APPLICATION AND DISPLAY point.
TABLE 3. LOCATION lh GWC mesh statistics for 3D-NEPH. Integrated with other data. Best data selected-no averaging.
Retrieve cleaned data from mass storage. Positive transparency displayed. Locate samples by ephemeris-derived data. Positive prints for multiple users. Map data onto a fixed grid. Quality controVcheck on processing.
The normalization process (Table 4) con- Much of the ~ ~ s p d a t e are unique. Thus the sists ofadjustingthe grid-point sample values USAF has made arrangements with NOAAINEWW
for the inequalities of lighting due to sun- to provide data to the scientific community. earth-spacecraft geometric relationships. Non DoD agencies should contact Mr. David This process is performed at each grid point S. Johnson, Director of NESS, FOB-4, Suitland, as soon as a data sample value has been Maryland 20233 for further information. selected. DoD agencies should contact Hq AWSISY,
The first step is determining sun-earth- Scott AFB, Illinois 62225; or Hq GWWIDO, satellite geometric and optical parameters. Andrews AFB, Maryland 20331.
FORUM Cahill Papers
Dear General Jacobs: nology. Dr. Robert M. Vogel, Curator of the Division of Mechanican and Civil Engineer-
Thanks so much for the obituary for my ing, was my contact, and he is the one to husband (Photo. Engr., June 1974, page 742). whom I delivered the papers. Mr. Harry I appreciate this so much. Tubis is preparing a pamphlet on my
I took his original mapping papers to the husband's work for you. Smithsonian Institution at their request. I thought that you might find all this in- They are being kept as the "Cahill Collec- teresting. tion" under the Care of Mr. Eugene Ostaff, Curator of Photography. They will by housed -Jane M . Cahill in the National Museum of History & Tech- August 4, 1974