methamphetamine use and related harms in nsw · nsw health methamphetamine use and related harms in...
TRANSCRIPT

Methamphetamine Use and Related Harms in NSWSurveillance Report to December 2018

ii NSW Health Methamphetamine Use and Related Harms in NSW
NSW Ministry of Health 100 Christie Street ST LEONARDS NSW 2065 Tel. (02) 9391 9000 Fax. (02) 9391 9101 TTY. (02) 9391 9900 www.health.nsw.gov.au
Produced by: NSW Ministry of Health
This work is copyright. It may be reproduced in whole or in part for study or training purposes subject to the inclusion of an acknowledgement of the source. It may not be reproduced for commercial usage or sale. Reproduction for purposes other than those indicated above requires written permission from the NSW Ministry of Health.
© NSW Ministry of Health 2019
SHPN (CPH) 190380 ISBN 978-1-76081-209-6
Further copies of this document can be downloaded from the NSW Health website www.health.nsw.gov.au
June 2019

NSW Health Methamphetamine Use and Related Harms in NSW 1
Contents Executive summary .........................................................................................................................2
Methamphetamine use .........................................................................................................................................2
Health harms from methamphetamine use .................................................................................................2
Social harms from methamphetamine use ..................................................................................................3
1. Methamphetamine use ............................................................................................................ 41.1 Recent use of methamphetamine..........................................................................................................4
1.2 Frequency of methamphetamine use ..................................................................................................6
1.3 Form of methamphetamine used ..........................................................................................................7
1.4 Purity of methamphetamine ....................................................................................................................9
1.5 Availability and cost of methamphetamine ...................................................................................... 11
1.6 Method of methamphetamine use ....................................................................................................... 11
1.7 Use of methamphetamine in regional NSW .................................................................................... 12
2. Health harms from methamphetamine use ....................................................................... 132.1 Methamphetamine-related emergency department presentations ...................................... 13
2.2 Methamphetamine-related hospital admissions ............................................................................ 14
2.3 Psychostimulant induced deaths ........................................................................................................20
2.4 Deaths where methamphetamine was detected ........................................................................... 21
2.5 Treatment episodes for methamphetamine use ........................................................................... 23
2.6 Methamphetamine-related calls to drug information services ............................................... 23
3. Social harms from methamphetamine use ....................................................................... 253.1 Arrests relating to amphetamines ...................................................................................................... 25
3.2 Drug driving incidents where methamphetamine was detected ........................................... 26
4. Limitations of the data ........................................................................................................... 27
Appendix A: Data sources and description ........................................................................... 28
Appendix B: Case selection for NSW Health data ...............................................................30
Appendix C: Reference list .......................................................................................................... 31

2 NSW Health Methamphetamine Use and Related Harms in NSW
Executive summaryThe proportion of people in NSW who used methamphetamine in 2016 remained low (0.7%). However among people who used methamphetamine, an increased proportion of use was high risk. People who used methamphetamine reported more frequent use, an increase in injected use and use of a high purity crystal form (‘ice’).
Despite the continued low use of methamphetamine in the general community, there was a rapid increase from 2010 onwards in the number of people who experienced methamphetamine-related harm, with a peak in harms in 2016-17. These harms were seen through methamphetamine-related emergency department presentations, hospital admissions and deaths. The level of methamphetamine-related harm remained high in 2017-18. This suggests that a relatively small proportion of people in NSW with higher risk patterns of methamphetamine use have experienced rapidly increasing health and social harms from methamphetamine.
People who experienced higher rates of harm included 25-44 year old people, males, Aboriginal people, and people who live in regional areas of NSW. Many people who experienced methamphetamine related harm also had co-existing mental health conditions, and experienced high rates of other substance related harm.
Certain groups of people with high rates of use and harms may not be well reflected in overall statewide data. The limitations of the data sources used to inform this report are described below. While there are many types of amphetamines, this report focuses on methamphetamine, with some information on 3,4-methylenedioxymethamphetamine (MDMA) and other drugs included for context.
Methamphetamine use
1. Methamphetamine use in the general community remained low in NSW in 2016, at 0.7%.
2. Methamphetamine use was not uniformly distributed across the NSW population. For example, in 2017-18, 31% of people entering NSW correctional centres reported recent use of methamphetamine. Wastewater monitoring in 2018 indicated that average methamphetamine consumption was higher in people living outside Sydney.
3. In people who reported recent use of methamphetamine, an increasing proportion reported frequent use, and injection was increasingly the method of use. The high purity crystal form (‘ice’) was the form most commonly used.
4. The median purity of seized crystal methamphetamine remained stable at close to 80%. Although the median purity of seized MDMA capsule contents was much higher than the median purity of MDMA tablets, MDMA tablets had a higher median weight compared with capsule contents. As a result, the estimated median dose of MDMA per capsule or tablet was similar.
5. People who inject drugs in NSW reported that crystal methamphetamine became cheaper, falling from $400 per gram in 2016 to $250 per gram in 2018 (IDRS NSW, 2018).
Health harms from methamphetamine use
1. The rate of methamphetamine-related emergency department presentations in NSW increased from 0.8 per 1,000 presentations in 2011-12, to a peak of 3.0 per 1,000 presentations in 2015-16. The rate of methamphetamine-related emergency department presentations stabilised at 2.4 per 1,000 presentations in 2017-18.
2. The rate of methamphetamine-related hospital admissions from public and private hospitals increased rapidly from 10.9 in 2010-11 to 115.1 in 2016-17, but stabilised in 2017-18 at 107.7 per 100,000 population.

NSW Health Methamphetamine Use and Related Harms in NSW 3
3. Methamphetamine-related public hospital admission rates were higher in men, Aboriginal people, people aged 25-44 years, and people living in inner regional areas. Many people admitted to hospital with a primary methamphetamine-related diagnosis also experienced harm from other substances. Many of these people also had other serious health conditions, including mental health conditions.
4. Psychostimulant-induced deaths (which included amphetamines, but excluded cocaine) increased rapidly from 51 deaths in 2010 to 197 deaths in NSW in 2016.
5. There was a peak in the number of deaths where methamphetamine was detected in forensic toxicological analyses in 2016. The number of deaths where methamphetamine was detected stabilised at high levels in 2017 and 2018, but remained well below the number of deaths where opioids were detected.
6. There were higher rates of psychostimulant-induced deaths in rural and remote areas of NSW compared to major cities in 2016. The rate of deaths where methamphetamine was detected in forensic toxicological analyses was higher in regional areas of NSW compared with major cities from 2012 onwards.
Social harms from methamphetamine use
1. Arrests for possession and/or use of amphetamines remained relatively stable in NSW between 2015 and 2018.
2. The number of drug driving incidents where methamphetamine was detected stabilised in 2017 and 2018 after a peak in 2015.

4 NSW Health Methamphetamine Use and Related Harms in NSW
1. Methamphetamine use
1.1 Recent use of methamphetamine
Figure 1: Recent use of meth/amphetamines by sex, NSW, 2010 to 2016
0.0
0.2
0.4
0.6
0.8
1.0
1.2
1.4
1.6
1.8
2.0
2010 2013 2016
Per
cent
age
of
po
pul
atio
n
Males Females Persons
Source: National Drug Strategy Household Survey 2016
The percentage of the population reporting recent use of ‘methamphetamine or amphetamines’ in the preceding 12 months decreased significantly in NSW between 2013 and 2016 (Figure 1).
In Australia, the proportion of people who reported recent use of methamphetamine was higher in particular groups, such as those in remote and very remote regions; those in the lowest economic decile; and lesbian, gay, bisexual, transgender, intersex and queer (LGBTIQ) communities (AIHW, 2017). Information on the rate of use in these groups was not able to be reported at the state level.

NSW Health Methamphetamine Use and Related Harms in NSW 5
Figure 2: High risk alcohol consumption, meth/amphetamine use and MDMA use, NSW, 2010 to 2016
0
5
10
15
20
25
30
35
40
2010 2013 2016
Per
cent
age
of
po
pul
atio
n
Alcohol (single occasion risk) Alcohol (lifetime risk)
Meth/amphetamine (recent use) MDMA (recent use)
Single occasion risk = more than 4 standard drinks on one occasion in the last 12 months Lifetime risk = more than 2 standard drinks per day in the last 12 months
Source: National Drug Strategy Household Survey 2016
High risk alcohol consumption remains a much more prevalent substance use issue at a population level than both methamphetamine and MDMA (Figure 2).
Figure 3: Recent use of methamphetamine among persons entering NSW correctional centres, NSW, April 2017 to December 2018
0
5
10
15
20
25
30
35
40
Apr - Jun Jul - Sep Oct - Dec Jan - Mar Apr - Jun Jul - Sep Oct - Dec
2017 2018
Rat
er p
er 1
00
peo
ple
ent
erin
g
into
pri
son
rep
ort
ing
rec
ent
use
Methamphetamine MDMA
Source: Justice Health and Forensic Mental Health Network, NSW
In 2017-18 31% of patients entering NSW Correction Centres reported recent use of methamphetamine (in the four weeks prior to entering custody). Of those, 57% reported daily or almost daily use of methamphetamine, and 79% reported methamphetamine use at least weekly. In comparison, only 1% reported recent use of MDMA (Figure 3).

6 NSW Health Methamphetamine Use and Related Harms in NSW
1.2 Frequency of methamphetamine use
Figure 4: Frequency of meth/amphetamine use among recent users, Australia, 2007 to 2016
0
10
20
30
40
50
60
2007 2010 2013 2016
Pro
po
rtio
n o
f re
cent
use
rs
Once a week or more About once a month
Every few months Once or twice a year
Source: National Drug Strategy Household Survey 2016
The proportion of people using methamphetamine/amphetamine across the population decreased from 2010 to 2016. However, those reporting use ‘once a week or more’ increased between 2010 and 2016 (Figure 4).
Figure 5: Use of meth/amphetamine at least weekly among recent users by sex, Australia, 2010 to 2016
0
10
20
30
40
50
60
2010 2013 2016
Pro
po
rtio
n o
f re
cent
use
rs
Males Females
Source: National Drug Strategy Household Survey 2016
The proportion of people reporting weekly use of methamphetamine/amphetamine increased between 2010 and 2016, particularly amongst males (Figure 5).

NSW Health Methamphetamine Use and Related Harms in NSW 7
Figure 6: Daily use of methamphetamine amongst people who recently used methamphetamine, NSW, 2008 to 2018
0
2
4
6
8
10
12
14
16
18
20
2008 2009 2010 2011 2012 2013 2014 2015 2016 2017 2018
Pro
po
rtio
n o
f m
etha
mp
heta
min
e us
ers
surv
eyed
Source: Illicit Drug Reporting System, 2018
A survey in NSW suggests that among people who inject drugs and reported recent use of methamphetamine, daily use of methamphetamine may be decreasing from the peak seen in 2016 (Figure 6).
The Australian Needle and Syringe Program survey 2013-17 showed a high proportion of people reported injecting drugs at least daily in the past month in 2017 (46% in NSW) (ANSPS, 2013-17).
1.3 Form of methamphetamine used
Figure 7: Recent use of meth/amphetamine among people aged 14 years and older, by form of meth/amphetamine used, NSW, 2010 to 2016
0
10
20
30
40
50
60
2010 2013 2016
Form
s as
a p
rop
ort
ion
of
tota
l
Powder Crystal, ice
Base/Paste/Pure Tablet
Prescription amphetamines Capsules
Source: National Drug Strategy Household Survey 2016

8 NSW Health Methamphetamine Use and Related Harms in NSW
Recent use of crystal methamphetamine (‘ice’) accounted for over 50% of all methamphetamine/amphetamine use in NSW in 2016 (Figure 7).
Figure 8: Recent use of methamphetamine in people who reported using recreational psychostimulants, by form of methamphetamine, NSW, 2003 to 2018
0
10
20
30
40
50
60
70
80
90
100
2003 2004 2005 2006 2007 2008 2009 2010 2011 2012 2013 2014 2015 2016 2017 2018
Pro
po
rtio
n re
po
rtin
g u
se
Crystal methamphetamine Any methamphetamine
Source: Ecstasy and Related Drugs Reporting System NSW 2018
There has been a decrease in methamphetamine use among people who regularly use psychostimulants such as MDMA (Figure 8). However methamphetamine use among people who inject drugs remains high; everyone surveyed in 2016, 2017 and 2018 in NSW who reported recent use of methamphetamine reported recent use of the crystalline form (Figure 9).
Figure 9: Recent use of methamphetamine among people who inject drugs, by form of methamphetamine used, NSW, 2002 to 2018
0
10
20
30
40
50
60
70
80
90
100
2002 2003 2004 2005 2006 2007 2008 2009 2010 2011 2012 2013 2014 2015 2016 2017 2018
Pro
po
rtio
n re
po
rtin
g u
se
Speed Base Crystal All forms
Source: Illicit Drug Reporting System 2018

NSW Health Methamphetamine Use and Related Harms in NSW 9
1.4 Purity of methamphetamine
Figure 10: Median purity of methamphetamine seized by NSW Police, by form of methamphetamine, NSW, July 2009 to December 2018
0
20
40
60
80
100
2009 2010 2011 2012 2013 2014 2015 2016 2017 2018
Med
ian
pur
ity
(%)
Crystal Paste Powder All
The shaded region represents the interquartile range (or middle 50% of values), and provides some indication of the variability in the estimated median purity of methamphetamine across seizures.
Table 1. Number of methamphetamine samples seized by NSW Police and tested for purity, by form of methamphetamine, NSW, July 2009 to December 2018
Form Year
2009 2010 2011 2012 2013 2014 2015 2016 2017 2018
Crystal 111 303 370 452 654 965 1157 1614 694 756
Paste 46 87 60 37 21 9 7 19 1 0
Powder 43 83 66 50 31 30 12 13 10 20
Other 29 179 166 99 51 88 44 155 33 48
Unspecified 21 123 131 109 59 85 54 77 22 32
Total 250 775 793 747 816 1177 1274 1878 760 856
Source: NSW Forensic and Analytical Science Service, NSW Health Pathology, 2019
Changes to the Drug Misuse and Trafficking Regulation in 2017 for seized substances requiring testing may affect trend analyses. The purity of NSW Police seizures for forms other than crystal should be interpreted with caution. Other forms (capsules, compressed, grains, liquid, and wax) and unspecified forms of methamphetamine samples represented 5.1% and 7.5% of seized samples respectively, and were not included in Figure 10.
The median purity of methamphetamine seizures has remained stable at around 75-80% purity since 2015 (Figure 10). Crystal methamphetamine represented 76% of all methamphetamine samples tested across this period (range: 39% in 2010 to 91% in 2017). The purity of the powder form of methamphetamine reached the same purity as the crystal form in 2018, but this form represented only 2% of all samples tested (Table 1).

10 NSW Health Methamphetamine Use and Related Harms in NSW
A survey of people who inject drugs reported that around 60% of responders perceived the purity of crystal methamphetamine (‘ice’) to be ‘medium’ to ‘high’ in 2018 (IDRS NSW, 2018).
Figure 11: Median purity of MDMA seized by NSW Police, by form of MDMA, NSW, July 2009 to December 2018
0
20
40
60
80
100
2009 2010 2011 2012 2013 2014 2015 2016 2017 2018
Med
ian
pur
ity
(%)
Capsule Powder/crystal Tablet All
The shaded region represents the interquartile range (or middle 50% of values), and provides some indication of the variability in the estimated median purity of MDMA across seizures.
Table 2. The number of MDMA samples seized by NSW Police and tested for purity, by form of MDMA, NSW, July 2009 to December 2018
Form Year
2009 2010 2011 2012 2013 2014 2015 2016 2017 2018
Capsule 7 9 10 30 36 101 189 322 115 102
Powder/crystal 6 13 11 20 41 87 122 257 67 59
Tablet 247 149 95 246 202 237 227 192 89 53
Other 1 0 2 2 2 7 10 9 18 14
Unspecified 3 1 3 4 12 21 23 51 29 83
Total 264 172 121 302 293 453 571 831 318 311Source: NSW Forensic and Analytical Science Service, NSW Health Pathology, 2019
Changes to the Drug Misuse and Trafficking Regulation in 2017 for seized substances requiring testing may affect trend analyses. Other forms (paste, compressed, grains and liquid) and unspecified forms of MDMA represented 1.9% and 7.0% of seized samples respectively, and were not displayed in Figure 11.
The median purity of MDMA is driven by the form tested. In 2018 the median purity overall was 67%, with the median purity of capsules at 74% and the median purity of tablets only 24% (Figure 11).
In 2009, tablets represented 94% of MDMA samples tested, however by 2018 tablets represented only 17% of all samples tested. In 2018 capsules and powder/crystal samples represented 52% of samples tested (Table 2).

NSW Health Methamphetamine Use and Related Harms in NSW 11
Figure 12: Estimated median weight of pure MDMA (per capsule contents or tablet) seized by NSW Police, July 2009 to December 2018
0
20
40
60
80
140
120
100
2009 2010 2011 2012 2013 2014 2015 2016 2017 2018
Med
ian
wei
ght
(m
illig
ram
s)
Capsule content Tablet
Source: NSW Forensic and Analytical Science Service, NSW Health Pathology, 2019
Changes to the Drug Misuse and Trafficking Regulation in 2017 for seized substances requiring testing may affect trend analyses. The purity of NSW Police seizures should be interpreted with caution. The shaded region represents the interquartile range (or middle 50% of values), and provides some indication of the variability in the estimated median weight of MDMA across seizures.
Although MDMA capsule contents had a much higher purity of MDMA than tablets from 2013 onwards, due to the higher median weight of tablets compared to capsule contents, the estimated median dose of MDMA (weight of pure MDMA) per capsule or tablet was similar for MDMA capsules and tablets from 2011 to 2017 (Figure 12). Although there was a higher estimated median weight of MDMA per tablet in 2018, this should be interpreted with caution due to the large variability in the median weight of tablets seized in 2018.
A survey conducted in NSW among people who regularly used psychostimulants reported that in 2018, 77% of the cohort had recently used MDMA capsules and 41% had recently used MDMA tablets (EDRS NSW, 2018).
1.5 Availability and cost of methamphetamineThere appeared to be little change in perceived availability of crystal methamphetamine amongst surveyed people who inject drugs, with 89% reporting access as ‘easy’ or ‘very easy’ in 2018 (IDRS NSW, 2018). In NSW the median price per gram of crystal methamphetamine reported by people who inject drugs decreased, falling from $400 per gram in 2016 to $250 per gram in 2018 (IDRS NSW 2018).
Regarding MDMA, the median price in 2018 for a point was $150, and appeared to have fallen gradually since 2015 (EDRS NSW, 2018).
1.6 Method of methamphetamine useNationally, among people attending needle and syringe programs, there was a significant increase between 2013 and 2017 of people reporting methamphetamine as the drug most recently injected (29% to 41%) (ANSPS 2013-17). Another NSW-based survey showed an increased proportion of people who inject drugs, reporting methamphetamine as the drug injected most often; and as the drug last injected (IDRS NSW, 2018).

12 NSW Health Methamphetamine Use and Related Harms in NSW
1.7 Use of methamphetamine in regional NSW
Figure 13: Estimated methamphetamine consumption in mass consumed per day (left axis) and doses per day (right axis) per thousand people by region and jurisdiction, Australia, August 2018
0
00
90
03
00
60
08
021
071
016
025
04
00
510
68
08
111
50
100
780
02
00
50
110
120
200
240
280
290
330
390
92
077
00
70
130
27 017
022
06
30
76 119
00
40
190
41
018
04
80
01
06
70
370
46
06
10
62
06
611
412
112
212
312
412
510
110
310
410
212
912
0
059
300
ACT
Capital RegionalAll SiteAverage
CapitalAverage
RegionalAverage
* No Data
* *
NSW NT Qld SA Tas Vic WA
600
900
1200
Est
imat
ed C
ons
ump
tio
n(m
g /
10
00
Peo
ple
/ D
ay) E
stimated
Co
nsump
tion
(Do
ses / 100
0 P
eop
le / Day)
1500
1800
2100
2400
2700
3000
3300 110
100
90
80
70
60
50
40
30
20
10
0
Source: National Wastewater Drug Monitoring Program Report December 2018
Based on data collected from wastewater analysis, methamphetamine consumption in the general community appears to vary across sites in both Sydney and regional areas of NSW. Estimated average consumption in NSW was higher in certain communities outside Sydney in 2018 (Figure 13).
Figure 14: Estimated MDMA consumption in mass consumed per day (left axis) and doses per day (right axis) per thousand people by region and jurisdiction, Australia, August 2018
0
009
003
006
008
021
071
016
025
040
051
068
081
115
010
078
002
005
011
012
020
024
028
029
033
039
092
077
007
013
027
017
022
063
076
119
004
019
041
018
048
001
067
037
046
061
062
066
114
121
122
123
124
125
101
103
104
102
129
120
059
200
ACT
Capital RegionalAll SiteAverage
CapitalAverage
RegionalAverage
* No Data
NSW NT Qld SA Tas Vic WA
400
600
800
Est
imate
d C
on
sum
pti
on
(mg
/ 1
00
0 P
eo
ple
/ D
ay
) Estim
ate
d C
on
sum
ptio
n(D
ose
s / 100
0 P
eo
ple
/ Day
)
1000
1200
1400
1600
1800
2000
2200
2400 24
20
22
18
16
14
12
10
8
6
4
2
0* *
Source: National Wastewater Drug Monitoring Program Report December 2018
Based on data collected from wastewater analysis, MDMA use appears to be more varied in the regional areas than capital cities (Figure 14).

NSW Health Methamphetamine Use and Related Harms in NSW 13
2. Health harms from methamphetamine use
2.1 Methamphetamine-related emergency department presentations
Figure 15: Rate of methamphetamine-related emergency department presentations in people aged 16 years and over, by sex, NSW, 2011-12 to 2017-18
0
2
4
6
8
2011-12 2012-13 2013-14 2014-15 2015-16 2016-17 2017-18
Rat
e p
er 1
,00
0 p
rese
ntat
ions
Male Female Total
Source: NSW Public Health Rapid, Emergency, Disease and Syndromic Surveillance system
The rate of methamphetamine-related emergency department presentations in NSW increased from 0.8 per 1,000 presentations in 2011-12 and peaked at 3.0 per 1,000 presentations in 2015-16. The rate of methamphetamine-related emergency department presentations decreased slightly to 2.4 per 1,000 presentations in 2017-18 (Figure 15).
The number of methamphetamine-related emergency department presentations in NSW stabilised at high levels in 2017-18. This pattern is evident among both men and women (Figure 15), and across all age groups, with the majority of the burden in the 25-34 and 35-44 age groups (Figure 16).

14 NSW Health Methamphetamine Use and Related Harms in NSW
Figure 16: Rate of methamphetamine-related emergency department presentations in people aged 16 years and over, by age group, NSW, 2011-12 to 2017-18
0
2
4
6
8
2011-12 2012-13 2013-14 2014-15 2015-16 2016-17 2017-18
Rat
e p
er 1
,00
0 p
rese
ntat
ions
16-24 years 25-34 years 35-44 years
45-54 years 55+ years
Source: NSW Public Health Rapid, Emergency, Disease and Syndromic Surveillance system
In NSW, the 25-34 and 35-44 year age groups experienced the highest rates of methamphetamine-related emergency department presentations, with a rate of 5.3 rate per 1,000 presentations in both groups in 2017-18 (Figure 16).
2.2 Methamphetamine-related hospital admissionsFigure 17: Rate of methamphetamine-related hospitalisations to public and private hospitals, NSW, 2010-11 to 2017-18
0
50
100
150
200
2010-11 2011-12 2012-13 2013-14 2014-15 2015-16 2016-17 2017-18
Rat
e p
er 1
00
,00
0 p
op
ulat
ion
All Private Public
Source: NSW Combined Admitted Patient Epidemiology Data and ABS population estimates (SAPHaRI). The shaded area represents the 95% confidence interval for each data point.
The rate of methamphetamine-related hospital admissions from all hospitals increased rapidly from 10.9 in 2010-11 to 115.1 per 100,000 population in 2016-17, but stabilised at high levels in 2017-18, with a rate of 107.7 per 100,000 population. The majority of methamphetamine-related admissions were to public hospitals (Figure 17).

NSW Health Methamphetamine Use and Related Harms in NSW 15
Many people who experienced harm from methamphetamine also experienced harm from other substances, and many people who experienced harm also had other serious health conditions, including mental health conditions. For example, among people admitted to hospital with a primary diagnosis related to methamphetamine in 2017-18 (2,897 admissions), the most common other diagnoses identified in the first five recorded secondary diagnosis fields were: diagnoses related to the use of other substances such as cannabis, other stimulants, alcohol and opioids (2,424 diagnoses); and diagnoses related to mental health conditions (880 diagnoses).
Among people admitted to hospital with a primary methamphetamine related diagnosis in 2017-18 (2,897 admissions), mental health conditions such as psychosis were commonly recorded as the primary diagnosis. For example, there were 1,006 admissions with psychosis due to methamphetamine, representing 35% of primary methamphetamine-related admissions in 2017-18.
Note that the figures below comparing different groups admitted to hospital are limited to public hospitals only.
Figure 18: Rate of amphetamine-type stimulants hospitalisations to public hospitals, by substance, NSW, 2010-11 to 2017-18
0
50
100
150
200
2010-11 2011-12 2012-13 2013-14 2014-15 2015-16 2016-17 2017-18
Rat
e p
er 1
00
,00
0 p
op
ulat
ion
All amphetamines Methamphetamine MDMA Other/unspecified
Source: NSW Combined Admitted Patient Epidemiology Data and ABS population estimates (SAPHaRI) The shaded area represents the 95% confidence interval for each data point. Amphetamine-type stimulants (ATS) are a group of drugs which have similar chemical structure and effects to amphetamine. This group includes amphetamine, methamphetamine and MDMA among other substances.
ATS hospitalisations accounted for 0.5% of total public hospitalisations in 2017-18. Methamphetamine hospitalisations accounted for 71.7% of ATS hospitalisations (0.3% of total hospitalisations) in 2017-18. The rate of hospitalisations for methamphetamines has been far higher than for MDMA across the analysed period (Figure 18).
The rate of hospitalisations for ‘other/unspecified amphetamine-type stimulants’ decreased slightly from 2014-15, probably reflecting improved specificity of hospital coding (Figure 18).

16 NSW Health Methamphetamine Use and Related Harms in NSW
Figure 19: Rate of methamphetamine-related hospitalisations to public hospitals, by sex, NSW, 2010-11 to 2017-18
0
50
100
150
200
2010-11 2011-12 2012-13 2013-14 2014-15 2015-16 2016-17 2017-18
Rat
e p
er 1
00
,00
0 p
op
ulat
ion
Male Female
Source: NSW Combined Admitted Patient Epidemiology Data and ABS population estimates (SAPHaRI). The shaded area represents the 95% confidence interval for each data point.
In 2017-18 the rate of methamphetamine-related hospital admissions from public hospitals was higher for males (118.4 per 100,000 population) than females (55.7 per 100,000 population) (Figure 19).
Figure 20: Rate of methamphetamine-related hospitalisations to public hospitals per 100,000 population, by age group, NSW, 2010-11 to 2017-18
0
50
100
150
200
2010-11 2011-12 2012-13 2013-14 2014-15 2015-16 2016-17 2017-18
Rat
e p
er 1
00
,00
0 p
op
ulat
ion
16 - 24 25 - 34 35 - 44 45 - 54 55 + years
Source: NSW Combined Admitted Patient Epidemiology Data and ABS population estimates (SAPHaRI) The shaded area represents the 95% confidence interval for each data point.
The 25-34 and 35-44 year age groups had the highest rates of methamphetamine-related hospitalisations in public hospitals, at rates of 155.8 (25-34 years) and 146.0 (35-44 years) per 100,000 population in 2017-18 (Figure 20).

NSW Health Methamphetamine Use and Related Harms in NSW 17
Figure 21: Rate of methamphetamine-related hospitalisations to public hospitals, by Aboriginal status, NSW, 2010-11 to 2017-18
0
250
500
750
1000
2010-11 2011-12 2012-13 2013-14 2014-15 2015-16 2016-17 2017-18
Rat
e p
er 1
00
,00
0 p
op
ulat
ion
Aboriginal Non-Aboriginal
Source: NSW Combined Admitted Patient Epidemiology Data and NSW Admitted Patient and ABS population estimates (SAPHaRI) The shaded area represents the 95% confidence interval for each data point.
Rates of methamphetamine-related hospital admissions were considerably higher among Aboriginal people than non-Aboriginal people. In 2017-18 the methamphetamine related hospitalisation rate in public hospitals for Aboriginal people was 649.3 per 100,000 population; the rate for non-Aboriginal people was 72.6 per 100,000 population (Figure 21).
18 NSW Health Methamphetamine Use and Related Harms in NSW
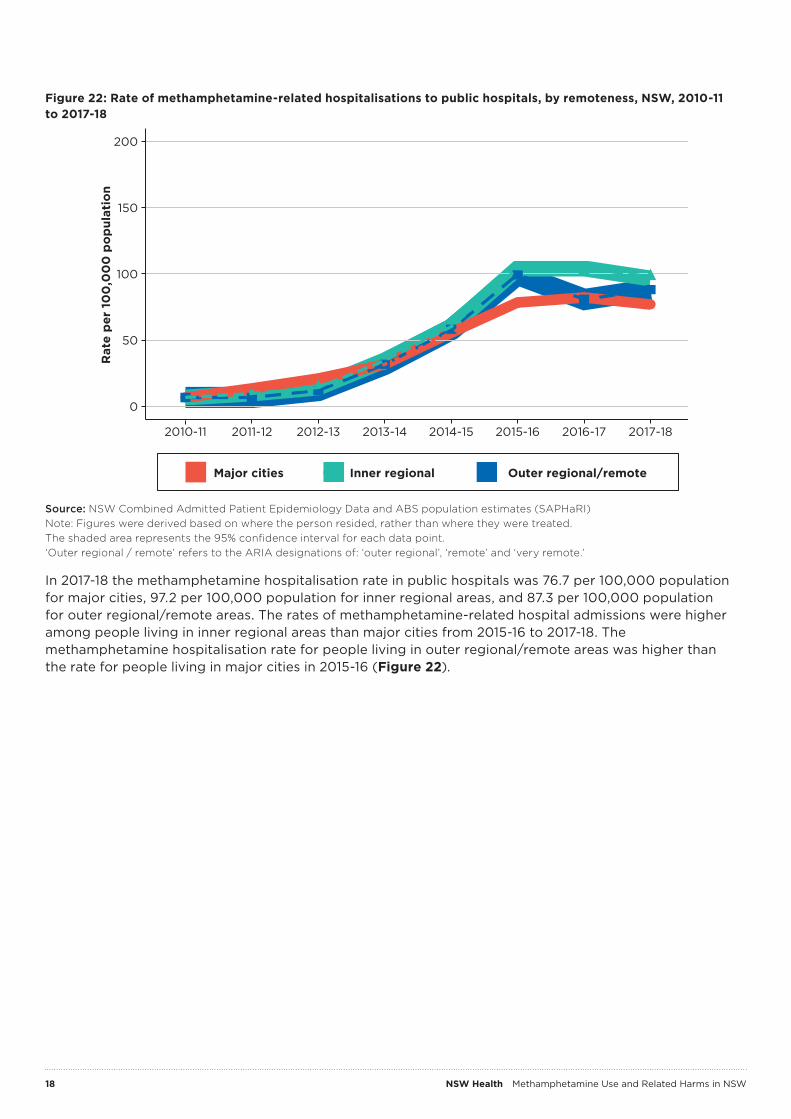
Figure 22: Rate of methamphetamine-related hospitalisations to public hospitals, by remoteness, NSW, 2010-11 to 2017-18
0
50
100
150
200
2010-11 2011-12 2012-13 2013-14 2014-15 2015-16 2016-17 2017-18
Rat
e p
er 1
00
,00
0 p
op
ulat
ion
Major cities Inner regional Outer regional/remote
Source: NSW Combined Admitted Patient Epidemiology Data and ABS population estimates (SAPHaRI) Note: Figures were derived based on where the person resided, rather than where they were treated. The shaded area represents the 95% confidence interval for each data point. ‘Outer regional / remote’ refers to the ARIA designations of: ‘outer regional’, ‘remote’ and ‘very remote.’
In 2017-18 the methamphetamine hospitalisation rate in public hospitals was 76.7 per 100,000 population for major cities, 97.2 per 100,000 population for inner regional areas, and 87.3 per 100,000 population for outer regional/remote areas. The rates of methamphetamine-related hospital admissions were higher among people living in inner regional areas than major cities from 2015-16 to 2017-18. The methamphetamine hospitalisation rate for people living in outer regional/remote areas was higher than the rate for people living in major cities in 2015-16 (Figure 22).

NSW Health Methamphetamine Use and Related Harms in NSW 19
Figure 23: Rate of methamphetamine-related psychosis hospitalisations to public hospitals, by sex, NSW, 2010-11 to 2017-18
0
10
20
30
40
50
2010-11 2011-12 2012-13 2013-14 2014-15 2015-16 2016-17 2017-18
Rat
e p
er 1
00
,00
0 p
op
ulat
ion
Male Female
Source: NSW Combined Admitted Patient Epidemiology Data and ABS population estimates (SAPHaRI) The shaded area represents the 95% confidence interval for each data point.
In 2017-18 the rate of methamphetamine-related psychosis admissions to public hospitals was 25.2 per 100,000 population for males and 11.3 per 100,000 population for females. The rate of methamphetamine-related psychosis admissions in NSW hospitals increased rapidly from 2010-11 to a peak in 2015-16 and 2016-17, and stabilised at a high level in 2017-18 (Figure 23).

20 NSW Health Methamphetamine Use and Related Harms in NSW
2.3 Psychostimulant induced deathsFigure 24: Psychostimulant induced deaths (excluding cocaine) as underlying or associated cause of death by number of deaths (left axis) and rate of deaths per 100,000 population (right axis), NSW, 1999 to 2016
0
50
100
150
200
0
1
2
3
4
1999 2000 2001 2002 2003 2004 2005 2006 2007 2008 2009 2010 2011 2012 2013 2014 2015 2016
Num
ber
of
dea
ths
Rate p
er 100
,00
0 p
op
ulation
Number of deaths Rate per 100,000
Source: Cause of death unit record file (NSW), Health Statistics New South Wales, Centre for Epidemiology and Evidence. Psychostimulants are a group of central nervous system stimulants. Common psychostimulants include: methamphetamine, MDMA, amphetamine, cocaine, caffeine, dextroamphetamine and methylphenidate. The data presented above excluded cocaine. The shaded area represents the 95% confidence interval for each data point.
Psychostimulant-induced deaths (which included amphetamine type substances, but excluded cocaine) increased rapidly from 51 deaths in 2010 to 197 deaths in 2016 in NSW (Figure 24). This is consistent with the rapid increase in methamphetamine-related harm seen in other data sources. Since 2010 more than half of the psychostimulant induced deaths included other classes of drugs as the underlying or associated cause of death.
Figure 25: Rate of psychostimulant induced deaths (excluding cocaine) as underlying or associated cause, by remoteness, NSW, 2011 to 2016
0
2
4
6
8
2011 2012 2013 2014 2015 2016
Rat
e o
f d
eath
s p
er 1
00
,00
0 p
op
ulat
ion
Major cities Rural and remote
Source: Cause of death unit record file (NSW), Health Statistics New South Wales, Centre for Epidemiology and Evidence.
‘Rural and remote’ refers to the ARIA designations of: ‘inner regional’, ‘outer regional’, ‘remote’ and ‘very remote.’ The shaded area represents the 95% confidence interval for each data point.

NSW Health Methamphetamine Use and Related Harms in NSW 21
In 2016, rural and remote areas of NSW had a higher rate of psychostimulant induced deaths than major cities (Figure 25). However, these results should be interpreted with caution due to the small numbers reported.
Although the rate of psychostimulant induced death was higher in rural and remote areas, the actual number of deaths in 2016 was lower in rural and remote areas (63 deaths) than major cities (131 deaths). This is because in 2016, the majority of the NSW population (75% of NSW residents) lived in major cities.
2.4 Deaths where methamphetamine was detected
Figure 26: Deaths where methamphetamine, MDMA or opioids were detected in forensic toxicology, by substance, NSW, July 2010 to 2018
0
200
400
600
800
1000
1200
2010 2011 2012 2013 2014 2015 2016 2017 2018
Num
ber
of
dea
ths
whe
re
sub
stan
ce d
etec
ted
Opioids MDMA Methamphetamine
Source: NSW Forensic and Analytical Science Service
The number of deaths where methamphetamine was detected in toxicological analyses rose from 92 deaths in 2010 to 314 deaths in 2016 before stabilising at high levels. In 2018, there were 289 deaths where methamphetamine was detected. This remained far lower than the number of deaths where opioids were detected (868 in 2018) (Figure 26).
For the period 2010-2018, the number of deaths where MDMA was detected was far lower than the number of deaths where methamphetamine was detected (36 deaths in 2018).
Note: Detection of a substance means that the substance was present at the time of death. It does not imply that the substance detected was the underlying or associated cause of death. In many cases, a number of substances were detected at the time of death.
Determination of the cause of death in cases where forensic toxicology tests were performed is a matter for the Coroner. Cause of death information is presented separately above (see Figure 24).
22 NSW Health Methamphetamine Use and Related Harms in NSW
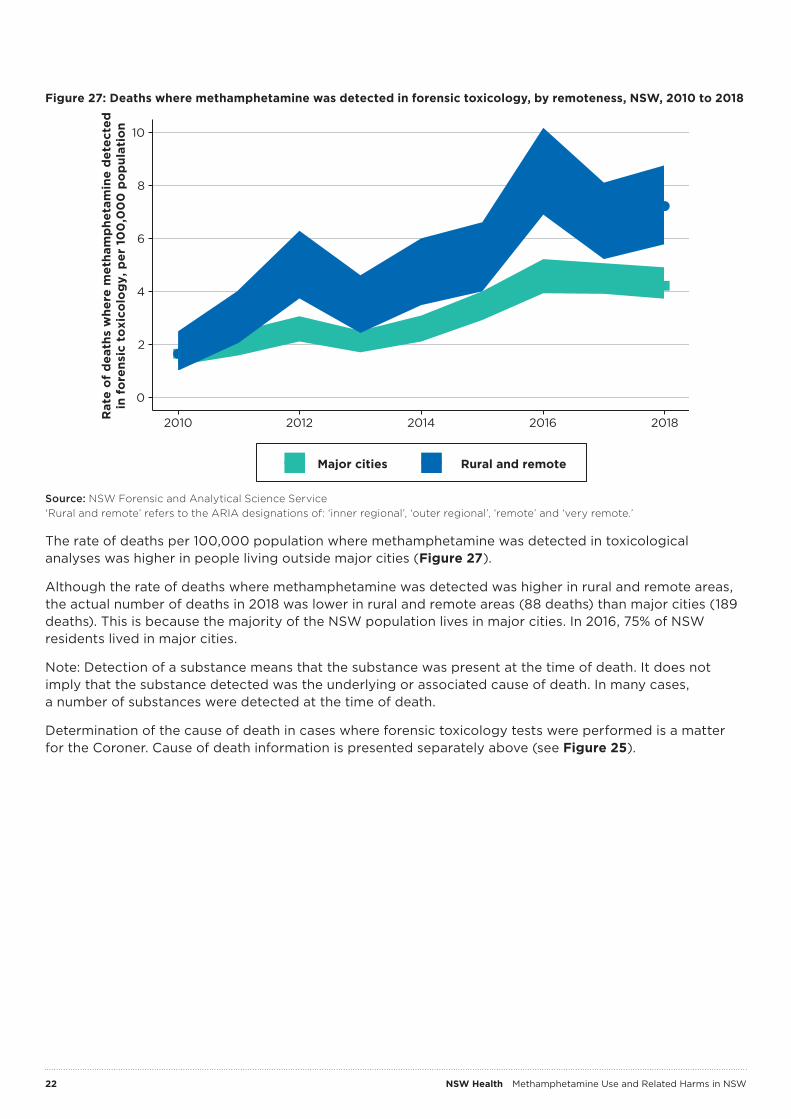
Figure 27: Deaths where methamphetamine was detected in forensic toxicology, by remoteness, NSW, 2010 to 2018
0
2
4
6
8
10
2010 2012 2014 2016 2018Rat
e o
f d
eath
s w
here
met
ham
phe
tam
ine
det
ecte
din
fo
rens
ic t
oxi
colo
gy,
per
10
0,0
00
po
pul
atio
n
Major cities Rural and remote
Source: NSW Forensic and Analytical Science Service ‘Rural and remote’ refers to the ARIA designations of: ‘inner regional’, ‘outer regional’, ‘remote’ and ‘very remote.’
The rate of deaths per 100,000 population where methamphetamine was detected in toxicological analyses was higher in people living outside major cities (Figure 27).
Although the rate of deaths where methamphetamine was detected was higher in rural and remote areas, the actual number of deaths in 2018 was lower in rural and remote areas (88 deaths) than major cities (189 deaths). This is because the majority of the NSW population lives in major cities. In 2016, 75% of NSW residents lived in major cities.
Note: Detection of a substance means that the substance was present at the time of death. It does not imply that the substance detected was the underlying or associated cause of death. In many cases, a number of substances were detected at the time of death.
Determination of the cause of death in cases where forensic toxicology tests were performed is a matter for the Coroner. Cause of death information is presented separately above (see Figure 25).

NSW Health Methamphetamine Use and Related Harms in NSW 23
2.5 Treatment episodes for methamphetamine use
Figure 28: Treatment episodes for all amphetamines provided by government services and by non-government services, NSW, 2012-13 to 2017-18
0
1
2
3
4
5
6
7
8
9
10
2012-13 2013-14 2014-15 2015-16 2016-17 2017-18
Num
ber
of
clo
sed
ser
vice
ep
iso
des
('0
00
)
Government funded Non-government organisation
Source: NSW Alcohol and Other Drugs Treatment Services Minimum Data Set
Treatment service episodes for amphetamines provided by NSW Local Health District (LHD) services have stabilised in 2017-18 after a peak in 2016-17 (Figure 28).
2.6 Methamphetamine-related calls to drug information services
Figure 29: Phone calls to NSW Alcohol and Drug Information Service, NSW, 2013 to 2018
0
1
2
3
4
5
6
2013 2014 2015 2016 2017 2018
Num
ber
of
calls
whe
re p
rim
ary
dru
g o
f co
ncer
n w
as e
licit
ed (
'00
0)
Alcohol Methamphetamine
Source: Alcohol and Drug Information Service, NSW Health. Includes calls to ADIS, OTL, STL, Cannabis Caution and DASAS
Calls to the NSW Alcohol and Drug Information Service regarding alcohol have remained relatively stable, while calls regarding methamphetamine peaked in 2015 and have stayed stable between 2017 and 2018. Alcohol remains the main drug of concern (Figure 29).

24 NSW Health Methamphetamine Use and Related Harms in NSW
Figure 30: Phone calls to the Poisons Information Centre from NSW callers, NSW, 2015 to 2018
0
20
40
60
80
100
120
140
2015 2016 2017 2018
Num
ber
of
calls
Methamphetamine Other amphetamines
Source: NSW Poisons Information Centre
Calls to the NSW Poisons Information Centre regarding methamphetamines have remained stable since 2015 (Figure 30).
NSW Health Methamphetamine Use and Related Harms in NSW 25
3. Social harms from methamphetamine use
3.1 Arrests relating to amphetamines
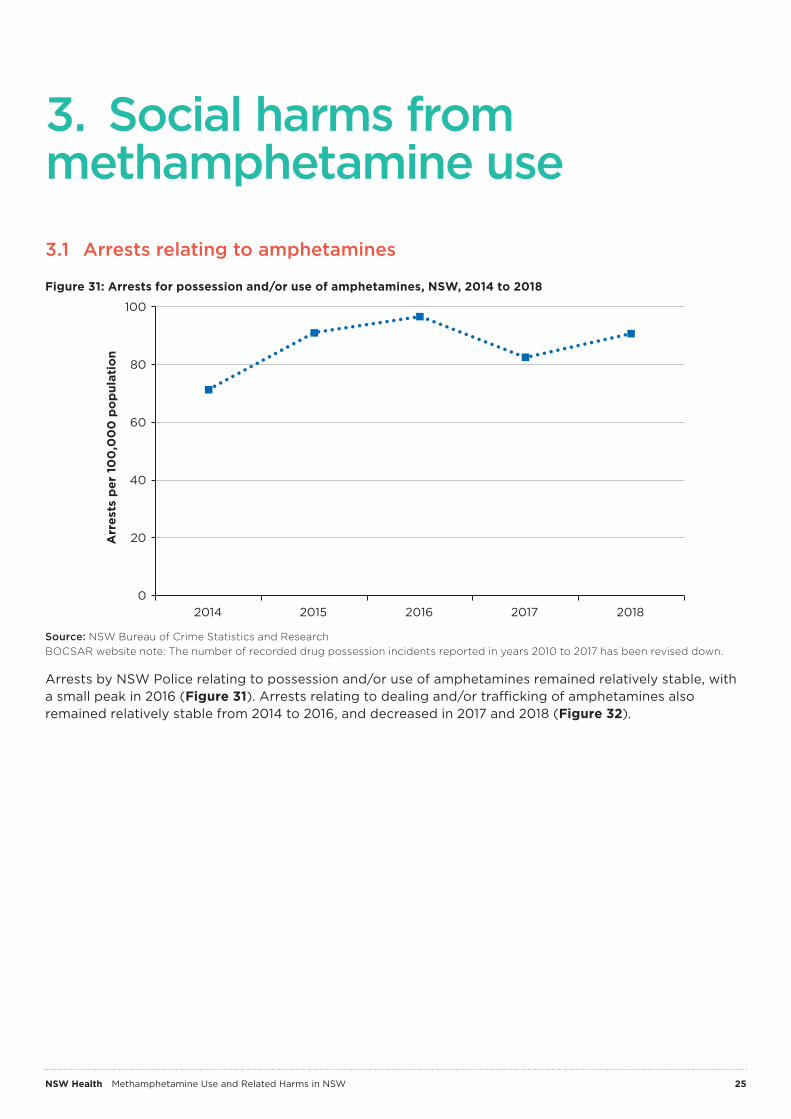
Figure 31: Arrests for possession and/or use of amphetamines, NSW, 2014 to 2018
0
20
40
60
80
100
2014 2015 2016 2017 2018
Arr
ests
per
10
0,0
00
po
pul
atio
n
Source: NSW Bureau of Crime Statistics and Research BOCSAR website note: The number of recorded drug possession incidents reported in years 2010 to 2017 has been revised down.
Arrests by NSW Police relating to possession and/or use of amphetamines remained relatively stable, with a small peak in 2016 (Figure 31). Arrests relating to dealing and/or trafficking of amphetamines also remained relatively stable from 2014 to 2016, and decreased in 2017 and 2018 (Figure 32).

26 NSW Health Methamphetamine Use and Related Harms in NSW
Figure 32: Arrests for dealing or trafficking amphetamines, NSW, 2014 to 2018
0
20
40
60
80
100
2014 2015 2016 2017 2018
Arr
ests
per
10
0,0
00
po
pul
atio
n
Source: NSW Bureau of Crime Statistics and Research BOCSAR website notes: The number of recorded drug possession incidents reported in years 2010 to 2017 has been revised down.
3.2 Drug driving incidents where methamphetamine was detected
Figure 33: Drug driving incidents where methamphetamine or MDMA were detected, NSW, 2014 to 2018
0
100
200
300
400
500
600
700
800
900
1000
2014 2015 2016 2017 2018
Num
ber
of
inci
den
ts w
here
dru
g d
etec
ted
Methamphetamine MDMA
Source: NSW Forensic and Analytical Science Service Note this data relates only to driving incidents where methamphetamine was subsequently detected in clinical samples. These data do not include roadside drug testing data
The number of drug driving incidents where methamphetamine was detected stabilised in 2017 and 2018 after a peak in 2015. The number of driving incidents where MDMA was detected was far below those where methamphetamine was detected throughout 2014-2018 (Figure 33).

NSW Health Methamphetamine Use and Related Harms in NSW 27
4. Limitations of the dataThis report draws on multiple sources of data in order to support a comprehensive, balanced and up-to-date understanding of the evidence around methamphetamine use and harms in NSW. Each source of data have a number of limitations. A brief overview of the limitations of the data used to inform this report is presented below.
Survey dataSurvey data usually provide the responses of individuals who voluntarily completed a survey. In most cases, a sample of the population was measured and then results weighted to make an estimation about the whole population. Sampling error can occur when the survey group does not accurately reflect the population. This can occur purely by chance, or can be a result of the design of the study.
For example, certain populations that may be more difficult to interview, such as people living in regional areas or homeless people, may be excluded from the survey. Certain groups of respondents may also choose not to participate, or provide inaccurate or incomplete responses. For example, people may be unwilling to report their use of illicit drugs. In these cases, bias may be introduced into the results of the study. However if the same survey methods are used over time, then trends in the results over time should be reliable.
Surveys that focus on specific population groups, such as people who inject drugs, may not be representative of the general population. However because of their targeted nature, these surveys may provide an opportunity to obtain much more comprehensive information from the population group of interest.
Routinely collected dataRoutinely collected data, or administrative data, contain information collected by services or organisations such as hospitals or police as part of their ongoing activities. While these data sources usually have good service or population coverage, they are often not designed for surveillance purposes. If a service does not ask or record specific information, it is not possible to routinely report on that information using this source. There can also be a bias toward those people who access a service frequently or easily, or where services or organisations have prioritised certain activities. There may be a significant delay in the availability of data due to administrative processes.
Routinely collected data are useful for examining harms at the state level and trends over time, however there may be challenges in identifying specific groups at higher risk. For example, detailed information is not routinely collected on gender identity or sexual preference in administrative hospital data which means that information cannot be reported for lesbian, gay, bisexual, transgender, intersex and queer (LGBTIQ) communities.
For specific details of the data used in this report, please refer to the original sources; or for NSW Health data presented, please refer to Appendix B.
28 NSW Health Methamphetamine Use and Related Harms in NSW
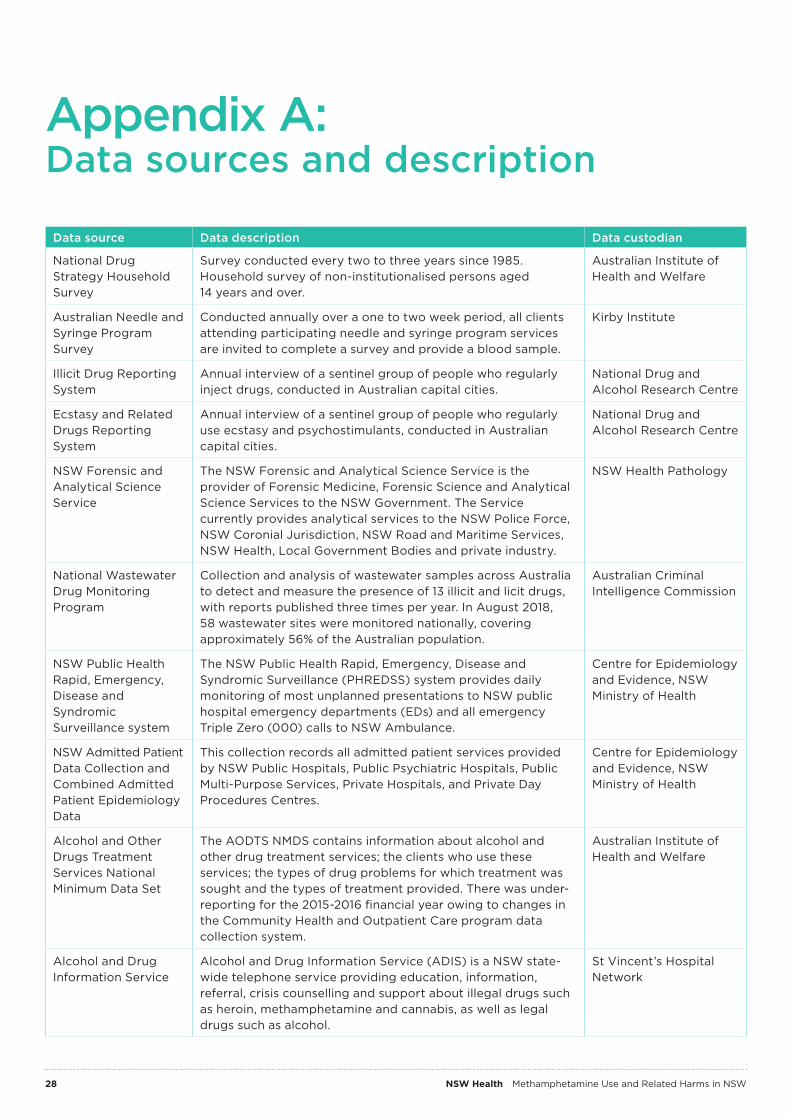
Appendix A: Data sources and description
Data source Data description Data custodian
National Drug Strategy Household Survey
Survey conducted every two to three years since 1985. Household survey of non-institutionalised persons aged 14 years and over.
Australian Institute of Health and Welfare
Australian Needle and Syringe Program Survey
Conducted annually over a one to two week period, all clients attending participating needle and syringe program services are invited to complete a survey and provide a blood sample.
Kirby Institute
Illicit Drug Reporting System
Annual interview of a sentinel group of people who regularly inject drugs, conducted in Australian capital cities.
National Drug and Alcohol Research Centre
Ecstasy and Related Drugs Reporting System
Annual interview of a sentinel group of people who regularly use ecstasy and psychostimulants, conducted in Australian capital cities.
National Drug and Alcohol Research Centre
NSW Forensic and Analytical Science Service
The NSW Forensic and Analytical Science Service is the provider of Forensic Medicine, Forensic Science and Analytical Science Services to the NSW Government. The Service currently provides analytical services to the NSW Police Force, NSW Coronial Jurisdiction, NSW Road and Maritime Services, NSW Health, Local Government Bodies and private industry.
NSW Health Pathology
National Wastewater Drug Monitoring Program
Collection and analysis of wastewater samples across Australia to detect and measure the presence of 13 illicit and licit drugs, with reports published three times per year. In August 2018, 58 wastewater sites were monitored nationally, covering approximately 56% of the Australian population.
Australian Criminal Intelligence Commission
NSW Public Health Rapid, Emergency, Disease and Syndromic Surveillance system
The NSW Public Health Rapid, Emergency, Disease and Syndromic Surveillance (PHREDSS) system provides daily monitoring of most unplanned presentations to NSW public hospital emergency departments (EDs) and all emergency Triple Zero (000) calls to NSW Ambulance.
Centre for Epidemiology and Evidence, NSW Ministry of Health
NSW Admitted Patient Data Collection and Combined Admitted Patient Epidemiology Data
This collection records all admitted patient services provided by NSW Public Hospitals, Public Psychiatric Hospitals, Public Multi-Purpose Services, Private Hospitals, and Private Day Procedures Centres.
Centre for Epidemiology and Evidence, NSW Ministry of Health
Alcohol and Other Drugs Treatment Services National Minimum Data Set
The AODTS NMDS contains information about alcohol and other drug treatment services; the clients who use these services; the types of drug problems for which treatment was sought and the types of treatment provided. There was under-reporting for the 2015-2016 financial year owing to changes in the Community Health and Outpatient Care program data collection system.
Australian Institute of Health and Welfare
Alcohol and Drug Information Service
Alcohol and Drug Information Service (ADIS) is a NSW state-wide telephone service providing education, information, referral, crisis counselling and support about illegal drugs such as heroin, methamphetamine and cannabis, as well as legal drugs such as alcohol.
St Vincent’s Hospital Network

NSW Health Methamphetamine Use and Related Harms in NSW 29
Data source Data description Data custodian
NSW Poisons Information Centre
Call centre service on a near full-time basis in NSW with shared after-hours service to the remainder of Australia. This results in approximately half of Australia’s poisons-related calls being received by NSW Poisons Information Centre (PIC). They reflect only the information provided when the public or healthcare professional reports an actual or potential exposure to a substance or request information. Exposures do not necessarily represent a case of poisoning or overdose. The data reflect harms and not use, and so trends may reflect other factors such as changes in purity of the drug or improved clinician management.
NSW Poisons Information Centre
Justice Health and Forensic Mental Health Network
Justice Health & Forensic Mental Health Network (JH&FMHN) triages all patients entering NSW Correctional Centres. The Reception Screening Assessment (RSA) was completed by a registered nurse or enrolled nurse on the Justice Health electronic Health System.
Justice Health and Forensic Network
Cause of death unit record file (NSW)
The cause of death was compiled and coded by the Australian Bureau of Statistics (ABS) based on data from the data custodians that was correct as at a point in time.
Centre for Epidemiology and Evidence, NSW Ministry of Health
NSW Bureau of Crime Statistics and Research
Contains information on all criminal incidents recorded by NSW Police since January 1995 onward by offence type. These data reflect policing priorities and activity, and not necessarily use in the community.
NSW Bureau of Crime Statistics and Research

30 NSW Health Methamphetamine Use and Related Harms in NSW
Appendix B: Case selection for NSW Health data
Hospitalisations
SourceNSW Combined Admitted Patient Epidemiology Data and ABS population estimates (SAPHaRI). Centre for Epidemiology and Evidence, NSW Ministry of Health.
Data extracted 17 May 2019, snapshot 20.
Case selection and analysis• Data were analysed:
– as age-standardised rates per 100,000 population– by age, sex, remoteness area, Aboriginal status, and private or public hospital– for total amphetamine-type stimulants (ATS), and for methamphetamine, MDMA, and other/
unspecified ATS
• Inclusion criteria: – episode end dates from 1 July 2010 to 30 June 2018– in persons aged 16 years and over– in NSW residents– where the primary or secondary diagnoses included the following poisoning or mental/behavioural
disorder International Statistical Classification of Diseases and Related Health Problems, Tenth Revision, Australian Modification (ICD-10-AM) codes:� all amphetamine-type stimulants: T43.6X or F15.XX� methylamphetamine: T43.61, F15.01, F15.11, F15.21, F15.31, F15.41, F15.51, F15.61, F15.71, F15.81 or
F15.91� methylamphetamine-related psychotic disorder: any of the above codes in any diagnosis, and
F15.51, F15.71 in any diagnosis� methylenedioxymethamphetamine (ecstasy/MDMA): T43.62, F15.02, F15.12, F15.22, F15.32,
F15.42, F15.52, F15.62, F15.72, F15.82 or F15.92� unspecified stimulants: T43.60, F15.00, F15.10, F15.20, F15.30, F15.40, F15.50, F15.60, F15.70,
F15.80 or F15.90� other unspecified stimulants (amphetamine, caffeine): T43.69, F15.09, F15.19, F15.29, F15.39,
F15.49, F15.59, F15.69, F15.79, F15.89 or F15.99– where episode of care was not related to acute hospital transfers or type changes (to avoid double
counting)– where episode of care was not coded as rehabilitation– where episode of care was not an admission to an emergency department (ED) only
• 95% confidence intervals for directly standardised rates are calculated using the Dobson method described by HealthStats and are illustrative of error (or “noise”) present in the data. These can be used as a measure of uncertainty and as an inexact measure of potential group differences (HealthStats NSW, 2015).

NSW Health Methamphetamine Use and Related Harms in NSW 31
• Analysis of remoteness areas uses the ABS Accessibility/Remoteness Index of Australia Plus (ARIA plus). This is an index value based on road distance to major service centres e.g. health, education, or retail. In the report, remoteness areas are classified as major cities; inner regional; and outer regional, remote and very remote areas combined. The term rural and remote is used when referring generally to areas outside major cities. For example:– Major cities includes: Sydney, Newcastle and Wollongong– Inner regional includes: Wagga Wagga, Goulburn, Nowra, Dubbo, Tamworth, Taree, Coffs Harbour
and Lismore– Outer regional includes: Bega, Griffith, Broken Hill, Parkes, Moree– Remote includes: Hay and Walgett– Very remote includes: Cobar and Bourke.
• A recent policy change (PD2017_015) resulted in patients treated solely within the emergency department being excluded from admitted patient records. A minority of patients managed in short stay areas of emergency departments were still included (HealthStats NSW, 2019).
Emergency department presentations
SourceNSW Public Health Rapid, Emergency, Disease and Syndromic Surveillance (PHREDSS), Centre for Epidemiology and Evidence, NSW Ministry of Health.
Data extracted 27 February 2019
Case selection and analysis• Data were analysed:
– as rates per 1,000 unplanned ED presentations – by age, and year
• Inclusion criteria:– unplanned ED presentations to 64 NSW hospitals– in persons aged 16 years and over– arriving from 1 July 2011 to 31 December 2018– assigned a provisional diagnosis within one of four PHREDDS alcohol and other drugs surveillance
syndromes (overdose/poisoning, alcohol problems, illicit drugs, mental health problems)– where the nursing assessment text, presenting problem or diagnosis description fields contained
the terms:� “ ice”, “meth” or “metham”
Unplanned presentations: Unplanned presentations include presentations that were not pre-arranged, with the majority classified as emergency presentations. Unplanned presentations are defined by the “ED visit type” field and includes the codes: 01 Emergency Presentation, 03 Unplanned Return Visit for continuing condition, 09 Person in transit, 10 Dead On Arrival, 11 Disaster, 13 Current Admitted Patient Presentation.
Notes• Methamphetamine ED presentations are restricted to drug, alcohol and mental health surveillance
syndromes to minimise the large number of false detections associated with the term ‘ice’, particularly across injuries.– The current selection criteria underestimates methamphetamine-related ED presentations by at
least 40%; however this method reduces the rate of false positives from 70% to 7% due to ‘ice’ being a commonly used term.
• The methamphetamine keyword search may undercount presentations of interest, however the purpose of surveillance is to identify trends over time rather than estimate burden.
• The analysis depends on both the identification and recording of relevant information during ED triage.

32 NSW Health Methamphetamine Use and Related Harms in NSW
• ED data only include one diagnosis code and coding of diagnoses are conducted by clinicians at the completion of the presentation, not clinical coders. Non-specific codes are used most frequently making the identification of drug types challenging.
• Presentations to the 64 EDs included in this report accounted for 84% of total NSW public ED activity in 2017-18.
• The number of PHREDSS reporting hospitals has increased over time, although coverage remains lower in rural locations. Coverage was higher in metropolitan Sydney areas (94%) compared with the rest of NSW (71%) and can be reported from January 2011. The PHREDSS system includes continuously updating data and improvements to the keyword search strategy may result in updates to previously reported numbers of methamphetamine-related ED presentations.
• ED data are captured at the presentation level (not unique persons).
• Even with the same number of hospitals, ED presentations increase over time due to increased service use and population growth.
Abbreviations• PHREDSS: Public Health Rapid, Emergency, Disease and Syndromic Surveillance • LHD: Local health district of hospital location• ED: Emergency department
Deaths (Cause of death unit record file)
SourceMortality estimates for years up to 2005 are based on Australian Bureau of Statistics death registration data. Data from 2006 onwards were provided by the Australian Coordinating Registry, Cause of Death Unit Record File; the data for the most two recent years are preliminary (SAPHaRI, Centre for Epidemiology and Evidence, NSW Ministry of Health).
Case selection and analysis• Rates were age-adjusted using the Australian standard population as at 30 June 2001.
• Counts of deaths for the latest year of data include an estimate of the number of deaths occurring in that year but registered in the next year.
• The data were derived from ICD-10 codes T43.6 (“Psychostimulants with abuse potential, excluding cocaine”) and F15.X (“Mental and behavioural disorders due to use of other stimulants, including caffeine, excluding cocaine”).
• A death was counted if the selected ICD-10 codes were found in the underlying or associated causes of death.
• 95% confidence intervals for directly standardised rates are calculated using the Dobson method described by HealthStats and are illustrative of error (or “noise”) present in the data. These can be used as an indication of uncertainty and as an inexact measure of potential group differences (HealthStats NSW, 2015).
• Only NSW residents are included.

NSW Health Methamphetamine Use and Related Harms in NSW 33
Deaths – Forensic toxicology, Forensic and Analytical Science Service
SourceForensic toxicology laboratory, Forensic and Analytical Science Service, NSW Health Pathology
Case selection and analysis• Dates are based on ‘approved date’ where the results of testing have completed internal approval.
Other analyses of these data may instead be based on the date of the post mortem examination.
• Geographic analysis uses the place of death postcode which is proportionately assigned to The Australian Statistical Geography Standard (ASGS) Remoteness Structure. Due to small numbers, four areas are grouped together: inner regional, outer regional; remote; and very remote.
• 95% confidence intervals for directly standardised rates are calculated using the Dobson method described by HealthStats and are illustrative of error (or “noise”) present in the data. These can be used as an indication of uncertainty and as an inexact measure of potential group differences (HealthStats NSW, 2015).
• The following substances names are captured to identify MDMA:– “3,4-Methylenedioxyamphetamine” – “3,4-Methylenedioxymethylamphet” – “3,4-Methylenedioxymethylamphetamine” – “MDMA”
• The following substances names are captured to identify methamphetamine:– “Methylamphetamine”– “Methylampheta”– “Methylamphetami”– “Methylamphetamin”– “Methylamphetamine”
• The following substances names are captured to identify opioids:– “6-Monoacetylmorphine”– “Acetylcodeine”– “Buprenorphine (free”) – “Buprenorphine (free)”– “Buprenorphine (total)”– “Codeine”– “Codeine (free)”– “Codeine (Total)”– “Codeine-6-glu”– “Codeine-6-glucoronide”– “Codeine-6-glucu”– “Codeine-6-glucur”– “Codeine-6-glucuron”– “Codeine-6-glucuronide”– “ Codeine-6-glucuronide”– “Dihydrocodeine”– “Fentanyl”– “Hydrocodone”– “Hydromorphone”
– “Methadone”– “Morphine”– “Morphine (Fre”– “Morphine (Free)”– “Morphine (Tot”– “Morphine (Total”– “Morphine (Total)”– “ Morphine (Total)”– “Morphine-3-gl”– “Morphine-3-gluc”– “Morphine-3-glucoro”– “Morphine-3-glucu”– “Morphine-3-glucuro”– “Morphine-3-glucuronide”– “Morphine-6 glucuro”– “Morphine-6-gl”– “Morphine-6-gluc”– “Morphine-6-glucoro”– “Morphine-6-glucoronide”– “Morphine-6-glucu”– “Morphine-6-glucuro”– “Morphine-6-glucuronide”– “Norbuprenorph”– “Norbuprenorphin”– “Norbuprenorphine”– “Norbuprenorphine (“ – “Norbuprenorphine (free)”– “Norbuprenorphine (total)”– “Oxycodone”– “Oxymorphone”– “Pethidine”– “Pholcodine”– “Propoxyphene”– “Tramadol”– “U-47700”

34 NSW Health Methamphetamine Use and Related Harms in NSW
Notes• Deaths from all internal FASS classifications are
included in this analysis and are not limited to ‘drug related’. Other classifications include but are not limited to: ‘drowning’ and ‘obscure’.
• All sample types available are included in this analysis and are not limited to: ‘blood post mortem’. Others include but are not limited to: ‘urine’ and ‘liver’, though data remains presented per person, rather than by test.
• ‘Opioids’ in this report refer to synthetic opioids and those naturally derived from opium (which may otherwise be known as ‘opiates’).
Purity and dose – Criminalistics, Forensic and Analytical Science Service
SourceCriminalistics, Forensic and Analytical Science Service, NSW Health Pathology
Case selection and analysis• Dates were based on ‘reported date’ where
the results of testing have completed internal approval.
• All records where sample purity was recorded were used. This represents 43% of methamphetamine and 38% of methamphetamine samples.
• The following substances names were captured to identify methamphetamine:– “Methylamphetamine”– “Methylamphtamine”
• The following substances names were captured to identify MDMA:– “34methylenedioxymethylamphetamine”– “34methylenedioymethylamphetamine”– “34methylendioxymethylamphetamine”
• The following keywords were used to identify sample forms from free text fields (descending hierarchy):– Tablet: tablet– Capsule: capsule– Crystal: crystalline– Powder: powder– Paste: paste, pasty, moist
Notes• Purity testing by FASS is currently only required
for commercial seizures and all drugs purchased during controlled (undercover) operations. In 2017 there were changes to the NSW Drug Misuse and Trafficking Regulation 2011 that have decreased the number of drug seizures tested at FASS.

NSW Health Methamphetamine Use and Related Harms in NSW 35
Appendix C: Reference list
AIHW, 2017 – Australian Institute of Health and Welfare 2017. National Drug Strategy Household Survey 2016: detailed findings. Drug Statistics series no. 31. Cat. no. PHE 214. Canberra: AIHW.
ANSPS, 2013-17 – Heard S., Iversen J., Geddes L., and Maher L. Australian Needle Syringe Program Survey. National Data Report 2013-2017: Prevalence of HIV, HCV and injecting and sexual behaviour among NSP attendees. Sydney: Kirby Institute, UNSW Sydney; 2018. ISSN: 1448-5915.
EDRS NSW, 2018 – Gibbs, D., & Peacock, A. (2018). New South Wales Drug Trends 2018: Key findings from the Ecstasy and Related Drugs Reporting System (EDRS) Interviews. Sydney, National Drug and Alcohol Research Centre, UNSW Australia.
HealthStats NSW, 2015 – Centre for Epidemiology and Evidence. HealthStats NSW Method Paper – Confidence Intervals. June 2015. Sydney: NSW Ministry of Health. Available at: http://www.healthstats.nsw.gov.au/Resources/Confidence_Intervals.pdf. Accessed 23 May 2019.
HealthStats NSW, 2019 – Centre for Epidemiology and Evidence. HealthStats NSW Method Paper – Reporting of hospitalisation-related indicators on HealthStats NSW Impact of changes to emergency department admissions. April 2019. Sydney: NSW Ministry of Health. Available at: http://www.healthstats.nsw.gov.au/Resources/ED-admissions.pdf Accessed 24 May 2019.
IDRS NSW, 2018 – Gibbs, D., & Peacock, A. (2018). New South Wales Drug Trends 2018: Key findings from the Illicit Drug Reporting System (IDRS) Interviews. Sydney, National Drug and Alcohol Research Centre, UNSW Australia.
SHPN (CPH) 190XXX