method 8260a volatile organic compounds by …legismex.mty.itesm.mx/secc_inter/sw-846/8260a.pdf ·...
TRANSCRIPT

CD-ROM 8260A - 1 Revision 1September 1994
METHOD 8260A
VOLATILE ORGANIC COMPOUNDS BY GAS CHROMATOGRAPHY/MASS SPECTROMETRY (GC/MS):CAPILLARY COLUMN TECHNIQUE
1.0 SCOPE AND APPLICATION
1.1 Method 8260 is used to determine volatile organic compounds in avariety of solid waste matrices. This method is applicable to nearly all typesof samples, regardless of water content, including ground water, aqueous sludges,caustic liquors, acid liquors, waste solvents, oily wastes, mousses, tars,fibrous wastes, polymeric emulsions, filter cakes, spent carbons, spentcatalysts, soils, and sediments. The following compounds can be determined bythis method:
_________________________________________________________________________________
Appropriate Technique Direct
Analyte CAS No. Purge-and-Trap Injectionb
Acetone 67-64-1 pp aAcetonitrile 75-05-8 pp aAcrolein (Propenal) 107-02-8 pp aAcrylonitrile 107-13-1 pp aAllyl alcohol 107-18-6 ht aAllyl chloride 107-05-1 a aBenzene 71-43-2 a aBenzyl chloride 100-44-7 a aBromoacetone 598-31-2 pp aBromochloromethane (I.S.) 74-97-5 a aBromodichloromethane 75-27-4 a a4-Bromofluorobenzene (surr.) 460-00-4 a aBromoform 75-25-2 a aBromomethane 74-83-9 a an-Butanol 71-36-3 ht a2-Butanone (MEK) 78-93-3 pp aCarbon disulfide 75-15-0 pp aCarbon tetrachloride 56-23-5 a aChloral hydrate 302-17-0 pp aChlorobenzene 108-90-7 a a2-Chloro-1,3-butadiene 126-99-8 a aChlorodibromomethane 124-48-1 a aChloroethane 75-00-3 a a2-Chloroethanol 107-03-3 pp abis-(2-chloroethyl) sulfide 505-60-2 pp a2-Chloroethyl vinyl ether 110-75-8 a aChloroform 67-66-3 a aChloromethane 74-87-3 a aChloroprene 126-99-8 a pc

CD-ROM 8260A - 2 Revision 1September 1994
________________________________________________________________________________
Appropriate Technique Direct
Analyte CAS No. Purge-and-Trap Injectionb
3-Chloropropene 107-05-1 a a3-Chloropropionitrile 542-76-7 i pc1,2-Dibromo-3-chloropropane 96-12-8 pp a1,2-Dibromoethane 106-93-4 a aDibromomethane 74-95-3 a a1,2-Dichlorobenzene 95-50-1 a a1,3-Dichlorobenzene 541-73-1 a a1,4-Dichlorobenzene 106-46-7 a acis-1,4-Dichloro-2-butene 1476-11-5 a atrans-1,4-Dichloro-2-butene 110-57-6 pp aDichlorodifluoromethane 75-71-8 a a1,1-Dichloroethane 75-34-3 a a1,2-Dichloroethane 107-06-2 a a1,1-Dichloroethene 75-35-4 a atrans-1,2-Dichloroethene 156-60-5 a a1,2-Dichloropropane 78-87-5 a a1,3-Dichloro-2-propanol 96-23-1 pp acis-1,3-Dichloropropene 10061-01-5 a atrans-1,3-Dichloropropene 10061-02-6 a a1,2,3,4-Diepoxybutane 1464-53-5 a aDiethyl ether 60-29-7 a a1,4-Difluorobenzene (I.S.) 540-36-3 a a1,4-Dioxane 123-91-1 pp aEpichlorohydrin 106-89-8 i aEthanol 64-17-5 i aEthyl acetate 141-78-6 i aEthylbenzene 100-41-4 a aEthylene oxide 75-21-8 pp aEthyl methacrylate 97-63-2 a aHexachlorobutadiene 87-68-3 a aHexachloroethane 67-72-1 i a2-Hexanone 591-78-6 pp a2-Hydroxypropionitrile 78-97-7 i pcIodomethane 74-88-4 a aIsobutyl alcohol 78-83-1 pp aIsopropylbenzene 98-82-8 a aMalononitrile 109-77-3 pp aMethacrylonitrile 126-98-7 pp aMethanol 67-56-1 i aMethylene chloride (DCM) 75-09-2 a aMethyl methacrylate 80-62-6 a a4-Methyl-2-pentanone (MIBK) 108-10-1 pp aNaphthalene 91-20-3 a aNitrobenzene 98-95-3 a a2-Nitropropane 79-46-9 a a

CD-ROM 8260A - 3 Revision 1September 1994
_________________________________________________________________________________
Appropriate Technique Direct
Analyte CAS No. Purge-and-Trap Injectionb
Pentachloroethane 76-01-7 i a2-Picoline 109-06-8 pp aPropargyl alcohol 107-19-7 pp a-Propiolactone 57-57-8 pp aPropionitrile (ethyl cyanide) 107-12-0 ht pcn-Propylamine 107-10-8 a aPyridine 110-86-1 i aStyrene 100-42-5 a a1,1,1,2-Tetrachloroethane 630-20-6 a a1,1,2,2-Tetrachloroethane 79-34-5 a aTetrachloroethene 127-18-4 a aToluene 108-88-3 a a1,2,4-Trichlorobenzene 120-82-1 a a1,1,1-Trichloroethane 71-55-6 a a1,1,2-Trichloroethane 79-00-5 a aTrichloroethene 79-01-6 a aTrichlorofluoromethane 75-69-4 a a1,2,3-Trichloropropane 96-18-4 a aVinyl acetate 108-05-4 a aVinyl chloride 75-01-4 a ao-Xylene 95-47-6 a am-Xylene 108-38-3 a ap-Xylene 106-42-3 a a________________________________________________________________________________
a Adequate response by this technique.b Chemical Abstract Services Registry Number.ht Method analyte only when purged at 80 Co
i Inappropriate technique for this analyte.pc Poor chromatographic behavior.pp Poor purging efficiency resulting in high EQLs.surr SurrogateI.S. Internal Standard
1.2 Method 8260 can be used to quantitate most volatile organic compoundsthat have boiling points below 200 C and that are insoluble or slightly solubleo
in water. Volatile water-soluble compounds can be included in this analyticaltechnique. However, for the more soluble compounds, quantitation limits areapproximately ten times higher because of poor purging efficiency. Suchcompounds include low-molecular-weight halogenated hydrocarbons, aromatics,ketones, nitriles, acetates, acrylates, ethers, and sulfides. See Tables 1 and2 for lists of analytes and retention times that have been evaluated on a purge-

CD-ROM 8260A - 4 Revision 1September 1994
and-trap GC/MS system. Also, the method detection limits for 25 mL samplevolumes are presented. The following analytes are also amenable to analysis byMethod 8260:
Bromobenzene 1-Chlorohexanen-Butylbenzene 2-Chlorotoluenesec-Butylbenzene 4-Chlorotoluenetert-Butylbenzene CrotonaldehydeChloroacetonitrile Dibromofluoromethane1-Chlorobutane cis-1,2-Dichloroethene1,3-Dichloropropane Methyl-t-butyl ether2,2-Dichloropropane Pentafluorobenzene1,1-Dichloropropene n-PropylbenzeneFluorobenzene 1,2,3-Trichlorobenzenep-Isopropyltoluene 1,2,4-TrimethylbenzeneMethyl acrylate 1,3,5-Trimethylbenzene
1.3 The estimated quantitation limit (EQL) of Method 8260 for anindividual compound is somewhat instrument dependent. Using standard quadrupoleinstrumentation, limits should be approximately 5 µg/kg (wet weight) forsoil/sediment samples, 0.5 mg/kg (wet weight) for wastes, and 5 µg/L for groundwater (see Table 3). Somewhat lower limits may be achieved using an ion trapmass spectrometer or other instrumentation of improved design. No matter whichinstrument is used, EQLs will be proportionately higher for sample extracts andsamples that require dilution or reduced sample size to avoid saturation of thedetector.
1.4 Method 8260 is based upon a purge-and-trap, gas chromatographic/massspectrometric (GC/MS) procedure. This method is restricted to use by, or underthe supervision of, analysts experienced in the use of purge-and-trap systems andgas chromatograph/mass spectrometers, and skilled in the interpretation of massspectra and their use as a quantitative tool.
1.5 An additional method for sample introduction is direct injection.This technique has been tested for the analysis of waste oil diluted withhexadecane 1:1 (vol/vol) and may have application for the analysis of somealcohols and aldehydes in aqueous samples.
2.0 SUMMARY OF METHOD
2.1 The volatile compounds are introduced into the gas chromatograph bythe purge-and-trap method or by direct injection (in limited applications).Purged sample components are trapped in a tube containing suitable sorbentmaterials. When purging is complete, the sorbent tube is heated and backflushedwith helium to desorb trapped sample components. The analytes are desorbeddirectly to a large bore capillary or cryofocussed on a capillary precolumnbefore being flash evaporated to a narrow bore capillary for analysis. Thecolumn is temperature programmed to separate the analytes which are then detectedwith a mass spectrometer (MS) interfaced to the gas chromatograph. Wide borecapillary columns require a jet separator, whereas narrow bore capillary columnscan be directly interfaced to the ion source.

CD-ROM 8260A - 5 Revision 1September 1994
2.2 If the above sample introduction techniques are not applicable, aportion of the sample is dispersed in solvent to dissolve the volatile organicconstituents. A portion of the solution is combined with organic-free reagentwater in the purge chamber. It is then analyzed by purge-and-trap GC/MSfollowing the normal water method.
2.3 Analytes eluted from the capillary column are introduced into themass spectrometer via a jet separator or a direct connection. Identification oftarget analytes is accomplished by comparing their mass spectra with the electronimpact (or electron impact-like) spectra of authentic standards. Quantitationis accomplished by comparing the response of a major (quantitation) ion relativeto an internal standard with a five-point calibration curve.
2.4 The method includes specific calibration and quality control stepsthat replace the general requirements in Method 8000.
3.0 INTERFERENCES
3.1 Major contaminant sources are volatile materials in the laboratoryand impurities in the inert purging gas and in the sorbent trap. The use of non-polytetrafluoroethylene (PTFE) thread sealants, plastic tubing, or flowcontrollers with rubber components should be avoided since such materials out-gasorganic compounds which will be concentrated in the trap during the purgeoperation. Analyses of calibration and reagent blanks provide information aboutthe presence of contaminants. When potential interfering peaks are noted inblanks, the analyst should change the purge gas source and regenerate themolecular sieve purge gas filter (Figure 1). Subtracting blank values fromsample results is not permitted. If reporting values not corrected for blanksresult in what the laboratory feels is a false positive for a sample, this shouldbe fully explained in text accompanying the uncorrected data.
3.2 Interfering contamination may occur when a sample containing lowconcentrations of volatile organic compounds is analyzed immediately after asample containing high concentrations of volatile organic compounds. Thepreventive technique is rinsing of the purging apparatus and sample syringes withtwo portions of organic-free reagent water between samples. After analysis ofa sample containing high concentrations of volatile organic compounds, one ormore calibration blanks should be analyzed to check for cross contamination. Forsamples containing large amounts of water soluble materials, suspended solids,high boiling compounds or high concentrations of compounds being determined, itmay be necessary to wash the purging device with a soap solution, rinse it withorganic-free reagent water, and then dry the purging device in an oven at 105 C.o
In extreme situations, the whole purge and trap device may require dismantlingand cleaning. Screening of the samples prior to purge and trap GC/MS analysisis highly recommended to prevent contamination of the system. This is especiallytrue for soil and waste samples. Screening may be accomplished with an automatedheadspace technique or by Method 3820 (Hexadecane Extraction and Screening ofPurgeable Organics).
3.2.1 The low purging efficiency of many analytes from a 25 mLsample often results in significant concentrations remaining in the samplepurge vessel after analysis. After removal of the analyzed sample aliquot

CD-ROM 8260A - 6 Revision 1September 1994
mm Modified Injector
and three rinses of the purge vessel with analyte free water, it isrequired that the empty vessel be subjected to a heated purge cycle priorto the analysis of another sample in the same purge vessel to reducesample to sample carryover.
3.3 Special precautions must be taken to analyze for methylene chloride.The analytical and sample storage area should be isolated from all atmosphericsources of methylene chloride. Otherwise random background levels will result.Since methylene chloride will permeate through PTFE tubing, all gaschromatography carrier gas lines and purge gas plumbing should be constructedfrom stainless steel or copper tubing. Laboratory clothing worn by the analystshould be clean since clothing previously exposed to methylene chloride fumesduring liquid/liquid extraction procedures can contribute to samplecontamination.
3.4 Samples can be contaminated by diffusion of volatile organics(particularly methylene chloride and fluorocarbons) through the septum seal intothe sample during shipment and storage. A trip blank prepared from organic-freereagent water and carried through the sampling and handling protocol can serveas a check on such contamination.
3.5 Use of sensitive mass spectrometers to achieve lower detection levelwill increase the potential to detect laboratory contaminants as interferences.
3.6 Direct injection - Some contamination may be eliminated by baking outthe column between analyses. Changing the injector liner will reduce thepotential for cross-contamination. A portion of the analytical column may needto be removed in the case of extreme contamination. Use of direct injection willresult in the need for more frequent instrument maintenance.
3.7 If hexadecane is added to samples or petroleum samples are analyzed,some chromatographic peaks will elute after the target analytes. The oventemperature program must include a post-analysis bake out period to ensure thatsemi-volatile hydrocarbons are volatilized.
4.0 APPARATUS AND MATERIALS
4.1 Purge-and-trap device - aqueous samples, described in Method 5030.
4.2 Purge-and-trap device - solid samples, described in Method 5030.
4.3 Injection port liners (HP catalogue #18740-80200, or equivalent) aremodified for direct injection analysisby placing a 1-cm plug of pyrex woolapproximately 50-60 mm down the lengthof the injection port towards theoven. An 0.53 mm ID column is mounted1 cm into the liner from the oven sideof the injection port, according tomanufacturer's specifications.

CD-ROM 8260A - 7 Revision 1September 1994
4.4 Gas chromatography/mass spectrometer/data system
4.4.1 Gas chromatograph - An analytical system complete with atemperature-programmable gas chromatograph suitable for splitlessinjection or interface to purge-and-trap apparatus. The system includesall required accessories, including syringes, analytical columns, andgases. The GC should be equipped with variable constant differential flowcontrollers so that the column flow rate will remain constant throughoutdesorption and temperature program operation. For some columnconfigurations, the column oven must be cooled to < 30 C, therefore, ao
subambient oven controller may be required. The capillary column shouldbe directly coupled to the source.
4.4.1.1 Capillary precolumn interface when using cryogeniccooling - This device interfaces the purge and trap concentrator tothe capillary gas chromatograph. The interface condenses thedesorbed sample components and focuses them into a narrow band on anuncoated fused silica capillary precolumn. When the interface isflash heated, the sample is transferred to the analytical capillarycolumn.
4.4.1.1.1 During the cryofocussing step, thetemperature of the fused silica in the interface is maintainedat -150 C under a stream of liquid nitrogen. After theo
desorption period, the interface must be capable of rapidheating to 250 C in 15 seconds or less to complete theo
transfer of analytes.
4.4.2 Gas chromatographic columns
4.4.2.1 Column 1 - 60 m x 0.75 mm ID capillary columncoated with VOCOL (Supelco), 1.5 µm film thickness, or equivalent.
4.4.2.2 Column 2 - 30 - 75 m x 0.53 mm ID capillary columncoated with DB-624 (J&W Scientific), Rt -502.2 (RESTEK), or VOCOLx
(Supelco), 3 µm film thickness, or equivalent.
4.4.2.3 Column 3 - 30 m x 0.25 - 0.32 mm ID capillarycolumn coated with 95% dimethyl - 5% diphenyl polysiloxane (DB-5,Rt -5, SPB-5, or equivalent), 1 µm film thickness. x
4.4.2.4 Column 4 - 60 m x 0.32 mm ID capillary columncoated with DB-624 (J&W Scientific), 1.8 µm film thickness, orequivalent.
4.4.3 Mass spectrometer - Capable of scanning from 35 to 300 amuevery 2 sec or less, using 70 volts (nominal) electron energy in theelectron impact ionization mode. The mass spectrometer must be capable ofproducing a mass spectrum for p-Bromofluorobenzene (BFB) which meets allof the criteria in Table 4 when 5-50 ng of the GC/MS tuning standard (BFB)is injected through the GC. To ensure sufficient precision of massspectral data, the desirable MS scan rate allows acquisition of at leastfive spectra while a sample component elutes from the GC.

CD-ROM 8260A - 8 Revision 1September 1994
4.4.3.1 The ion trap mass spectrometer may be used if itis capable of axial modulation to reduce ion-molecule reactions andcan produce electron impact-like spectra that match those in theEPA/NIST Library. In an ion trap mass spectrometer, because ion-molecule reactions with water and methanol may produce interferencesthat coelute with chloromethane and chloroethane, the base peak forboth of these analytes will be at m/z 49. This ion should be usedas the quantitation ion in this case. The mass spectrometer must becapable of producing a mass spectrum for BFB which meets all of thecriteria in Table 3 when 5 or 50 ng are introduced.
4.4.4 GC/MS interface - Two alternatives are used to interface theGC to the mass spectrometer.
4.4.4.1 Direct coupling by inserting the column into themass spectrometer is generally used for 0.25-0.32 mm id columns.
4.4.4.2 A separator including an all-glass transfer lineand glass enrichment device or split interface is used with an0.53 mm column.
4.4.4.3 Any enrichment device or transfer line can be usedif all of the performance specifications described in Sec. 8(including acceptable calibration at 50 ng or less) can be achieved.GC-to-MS interfaces constructed entirely of glass or of glass-linedmaterials are recommended. Glass can be deactivated by silanizingwith dichlorodimethylsilane.
4.4.5 Data system - A computer system that allows the continuousacquisition and storage on machine-readable media of all mass spectraobtained throughout the duration of the chromatographic program must beinterfaced to the mass spectrometer. The computer must have software thatallows searching any GC/MS data file for ions of a specified mass andplotting such ion abundances versus time or scan number. This type ofplot is defined as an Extracted Ion Current Profile (EICP). Software mustalso be available that allows integrating the abundances in any EICPbetween specified time or scan-number limits. The most recent version ofthe EPA/NIST Mass Spectral Library should also be available.
4.5 Microsyringes - 10, 25, 100, 250, 500, and 1,000 µL.
4.6 Syringe valve - Two-way, with Luer ends (three each), if applicableto the purging device.
4.7 Syringes - 5, 10, or 25 mL, gas-tight with shutoff valve.
4.8 Balance - Analytical, 0.0001 g, and top-loading, 0.1 g.
4.9 Glass scintillation vials - 20 mL, with Teflon lined screw-caps orglass culture tubes with Teflon lined screw-caps.
4.10 Vials - 2 mL, for GC autosampler.

CD-ROM 8260A - 9 Revision 1September 1994
4.11 Disposable pipets - Pasteur.
4.12 Volumetric flasks, Class A - 10 mL and 100 mL, with ground-glassstoppers.
4.13 Spatula - Stainless steel.
5.0 REAGENTS
5.1 Reagent grade inorganic chemicals shall be used in all tests. Unlessotherwise indicated, it is intended that all inorganic reagents shall conform tothe specifications of the Committee on Analytical Reagents of the AmericanChemical Society, where such specifications are available. Other grades may beused, provided it is first ascertained that the reagent is of sufficiently highpurity to permit its use without lessening the accuracy of the determination.
5.2 Organic-free reagent water - All references to water in this methodrefer to organic-free reagent water, as defined in Chapter One.
5.3 Methanol, CH OH - Pesticide quality or equivalent, demonstrated to3
be free of analytes. Store apart from other solvents.
5.4 Reagent Hexadecane - Reagent hexadecane is defined as hexadecane inwhich interference is not observed at the method detection limit of compounds ofinterest.
5.4.1 In order to demonstrate that all interfering volatiles havebeen removed from the hexadecane, a direct injection blank must beanalyzed.
5.5 Polyethylene glycol, H(OCH CH ) OH - Free of interferences at the2 2 n
detection limit of the target analytes.
5.6 Hydrochloric acid (1:1 v/v), HCl - Carefully add a measured volumeof concentrated HCl to an equal volume of organic-free reagent water.
5.7 Stock solutions - Stock solutions may be prepared from pure standardmaterials or purchased as certified solutions. Prepare stock standard solutionsin methanol, using assayed liquids or gases, as appropriate.
5.7.1 Place about 9.8 mL of methanol in a 10 mL tared ground-glass-stoppered volumetric flask. Allow the flask to stand, unstoppered, forabout 10 minutes or until all alcohol-wetted surfaces have dried. Weighthe flask to the nearest 0.0001 g.
5.7.2 Add the assayed reference material, as described below.
5.7.2.1 Liquids - Using a 100 µL syringe, immediately addtwo or more drops of assayed reference material to the flask; thenreweigh. The liquid must fall directly into the alcohol withoutcontacting the neck of the flask.

CD-ROM 8260A - 10 Revision 1September 1994
5.7.2.2 Gases - To prepare standards for any compoundsthat boil below 30 C (e.g. bromomethane, chloroethane, chloromethane,o
or vinyl chloride), fill a 5 mL valved gas-tight syringe with thereference standard to the 5.0 mL mark. Lower the needle to 5 mmabove the methanol meniscus. Slowly introduce the reference standardabove the surface of the liquid. The heavy gas will rapidly dissolvein the methanol. Standards may also be prepared by using a lecturebottle equipped with a Hamilton Lecture Bottle Septum (#86600).Attach Teflon tubing to the side arm relief valve and direct a gentlestream of gas into the methanol meniscus.
5.7.3 Reweigh, dilute to volume, stopper, and then mix by invertingthe flask several times. Calculate the concentration in milligrams perliter (mg/L) from the net gain in weight. When compound purity is assayedto be 96% or greater, the weight may be used without correction tocalculate the concentration of the stock standard. Commercially preparedstock standards may be used at any concentration if they are certified bythe manufacturer or by an independent source.
5.7.4 Transfer the stock standard solution into a bottle with aTeflon lined screw-cap. Store, with minimal headspace, at -10 C to -20 Co o
and protect from light.
5.7.5 Prepare fresh standards for gases weekly or sooner ifcomparison with check standards indicates a problem. Reactive compoundssuch as 2-chloroethyl vinyl ether and styrene may need to be prepared morefrequently. All other standards must be replaced after six months, orsooner if comparison with check standards indicates a problem. Both gasand liquid standards must be monitored closely by comparison to theinitial calibration curve and by comparison to QC check standards. It maybe necessary to replace the standards more frequently if either checkexceeds a 20% drift.
5.7.6 Optionally calibration using a certified gaseous mixture canbe accomplished daily utilizing commercially available gaseous analytemixture of bromomethane, chloromethane, chloroethane, vinyl chloride,dichlorodifluoromethane and trichlorofluoromethane in nitrogen. Thesemixtures of documented quality are stable for as long as six monthswithout refrigeration. (VOA-CYL III, RESTEK Corporation, Cat. #20194 orequivalent).
5.7.6.1 Preparation of Calibration Standards From a GasMixture
5.7.6.1.1 Before removing the cylinder shipping cap,be sure the valve is completely closed (turn clockwise). Thecontents are under pressure and should be used in a well-ventilated area.
5.7.6.1.2 Wrap the pipe thread end of the Luer fittingwith Teflon tape. Remove the shipping cap from the cylinderand replace it with the Luer fitting.

CD-ROM 8260A - 11 Revision 1September 1994
5.7.6.1.3 Transfer half the working standard containingother analytes, internal standards, and surrogates to thepurge apparatus.
5.7.6.1.4 Purge the Luer fitting and stem on the gascylinder prior to sample removal using the following sequence:
a) Connect either the 100 µL or 500 µL Luer syringeto the inlet fitting of the cylinder.
b) Make sure the on/off valve on the syringe is inthe open position.
c) Slowly open the valve on the cylinder andwithdraw a full syringe volume.
d) Be sure to close the valve on the cylinder beforeyou withdraw the syringe from the Luer fitting.
e) Expel the gas from the syringe into a well-ventilated area.
f) Repeat steps a through e one more time to fullypurge the fitting.
5.7.6.1.5 Once the fitting and stem have been purged,quickly withdraw the volume of gas you require using steps5.6.6.1.4(a) through (d). Be sure to close the valve on thecylinder and syringe before you withdraw the syringe from theLuer fitting.
5.7.6.1.6 Open the syringe on/off valve for 5 secondsto reduce the syringe pressure to atmospheric pressure. Thepressure in the cylinder is ~30 psi.
5.7.6.1.7 The gas mixture should be quickly transferredinto the reagent water through the female Luer fitting locatedabove the purging vessel.
NOTE: Make sure the arrow on the 4-way valve ispointing toward the female Luer fitting whentransferring the sample from the syringe. Be sureto switch the 4-way valve back to the closedposition before removing the syringe from theLuer fitting.
5.7.6.1.8 Transfer the remaining half of the workingstandard into the purging vessel. This procedure insures thatthe total volume of gas mix is flushed into the purgingvessel, with none remaining in the valve or lines.
5.7.6.1.9 Concentration of each compound in thecylinder is typically 0.0025 µg/µL.

CD-ROM 8260A - 12 Revision 1September 1994
5.7.6.1.10 The following are the recommended gas volumesspiked into 5 mL of water to produce a typical 5-pointcalibration:
Gas CalibrationVolume Concentration 40 µL 20 µg/L100 µL 50 µg/L200 µL 100 µg/L300 µL 150 µg/L400 µL 200 µg/L
5.7.6.1.11 The following are the recommended gas volumesspiked into 25 mL of water to produce a typical 5-pointcalibration:
Gas CalibrationVolume Concentration 10 µL 1 µg/L 20 µL 2 µg/L 50 µL 5 µg/L100 µL 10 µg/L250 µL 25 µg/L
5.8 Secondary dilution standards - Using stock standard solutions,prepare in methanol, secondary dilution standards containing the compounds ofinterest, either singly or mixed together. Secondary dilution standards must bestored with minimal headspace and should be checked frequently for signs ofdegradation or evaporation, especially just prior to preparing calibrationstandards from them. Store in a vial with no headspace for one week only.
5.9 Surrogate standards - The surrogates recommended are toluene-d ,84-bromofluorobenzene, 1,2-dichloroethane-d , and dibromofluoromethane. Other4
compounds may be used as surrogates, depending upon the analysis requirements.A stock surrogate solution in methanol should be prepared as described above, anda surrogate standard spiking solution should be prepared from the stock at aconcentration of 50-250 µg/10 mL in methanol. Each water sample undergoing GC/MSanalysis must be spiked with 10 µL of the surrogate spiking solution prior toanalysis.
5.9.1 If a more sensitive mass spectrometer is employed to achievelower detection levels, more dilute surrogate solutions may be required.
5.10 Internal standards - The recommended internal standards arefluorobenzene, chlorobenzene-d , and 1,4-dichlorobenzene-d . Other compounds may5 4
be used as internal standards as long as they have retention times similar to thecompounds being detected by GC/MS. Prepare internal standard stock and secondarydilution standards in methanol using the procedures described in Secs. 5.7 and5.8. It is recommended that the secondary dilution standard should be preparedat a concentration of 25 mg/L of each internal standard compound. Addition of10 µL of this standard to 5.0 mL of sample or calibration standard would be theequivalent of 50 µg/L.

CD-ROM 8260A - 13 Revision 1September 1994
5.10.1 If a more sensitive mass spectrometer is employed toachieve lower detection levels, more dilute internal standard solutionsmay be required. Area counts of the internal standard peaks should bebetween 50-200% of the area of the target analytes in the mid-pointcalibration analysis.
5.11 4-Bromofluorobenzene (BFB) standard - A standard solution containing25 ng/µL of BFB in methanol should be prepared.
5.11.1 If a more sensitive mass spectrometer is employed toachieve lower detection levels, a more dilute BFB standard solution may berequired.
5.12 Calibration standards - Calibration standards at a minimum of fiveconcentrations should be prepared from the secondary dilution of stock standards(see Secs. 5.7 and 5.8). Prepare these solutions in organic-free reagent water.One of the concentrations should be at a concentration near, but above, themethod detection limit. The remaining concentrations should correspond to theexpected range of concentrations found in real samples but should not exceed theworking range of the GC/MS system. Each standard should contain each analyte fordetection by this method. It is EPA's intent that all target analytes for aparticular analysis be included in the calibration standard(s). However, thesetarget analytes may not include the entire List of Analytes (Sec. 1.1) for whichthe method has been demonstrated. However, the laboratory shall not report aquantitative result for a target analyte that was not included in the calibrationstandard(s). Calibration standards must be prepared daily.
5.13 Matrix spiking standards - Matrix spiking standards should beprepared from volatile organic compounds which will be representative of thecompounds being investigated. At a minimum, the matrix spike should include 1,1-dichloroethene, trichloroethene, chlorobenzene, toluene, and benzene. It isdesirable to perform a matrix spike using compounds found in samples. Somepermits may require spiking specific compounds of interest, especially if theyare polar and would not be represented by the above listed compounds. Thestandard should be prepared in methanol, with each compound present at aconcentration of 250 µg/10.0 mL.
5.13.1 If a more sensitive mass spectrometer is employed toachieve lower detection levels, more dilute matrix spiking solutions maybe required.
5.14 Great care must be taken to maintain the integrity of all standardsolutions. It is recommended all standards in methanol be stored at -10 C too
-20 C in amber bottles with Teflon lined screw-caps.o
6.0 SAMPLE COLLECTION, PRESERVATION, AND HANDLING
6.1 See the introductory material to this chapter, Organic Analytes, Sec.4.1.

CD-ROM 8260A - 14 Revision 1September 1994
7.0 PROCEDURE
7.1 Three alternate methods are provided for sample introduction. Allinternal standards, surrogates, and matrix spikes (when applicable) must be addedto samples before introduction.
7.1.1 Direct injection - in very limited application, (e.g.,volatiles in waste oil or aqueous process wastes) direct injection ofaqueous samples or samples diluted according to Method 3585 may beappropriate. Direct injection has been used for the analysis of volatilesin waste oil (diluted 1:1 with hexadecane) and for determining if thesample is ignitable (aqueous injection, Methods 1010 or 1020). Directinjection is only permitted for the determination of volatiles at thetoxicity characteristic (TC) regulatory limits, at concentrations inexcess of 10,000 µg/L, or for water-soluble compounds that do not purge.
7.1.2 Purge-and-trap for aqueous samples, see Method 5030 fordetails.
7.1.3 Purge-and-trap for solid samples, see Method 5030 for details.
7.2 Recommended Chromatographic conditions
7.2.1 General:
Injector temperature: 200-225 C o
Transfer line temperature: 250-300 Co
7.2.2 Column 1 (A sample chromatogram is presented in Figure 5)
Carrier gas (He) flow rate: 15 mL/min Initial temperature: 10 C, hold for 5 minuteso
Temperature program: 6 C/min to 160 C o o
Final temperature: 160 C, hold until all expectedo
compounds have eluted.
7.2.3 Column 2, Cryogenic cooling (A sample chromatogram ispresented in Figure 6)
Carrier gas (He) flow rate: 15 mL/min Initial temperature: 10 C, hold for 5 minuteso
Temperature program: 6 C/min to 160 C o o
Final temperature: 160 C, hold until all expectedo
compounds have eluted.
7.2.4 Column 2, Non-cryogenic cooling (A sample chromatogram ispresented in Figure 7). It is recommended that carrier gas flow and splitand make-up gases be set using performance of standards as guidance. Setthe carrier gas head pressure to . l0 psi and the split to . 30 mL/min.Optimize the make-up gas flow for the separator (approximately 30 mL/min)by injecting BFB, and determining the optimum response when varying themake-up gas. This will require several injections of BFB. Next, makeseveral injections of the volatile working standard with all analytes of

CD-ROM 8260A - 15 Revision 1September 1994
interest. Adjust the carrier and split to provide optimum chromatographyand response. This is an especially critical adjustment for the volatilegas analytes. The head pressure should optimize between 8-12 psi and thesplit between 20-60 mL/min. The use of the splitter is important tominimize the effect of water on analyte response, to allow the use of alarger volume of helium during trap desorption, and to slow column flow.
Initial temperature: 45 C, hold for 2 minuteso
Temperature program: 8 C/min to 200 C o o
Final temperature: 200 C, hold for 6 minutes. o
A trap preheated to l50 C prior to trap desorption is required too
provide adequate chromatography of the gas analytes.
7.2.5 Column 3 (A sample chromatogram is presented in Figure 8)
Carrier gas (He) flow rate: 4 mL/min Initial temperature: 10 C, hold for 5 minuteso
Temperature program: 6 C/min to 70 C, then 15 C/mino o o
to 145 C o
Final temperature: 145 C, hold until all expectedo
compounds have eluted.
7.2.6 Direct injection - Column 2
Carrier gas (He) flow rate: 4 mL/min Column: J&W DB-624, 70m x 0.53 mmInitial temperature: 40 C, hold for 3 minuteso
Temperature program: 8 C/min o
Final temperature: 260 C, hold until all expectedo
compounds have eluted.Column Bake out (direct inj): 75 minutesInjector temperature: 200-225EC Transfer line temperature: 250-300EC
7.2.7 Direct Split Interface - Column 4
Carrier gas (He) flow rate: 1.5 mL/minInitial temperature: 35EC, hold for 2 minutesTemperature program: 4EC/min to 50EC
10EC/min to 220ECFinal temperature: 220EC, hold until all expected
compounds have elutedSplit ratio: 100:1Injector temperature: 125EC
7.3 Initial calibration - the recommended MS operating conditions
Mass range: 35-260 amuScan time: 0.6-2 sec/scanSource temperature: According to manufacturer's specifications

CD-ROM 8260A - 16 Revision 1September 1994
Ion trap only: Set axial modulation, manifold temperature,and emission current to manufacturer'srecommendations
7.3.1 Each GC/MS system must be hardware-tuned to meet the criteriain Table 4 for a 5-50 ng injection or purging of 4-bromofluorobenzene(2 µL injection of the BFB standard). Analyses must not begin until thesecriteria are met.
7.3.2 Set up the purge-and-trap system as outlined in Method 5030 ifpurge-and-trap analysis is to be utilized. A set of at least fivecalibration standards containing the method analytes is needed. Onecalibration standard should contain each analyte at a concentrationapproaching but greater than the method detection limit (Table 1) for thatcompound; the other calibration standards should contain analytes atconcentrations that define the range of the method. Calibration should bedone using the sample introduction technique that will be used forsamples. For Method 5030, the purging efficiency for 5 mL of water isgreater than for 25 mL. Therefore, develop the standard curve withwhichever volume of sample that will be analyzed.
7.3.2.1 To prepare a calibration standard for purge-and-trap or aqueous direct injection, add an appropriate volume of asecondary dilution standard solution to an aliquot of organic-freereagent water in a volumetric flask. Use a microsyringe and rapidlyinject the alcoholic standard into the expanded area of the filledvolumetric flask. Remove the needle as quickly as possible afterinjection. Mix by inverting the flask three times only. Discard thecontents contained in the neck of the flask. Aqueous standards arenot stable and should be prepared daily. Transfer 5.0 mL (or 25 mLif lower detection limits are required) of each standard to a gastight syringe along with 10 µL of internal standard. Then transferthe contents to a purging device or syringe. Perform purge-and-trapor direct injection as outlined in Method 5030.
7.3.2.2 To prepare a calibration standard for directinjection analysis of oil, dilute standards in hexadecane.
7.3.3 Tabulate the area response of the characteristic ions (seeTable 5) against concentration for each compound and each internalstandard. Calculate response factors (RF) for each compound relative toone of the internal standards. The internal standard selected for thecalculation of the RF for a compound should be the internal standard thathas a retention time closest to the compound being measured (Sec. 7.6.2).The RF is calculated as follows:

% RSD ' SD
RFX
x 100%
CD-ROM 8260A - 17 Revision 1September 1994
RF = (A C )/(A C )x is is x
where:
A = Area of the characteristic ion for the compound beingx
measured.A = Area of the characteristic ion for the specificis
internal standard.C = Concentration of the specific internal standard.is
C = Concentration of the compound being measured.x
7.3.4 The average RF must be calculated and recorded for eachcompound using the five RF values calculated for each compound from theinitial (5-point) calibration curve. A system performance check should bemade before this calibration curve is used. Five compounds (the SystemPerformance Check Compounds, or SPCCs) are checked for a minimum averagerelative response factor. These compounds are chloromethane; 1,1-dichloroethane; bromoform; 1,1,2,2-tetrachloroethane; and chlorobenzene.These compounds are used to check compound instability and to check fordegradation caused by contaminated lines or active sites in the system.Examples of these occurrences are:
7.3.4.1 Chloromethane - This compound is the most likelycompound to be lost if the purge flow is too fast.
7.3.4.2 Bromoform - This compound is one of the compoundsmost likely to be purged very poorly if the purge flow is too slow.Cold spots and/or active sites in the transfer lines may adverselyaffect response. Response of the quantitation ion (m/z 173) isdirectly affected by the tuning of BFB at ions m/z 174/176.Increasing the m/z 174/176 ratio relative to m/z 95 may improvebromoform response.
7.3.4.3 Tetrachloroethane and 1,1-dichloroethane - Thesecompounds are degraded by contaminated transfer lines in purge-and-trap systems and/or active sites in trapping materials.
7.3.5 Using the RFs from the initial calibration, calculate andrecord the percent relative standard deviation (%RSD) for all compounds.The percent RSD is calculated as follows:
where:
RSD = Relative standard deviation.RF = mean of 5 initial RFs for a compound.x
SD = standard deviation of the 5 initial RFs for a compound.
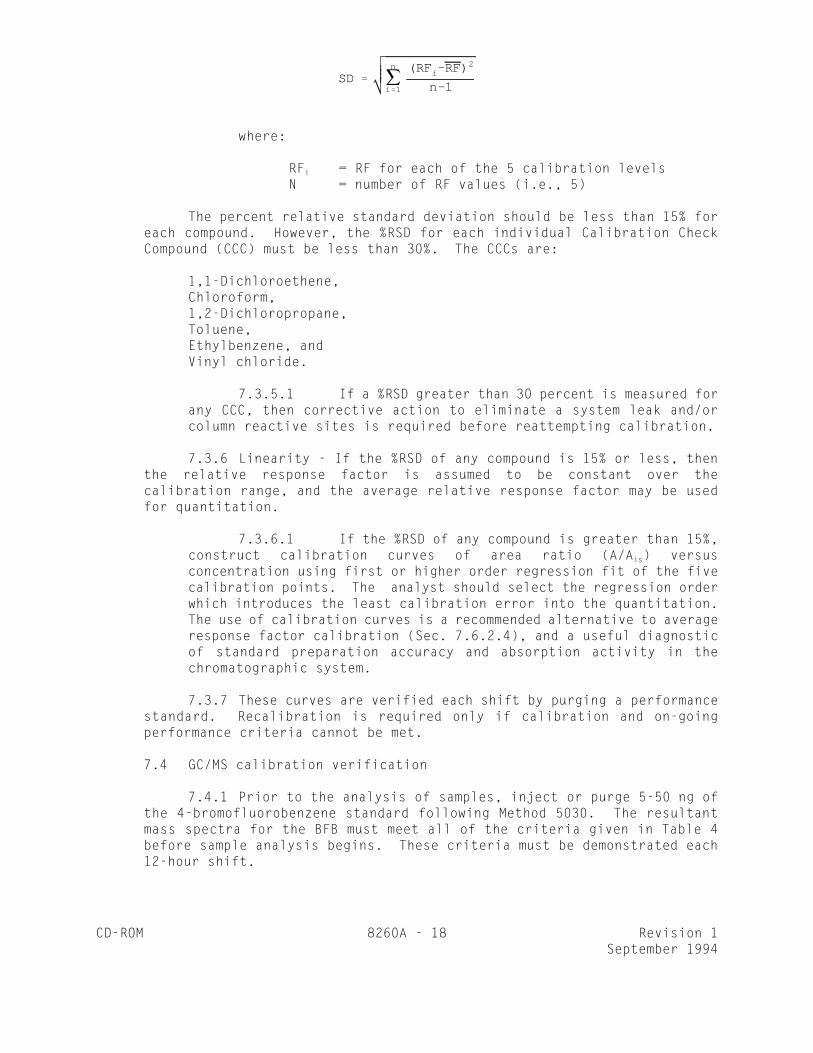
SD ' jn
i'1
(RFi&RF)2
n&1
CD-ROM 8260A - 18 Revision 1September 1994
where:
RF = RF for each of the 5 calibration levelsi
N = number of RF values (i.e., 5)
The percent relative standard deviation should be less than 15% foreach compound. However, the %RSD for each individual Calibration CheckCompound (CCC) must be less than 30%. The CCCs are:
1,1-Dichloroethene,Chloroform,1,2-Dichloropropane,Toluene,
Ethylbenzene, andVinyl chloride.
7.3.5.1 If a %RSD greater than 30 percent is measured forany CCC, then corrective action to eliminate a system leak and/orcolumn reactive sites is required before reattempting calibration.
7.3.6 Linearity - If the %RSD of any compound is 15% or less, thenthe relative response factor is assumed to be constant over thecalibration range, and the average relative response factor may be usedfor quantitation.
7.3.6.1 If the %RSD of any compound is greater than 15%,construct calibration curves of area ratio (A/A ) versusis
concentration using first or higher order regression fit of the fivecalibration points. The analyst should select the regression orderwhich introduces the least calibration error into the quantitation.The use of calibration curves is a recommended alternative to averageresponse factor calibration (Sec. 7.6.2.4), and a useful diagnosticof standard preparation accuracy and absorption activity in thechromatographic system.
7.3.7 These curves are verified each shift by purging a performancestandard. Recalibration is required only if calibration and on-goingperformance criteria cannot be met.
7.4 GC/MS calibration verification
7.4.1 Prior to the analysis of samples, inject or purge 5-50 ng ofthe 4-bromofluorobenzene standard following Method 5030. The resultantmass spectra for the BFB must meet all of the criteria given in Table 4before sample analysis begins. These criteria must be demonstrated each12-hour shift.

CD-ROM 8260A - 19 Revision 1September 1994
7.4.2 The initial calibration curve (Sec. 7.3) for each compound ofinterest must be checked and verified once every 12 hours during analysiswith the introduction technique used for samples. This is accomplished byanalyzing a calibration standard that is at a concentration near themidpoint concentration for the working range of the GC/MS by checking theSPCC and CCC.
7.4.3 System Performance Check Compounds (SPCCs) - A systemperformance check must be made each 12 hours. If the SPCC criteria aremet, a comparison of relative response factors is made for all compounds.This is the same check that is applied during the initial calibration. Ifthe minimum relative response factors are not met, the system must beevaluated, and corrective action must be taken before sample analysisbegins. Some possible problems are standard mixture degradation,injection port inlet contamination, contamination at the front end of theanalytical column, and active sites in the column or chromatographicsystem.
7.4.3.1 The minimum relative response factor for volatileSPCCs are as follows:
Chloromethane 0.101,1-Dichloroethane 0.10Bromoform >0.10Chlorobenzene 0.301,1,2,2-Tetrachloroethane 0.30
7.4.4 Calibration Check Compounds (CCCs) - After the systemperformance check is met, CCCs listed in Sec. 7.3.5 are used to check thevalidity of the initial calibration.
Calculate the percent drift using the following equation:
% Drift = (C - C )/C x 100I C I
where:
C = Calibration Check Compound standard concentration.I
C = Measured concentration using selected quantitation method.c
If the percent drift for each CCC is less than 20%, the initialcalibration is assumed to be valid. If the criterion is not met (> 20%drift), for any one CCC, corrective action must be taken. Problemssimilar to those listed under SPCCs could affect this criterion. If nosource of the problem can be determined after corrective action has beentaken, a new five point calibration MUST be generated. This criterionMUST be met before quantitative sample analysis begins. If the CCCs arenot required analytes by the permit, then all required analytes must meetthe 20% drift criterion.
7.4.5 The internal standard responses and retention times in thecheck calibration standard must be evaluated immediately after or duringdata acquisition. If the retention time for any internal standard changes

CD-ROM 8260A - 20 Revision 1September 1994
by more than 30 seconds from the last calibration check (12 hours), thechromatographic system must be inspected for malfunctions and correctionsmust be made, as required. If the EICP area for any of the internalstandards changes by a factor of two (-50% to +l00%) from the last dailycalibration check standard, the mass spectrometer must be inspected formalfunctions and corrections must be made, as appropriate. Whencorrections are made, reanalysis of samples analyzed while the system wasmalfunctioning is necessary.
7.5 GC/MS analysis
7.5.1 It is highly recommended that the extract be screened on aheadspace-GC/FID (Methods 3810/8015), headspace-GC/PID/ELCD (Methods3810/8021), or waste dilution-GC/PID/ELCD (Methods 3585/8021) using thesame type of capillary column. This will minimize contamination of theGC/MS system from unexpectedly high concentrations of organic compounds.Use of screening is particularly important when this method is used toachieve low detection levels.
7.5.2 All samples and standard solutions must be allowed to warm toambient temperature before analysis. Set up the purge-and-trap system asoutlined in Method 5030 if purge-and-trap introduction will be used.
7.5.3 BFB tuning criteria and GC/MS calibration verificationcriteria must be met before analyzing samples.
7.5.3.1 Remove the plunger from a 5 mL syringe and attacha closed syringe valve. If lower detection limits are required, usea 25 mL syringe. Open the sample or standard bottle, which has beenallowed to come to ambient temperature, and carefully pour the sampleinto the syringe barrel to just short of overflowing. Replace thesyringe plunger and compress the sample. Open the syringe valve andvent any residual air while adjusting the sample volume to 5.0 mL.
7.5.4 The process of taking an aliquot destroys the validity ofaqueous and soil samples for future analysis; therefore, if there is onlyone VOA vial, the analyst should prepare a second aliquot for analysis atthis time to protect against possible loss of sample integrity. Thissecond sample is maintained only until such time when the analyst hasdetermined that the first sample has been analyzed properly. For aqueoussamples, filling one 20 mL syringe would require the use of only onesyringe. If a second analysis is needed from a syringe, it must beanalyzed within 24 hours. Care must be taken to prevent air from leakinginto the syringe.
7.5.4.1 The following procedure is appropriate fordiluting aqueous purgeable samples. All steps must be performedwithout delays until the diluted sample is in a gas-tight syringe.
7.5.4.1.1 Dilutions may be made in volumetric flasks(10 to 100 mL). Select the volumetric flask that will allowfor the necessary dilution. Intermediate dilutions may benecessary for extremely large dilutions.

CD-ROM 8260A - 21 Revision 1September 1994
7.5.4.1.2 Calculate the approximate volume of organic-free reagent water to be added to the volumetric flaskselected and add slightly less than this quantity of organic-free reagent water to the flask.
7.5.4.1.3 Inject the proper aliquot of sample from thesyringe into the flask. Aliquots of less than 1 mL are notrecommended. Dilute the sample to the mark with organic-freereagent water. Cap the flask, invert, and shake three times.Repeat above procedure for additional dilutions.
7.5.4.1.4 Fill a 5 mL syringe with the diluted sample.
7.5.4.2 Compositing aqueous samples prior to GC/MSanalysis
7.5.4.2.1 Add 5 mL or equal larger amounts of eachsample (up to 5 samples are allowed) to a 25 mL glass syringe.Special precautions must be made to maintain zero headspace inthe syringe.
7.5.4.2.2 The samples must be cooled at 4 C during thiso
step to minimize volatilization losses.
7.5.4.2.3 Mix well and draw out a 5 mL aliquot foranalysis.
7.5.4.2.4 Follow sample introduction, purging, anddesorption steps described in Method 5030.
7.5.4.2.5 If less than five samples are used forcompositing, a proportionately smaller syringe may be usedunless a 25 mL sample is to be purged.
7.5.5 Add 10.0 µL of surrogate spiking solution and 10 µL ofinternal standard spiking solution to each sample. The surrogate andinternal standards may be mixed and added as a single spiking solution.The addition of 10 µL of the surrogate spiking solution to 5 mL of sampleis equivalent to a concentration of 50 µg/L of each surrogate standard.The addition of 10 µL of the surrogate spiking solution to 5 g of sampleis equivalent to a concentration of 50 µg/kg of each surrogate standard.
7.5.5.1 If a more sensitive mass spectrometer is employedto achieve lower detection levels, more dilute surrogate and internalstandard solutions may be required.
7.5.6 Perform purge-and-trap or direct injection by Method 5030. Ifthe initial analysis of sample or a dilution of the sample has aconcentration of analytes that exceeds the initial calibration range, thesample must be reanalyzed at a higher dilution. Secondary ionquantitation is allowed only when there are sample interferences with theprimary ion. When a sample is analyzed that has saturated ions from acompound, this analysis must be followed by a blank organic-free reagent

CD-ROM 8260A - 22 Revision 1September 1994
water analysis. If the blank analysis is not free of interferences, thesystem must be decontaminated. Sample analysis may not resume until theblank analysis is demonstrated to be free of interferences.
7.5.6.1. All dilutions should keep the response of themajor constituents (previously saturated peaks) in the upper half ofthe linear range of the curve. Proceed to Secs. 7.6.1 and 7.6.2 forqualitative and quantitative analysis.
7.5.7 For matrix spike analysis, add 10 µL of the matrix spikesolution (Sec. 5.13) to the 5 mL of sample to be purged. Disregarding anydilutions, this is equivalent to a concentration of 50 µg/L of each matrixspike standard.
7.6 Data interpretation
7.6.1 Qualitative analysis
7.6.1.1 The qualitative identification of compoundsdetermined by this method is based on retention time, and oncomparison of the sample mass spectrum, after background correction,with characteristic ions in a reference mass spectrum. The referencemass spectrum must be generated by the laboratory using theconditions of this method. The characteristic ions from thereference mass spectrum are defined to be the three ions of greatestrelative intensity, or any ions over 30% relative intensity if lessthan three such ions occur in the reference spectrum. Compoundsshould be identified as present when the criteria below are met.
7.6.1.1.1 The intensities of the characteristic ionsof a compound maximize in the same scan or within one scan ofeach other. Selection of a peak by a data system targetcompound search routine where the search is based on thepresence of a target chromatographic peak containing ionsspecific for the target compound at a compound-specificretention time will be accepted as meeting this criterion.
7.6.1.1.2 The RRT of the sample component is within± 0.06 RRT units of the RRT of the standard component.
7.6.1.1.3 The relative intensities of the
characteristic ions agree within 30% of the relativeintensities of these ions in the reference spectrum.(Example: For an ion with an abundance of 50% in thereference spectrum, the corresponding abundance in a samplespectrum can range between 20% and 80%.)
7.6.1.1.4 Structural isomers that produce very similarmass spectra should be identified as individual isomers ifthey have sufficiently different GC retention times.Sufficient GC resolution is achieved if the height of thevalley between two isomer peaks is less than 25% of the sum of

CD-ROM 8260A - 23 Revision 1September 1994
the two peak heights. Otherwise, structural isomers areidentified as isomeric pairs.
7.6.1.1.5 Identification is hampered when samplecomponents are not resolved chromatographically and producemass spectra containing ions contributed by more than oneanalyte. When gas chromatographic peaks obviously representmore than one sample component (i.e., a broadened peak withshoulder(s) or a valley between two or more maxima),appropriate selection of analyte spectra and backgroundspectra is important. Examination of extracted ion currentprofiles of appropriate ions can aid in the selection ofspectra, and in qualitative identification of compounds. Whenanalytes coelute (i.e., only one chromatographic peak isapparent), the identification criteria can be met, but eachanalyte spectrum will contain extraneous ions contributed bythe coeluting compound.
7.6.1.2 For samples containing components not associatedwith the calibration standards, a library search may be made for thepurpose of tentative identification. The necessity to perform thistype of identification will be determined by the type of analysesbeing conducted. Guidelines for making tentative identification are:
(1) Relative intensities of major ions in the referencespectrum (ions > 10% of the most abundant ion) shouldbe present in the sample spectrum.
(2) The relative intensities of the major ions should agreewithin + 20%. (Example: For an ion with an abundanceof 50% in the standard spectrum, the correspondingsample ion abundance must be between 30 and 70%).
(3) Molecular ions present in the reference spectrum shouldbe present in the sample spectrum.
(4) Ions present in the sample spectrum but not in thereference spectrum should be reviewed for possiblebackground contamination or presence of coelutingcompounds.
(5) Ions present in the reference spectrum but not in thesample spectrum should be reviewed for possiblesubtraction from the sample spectrum because ofbackground contamination or coeluting peaks. Datasystem library reduction programs can sometimes createthese discrepancies.
Computer generated library search routines should not usenormalization routines that would misrepresent the library or unknownspectra when compared to each other. Only after visual comparisonof sample with the nearest library searches will the mass spectralinterpretation specialist assign a tentative identification.

CD-ROM 8260A - 24 Revision 1September 1994
7.6.2 Quantitative analysis
7.6.2.1 When a compound has been identified, thequantitation of that compound will be based on the integratedabundance from the EICP of the primary characteristic ion.Quantitation will take place using the internal standard technique.The internal standard used shall be the one nearest the retentiontime of that of a given analyte.
7.6.2.2 When MS response is linear and passes through theorigin, calculate the concentration of each identified analyte in thesample as follows:
Water
(A )(I )x s
concentration (µg/L) = (A )( RF)(V )is o
__
where:
A = Area of characteristic ion for compound beingx
measured.I = Amount of internal standard injected (ng).s
A = Area of characteristic ion for the internalis
standard.RF = Mean relative response factor for compound being__
measured.V = Volume of water purged (mL), taking intoo
consideration any dilutions made.
Sediment/Soil Sludge (on a dry-weight basis) and Waste(normally on a wet-weight basis)
(A )(I )(V )x s t
concentration (µg/kg) = (A )( RF)(V )(W )(D)is i s
__
where:
A , I , A , RF, = Same as for water.x s is
__
V = Volume of total extract (µL) (use 10,000 µL or at
factor of this when dilutions are made).V = Volume of extract added (µL) for purging. i
W = Weight of sample extracted or purged (g). s
D = % dry weight of sample/100, or 1 for a wet-weightbasis.
7.6.2.3 Where applicable, an estimate of concentration fornoncalibrated components in the sample should be made. The formulaegiven above should be used with the following modifications: Theareas A and A should be from the total ion chromatograms, and thex is

CD-ROM 8260A - 25 Revision 1September 1994
RF for the compound should be assumed to be 1. The concentrationobtained should be reported indicating (1) that the value is anestimate and (2) which internal standard was used to determineconcentration. Use the nearest internal standard free ofinterferences.
7.6.2.4 Alternatively, the regression line fitted to theinitial calibration (Sec. 7.3.6.1) may be used for determination ofanalyte concentration.
8.0 QUALITY CONTROL
8.1 Refer to Chapter One and Method 8000 for general quality controlprocedures.
8.2 Additional required instrument QC is found in the Secs. 7.3 and 7.4:
8.2.1 The GC/MS system must be tuned to meet the BFB specifications.
8.2.2 There must be an initial calibration of the GC/MS system
8.2.3 The GC/MS system must meet the SPCC criteria and the CCCcriteria, each 12 hours.
8.3 To establish the ability to generate acceptable accuracy andprecision, the analyst must perform the following operations.
8.3.1 A quality control (QC) reference sample concentrate isrequired containing each analyte at a concentration of 10 mg/L or less inmethanol. The QC reference sample concentrate may be prepared from purestandard materials or purchased as certified solutions. If prepared bythe laboratory, the QC reference sample concentrate must be made usingstock standards prepared independently from those used for calibration.
8.3.2 Prepare a QC reference sample to contain 20 µg/L or less ofeach analyte by adding 200 µL of QC reference sample concentrate to 100 mLof organic-free reagent water.
8.3.3 Four 5-mL aliquots of the well mixed QC reference sample areanalyzed according to the method beginning in Sec. 7.5.1.
8.3.4 Calculate the average recovery (x) in µg/L, and the standard_
deviation of the recovery (s) in µg/L, for each analyte using the fourresults.
8.3.5 Tables 7 and 8 provide single laboratory recovery andprecision data obtained for the method analytes from water. Similarresults from dosed water should be expected by any experienced laboratory.Compare s and x (Sec. 8.3.4) for each analyte to the single laboratory
_
recovery and precision data. Results are comparable if the calculatedstandard deviation of the recovery does not exceed 2.6 times the single

CD-ROM 8260A - 26 Revision 1September 1994
laboratory RSD or 20%, whichever is greater, and the mean recovery lieswithin the interval x ± 3s or x ± 30%, whichever is greater.
_ _
NOTE: The large number of analytes in Tables 7 and 8 present asubstantial probability that one or more will fail at leastone of the acceptance criteria when all analytes of a givenmethod are determined.
8.3.6 When one or more of the analytes tested are not comparable tothe data in Table 6 or 7, the analyst must proceed according to Sec.8.3.6.1 or 8.3.6.2.
8.3.6.1 Locate and correct the source of the problem andrepeat the test for all analytes beginning with Sec. 8.3.2.
8.3.6.2 Beginning with Sec. 8.3.2, repeat the test onlyfor those analytes that are not comparable. Repeated failure,however, will confirm a general problem with the measurement system.If this occurs, locate and correct the source of the problem andrepeat the test for all compounds of interest beginning with Sec.8.3.2.
8.4 For aqueous and soil matrices, laboratory established surrogatecontrol limits should be compared with the control limits listed in Table 8.
8.4.1 If recovery is not within limits, the following procedures arerequired.
8.4.1.1 Check to be sure that there are no errors in thecalculations, surrogate solutions or internal standards. If errorsare found, recalculate the data accordingly.
8.4.1.2 Check instrument performance. If an instrumentperformance problem is identified, correct the problem and re-analyzethe extract.
8.4.1.3 If no problem is found, re-extract and re-analyzethe sample.
8.4.1.4 If, upon re-analysis, the recovery is again notwithin limits, flag the data as "estimated concentration".
8.4.2 At a minimum, each laboratory should update surrogate recoverylimits on a matrix-by-matrix basis, annually.
9.0 METHOD PERFORMANCE

CD-ROM 8260A - 27 Revision 1September 1994
9.1 The method detection limit (MDL) is defined as the minimumconcentration of a substance that can be measured and reported with 99%confidence that the value is above zero. The MDL actually achieved in a givenanalysis will vary depending on instrument sensitivity and matrix effects.
9.2 This method has been tested in a single laboratory using spikedwater. Using a wide-bore capillary column, water was spiked at concentrationsbetween 0.5 and 10 µg/L. Single laboratory accuracy and precision data arepresented for the method analytes in Table 6. Calculated MDLs are presented inTable 1.
9.3 The method was tested using water spiked at 0.1 to 0.5 µg/L andanalyzed on a cryofocussed narrow-bore column. The accuracy and precision datafor these compounds are presented in Table 7. MDL values were also calculatedfrom these data and are presented in Table 2.
9.4 Direct injection has been used for the analysis of waste motor oilsamples using a wide-bore column. The accuracy and precision data for thesecompounds are presented in Table 10.
10.0 REFERENCES
1. Methods for the Determination of Organic Compounds in Finished DrinkingWater and Raw Source Water Method 524.2; U.S. Environmental ProtectionAgency. Office of Research Development, Environmental Monitoring andSupport Laboratory, Cincinnati, OH 1986.
2. U.S. EPA Contract Laboratory Program, Statement of Work for OrganicAnalysis, July 1985, Revision.
3. Bellar, T.A.; J.J. Lichtenberg. J. Amer. Water Works Assoc. 1974, 66(12),739-744.
4. Bellar, T.A.; J.J. Lichtenberg. "Semi-Automated Headspace Analysis ofDrinking Waters and Industrial Waters for Purgeable Volatile OrganicCompounds"; in Van Hall, Ed.; Measurement of Organic Pollutants in Waterand Wastewater, ASTM STP 686, pp 108-129, 1979.
5. Budde, W.L.; J.W. Eichelberger. "Performance Tests for the Evaluation ofComputerized Gas Chromatography/Mass Spectrometry Equipment andLaboratories"; U.S. Environmental Protection Agency. EnvironmentalMonitoring and Support Laboratory, Cincinnati, OH 45268, April 1980; EPA-600/4-79-020.
6. Eichelberger, J.W.; L.E. Harris; W.L. Budde. "Reference Compound toCalibrate Ion Abundance Measurement in Gas Chromatography-MassSpectrometry Systems"; Analytical Chemistry 1975, 47, 995-1000.
7. Olynyk, P.; W.L. Budde; J.W. Eichelberger. "Method Detection Limit forMethods 624 and 625"; Unpublished report, October 1980.

CD-ROM 8260A - 28 Revision 1September 1994
8. Non Cryogenic Temperatures Program and Chromatogram, PrivateCommunications; Myron Stephenson and Frank Allen, EPA Region IVLaboratory, Athens, GA.
9. Marsden, P.; C.L. Helms, B.N. Colby. "Analysis of Volatiles in Waste Oil";report for B. Lesnik, OSW/EPA under EPA contract 68-W9-001, 6/92.
10. Methods for the Determination of Organic Compounds in Drinking Water,Supplement II Method 524.2; U.S. Environmental Protection Agency. Officeof Research and Development, Environmental Monitoring Systems Laboratory,Cincinnati, OH 1992.

CD-ROM 8260A - 29 Revision 1September 1994
TABLE 1.CHROMATOGRAPHIC RETENTION TIMES AND METHOD DETECTION LIMITS (MDL)
FOR VOLATILE ORGANIC COMPOUNDS ON WIDE-BORE CAPILLARY COLUMNS
________________________________________________________________________________
ANALYTE RETENTION TIME MDLd
(minutes) (µg/L)Column 1 Column 2 Column 2'a b c
Dichlorodifluoromethane 1.35 0.70 3.13 0.10Chloromethane 1.49 0.73 3.40 0.13Vinyl Chloride 1.56 0.79 3.93 0.17Bromomethane 2.19 0.96 4.80 0.11Chloroethane 2.21 1.02 -- 0.10Trichlorofluoromethane 2.42 1.19 6.20 0.08Acrolein 3.19Iodomethane 3.56Acetonitrile 4.11Carbon disulfide 4.11Allyl chloride 4.11Methylene chloride 4.40 2.06 9.27 0.031,1-Dichloroethene 4.57 1.57 7.83 0.12Acetone 4.57trans-1,2-Dichloroethene 4.57 2.36 9.90 0.06Acrylonitrile 5.001,1-Dichloroethane 6.14 2.93 10.80 0.04Vinyl acetate 6.432,2-Dichloropropane 8.10 3.80 11.87 0.352-Butanone --cis-1,2-Dichloroethene 8.25 3.90 11.93 0.12Propionitrile 8.51Chloroform 9.01 4.80 12.60 0.03Bromochloromethane -- 4.38 12.37 0.04Methacrylonitrile 9.191,1,1-Trichloroethane 10.18 4.84 12.83 0.08Carbon tetrachloride 11.02 5.26 13.17 0.211,1-Dichloropropene -- 5.29 13.10 0.10Benzene 11.50 5.67 13.50 0.041,2-Dichloroethane 12.09 5.83 13.63 0.06Trichloroethene 14.03 7.27 14.80 0.191,2-Dichloropropane 14.51 7.66 15.20 0.04Bromodichloromethane 15.39 8.49 15.80 0.08Dibromomethane 15.43 7.93 15.43 0.24Methyl methacrylate 15.501,4-Dioxane 16.172-Chloroethyl vinyl ether --4-Methyl-2-pentanone 17.32trans-1,3-Dichloropropene 17.47 -- 16.70 -- Toluene 18.29 10.00 17.40 0.11cis-1,3-Dichloropropene 19.38 -- 17.90 --1,1,2-Trichloroethane 19.59 11.05 18.30 0.10

CD-ROM 8260A - 30 Revision 1September 1994
TABLE 1. (Continued)
_________________________________________________________________________________
ANALYTE RETENTION TIME MDLd
(minutes) (µg/L)Column 1 Column 2 Column 2'a b c
Ethyl methacrylate 20.012-Hexanone 20.30Tetrachloroethene 20.26 11.15 18.60 0.141,3-Dichloropropane 20.51 11.31 18.70 0.04Dibromochloromethane 21.19 11.85 19.20 0.051,2-Dibromoethane 21.52 11.83 19.40 0.061-Chlorohexane -- 13.29 -- 0.05Chlorobenzene 23.17 13.01 20.67 0.041,1,1,2-Tetrachloroethane 23.36 13.33 20.87 0.05Ethylbenzene 23.38 13.39 21.00 0.06p-Xylene 23.54 13.69 21.30 0.13m-Xylene 23.54 13.68 21.37 0.05o-Xylene 25.16 14.52 22.27 0.11Styrene 25.30 14.60 22.40 0.04Bromoform 26.23 14.88 22.77 0.12Isopropylbenzene (Cumene) 26.37 15.46 23.30 0.15cis-1,4-Dichloro-2-butene 27.121,1,2,2-Tetrachloroethane 27.29 16.35 24.07 0.04Bromobenzene 27.46 15.86 24.00 0.031,2,3-Trichloropropane 27.55 16.23 24.13 0.32n-Propylbenzene 27.58 16.41 24.33 0.042-Chlorotoluene 28.19 16.42 24.53 0.04trans-1,4-Dichloro-2-butene 28.261,3,5-Trimethylbenzene 28.31 16.90 24.83 0.054-Chlorotoluene 28.33 16.72 24.77 0.06Pentachloroethane 29.411,2,4-Trimethylbenzene 29.47 17.70 31.50 0.13sec-Butylbenzene 30.25 18.09 26.13 0.13tert-Butylbenzene 30.59 17.57 26.60 0.14p-Isopropyltoluene 30.59 18.52 26.50 0.121,3-Dichlorobenzene 30.56 18.14 26.37 0.121,4-Dichlorobenzene 31.22 18.39 26.60 0.03Benzyl chloride 32.00n-Butylbenzene 32.23 19.49 27.32 0.111,2-Dichlorobenzene 32.31 19.17 27.43 0.031,2-Dibromo-3-chloropropane 35.30 21.08 -- 0.261,2,4-Trichlorobenzene 38.19 23.08 31.50 0.04Hexachlorobutadiene 38.57 23.68 32.07 0.11Naphthalene 39.05 23.52 32.20 0.041,2,3-Trichlorobenzene 40.01 24.18 32.97 0.03

CD-ROM 8260A - 31 Revision 1September 1994
TABLE 1. (Continued)
________________________________________________________________________________
ANALYTE RETENTION TIME MDLd
(minutes) (µg/L)Column 1 Column 2 Column 2'a b c
INTERNAL STANDARDS/SURROGATES
1,4-Difluorobenzene 13.26Chlorobenzene-d 23.105
1,4-Dichlorobenzene-d 31.164
4-Bromofluorobenzene 27.83 15.71 23.63
1,2-Dichlorobenzene-d 32.30 19.08 27.254
Dichloroethane-d 12.084
Dibromofluoromethane --Toluene-d 18.278
Pentafluorobenzene --Fluorobenzene 13.00 6.27 14.06
________________________________________________________________________________
Column 1 - 60 meter x 0.75 mm ID VOCOL capillary. Hold at 10 C fora o
8 minutes, then program to 180 C at 4 /min.o o
Column 2 - 30 meter x 0.53 mm ID DB-624 wide-bore capillary using cryogenicb
oven. Hold at 10 C for 5 minutes, then program to 160 C at 6 /min.o o o
Column 2' - 30 meter x 0.53 mm ID DB-624 wide-bore capillary, cooling GC ovenc
to ambient temperatures. Hold at 10 C for 6 minutes, program to 70 C ato o
10 /min, program to 120 C at 5 /min, then program to 180 C at 8 /min.o o o o o
MDL based on a 25 mL sample volume.d

CD-ROM 8260A - 32 Revision 1September 1994
TABLE 2.CHROMATOGRAPHIC RETENTION TIMES AND METHOD DETECTION LIMITS (MDL)FOR VOLATILE ORGANIC COMPOUNDS ON NARROW-BORE CAPILLARY COLUMNS
_________________________________________________________________________________
ANALYTE RETENTION TIME MDLb
(minutes) (µg/L) Column 3a
Dichlorodifluoromethane 0.88 0.11Chloromethane 0.97 0.05Vinyl chloride 1.04 0.04Bromomethane 1.29 0.06Chloroethane 1.45 0.02Trichlorofluoromethane 1.77 0.071,1-Dichloroethene 2.33 0.05Methylene chloride 2.66 0.09trans-1,2-Dichloroethene 3.54 0.031,1-Dichloroethane 4.03 0.03cis-1,2-Dichloroethene 5.07 0.062,2-Dichloropropane 5.31 0.08Chloroform 5.55 0.04Bromochloromethane 5.63 0.091,1,1-Trichloroethane 6.76 0.041,2-Dichloroethane 7.00 0.021,1-Dichloropropene 7.16 0.12Carbon tetrachloride 7.41 0.02Benzene 7.41 0.031,2-Dichloropropane 8.94 0.02Trichloroethene 9.02 0.02Dibromomethane 9.09 0.01Bromodichloromethane 9.34 0.03Toluene 11.51 0.081,1,2-Trichloroethane 11.99 0.081,3-Dichloropropane 12.48 0.08Dibromochloromethane 12.80 0.07Tetrachloroethene 13.20 0.051,2-Dibromoethane 13.60 0.10Chlorobenzene 14.33 0.031,1,1,2-Tetrachloroethane 14.73 0.07Ethylbenzene 14.73 0.03p-Xylene 15.30 0.06m-Xylene 15.30 0.03Bromoform 15.70 0.20o-Xylene 15.78 0.06Styrene 15.78 0.271,1,2,2-Tetrachloroethane 15.78 0.201,2,3-Trichloropropane 16.26 0.09Isopropylbenzene 16.42 0.10

CD-ROM 8260A - 33 Revision 1September 1994
TABLE 2.(Continued)
_________________________________________________________________________________
ANALYTE RETENTION TIME MDLb
(minutes) (µg/L) Column 3a
Bromobenzene 16.42 0.112-Chlorotoluene 16.74 0.08n-Propylbenzene 16.82 0.104-Chlorotoluene 16.82 0.061,3,5-Trimethylbenzene 16.99 0.06tert-Butylbenzene 17.31 0.331,2,4-Trimethylbenzene 17.31 0.09sec-Butylbenzene 17.47 0.121,3-Dichlorobenzene 17.47 0.05p-Isopropyltoluene 17.63 0.261,4-Dichlorobenzene 17.63 0.041,2-Dichlorobenzene 17.79 0.05n-Butylbenzene 17.95 0.101,2-Dibromo-3-chloropropane 18.03 0.501,2,4-Trichlorobenzene 18.84 0.20Naphthalene 19.07 0.10Hexachlorobutadiene 19.24 0.101,2,3-Trichlorobenzene 19.24 0.14________________________________________________________________________________
Column 3 - 30 meter x 0.32 mm ID DB-5 capillary with 1 µm film thickness.a
MDL based on a 25 mL sample volume.b

CD-ROM 8260A - 34 Revision 1September 1994
TABLE 3.ESTIMATED QUANTITATION LIMITS FOR VOLATILE ANALYTESa
______________________________________________________________________________
Estimated Quantitation Limits (All Analytes in Table 1)
Ground water Low Soil/Sedimentb
µg/L µg/kg
Purging 5 mL of water 5 --
Purging 25 mL of water 1 --
Soil/Sediment - 5
______________________________________________________________________________
Estimated Quantitation Limit (EQL) - The lowest concentration that can bea
reliably achieved within specified limits of precision and accuracy duringroutine laboratory operating conditions. The EQL is generally 5 to 10times the MDL. However, it may be nominally chosen within these guidelinesto simplify data reporting. For many analytes the EQL is selected from thelowest non-zero standard in the calibration curve. Sample EQLs are highlymatrix-dependent. The EQLs listed herein are provided for guidance and maynot always be achievable.
EQLs listed for soil/sediment are based on wet weight. Normally data areb
reported on a dry weight basis; therefore, EQLs will be higher, based onthe percent dry weight in each sample.
______________________________________________________________
Other Matrices Factorc
Water miscible liquid waste 50High-concentration soil and sludge 125Non-water miscible waste 500
______________________________________________________________
EQL = [EQL for low soil/sediment (see Table 3)] X [Factor]. For non-aqueousc
samples, the factor is on a wet-weight basis.

CD-ROM 8260A - 35 Revision 1September 1994
TABLE 4.BFB MASS - INTENSITY SPECIFICATIONS (4-BROMOFLUOROBENZENE)a
______________________________________________________________________________
Mass Intensity Required (relative abundance)
50 15 to 40% of mass 95 75 30 to 60% of mass 95 95 base peak, 100% relative abundance 96 5 to 9% of mass 95173 less than 2% of mass 174174 greater than 50% of mass 95175 5 to 9% of mass 174176 greater than 95% but less than 101% of mass 174177 5 to 9% of mass 176
______________________________________________________________________________
Alternate tuning criteria may be used (e.g. CLP, Method 524.2, ora
manufacturers' instructions), provided that method performance is notadversely affected.

CD-ROM 8260A - 36 Revision 1September 1994
TABLE 5.CHARACTERISTIC MASSES (M/Z) FOR PURGEABLE ORGANIC COMPOUNDS
________________________________________________________________________________
Primary SecondaryCharacteristic Characteristic
Analyte Ion Ion(s)
Acetone 58 43Acetonitrile 41 41, 40, 39Acrolein 56 55, 58Acrylonitrile 53 52, 51Allyl alcohol 57 57, 58, 39Allyl chloride 76 76, 41, 39, 78Benzene 78 -Benzyl chloride 91 91, 126, 65, 128Bromoacetone 136 43, 136, 138, 93, 95Bromobenzene 156 77, 158Bromochloromethane 128 49, 130Bromodichloromethane 83 85, 127Bromoform 173 175, 254Bromomethane 94 96iso-Butanol 74 43n-Butanol 56 412-Butanone 72 43, 72n-Butylbenzene 91 92, 134sec-Butylbenzene 105 134tert-Butylbenzene 119 91, 134Carbon disulfide 76 78Carbon tetrachloride 117 119Chloral hydrate 82 44, 84, 86, 111Chloroacetonitrile 48 75Chlorobenzene 112 77, 1141-Chlorobutane 56 49Chlorodibromomethane 129 208, 206Chloroethane 64(49*) 66(51*)2-Chloroethanol 49 49, 44, 43, 51, 80bis-(2-chloroethyl) sulfide 109 111, 158, 1602-Chloroethyl vinyl ether 63 65, 106Chloroform 83 85Chloromethane 50(49*) 52(51*)Chloroprene 53 53, 88, 90, 513-Chloropropionitrile 54 54, 49, 89, 912-Chlorotoluene 91 1264-Chlorotoluene 91 1261,2-Dibromo-3-chloropropane 75 155, 157Dibromochloromethane 129 1271,2-Dibromoethane 107 109, 188Dibromomethane 93 95, 1741,2-Dichlorobenzene 146 111, 1481,2-Dichlorobenzene-d 152 115, 1504

CD-ROM 8260A - 37 Revision 1September 1994
TABLE 5.(continued)
________________________________________________________________________________ Primary SecondaryCharacteristic Characteristic
Analyte Ion Ion(s)
1,3-Dichlorobenzene 146 111, 1481,4-Dichlorobenzene 146 111, 148cis-1,4-Dichloro-2-butene 75 75, 53, 77, 124, 89trans-1,4-Dichloro-2-butene 53 88, 75Dichlorodifluoromethane 85 871,1-Dichloroethane 63 65, 831,2-Dichloroethane 62 981,1-Dichloroethene 96 61, 63cis-1,2-Dichloroethene 96 61, 98trans-1,2-Dichloroethene 96 61, 981,2-Dichloropropane 63 1121,3-Dichloropropane 76 782,2-Dichloropropane 77 971,3-Dichloro-2-propanol 79 79, 43, 81, 491,1-Dichloropropene 75 110, 77cis-1,3-Dichloropropene 75 77, 39trans-1,3-Dichloropropene 75 77, 391,2,3,4-Diepoxybutane 55 55, 57, 56Diethyl ether 74 45, 591,4-Dioxane 88 88, 58, 43, 57Epichlorohydrin 57 57, 49, 62, 51Ethanol 31 45, 27, 46Ethyl acetate 88 43, 45, 61Ethylbenzene 91 106Ethylene oxide 44 44, 43, 42Ethyl methacrylate 69 69, 41, 99, 86, 114Hexachlorobutadiene 225 223, 227Hexachloroethane 201 166, 199, 2032-Hexanone 43 58, 57, 1002-Hydroxypropionitrile 44 44, 43, 42, 53Iodomethane 142 127, 141Isobutyl alcohol 43 43, 41, 42, 74Isopropylbenzene 105 120p-Isopropyltoluene 119 134, 91Malononitrile 66 66, 39, 65, 38Methacrylonitrile 41 41, 67, 39, 52, 66Methyl acrylate 55 85Methyl-t-butyl ether 73 57Methylene chloride 84 86, 49Methyl ethyl ketone 72 43Methyl iodide 142 142, 127, 141Methyl methacrylate 69 69, 41, 100, 394-Methyl-2-pentanone 100 43, 58, 85Naphthalene 128 -Nitrobenzene 123 51, 77

CD-ROM 8260A - 38 Revision 1September 1994
TABLE 5.(continued)
_________________________________________________________________________________ Primary SecondaryCharacteristic Characteristic
Analyte Ion Ion(s)
2-Nitropropane 46 -2-Picoline 93 93, 66, 92, 78Pentachloroethane 167 167, 130, 132, 165, 169Propargyl alcohol 55 55, 39, 38, 53-Propiolactone 42 42, 43, 44Propionitrile (ethyl cyanide) 54 54, 52, 55, 40n-Propylamine 59 59, 41, 39n-Propylbenzene 91 120Pyridine 79 52Styrene 104 781,2,3-Trichlorobenzene 180 182, 1451,2,4-Trichlorobenzene 180 182, 1451,1,1,2-Tetrachloroethane 131 133, 1191,1,2,2-Tetrachloroethane 83 131, 85Tetrachloroethene 164 129, 131, 166Toluene 92 911,1,1-Trichloroethane 97 99, 611,1,2-Trichloroethane 83 97, 85Trichloroethene 95 97, 130, 132Trichlorofluoromethane 151 101, 1531,2,3-Trichloropropane 75 771,2,4-Trimethylbenzene 105 1201,3,5-Trimethylbenzene 105 120Vinyl acetate 43 86Vinyl chloride 62 64o-Xylene 106 91m-Xylene 106 91p-Xylene 106 91
INTERNAL STANDARDS/SURROGATES
1,4-Difluorobenzene 114Chlorobenzene-d 1175
1,4-Dichlorobenzene-d 152 115, 1504
4-Bromofluorobenzene 95 174, 176Dibromofluoromethane 113Dichloroethane-d 1024
Toluene-d 988
Pentafluorobenzene 168Fluorobenzene 96 77
* - characteristic ion for an ion trap mass spectrometer (to be used whenion-molecule reactions are observed)

CD-ROM 8260A - 39 Revision 1September 1994
TABLE 6.SINGLE LABORATORY ACCURACY AND PRECISION DATA FOR VOLATILE
ORGANIC COMPOUNDS IN WATER DETERMINED WITH A WIDE-BORE CAPILLARY COLUMN
_________________________________________________________________________________
Conc. Number StandardRange, of Recovery Deviation Percenta
Analyte µg/L Samples % of Recovery RSD b
_________________________________________________________________________________
Benzene 0.1 - 10 31 97 6.5 5.7Bromobenzene 0.1 - 10 30 100 5.5 5.5Bromochloromethane 0.5 - 10 24 90 5.7 6.4Bromodichloromethane 0.1 - 10 30 95 5.7 6.1Bromoform 0.5 - 10 18 101 6.4 6.3Bromomethane 0.5 - 10 18 95 7.8 8.2n-Butylbenzene 0.5 - 10 18 100 7.6 7.6sec-Butylbenzene 0.5 - 10 16 100 7.6 7.6tert-Butylbenzene 0.5 - 10 18 102 7.4 7.3Carbon tetrachloride 0.5 - 10 24 84 7.4 8.8Chlorobenzene 0.1 - 10 31 98 5.8 5.9Chloroethane 0.5 - 10 24 89 8.0 9.0Chloroform 0.5 - 10 24 90 5.5 6.1Chloromethane 0.5 - 10 23 93 8.3 8.92-Chlorotoluene 0.1 - 10 31 90 5.6 6.24-Chlorotoluene 0.1 - 10 31 99 8.2 8.31,2-Dibromo-3-Chloropropane 0.5 - 10 24 83 16.6 19.9Dibromochloromethane 0.1 - 10 31 92 6.5 7.01,2-Dibromoethane 0.5 - 10 24 102 4.0 3.9Dibromomethane 0.5 - 10 24 100 5.6 5.61,2-Dichlorobenzene 0.1 - 10 31 93 5.8 6.21,3-Dichlorobenzene 0.5 - 10 24 99 6.8 6.91,4-Dichlorobenzene 0.2 - 20 31 103 6.6 6.4Dichlorodifluoromethane 0.5 - 10 18 90 6.9 7.71,1-Dichlorobenzene 0.5 - 10 24 96 5.1 5.31,2-Dichlorobenzene 0.1 - 10 31 95 5.1 5.41,1-Dichloroethene 0.1 - 10 34 94 6.3 6.7cis-1,2-Dichloroethene 0.5 - 10 18 101 6.7 6.7trans-1,2-Dichloroethene 0.1 - 10 30 93 5.2 5.61,2-Dichloropropane 0.1 - 10 30 97 5.9 6.11,3-Dichloropropane 0.1 - 10 31 96 5.7 6.02,2-Dichloropropane 0.5 - 10 12 86 14.6 16.91,1-Dichloropropene 0.5 - 10 18 98 8.7 8.9Ethylbenzene 0.1 - 10 31 99 8.4 8.6Hexachlorobutadiene 0.5 - 10 18 100 6.8 6.8Isopropylbenzene 0.5 - 10 16 101 7.7 7.6p-Isopropyltoluene 0.1 - 10 23 99 6.7 6.7Methylene chloride 0.1 - 10 30 95 5.0 5.3Naphthalene 0.1 -100 31 104 8.6 8.2n-Propylbenzene 0.1 - 10 31 100 5.8 5.8Styrene 0.1 -100 39 102 7.3 7.2

CD-ROM 8260A - 40 Revision 1September 1994
TABLE 6.(Continued)
_________________________________________________________________________________
Conc. Number StandardRange, of Recovery Deviation Percenta
Analyte µg/L Samples % of Recovery RSD b
______________________________________________________________________________
1,1,1,2-Tetrachloroethane 0.5 - 10 24 90 6.1 6.81,1,2,2-Tetrachloroethane 0.1 - 10 30 91 5.7 6.3Tetrachloroethene 0.5 - 10 24 89 6.0 6.8Toluene 0.5 - 10 18 102 8.1 8.01,2,3-Trichlorobenzene 0.5 - 10 18 109 9.4 8.61,2,4-Trichlorobenzene 0.5 - 10 18 108 9.0 8.31,1,1-Trichloroethane 0.5 - 10 18 98 7.9 8.11,1,2-Trichloroethane 0.5 - 10 18 104 7.6 7.3Trichloroethene 0.5 - 10 24 90 6.5 7.3Trichlorofluoromethane 0.5 - 10 24 89 7.2 8.11,2,3-Trichloropropane 0.5 - 10 16 108 15.6 14.41,2,4-Trimethylbenzene 0.5 - 10 18 99 8.0 8.11,3,5-Trimethylbenzene 0.5 - 10 23 92 6.8 7.4Vinyl chloride 0.5 - 10 18 98 6.5 6.7o-Xylene 0.1 - 31 18 103 7.4 7.2m-Xylene 0.1 - 10 31 97 6.3 6.5p-Xylene 0.5 - 10 18 104 8.0 7.7
________________________________________________________________________________
Recoveries were calculated using internal standard method. Internal standarda
was fluorobenzene.
Standard deviation was calculated by pooling data from three concentrations.b

CD-ROM 8260A - 41 Revision 1September 1994
TABLE 7.SINGLE LABORATORY ACCURACY AND PRECISION DATA FORVOLATILE ORGANIC COMPOUNDS IN WATER DETERMINED
WITH A NARROW-BORE CAPILLARY COLUMN
________________________________________________________________________________
Number StandardConc. of Recovery Deviation Percenta
Analyte µg/L Samples % of Recovery RSD________________________________________________________________________________
Benzene 0.1 7 99 6.2 6.3Bromobenzene 0.5 7 97 7.4 7.6Bromochloromethane 0.5 7 97 5.8 6.0Bromodichloromethane 0.1 7 100 4.6 4.6Bromoform 0.5 7 101 5.4 5.3Bromomethane 0.5 7 99 7.1 7.2n-Butylbenzene 0.5 7 94 6.0 6.4sec-Butylbenzene 0.5 7 110 7.1 6.5tert-Butylbenzene 0.5 7 110 2.5 2.3Carbon tetrachloride 0.1 7 108 6.8 6.3Chlorobenzene 0.1 7 91 5.8 6.4Chloroethane 0.1 7 100 5.8 5.8Chloroform 0.1 7 105 3.2 3.0Chloromethane 0.5 7 101 4.7 4.72-Chlorotoluene 0.5 7 99 4.6 4.64-Chlorotoluene 0.5 7 96 7.0 7.31,2-Dibromo-3-chloropropane 0.5 7 92 10.0 10.9Dibromochloromethane 0.1 7 99 5.6 5.71,2-Dibromoethane 0.5 7 97 5.6 5.8Dibromomethane 0.5 7 93 5.6 6.01,2-Dichlorobenzene 0.1 7 97 3.5 3.61,3-Dichlorobenzene 0.1 7 101 6.0 5.91,4-Dichlorobenzene 0.1 7 106 6.5 6.1Dichlorodifluoromethane 0.1 7 99 8.8 8.91,1-Dichloroethane 0.5 7 98 6.2 6.31,2-Dichloroethane 0.1 7 100 6.3 6.31,1-Dichloroethene 0.1 7 95 9.0 9.5cis-1,2-Dichloroethene 0.1 7 100 3.7 3.7trans-1,2-Dichloroethene 0.1 7 98 7.2 7.31,2-Dichloropropane 0.5 7 96 6.0 6.31,3-Dichloropropane 0.5 7 99 5.8 5.92,2-Dichloropropane 0.5 7 99 4.9 4.91,1-Dichloropropene 0.5 7 102 7.4 7.3Ethylbenzene 0.5 7 99 5.2 5.3Hexachlorobutadiene 0.5 7 100 6.7 6.7Isopropylbenzene 0.5 7 102 6.4 6.3p-Isopropyltoluene 0.5 7 113 13.0 11.5Methylene chloride 0.5 7 97 13.0 13.4Naphthalene 0.5 7 98 7.2 7.3n-Propylbenzene 0.5 7 99 6.6 6.7

CD-ROM 8260A - 42 Revision 1September 1994
TABLE 7.(Continued)
_________________________________________________________________________________
Number StandardConc. of Recovery Deviation Percenta
Analyte µg/L Samples % of Recovery RSD_________________________________________________________________________________
Styrene 0.5 7 96 19.0 19.81,1,1,2-Tetrachloroethane 0.5 7 100 4.7 4.71,1,2,2-Tetrachloroethane 0.5 7 100 12.0 12.0Tetrachloroethene 0.1 7 96 5.0 5.2Toluene 0.5 7 100 5.9 5.91,2,3-Trichlorobenzene 0.5 7 102 8.9 8.71,2,4-Trichlorobenzene 0.5 7 91 16.0 17.61,1,1-Trichloroethane 0.5 7 100 4.0 4.01,1,2-Trichloroethane 0.5 7 102 4.9 4.8Trichloroethene 0.1 7 104 2.0 1.9Trichlorofluoromethane 0.1 7 97 4.6 4.71,2,3-Trichloropropane 0.5 7 96 6.5 6.81,2,4-Trimethylbenzene 0.5 7 96 6.5 6.81,3,5-Trimethylbenzene 0.5 7 101 4.2 4.2Vinyl chloride 0.1 7 104 0.2 0.2o-Xylene 0.5 7 106 7.5 7.1m-Xylene 0.5 7 106 4.6 4.3p-Xylene 0.5 7 97 6.1 6.3
_________________________________________________________________________________
Recoveries were calculated using internal standard method. Internal standarda
was fluorobenzene.

CD-ROM 8260A - 43 Revision 1September 1994
TABLE 8.SURROGATE SPIKE RECOVERY LIMITS FOR WATER AND SOIL/SEDIMENT SAMPLES
_________________________________________________________________________________
Percent Recovery Low/High Low/High
Surrogate Compound Water Soil/Sediment_________________________________________________________________________________
4-Bromofluorobenzene 86-115 74-121a
Dibromofluoromethane 86-118 80-120a
Toluene-d 88-110 81-1178a
Dichloroethane-d 80-120 80-1204a
_________________________________________________________________________________
Single laboratory data, for guidance only.a
TABLE 9.QUANTITY OF EXTRACT REQUIRED FOR ANALYSIS OF
HIGH-CONCENTRATION SAMPLES
_________________________________________________________________________________
Approximate Volume ofConcentration Range Extracta
500 - 10,000 µg/kg 100 µL 1,000 - 20,000 µg/kg 50 µL 5,000 - 100,000 µg/kg 10 µL25,000 - 500,000 µg/kg 100 µL of 1/50 dilutionb
_________________________________________________________________________________
Calculate appropriate dilution factor for concentrations exceeding this table.
The volume of solvent added to 5 mL of water being purged should be kepta
constant. Therefore, add to the 5 mL syringe whatever volume of solventis necessary to maintain a volume of 100 µL added to the syringe.
Dilute an aliquot of the solvent extract and then take 100 µL forb
analysis.

CD-ROM 8260A - 44 Revision 1September 1994
TABLE 10DIRECT INJECTION ANALYSIS OF NEW OIL AT 5 PPM
Blank SpikeCompound Recovery (%) %RSD (ppm) (ppm)
Acetone 91 14.8 1.9 5.0Benzene 86 21.3 0.1 0.5n-Butanol*,** 107 27.8 0.5 5.0iso-Butanol*,** 95 19.5 0.9 5.0Carbon tetrachloride 86 44.7 0.0 0.5Carbon disulfide** 53 22.3 0.0 5.0Chlorobenzene 81 29.3 0.0 5.0Chloroform 84 29.3 0.0 6.01,4-Dichlorobenzene 98 24.9 0.0 7.51,2-Dichloroethane 101 23.1 0.0 0.51,1-Dichloroethene 97 45.3 0.0 0.7Diethyl ether 76 24.3 0.0 5.0Ethyl acetate 113 27.4 0.0 5.0Ethylbenzene 83 30.1 0.2 5.0Hexachloroethane 71 30.3 0.0 3.0Methylene chloride 98 45.3 0.0 5.0Methyl ethyl ketone 79 24.6 0.4 5.0MIBK 93 31.4 0.0 5.0Nitrobenzene 89 30.3 0.0 2.0Pyridine 31 35.9 0.0 5.0Tetrachloroethene 82 27.1 0.0 0.7Trichlorofluoromethane 76 27.6 0.0 5.01,1,2-Cl F ethane 69 29.2 0.0 5.03 3
Toluene 73 21.9 0.6 5.0Trichloroethene 66 28.0 0.0 0.5Vinyl chloride 63 35.2 0.0 0.2o-Xylene 83 29.5 0.4 5.0m/p-Xylene 84 29.5 0.6 10.0
* Alternate mass employed** IS quantitation
Data are taken from Reference 9.

CD-ROM 8260A - 45 Revision 1September 1994
FIGURE 1.PURGING DEVICE

CD-ROM 8260A - 46 Revision 1September 1994
FIGURE 2.TRAP PACKING AND CONSTRUCTION TO INCLUDE DESORB CAPABILITY

CD-ROM 8260A - 47 Revision 1September 1994
FIGURE 3.SCHEMATIC OF PURGE-AND-TRAP DEVICE - PURGE MODE

FIGURE 4.SCHEMATIC OF PURGE-AND-TRAP DEVICE - DESORB MODE
CD-ROM 8260A - 48 Revision 1September 1994

CD-ROM 8260A - 49 Revision 1September 1994
FIGURE 5.GAS CHROMATOGRAM OF VOLATILE ORGANICS

CD-ROM 8260A - 50 Revision 1September 1994
FIGURE 6.GAS CHROMATOGRAM OF VOLATILE ORGANICS

CD-ROM 8260A - 51 Revision 1September 1994
FIGURE 7.GAS CHROMATOGRAM OF VOLATILE ORGANICS

CD-ROM 8260A - 52 Revision 1September 1994
0.5 µg/L PER COMPOUND
1. 1,1-DICHLOROETHYLENE2. METHYLENE CHLORIDE3. TRANS-1,2-DICHLOROETHYLENE4. 1,1 DICHLOROETHANE5. ISOPROPYLETHER6. CHLOROFORM7. 1,1,1-TRICHLOROETHANE8. 1,2-DICHLORORETHYLENE9. CARBON TETRACHLORIDE10. BENZENE11. FLOUROBENZENE (INT. STD.)12. TRICHLOROETHYENE13. 1,2-DICHLOROPROPANE14. BROMODICHLOROMETHANE15. TOLUENE16. BROMOCHLOROPROPANE INT. STD.)17. DIBROMOCHLOROMETHANE18. TETRACHLOROETHYLENE19. CHLOROBENZENE20. ETHYLBENZENE21. 1,3-XYLENE22. BROMOFORM23. BROMOBENZENE24. 1,4-DICHLOROBENZENE25. 1,2,4-TRICHLOROBENZENE26. NAPHTHALENE
FIGURE 8.GAS CHROMATOGRAM OF TEST MIXTURE

CD-ROM 8260A - 53 Revision 1September 1994
FIGURE 9.LOW SOILS IMPINGER

CD-ROM 8260A - 54 Revision 1September 1994
METHOD 8260AVOLATILE ORGANIC COMPOUNDS BY GAS CHROMATOGRAPHY/MASS SPECTROMETRY (GC/MS):
CAPILLARY COLUMN TECHNIQUE