method development for characterization of n- linked
TRANSCRIPT

Method Development for Characterization of N-linked Glycoproteins in Mass Spectrometry
By
2007
Ying Zhang
Ph.D., University of Kansas 2007 Submitted to the Department of Chemistry and the
Faculty of the Graduate School of the University of Kansas in partial fulfillment of the requirements for the degree of
Doctor of Philosophy
Heather Desaire (Chairperson)
Robert C. Dunn
Cindy L. Berrie
David D. Weis
Roberto N. De Guzman
Date defended

The Dissertation Committee for Ying Zhang certifies that this is
the approved version of the following dissertation:
Method Development for Characterization of N-linked Glycoproteins in Mass Spectrometry
Committee:
Heather Desaire (Chairperson)
Robert C. Dunn
Cindy L. Berrie
David D. Weis
Roberto N. De Guzman
Date Accepted

i
Abstract
Method Development for Characterization of N-linked Glycoproteins in Mass Spectrometry
by
2007
Ying Zhang
Doctor of Philosophy in Chemistry
University of Kansas
Advisor: Dr. Heather Desaire, Chair
Protein glycosylation is one of the most important post-translational
modifications, and it is involved in many biological processes, including inter-/intra
cell signaling, protein recognition, and receptor binding, etc. It is estimated that 50-
60% of cell-surface and secreted proteins are glycosylated. Alteration in the glycan
structures on these proteins has been implicated in various disease states, such as,
cancer, Alzheimer’s disease, rheumatoid arthritis, and chronic obstructive pulmonary
disease, etc. Thus, characterizing glycans and monitoring the changes of glycan
profiles on proteins are essential to elucidate their biological significance and
facilitate disease diagnosis.
Mass spectrometry is a powerful tool for characterizing glycans on proteins,
due to its high sensitivity, selectivity and small sample requirements for analysis. In
order to elucidate a variety of glycan profiles (including both neutral and acidic
glycans) on glycoproteins, several efficient MS-based approaches have been
developed, and they are described herein. These approaches include an ion-pairing
strategy in conjunction with ESI-MS/MS to identify the acidic functional groups
(sulfate, and phosphate) in carbohydrates and glycopeptides; and a glycopeptide-

ii
based MS approach (liquid chromatography followed by MALDI-TOF/TOF) to
characterize glycans on different glycoproteins that vary in the number of
glycosylation sites and their corresponding glycan profiles.
Aside from protein glycosylation, disulfide connectivity is another important
modification present in proteins, and it plays a key role in establishing/maintaining
protein structures in their biologically active forms. Therefore, determination of
disulfide bond arrangement provides chemical structural information about proteins,
and it may lead to insights into their functional roles. To achieve this goal of
determining disulfide bonding patterns in proteins, a mass spectrometric approach
using liquid chromatography followed by electrospray ionization-Fourier transform ion
cyclotron resonance mass spectrometry (LC/ESI-FTICR-MS) has been validated and
used to determine the disulfide bond arrangement in an HIV envelope protein. This
study contributes to the understanding of this protein’s structure, and these findings
are essential in understanding and improving the protein’s immunogenicity.

iii
Acknowledgment
First of all, I would like to express my deep and sincere gratitude to my
advisor, Dr. Heather Desaire for her broad knowledge, invaluable guidance,
continuous support, and encouragement throughout this study. Without those
knowledge and guidance from her, this study would not have been successful.
I would also like to express my deep gratitude to Dr. Eden P. Go for her
detailed and constructive suggestions in my research, and helping me with MALDI
instrument, editing my papers, and providing suggestions in my oral comprehensive
examination, etc. I am also thankful to Dr. Hui Jiang for his generous assistance at
the beginning of my research and helping me to initiate my first project in graduate
school. I warmly thank Dr. Todd Williams and Dr. Marc Anderson for their kind
support and guidance in the instruments used in my research. I would also like to
thank Dr. Barton F. Haynes, Dr. Hua-Xin Liao, and Laura L. Sutherland at Duke
Human Vaccine Research Institute (Duke University, Durham, NC) for supplying HIV
Env proteins for my research. I warmly thank Dr. George R. Bousfield, and Dr.
Vladimir Y. Butnev from Wichita State University for supplying the glycoprotein
hormones for my study.
I am thankful to all my graduate friends for sharing literatures, invaluable
opinions, comments, and assistance in my course work and my research. I am also
thankful to all my Chinese friends in Lawrence Chinese Evangelical Church for
prayers and their continued support in my life.
I would like to express my love and gratitude to my beloved family for their
understanding, support, encouragement, trust, and endless love in my entire life,
especially my mother, thank you for always being there for me. I would also like to

iv
express my loving thanks to my fiancé Xuefeng Xue for his support, understanding,
encouragement, and love through the duration of my last two years’ graduate
studies. Without his encouragement and understanding, it would be impossible for
me to finish writing this dissertation. Thank you for being willing to share your
opinions, comments and suggestions in my life. Thank you for bringing lots of
happiness in my life.
Last but not least, I would like to give all my deep and sincere thanks to God
for my life. You have made my life bountiful and blessed.

v
Table of Contents
I. Introduction
1.1 Mass spectrometry……………………………………………………………………1
1.2 Matrix-assisted laser desorption/ionization (MALDI)…………………………...2
1.3 Electrospray ionization (ESI)………………………………………………………17
1.4 Principle of quadrupole ion-trap mass spectrometry…………………………18
1.5 Principle of Fourier transform mass spectrometry…………………………….20
1.6 Background information on carbohydrates and glycoproteins…………......22
1.7 Analyzing carbohydrates and glycoproteins by mass spectrometry………25
1.8 Overview and summary of the following chapters…………………………….27
1.9 References…………………………………………………………………………….30
II. A novel mass spectrometric method to distinguish isobaric monosaccharides that are phosphorylated or sulfated using ion-pairing reagents. 2.1 Introduction…………………………………………………………………………...35
2.2 Experimental…………………………………………………………………………..37
2.3 Results and discussion……………………………………………………………..38
2.4 Conclusions…………………………………………………………………………...56
2.5 References…………………………………………………………………………….57
III. Distinguish phosphorylation and sulfation in carbohydrates and glycoproteins using ion-pairing and mass spectrometry. 3.1 Introduction……………………………………………………………………………60
3.2 Experimental…………………………………………………………………………..63
3.3 Materials and methods………………………………………………………………65

vi
3.4 Conclusions…………………………………………………………………………...76
3.5 References…………………………………………………………………………….76
IV. Maximizing coverage of glycosylation heterogeneity in MALDI-MS analysis of glycoproteins with up to 27 glycosylation sites. 4.1 Introduction…………………………………………………………………………...80
4.2 Experimental section………………………………………………………………..84
4.3 Results and discussion……………………………………………………………..89
4.4 Conclusions………………………………………………………………………….112
4.5 References…………………………………………………………………………...115
V. Determination of disulfide bond arrangement of HIV Env protein CON-S gp140 ∆CFI by LC/ESI-FTICR mass spectrometry. 5.1. Introduction…………………………………………………………………………120
5.2. Experimental section……………………………………………………………...124
5.3. Results and discussion…………………………………………………………...126
5.4. Conclusions…………………………………………………………………………145
5.5. References…………………………………………………………………………..147
VI. Conclusions………………………………………………………………………….151

1
Chapter I
Introduction
1.1 Mass spectrometry
During past two decades, mass spectrometry has emerged as a powerful and
variable tool, which has been widely used in fundamental studies and analytical
applications.1-3 This technique measures the molecular mass of a molecule
according to its mass-to-charge ratio (m/z). Typically, a mass spectrometer consists
of three basic components: an ionization source, mass analyzer, and detector;1 see
Figure 1. Gas-phase ions are initially generated from a solid or liquid form in the
ionization source by gaining or losing a charge on the neutral molecules.4 The
charged gas-phase ions are electrostatically drawn into a mass analyzer, separated
based on the m/z ratio and then detected by a detector.1 The generated mass
spectrum provides the molecular masses of these ions.
There are several soft ionization techniques that have been widely used in
the studies of glycomics, proteomics and glycoproteomics, etc. These soft ionization
techniques consist of fast atom bombardment (FAB)5-8, matrix-assisted laser
desorption/ionization (MALDI)1, 9-17 and electrospray ionization (ESI)1, 3, 14. Among
these ionization sources, two ionization processes -MALDI and ESI- are used in the
research presented herein. Therefore, the fundamentals of these two ionization
sources will be discussed in the following sections. The principles as well as the
application of FAB can be found in references 5 through 8.

2
Figure 1. Schematic representation of the three basic components in mass spectrometry and their functions; the ions are produced in the ionization source, separated in the mass analyzer according to their m/z ratio, and then detected in a detector.
1.2 Matrix-assisted laser desorption/ionization (MALDI)
MALDI is one of the soft ionization processes to produce charged ions for
biologically relevant molecules with molecular masses up to 300 kDa.18, 19 MALDI
mass spectrometry (MALDI-MS) was invented in 1988 by Tanaka, Karas, and
Hillenkamp.19 Since then, it has become one of the essential techniques in the
identification of proteins and their corresponding post-translational modifications
(PTMs) with high sensitivity, selectivity and throughput.4, 15, 18, 20 The invention of this
technique was a landmark, in that it provided an opportunity to apply mass
spectrometry to the analysis of non-volatile, complex biological samples.4, 18
The MALDI ionization process initiates with mixing the sample with an excess
amount of matrix solution and spotting the sample:matrix mixtures on the MALDI
target plate. The crystallized sample:martrix mixtures are then irradiated by a laser
beam to extract and ionize the analytes, as well as matrix molecules, into the gas
phase, as shown in Figure 2. Although this process is still not well understood, it is
generally believed that the matrix molecules absorb a large amount of the photon
energy from the laser beam and subsequently transfer that energy to the analytes in
a certain way that the sample molecules sublime to the gas phase as intact ions.18, 19,

3
21
Two mechanisms have been proposed to explain how the charged analytes
are formed in MALDI ionization process.22, 23 The first mechanism shows a two-step
ionization event: a primary ionization process, followed by a secondary in-plume ion-
molecule reaction.22 The matrix molecules are ionized in the first step and then
undergo a secondary ion-molecule charge-transfer reaction with neutral analyte
molecules in the expanding gas plume produced on the matrix surface; See Equation
(1.1).
M+ + A → M + A+ (1.1)
Where M+ is the charged matrix molecule that could be protonated, sodiated, or
deprotonated; A is the neutral analyte which participates the ion-molecule reaction to
obtain the charge from the matrix molecule (M). The ion-molecule reactions between
the charged matrix molecule and the neutral analyte might be proton transfer, cation
transfer, electron transfer, or electron-capture reactions. In this model, the primary
ionized matrix molecules are produced by laser excitation and the in-plume ion-
molecule reaction plays a predominant role in the analyte ionization process.18, 19, 21
The second mechanism of analyte ionization is to produce the matrix-analyte
clusters, followed by ionization of these clusters.23 Two models have been proposed
in this mechanism to explain how to charge the formed matrix-analyte clusters in
MALDI ionization process. One model assumes that the analytes are present in a
multiply charged form in the matrix.23 The clusters are produced through trapping the
multiply charged analytes as well as their counter-ions in the matrix. The generated
and charged clusters are released in the plume by laser irradiation. During this
process, the charged analyte molecules are generated from these matrix-rich

4
clusters via desolvation. The highly charged initial analytes cannot survive in the
plume due to high charge-charge repulsion in the gas phase.18, 22, 23 Therefore, these
highly charged analytes undergo a charge reduction process, in which they are
neutralized by the electrons produced by laser irradiation on the matrix.22 During this
process, only the singly charged ions are the lucky survivors in the plume. This
explains why most gas phase ions produced in MALDI are singly charged. The
second model of charging the formed matrix-analyte clusters is photoionization with
normally used laser systems, such as N2 (337 nm) laser and the frequency-tripled
Nd:YAG (355 nm) laser, etc.18, 19, 21
In the desorption and ionization process discussed above, the generated
analyte ions are mainly singly charged molecules. With the increases in the
molecular masses of the sample molecules, the likelihood of forming oligomeric ions
(e.g. doubly and triply charged ions) in MALDI becomes higher. Sodiated adducts
are also a characteristic feature in the analysis of the biologically relevant samples
by MALDI. In addition to the analysis of positively charged ions, the analysis of
negatively charged ions is also possible with the MALDI ionization technique.1, 9-11, 18-
20

5
Figure 2. Matrix-assisted laser desorption/ionization process. (Adapted from Chhabil Dass, Fundamentals of Contemporary Mass Spectrometry, Wiley-interscience, New York, 2007.)
1.2.1 Laser systems in MALDI
In MALDI analysis, there are several important factors that need to be
considered when performing the experiments, such as the laser system and the
selected matrix solution. A diversity of laser systems has been applied in MALDI
analysis, including UV lasers and IR lasers. UV lasers include the N2 laser (337 nm),
the ArF excimer laser (193 nm), and the frequency-tripled (355 nm) / frequency-
quadrupled (266 nm) Nd:YAG lasers. IR lasers consist of the transversely excited
atmospheric (TEA) CO2 laser (10.6 μm), the Q-switched Er:YAG laser (2.94 μm),
and the Cr:LiSAF / Nd:YAG pumped optical parametric oscillator (OPO) lasers (3.28
μm). These lasers are commonly used in MALDI systems and can produce the
similar spectra in the analysis of biological samples.12, 18, 19
1.2.2 Matrices for MALDI
The MALDI matrix is another important part of the MALDI ionization process.
Typically, the matrix used in MALDI desorption and ionization is a non-volatile solid
material. It absorbs a large amount of photon energy from the laser beam and
minimizes sample damage. The use of matrix can also reduce the inter-molecular
forces among the sample molecules, thus decreasing sample aggregation. An ideal
MALDI matrix is comprised of several characteristics: strong adsorption of laser
energy to reduce sample damage; good solvent compatibility with analytes, to form
well-defined crystals; low sublimation temperature, to facilitate the formation of a
plume of the sample:matrix mixture by laser irradiation; and the ability to transfer
charges to the analytes with high efficiency, through photochemical reactions.18, 19, 21

6
According to the characteristics of the ideal MALDI matrix, four classes of
matrices have been widely used in the MALDI ionization process so far, including
solid organic matrices, liquid organic matrices, ionic liquids, and inorganic materials.
Solid organic matrices include α-cyano-4-hydroxycinnamic acid (CHCA), and 2,5-
dihydroxybenzoic acid (DHB), etc. These compounds are the most common types of
matrices retaining an aromatic ring in the structure to facilitate absorbing laser
irradiation. While a wide range of species can be analyzed with this type of matrices,
(such as proteins, peptides, oligosacchrides, glycoproteins, and glycopeptides,
etc),12 inhomogeneous distribution of the sample:matrix molecules in the crystallized
solid phase exists when these matrices are used in MALDI analysis. Thus, spot-to-
spot variations and sample-to-sample variations are present during analysis. Liquid
organic matrices (e.g. 2-nitrophenyloctyl ether and 3-nitrobenzyl alcohol) and ionic
liquids produced by mixing an organic solid matrix with an organic base (such as
butylamine), can be used to overcome inhomogeneous distribution in the sample
preparation.18 Aside from organic compounds used in MALDI matrices, inorganic
matrices such as metals, metal oxides, and graphitized carbon dispersed in a
nonvolatile liquid are also used to mix with analytes and facilitate their detection in
MALDI analysis.12, 18, 19, 21
1.2.3 Advantages and disadvantages of MALDI
MALDI produces charged molecules with little or no fragment ions; thus, it is
a soft ionization technique that is applicable for the analysis of biomolecules, up to
300 kDa in mass. It also has a high salt tolerance and high sensitivity, detecting
samples at a femtomole to low picomole levels, which is suitable for the analysis of
samples present in low abundance in complex mixtures. Since matrix is necessary in

7
MALDI experiments, matrix interference would be a problem for the analysis of
compounds in a lower mass range (< 700 Da). In addition, the use of an acidic matrix
in MALDI may also cause sample degradation on a certain types of compounds.
Therefore, selecting a suitable matrix material to be compatible with the analytes, to
avoid the sample degradation, is very important. Aside from matrix interference, the
laser beam used in MALDI may cause sample photodegradation. Therefore, the
laser energy needs to be controlled carefully in the experiments, to reduce sample
damage.19
1.2.4 Principles of time of flight (TOF) mass spectrometry
Time of flight (TOF) is a widely used mass analyzer coupled with MALDI
ionization sources. Briefly, this technique works based on the principle that the
generated ions from MALDI are accelerated and electrostatically drawn to the TOF
tube in a field free drift region, in which the ions are separated based on the mass-to-
charge ratio (m/z). Specifically, a positive voltage (V) is placed on the backing plate
to produce an electric field within the source region, as shown in Figure 3. Prior to
entering the field free drift region, all of the generated ions are accelerated to the
same kinetic energy:
½ mv2 = qV (1.2)
where m= mass of the ion, v= velocity of the ion, q= charge of the ion, V= potential of
the electric field. When the ions pass through the extraction grid, their velocities (v)
are inversely proportional to the square root of their m/q (or m/z) values:
v = (2qV/m)1/2 (1.3)
Subsequently, the ions travel in a long, field free drift region of length L and reach the
detector at different times, depending on their velocity, as described below:

8
t = L/v = L• [m/(2qV)]1/2 (1.4)
Since L and V are constants, the time spent to reach the detector relies on the
square root of m/q (or m/z) of the ions. The lower m/q (or m/z) ions migrate faster
and reach the detector earlier than the higher m/q (or m/z) ions in the field free drift
region. The resultant time spectrum can be converted to a mass spectrum by an
equation as shown below:
m/q = (2V) • (t/L)2 (1.5)
From this equation, the m/q (or m/z) of the ions is proportional to the time they take
to reach the detector. V and L are constants, determined by the experimental
parameters in the instruments. Typically, the potential of the electric field V
(accelerating voltage V) ranges from 3 kV to 30 kV, and the length of the TOF tube
ranges from 15 cm to 8 m.1, 9-11, 18-20
Although the conventional linear TOF mass spectrometer can be employed to
separate and detect the gas-phase ions on the basis of m/z, it generally has poor
mass resolution (less than 500) which is related to the temporal width of two ions of
the same m/z values (∆t) upon reaching the detector. The mass resolution of a TOF
mass spectrometer is shown in below:
R = t/(2∆t) = m/∆m (1.6)
Where R = mass resolution, t = time that the ions spend to reach the detector, ∆t =
the time interval of two ions of same m/z (s). Theoretically, if the ions of the same
m/z value arrive at the detector simultaneously (∆t → 0), the mass resolution can be
increased according to equation (1.6). However, practically, when the ions are
generated and accelerated in the source region, due to the intrinsic distribution in
time (instant of ion formation), space (initial locations of the ions in the source

9
region), and velocity (different initial kinetic energies on the ions), the two ions with
the same mass will not reach the detector at the same time. These factors result in
the poor mass resolution in the linear TOF mass spectrometer. To mitigate these
limitations and improve the mass resolution in MALDI-TOF analysis, delayed
extraction and reflectron devices are designed and incorporated in the MALDI-TOF
instrument.1, 9-11, 18-20
Figure 3. Schematic representation of mass separation in TOF analyzer; The ions are separated based on m/z. The ions with lower m/z (small circles) migrate faster than those with higher m/z (large circles). (Adapted from Chhabil Dass, Fundamentals of Contemporary Mass Spectrometry, Wiley-interscience, New York, 2007.)
1.2.5 Delayed extraction
Delayed extraction is an efficient approach to increase the mass resolution of
a linear TOF mass spectrometer, in which the ionization source region has been
divided into two regions, a field-free extraction region and an acceleration region; as
shown in Figure 4A. In the ionization process, the crystallized sample:matrix mixture

10
is irradiated by a laser beam to form gas-phase ions. During this process, no
potential is applied to the extraction region. The ions oscillate randomly in the field-
free extraction region, in which the isomass ion with a higher initial velocity (e.g. ion
a) moves faster than those with a lower initial velocity (e.g. ion b), therefore, the
distance they travel away from the backing plate is different; see Figure 4A.

11
Figure 4. Schematic representation of delayed extraction in MALDI-TOF; The ions with the different initial velocities (v0) are extracted in a field free environment in the extraction region. After a few nanoseconds of delay, an acceleration pulse is applied. The ion b with a lower v0 is subjected into a higher potential field and accelerated to a higher velocity (vH). While the ion a is subjected into a lower potential field and accelerated to a low velocity (vL) prior to entering the field free drift region. In the field free drift region, the ion b continues to migrate closer to ion a and eventually they reach the detector at the same time.
After a short period of delay, an acceleration potential is applied to accelerate
the ions. Thus, the isomass ions are electrostatically drawn away from the ionization
source. Due to the different distances away from the backing plate, the isomass ions
with lower initial velocities (e.g. ion b) are subjected to a higher potential field than
those with higher initial velocities (e.g. ion a); See Figure 4B. As a result, the ions
with a lower initial velocity (e.g. ion b) are sped up to a higher velocity than those
with a higher initial velocity (e.g. ion a). In the field free drift region, all of the ions with
the same m/z values migrate closer to each other and eventually reach the detector
at the same time.1, 9-11, 18, 20
1.2.6 The reflectron
Reflectron is another widely used device to mitigate the intrinsic spatial and
energy distribution of gas-phase ions; thus, it improves the mass resolution in
MALDI-TOF analysis. A reflectron is comprised of a series of retarding electrostatic
mirrors with a progressively increasing potential, as shown in Figure 5. These mirrors
are located at the end of the field free drift region, and they slow down the ions to
zero velocity. The ions are then reaccelerated in the opposite direction, and they
migrate in the second field free drift region. According to the differences in the initial
spatial and kinetic energy distribution, the isomass ions with higher initial energy
(e.g. ion a) will travel in a longer pathway in the reflectron region than those with
lower initial energy (e.g. ion b). Therefore, the shorter flying time of the isomass ions

12
with higher initial energy (e.g. ion a) in the first field free drift region is compensated
by penetrating the retarding field in the reflectron to a greater depth than those with
lower initial energy (e.g. ion b). As a result, all of the ions with the same m/z values
reach the second detector (D2) simultaneously. This process enhances the mass
resolution in MALDI-TOF.
Figure 5. Schematic representation of the reflectron in a MALDI-TOF instrument; The ions a and b have the same m/z value but different initial kinetic energies. In the refletron mode, they are moving in a different pathway, but reach the second detector simultaneously. (Adapted from Chhabil Dass, Fundamentals of Contemporary Mass Spectrometry, Wiley-interscience, New York, 2007.)
To date, both reflectron and delayed extraction have been incorporated into
MALDI-TOF mass spectrometers to improve mass resolution in MALDI-TOF MS
analysis. This provides a unique opportunity for applying MALDI in the
characterization of proteins and their corresponding post-translational modifications,
because these devices allow sufficient mass resolution to distinguish isotopes for
large molecules, and they can detect biological samples in low abundance. 1, 9-11, 18, 20
1.2.7 Principle of post-source decay (PSD)
In addition to performing an MS1 experiment on MALDI-TOF, tandem mass
13
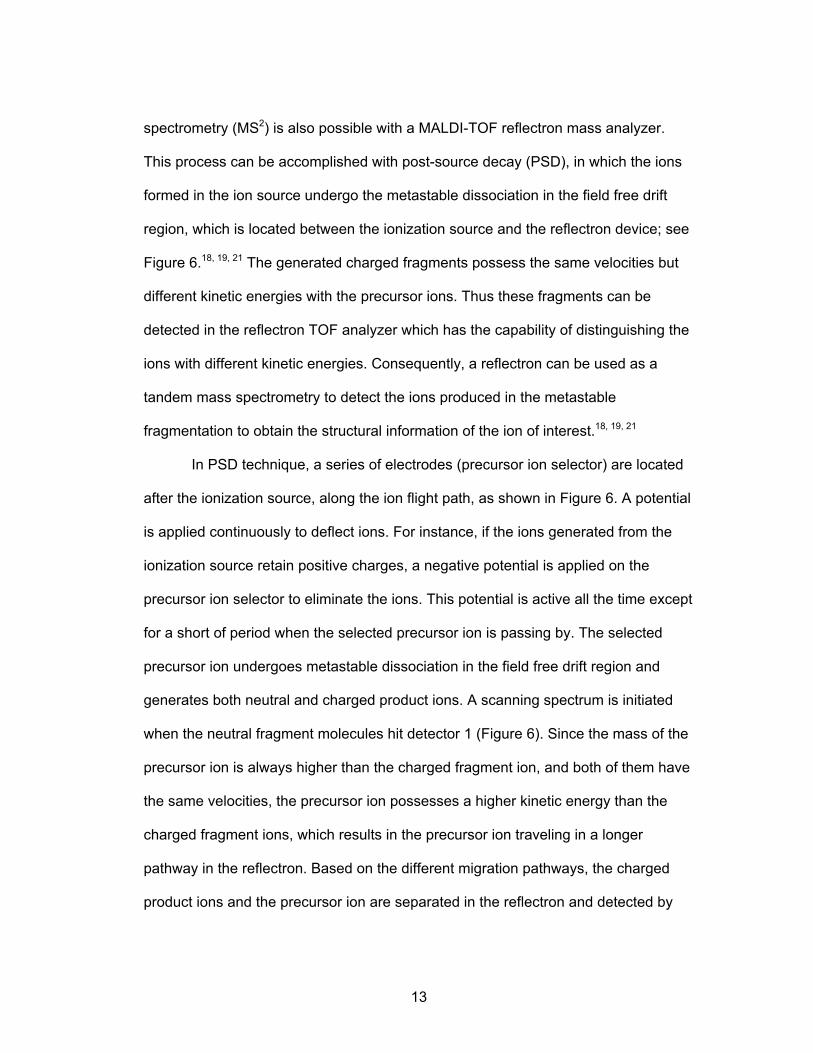
spectrometry (MS2) is also possible with a MALDI-TOF reflectron mass analyzer.
This process can be accomplished with post-source decay (PSD), in which the ions
formed in the ion source undergo the metastable dissociation in the field free drift
region, which is located between the ionization source and the reflectron device; see
Figure 6.18, 19, 21 The generated charged fragments possess the same velocities but
different kinetic energies with the precursor ions. Thus these fragments can be
detected in the reflectron TOF analyzer which has the capability of distinguishing the
ions with different kinetic energies. Consequently, a reflectron can be used as a
tandem mass spectrometry to detect the ions produced in the metastable
fragmentation to obtain the structural information of the ion of interest.18, 19, 21
In PSD technique, a series of electrodes (precursor ion selector) are located
after the ionization source, along the ion flight path, as shown in Figure 6. A potential
is applied continuously to deflect ions. For instance, if the ions generated from the
ionization source retain positive charges, a negative potential is applied on the
precursor ion selector to eliminate the ions. This potential is active all the time except
for a short of period when the selected precursor ion is passing by. The selected
precursor ion undergoes metastable dissociation in the field free drift region and
generates both neutral and charged product ions. A scanning spectrum is initiated
when the neutral fragment molecules hit detector 1 (Figure 6). Since the mass of the
precursor ion is always higher than the charged fragment ion, and both of them have
the same velocities, the precursor ion possesses a higher kinetic energy than the
charged fragment ions, which results in the precursor ion traveling in a longer
pathway in the reflectron. Based on the different migration pathways, the charged
product ions and the precursor ion are separated in the reflectron and detected by

14
detector 2. To facilitate metastable fragmentation of MALDI-generated ions, the PSD
experiment is performed using a “hot” MALDI matrix (e.g. α-cyano-4-
hydroxycinnamic acid, etc). In addition, blowing air or an inert gas into the flying tube
in the field free drift region may also enhance metastable fragmentation of the
precursor ion.9, 18, 21
Although PSD is useful in performing MALDI-MS/MS experiment, there are
several limitations with this approach: poor mass resolution of the precursor ion
selection and the inefficiency of the metastable fragmentation process, which results
in poor quality MS/MS data, compared to other methods of MS/MS analysis.18, 19, 21
To overcome these limitations, the tandem time of flight (TOF/TOF) instrument was
designed to perform improved MS/MS experiments and facilitate structural analysis
of various species.
Figure 6. Schematic representation of post-source decay (PSD): the precursor ion

15
(white circle) is selected in the precursor ion selector and undergoes the metastable dissociation in the flying tube of field free drift region. The charged product ions (black circles) travel a short pathway in the reflectron than the precursor ion due to the lower kinetic energy and then detected by detector 2. The neutral molecules (black squares) strike the detector 1, which initiates the MS/MS spectrum scanning event. (Adapted from Edmond de Hoffmann and Vincent Stroobant, Mass Spectrometry principles and applications, John Wiley & Sons, Chichester, England, 2002.)
1.2.8 Principle of the tandem time of flight (TOF/TOF) mass spectrometry
MALDI-TOF/TOF is derived from the MALDI-TOF instrument, by
incorporating a second time of flight tube and a series of components between the
ionization source and the electrostatic mirrors located in the reflectron at the end of
the second flight tube; as shown in Figure 7. These components consist of timed-ion
selector (TIS), the deceleration mirrors, a floating collision cell, a second pulsed ion
accelerator, and a pair of deflection electrodes for metastable suppression, etc.
Briefly, MALDI-TOF/TOF works based on the principle that the precursor ion
is produced in the first TOF, fragmented in the collision cell, and analyzed in the
second TOF. Specifically, the precursor ions generated in the MALDI ionization
source are focused in the center of the TIS, which contains a double-sided deflection
gate. The precursor ions are trapped by TIS through a time delay generator, which is
programmed to open the gate of the TIS when the lowest mass of interest arrives to
the gate and close the gate when the highest mass of interest passes through the
gate. The non-selected ions are deflected away from the floating collision cell. The
TIS-selected ions are decelerated by retarding mirrors, prior to entering the collision
cell. In the collision induced dissociation process, the ions are activated and collided
by the collision gas (N2 or inert gas) with selected energy, which can be varied by

16
Figure 7. Schematic representation of MALDI-TOF/TOF instrument; (Adapted from Marvin L. Vestal et al, Tandem time-of-flight mass spectrometry. Methods Enzymol. 2005, 402, 79-108.) adjusting the relative potential between the ionization source and the collision cell.
The fragment ions as well as the precursor ions exit the collision cell, pass through a
short field free drift region and are then reaccelerated by a second pulsed ion
accelerator into the second TOF region. Consequently, the reflectron mode in the
second TOF region is performed to generate high resolution MS/MS spectra. The
metastable suppressor consisting of a set of deflection electrodes is used to deplete
the “metastable” ions, which are produced outside of the collision cell, thus,
improving the quality of the MS/MS spectra.4, 10, 18, 20
Aside from performing MS2 experiments on MALDI-TOF/TOF instrument, the
linear and reflectron modes in the MS1 experiment can also be performed in the
MALDI-TOF/TOF system without applying any voltages on the components added
between ionization source and electrostatic mirrors for the MS2 experiment. The
performance of a MALDI-TOF/TOF system in MS1 experiments in linear mode and
reflectron mode is the same as the MALDI-TOF instrument described in the previous

17
sections, 1.2.4 and 1.2.6, respectively.4, 18, 20
1.3 Electrospray ionization (ESI)
In addition to the MALDI ionization process, ESI is the softest ionization
source that has been applied in the analysis of non-volatile biological samples, such
as proteins, glycoproteins, carbohydrates, and peptides, etc. In this ionization
process, the analytes are transferred from the solution phase to the gas phase via a
metal capillary, to which a high voltage (from ~ 700 V to 5 KV) is applied; see Figure
8.19 The liquid sample is infused through the capillary, which disperses the liquid
solution into a mist of small, charged droplets. If a positive voltage is applied on the
capillary, positively charged droplets are formed. The solvent on the positively
charged droplets are evaporated by applying drying gas, heat or both, at
atmospheric pressure.19 As the solvent evaporates, the positively charged droplets
shrink in size, and the charge density on their surface increases until it reaches the
Raleigh limit, in which the repulsive Columbic forces between ions within the droplet
exceed the surface tension of the droplets.18, 19, 21 This causes fission of the droplets
to form smaller charged droplets. As the solvent on the smaller droplets continues to
be evaporated, the charged droplets keep breaking down into the smaller droplets
and ultimately become a single ion.21 This process is called Coulomb fission.2, 13, 15, 24
Another proposed mechanism for ion formation is ion evaporation, in which the
charged droplets become smaller by releasing one charged ion at a time, until the
whole droplet contains one charged solute molecule in it. The produced charged ions
from the ionization process are electrostatically directed to the mass analyzer and
detected in the detector.2, 15, 18, 19, 24

18
Figure 8. Schematic representation of ESI ionization process; the ions are transferred from liquid phase to gas phase via two mechanisms: (A) Coulomb fission and (B) Ion evaporation. (Adapted from Chhabil Dass, Fundamentals of Contemporary Mass Spectrometry, Wiley-interscience, New York, 2007.) 1.4 Principle of quadrupole ion-trap mass spectrometry
The quadrupole ion-trap (QIT) mass analyzer was invented in 1958 by
Wolfgong Paul and his colleagues.18, 19, 21 Since then, it has been utilized in a
diversity of applications ranging from small compounds (e.g. drug metabolites,
pharmaceuticals, etc) to large biologically relevant molecules, such as proteins,
peptides, and their corresponding modifications, etc.19
Typically, the quadrupole ion trap consists of a ring electrode and two endcap
electrodes; See Figure 9.18 Mass separation in this instrument is accomplished by
storing the ions in the trapping space, and ejecting one m/z at a time through small
holes in the exit endcap, to a detector, by oscillating electric field created within the
three electrodes.18 Specifically, the ions created in the ionization source (e.g. ESI,
MALDI, etc) are electrostatically drawn into the analyzer and trapped in a three-
dimentional quadrupole filed, which is created by applying a voltage Φ0 (Equation

19
1.7) to the ring electrode and maintaining the endcap electrodes at ground
potential.18
Φ0=U-Vcosωt (1.7)
Where U is the amplitudes of the dc (constant) voltages and V is the amplitude of rf
(alternating) voltages; ω is the angular frequency. A potential well is formed within
the boundaries of the electrodes, and the lowest potential point of this well is located
in the center of the trap. Once the ions enter the quadrupole field, the helium gas (at
a pressure of 1mtorr) which is present in the trap is utilized to cool the kinetic
energies of these ions and confine them in the center.18 After the ions are focused in
the center of the trap, a gradually increased rf voltage is applied on the ring electrode
to eject the ions from the trap for detection. During this process, all the trapped ions
migrate in a figure eight-shaped pathway; See Figure 9. The large m/z(s) migrate in
a bigger pathway with a lower frequency, while the small m/z(s) migrate in a smaller
pathway with a higher frequency. According to Equation 1.8,
m/z = 4eV/(qmaxω2r02) (1.8)
where qmax is 0.908, and r0 is the radius of the trap, under a given rf voltage (V), all
the ions above a certain m/z value can be restored within the quadrupole field and
the ions lower than this value become unstable and are ejected out from the trap.18
Accordingly, as ramping the rf voltage V, the ions of sequentially increasing m/z are
forced to be unstable, and ejected out from the ion trap for external detection.18, 21
This approach of ejecting ions is known as “mass-selective instability mode”.18 The
alternative approach to eject ions is the “resonance ion ejection”, in which a
supplementary rf voltage is applied to the endcap electrodes to eject ions with
different m/z(s).18

20
In addition to performing MS1 experiment, MS/MS (or MSn) experiments are
also performed in the QIT. In this process, all the ions but the m/z(s) of interest are
ejected and a rf voltage is applied to the endcap electrode to excite the ions of
interest, thus, facilitates generating fragmentation ions.18, 21 The produced fragment
ions as well as the precursor ions are then ejected from the QIT for external
detection.
One salient feature of quadrupole ion trap is that it can perform multiple
collision-induced dissociation experiments (CID) without requiring multiple
analyzers.19 Other predominant features of QIT instrument include its compact
instrument size, and its capability to accumulate ions, thereby, enhances the signal-
to-noise (S/N) in an analysis.19
Figure 9. Schematic representation of quadrupole ion trap mass spectrometer. (Adapted from Chhabil Dass, Fundamentals of Contemporary Mass Spectrometry, Wiley-interscience, New York, 2007.) 1.5 Principle of Fourier transform mass spectrometry
Aside from the quadrupole ion trap, Fourier transform ion cyclotron

21
resonance mass spectrometry (FTICR-MS) is another technique which works
based on the same principle of trapping ions. This instrument was invented in 1974
by Comisarow and Marshall.18, 21 Since then, it has been widely used for the
analysis of numerous species with the highest mass resolution and mass accuracy,
compare to other mass analyzers.19
The key component of this instrument is a mass analyzer cell, which is
housed inside a strong magnetic field.18 This cubic cell consists of three pairs of
electrodes, including two trapping plates (front and back electrodes), two excitation
plates (the side electrodes), and two receiver plates (the top and bottom
electrodes); See Figure 10.18 The generated ions from the ionization source enter
the analyzer cell along the same direction (z-axis) as the magnetic field, and they
are confined to the center of the cell by applying a small voltage with the same
polarity of the ions on the trapping plates. Prior to excitation, the trapped ions
migrate along the z-axis at different frequencies, depending on their m/z values.18
To excite and detect these trapped ions, the remaining four plates in the cell are
utilized. In the excitation process, a range of radio frequency (rf) is applied to the
two excitation plates. The ions absorb energy, which causes their cyclotron radius
to enlarge and become coherent; therefore, the isomass ions cycle coherently at
the same orbital radius.18, 21 As the ions pass by the two receiver plates, an image
current induced by the ions is detected as a function of time and Fourier
transformed to the frequency domain to generate a mass spectrum.18, 21 The
generated image current oscillates at the same frequency as the coherently
migrating ions, which relies on their m/z values. Since the ions are continuously
migrating in a coherent circular pathway, they can be re-measured numerous

22
times, and this enhances the sensitivity and resolution of the instrument.
Figure 10. Schematic representation of Fourier transform ion cyclotron resonance mass spectrometry (FTICR-MS). (Adapted from Chhabil Dass, Fundamentals of Contemporary Mass Spectrometry, Wiley-interscience, New York, 2007.)
1.6 Background information on carbohydrates and glycoproteins
Carbohydrates are the most abundant and structurally complex species
present in nature.12, 13, 24-28 They are comprised of mono-, oligo-, and polymeric
saccharides. In oligo-, and polysaccharides, branched structures can form, due to
the different linkages that could be potentially present in the constituent
monosaccharides; thereby, this results in a very large structural diversity in
carbohydrates.12, 13, 24 In addition to the complexity in the linkages among
monosaccharides, carbohydrates can also be modified by addition of acidic
functional groups to form sialylated, sulfated, or phosphorylated species. These
acidic functional groups on carbohydrates influence their biological functional roles.
Specifically, sialylation is involved in controlling the half-life circulation time and
receptor binding.29, 30 Sulfation is linked to biological recognition, and protein

23
clearance.31 Alteration in phosphorylation of a carbohydrate correlates to diverse
types of diseases, and the phosphorylation state of certain carbohydrates can be
used as prognostic markers for breast cancer, ovarian cancer, and prostate cancer,
etc.32, 33
Carbohydrates attach to proteins to generate either O-linked or N-linked
glycoproteins. In O-linked glycosylation, the glycans are anchored via a hydroxyl
oxygen of serine(S) / threonine (T) to form a glycosidic bond. In N-linked
glycosylation, the carbohydrate is linked via an amide bond attached to the
asparagine (N) sidechain. The asparagine must be present in the consensus
sequence N X T/S, in which X can be any amino acid residues except for proline.13
All the N-linked glycans contain a common trimannosyl chitobiose core consisting of
[HexNAc2+Hexose3], which is boxed in scheme1.13-16 Based on the differences in the
outer branches of the glycans, the
N-linked glycans can be classified as high mannose, hybrid and complex types.13-16

24
The research presented in this manuscript focuses on the N-linked glycoproteins,
since these proteins are the most abundant species in mammalian cells.13
Glycosylation on proteins affects various biological functions of the proteins
(e.g. protein binding, inter- or intra- cell signaling, etc),28, 34-43 and it can serve as an
indicator of disease.34-38, 44-47 For example, human serum glycoproteins,
immunoglobulin G (IgG), transferrin, and α1-acid glycoprotein (AGP) are the most
abundant and significant proteins in human plasma. Human IgG is the major
immunoglobulin in human serum and serves as antibody. The neutral glycans on
human IgG are involved in inter-/intra cell signaling. Transferrin is a metal carrying
serum protein, transporting iron to tissues, via the circulation system.48 Alteration in
the glycosylation pattern on this protein affects iron homeostasis in the body. AGP,
also known as orosomucoid, is one of the important positive acute phase proteins in
human plasma.44 Although the biological functions of AGP are not fully understood,
changes in the glycosylation in some pathological conditions have been implicated,
such as chronic inflammation, pregnancy, etc.44 In addition, AGP has affinity for
various basic or neutral lipophilic drugs from endo and exogeneous sources,49-51 and
these binding activities largely rely on the glycan structures. Therefore,
characterization of the glycosylation in proteins is one important step in developing a
comprehensive understanding of the biological significance of glycosylation and in
facilitating disease diagnosis. Aside from human serum glycoproteins, several other
glycoproteins, such as glycoprotein hormones,52 and HIV Env proteins (CONS gp140
∆CFI and JRFL gp140 ∆CF) 53 are also used in this study for glycan analysis by
mass spectrometry.

25
1.7 Analyzing carbohydrates and glycoproteins by mass spectrometry
There are two basic approaches to characterizing glycans on glycoproteins
by mass spectrometry, either cleaving of the glycans or analyzing glycopeptides; see
Figure 11.14-17, 54 For glycan analysis, the glycans are enzymatically or chemically
released from the protein, followed by a separation technique and then detected by
MS. Since the glycans ionize inefficiently, the reducing-terminus of the glycans is
frequently derivatized in a reductive amination reaction by an aromatic amine; this
facilitates detection of the glycans in mass spectrometry.17 Although this approach is
useful in characterization of glycans with high sensitivity, the glycosylation site-
specific information, which defines where on the protein the glycans are attached can
not be elucidated, unless the glycosylation sites are separated prior to glycan
release.31
Figure 11. Schematic representation of characterization of glycans on glycoproteins by mass spectrometry: circle: glycans; star:derivatized reducing ends on the glycans.
The alternative approach to characterizing glycans on glycoproteins is to
perform glycopeptide-based analysis, in which the glycans and their attached

26
glycosylation sites can be elucidated in the same experiment. This affords
glycosylation site-specific information, which is useful in elucidating the functional
properties of glycoproteins.31, 55 Typically, the glycopeptide-based analysis entails
enzymatic digestion by either specific or non-specific proteases, followed by a
separation approach (e.g. high-performance liquid chromatography, etc) and then
mass analysis. One salient feature of this approach is that the peptide portion in the
glycopeptides is more readily ionized than underivatized glycans; so no extra
derivatization step is needed.17 As a result, this approach can be used for elucidation
of glycan structures on proteins with relatively low detection limits.17
In addition to the advantages of using glycopeptide-based MS analysis,
several challenges are encountered in this approach, including sample preparation
and data analysis.54 For sample preparation, due to the presence of glycans on
glycopeptides and their high degree of heterogeneity, the mass spectral signals of
glycopeptides are suppressed by the strongly ionizing peptides when both species
co-exist in a complex mixture. Therefore, the enrichment/separation process is
critical in the sample preparation of glycopeptide analysis. Detailed information for
the comparison of different enrichment and/or chromatographic approaches is
discussed in Chapter IV.
For data analysis, two “unknowns” are generated from glycopeptide-based
analysis, the glycan moiety and the peptide moiety of a glycopeptide peak in the
mass spectrum. This is due to the heterogeneity in both glycosylation and peptide
potion of the glycopeptides generated in enzymatic digestion. In order to
unambiguously assign the glycan compositions for the glycopeptides, the peptide
must be identified first. Knowledge of the primary sequence of the protein is required

27
to generate the theoretical peptide masses, which are necessary for elucidating the
peptide moiety of the glycopeptides.17 This process of identifying the peptide
composition can be accomplished by a web-based tool GlycoPep ID developed by
our group. After identifying composition of the peptide moiety of glycopeptides, the
process of assigning the glycan compositions of glycopeptides to MS1 data is greatly
facilitated. The detailed steps of data analysis in glycopeptide-based analysis can be
found in reference [50] and [51].56, 57
1.8 Overview and summary of the following chapters
The research presented herein focuses on developing several efficient MS-
based approaches to characterize post-translational modifications on glycoproteins.
These approaches include ion-pairing strategy in conjunction with ESI-MS/MS to
identify the acidic functional groups (sulfate, and phosphate) in carbohydrates and
glycopeptides; (Chapter II, III) and a glycopeptide-based MALDI-TOF/TOF approach
to characterize glycans on different glycoproteins varying in the number of
glycosylation sites and their corresponding glycan profiles (Chapter IV).
In addition to glycosylation, disulfide connectivity is another important protein
modification, and it plays a key role in establishing/maintaining protein structures in
their biologically active forms. Therefore, the determination of disulfide bond
arrangement will provide an efficient way to obtain the chemical structural
information about proteins, and these studies may lead to insights into the proteins’
functional roles. Towards this end, a mass spectrometric approach using liquid
chromatography followed by eletrospray ionization-Fourier transform ion cyclotron
resonance mass spectrometry (LC/ESI-FTICR-MS) was developed to determine the
disulfide bond arrangement in proteins and glycoproteins, as described in Chapter V.

28
The content of each chapter in this manuscript is summarized below.
1.8.1 Using ion-pairing strategy to differentiate between phosphorylation and
sulfation in mass spectrometry. (Chapter II and III)
The studies presented in Chapter II and III focus on the discrimination of
sulfation from phosphorylation in mass spectrometry. Phosphorylation and sulfation
are two important biological modifications present in carbohydrates, proteins, and
glycoproteins. Typically, sulfation and phosphorylation cause different biological
responses, so identification of these two functional groups is important for
understanding structure/function relationships in various species. Mass spectrometry
is one of the methods used to detect the presence of these two modifications in
complex biological mixtures. However, phosphorylated and sulfated structures are
isobaric; thus, differentiation between them in routinely used mass spectrometers is
not possible. To overcome this problem, a novel mass spectrometric method, ion-
pairing, in conjunction with ESI-MS/MS analysis, is developed on model
phosphorylated/sulfated carbohydrates(Chapter II), and subsequently applied in
discriminating sulfation from phosphorylation present in other biologically relevant
molecules, including mono-, di-, saccharides, and the highly sulfated glycoprotein,
ovine luteinizing hormone; see Chapter III. The ion-pairing strategy developed herein
is the first study demonstrating that this robust approach can be used to differentiate
the two isobaric functional groups, and this method is also useful in the detection of
phosphorylated compounds in complex mixtures.32, 33
1.8.2 Method development in glycan profiling on glycoproteins. (Chapter IV)
The research presented in Chapter IV focuses on method development for
characterization of N-linked glycans on glycoproteins, to facilitate understanding how

29
the glycan structures influence biological functional roles of glycoproteins. To date,
glycopeptide-based MS analysis has proven to be a well-suited approach for
characterizing glycans, since the glycan and its attachment site on the protein can be
elucidated in the same experiment. However, when glycopeptides co-exist with
peptides, glycopeptide signals are usually suppressed by the strongly ionizing
peptides. Towards this end, it would be desirable to seek methods to improve
glycopeptide detection. In Chapter IV, we performed an in-depth study of maximizing
glycosylation coverage on model glycoproteins by optimizing all the aspects of
glycopeptide-based analysis, including sample preparation methods, mass spectral
techniques, and data analysis strategies. In doing so, we created a work-flow that is
designed specifically to optimize the coverage of glycosylation heterogeneity in terms
of the number of glycosylation sites detected and their corresponding glycan profiles.
To test the effectiveness of this approach, a glycoprotein with 27 potential
glycosylation sites was analyzed. This work demonstrates that our strategies
significantly improve the glycopeptide detection to elucidate a variety of glycoforms
present on proteins, thereby, facilitating the understanding of the functional
properties of glycans on glycoproteins.
1.8.3 Method development in determination of disulfide bonds on
glycoproteins. (Chapter V)
In addition to glycan profiling on the glycoproteins, determining the disulfide
bonding pattern is another important feature in protein structural analysis. In Chapter
V, aiming to understand how the HIV Env protein’s structure influences its
immunogenicity, we developed a highly efficient MS-based approach, liquid
chromatography electrospray ionization Fourier transform ion cyclotron (LC/ESI-

30
FTICR) mass spectrometry, to determine the disulfide linkages on a synthetic form of
the HIV Env protein, CON-S gp140 ∆CFI, which has marked improvement in
antigenicity, compared to other similar wild-type proteins. This study is the first
investigation of utilizing mass spectrometry to determine the disulfide bonding
pattern in the HIV Env protein. The disulfide bonding pattern obtained from this study
complements the glycan profiling (also performed in our lab) to reveal overall
structural information, including functional domains and glycan shields present on
CON-S gp140 ∆CFI. Thus, these studies may provide beneficial information for
understanding the immunogenetic activity of this protein, which would lead to insights
to guide the direction of future vaccine development.
1.9 References
1. Sachon, E.; Jensen, O.N. Protein and peptide analysis by matrix-assisted laser desorption/ionization tandem mass spectrometry (MALDI MS/MS). Spectral Tech. Proteomics. 2007, 67-79. 2. Nguyen, D.N.; Becker, G.W.; Riggin, R.M. Protein mass spectrometry: applications to analytical biotechnology. J. Chromatogr., A 1995, 705, 21-45. 3. Nedlkov, D.; Nelson, R.W. Isolation of glycoproteins and identification of their N-linked glycosylation sites. In New and emerging proteomic techniques; Humana Press Inc: New Jersey, 2006; pp177-186. 4. Vestal, M. L.; Campbell, J.M. Tandem time-of-flight mass spectrometry. Methods Enzymol. 2005, 402, 79-108. 5. Carr, S.A.; Barr, J.R.; Roberts, G.D. Anumula, K.R.; Taylor, P.B. Identification of attachment sites and structural classes of asparagine-linked carbohydrates in glycoproteins. Methods Enyzmol. 1990, 193, 501-518. 6. Angel, A.S.; Nilsson, B. Linkage positions in glycoconjugates by periodate oxidation and fast atom bombardment mass spectrometry. Mehods Enyzmol. 1990, 193, 587-607. 7. Egge, H.; Peter-Katalinic, J.; Karas, M.; Stahl, B. The use of fast atom bombardment and laser desorption mass spectrometry in the analysis of complex

31
carbohydrates. Pure Appl. Chem. 1991, 63, 491-498. 8. Dell, A.; Rogers, M.E. Fast atom bombardment mass spectrometry of protein and carbohydrate biopolymers. TrAC, Trends Anal. Chem. 1989, 8, 375-378. 9. Pasch, H.; Schrepp, W. Mass spectrometric instrumentation. In MALDI-TOF mass spectrometry of synthetic polymers; Springer-Verlag Berlin Heidelberg: New York, 2003; pp19-53. 10. Coon, J.J.; Skyka, J.E.P.; Shabanowitz, J.; Hunt, D.F. Tandem mass spectrometry for peptide and protein sequence analysis. BioTechniques. 2005, 38, 519, 521, 523. 11. Cotter, R.J. Time-of-flight mass spectrometers. In Time-of-flight mass spectrometry: Instrumentation and applications in biological research; American Chemical Society, 1997; pp19-44. 12. Harvey, D.J. Matrix-assisted laser desorption/ionization mass spectrometry of carbohydrates. Mass Spectrom. Rev. 1999, 18, 349-450. 13. Harvey, D.J. Identification of protein-bound carbohydrates by mass spectrometry Proteomics. 2001, 1, 311-328. 14. Harvey, D. J., Structural determination of N-linked glycans by matrix-assisted laser desorption/ionization and electrospray ionization mass spectrometry. Proteomics 2005, 5, 1774-1786. 15. Harvey, D.J. Proteomic analysis of glycosylation: structural determination of N- and O-linked glycans by mass spectrometry. Expert Rev. Proteomics 2005, 2, 87-101. 16. Harvey, D.J. Analysis of carbohydrates and glycoconjugates by matrix-assisted laser desorption/ionization mass spectrometry: an update covering the period 1999-2000 Mass Spectrom. Rev. 2006, 25, 595-662. 17. Harvey, D.J.; Kuster, B.; Wheeler, S.F.; Hunter, A.P.; Bateman, R.H.; Dwek, R.A. Matrix-assisted laser desorption/ionization mass spectrometry of N-linked carbohydrates and related compounds. Mass Spectrom. Biol. Med. 2000, 403-437. 18. Dass, C. Fundamentals of contemporary mass spectrometry; John Wiley & Sons, Inc: Hoboken, New Jersey, 2007; pp35-45, 80-86, 133-136. 19. Siuzdak, G. Mass spectrometry for biotechnology; MCC Press; 2003; pp13-33. 20. Vestal, M.L.; Juhasz, P.; Martin, S.A. Delayed extraction matrix-assisted laser desorption time-of-flight mass spectrometry. Rapid Commun. Mass Spectrom. 1995, 9, 1044-1050.

32
21. De Hoffmann, E.; Stroobant, V. Mass spectrometry principles and applications; John Wiley & Sons, Inc: Southern Gate, Chichester, 2002; pp28-32, 33-44, 89-99. 22. Karas, M.; Gluckmann, M.; Schafer, J. Ionization in matrix-assisted laser desorption/ionization: singly charged molecular ions are the lucky survivors. J. Mass Spectrom. 2000, 35, 1-12. 23. Karas, M.; Kruger, R. Ion formation in MALDI: the cluster ionization mechanism. Chem. Rev. 2003, 103, 427-440. 24. Zaia, J. Mass spectrometry of oligosaccharides. Mass Spectrom. Rev. 2004, 23, 161-227. 25. Dell, A.; Morris, H.R.; Glycoprotein structure determination by mass spectrometry. Science, 2001, 291, 2351-2356. 26. Helenius, A.; Aebi, M. Intracellular functions of N-linked glycans. Science 2001, 291, 2364-2356. 27. Rudd, P.M.; Dwek, R.A.; Glycosylation: Heterogeneity and the 3D structure of proteins. Crit. Rev. Biochem. Mol. Biol. 1997, 32, 1-100. 28. Weerapana, E.; Imperiali, B. Asparagine-linked protein glycosylation: From eukaryotic to prokaryotic systems. Glycobiology. 2006, 16, 91R-101R. 29. Dalpathado, D.S.; Irungu, J.; Go, E.P. Butnev, V.Y.; Norton, K.; Bousfield, G.R.; Desaire, H. Comparative Glycomics of the Glycoprotein Follicle Stimulating Hormone: Glycopeptide Analysis of Isolates from Two Mammalian Species. Biochemistry 2006, 45, 8665-8673. 30. Compton, Steven J. Glycosylation and proteinase-activated receptor function. Drug Dev. Res. 2003, 59, 350-354. 31. Irungu, J.; Dalpathado, D. S.; Go, E. P.; Jiang, H.; Ha, H.; Bousfield, G. R.; Desaire, H. Method for characterizing sulfated glycoproteins in a glycosylation site-specific fashion, using ion pairing and tandem mass spectrometry. Anal. Chem. 2006, 78, 1181-1190. 32. Zhang, Y.; Go, E.P.; Jiang, H.; Desaire, H. A novel mass spectrometric method to distinguish isobaric monosaccharides that are phosphorylated or sulfated using ion-pairing reagents. J. Am. Soc. Mass. Spectrom. 2005, 16, 1827-1839. 33. Zhang, Y.; Jiang, H. Go, E.P.; Desaire, H. Distinguishing phosphorylation and sulfation in carbohydrates and glycoproteins using ion-pairing and mass spectrometry. J. Am. Soc. Mass. Spectrom. 2006, 17, 1282-1288. 34. Kameyama, A.; Kaneda, Y.; Yamanaka, H.; Yoshimine, H.; Narimatsu, H.; Shinohara, Y. Detection of oligosaccharides labeled with cyanine dyes using matrix-

33
assisted laser desorption/ionization mass spectrometry. Anal. Chem. 2004, 76, 4537-4542. 35. Kameyama, A.; Kikuchi, N.; Nakaya, S.; Ito, H.; Sato, T.; Shikanai, T.; Takahashi, Y.; Takahashi, K.; Narimatsu, H. A strategy for identification of oligosaccharide structures using observational multistage mass spectral library. Anal. Chem. 2005, 77, 4719-4725. 36. Nilsson, B. Analysis of protein glycosylation by mass spectrometry. Mol. Biotechnol. 1994, 2, 243-280. 37. Palm, A. K.; Novotny, M. V. A monolithic PNGase F enzyme microreactor enabling glycan mass mapping of glycoproteins by mass spectrometry. Rapid Commun. Mass Spectrom. 2005, 19, 1730-1738. 38. Shinohara, Y.; Furukawa, J.; Niikura, K.; Miura, N.; Nishimura, S. Direct N-glycan profiling in the presence of tryptic peptides on MALDI-TOF by controlled ion enhancement and suppression upon glycan-selective derivatization. Anal. Chem. 2004, 76, 6989-6997. 39. Yu Y. Q.; Gilar, M.; Kaska, J.; Gebler J. C. A rapid sample preparation method for mass spectrometric characterization of N-linked glycans. Rapid Commun. Mass Spectrom. 2005, 19, 2331-2336. 40. Haslam, S. M.; North, S. J.; Dell, A. Mass spectrometric analysis of N- and O-glycosylation of tissues and cells. Curr. Opin. Struct. Biol. 2006, 16, 584-591. 41. Jones, J.; Krag, S. S.; Betenbaugh, M. J. Controlling N-linked glycan site occupancy. Biochim. Biophys. Acta, Gen. Subj. 2005, 1726, 121-137. 42. Helenius, A.; Aebi, M. Roles of N-linked glycans in the endoplasmic reticulum. Annu. Rev. Biochem. 2004, 73, 1019-1049. 43. Vigerust, D. J.; Shepherd, V. L. Virus glycosylation: role in virulence and immune interactions. Trends Microbiol. 2007, 15, 211-218. 44. Imre, T.; Schlosser, G.; Pocsfalvi, G.; Siciliano, R.; Molnar-Szollosi, E.; Kremmer, T.; Malorni, A.; Vekey, K. Glycosylation site analysis of human alpha-1-acid glycoprotein (AGP) by capillary liquid chromatography - electrospray mass spectrometry. J. Mass Spectrom. 2005, 40, 1472-1483. 45. Larsen, M. R.; Hojrup, P.; Roepstorff, P. Characterization of gel-separated glycoproteins using two-step proteolytic digestion combined with sequential microcolumns and mass spectrometry. Mol. Cell Proteomics. 2005, 4, 107-119. 46. Wada, Y.; Tajiri, M.; Yoshida, S. Hydrophilic affinity isolation and MALDI multiple-stage tandem mass spectrometry of glycopeptides for glycoproteomics. Anal. Chem. 2004, 76, 6560-6565.

34
47. Sparks, S. E. Inherited disorders of glycosylation. Mol. Genet. Metab. 2006, 87, 1-7. 48. Van Rensburg, S. J.; Berman, P.; Potocnik, F.; MacGregor, P.; Hon, D.; De Villiers, N. 5- and 6-glycosylation of transferrin in patients with Alzheimer's disease. Metab. Brain Dis. 2004, 19, 89-96. 49. Dage, J. L.; Ackermann, B. L.; Halsall, H. B. Site localization of sialyl Lewisx antigen on a1-acid glycoprotein by high performance liquid chromatography-electrospray mass spectrometry. Glycobiology 1998, 8, 755-760. 50. Fournier, T.; Medjoubi, N. N.; Porquet, D. Alpha-1-acid glycoprotein. Biochim. Biophys. Acta. 2000, 1482, 157-171. 51. Nagy, K.; Vekey, K.; Imre, T.; Ludanyi, K.; Barrow, M. P.; Derrick, P. J. Electrospray Ionization Fourier Transform Ion Cyclotron Resonance Mass Spectrometry of Human a-1-Acid Glycoprotein. Anal. Chem. 2004, 76, 4998-5005. 52. Bousfield, G.R.; Butnev, V.Y.; Butnev, V.Y.; Nguyen, V.T.; Gary, C.M.; Dias, J.A.; MacColl, R.; Eisele, L.; Harvey, D.J. Differential effects of α subunit asparagines56 oligosaccharide structure on equine lutropin and follitropin hybrid conformation and receptor-binding activity. Biochemistry 2004, 43, 10817-10833. 53. Liao, H.; Sutherland, L.L.; Xia, S.; Brock, M. E.; Scearce, R. M.; Vanleeuwen, S.; Alam, S. M.; McAdams, M.; Weaver, E. A.; Camacho, Z. T.; Ma, B.; Li, Y.; Decker, J. M.; Nabel, G. J.; Montefiori, D. C.; Hahn, B. H.; Korber, B. T.; Gao, F.; Haynes, B. F. A group M consensus envelope glycoprotein induces antibodies that neutralize subsets of subtype B and C HIV-1 primary viruses. Virology 2006, 353, 268-282. 54. Budnik, B. A. ; Lee, R. S. ; Steen, J. A. J. Global methods for protein glycosylation analysis by mass spectrometry. Biochim. Biophys. Acta. 2006, 1764, 1870-1880. 55. Novotny, M. V.; Mechref, Y. New hyphenated methodologies in high-sensitivity glycoprotein analysis. J. Sep. Sci. 2005, 28, 1956-1968. 56. Go, E. P.; Rebecchi, K. R.; Dalpathado, D. S.; Bandu, M. L.; Zhang, Y.; Desaire, H. GlycoPep DB: a tool for glycopeptide analysis using a "smart search". Anal. Chem. 2007, 79, 1708-1713. 57. Irungu, J.; Go. E. P.; Dalpathado, D. S.; Desaire, H. Simplification of mass spectral analysis of acidic glycopeptides using GlycoPep ID. Anal. Chem. 2007, 79, 3065-3074.

35
Chapter II
A novel mass spectrometric method to distinguish isobaric monosaccharides that are phosphorylated or sulfated using ion-pairing regents
Reprinted by permission of Elsevier Science from “A novel mass spectrometric method to distinguish isobaric monosaccharides that are phosphorylated or sulfated using ion-pairing reagents” by Zhang, Y.; Go, E.P.; Jiang, H.; Desaire, H. Journal of American Society for Mass Spectrometry, Vol 16, pp1827-1839, copyright © 2005 by the American Society for Mass Spectrometry. 2.1 Introduction:
Phosphorylation and sulfation are functionally significant biological
modifications commonly found in metabolites, carbohydrates, proteins, and
glycoproteins. Phosphorylation is linked to signal transduction, gene expression, cell
cycle, cytoskeletal regulation, and apoptosis [1-8]. In particular, phosphorylated
carbohydrates are integral components of nucleic acids [1,5], oligosaccharides [1,5],
glycopeptides [2,3,4,6], and glycoproteins [2-4]. They are also involved in glycolysis
processes in the extracellular matrix [7,8]. Sulfation effects protein recognition and
helps facilitate clearance of proteins and metabolites from the body [9-14].
Specifically, sulfated carbohydrates represent a class of biologically active and
pharmaceutically important molecules [10]. They are essential in neuropathology and
used as therapeutic agents [9]. Because phosphorylation and sulfation have been
linked to different biological functions, differentiating these structures is essential for
understanding structure/function relationships in proteins, carbohydrates, and
metabolites.
Numerous studies [1-4, 6-7, 9-18] have been utilized to characterize the
phosphorylation and sulfation. These methods indicate that selective and sensitive
detection of phosphorylated and sulfated compounds in complex matrices is

36
paramount. Radiolabelling [3,6,11-14] is one of the commonly used methods to
identify phosphorylated and sulfated carbohydrates with good specificity. While this
method is hazardous and time-consuming, phosphorylated or sulfated species can
be selectively discriminated in the presence of many other compounds in the matrix,
using radiolabeling.
Mass spectrometry, which is highly selective and sensitive, could possibly
provide information about phosphorylation and sulfation without the need for
radiolabelling [3,15-17]. Recent MS experiments to identify phosphorylated
compounds include exact mass differentiation [2] and discrimination using ion-
molecule reactions [1] by using Fourier Transform Ion Cyclotron Resonance Mass
Spectrometry (FTICR-MS). While these two methods are useful in differentiating the
presence of phosphorylated and sulfated compounds, only a few groups have
access to these sophisticated instruments. Thus, developing the mass spectrometric
methods on more readily available instruments will benefit investigators who are
interested in this field.
Herein, we utilize basic peptides [9,19-23] as ion-pairing reagents to complex
to phosphorylated or sulfated carbohydrates via non-covalent interactions [9,19-23]
and perform MS/MS experiments on each complex to obtain the structural
information. This is the same ion-pairing technique employed in MALDI and ESI that
is used to enhance the signal of sulfated carbohydrates [19, 20]. Since both
phosphate and sulfate are highly acidic compounds with different proton affinities,
differences in their chemical reactivities with the ion-pairing reagents may be used to
distinguish their structures by MS/MS experiments. This is the first study to illustrate
that ion-pairing can be used in conjunction with MS/MS to differentiate isobaric

37
phosphorylated and sulfated compounds. In addition to its application to simple
carbohydrates, this method is also potentially applicable in identifying
phosphorylation and sulfation in glycosaminoglycans and glycoproteins in biological
samples.
This work complements other mass spectrometric studies that have
discriminated phosphorylation from sulfation using FTICR-MS [1,2], and most
recently MALDI-MS in which the differentiation was accomplished by monitoring the
differences in the ionization behavior between the two functional groups [24]. In
addition to discriminating these isobars, ion pairing has the added advantage of
simultaneously enhancing the mass spectral signal of these acidic groups, even
when they are present in complex mixtures of other compounds [20].
2.2 Experimental Section
Chemicals and Materials
All of the phosphorylated and sulfated monosaccharides and peptides were
purchased from Sigma-Aldrich (St. Louis, MO), except for the three basic peptides
Arg-Arg-Arg (R3), Arg-Ser-Lys (RSK) and Arg-Gly-Lys (RGK). These three small
peptides were synthesized at the University of Kansas Biological Research Service
Laboratory using solid phase peptide synthesis. All chemicals were used without
further purification and all solvents were HPLC grade.
Sample Preparation
All of the compounds including basic peptides were dissolved in a minimal
amount of HPLC grade water. Peptide stock solutions were further diluted with
methanol : water (MeOH:H2O) mixture (1:1) containing 0.5% acetic acid, to a final

38
concentration of 2 mM. All phosphorylated and sulfated monosaccharides were
diluted to 1 mM. Prior to MS analysis, ion-pair complexes were formed by combining
5 μL of basic peptide solution and 5 �L of monosaccharides solution. The mixture
was thoroughly mixed and 1-2 μL was directly injected into the mass spectrometer.
Mass Spectrometry
A surveyor MS-pump (Thermo, San Jose, CA) was used to deliver the mobile
phase of MeOH : H2O (1:1) containing 0.5% acetic acid at a flow rate of 20 μL/min.
1-2 �L of samples were directly injected into mass spectrometer. All samples were
analyzed on a Thermo Finnigan LCQ Advantage quadrupole ion trap mass
spectrometer (Thermo, San Jose, CA). Electrospray ionization in both positive and
negative ion mode was achieved by using a spray voltage of ~ 4.0 kV. Nitrogen was
used as a nebulizing gas, at a pressure of 20 psi. A capillary temperature of 200-
230°C was maintained. Ion-pairing experiments were performed in positive ion
mode, and MS data of the native carbohydrates was performed in negative ion
mode.
Collision-induced dissociation (CID) was performed to obtain structural
information. Specifically, doubly charged precursor ions were activated for 30 ms
with 20% normalized collision energy. A qz value of 0.25 and an isolation width of 3
Da were used. The singly charged precursor ions were activated with 15%
normalized collision energy.
2.3 Results and Discussion
MS data for isobaric monosaccharides without ion-pairing
To demonstrate the effectiveness of the ion-pairing technique in

39
differentiating between phosphorylated and sulfated compounds, two sets of isobaric
phosphorylated and sulfated monosaccharides were chosen as model compounds
(Scheme 1). In the first set of experiments, the fragmentation characteristics of the
isobaric monosaccharides without ion-pairing were examined. MS/MS data revealed
that the two sets of isobaric monosaccharides, glucose-6-phosphate (Glc6P) /
glucose-6-sulfate (Glc6S), and N-acetyl-glucosamine-6-phosphate (GlcNAc6P) / N-
acetyl-glucosamine-6-sulfate (GlcNAc6S) produce identical MS/MS data (Figure 1A-
D).
As a result, these isobaric monosaccharides cannot be distinguished using standard
MS/MS methods.
Ion-pairing for sulfated and phosphorylated carbohydrates
To overcome this problem, ion-pairing [9,19-23] was employed for the analysis. Ten
different basic peptides: Lys-Lys (K2), Lys-Lys-Lys (K3), Lys-Tyr-Lys (KYK), Arg-Ser-
Lys (RSK), Arg-Gly-Lys (RGK), Arg-Arg-Arg (R3), Lys-Lys-Lys-Lys (K4), Arg-Lys-
Arg-Ser-Arg-Lys-Glu (P1), Ser-Arg-Val-Ser-Arg-Arg-Ser-Arg (P2), Lys-Arg-Thr-Leu-
Arg- Arg (P3), were evaluated for their potential to form ion-pairing complexes with
the acidic carbohydrates and facilitate their discrimination in MS/MS experiments.
These peptides were complexed with the isobaric carbohydrates in Scheme 1.
Glucose-6-sulfate Glucose-6-phosphateGlc6S Glc6P
N-acetyl-glucosamine-6-sulfateGlcNAc6S
N-acetyl-glucosamine-6-phosphateGlcNAc6P
OOH
OHHO
HO
OO S O-
OOH
OHHO
HO
OH
O P O-
O OOH
NHHO
HO
OO S O-
O
O
OOH
NHHO
HO
OH
O P O-
O
O
O
Scheme1. Phosphorylated and sulfated monosaccharide standards used for the ion-pairing experiments.

40
Typical MS data of the carbohydrate and peptide ion-pairs depict the formation of
abundant ion-pair complexes. An example of the carbohydrate:peptide complex
between the phosphorylated carbohydrate, Glc6P, and the tripeptide, R3, is shown in
Figure 2. Since the basic side chain of the peptide is easily protonated under the
conditions used in this analysis, both doubly and singly charged ion-pair complexes
are formed in the spectrum. This is the first example that demonstrates ion-pairing,
which is typically used to facilitate MS detection of sulfated compounds [9,20,21],
also can be used for phosphorylated species. Structural information on each
carbohydrate:peptide complex was obtained from MS/MS experiments. The data are
presented in Table 1 and 2. To determine which peptide could be used in the
differentiation study, the fragmentation pattern of each singly and doubly charged
ion-pair complex was compared. The most effective ion-pairing reagents were
identified as those that could discriminate both sets of isobaric monosaccharides, in
Scheme 1. A summary of all the MS/MS data is in Table 1 and 2. Peptides that
produced unique product ions for one of the isobaric compounds were deemed
“useful”, because they could discriminate the isobars by MS/MS.
Table 1 shows data for the singly charged complexes. Several peptides were
ruled out as potentially useful ion-pairing candidates because their MS/MS data were
identical for both sets of the isobaric carbohydrate:peptide ion-pairs. In fact, only the
three peptides, R3, K3, and KYK, in Table 1, could be used to differentiate all the
isobars in this study. The same comparison was made for the doubly charged
complexes in Table 2. The peptides P1, P2, P3 and K3 in Table 2 were useful for
discriminating the doubly charged isobaric complexes. Combining the results from
both tables, indicate that K3 can be used to differentiate isobaric carbohydrates,
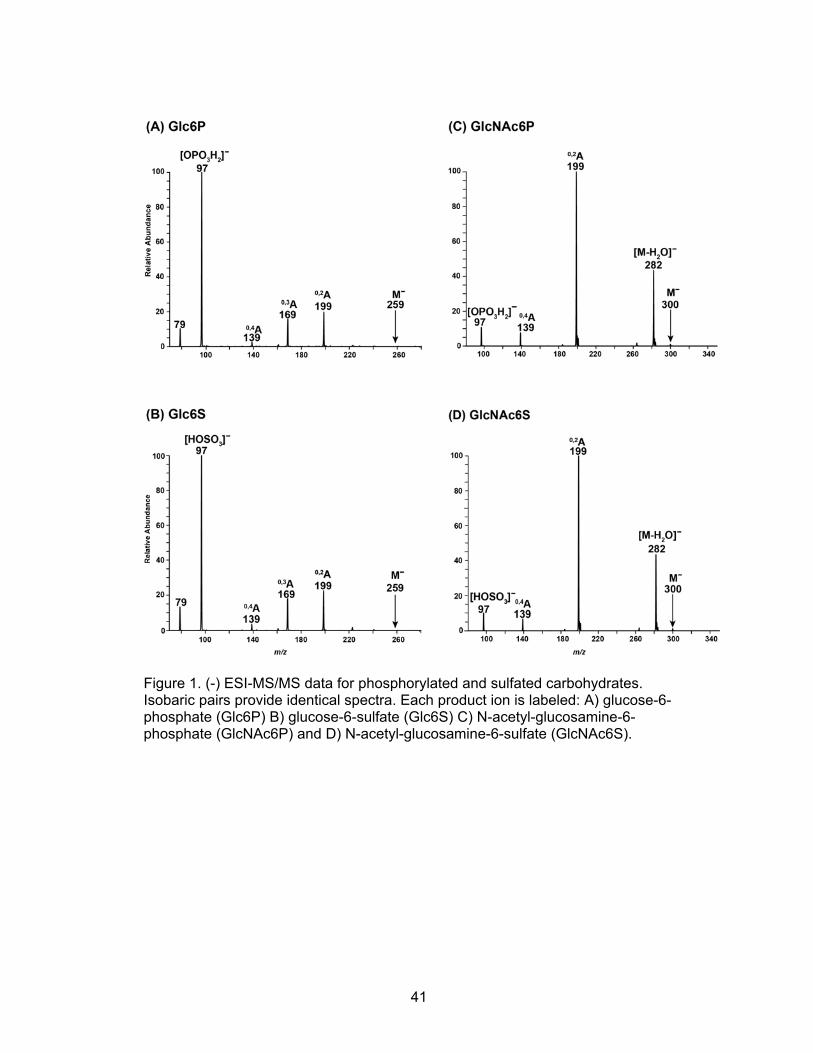
41
Figure 1. (-) ESI-MS/MS data for phosphorylated and sulfated carbohydrates. Isobaric pairs provide identical spectra. Each product ion is labeled: A) glucose-6-phosphate (Glc6P) B) glucose-6-sulfate (Glc6S) C) N-acetyl-glucosamine-6-phosphate (GlcNAc6P) and D) N-acetyl-glucosamine-6-sulfate (GlcNAc6S).

42
Figure 2. (+)ESI-MS data for the phosphorylated carbohydrate glucose-6-phosphate (Glc6P) after the addition of the ion-pairing reagent Arg-Arg-Arg (R3). The spectrum shows the two ion-pairs, [Glc6P+R3+2H]2+ and [Glc6P+R3+H]+.
in a charge-state independent fashion. The ion-pair complexes can have different
charge states (singly and doubly charge) in ESI. Thus, it would be beneficial if this
method could be used to discriminate the ion-pairs in both charge states. In addition,
being able to differentiate the isobars using two different charge states is useful
because it provides two methods of confirming the functional groups’ assignment. To
better understand why these isobaric complexes have different MS/MS data, the
spectra for the phosphorylated and sulfated ion-pairs are compared.

43
Table 1: MS/MS data of singly charged complexes with different peptides
N/A: the precursor ions or product ions are not detected. +: peak detected in MS/MS. -: peak absent in MS/MS.
Peptides were ruled out based on the following criteria: (1) Data are identical for each set of the isobars. (2) The peptide cannot form a complex with at least one carbohydrate, so the complexes are not apparent on spectra. Bolded peptides are good for discriminating the isobars.
Glc6P Glc6S GlcNac6P GlcNac6SParent
ionsH2Oloss
Peptide Parentions loss
Peptide Parentions loss
Peptide Other Parentions loss
Peptide Otherpeaks
P1 1219 + 1219 1260 1260
P2 1263 N/A N/A N/A 1305 1203
P3 1089 1089 1130 1130
R3 747 747 788 788 687
K4 791 791 N/A N/A 832
K3 661 663 704 704
KYK 698 698 739 739K2 535 535
RGK 620 620 661
RSK 650 650 691 691
661
576 576
N/A N/A
N/AN/AN/A N/A
796
1209
peaks
+
-
-
+ ++ +
++ +
++++
+++++
+ +
+ ++ ++ -+ -
+ ++ ++ +
--
+ + -
--
-----
+ ++ +
++++
+ ++ ++ +
+ + -
+ +-+
+ +-+
--+------
+ ++ ++ +
[m/z] [m/z] [m/z] [m/z] [m/z] [m/z]
H2O H2O H2O
Table 2: MS/MS data of doubly charged complexes with different peptides
N/A: the precursor ions or product ions are not detected. +: peak detected in MS/MS. -: peak absent in MS/MS.
Peptides were rule out based on the following criteria: (1) Data are identical for each set of the isobars. (2) The peptide cannot form a complex with at least one carbohydrate, so the complexes are not apparent on spectra. Bolded peptides are good for discriminating the isobars.
GlcNAc6P GlcNAc6S
Parentions loss
Peptide Parentions
Peptide Otherpeaks
Parentions
Peptide Otherpeaks
Parentions
Peptide Otherpeaks
P1 610 610 631 631
P2 633 653 653 602P3 545 566 566
R3 374 395 395
K4 396 396 417 417531/302
K3 353302/403 403/302284/222
KYK
K2 289 289271/161
RGK
RSK 346 346390/302 390/302
271/161
633
loss loss loss
Glc6P Glc6S
545
374
353
Otherpeaks
332 403 332261/243
350 483 350261/243
360261/243
390 285276/236
N/A
242
309
326 326261/243
N/A N/A N/A
N/A N/A N/A N/A
N/A N/A N/A N/A
N/A N/A N/A N/A N/A N/A N/A N/A
N/AN/A
311
N/A N/A N/A N/A 370 438/302222
+ + -
+ + --+-
-+-
+ --+ ++ +
+-
+- + +
+ --+ + -
-+-+ --
+ --+ -+ +
+ + -+ + 542
+ + --+-
+ ---
--
+ -
+ --+ ++ --+ + -+ --+ -+ -
+ -
[m/z] [m/z] [m/z] [m/z] [m/z] [m/z] [m/z] [m/z]
H2O H2O H2O H2O

44
Comparison of the MS/MS data: Doubly charged complexes with K3
The MS/MS data of the doubly charged ion-pairs of glucose-6-phosphate
[Glc6P+K3+2H]2+ and glucose-6-sulfate [Glc6S+K3+2H]2+ are in Figure 3A and 3B.
The product ions of the ion-pair complex, [Glc6P+K3+2H]2+, in Figure 3A include the
singly charged K3 at m/z 403, the doubly charged K3 at m/z 202, and two ions
corresponding to the water loss from the ion-pair complex, labeled as [M-H2O+2H]2+
and [M-2H2O+2H]2+, respectively. Water loss is generally expected in the MS/MS
data of carbohydrates due to the presence of many hydroxyl groups in the
carbohydrate’s structure [25,26]. Two other singly charged ions at m/z 261 and 243
corresponding to the product ion, [Glc6P+H]+, and water loss from phosphorylated
monosaccharide, respectively, were also observed.
In Figure 3A, an ion corresponding to the protonated monosaccharide
([Glc6P+H]+) appears in the spectrum of the phosphorylated complex,
[Glc6P+K3+2H]2+. This ion forms when the doubly charged complex dissociates to
two singly charged ions, [K3+H]+ at m/z 403 and [Glc6P+H]+ at m/z 261. Doubly
charged product ions dominate the spectrum of the sulfated complex,
[Glc6S+K3+2H]2+. This indicates that the distribution of charges on the
phosphorylated complex is different from that of the sulfated complex. The two
protons on the phosphorylated complex are not exclusively located on the basic
residue of the peptide. One of them can be transferred to the phosphate group of the
carbohydrate. The difference in the charge distribution of the
doubly charged sulfated and phosphorylated ion-pairs can be explained in terms of
the proton affinities of the two functional groups. From the known pKa values of the
sulfate (pKa=1.89) and the phosphate group (pKa=2.13) [27], it can be deduced that

45
the functional group with higher pKa has stronger proton affinity. Thus the proton
transfer from basic residue to the mono-phosphorylated residue is more facile,
compared to the mono-sulfated carbohydrates. Another difference in the dissociation
between the sulfated and phosphorylated complexes is the product ion
[K3+SO3+2H]2+ at m/z 242, which appears in Figure 3B, but not 3A. This ion formed
by bond cleavage between the carbohydrate and the SO3 group. The formation of
this ion is likely due to stronger non-covalent interactions between the peptide and
the sulfate group. Since the sulfate group has lower pKa than the phosphate group, it
most likely complexes to the basic peptide residue more strongly. As a result, the
covalent oxygen-sulfur bond cleaves, and the SO3 remains complexed to the ion-
pairing reagent during CID. In contrast, the covalent phosphorus-oxygen bond does
not cleave during CID. Because of the differences in chemical reactivity, the
complexes have different fragmentation patterns when they undergo the same CID
conditions.
Figure 3C and 3D show MS/MS data for the two other isobaric species,
GlcNAc6P and GlcNAc6S, complexed with K3. These two ion-pair complexes can
also be distinguished, based on their MS/MS data. In Figure 3C, two singly charged
complementary ions [GlcNAc6P+H]+ and [K3+H]+ (m/z 302 and 403, respectively)
originate from the precursor ion. These ions correspond to the ligand dissociation of
the ion-pair complex. Only one other small product ion corresponding to the loss of
water from the carbohydrate was observed, indicating that the interaction between
phosphate and basic peptide is weaker than the covalent bonds in the
phosphorylated monosaccharide. In addition to the two complementary ions
observed in Fig 3C, other product ions appear in the spectrum containing GlcNAc6S

46
Figure 3. (+)ESI-MS/MS data for the doubly charged ion-pairs with Lys-Lys-Lys (K3): A) phosphorylated complex [Glc6P+K3+2H]2+ B) sulfated complex [Glc6S+K3+2H]2+ C) phosphorylated complex [GlcNAc6P+K3+2H]2+ and D) sulfated complex [GlcNAc6S+K3+2H]2+. 3B and 3D both show characteristic ions resulting from oxygen-sulfur bond cleavage.
and K3 in Figure 3D. These ions include water loss ions (m/z 344, 335, and 284)
and the product ion at m/z 222, which corresponds to cleaving the oxygen-sulfur
bond in the carbohydrate. Note that this covalent bond cleavage is only observed in

47
the MS/MS data of the sulfated carbohydrates (Figure 3B and 3D).
Another interesting observation in the MS/MS data in Figure 3C and 3D is
that only the precursor and the product ions corresponding to the loss of H2O (m/z
344 and 335, respectively) are doubly charged. All of the other product ions are
singly charged. This fragmentation behavior is different than the MS/MS data of the
ion-pair complexes shown in Figure 3A and 3B. This must be due to the type of
carbohydrate complexed with the peptide. Hence, in addition to proton affinities, the
type of carbohydrate is another important factor that can influence the ions formed in
the CID spectra of phosphorylated and sulfated ion-pair complexes.
Singly charged complexes with K3
As discussed above, the MS data of the carbohydrate:peptide ion pairs show
the formation of ion-pair complexes with different charge states: singly and doubly
charge state complexes. MS/MS experiments were performed on the singly charged
complexes, and the sulfated and phosphorylated monosaccharides can also be
distinguished using these CID spectra (Figure 4). Three important ions were
observed in the spectra: The molecular ions (MH+), the ions corresponding to water
loss ([M-H2O+H]+), and the singly charged peptides ([K3+H]+). When identical
collision conditions are used, the protonated peptide K3 at m/z 403 in Figure 4 is
observed upon CID in the MS/MS data of the phosphorylated complex, but not in that
of the sulfated complex. The presence of these singly charged peptide product ions
[K3+H]+ provides additional evidence that phosphorylated ion-pair complexes are
weaker than the sulfated ion-pair complexes, because the sulfated complexes
undergo the covalent cleavage only (loss of H2O), while the phosphorylated
complexes undergo cleavage of the non-covalent interaction. This method of

48
differentiating the isobars is dependent on the collision energy used. At higher
collision energies, the sulfated complexes also undergo ligand dissociation.
Figure 4. (+)ESI-MS/MS data for singly charged complexes with Lys-Lys-Lys (K3) to identify the difference in chemical reactivity between phosphate and sulfate of the following carbohydrate:peptide complexes: A) phosphorylated ion-pair complex [Glc6P+K3+H]+, B) sulfated ion-pair complex [Glc6S+K3+H]+, C) phosphorylated ion-pair complex [GlcNAc6P+K3+H]+, and D) sulfated ion-pair complex [GlcNAc6S+K3+H]+.

49
Application to other phosphorylated and sulfated monosaccharides
The ion-pairs with different charge states have different fragmentation characteristics
based on the observations discussed above. Doubly charged sulfated compounds produce
ions that correspond to cleavage of the oxygen-sulfur bond, resulting in losses of SO3 in the
MS/MS data, while phosphorylated compounds are more likely to undergo ligand
dissociation to produce the protonated carbohydrates, instead of covalent bond cleavages.
When singly charged ion-pair complexes undergo CID, the dissociation of the non-covalent
complex occurs more readily for the phosphorylated compounds. This results in formation of
the product ions [K3+H]+ in the CID data of the phosphorylated complexes. To test whether
the chemical reactivity trends observed for the four isobaric monosaccharides are conserved
when slight changes in the monosaccharides occur, the ion pairing MS/MS experiments
were applied to other commercially available phosphorylated and sulfated monosaccharides.
The structures of the monosaccharides shown in Scheme 2 include N-acetyl-
glucosamine-1-phosphate (GlcNAc1P), N-acetyl-galactosamine-4-sulfate
(GalNAc4S), glucose-3-sulfate (Glc3S) and isomers α-glucose-1-phosphate
(αGlc1P), β-glucose-1-phosphate (βGlc1P). MS/MS data of the doubly charged ion-
pair complexes of the sulfated and phosphorylated carbohydrates complexed with K3
are shown in Figure 5. Figure 5A and 5B are two phosphorylated isomers α-Glc1P
and β-Glc1P complexed with K3, while the two N-acetylhexosamine:peptide ion pairs
[GlcNAc1P+K3+2H]2+ and [GalNAc4S+K3+2H]2+ are shown in Figure 5D and 5E.
The two N-acetylhexosamines are readily distinguished in this experiment.
Two complementary ions: protonated hexosamine [GlcNAc1P+H]+ (m/z 302) and
peptide ion [K3+H]+ (m/z 403) are shown in Figure 5D, which is consistent with the
trends of dissociation of phosphorylated ion pairs upon CID. The ion (m/z 204) is

50
most likely a secondary product resulting from the fragmentation of the ion at m/z
302. In Figure 5E the product ion corresponding to the cleavage of the oxygen-sulfur
bond is labeled at m/z 222 which corresponds to [GalNAc4S-SO3+H]+. This ion
clearly indicates that the monosaccharide is sulfated and not phosphorylated.
The data for the hexose monosaccharides is also consistent with the trends
established for the CID spectra of the isobaric monosaccharides in Figure 3. Two
product ions (m/z 261 and m/z 403) originating from the ligand dissociation are
apparent in the spectra of phosphorylated complexes [αGlc1P+K3+2H]2+, Figure 5A
and [βGlc1P+K3+2H]2+, Figure 5B. The product ion at m/z 242 corresponding to the
oxygen-sulfur bond cleavage appears in Figure 5C. However, these three
characteristic product ions that are useful to discriminate the hexoses are not present
in abundance. To further verify the different fragmentation characteristics of both
phosphorylated and sulfated hexoses:peptide ion-pair complexes upon collisional
Scheme 2. Structures of other phosphorylated and sulfated monosaccharides used for the ion-pairing experiments.
OOH
OHO
HO
OH
OS
-O
O
OO
NHHO
HO
OH
O
OH
P O -
O
OO
OHHO
HO
O H
OH
P O-
O
α-Glucose-1-phoshate β-Glucose-1-phosphate Glucose-3-sulfate αGlc1P βGlc1P Glc3S
N-acetyl-glucosamine-1-phosphate N-acetyl-galactosamine-4-sulfateGlcNAc1P GalNAc4S
O
OHHO
HO
OH
O
OH
P O-
O
OOH
NHHO
OH
O
O
O
S-OO

51
activation, peptide KYK was introduced in the analysis.
Figure 6 shows the MS/MS data of the doubly charged hexoses:peptide ion-
pairs. The observed difference between the MS/MS data of the ion-pair complexes in
Figure 6A and 6B, which are model isobaric molecules, are consistent with the
trends discussed above. Two complementary product ions at m/z 260.9 and m/z
438.3 are originating from the ligand dissociation in Figure 6A. While an ion
corresponding to oxygen-sulfur bond cleavage appears in Figure 6B, along with
many other product ions resulting from the covalent bond cleavages. This
demonstrates that peptide KYK is useful to distinguish doubly charged
hexoses:peptide ion pairs. From the other spectra in Figure 6, the relative
abundance of the ions corresponding to the non-covalent cleavage in
phosphorylated complexes (ions at m/z 260.9 and m/z 438.1 in Fig. 6C and 6D) and
oxygen-sulfur cleavage in sulfated complexes (ion at m/z 309.4 in Fig. 6E) are
enhanced when KYK is used as the ion-pairing reagent, instead of K3. This peptide
provides the complementary information to confirm the fragmentation characteristics
of hexoses:peptide ion pairs. To summarize, the peptide K3 was useful at
distinguishing the monosaccharides, but the important, discriminating ions were in
low abundance. The identity of each of the monosaccharides could be further
supported using another peptide that discriminated the hexoses, KYK.
Aside from the doubly charged ion pairs, the CID data of the singly charged ion pairs
are summarized in Table 3. Upon collisional activation, the singly charged
phosphorylated ion-pair complexes dissociate to produce the abundant peptide
[K3+H]+. This ion is useful to distinguish phosphorylated and sulfated complexes.
These results are consistent with the MS/MS data for the original four isobaric

52
monosaccharides, in Figure 4.Using the singly charged complexes to differentiate
the hexose monosaccharides represents a third successful approach to identifying
the chemical composition of these monosaccharides. Clearly, the ion pairing strategy
is robust in that it is useful under many conditions, for various types of
monosaccharides, various charge states, and various ion-pairing reagents. These
data also demonstrate that the rules developed to describe the dissociation of the
isobaric monosaccharides could be applied to any other sulfated or phosphorylated
monosaccharide. Since these rules appear to be functional group specific, and not
compound specific, it is quite plausible that these principles could be extended to
larger oligosaccharides or glycopeptides. Overall, the comparison of the MS/MS data
of both abundant ion-pairs demonstrates that ion-pairing reagents, K3 and KYK, can
be used to effectively distinguish phosphorylated and sulfated compounds in terms of
their fragmentation characteristics in the CID spectra.
While differentiating positional isomers is not the subject of this investigation,
ion-pairing may also be useful for identifying the location of the phosphate on the
monosaccharides. A unique product ion is present in Figures 5 and 6 for the
monosaccharides phosphorylated at the anomeric carbon. This product ion
corresponds to cleavage of H3PO4 from the monosaccharides. When the phosphate
is at the C6 position, a loss of H2O is observed instead. A possible explanation for
this behavior is that the water loss from Glc6P and GlcNAc6P is coming from the
hydroxyl group of C1. Once the hydroxyl group is replaced by the phosphate group,
a carbohydrate/phosphate cleavage occurs instead. This hypothesis is also
supported by the observation that the complexes produced from Glc1P or GlcNAc1P
do not have water loss product ions in their CID spectra.

53
Figure 5. (+)ESI-MS/MS data for the doubly charged ion-pair complexes with the tripeptide Lys-Lys-Lys (K3) verifying which species were sulfated or phosphorylated of the following carbohydrate:peptide complexes: A) phosphorylated complex [αGlc1P+K3+2H]2+, B) phosphorylated complex [βGlc1P+K3+2H]2+, C) sulfated complex [Glc3S+K3+2H]2+, D) phosphorylated complex [GlcNAc1P+K3+2H]2+, and E) sulfated complex [GalNAc4S+K3+2H]2+. 5C and 5E both show characteristic ions resulting from oxygen-sulfur bond cleavage.

54
Figure 6. (+)ESI-MS/MS data for the doubly charged ion-pair complexes with Lys-Tyr-Lys (KYK) A) phosphorylated complex [Glc6P+KYK+2H]2+ and B) sulfated complex [Glc6S+KYK+2H]2+ C) phosphorylated complex [αGlc1P+KYK+2H]2+, D) phosphorylated complex [βGlc1P+KYK+2H]2+ , and E) sulfated complex [Glc3S+KYK+2H]2+.
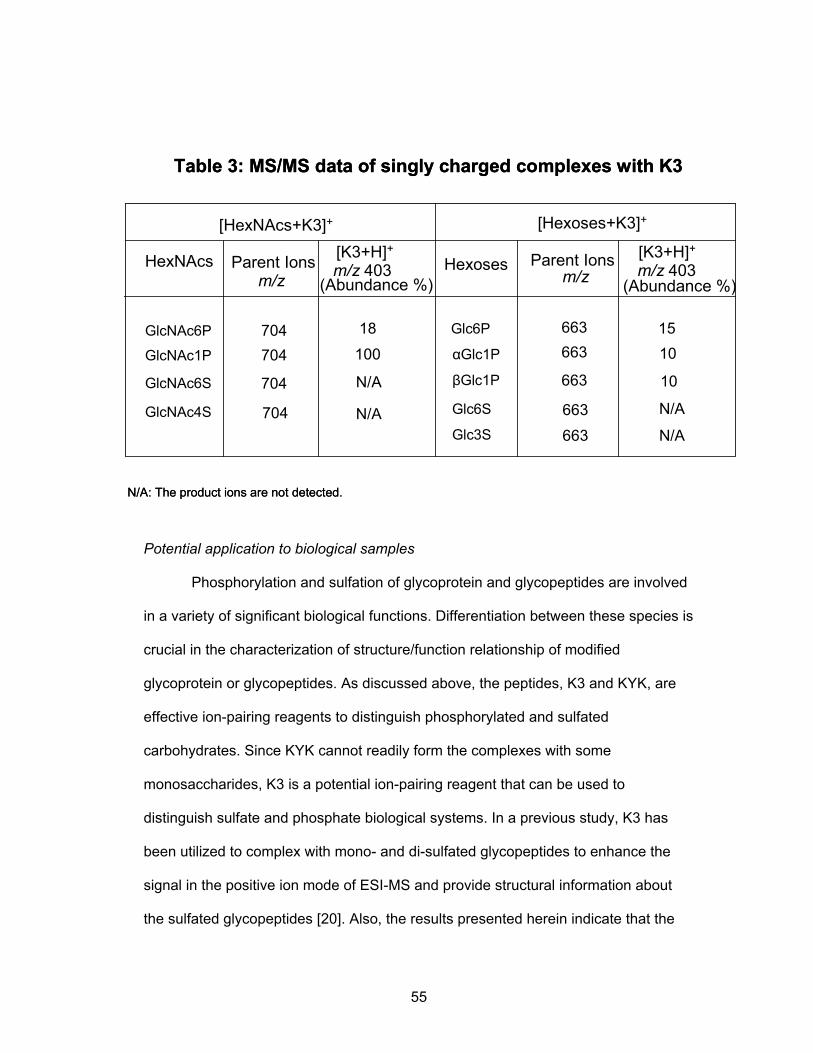
55
Potential application to biological samples
Phosphorylation and sulfation of glycoprotein and glycopeptides are involved
in a variety of significant biological functions. Differentiation between these species is
crucial in the characterization of structure/function relationship of modified
glycoprotein or glycopeptides. As discussed above, the peptides, K3 and KYK, are
effective ion-pairing reagents to distinguish phosphorylated and sulfated
carbohydrates. Since KYK cannot readily form the complexes with some
monosaccharides, K3 is a potential ion-pairing reagent that can be used to
distinguish sulfate and phosphate biological systems. In a previous study, K3 has
been utilized to complex with mono- and di-sulfated glycopeptides to enhance the
signal in the positive ion mode of ESI-MS and provide structural information about
the sulfated glycopeptides [20]. Also, the results presented herein indicate that the
Table 3: MS/MS data of singly charged complexes with K3
[HexNAcs+K3]+ [Hexoses+K3]+
HexNAcs Hexoses[K3+H]+[K3+H]+ Parent IonsParent Ions
GlcNAc6P
GlcNAc1P
GlcNAc6S
GlcNAc4S
704704
704
704
m/z 403(Abundance %)
m/z 403(Abundance %)m/z m/z
Glc6P
αGlc1P
βGlc1P
Glc6S
Glc3S
663663
663
663663
18
N/A
N/A N/A
N/A
1510
10
100
N/A: The product ions are not detected.

56
phosphorylated carbohydrates can also complex with the ion-pairing reagents in
good abundance in ESI-MS. This implies that K3 can potentially be applied to
distinguish between phosphorylated and sulfated glycopeptides. A full investigation
of the utility of ion-pairing for differentiation analysis of phosphorylated and sulfated
glycopeptides is ongoing and will be presented separately.
2.4 Conclusions
In this manuscript all the commercially available sulfated and phosphorylated
monosaccharides are differentiated using ion pairing and MS/MS. Furthermore, this method
is robust because it is effective regardless of the charge state of the ion-pair. The
fragmentation characteristics in the CID spectra for both abundant ion-pairs were
summarized. For doubly charged complexes, sulfated compounds are likely to undergo
sulfur-oxygen bond cleavage, while phosphorylated compounds tend to dissociate by
discrupting noncovalent interactions. The type of monosaccharide also affects the MS data
of the ion pairs, but it does not affect the characteristic product ions that are useful at
discriminating between sulfate and phosphate.
MS/MS data of singly charged ion pairs also support the hypothesis that
phosphorylated ion-pair complexes are weaker than the sulfated ion-pair complexes,
because the sulfated complexes undergo covalent cleavage only, while the phosphorylated
complexes undergo cleavage of the non-covalent interaction.
This is the first example of using ion-pairing on phosphorylated compounds and the
first use of ion-pairing reagents to discriminate the presence of sulfates and phosphates.
Since we have recently demonstrated that the ion-pairing method enhances the mass
spectral signal of sulfated glycopeptides that are minor components (<5%) of glycopeptide

57
mixtures [20], this is the only method that can simultaneously facilitate the MS detection of
acidic species in complex mixtures and discriminate the acidic groups, sulfate and
phosphate.
Acknowledgements
The authors acknowledge the National Institutes of Health for funding (project
number 1 P20 RR17708-01).
2.5 References 1. Petzold, C.J.; Leavell, M.D.; Leary, J.A. Screening and identification of acidic carbohydrates in bovine colostrums by using ion/molecule reactions and Fourier transform ion cyclotron resonance mass spectrometry: specificity toward phosphorylated complexes. Anal. Chem. 2004, 76, 203-210. 2. Bossio, R.E.; Marshall, A.G. Baseline resolution of isobaric phosphorylated and sulfated peptides and nucleotides by electrospray ionization FTICR MS: another step toward mass spectrometry-based proteomics. Anal. Chem. 2002, 74, 1674-1679. 3. Mann, M.; Ong, S.; Grǿnborg, M.; Steen, H.; Jensen, O.N.; Pandey, A. Analysis of protein phosphorylation using mass spectrometry: deciphering the phosphoproteome. Trends Biotechnol. 2002, 20, 261-268. 4. Mclachlin, D.; Chait, B.T. Analysis of phosphorylated proteins and peptides by mass spectrometry. Curr Opin Chem Biol. 2001, 5, 591-602. 5. Nelson, D.L.; Cox, M.M. Biosignaling. In Principles of Biochemistry. W.H.Freeman and Company, Inc: New York, 2004; pp 428-429. 6. Zhou, H.; Watts, J.D.; Aebersold, R. A systematic approach to the analysis of protein phosphorylation. Nat. Biotechnol. 2001, 19, 375-378. 7. Gao, H.; Petzold, C.J.; Leavell, M.D.; Leary, J.A.; Investigation of ion/molecule reactions as a quantification method for phosphorylated positional isomers: an FT-ICR approach. J.Am.Soc.Mass. Spectrom. 2003, 14, 916-924. 8. Nelson, D.L.; Cox, M.M. Biosignaling. In Principles of Biochemistry. W.H.Freeman and Company, Inc: New York, 2004; pp 421-422. 9. Siegel, M.M.; Tabei, K.; Kagan, M.Z.; Vlahov, I.R.; Hileman, R.E.; Linhardt, R.J.

58
Polysulfated carbonhydrates analyzed as Ion-paired complexes with basic peptides and proteins using electrospray negative ionization mass spectrometry. J Mass Spectrom. 1997, 32, 760-772. 10. Witczak, Z.J.; Nieforth, K.A. Carohydrates as new and old targets for future drug design. In Carbohydrates in drug design. Marcel Dekker, Inc.: New York, 1997; pp 1-39. 11. Delcommenne, M.; Kannagi, R.; Johnson, P. TNF-α increases the carbohydrate sulfation of CD44: induction of 6-sulfo N-acetyl lactosamine on N- and O-linked glycans. Glycobiology. 2002, 12, 613-622. 12. Bowman, K.G.; Cook, B.N.; de Graffenried, C.L.; Bertozzi, C.R.; Biosynthesis of L-selectin ligands: sulfation of sialyl lewis x-related oligosaccharides by a family of GlcNAc-6-sulfotransferases. Biochemistry. 2001, 40, 5382-5391. 13. Green E.D.; Baenziger, J.U. Asparagine-linked oligosaccharides on lutropin, follitropin, and tryrotropin. J.Biol.Chem. 1988, 263, 36-44. 14. Bai, X.; Brown, J.R.; Varki, A.; Esko, J.D.; Enhanced 3-O-sulfation of galactose in Asn-linked glycans and Maackia amurenesis lectin binding in a new Chinese hamster ovary cell line. Glycobiology, 2001, 11, 621-632. 15. Chen, S.L.; Huddleston, M.J.; Shou, W.; Deshaies, R.J.; Annan, R.S.; Carr, S.A. Mass spectrometry-based methods for phosphorylation site mapping of hyperphosphorylated proteins applied to Net1, a regulator of exit from mitosis in yeast. Mol. Cell. Proteomics. 2002, 186-187. 16. Tuytten, R.; Lemiere, F.; Dongen, W.V.; Esmans, E.L.; Slegers, H. Short capillary ion-pair high performance liquid chromatography coupled to electrospray (tandem) mass spectrometry for the simultaneous analysis of nucleoside mono, di- and triphosphates. Rapid. Commun. Mass Spectrom. 2002, 16, 1205-1215. 17. Ruse, C.I. Willard, B.; Jin, J.P.; Hass, T.; Kinter, M.; Bond, M. Quantitative dynamics of site-specific protein phosphorylation determination using liquid chromatography electrospray ionization mass spectrometry. Anal. Chem. 2002, 74, 1658-1664. 18. Watkins, M.A.; Price, J.M.; Winger, B.E.; Kenttamaa, H.I. Ion-molecule reactions for mass spectrometric identification of functional groups in protonated oxygen-containing monofunctional compounds. Anal. Chem. 2004, 76, 964-976. 19. Juhasz, P.; Biemann, K. Mass spectrometric molecular-weight determination of highly acidic compounds of biological significance via their complexes with basic polypeptides. Proc. Natl. Acad. Sci. USA. 1994, 91, 4333-4337. 20. Jiang, H; Irungu, J; Desaire, H. “Enhanced Detection of Sulfated Glycosylation Sites in Glycoproteins.” J. Am. Soc. Mass Spectrom. In press.

59
21. Juhasz, P.; Biemann, K. Utility of non-covalent complexes in the matrix- assisted laser desorption ionization mass spectrometry of heparin-derived oligosaccharides. Carbohyr Res. 1995, 270, 131-147. 22. Fromm, J.R.; Hileman, R.E.; Caldwell, E.E; Weiler, J.M.; Linhardt, R.J. Differences in the interaction of heparin with arginine and lysine and the importance of these basic amino acids in the binding of heparin to acidic fibrolast growth factor. Arch. Biochem. Biophys. 1995, 323, 279-287. 23. Svoboda, M.; Meister, W.; Kitas, E.A; Vetter, W. The influence of strongly acidic groups on the protonation of peptides in electrospray MS. J. Mass. Spectrom. 1997, 32, 1117-1123. 24. Harvey, D.J.; Bousfield, G.R. Differentiatin between sulphated and phosphated carbohydrates in low-resolution matrix-assisted laser desorption/ionization mass spectra. Rapid. Commun. Mass Spectrom. 2005, 19, 287-288. 25. Desaire, H.; Leary, J.A. The effects of coordination number and ligand size on the gas phase dissociation and sterochemical differentiation of co-coordinated monosacchrides. Int. J. Mass spectrum. 2001, 209, 171-184. 26. Desaire, H.; Leavell, M.D.; Leary, J.A. Solvent effects in tandem mass spectrometry: Mechanistic studies indicating how a change in solvent conditions and pH can dramatically alter CID spectra. J. Org. Chem. 2002, 67, 3693-3699. 27. Chang, R. Acids and Bases In Chemistry. McGraw-Hill, Inc.: New York, 2005; pp 626-675.

60
Chapter III
Distinguishing phosphorylation and sulfation in carbohydrates and glycoproteins using ion-pairing and mass spectrometry
Reprinted by permission of Elsevier Science from “Distinguishing phosphorylation and sulfation in carbohydrates and glycoproteins using ion-pairing and mass spectrometry” by Zhang, Y.; Jiang, H.; Go, E.P.; Desaire, H. Journal of American Society for Mass Spectrometry, Vol 17, pp1282-1288, copyright © 2006 by the American Society for Mass Spectrometry. 3.1 Introduction
Phosphorylation and sulfation are significant biological modifications that
affect the functions of numerous species ─ carbohydrates,1 proteins,2-5 and
glycoproteins.6-15 For example, tyrosine phosphorylation of proteins in the cytoplasm
plays an essential role in intracellular signaling transduction,2,3 cell cycle control,4
transcription of gene expression,4 cytoskeletal regulation, and apoptosis.3,4 Tyrosine
sulfation results in different functions, including modulation of intracellular protein
transportation, regulation of proteolytic process of proteins, and the alteration of
biological activity of proteins.3, 5-7 Phosphorylation and sulfation present on
carbohydrate moieties of glycoproteins also causes different biological responses.
Changes in sulfation on the glycoproteins have been related to various diseases,
such as diabetes, arthritis, Alzheimer’s disease, and cystic fibrosis etc.8 In addition,
alterations in phosphorylation of carbohydrate moieties on glycoproteins are also
linked to diverse types of diseases including the neuronal ceroid lipofuscinoses
(NCLs) which are hereditary neurodegenerative diseases affecting human beings.9
Moreover, phosphorylated glycoproteins, such as mannose-6-phosphorylated
glycoprotein, can be used as prognostic markers for breast cancer, ovarian cancer,
and prostate cancer, etc.10 Since phosphorylation and sulfation have been

61
associated with significantly different biological functions, developing efficient and
sensitive methods to discriminate these structures is essential for understanding their
roles in protein functions and in diseases.
Traditionally, phosphorylation and sulfation of carbohydrates or proteins are
detected by radiolabeling using 32P or 35S 2,6,7,14-17 isotopes, separation using gel-
filtration chromatography,11-13 high performance liquid chromatography (HPLC),11-13,16-
17 two-dimensional thin-layer chromatography (TLC),7,16 and the detection of these
isotopes in scintillation counting or autoradiography.16 While radiolabeling is effective
at identifying the presence of phosphorylation or sulfation, the detection step must be
followed by additional characterization steps, since determining the presence of the
radioisotopes does not provide any information about the structure of the compound
that was labeled.
In recent years, mass spectrometry has become a powerful analytical tool in
the identification and characterization of biological molecules and their
posttranslational modifications. It is highly sensitive and selective, and provides rapid
means to analyze samples, obviating the need for radiolabeling.16,18 A MS-based
method to discriminate between phosphorylation and sulfation involves reacting
suspected phosphorylated compounds with alkaline phosphatase.16 MS analysis is
applied before and after treatment with the enzyme to detect the loss of phosphate in
the products.16 Although this type of enzymatic assay is effective in differentiation
between phosphorylation and sulfation, its application is limited when analyzing
complex mixtures, which imparts a significant barrier in many biological applications,
especially when the compounds are phosphorylated or sulfated at low levels.16
High resolution MS methods, such as Fourier transform ion cyclotron
62
resonance mass spectrometry (FTICR-MS), have been used to distinguish between
phosphorylated and sulfated compounds based on their slight difference in mass19 or
by their ability to react differently in ion-molecule reactions.20 Other MS methods,
such as matrix-assisted laser desorption/ionization (MALDI) 21 and electrospray
ionization (ESI),22 have been recently reported to distinguish phosphorylation and
sulfation. In MALDI analysis, sulfated and phosphorylated products ionize somewhat
differently, and these differences could potentially be used to distinguish phosphate
and sulfate in an unknown compound.21 In ESI analysis, ion-pairing reagents have
been utilized to complex with singly phosphorylated or sulfated monosaccharides.22
The isobaric ion-pairing complexes can be differentiated in MS/MS experiments
because of their different chemical reactivities. The fundamental study indicates that
this approach is only functional group dependent,22 thus, it could potentially be
effective in discriminating the phosphorylation and sulfation in larger biologically
relevant molecules. If the ion-pairing method, which distinguishes phosphorylated
and sulfated monosaccharides, could be adapted to larger macromolecules, like
oligosaccharides and glycoproteins, this approach would afford a unique and
effective way to distinguish phosphorylation from sulfation. Using ion-pairing to
discriminate these groups is advantageous to other methods because this approach
provides significant advantages that are not related to phosphate/sulfate
discrimination: The ion-pairing method has already been demonstrated to enhance
the signal of sulfated glycopeptides,23 and to facilitate structural elucidation of the
glycan moiety present in glycoproteins.24 Thus, sulfate/phosphate determination
could be accomplished in a synergistic analysis that also enhances sensitivity and
provides additional structural information about glycoproteins.

63
In the work presented here, the ion-pairing approach described previously to
discriminate monosaccharides22 is utilized to identify the phosphorylation and
sulfation present in disaccharides and glycopeptides generated from a proteolytic
digest of oLHα (ovine luteinizing hormone, α-subunit). Difference in chemical
reactivities between these two acidic functional groups observed in the
monosaccharides22 can be preserved when this approach is applied to complex
biomolecules. This is the first study to use the ion-pairing technique in conjunction
with MS/MS to differentiate phosphorylation and sulfation on disaccharides and
glycopeptides. In addition to discriminating the isobaric compounds, this approach
can also simultaneously enhance the mass spectral signal of acidic groups in
complex mixtures by enhancing the ionization efficiency of these functional groups.23
3.2 Materials and Methods
Materials
Phosphorylated or sulfated monosaccharides, disaccharides, and the peptide
Lys-Lys-Lys were purchased from Sigma-Aldrich (St. Louis, MO) and were used
without further purification. Glycopeptides from ovine luteinizing hormone, α-subunit,
(oLHα) were produced in the laboratory of Dr. George Bousfield, Wichita State
University, as described elsewhere.23,25
Ion-pairing experiments
Ion-pair complexes were formed by combining equal volumes of basic
peptide, Lys-Lys-Lys, (henceforth referred to as K3), with solutions of
monosaccharides or disaccharides. Phosphorylated or sulfated carbohydrates and
K3 were dissolved in a minimal amount of HPLC grade water, respectively.

64
Carbohydrate solutions were further diluted with a methanol:water (MeOH:H2O)
mixture (1:1) containing 0.5% acetic acid, to the final concentration of 1 mM. The
peptide, K3, was diluted to 2 mM. Ion-pair complexes were generated by mixing 5 μL
of carbohydrate solution with 5 μL of peptide solution, vortexing and injecting 2 μL of
this mixture into the mass spectrometer. The ion-pair complexes of glycopeptides
with K3 were formed by dissolving 1 μg of the glycopeptide mixture in 3 μL of a 1.25
mM solution of K3. 1-3 μL of this sample were injected into the mass spectrometer.
Mass spectrometry
All the ion-pair complexes were monitored on a Thermo Finnigan LCQ
Advantage quadrupole ion trap mass spectrometer (Thermo, San Jose, CA). A
surveyor MS-pump (Thermo, San Jose, CA) was used to deliver the mobile phase ─
MeOH:H2O mixture (1:1) containing 0.5% acetic acid at a flow rate of 20 �L/min. Ion-
pair complexes were directly introduced to the mass spectrometer, and all the mass
spectra were acquired in the positive ion mode. Electrospray ionization was achieved
by using a spray voltage of 4.0 KV. Nitrogen was used as nebulizing gas, at a
pressure of 20 psi. The capillary temperature was maintained at 230 °C.
Collision-induced dissociation (CID) was performed to obtain structural
information about the ion-pairs. Specifically, for the phosphorylated or sulfated mono-
and disaccharide ion-pair complexes, doubly charged precursor ions were activated
for 30 ms with 20% normalized collision energy. A qz value of 0.25 and an isolation
width of 3 Da were used. For the ion-pairing complexes containing glycopeptides
released from oLHα and the peptide K3, doubly charged precursor ions were
activated with 19% normalized collision energy. All the data were acquired and
analyzed using Xcalibur 1.3 software (Thermo, San Jose, CA).

65
3.3 Results and Discussion
Ion pairing complexes readily form when the ion-pairing reagent is mixed with
sulfated/phosphorylated carbohydrates. An example of the resulting MS data is
shown in Figure 1. Recently, we demonstrated that phosphorylated and sulfated
monosaccharides can be differentiated based on the different characteristic product
ions of singly or doubly charged ion-pairing complexes; see Table 1.22 For doubly
charged complexes, sulfated monosaccharides undergo sulfur-oxygen bond
cleavage while phosphorylated monosaccharides dissociate by disrupting the
noncovalent interaction between the carbohydrate and the ion-pairing reagent. Since
HexNAc’s contain an amide group in their structure, the ligand dissociation can also
be observed for the doubly charged, sulfated ion-pairs. For singly charged
complexes, sulfated complexes undergo covalent cleavage, resulting in the losses of
water, while the phosphorylated complexes undergo cleavage of noncovalent
interactions, resulting in the presence of the singly charged peptide ion [K3+H]+.22
The differences in the fragmentation pattern of these two modifications are induced
by different chemical reactivities resulting from the slightly different pKa values of
these two acidic groups. Since the ion-pairing MS/MS method has been
demonstrated to be functional group specific, it should be useful in identifying
phosphorylation and sulfation in more complex carbohydrates and glycopeptides.

66
Figure 1. (+) ESI-MS data for the phosphorylated disaccharide maltose-1-phosphate (Mal1P) after the addition of the ion-pairing reagent Lys-Lys-Lys (K3). The spectrum shows two ions, [K3+H]+ and [Mal1P+K3+2H]2+.
MS/MS of doubly charged monosaccharide:K3 ion pairs
Owing to the successful application of ion-pairing technique in discriminating
mono- phosphorylated and sulfated carbohydrates, we extend its utility in
discriminating biologically relevant molecules. To this end, several diphosphorylated
and disulfated monosaccharides, along with sulfated and phosphorylated
disaccharides were selected (Figure 2). An initial set of experiments was performed
to establish whether the characteristic product ions in Table 1 are preserved for
diphosphorylated and disulfated monosaccharides, D-glucose-1,6-diphosphate
(Glc1,6P) and N-acetyl-glucosamine 3,6-disulfate (GlcNAc 3,6S). MS/MS data
(Figure 3) show that the mass of doubly charged precursor ions at m/z 372 and m/z
393 are consistent with the expected mass of the ion pairs [Glc1,6P+K3+2H]2+ and
[GlcNAc3,6S+K3+2H]2+, respectively. Two complementary ions [Glc1,6P+H]+ at m/z
341 and [K3+H]+ at m/z 403 correspond to the dissociation of the noncovalent
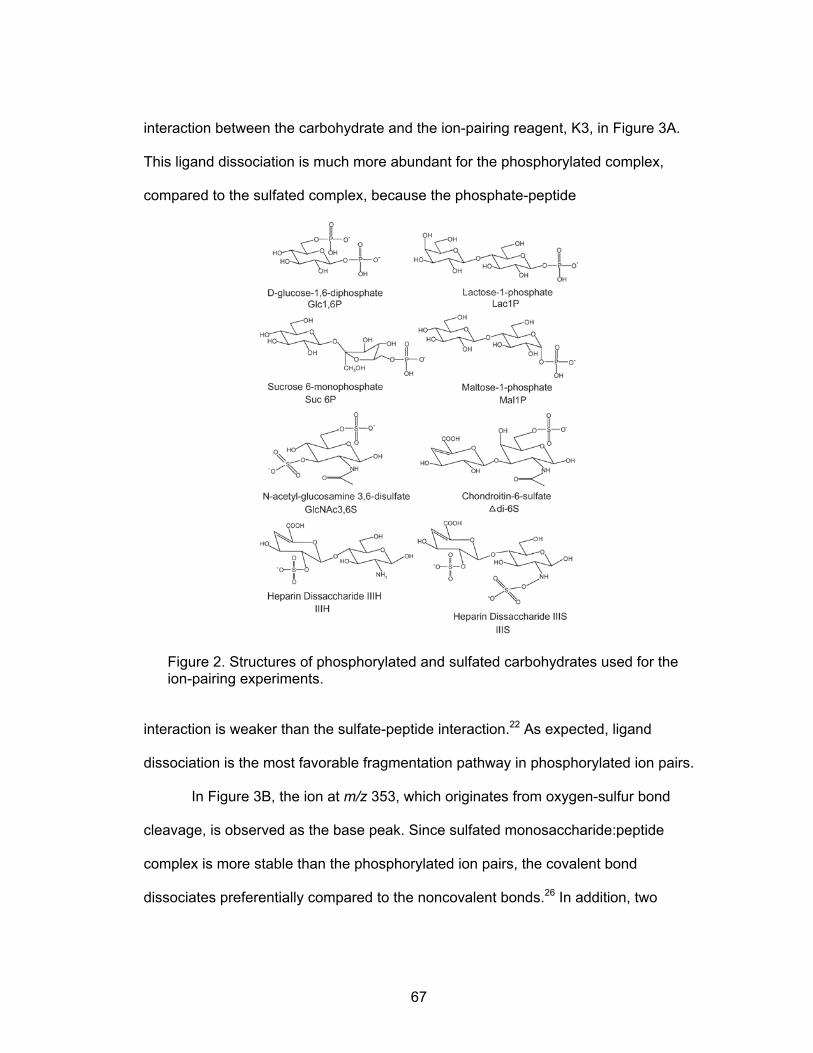
67
interaction between the carbohydrate and the ion-pairing reagent, K3, in Figure 3A.
This ligand dissociation is much more abundant for the phosphorylated complex,
compared to the sulfated complex, because the phosphate-peptide
Figure 2. Structures of phosphorylated and sulfated carbohydrates used for the ion-pairing experiments.
interaction is weaker than the sulfate-peptide interaction.22 As expected, ligand
dissociation is the most favorable fragmentation pathway in phosphorylated ion pairs.
In Figure 3B, the ion at m/z 353, which originates from oxygen-sulfur bond
cleavage, is observed as the base peak. Since sulfated monosaccharide:peptide
complex is more stable than the phosphorylated ion pairs, the covalent bond
dissociates preferentially compared to the noncovalent bonds.26 In addition, two

68
small product ions at m/z 384 and m/z 403 correspond to the ligand dissociation from
the precursor ion. This is due to the presence of the amide group on the sulfated
HexNAc (Table 1), facilitating the proton transfer.22 As a result, the observed
abundant characteristic product ions in Figure 3 indicate that ion-pairing is useful in
discriminating diphosphorylated and disulfated monosaccharides.
Figure 3. (+) ESI-MS/MS data for the doubly charged diphosphorylated or disulfated ion pairs with Lys-Lys-Lys (K3): A) diphosphorylated monosaccharide complex [Glc1,6P+K3+2H]2+ B) disulfated monosaccharide complex [GlcNAc3,6S+K3+2H]2+. In (A), the precursor ion underwent the ligand dissociation upon CID, while (B) shows characteristic ions resulting from oxygen-sulfur bond cleavage. Characteristic ions are marked with a star.
MS/MS of doubly charged disaccharide:K3 ion pairs
Aside from the monosaccharides, the ion-pairing approach is also applied to

69
the structurally more complex disaccharides that are phosphorylated or sulfated.
Three phosphorylated disaccharides, maltose-1-phosphate (Mal1P), lactose-1-
phosphate (Lac1P), sucrose 6-monophosphate (Suc6P) and three sulfated
disaccharides, heparin disaccharide IIIH (IIIH), heparin disaccharide IIIS (IIIS),
chondroitin-6-sulfate (∆di-6S) (Figure 2) were complexed with the peptide, K3.
MS/MS data of two isomeric phosphorylated disaccharide:peptide ion-pairs
(maltose-1-phosphate:K3 and lactose-1-phosphate:K3) in Figure 4 demonstrate that
the fragmentation pattern of these two
Figure 4. (+) ESI-MS/MS data for the doubly charged phosphorylated ion pairs with Lys-Lys-Lys (K3): A) [Mal1P+K3+2H]2+ B) [Lac1P+K3+2H]2+ C) [Suc6P+K3+2H]2+. As expected, abundant ligand dissociation ions are observed in the CID data, which

70
are characteristic for phosphorylated carbohydrates. These ions are marked with a star.
structures is similar when the complexes are subjected to CID. In both spectra
(Figure 4A and B), the precursor ions at m/z 413 correspond to the doubly charged
ions, [Mal1P+K3+2H]2+ and [Lac1P+K3+2H]2+, respectively. Two complementary
ions, [Mal1P+H]+ (Figure 4A) or [Lac1P+H]+ (Figure 4B) at m/z 423 and the peptide
K3 ion at m/z 403, originate from ligand dissociation. Both characteristic ions are
consistent with the expected fragmentation trends described in Table 1. Two
interesting ions at m/z 364 and m/z 325 in Figure 4A and B correspond to the loss of
H3PO4. The loss of H3PO4 only occurs when the carbohydrates are phosphorylated
at the anomeric carbon.22 Thus, the loss of H3PO4 (98 Da) can be used to identify the
position of the phosphate on the structure.22
Figure 4C shows the MS/MS data of the doubly charged phosphorylated
complex [Suc6P+K3+2H]2+. In this spectrum, the parent ion at m/z 413 dissociates
into two singly charged characteristic ions, the peptide ion (K3, m/z 403) and the
protonated disaccharide ion (m/z 423). All the other product ions are related to the
dissociation of the glycosidic bonds and the loss of water. In summary, all the
phosphorylated disaccharide complexes dissociated according to the fragmentation
trends that were established based on the dissociations of phosphorylated
monosaccharide/ion-pair complexes.
The fragmentation of the sulfated disaccharide:peptide ion-pairs was also
investigated, employing the same collisional dissociation (Figure 5). For the doubly
charged complex [IIIH+K3+2H]2+ in Figure 5A, the singly charged ion at m/z 338
corresponds to the characteristic ion resulting from oxygen-sulfur bond cleavage.
Due to the presence of the amine group in the structure of IIIH, two complementary

71
ions, the singly charged peptide ion at m/z 403 and the protonated disaccharide ion
at m/z 418, were observed (Table 1).
Figure 5B shows the MS/MS data of the doubly charged ion-pair complex
[IIIS+K3+2H]2+, at m/z 450.4. Four characteristic ions at m/z 338.0, 417.8, 483.0, and
the base peak ion at m/z 410.6 originate from oxygen-sulfur bond cleavage. With an
amine group present in the carbohydrate portion of the ion-pair complex, the
complementary ions, singly charged peptide [K3+H]+ and protonated disaccharide
[IIIS+H]+, should be observed. The peptide ion is observed at m/z 403.2, but an ion
corresponding to [IIIS+H]+ is not present in the spectrum. Since the peptide ion is
observed, the dissociation reaction obviously occurs, but the ion corresponding to
[IIIS+H]+ probably dissociates by undergoing loss of SO3, producing the secondary
ion at m/z 417.8.
In the MS/MS data of the ion pair complex [∆di-6S +K3+2H]2+ in Figure 5C,
the observed characteristic ion is m/z 380, which originates from oxygen-sulfur bond
cleavage. Also, the expected singly charged ions, protonated sulfated disaccharide
[∆di-6S +H]+ (m/z 460) and the singly charged peptide ion [K3+H]+ (m/z 403), are
present. Thus, from these results it is apparent that the ion-pairing approach in
combination with MS/MS experiments can be used to identify the phosphorylation
and sulfation on doubly charged mono-and disaccharides. The characteristic product
ions are useful in characterizing the acidic functional groups present on
carbohydrates.

72
Table 1. Characteristic product ions used to differentiate phosphate and sulfate in monosaccharides
Doubly charged ion pairs Singly
charged ion pairs
[Hexose+K3+2H]2+ [HexNAc+K3+2H]2+ [Carbohydrates+K3+H]+
Observed Reaction Pathways
Oxygen-sulfur (or oxygen-phosphorus)
bond cleavage
Ligand dissociation
Oxygen-sulfur (or oxygen-
phosphorous) bond
cleavage
Ligand dissociation
Ligand dissociation
Sulfate yes no yes yes* no
Phosphate no yes no yes yes
*: Ligand dissociation in sulfated HexNAcs is caused by the amine group on the carbohydrate.

73
Figure 5. (+) ESI-MS/MS data for the doubly charged sulfated ion pairs with Lys-Lys-Lys (K3): A) [IIIH+K3+2H]2+ B) [IIIS+K3+2H]2+ C) [∆di-6S+K3+2H]2+ As expected, the spectrum shows characteristic ions resulting from oxygen-sulfur bond cleavage. These ions are marked with a star.
Biological application
To test the efficacy of using the ion-pairing approach in identifying functional
groups on larger biomolecules, a highly sulfated glycoprotein hormone oLHα (ovine
luteinizing hormone, alpha subunit) was used as a test case. In a previous study, the
ion pairing approach was used to enhance the signal of mono-, di-sulfated
glycopeptides from this protein.23 Sulfated ion pairs can be readily observed in the

74
ESI-MS analysis when adding the peptide K3 to the complex mixture.23 This is
because the peptide K3 suppresses the signal of neutral glycopeptides to facilitate
the detection of sulfated glycoforms.23 In this study, these glycopeptides are
complexed with the peptide, K3, to demonstrate that the presence of sulfation on the
structure can be confirmed by the ion-pairing method.
Four sulfated glycopeptides, which are present in the glycoprotein and
contain different types of glycans, were selectively ion-paired with K3, and they
formed abundant ion-pairing complexes at m/z 1065.4, m/z 1165.7, m/z 1227.3, and
m/z 1146.3. The structures of the glycopeptides appear in Figure 6. To confirm that
these glycopeptides contain sulfate and not phosphate, the ion-pairing complexes
were subjected to CID experiments. MS/MS data of one of the precursor ions at m/z
1065.4 is shown in Figure 6A. The base peak (m/z 1645.5) is an ion originating from
oxygen-sulfur bond cleavage; this peak confirms that this glycopeptide is sulfated.
Also, the ion at m/z 483.3 corresponding to [K3+SO3+H]+ provides the additional
evidence for the functional group’s assignment. The complementary ions, singly
charged K3 (m/z 403.3) and [M+H-K3]+ (m/z 1725.73), are also expected. These
ions correspond to dissociation of the noncovalent complex, and they are expected
for sulfated HexNAc’s.22
The other three glycopeptides (Figure 6B, 6C, and 6D) also dissociated to
produce the product ions that correspond to oxygen-sulfur bond cleavage. These
ions are at m/z 1848.2 (Figure 6B), m/z 1969.3 (Figure 6C), and m/z 1807.4 (Figure
6D). This implies that all of these glycopeptides are sulfated, which is consistent with
the results obtained from radiolabelling.14,15 The ion at m/z 403, corresponding to the
peptide ion [K3+H]+, is apparent on the spectrum of these glycopeptides. This ion

75
indicates that the ion pairing complexes also undergo ligand dissociation, which is
expected for sulfated HexNAc’s. Hence, the ion-pairing approach is useful to identify
the modifications in complex biomolecules.
Figure 6. (+) ESI-MS/MS data for the doubly charged ion-pair complexes of glycopeptides from oLHα with Lys-Lys-Lys (K3): The characteristic ions marked with a star confirm that the glycopeptides are sulfated. The ions marked with a circle represent the ions that originated from glycosidic bond cleavage.

76
3.4 Conclusions
The differentiation between phosphorylation and sulfation on
monosaccharides, disaccharides, and glycopeptides is accomplished using ion-
pairing in combination with MS/MS experiments. The characteristic product ions of
ion-pairing complexes are applicable in identifying the modification of larger
biomolecules, such as glycopeptide mixtures obtained from ovine luteinizing
hormone proteolytic digest. This is the first example of applying ion-pairing in
discriminating the presence of phosphates and sulfates in complex biomolecules.
This approach also has the added advantages of enhancing the signal of acidic
functional groups in complex biological mixtures 23 as well as elucidating the
structure of carbohydrate moiety of glycopeptides.24 Therefore, this
sulfate/phosphate discrimination strategy can be successfully incorporated into a
single synergistic approach that can be used to structurally characterize
phosphorylated or sulfated glycoproteins, without any separation or enrichment of
the samples prior to analysis.
Acknowledgements The authors acknowledge the NIH for funding (project number 1 P20
RR17708-01 and RO1GM077266)
3.5 References
1. Siegel, M.M.; Tabei, K.; Kagan, M.Z.; Vlahov, I.R.; Hileman, R.E.; Linhardt, R.J. Polysulfated carbohydrates analyzed as ion-paired complexes with basic peptides and proteins using electrospray negative ionization mass spectrometry. J Mass Spectrom. 1997, 32, 760-772.

77
2. Mann, M.; Ong, S.; Gronborg, M.; Steen, H.; Jensen, O.N.; Pandey, A. Analysis of protein phosphorylation using mass spectrometry: deciphering the phosphoproteome. Trends Biotechnol. 2002, 20, 261-268.
3. Rappsilber, J.; Steen, H.; Mann, M. Labile sulfogroup allows differentiation of sulfotyrosine and phosphortyrosin in peptides. J. Mass. Spectrom. 2001, 36, 832-833.
4. Hunter, T. The croonian lecture 1997. The phosphorylation of proteins on tyrosine: its role in cell growth and disease. Phil. Trans. R. Lond. B. 1998, 353, 583-605.
5. Huttner, W.B. Protein tyrosine sulfation. Trends Biochem. Sci. 1987, 12, 361-363.
6. Delcommenne, M.; Kannagi, R.; Johnson, P. TNF-α increases the carbohydrate sulfation of CD44: induction of 6-sulfo N-acetyl lactosamine on N- and O-linked glycans. Glycobiology 2002, 12, 613-622.
7. Bai, X.; Brown, J.R.; Varki, A.; Esko, J.D. Enhanced 3-O-sulfation of galactose in Asn-linked glycans and Macckia amurenesis lectin binding in a new Chinese hamster ovary cell line. Glycobiology 2001, 11, 621-632.
8. Xiong, L.; Andrews,D.; Regnier, F. Comparative proteomics of glycoproteins based on lectin selection and isotope coding. J. Proteome Res. 2003, 2, 618-625.
9. Sleat, D.E.; Sohar, I.; Pullarkat, P.S.; Lobel, P.; Pullarkat, R.K. Specific alterations in levels of mannose-6-phosphorylated glycoprotiens in different neuronal ceroid lipofuscinoses. Biochem. J. 1998, 334, 547-551.
10. Lobel, P.; Karel, R. Assay for glycoproteins containing mannose-6-phosphate. PCT Int. Appl. 1997, 60pp.
11. Harvey, D.J. Structural determination of N-linked glycans by matrix-assisted laser desorption/ionization and electrospray ionization mass spectrometry. Proteomics. 2005, 5, 1774-1786.
12. Harvey, D.J. Fragmentation of negative ions from carbohydrates: part 1. use of nitrate and other anionic adducts for the production of negative ion electrospray spectra from N-linked carbohydrates. J. Am. Soc. Mass Spectrom. 2005, 16, 622-630.
13. Wheeler, S.F.; Harvey, D.J. Extension of the in-gel release method for structural analysis of neutral and sialylated N-linked glycans to the analysis of sulfated glycans: application to the glycans from bovine thyroid-stimulating hormone. Anal. Biochem. 2001, 296, 92-100.
14. Green, E.D.; Baenziger, J.U. Asparagine-linked oligosaccharides on lutropin, follitropin, and tryrotropin. I. Structure elucidation of the sulfated and sialylated

78
oligosaccharides on bovine, ovine, and human pituitary glycoprotein hormones. J. Biol. Chem. 1988, 263, 25-35. 15. Green, E.D.; Baenziger, J.U. Asparagine-linked oligosaccharides on lutropin, follitropin, and tryrotropin. II. Distributions of sulfated and sialylated oligosaccharides on bovine, ovine, and human pituitary glycoprotein hormones. J. Biol. Chem. 1988, 263, 36-44.
16. Chen, S.L.; Huddleston, M.J.; Shou, W.; Deshaies, R.J.; Annan, R.S.; Carr, S.A. Mass spectrometry-based methods for phosphorylation site mapping of hyperphosphorylated proteins applied to Net1, a regulator of exit from mitosis in yeast. Mol. Cell Proteomics. 2002, 1, 186-196.
17. Annan, R.S.; Carr, S.A. Phosphopeptide analysis by matrix-assisted laser desorption time-of-flight mass spectrometry. Anal.Chem. 1996, 68, 3413-3421.
18. Oda, Y.; Nagasu, T.; Chait, B.T. Enrichment analysis of phosphorylated proteins as a tool for probing the phosphoproteome. Nat. Biotechnol. 2001, 19, 379-382.
19. Bossio, R.E.; Marshall, A.G. Baseline resolution of isobaric phosphorylated and sulfated peptides and nucleotides by electrospray ionization FTICR MS: another step toward mass spectrometry-based proteomics. Anal. Chem. 2002, 74, 1647-1679. 20. Petzold, C.J.; Leavell, M.D.; Leary, J.A. Sreening and identification of acidic carbohydrates in bovine colostrum by using ion/molecule reactions and Fourier transform ion cyclotron resonance mass spectrometry: specific toward phosphorylated complexes. Anal. Chem. 2004, 76, 203-210.
21. Harvey, D.J.; Bousfield, G.R. Differentiation between sulphated and phosphated carbohydrates in low-resolution matrix-assisted laser desorption/ionization mass spectra. Rapid Commun. Mass Spectrom. 2005, 19, 287-288. 22. Zhang, Y.; Go, E.P.; Jiang, H.; Desaire, H. A novel mass spectrometric method to distinguish isobaric monosaccharides that are phosphorylated or sulfated using ion-pairing reagents. J. Am. Soc. Mass Spectrom. 2005, 16, 1827-1839. 23. Jiang, H.; Irungu, J.; Desaire, H. Enhanced detection of sulfated glycosylation sites in glycoproteins. J. Am. Soc. Mass Spectrom. 2005, 16, 340-348.
24. Irungu, J.; Dalpathado, D.S.; Go, E.P.; Jiang, H.; Ha, H.; Bousfield, G.R.; Desaire, H. Method for characterizing sulfated glycoproteins in a glycosylation site-specific fashion, using ion pairing and tandem mass spectrometry. Anal. Chem. 2006, 78,1181-1190.
25. Jiang, H.; Butnev, V.Y.; Bousfield, G.R.; Desaire, H. Glycoprotein profiling by electrospray mass spectrometry. J. Am. Soc. Mass Spectrom. 2004, 15, 750-758.

79
26. Loo, J.A. Studying noncovalent protein complexes by electrospray ionization mass spectrometry. Mass Spectrom. Rev. 1997, 16, 1-23.

80
Chapter IV
Maximizing coverage of glycosylation heterogeneity in MALDI-MS analysis of glycoproteins with up to 27 glycosylation sites
“Maximizing coverage of glycosylation heterogeneity in MALDI-MS analysis of glycoproteins with up to 27 glycosylation sites” by Zhang, Y.; Go, E.P.; Desaire, H. Submitted to Analytical Chemistry. 4.1 Introduction
Protein glycosylation is one of the essential post-translational modifications
(PTMs), and it is involved in various biological processes.34-37, 39, 46, 58 Glycosylation
can modify protein properties such as stability, solubility,34-38, 45 the protein’s binding
affinity to the other biomolecules,34-38 and it can also affect inter-, intra-cell
signaling.34-38, 59 Studying glycosylation is important because most proteins secreted
from tissues are glycosylated and many plasma protein biomarkers are also
glycosylated.45, 60, 61 Alteration in the glycan structures or pattern on glycoproteins
has been implicated in several disease states, such as cancer,46, 58, 61 Alzheimer’s
disease,48 rheumatoid arthritis,50 and chronic obstructive pulmonary disease,62 etc.
Therefore, characterizing the glycans and monitoring the changes of glycan profiles
are important to elucidate their biological significance and discern their roles in the
disease process. However, the global mapping and comprehensive analysis of
glycosylation remains a challenging task due to heterogeneous populations of
glycans present on glycoproteins.54 As a result, maximizing the coverage of
glycosylation heterogeneity on glycoproteins is important, especially for the biological
variants that typically occur at low abundance.54
There are two basic approaches to analyzing glycosylation on proteins, either
cleaving the glycans or analyzing glycopeptides. For glycan analysis, several
analytical methodologies have been employed, such as high performance anion-

81
exchange chromatography (HPAEC),63 capillary electrophoresis (CE),64 1H nuclear
magnetic resonance spectroscopy (1H NMR)63, microarray construction,65 and mass
spectrometry34, 38, 39, 66-68. These techniques involve enzymatic or chemical release of
glycans from glycoproteins, followed by a separation method then detection.
Although these approaches have advantages to distinguish between isomeric
structures, glycosylation site-specific information is lost, unless the glycosylation
sites are separated prior to glycan release.69
Mass spectrometry can also provide glycosylation site-specific information by
conducting glycopeptide-based analysis,46, 49, 58, 61, 70-74 wherein the glycan and its
attachment site to the protein can be elucidated in the same experiment.74 This
glycosylation site-specific information is useful in elucidating functional properties of
glycoprotein.74 Typically, glycopeptide-based MS analysis entails enzymatic
cleavage of glycoproteins with an endoprotease, followed by a separation technique
and mass analysis. Due to the high degree of heterogeneity of glycans on
glycopeptides, the mass spectral signals of glycopeptides are suppressed by the
strongly ionizing peptides, when both species co-exist in the complex mixture.39, 45, 51,
58 As a result, separation and/or enrichment approaches are usually employed to
isolate and detect glycopeptides in proteolytic digests.
At present, several chromatographic and/or enrichment methods have been
used for glycopeptide-based MS analysis, including reverse-phase HPLC
fractionation,75, 76 lectin-based affinity chromatography,70, 71 and hydrophilic affinity
methods that use porous graphitized carbon 45, carbohydrate-based resins, 46, 74 and
hydrophilic interaction liquid chromatography,72, 77 etc. Among these methods,
reverse phase HPLC coupled with electrospray ionization (ESI) mass spectrometry

82
has been widely used.75, 76 Lectin–based affinity chromatography is another prevalent
approach to isolate and detect the glycopeptides. This method relies on the binding
specificity of glycan structures,74, 78, 79 hence, the glycopeptide profile of the enriched
fraction is dictated by the type of lectin column used for the enrichment.74 The recent
introduction of hydrophilic affinity methods have provided a promising approach to
isolate glycopeptides by taking advantage of the hydrophilic interactions between the
glycans and resin materials,77 thereby, revealing the glycan profiles on glycoproteins.
Although all of these separation and/or enrichment approaches have been utilized to
improve the glycopeptide detection in the complex digest mixtures, there is no
consensus in the field as to which sample separation/enrichment approaches best
maximize coverage of glycosylation heterogeneity.
Herein, we present an in-depth study of maximizing glycosylation coverage in
terms of the number of glycosylation sites detected and their corresponding
glycoforms, by optimizing all the experimental steps in the glycopeptide-based
analysis, including sample preparative approaches, mass spectral techniques, and
data analysis strategies. Specifically, for sample preparation, a comparative analysis
has been performed on several approaches, such as reverse phase HPLC
fractionation, lectin-based affinity enrichment, and hydrophilic affinity method using
carbohydrate-based resin beads – Sepharose®. All preparation methods are
performed in combination with MALDI-TOF/TOF mass spectrometry, to determine an
efficient approach for maximizing glycosylation coverage in glycan profiling. MALDI
mass spectrometry was the chosen detection method due to its simplicity, speed,
high sensitivity, and selectivity.34, 38, 67, 68
Three well-characterized glycoproteins that include immunoglobulin G (IgG),

83
transferrin, and α1-acid glycoprotein (AGP) were used as model glycoproteins in this
study. These glycoproteins vary in terms of the number of glycosylation sites (from
one to five) and the diversity in their glycan profiles, from mainly neutral glycans
(IgG) to highly sialylated glycans (transferrin, AGP). Based on comparative analysis
of sample preparation approaches, the efficacy of each sample preparative method
is evaluated and the pros and cons for each method are described.
In addition to addressing the issue of which sample preparation method best
enhances glycosylation coverage, several other approaches are implemented in our
comprehensive strategy of increasing glycosylation coverage. To optimize mass
spectral signal of the glycopeptides, MALDI analysis was performed in both positive
and negative ion mode to obtain the maximum glycan profiles for each glycoprotein.
To increase the number of assigned peaks in the mass spectra, methods were
implemented that identify glycopeptides that contain modifications on peptide
moieties ─ such as conversion of an N-terminal glutamine into pyroglutamic acid,
and deamination of alkylated cysteines on N-terminus. This was accomplished by
enhancing the functionality of GlycoPep DB,80 a publicly available data analysis tool,
built and administered by our research group, and used for all the data analysis
completed in this study.
Finally, PNGase F was used to cleave off the glycans in order to enhance
glycosylation site coverage. Upon releasing the glycans from glycopeptides, the
peptide moiety bearing the glycosylation site can be detected. This is useful because
sometimes the presence of weakly ionizing glycopeptides cannot be detected when
they co-elute with more strongly ionizing species; so cleaving the glycans off allows
for the detection of the peptides that were glycosylated. While the glycan moieties

84
themselves are not identified in this technique, data about glycosylation site
occupancy is obtained, which is another important aspect of maximizing
glycosylation coverage on glycoproteins.
As a demonstration of the effectiveness of the comprehensive approach we
developed, the strategies were applied to the very heavily glycosylated HIV envelope
protein ― JR-FL gp140 ΔCF, which contains 27 potential glycosylation sites.81 By
optimizing each experimental step in glycopeptide-based analysis, over 85%
glycosylation coverage was achieved on JR-FL. This study demonstrates that our
strategies significantly improve the glycopeptide detection and maximize coverage of
glycosylation heterogeneity on glycoproteins.
4.2 Experimental Section
Materials and reagents
Human serum glycoproteins (IgG, transferrin, AGP), PNGase F from
Elizabethkingia meningosepticum, urea, dithiothreitol (DTT), iodoacetamide (IAA),
acetonitrile, sodium phosphate, sodium chloride, formic acid, trifluoroacetic acid
(TFA), Trizma hydrochloride, Trizma base, ammonium bicarbonate, N-acetyl-D-
glucosamine, 2,5-dihydroxybenzoic acid (DHB), α-cyano-4-hydroxycinnamic acid
(CHCA), and Sepharose® CL-4B were all purchased from Sigma (St. Louis, MO).
The HIV envelope glycoprotein JR-FL gp140 ∆CF was expressed and purified in the
laboratory of Dr. Barton F. Haynes, Duke Human Vaccine Research Institute
(Durham, NC), using the method described in liturature81. Concanavilin A (ConA)
TopTips® and hypercarb NuTips® were purchased from Glygen Corp (Columbia,
MD). Proteomics grade trypsin was obtained from Promega (Madison, WI). Milli-Q

85
water was obtained from a Millipore filtration system (Billerica, MA).
Glycoprotein digestion
Glycoproteins (100 μg-1mg) were dissolved in 100 μL of 100 mM Tris-HCl
buffer with 6M urea, pH 8.0. Protein samples were reduced with 15 mM DTT and
alkylated with 25 mM IAA in dark for 1 hour at ambient temperature, respectively.
Excess IAA was removed with the addition of DTT. Prior to adding trypsin, the
solution was diluted to less than 1M urea. Typsin was added at an enzyme-to-
substrate ratio of 1:30 (w/w). The solution was incubated overnight at 37 °C and was
stopped by the addition of 1 μL concentrated acetic acid.
Hydrophilic affinity method for glycopeptide enrichment
This method follows a literature protocol3, 27 with slight modification, which
optimizes glycopeptide detection. About 200 μg of the digest was added to a
microcentrifuge tube packed with 20 μL Sepharose®. Then 1 mL of organic solvent
mixture containing butanol:ethanol:water (5:1:1 by volume) was added to the digest:
Sepharose® mixture. The resulting mixture was gently mixed for 45 min and then
centrifuged for 5 min. The supernatant was removed and the pellet was washed
twice with the same organic solvent. The glycopeptides were extracted by incubating
the pellet in 1 mL ethanol:water (1:1 v/v) for 45 min. The samples were vortexed then
centrifuged and the supernatant was transferred to another microcentrifuge tube.
The same extraction procedure was repeated twice. The combined supernatant was
completely dried in the Labconco centrivap cold trap (Kansas City, MO) and
reconstituted with 100 μL of deionized water prior to MALDI analysis or HPLC
fractionation.
Lectin affinity method for glycopeptide enrichment

86
Con A packed TopTips® and hypercarb NuTips® were utilized according to
the protocol recommended by the manufacturer. Briefly, Con A packed TopTips®
were conditioned by adding 50 μL of loading buffer, 100 mM Na3PO4, 0.2M NaCl, pH
7.0. Approximately 50 μL of digest mixture was loaded on the Con A packed bed.
The eluate was reloaded 5 times. The packed bed was washed with 50 μL of
washing buffer, 50 mM Na3PO4, 0.2M NaCl pH 7.0, for 2-3 times. The sample was
eluted by the addition of elution buffer, 0.3M N-acetyl-D-glucosamine in 50 mM
Na3PO4, 0.2M NaCl, pH 7.0. The same sample releasing procedure was repeated 3
times. The combined eluates were concentrated to 20 μL in the Labconco centrivap
cold trap (Kansas City, MO) and desalted using hypercarb NuTips®.
Desalting by hypercarb NuTips®
Before loading the sample, the hypercarb NuTips® were conditioned by
aspirating 20 μL of the releasing solution, 40% acetonitrile with 0.05% TFA, followed
by the binding solution, water with 0.05% TFA. The concentrated eluate from Con A
packed TopTips® were loaded on the hypercarb NuTips® by aspirating 50 times to
allow the maximum absorption. Then the hypercarb NuTips® were washed with 20
μL binding solution ~10 times, and the samples were eluted by expelling the
releasing solution ~50 times. The same releasing procedure was repeated 3 times.
Then the combined eluate was evaporated to 10 μL prior to MALDI analysis.
Reverse phase HPLC fractionation
The tryptic digest mixtures were desalted and separated on a Shimadzu
HPLC system. The mobile phase A was water with 0.1% formic acid. Mobile phase B
was acetonitrile with 0.1% formic acid. About 20 μL of the sample was injected and
separated on a C18 column (150×4.6mm, 5 μM, Alltech, Deerfield, IL) with flow rate

87
1mL/min at 40 °C. The fractions were collected every minute manually. Since each
glycoprotein has different glycan structures and peptide sequences, different
gradients were used to optimize the separation. Human IgG: initial conditions were
5% B for 3 min, followed by a linear gradient to 40% B by 15 min, maintaining 40% B
for another 15 min, then ramped to 85% B by 60 min. Human transferrin and JR-FL
gp140 ∆CF: the gradient was started with 1% B and a linear gradient to 40% B was
achieved in 50 min, then ramped to 90% B in 60 min.82 Human AGP: the column was
equilibrated at 5% B for 3 min. A linear gradient to 20% B in 10 min were achieved,
followed by 40% B in 60 min, then up to 100% B in 64 min.58 The collected fractions
were dried on centrivap and reconstituted with 10 μL water, prior to MALDI analysis.
Deglycosylation of tryptic glycopeptides by PNGase F
PNGase F enzyme solution (≥ 500 units/mL) was prepared by adding 100 μL
water into the sample vial of 50 units. Each glycopeptide fraction collected from
HPLC fractionation was reconstituted with 25 μL of 20 mM ammonium bicarbonate
buffer, pH 8.0, and treated with 2 – 4 μL of PNGase F for 3 hours at 37 °C. The
reaction was stopped by heating to 100 °C for 10 minutes and the sample was
directly spotted on the MALDI target plate.
MALDI-TOF analysis and data interpretation
The matrix used in MALDI analysis was the combination of DHB and CHCA.
DHB and CHCA were initially dissolved in 70% ACN/ H2O to the final concentration
of 20 mg/mL, respectively. The matrix was prepared by mixing DHB and CHCA (1:1
V/V). The sample was mixed with the matrix solution (1:1 V/V) and 1.5 μL was
spotted on a stainless steel MALDI target plate (Applied Biosystems, Foster City,
CA) and air-dried. MS and MS/MS spectra were acquired on an Applied Biosystems

88
4700 proteomics analyzer. The samples were irradiated by a 355 nm Nd-YAG laser
at 200 Hz. The acceleration voltage was 25 kV. Each mass spectrum was generated
by averaging 3000 laser shots. In the positive ion mode, the instrument was operated
in the reflectron mode. In the negative ion mode, the spectra were obtained in the
linear mode. All the data were processed in Data Explorer version 4.5 (Applied
Biosystems).
The glycopeptide composition was assigned by using a glycopeptide web-
based tool (Glycopep DB).80 The primary sequence of two glycoproteins human IgG
(accession number AAA02914) and transferrin (accession number NP_001054) were
obtained from National Center for Biotechnology Information (NCBI). The peptide
sequence of human AGP (accession number P02763) and JRFL gp 140 ∆CF was
obtained from Swiss-Prot and the literature,81 respectively. Theoretical tryptic digest
peptide sequences containing glycosylation sites were determined from a home-built
glycopeptide database (Glycopep ID) by inputting primary sequence of the
glycoproteins.83 MALDI-MS/MS data were used to confirm both peptide and glycan
compositions of glycopeptides from the tryptic digest. Specifically, peptide
composition was identified by two characteristic ions in the MALDI-MS/MS spectrum,
0,2X ([peptide+83+H]+) and Y1α ([peptide+HexNAc+H]+)71, corresponding to a cross-
ring cleavage and a glycosidic cleavage, respectively. The peptide composition was
also confirmed by internal ions observed on MS/MS spectra and deglycosylation of
glycopeptide HPLC fractions using PNGase F. Glycan composition was initially
assigned by using the glycopeptide web-based tool (GlycoPep DB)80 and further
confirmed with MALDI-MS/MS data.

89
4.3 Results and Discussion
Overview of the analytical protocols
Aiming to determine the best strategy in maximizing glycosylation coverage
on the glycoproteins, and subsequently, heavily glycosylated proteins like the HIV
glycoprotein env, all the aspects of the glycopeptide-based analysis, such as sample
preparation, mass spectral techniques and data analysis, have been optimized for
each glycoprotein used in this study. Specifically, for optimizing the sample
preparation approaches, a systematic comparison was conducted on reverse phase
HPLC fractionation, lectin-based affinity, and hydrophilic affinity methods. Each
method was evaluated in terms of the number of glycosylation sites detected and the
glycopeptide coverage on three model glycoproteins. Figure 1 provides the
experimental template used in this study. Model glycoproteins were first subjected to
proteolytic digestion followed by either HPLC fractionation or/and enrichment
methods prior to MALDI-MS analysis. To facilitate the data analysis, model
glycoproteins were digested with trypsin. All three methods were initially applied to
IgG, which contains one glycosylation site and a corresponding N-linked
glycosylation profile consisting of mainly neutral glycans. Since no sialylated
glycopeptides were detected on human IgG in the negative ion mode, the MALDI-MS
data presented only includes analysis in the positive mode for this protein. After
assessing the differences between glycopeptide enrichment methods using IgG, the
applicability of each method was determined for acidic glycoproteins with two
(transferrin) and five (AGP) glycosylation sites.

90
Figure 1. Analytical protocols used to separate or/and enrich glycopeptides of model glycoproteins.
Comparison of three sample preparation methods on human IgG
a) Hydrophilic affinity method using Sepharose®
The hydrophilic affinity enrichment approach used to separate glycopeptides
from proteolytic digest relies on the hydrogen bonding interaction between the
glycans of glycopeptides and the carbohydrates on the resin material –
Sepharose®.46, 74 This interaction is sufficient to bind glycopeptides allowing facile
extraction of glycopeptides from the complex digest mixture. (+) MALDI-MS analysis
of the glycopeptide enriched sample of IgG with Sepharose® in Figure 2A shows the
glycopeptide profile of glycosylation site (Asn326) on the CH2 region of heavy chain.
Seven glycan structures were observed and mainly consist of core fucosylated
biantennary complex structures with or without a bisecting N-acetylglucosamine,
consistent with the structures reported

91
in literature.84 In addition to heterogeneity in the glycosylation, heterogeneity in the
peptide portion was also observed. Two peptide sequences encompassing the same
glycosylation site, corresponding to EEQYNSTYR and EEQFNSTFR, were detected.
b) Lectin affinity isolation using Concanavalin A (Con A) TopTips®
Lectins are plant proteins with binding specificities for specific glycan structures.71, 85
Among the ten known types of lectins, Con A is one of the commonly used lectins for
glycoprotein enrichment.71, 85 Con A selectively binds to N-linked hybrid, high-
mannose, or biantennary complex type glycans.71, 86 In this experiment, Con A
TopTips® were used for the selective enrichment of IgG glycopeptides; see Figure
2B. Glycopeptides observed in (+) MALDI-MS measurement of the lectin enriched
samples contain glycans with biantennary complex type and high mannose
structures. Particularly, the glycopeptide peak observed at m/z 2892.0605
corresponds to the high mannose glycan structure. Compared with the (+) MALDI-
MS data in Figure 2A, only a small portion of glycopeptides with a bisecting N-acetyl-
glucosamine were observed in Figure 2B because these glycopeptides have low
affinity for Con A.46 Specifically, four glycopeptide peaks at m/z 2805, 2837, 2967,
and 2999 observed in Figure 2A are corresponding to the glycopeptides with a
bisecting N-acetyl-glucosamine. While only two peaks at m/z 2805, and 2967 arising
from glycopeptides with a bisecting N-acetyl-glucosamine are present in Figure 2B.
Using this sample preparation method, MALDI-MS measurement generated
glycopeptides with six glycan structures consisting of fucosylated and non-
fucosylated biantennary complex type with or without a bisecting N-acetyl-
glucosamine and one high mannose glycan structure. Since Con A binds to
glycoproteins with specific glycan structures, the selective enrichment of

92
Figure 2. (+) MALDI-TOF data of glycopeptides from human IgG separated or/and

93
enriched by different approaches: (A) hydrophilic affinity method with Sepharose®, (B) Con A TopTips®; (C) reverse phase HPLC fractionation. 2C shows the best quality data (i.e. S/N ratio). Postulated glycopeptide structures are shown. These are based on compositional data and biological precedence; other isomeric structures would also be possible. glycopeptides bearing glycans that have strong affinity to Con A was observed.
Because this method is effective in selectively enriching this subset of glycopeptides,
the lectin enrichment method using Con A is not suitable when the goal of the
analysis is to detect the complete glycosylation profile of the protein. One obvious
disadvantage of single lectin-based purification methods is that they bias the results
towards whatever carbohydrate structures they have strongest affinity for, as
observed in Figure 2. In addition, we found that the Con A TopTips® suffered from
very poor run-to-run reproducibility, while reproducible profiles were much easier to
obtain using the other methods.
c) Reverse phase HPLC fractionation
In RP-HPLC fractionation, proteolytic digests were subjected to a
chromatographic separation using a C18 column to resolve glycopeptides in the
digest into fractions. Each collected fraction was dried and reconstituted with H2O
prior to analysis. Glycopeptides from the IgG tryptic digest were eluted at 6, 7, 9, and
10 min. Figure 2C represents the (+) MALDI-MS data of the glycopeptide fraction
eluting at 6 min. Compared to the (+) MALDI-MS data obtained from the two
enrichment methods in Figure 2A and 2B, MALDI-MS data from HPLC fractionation
was far superior with respect to the quality of the data (i.e, better signal-to-noise
(S/N) ratio) and the total number of glycopeptides observed. A summary of the
glycan compositions for all glycopeptide fractions is shown in Table 1. Overall,
thirteen glycan structures were observed from HPLC fractionation. In addition,

94
Table 1. (+) MALDI-MS data of human IgG purified by different methods
*Peptide sequence (positions 322-330) with no miscleavages; Mod: modification on peptide moieties; For: Formylation; F6: HPLC fraction 6
95
glycopeptide with peptide sequences, EEQYNSTYR and EEQFNSTFR, are better
resolved in the HPLC experiment, and formylation occurs on these peptide moieties
during fractionation. This modification is discussed in a later section of the
manuscript. Based on these results, MALDI-MS analysis of the HPLC fractionated
IgG glycopeptides yielded a more comprehensive glycan profile, compared to
Sepharose® and Con A enrichment schemes; see Table 1. Thus, reverse phase
HPLC fractionation was proven to be an efficient approach for maximizing coverage
of glycosylation heterogeneity of glycoproteins using MALDI analysis.
Sample preparation methods for human transferrin
Having demonstrated the strength and weaknesses of each method on a
glycoprotein with one glycosylation site, the applicability of these methods was tested
on two glycoproteins with more than one glycosylation site, transferrin and AGP.
Human transferrin contains two glycosylation sites with highly sialylated biantennary
complex-type glycans.87 Compared with human IgG, identifying glycan structures of
transferrin in MALDI-MS analysis is more challenging because it is sialylated. Sialic
acids are labile and ionize less efficiently than neutral glycans, in the positive ion
mode.88 To detect the sialic acids on transferrin, MALDI data was acquired mainly in
negative ion mode. From the information obtained with IgG, the sample preparation
approach employed for transferrin were hydrophilic affinity method using Sepharose®
and reverse phase HPLC fractionation. Because the glycopeptide coverage of lectin-
based affinity enrichment largely depends on the lectin-glycan binding specificity, the
application of this approach to profiling glycosylation on transferrin was not
successful.
a) Hydrophilic affinity method using Sepharose®

96
Glycopeptides generated from the tryptic digest of transferrin were subjected to
hydrophilic affinity enrichment followed by (-) MALDI-MS analysis and the data is
shown in Figure 3A. Two glycosylation sites (Asn413 and Asn611) are detected, which
contain sialylated glycans and peptide compositions,
QQQHLFGSN611VTDCSGNFCLFR and CGLVPVLAENYN413K. Both of these
peptides were modified during the proteolytic digestion. In the case of tryptic peptide,
QQQHLFGSN611VTDCSGNFCLFR, the modification arises from the formation of
pyroglutamic acid on N-terminus. For the tryptic peptide composition,
CGLVPVLAENYN413K, the alkylated cysteine residue was deaminated to form 5-oxo-
thiomorpholine-3-carboxylic acid.73, 89 These modifications are previously
documented in the literature.73, 89 Two major glycan structures observed in Figure 3A
were bi- and mono-sialylated complex-types, illustrating that this enrichment method
is a practical approach in the identification of sialylated glycopeptides. In positive ion
mode, no new glycopeptides were detected (data not shown). Some of the sialylated
glycopeptides were observed; however, the signal was stronger in negative ion
mode, as expected.
b) Reverse phase HPLC fractionation
For comparison, reverse phase HPLC fractionation was also evaluated in the
analysis of glycopeptides generated from transferrin. MALDI-MS analysis of the
glycopeptide fractions eluting at 25 and 28 min in Figure 3B and 3C show two
glycosylation sites (Asn413 and Asn611) with peptide compositions,
QQQHLFGSN611VTDCSGNFCLFR and CGLVPVLAENYN413K. The modifications on
these peptides comprise deamination of glutamine, alkylated cysteine on the N-
terminus,73, 89 and formylation. The peptide sequences and modifications were

97
Figure 3. (-)MALDI-TOF data of glycopeptides from human transferrin separated or/and enriched by two methods: (A) hydrophilic affinity method with Sepharose®, (B)

98
reverse phase HPLC fraction eluting at 25 min (C) reverse phase HPLC fraction eluting at 28 min. Several modifications are present on peptide portion of the glycopeptides. *Peptide mod: modification on the peptide moieties. PyroCMC: deamination of alkylated cysteine of N-terminus; PyroQ: pyroglutamic acid of N-terminus of peptide. For: formylation of amino groups of the peptide. confirmed using several approaches, including identifying peptide-based ions in
MS/MS data and deglycosylation of glycopeptide HPLC fractions using PNGase F,
which is discussed in a later section of this manuscript. In addition to glycopeptides
with sialylated glycans present in the spectra, neutral glycans are also observed.
Specifically, glycopeptide peaks observed at m/z 3081, 3098, and 3109 in Figure 3B
and glycopeptide peaks observed at m/z 4120, and 4137 in Figure 3C correspond to
glycopeptides with neutral glycans. Compared to Figure 3A, the relative abundance
of di-sialylated glycopeptides decrease dramatically in HPLC fractionation and
neutral glycopeptides are present on the spectra; see Figure 3B and 3C. According
to the glycan structures of human transferrin reported in literature,87 over 90%
glycans are di-sialylated biantennary complex type. Therefore, the neutral
glycopeptides observed on Figure 3B and 3C could arise from the decomposition of
the glycopeptides bearing di-sialic acids in the acidic HPLC fractionation, in which
the sialic acids are hydrolyzed, and non-sialylated glycopeptides are formed.
Although more glycopeptide peaks are observed in the HPLC fractionation for human
transferrin, decomposition of sialylated glycopeptides were also present in the
experiment. In addition, since glycopeptides can be better resolved in the HPLC
fractionation, spectra with better S/N ratio were obtained in HPLC experiments,
compared with the Sepharose® enrichment method.
Sample preparation methods for human α1-acid glycoprotein
From the results obtained from IgG and transferrin, all three methods were

99
able to detect all the glycosylation sites. While this is beneficial in obtaining
glycosylation site-specific information, the glycopeptide coverage obtained from each
method was not the same. HPLC fractionation provided better glycopeptide
coverage. Accordingly, HPLC fractionation was used to characterize the
glycosylation on AGP. AGP is a structurally complex glycoprotein with five
glycosylation sites (Asn15, Asn38, Asn54, Asn75 and Asn85). The glycan profile on the
glycosylation sites consist of highly sialylated bi-, tri- and tetra-antennary complex-
type structures.90, 91
For (+) MALDI-MS analysis of the HPLC fractions of AGP glycopeptides, see
Table 2A; only a few glycopeptide fractions are observed, and out of these fractions,
only two glycosylation sites (Asn15 and Asn75), eluting between 12 –18 mins, are
identified. The tryptic peptide sequence bearing glycosylation site Asn15 is
CANLVPVPITN15ATLDR. Two tryptic peptides, QDQCIYN75TTYLNVQR and
QNQCFYN75SSYLNVQR, represent the same glycosylation site (Asn75) and their
difference in sequence is due to the peptide heterogeneity.58 The modifications on
these peptide moieties include deamination of alkylated cysteine, glutamine on N-
terminus, carbamylation and formylation.73, 89 These modifications were verified with
deglycosylation of glycopeptide fractions using PNGase F. Eleven glycan structures
containing fucosylated and non-fucosylated complex-type with or without sialic acids
were observed, as summarized in Table 2A. Table 2B contains data from the
negative ion mode, and it is discussed in more detail later.
Because of the relatively poor glycopeptide coverage and few glycosylation
sites detected, we employed a two-step sample preparation approach using
hydrophilic affinity method with Sepharose® followed by HPLC fractionation.46, 74 The

100
results (Table 3) show four glycosylation sites (Asn15, Asn54, Asn75 and Asn85) are
observed, and thirty-three unique glycopeptide ions are identified from MALDI
analysis of the HPLC fractions. A comparison of the data in Table 2A with those in
Table 3 shows a marked improvement in the glycopeptide coverage and the number
of glycosylation sites detected using the two-step sample preparation approach.
In addition to increasing the number of glycopeptide ions detected, an additional
benefit of improving the glycopeptide signal in the mass spectra is that MALDI-
MS/MS data can be acquired on the ions of sufficient abundance. This is critical for
confirming the peptide assignment of the glycopeptides. Representative MALDI-MS
and MS/MS data of the glycopeptide fraction eluting at 27 min (fraction 27 in Table 3)
is shown in Figure 4A and 4B, respectively. The precursor ion in Figure 4B is the
base peak at m/z 4192 in Figure 4A. Abundant glycopeptide peaks observed at m/z
2594, 3283, and 3811 on Figure 4B were used to confirm the glycan composition.
Glycopeptide peaks observed at m/z 2271 and 2391 correspond to 0,2X
([peptide+83+H]+) and Y1α ([peptide+HexNAc+H]+) ions, respectively, identifying the
peptide composition of the glycopeptides. Peptide peaks observed at m/z 112, 175,
403, 497, 575, 893, and 1179, were used to verify the peptide sequence.
Among five glycosylation sites, the signal of the glycopeptides from site Asn38
(NEEYNK) was not detected in MALDI-MS analysis. It has been observed previously
that these glycopeptides co-elute with the glycopeptides from site Asn85
(ENGTISR).90, 91 Since the peptide portion of the glycopeptides generated from Asn85
ends with arginine (R), these glycopeptides ionize better than the glycopeptides from
site Asn38, which ends in lysine (K).92 Hence, the mass spectral signal of
glycopeptides from site Asn38 were most likely suppressed by the signal of the

101
Table 2A. (+)MALDI-MS data of human AGP purified by reverse phase HPLC
*Peptide sequence with no miscleavages; Mod: modification on peptide moieties; PyroCMC: Deamination of alkylated cysteine; PyroQ: pryoglutamic acid; U: Carbamylation; For: Formylation; F12: HPLC fraction 12
Table 2B. (-) MALDI-MS data of human AGP purified by reverse phase HPLC
*Peptide sequence with no miscleavages; Mod: modification on peptide moieties; PyroCMC: Deamination of alkylated cysteine; PyroQ: pryoglutamic acid; For: Formylation; F12 neg: HPLC fraction 12 in negative ion mode

102
glycopeptides from Asn85. Due to the relatively low glycopeptide intensities obtained
from this fraction compared to the other fractions, the glycans were cleaved with
PNGase F to confirm the presence of the tryptic peptides (NEEYNK and ENGTISR).
MALDI-MS analysis of the deglycosylated fraction indeed confirmed the presence of
NEEYNK and ENGTISR (data not shown). Although the glycoforms could not be
observed on site Asn38, the PNGase F experiment confirms that this site is occupied
with glycans, therefore, increasing the number of detected glycosylation sites on this
protein. As demonstrated here, the use of PNGase F to identify the glycosylation
site occupancy on the weakly ionized glycopeptides is one more strategy that can be
implemented to maximize glycosylation coverage, when the goal is to determine
which glycosylation sites are occupied.
Note that MALDI-MS analysis of AGP discussed so far were performed in the
positive ion mode. Mass analysis of the AGP glycopeptide fractions in the negative
ion mode revealed the presence of sialylated species. Table 2B shows the sialylated
glycans when the same fractions in Table 2A were analyzed in the negative ion
mode. Six glycan structures were observed in (-) MALDI-MS analysis. Combining the
glycan structures detected in both modes, a total of seventeen glycans containing
fucosylated and non-fucosylated complex-type with or without sialic acids were
observed.
Representative MALDI data acquired both in the positive and negative ion
mode of AGP glycopeptide fraction eluting at 15 min (F15 in Table 2A and 2B) in
Figure 5 show glycopeptides with neutral glycans were mainly observed in the
positive ion mode (Figure 5A), while sialylated species were mainly observed in the
negative ion mode (Figure 5B). This capability to observe sialylated species in the
negative mode improves the glycopeptide coverage.

103
Table 3. (+) MALDI-MS data of human AGP purified by Sepharose®- RP HPLC
*MC: trypsin miscleavage; Mod: modification on peptide moieties; PyroCMC: Deamination of alkylated cystein; PyroQ: pryoglutamic acid; U: Carbamylation; For: Formylation; F4: HPLC fraction 4

104
Figure 4. MALDI analysis of glycopeptides from human AGP separated with Sepharose® followed by reverse phase HPLC; fraction eluting at 27min (A) (+)MALDI-TOF data of HPLC fraction 27, (B) (+)MALDI-TOF/TOF data of base peak at m/z 4192.6221 in (A) to confirm the glycopeptide assignment. 0,2X and Y1α ions are used to identify the peptide moieties. Postulated glycopeptide structures are shown. These are based on compositional data and biological precedence; other isomeric structures would also be possible.

105
Figure 5. MALDI-TOF data of glycopeptides from human AGP separated by reverse phase HPLC; fraction eluting at 15 min (A) positive ion mode; mainly neutral glycans on glycopeptides are detected. (B) negative ion mode; sialylated glycopeptides are identified. Acquiring MS data in both positive and negative ion modes improves glycopeptide coverage for acidic glycoproteins. *Peptide mod: modification on the peptide moieties. PyroCMC: deamination of alkylated cysteine of N-terminus. For: formylation of amino groups of the peptide. U: carbamylation.
Modifications on peptide moieties of glycopeptides
In the glycopeptide-based analysis, we detected several modifications on the
peptide moieties that have been previously observed in the proteolytic digests of

106
proteins. These include conversion of an N-terminal glutamine into pyroglutamic
acid,73, 89 deamination of alkylated cysteine on N-terminus when this residue was
alkylated by iodoacetamide,73, 89 carbamylation due to the presence of urea in protein
denaturation, and formylation when the digest mixtures were separated in acidic
HPLC conditions.
These modifications and their corresponding peptide sequences were confirmed by
deglycosylation of glycopeptide HPLC fractions using PNGase F and assigning the
MS and MS/MS data to the resulting peptides, which were generated during PNGase
F hydrolysis. Representative MALDI-MS and MS/MS data of a deglycosylated
glycopeptide fraction (eluting at 28 min) of human transferrin are shown in Figure 6.
The tryptic peptide sequence bearing glycosylation site Asn611 was converted to
QQQHLFGSD611VTDCSGNFCLFR upon deglycosylation by PNGase F. The
modification on this peptide moiety comprises conversion of glutamine into
pyroglutamic acid on the N-terminus, which results in a mass shift of 17 Da. Two
peaks at m/z 2498 and m/z 2515 in Figure 6A represent the modified and unmodified
peptide moieties of glycopeptides from human transferrin, respectively. To further
verify the presence of modification in this fraction and the corresponding peptide
sequences, MALDI-MS/MS data were acquired and shown in Figure 6B and 6C. The
characteristic ions at m/z 385, 635, and 782 in Figure 6B, originating from b3, b5 and
b6 ions are shifted 17 Da, compared to the same peaks (labeled in red) in Figure 6C.
This demonstrates that the formation of pyroglutamic acid on N-terminus occurs
when the glycoproteins undergo the proteolytic digestion. All the other peptide-based
internal ions in Figure 6B and 6C were utilized to confirm the peptide sequences.

107
Figure 6. MALDI analysis of a deglycosylated glycopeptide fraction (eluting at 28 min) from human transferrin; (A) MALDI-TOF data of HPLC fraction 28; Asparagine converts to aspartic acid upon deglycosylation by PNGase F. The peak marked by a circle represents the modification on N-terminus of the peptide: the conversion of glutamine into pyroglutamic acid. The peak marked by a star represents the native peptide. (B) and (C) MALDI-TOF/TOF data of the modified and native peptide

108
moieties. The internal peptide ions confirm the peptide sequences and the peaks labeled in red are used to verify the modification on N-terminus by a mass shift of 17 Da, compared to the native peptide.
Due to the presence of these modifications in proteolytic digest of the
proteins, incorporating the variable modifications into the database search is helpful
in increasing the number of mass spectral assignments of glycopeptide peaks. For
example, in the analysis of AGP purified by the two-step preparation approach, thirty-
five glycopeptides were identified from all the fractions; see Table 3. However, out of
thirty-five glycopeptide peaks, only sixteen glycopeptides were identified prior to
applying the variable modifications into the database (GlycoPep DB) search.
Therefore, considering these modifications in the assignment of glycopeptide
compositions more than doubles the number of assignable peaks.
Summary of the strategies used in maximizing glycosylation coverage
As described above, each of the chromatographic or/and enrichment
approaches was evaluated based on the number of glycosylation sites detected and
glycopeptides identified in three model glycoproteins. The pros and cons for each
preparative method are summarized in Table 4. In general, the hydrophilic and lectin-
based affinity enrichment methods used in this study are straightforward, selective,
show good reproducibility (in the case of Sepharose®), and deliver moderate
throughput for
Table 4. Pros and cons of each sample preparation method

109
preparing several samples. While all glycosylation sites were detected in IgG and
transferrin, the glycopeptide coverage is limited due to the lower separation
capacities in the microcolumns, compared to HPLC fractionation. The glycan
coverage of Con A packed lectin microcolumn tips is also limited by their glycan
binding specificity. Although the glycan binding specificities can be improved by
packing different lectins in one microcolumn tip, these tips are not commercially
available. Additionally, the single lectin used in this study, Con A TopTips®, showed
the poorest reproducibility of all the sample preparation methods.
Reverse phase HPLC fractionation gave the best glycopeptide coverage on
the model glycoproteins. While this approach is beneficial in achieving good
glycosylation coverage, the throughput is relatively low and the sample
decomposition of sialylated glycopeptides is observable, due to the acidic conditions
of the mobile phase. The recent development and implementation of automated LC-
MALDI systems93, 94 as well as the optimization of pH in mobile phase could help to
mitigate these problems.82 In the analysis of glycoproteins with more than two
glycosylation sites, a two-step sample preparation method ─ Sepharose® followed by
HPLC fractionation ─ is highly beneficial to optimize the glycosylation coverage
because it depletes more peptides from digestion mixture, as illustrated in the
analysis of AGP.
Finally, in addition to the sample preparation strategies compared here, the
other important strategies, including the mass spectral techniques and data analysis
strategies, were also implemented to enhance glycosylation coverage: First, profiling
in both positive and negative ion mode in mass spectrometry is essential when
neutral glycopeptides are intermixed with acidic ones, as is the case with AGP.
110
Second, the use of PNGase F was helpful in confirming the presence of a weakly
ionizing glycopeptide that co-eluted with more strongly ionizing species, thus,
increasing the number of glycosylation sites detected in glycopeptide-based analysis.
Third, several modifications on the peptide portion commonly observed in proteolytic
digestion, such as conversion of an N-terminal glutamine residue into pyroglutamic
acid, and deamination of alkylated cysteine on N-terminus, can be incorporated into
the database search (Glycopep DB)80 to facilitate assigning more glycopeptide peaks
in data analysis.
Application of maximizing glycosylation coverage strategies in HIV envelope
glycoprotein
Owing to successfully optimizing glycosylation coverage on model
glycoproteins (from one to five glycosylation sites), the same strategies were also
tested on a very highly complex glycoprotein, the HIV envelope protein, JR-FL gp140
ΔCF, which contains 27 potential glycosylation sites. The proteolytic digests of JR-FL
were subjected to RP-HPLC fractionation, with and without pre-treatment with
Sepharose® affinity purification. Our study shows that over 300 glycoform were
identified on 23 detected glycosylation sites from 36 HPLC fractions that contained
glycopeptides of JR-FL in MALDI-MS analysis. Representative MALDI-MS and
MS/MS data of a glycopeptide fraction of JR-FL eluting at 7 min (without Sepharose®
pre-treatment) are shown in Figure 7. The two-step sample preparation method
using Sepharose® followed by HPLC fractionation produced the same glycosylation
coverage, compared to HPLC fractionation. In Figure 7, all the peaks marked with a
star represent glycopeptides from glycosylation site Asn361 (LREQFEN361K) on JR-FL
gp140 ∆CF. This single spectrum shows a total 38 glycopeptide peaks detected, with

111
Figure 7. Representative MALDI-TOF data of glycopeptide fraction (eluting at 7 min) from tryptic digest of JR-FL gp140 ΔCF separated by reverse phase HPLC. All the identified glycopeptides are from glycosylation site Asn361 on JR-FL gp 140 ΔCF and marked by a star. Inset: MALDI-TOF/TOF data of the identified glycopeptide base peak at m/z 2711.3184. The peptide portion is LREQFEN361K and conformed by 0,2X and Y1α ions.
good S/N ratio. Out from 38 glycopeptide peaks, 26 unique glycan structures have
been identified, which demonstrates that a highly heterogeneous population of
glycans can be detected from this glycosylation site. This implies that our approach
works not only for elucidation of overall glycan profiles on glycoproteins but also for
the identification of glycan heterogeneity in each glycosylation site. The precursor ion
in Figure 7 inset is the base peak at m/z 2711. Glycopeptide peaks observed at m/z
1147 and 1413 correspond to 0,2X ([peptide+83+H]+) and
Y1α ([peptide+HexNAc+Fuc+H]+) ions, respectively, identifying the peptide

112
composition of the glycopeptides. Since the observed peptide mass is consistent
with the calculated mass, no modification was found on the peptide portion of the
base peak at m/z 2711. Peptide peaks observed at m/z 253, 510, 803, and 918,
were used to verify the peptide sequence. The glycan compositions for each of the
starred peaks in Figure 7 were determined using GlycoPep DB and are listed in
Supplementary Table 1 online. A full discussion of this data, along with the glycan
profiles at the other 22 glycosylation sites detected by MALDI-MS, is presented
separately.
4.4 Conclusions
In order to design an experimental workflow that maximizes coverage of
glycosylation heterogeneity on glycoproteins, we optimized all the features of
glycopeptide-based MALDI-MS analysis, including sample preparation methods,
mass spectral data acquisition, and data analysis. This is the first study aimed at
independently determining the best strategies to maximize glycosylation coverage in
glycopeptide-based analysis. These strategies are useful in obtaining complete
glycan profiles on a variety of glycoproteins (from one to multiple glycosylation sites),
thereby facilitating understanding how glycan structure affects the functions of
glycoproteins. This investigation also provides beneficial information in the
experimental design for glycan profiling on heavily glycosylated glycoproteins, such
as HIV virus envelope protein ─ JR-FL gp 140 ∆CF, which contains 27 glycosylation
sites.

113
Acknowledgments
The authors acknowledge the National Institutes of Health for funding (project
number RO1GM077266), Dr. Barton F. Haynes, Dr. Hua-Xin Liao, and Laura L.
Sutherland at Duke Human Vaccine Research Institute (Duke University, Durham,
NC) for supplying the glycoprotein JR-FL gp140 ΔCF, and the KU proteomics facility
for instrument time on the MALDI TOF/TOF.
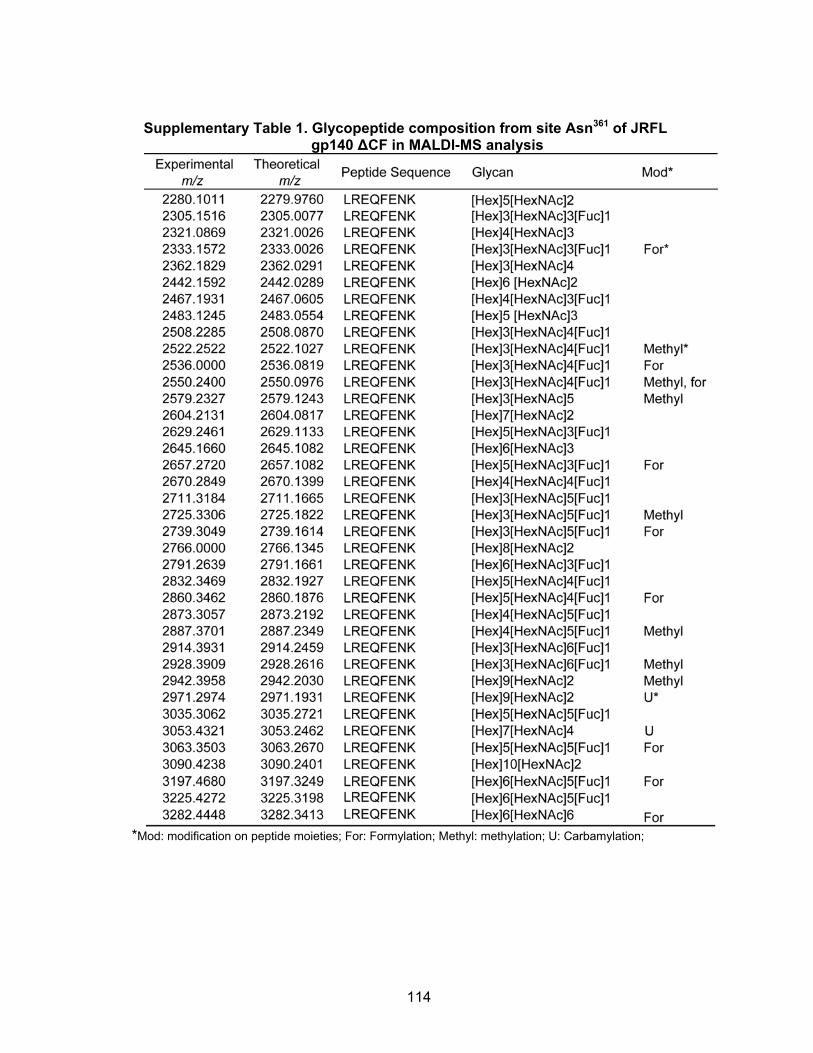
114
Supplementary Table 1. Glycopeptide composition from site Asn361 of JRFL gp140 ΔCF in MALDI-MS analysis
*Mod: modification on peptide moieties; For: Formylation; Methyl: methylation; U: Carbamylation;

115
4.5 References
1. Kameyama, A.; Kaneda, Y.; Yamanaka, H.; Yoshimine, H.; Narimatsu, H.; Shinohara, Y. Detection of oligosaccharides labeled with cyanine dyes using matrix-assisted laser desorption/ionization mass spectrometry. Anal. Chem. 2004, 76, 4537-4542. 2. Nilsson, B. Analysis of protein glycosylation by mass spectrometry. Mol. Biotechnol. 1994, 2, 243-280. 3. Wada, Y.; Tajiri, M.; Yoshida, S. Hydrophilic affinity isolation and MALDI multiple-stage tandem mass spectrometry of glycopeptides for glycoproteomics. Anal. Chem. 2004, 76, 6560-6565. 4. Imre, T.; Schlosser, G.; Pocsfalvi, G.; Siciliano, R.; Molnar-Szollosi, E.; Kremmer, T.; Malorni, A.; Vekey, K. Glycosylation site analysis of human alpha-1-acid glycoprotein (AGP) by capillary liquid chromatography - electrospray mass spectrometry. J. Mass Spectrom. 2005, 40, 1472-1483. 5. Kameyama, A.; Kikuchi, N.; Nakaya, S.; Ito, H.; Sato, T.; Shikanai, T.; Takahashi, Y.; Takahashi, K.; Narimatsu, H. A strategy for identification of oligosaccharide structures using observational multistage mass spectral library. Anal. Chem. 2005, 77, 4719-4725. 6. Palm, A. K.; Novotny, M. V. A monolithic PNGase F enzyme microreactor enabling glycan mass mapping of glycoproteins by mass spectrometry. Rapid Commun. Mass Spectrom. 2005, 19, 1730-1738. 7. Yu Y. Q.; Gilar, M.; Kaska, J.; Gebler J. C. A rapid sample preparation method for mass spectrometric characterization of N-linked glycans. Rapid Commun. Mass Spectrom. 2005, 19, 2331-2336. 8. Shinohara, Y.; Furukawa, J.; Niikura, K.; Miura, N.; Nishimura, S. Direct N-glycan profiling in the presence of tryptic peptides on MALDI-TOF by controlled ion enhancement and suppression upon glycan-selective derivatization. Anal. Chem. 2004, 76, 6989-6997. 9. Larsen, M. R.; Hojrup, P.; Roepstorff, P. Characterization of gel-separated glycoproteins using two-step proteolytic digestion combined with sequential microcolumns and mass spectrometry. Mol. Cell Proteomics. 2005, 4, 107-119. 10. Haslam, S. M.; North, S. J.; Dell, A. Mass spectrometric analysis of N- and O-glycosylation of tissues and cells. Curr. Opin. Struct. Biol. 2006, 16, 584-591. 11. Yang, Z.; Hancock, W. S.; Chew, T. R.; Bonilla, L. A study of glycoproteins in human serum and plasma reference standards (HUPO) using multilectin affinity chromatography coupled with RPLC-MS/MS. Proteomics 2005, 5, 3353-3366.

116
12. Wang, Y.; Wu, S.; Hancock, W. S. Approaches to the study of N-linked glycoproteins in human plasma using lectin affinity chromatography and nano-HPLC coupled to electrospray linear ion trap-Fourier transform mass spectrometry. Glycobiology 2006, 16, 514-523. 13. Van Rensburg, S. J.; Berman, P.; Potocnik, F.; MacGregor, P.; Hon, D.; De Villiers, N. 5- and 6-glycosylation of transferrin in patients with Alzheimer's disease. Metab. Brain Dis. 2004, 19, 89-96. 14. Fournier, T.; Medjoubi, N. N.; Porquet, D. Alpha-1-acid glycoprotein. Biochim. Biophys. Acta. 2000, 1482, 157-171. 15. Nihlen, U.; Montnemery, P.; Lindholm, L. H.; Loefdahl, C. G. Increased serum levels of carbohydrate-deficient transferrin in patients with chronic obstructive pulmonary disease. Scand. J. Clin. Lab. Invest. 2001, 61, 341-348. 16. Budnik, B. A. ; Lee, R. S. ; Steen, J. A. J. Global methods for protein glycosylation analysis by mass spectrometry. Biochim. Biophys. Acta. 2006, 1764, 1870-1880. 17. Haynes, P. A.; Batley, M.; Peach, R. J.; Brennan, S. O.; Redmond, J. W. Characterization of oligosaccharides from a glycoprotein variant of human serum albumin (albumin Casebrook) using high-performance anion-exchange chromatography and nuclear magnetic resonance spectroscopy. J. Chromatogr. 1992, 581, 187-193. 18. Mechref, Y.; Novotny, M. V. Miniaturized separation techniques in glycomic investigations. J. Chromatogr. B Analyt. Technol. Biomed. Life Sci. 2006, 841, 65-78. 19. Patwa, T. H.; Zhao, J.; Anderson, M. A.; Simeone, D. M.; Lubman, D. M. Screening of glycosylation patterns in serum using natural glycoprotein microarrays and multi-lectin fluorescence detection. Anal. Chem. 2006, 78, 6411-6421 20. Charlwood, J.; Birrell, H.; Camilleri, P. Carbohydrate release from picomole quantities of glycoprotein and characterization of glycans by high-performance liquid chromatography and mass spectrometry. J. Chromatogr. B, Biomed. Sci. Appl. 1999, 734, 169-174. 21. Kuester, B.; Naven, T. J. P.; Harvey, D. J., Rapid approach for sequencing neutral oligosaccharides by exoglycosidase digestion and matrix-assisted laser desorption/ionization time-of-flight mass spectrometry. J. Mass Spectrom. 1996, 31, 1131-1140. 22. Mechref, Y.; Novotny, M. V. Mass spectrometric mapping and sequencing of N-linked oligosaccharides derived from submicrogram amounts of glycoproteins. Anal. Chem. 1998, 70, 455-463. 23. Irungu, J.; Dalpathado, D. S.; Go, E. P.; Jiang, H.; Ha, H.; Bousfield, G. R.;

117
Desaire, H. Method for characterizing sulfated glycoproteins in a glycosylation site-specific fashion, using ion pairing and tandem mass spectrometry. Anal. Chem. 2006, 78, 1181-1190. 24. Bunkenborg, J.; Pilch, B. J.; Podteleinikov, A. V.; Wisniewski, J. R. Screening for N-glycosylated proteins by liquid chromatography mass spectrometry. Proteomics 2004, 4, 454-465. 25. Dage, J. L.; Ackermann, B. L.; Halsall, H. B. Site localization of sialyl LewisX antigen on α1-acid glycoprotein by high performance liquid chromatography-electrospray mass spectrometry. Glycobiology 1998, 8, 755-760. 26. Geng, M.; Zhang, X.; Bina, M.; Regnier, F. Proteomics of glycoproteins based on affinity selection of glycopeptides from tryptic digests. J. Chromatogr. B Biomed. Sci. Appl. 2001, 752, 293-306. 27. Haegglund, P.; Bunkenborg, J.; Elortza, F.; Jensen, O. N.; Roepstorff, P. A new strategy for identification of N-glycosylated proteins and unambiguous assignment of their glycosylation sites using HILIC enrichment and partial deglycosylation. J. Proteome Res. 2004, 3, 556-566. 28. Krokhin, O.; Ens, W.; Standing, K. G.; Wilkins, J.; Perreault, H. Site-specific N-glycosylation analysis: matrix-assisted laser desorption/ionization quadrupole-quadrupole time-of-flight tandem mass spectral signatures for recognition and identification of glycopeptides. Rapid Commun. Mass Spectrom. 2004, 18, 2020-2030. 29. Tajiri, M.; Yoshida, S.; Wada, Y. Differential analysis of site-specific glycans on plasma and cellular fibronectins: application of a hydrophilic affinity method for glycopeptide enrichment. Glycobiology 2005, 15, 1332-1340. 30. Nagy, K.; Vekey, K.; Imre, T.; Ludanyi, K.; Barrow, M. P.; Derrick, P. J. Electrospray ionization Fourier transform ion cyclotron resonance mass spectrometry of human α1-acid glycoprotein. Anal. Chem. 2004, 76, 4998-5005. 31. Carr, S. A.; Huddleston, M. J.; Bean, M. F. Selective identification and differentiation of N- and O-linked oligosaccharides in glycoproteins by liquid chromatography-mass spectrometry. Protein Sci. 1993, 2, 183-196. 32. Huddleston, M. J.; Bean, M. F.; Carr, S. A. Collisional fragmentation of glycopeptides by electrospray ionization LC/MS and LC/MS/MS: methods for selective detection of glycopeptides in protein digests. Anal. Chem. 1993, 65, 877-884. 33. Hemstroem, P.; Irgum, K. Hydrophilic interaction chromatography. J. Sep. Sci. 2006, 29, 1784-1821. 34. Atwood, J. A.; Minning, T.; Ludolf, F.; Nuccio, A.; Weatherly, D. B.; Alvarez-

118
Manilla, G.; Tarleton, R.; Orlando, R. Glycoproteomics of trypanosoma cruzi trypomastigotes using subcellular fractionation, lectin affinity, and stable isotope labeling. J. Proteome Res. 2006, 5, 3376-3384. 35. Alvarez-Manilla, G.; Atwood, J.; Guo, Y.; Warren, N. L.; Orlando, R.; Pierce, M. Tools for glycoproteomic analysis: Size exclusion chromatography facilitates identification of tryptic glycopeptides with N-linked glycosylation sites. J. Proteome Res. 2006, 5, 701-708. 36. Go, E. P.; Rebecchi, K. R.; Dalpathado, D. S.; Bandu, M. L.; Zhang, Y.; Desaire, H. GlycoPep DB: a tool for glycopeptide analysis using a "smart search". Anal. Chem. 2007, 79, 1708-1713. 37. Liao, H.; Sutherland, L.L.; Xia, S.; Brock, M. E.; Scearce, R. M.; Vanleeuwen, S.; Alam, S. M.; McAdams, M.; Weaver, E. A.; Camacho, Z. T.; Ma, B.; Li, Y.; Decker, J. M.; Nabel, G. J.; Montefiori, D. C.; Hahn, B. H.; Korber, B. T.; Gao, F.; Haynes, B. F. A group M consensus envelope glycoprotein induces antibodies that neutralize subsets of subtype B and C HIV-1 primary viruses. Virology 2006, 353, 268-282. 38. Zhu, X.; Borchers, C.; Bienstock, R. J.; Tomer, K. B. Mass spectrometric characterization of the glycosylation pattern of HIV-gp120 expressed in CHO cells. Biochemistry 2000, 39, 11194-11204. 39. Irungu, J.; Go. E. P.; Dalpathado, D. S.; Desaire, H. Simplification of mass spectral analysis of acidic glycopeptides using GlycoPep ID. Anal. Chem. 2007, 79, 3065-3074.
40. Butler, M.; Quelhas, D.; Critchley, A. J.; Carchon, H.; Hebestreit, H. F.; Hibbert, R. G.; Vilarinho, L.; Teles, E.; Matthijs, G.; Schollen, E.; Argibay, P.; Harvey, D. J.; Dwek, R. A.; Jaeken, J.; Rudd, P. M. Detailed glycan analysis of serum glycoproteins of patients with congenital disorders of glycosylation indicates the specific defective glycan processing step and provides an insight into pathogenesis. Glycobiology 2003, 13, 601-622. 41. Novotny, M. V.; Mechref, Y. New hyphenated methodologies in high-sensitivity glycoprotein analysis. J. Sep. Sci. 2005, 28, 1956-1968. 42. Qiu, R.; Regnier, F. E. Use of multidimensional lectin affinity chromatography in differential glycoproteomics. Anal. Chem. 2005, 77, 2802-2809. 43. Satomi, Y.; Shimonishi, Y.; Hase, T.; Takao, T., Site-specific carbohydrate profiling of human transferrin by nano-flow liquid chromatography/electrospray ionization mass spectrometry. Rapid Commun. Mass Spectrom. 2004, 18, 2983-2988. 44. Harvey, D. J., Structural determination of N-linked glycans by matrix-assisted laser desorption/ionization and electrospray ionization mass spectrometry.

119
Proteomics 2005, 5, 1774-1786. 45. Krokhin, O. V.; Ens, W.; Standing, K. G. Characterizing degradation products of peptides containing N-terminal Cys residues by (off-line high-performance liquid chromatography)/matrix-assisted laser desorption/ionization quadrupole time-of-flight measurements. Rapid Commun. Mass Spectrom. 2003, 17, 2528-2534. 46. Kremmer, T.; Szoelloesi, E.; Boldizsar, M.; Vincze, B.; Ludanyi, K.; Imre, T.; Schlosser, G.; Vekey, K., Liquid chromatographic and mass spectrometric analysis of human serum acid alpha-1-glycoprotein. Biomed. Chromatogr. 2004, 18, 323-329. 47. Szoellosi, E.; Kremmer, T.; Ludanyi, K.; Imre, T.; Schlosser, G.; Boldizsar, M.; Vincze, B.; Vekey, K. A novel method for the separation and purification of human serum acid alpha-1-glycoprotein: liquid chromatographic and mass spectrometric investigation of tryptic fragments. Chromatographia 2004, 60, S213-S219. 48. Brancia, F. L.; Oliver, S. G.; Gaskell, S. J. Improved matrix-assisted laser desorption/ionization mass spectrometric analysis of tryptic hydrolysates of proteins following guanidination of lysine-containing peptides. Rapid Commun. Mass Spectrom. 2000, 14, 2070-2073. 49. Connolly, J.; Openshaw, M.; Rasso, R.; Martin, R.; Ojima, N. Protein identification of complex mixtures using LC-MALDI on Axima-TOF2. Shimadzu Hyoron 2006, 63, 11-18. 50. Hattan, S. J.; Parker, K. C., Methodology utilizing MS signal intensity and LC retention time for quantitative analysis and precursor ion selection in proteomic LC-MALDI analyses. Anal. Chem. 2006, 78, 7986-7996.

120
Chapter V
Determination of disulfide bond arrangement of the oligomeric HIV envelope protein CON-S gp140 ∆CFI by LC/ESI-FTICR mass spectrometry
5.1 Introduction
Disulfide connectivity is one of the most essential protein modifications, and it
plays a key role in stabilizing protein structures.95-98 Disulfide bonds are usually
formed between thiol groups of two cysteine residues that are proximal in three-
dimensional structures in the secreted and non-cytoplasmic proteins.2, 98 The formed
disulfide bonds provide a significant reinforcement to the native folding state of the
protein by decreasing the conformational entropy of the unfolded state, thus,
stabilizing the protein.98 Numerous studies have shown that the correct disulfide
connectivity in proteins is important for protein folding and becomes an indispensable
criterion to assess the quality of protein in recombinant DNA technology.2, 97, 99, 100
Since disulfide linkages are essential in establishing and maintaining the proper
protein folds, determination of disulfide bond arrangement is an important aspect to
understanding protein chemical structures and defining the functional domains of
proteins.100-102
If a x-ray crystal structure of a protein is available, the disulfide bonds can be
determined from the protein structure directly.103, 104 Likewise, if a protein structure
has been assigned by nuclear magnetic resonance (NMR), the disulfide bonds are
also determinable in a straightforward fashion.105 However, if this level of structural
data is not available a priori, other methods are more appropriate. For example,
several analytical techniques, including high performance liquid chromatography
(HPLC),96, 106, 107 paper electrophoresis,108 and Edman sequencing96, 109 have been
employed in the determination of disulfide bonds in proteins. These techniques were

121
used to originally characterize the disulfide bonding network in a monomeric HIV Env
protein, from the IIIB isolate of HIV-1 generated in Chinese Hamster Ovary (CHO)
cells.96 Typically, the disulfide bond determination by these techniques entails the
enzymatic cleavage of proteins, followed by a separation process and then the
detection of disulfide-linked peptides.100 Although Edman sequencing is a powerful
tool to obtain the amino acid sequence of disulfide-linked peptides, it requires highly
purified samples.57, 100 As a result, this approach largely hinges on the ability to
obtain highly purified peptides, when analyzing complex samples.100 Mass
spectrometry has emerged as an alternative analytical tool for Edman sequencing in
determination of disulfide linkages in proteins, due to its ability to analyze peptide
mixtures, along with its high sensitivity and throughput.
In addition to the analytical tools, disulfide mapping requires rigorous
experimental controls, due to the possibility of disulfide rearrangement under certain
circumstances. It has been previously observed that the disulfide bond scrambling
could be triggered by the following conditions: (1) strong acid (e.g. 8.0 M sulfuric
acid),101, 102, 110 (2) the presence of a free thiol group on unpaired cysteine residues at
neutral pH,100-102, 110 and (3) the presence of a thiol group generated by hydrolytic
cleavage of disulfide bonds during protein denaturation at neutral and alkaline pH.
Thus, precautions must be taken when handling proteins to avoid disulfide bond
rearrangement.
The focus of this paper is two-fold: to validate an efficient method of profiling
disulfide bonds on proteins, using liquid chromatography electrospray ionization
Fourier transform ion cyclotron resonance mass spectrometry (LC/ESI-FTICR-MS)
and to use the validated approach to analyze the disulfide bond arrangement in an
122
oligomeric HIV Env CON-S gp140 ∆CFI. CON-S gp140 ∆CFI was developed as a
potential HIV vaccine candidate. It is a synthetic form of Env representing a group M
consensus envelope protein, and it induces neutralizing antibodies against type one
and limited type two strains of the HIV-1 virus.53 Compared to previously designed
and synthesized immunogens, CON-S gp140 ∆CFI has marked improvement in its
immunogenicity.53
To date, the disulfide bonding pattern of oligomeric Env proteins, such as
CON-S gp140 ∆CFI has not been elucidated; however, the disulfide connectivity in
several monomeric forms of HIV Env protein, gp120, have been described.96, 111-114
These previous studies indicate a conserved disulfide bonding pattern is present in
various monomeric forms of HIV Env proteins, where all cysteines are utilized for
disulfide connectivity. While these prior studies provide useful insight into the
connectivity of monomeric Env, this form of the protein is not the most relevant form
for vaccine development, since it has been shown to perform inadequately as a
vaccine candidate,115, 116 and many believe a key contributing reason is that a better
mimic of viral Env would include protein that is present in oligomeric form.117-120
Several oligomeric HIV Env proteins (dimers and trimers) have recently been
expressed, and they are known to be covalently associated as a dimer or trimer
through disulfide bonds.53, 121 This surprising result implies that the disulfide bonding
network in recombinant oligomeric Env protein must be different from that in the
previously characterized monomers, since at least one cysteine must be used for the
inter-subunit disulfide bond.
Previous studies have identified the location of inter-chain disulfide bonds
between two subunits of Env proteins, by deleting certain domains and/or loops that

123
are suspected to be involved in the connecting disulfide bond and detecting the
changes in the number of domains that are covalently linked in the new protein.121-123
Although deletion mutations on a protein are useful to identify which domains and/or
loops are involved in the inter-subunit contact of a protein, a possibility that
truncating these segments influences the protein conformation and indirectly inhibits
inter-subunit association cannot be ruled out.121-123 Additionally, these studies do not
address the disulfide bonding which is not associated with the inter-subunit linkage.
The study presented herein is the first investigation to fully characterize the
disulfide bonding network of an oligomeric Env protein, CON-S gp140 ∆CFI, and
identify the exact location of an inter-subunit disulfide bond in HIV Env protein, using
high resolution FTICR mass spectrometry. Our results show that two functional
domains previously identified in a monomeric Env protein, the third and forth variable
regions (V3, V4), are also conserved in the disulfide bonding in CON-S gp140 ∆CFI.
Among these two regions, V3 is the immunodominant region that is responsible for
inducing neutralizing antibodies.53 One cysteine residue Cys225 was identified as
forming an inter-subunit disulfide bond between two Env monomers, accounting for
the oligomeric nature of CON-S gp140 ∆CFI. Interestingly, five free cysteine residues
are present in the N-terminal region (defined by amino acid residues 1-250) of CON-
S gp140 ∆CFI. Our results demonstrate that the oligomeric form of an HIV Env
protein possess a different disulfide bonding network, compared to the monomeric
HIV Env protein. This information will facilitate understanding how the disulfide bond
arrangement correlates to immunogenetic activities of the oligomeric form of HIV Env
protein. This study also sets the foundation for further work: Assessing the
differences in disulfide bonding patterns of recombinant Env proteins and comparing

124
them to the disulfide bonds pattern on Env isolated from virions; these studies would
make it possible to determine what types of recombinant proteins best mimic the
native viral Env protein. Such studies would greatly aide in the generation of an
effective vaccine against the HIV-1 virus.
5.2 Experimental Section
Materials and reagents
Albumin from bovine serum (BSA), 4-Vinylpyridine, acetonitrile, formic acid,
acetic acid, and ammonium bicarbonate were all obtained in high purity from Sigma-
Aldrich (St. Louis, MO). The HIV envelope glycoprotein CON-S gp140 ∆CFI was
expressed and purified in the laboratory of Dr. Barton F. Haynes, Duke Human
Vaccine Research Institute (Duke University, Durham, NC), using the method
described elsewhere53. Peptide N-glycosidase F (PNGase F) from Elizabethkingia
meningosepticum and proteomics grade trypsin were purchased from Calbiochem
(San Diego, CA) and Promega (Madison, MI), respectively. Ultra-pure water was
obtained from a Millipore Direct-Q3 filtration system. (Billerica, MA).
N-deglycosylation of CON-S gp140 ∆CFI
A sample containing approximately 100 μg of HIV envelope protein CON-S
gp140 ∆CFI was dissolved in 50 mM ammonium bicarbonate buffer (pH 7.0) and
treated with 1 μL of PNGase F enzyme solution (≥ 4500 units/mL). The reaction was
incubated at 37 °C for one week.
Protein digestion
The protein, either BSA or deglycosylated CON-S gp140 ∆CFI, was dissolved
in 50 mM ammonium bicarbonate buffer (pH 7.0). Prior to enzymatic digestion,

125
unpaired cysteine residues in BSA or deglycosylated CON-S gp140 ∆CFI were
alkylated with 4-Vinylpyridine at a protein:alkylating reagent ratio of 1:6 (molar ratio).
The resulting solution was incubated in the dark for 1 hour at ambient temperature.
Proteins were then digested at 37°C with trypsin at an enzyme-to-substrate ratio of
1:20 (w/w) for 18 hours, followed by a second trypsin addition under the same
conditions. The digestion was stopped by the addition of 1μL concentrated acidic
acid and the resulting protein digest mixture was analyzed by reverse phase-
HPLC/ESI-FTICR MS.
LC/ESI-FTICR MS analysis
The tryptic digestion mixtures were subjected to reverse phase high
performance liquid chromatography (RP-HPLC, Dionex, Sunnyvale, CA) coupled
with a hybrid linear ion trap-Fourier transform ion cyclotron resonance mass
spectrometer (LTQ-FTICR-MS) equipped with a 7 Tesla actively shielded magnet
(ThermoElectron Corp, San Jose, CA). The mobile phase A was 99.9% water with
0.1% formic acid. Mobile phase B was 99.9% acetonitrile with 0.1% formic acid.
Approximately 10 μL of the sample was injected and separated on a C18 PepMap
300TM column (150mm×300 μm i.d. 5 μM, 300Å; LC Packings, Sunnyvale, CA) at a
flow rate of 5μL/min. The tryptic peptides were eluted using the following gradient,
which was modified from the method described in the literature124: The mobile phase
initially contained 2% B and the level of B increased linearly to 40% over 30 min,
then ramped to 90% B over 20 min. The column was re-equilibrated after holding at
90% B for 10 min.
The samples were infused into the electrospray ion source, and the hybrid
LTQ-FTICR data acquisition was performed in a data-dependent scanning mode.

126
Briefly, the MS1 spectra were recorded in FT-MS scan and the three most intense
peptide ions in MS scan were sequentially selected for CID experiment performed in
the LTQ mass analyzer, with 25% normalized collision energy and a 3 min dynamic
exclusion window. Electrospray ionization was achieved with a spray voltage of ~ 4.0
kV. Nitrogen was used as nebulizing gas and set at a pressure of 10 psi. The
capillary temperature was maintained at 200 °C. All the data were acquired in the
positive ion mode and analyzed using Xcalibur 1.3 software (ThermoElectron Corp,
San Jose, CA).
5.3 Results and Discussion
To demonstrate the effectiveness of our approach in disulfide mapping using
LC/ESI-LTQ-FTICR-MS analysis, a disulfide-rich protein, bovine serum albumin
(BSA), was chosen as a model protein to optimize experimental conditions. This
approach was subsequently applied in the determination of disulfide bond
arrangement of HIV Env protein CON-S gp140 ∆CFI.
Disulfide mapping of bovine serum albumin
Bovine serum albumin (primary accession number P02769 from Swiss-Prot)
contains ~600 amino acid residues, 77 potential cleavage sites for trypsin, and 35
cysteine residues.125 The putative disulfide bond arrangements126 are shown in
Figure 1, in which 17 inter- and intra-chain disulfide linkages are formed. One
unpaired cysteine residue, Cys58, has a free thiol group, and it could promote the
disulfide bond rearrangement at neutral pH ~7.0.100 To preclude disulfide scrambling,
the thiol groups in the unpaired cysteine residues were masked with the addition of
excess alkylating reagent, 4-Vinylpyridine. 4-Vinylpyridine is an ideal alkylating agent

127
because the modified peptides containing S-β-(4-pyridylethyl)-cysteine can be
readily identified, due to the presence of characteristic ion, S-pyridylethyl moiety,
Figure 1. Protein sequence and theoretical disulfide-linkage arrangement in bovine serum albumin; Disulfide linkages are indicated with a solid line and cysteine residues are shown in red.
upon CID experiments in mass spectrometry.127 The protein was then digested with
trypsin at neutral pH ~7.0. Trypsin was used for generating the disulfide-linked
peptides due to its substrate specificity and its capability to produce relatively simple
mass spectra, compared to other proteases (e.g. pepsin).100 The resultant tryptic
peptides containing disulfide linkages and modified unpaired cysteine residues were
then subjected to reverse-phase HPLC followed by ESI-FTICR MS and MS/MS
analysis, as shown in Figure 2.
When the tryptic digestion mixtures were separated, several clusters of
peptides with inter- or/and intra-disulfide linkages were identified. A representative
reverse-phase HPLC chromatogram and LC/ESI-FTICR MS data of tryptic peptides

128
from BSA are shown in Figure 3A and B, respectively. The FTICR-MS spectrum of
the HPLC fraction eluting between 16-17 min (the red bar shown in Figure 3A) shows
two peaks at m/z 925.8946 and m/z 1234.1892 with different charge states. Figure 3
inset shows the zoomed-in spectra used to identify the monoisotopic peaks at m/z
925.3933, m/z 1234.5219 and their corresponding charge states (+4, and +3,
respectively). By comparing the observed masses resulting from the tryptic protein
digests with the theoretically calculated masses of the putative disulfide-linked
peptides, the peaks at m/z 925.3933 and m/z 1234.1892 were identified as
corresponding to a three-chain disulfide-linked peptide found in BSA. This is the third
entry in Table 1, which summarized all the experimentally determined disulfide
linkages in BSA. All the 35 cysteines have been identified by LC/ESI-FTICR MS
analysis. Each cluster of peptides containing disulfide linkages or unpaired cysteine
residues has been identified with high mass accuracy, which is consistent with the
known disulfide linkages in BSA, as described in literature.108, 126
To further verify the disulfide linkages and peptide sequences of these
peptide clusters, MS/MS analysis was performed using data dependent acquisition in
the linear ion trap. Representative LC/ESI-LTQ-FTICR MS/MS data are shown in
Figure 4. Three classes of peptides containing disulfide-linkages or unpaired
cysteine residues have been identified by the product ions observed in MS/MS
analysis. Figure 4A depicts the CID data of a peptide that contains a cysteine capped
with 4-Vinylpyridine. The major ions in the spectrum are consistent with the expected
peptide sequence that retains the chemically modified thiol group on the cysteine.
Figure 4B represents an intra-chain disulfide-linked peptide from BSA. For the
product ions at m/z 407.22, 438.09, 566.39, 849.24, and 860.88, in which the

129
Figure 2. Schematic representation of disulfide bond mapping work-flow in (A) bovine serum albumin and (B) CON-S gp140 ΔCFI; The pink ball represents the glycans on CON-S gp140 ΔCFI. The yellow star indicates the free cysteines alkylated by 4-Vinylpyridine.

130
disulfide bonds are dissociated, the termini of the cysteine residues were detected as
thiol groups (-SH), as expected.98 Again, the MS/MS data is highly consistent with
the depicted peptide sequence. Figure 4C demonstrates the identification of a three-
chain disulfide-linked peptide. The product ions denoted y/b were generated from the
peptide chain containing an N- terminal serine (S), whereas product ions denoted
Y/B and yn’/bn’ (n’=1-7) were produced from the peptide chains with N terminal
glutamic acid (E) and asparagine (N), respectively. As demonstrated here, in addition
to using high mass accuracy data in FTICR-MS analysis to identify the disulfide-
linked peptides in BSA, the peptide sequences and disulfide linkages in these
peptides were also confirmed with MS/MS experiments, which significantly increases
the confidence level in the mass assignments and implicates that our approach is an
effective way to determine the disulfide bonds in complex protein digests.

131
Figure 3. Representative (A) reverse-phase HPLC chromatogram and (B) LC/ESI-FTICR MS data of tryptic peptides from bovine serum albumin; The tryptic peptides are separated within a 60-min gradient. The mass spectrum of HPLC fraction eluting at 16-17 min (labeled with a red bar in A) shows two peaks (in red) with different charge states corresponding to the tryptic peptides with two inter-chain disulfide linkages. Inset: The zoomed-in spectra of detected disulfide-linked peptide peaks, used to identify the monoisotopic peaks and charge states.

132
Table 1. Summary of the disulfide linkages in bovine serum albumin
*: The free Cysteine is alkylated by 4-vinylpyridine.

133
Figure 4. Representative LC/ESI-FTICR MS/MS data for the disulfide-linked tryptic peptides from bovine serum albumin; (A) peptide with a free cysteine residue; (B) peptide with an internally linked disulfide bond; (C) peptides with two inter-chain disulfide linkages.

134
Disulfide mapping of CON-S gp140 ∆CFI
Owing to the successful application of this approach in disulfide mapping of
bovine serum albumin, we extend its utility to a structurally complex protein CON-S
gp140 ∆CFI.
CON-S gp140 ∆CFI is a synthetic form of the HIV-1 Env protein; in small
animal vaccine trials, it was shown to induce type I and limited type II neutralizing
antibodies against the HIV-1 virus.53 This protein contains ~600 amino acid
residues53, 52 potential cleavage sites for trypsin, 18 cysteine residues, and 31
potential N-linked glycosylation sites, attached with a heterogeneous population of
glycans.128 It is expressed mainly as a dimer. According to the disulfide connectivity
in a previously analyzed recombinant, monomeric HIV Env protein,96 nine disulfide
bonds should be present for each monomeric unit of CON-S gp140 ∆CFI, if the
disulfide bonding pattern is conserved. This “expected” disulfide connectivity for the
monomeric form of CON-S gp140 ∆CFI is shown in Figure 5A, in which the disulfide
bonds define the boundaries of the variable regions (V1-V5) as well as conserved
domains in HIV Env protein.96, 129 Since CON-S gp140 ∆CFI used in this study is an
oligomeric form of Env, we accounted for the possibility that the disulfide bonding
pattern could be significantly different. Therefore, many possibilities for the disulfide
connectivity were considered and investigated in data analysis, including free
cysteine residues, the disulfide bonding pattern observed previously,96 new disulfide
bonds within the monomeric unit and inter-chain disulfide bonds between two
monomeric units.
One final obstacle in analyzing disulfide bonds of CON-S gp140 ∆CFI is dealing with

135
Figure 5. Overview of (A) “Expected” disulfide-linkages based on the disulfide bond arrangement of a previous analysis of a monomeric form of HIV Env protein expressed in CHO cells.96 and (B) experimentally determined disulfide linkages in CON-S gp140 ΔCFI. (A): disulfide linkages are indicated with a solid line and cysteine residues are shown in red; (B): cysteine residues shown in red and green represents the identified and non-identified cysteines, respectively. The cysteines

136
labeled with a star represent the free cysteines. The cysteine labeled with a circle indicates a formed inter-subunit disulfide bond to connect two monomeric units in CON-S gp140 ΔCFI. The disulfide linkages are indicated with a solid line and the variable regions (V1 to V5) are labeled.
protein glycosylation. This protein is extensively glycosylated. The glycans are bulky
and block proteases from accessing the peptide backbone. This would result in
multiple missed cleavage sites during enzymatic digestion, thus producing
complicated spectra in MS analysis. As a result, the glycans attached to CON-S
gp140 ∆CFI were cleaved prior to the disulfide mapping, to facilitate trypsin
digestion.
Control experiment to validate the deglycosylation step in disulfide mapping of CON-
S gp140 ∆CFI
While the deglycosylation step is essential in assigning the disulfide bond
arrangement of CON-S gp140 ∆CFI, it is possible that this process would result in
disulfide scrambling. Herein, we introduced a control experiment to investigate this
possibility. The validation protein, bovine serum albumin, was incubated with
PNGase F at 37 °C for one week, followed by alkylation with 4-Vinylpyridine and
tryptic digestion. The resultant tryptic peptides containing inter-/intra-disulfide
linkages were subjected to LC/ESI-FTICR-MS analysis. Our study shows that the
same disulfide connectivity in BSA is obtained, compared to the results described in
the previous section. This demonstrates that the conditions described herein for the
extra deglycosylation step do not affect the determination of disulfide linkages in
glycoproteins.
Determination of disulfide bonds in CON-S gp140 ∆CFI

137
A schematic work-flow of disulfide-mapping in CON-S gp140 ∆CFI is shown
in Figure 2B. The glycoprotein was enzymatically deglycosylated with PNGase F by
incubating the protein:enzyme solution at 37°C for one week. The enzymatic release
of glycans converts asparagine in the peptide consensus sequence NXT/S to
aspartic acid, which results in a mass shift of 1 Da; see Scheme 1.
It is necessary to know which asparagines (N) would be converted to aspartic acids
(D) during deglycosylation, so that the theoretical masses of each peptide would be
elucidated; therefore, the glycosylation site occupancy of the protein must be known
or determined. The determination of glycosylation site occupancy in CON-S gp140
∆CFI was achieved and described in a previous work.128 Accordingly, the cysteine-
containing tryptic peptides from CON-S gp140 ∆CFI with fully or partially occupied
glycosylation sites and their corresponding deglycosylated peptide masses are listed
in Table 2. The masses in this table were used to generate theoretical masses for a
wide variety of possible disulfide-linked peptides, as described above, and this list of
theoretical masses was interrogated against the mass spectral data, in order to
determine the disulfide connectivity of this protein.

138
Table 2. Glycosylation sites occupancy on the Cys-containing tryptic peptides of CON-S gp 140 ΔCFI
The mass spectral data was acquired by first subjecting the deglycosylated
CON-S gp140 ∆CFI to tryptic digest, then obtaining an LC/ESI-FTICR-MS analysis.
Representative reverse-phase HPLC chromatogram and ESI-FTICR MS data of
tryptic peptides from deglycosylated CON-S gp140 ∆CFI are shown in Figure 6A and
B, respectively. The FTICR-MS spectrum of HPLC fraction eluting between 14-15
min (the red bar shown in Figure 6A) shows a doubly charged peak at m/z 788.8779
originating from an intra-chain disulfide linked peptide, LINCDTSAITQACPK. Figure
6 inset shows a zoomed-in spectrum of this peak, which is used to identify the
monoisotopic peak at m/z 788.3805 and its corresponding charge state. The aspartic
acid residue (labeled in green) was generated upon deglycosylation with PNGase F,
as described above.
The summary of all the experimentally determined disulfide linkages in CON-
S gp140 ∆CFI is shown in Table 3. Only two interchain disulfide linked peptides were
detected as having a disulfide bonding pattern consistent with the disulfide bonding
observed in the previous analysis of a monomeric form of Env protein.96 These two

139
disulfide-linked peptides form the third and forth variable regions (V3, V4) in CON-S
gp140 ∆CFI. It is worth noting that the V3 loop is an immunodominant region, which
is responsible for the generation of a wide range of neutralizing antibodies.53 Aside
from these two disulfide-linked peptides, which are consistent with the “expected”
disulfide-linkages for monomeric Env,96 several peptides with unpaired cysteine
residues, intra-, and inter-chain disulfide linkages were identified, which are also
listed in Table 3. Most notable in this group of newly-described disulfide bonding is
the tryptic peptide CNDKK, which forms an inter-subunit disulfide bond, where a
disulfide bond connects the same peptide region present in two monomeric units.
This disulfide-linked peptide demonstrates the exact cysteine residue responsible for
the oligomerization of this protein.
To further verify each of the disulfide linkages and peptide sequences of
these peptide clusters, MS/MS analysis was performed. In each case, the MS/MS
data is consistent with the assignments presented in Table 3. Representative
LC/ESI-LTQ-FTICR MS/MS data are shown in Figure 7. Three classes of peptides
containing intra-, inter-, and self-linked disulfide bonds have been confirmed by the
fragmentation ions observed in the MS/MS analysis. Figure 7A depicts the
fragmentation of a peptide with an intra-chain disulfide linkage. For the product ions
at m/z 779.74 and 874.77, in which the disulfide bonds are dissociated, the termini of
the cysteine residues were detected as thiol groups (-SH), as expected, based on
prior work.98 The ion at m/z 975.50, with an intact disulfide bond, demonstrates that
this peptide indeed contains an intra-chain disulfide linkage. All of the other major
ions in the spectrum are also assignable, and consistent with the peptide sequence
shown on the Figure.

140
Figure 7B and C represent the verification of an interchain disulfide-linked
peptide and the peptides forming an inter-protein disulfide bond, connecting the two
monomeric subunits in CON-S gp140 ∆CFI, respectively. In Figure 7B, the product
ions denoted y/b were generated from the peptide chain with an N-terminal threonine
(T), whereas product ions denoted Y/B were produced from the peptide chains with
N-terminal isoleucine (I). As in Figure 7A, the data in 7B and 7C clearly show that the
MS/MS data is highly consistent with the assignment for each precursor ion, further
validating the data in Table 3.
An overview of the experimentally determined disulfide bonds from this study
is shown in Figure 5B. In the N-terminal region (defined by amino acid residues 1-
250) of CON-S gp140 ∆CFI, six cysteine residues form intra-, and inter-chain
disulfide bonds; one cysteine residue forms an inter-protein disulfide bond which
connects the same regions of two monomeric units in CON-S gp140 ∆CFI; and five
unpaired cysteine residues are present in the early region of the protein. While the
disulfide connectivity in the N-terminal region of the protein is completely different,
the disulfide linkages from V3 and V4 regions are consistent with the putative
disulfide bonds in a previous analysis of a monomeric form of Env protein.96 Overall,
out of 18 cysteine residues in CON-S gp140 ∆CFI, 16 cysteine residues have been
identified by LC/ESI-FTICR MS analysis. Two cysteine residues within the V4 loop,
Cys380 and Cys409, were not detected. This is probably due to the fact that the tryptic
peptide generated within V4 loop would be large, and it contains numerous acidic
amino acid residues, so its ionization efficiency in MS would be problematic.

141
Figure 6. Representative (A) reverse-phase HPLC chromatogram and (B) LC/ESI-FTICR MS data of tryptic peptides from CON-S gp140 ΔCFI; The tryptic peptides are separated within a 60-min gradient. The MS spectrum of HPLC fraction eluting at 14-15 min (labeled with a red bar in A) shows a peak at m/z 788.8779 (in red) corresponding to the disulfide-linked tryptic peptides. Inset: The zoomed-in spectrum of the detected disulfide-linked peptide peak, which is used to identify the monoisotopic peak and charge state.

142
Table 3. Summary of the disulfide linkages in CON-S gp140 ΔCFI detected by LC-LTQ-FTICR
*: free cysteines are alkylated by 4-vinylpyridne; Asparagine in NXT/S is converted to aspartic
acid upon deglycosylation and labeled in green.

143
Figure 7. Representative LC/ESI-FTICR MS/MS data for the disulfide-linked tryptic peptides from CON-S gp140 ΔCFI (A) peptide with an internally linked disulfide bond; (B) disulfide-linked peptides within the V4 loop (C) peptide with a self-linked disulfide bond, showing where the inter-subunits contact point in CON-S gp140 ΔCFI is located. N’ and K’ indicate that the side chain of asparagine and lysine are cleaved, while the peptide backbone remains intact.

144
Biological implications of this study
The results obtained from this study demonstrate that the disulfide
connectivity of CON-S gp140 ∆CFI is dramatically different than the disulfide
linkages in the previously analyzed monomeric form of HIV Env protein expressed
from CHO cells96 (Figure 5A), especially in the N-terminal region of protein where
the first and second variable regions (V1, V2) are normally formed.
Our findings complement a previous study by Jobes et al, which shows that
the V1 and V2 regions of Env are highly variable, with the respect to the cysteine
content.129 These authors suggest that when the insertion or deletion of cysteine
residues occurs in these regions, it could result in the disruption of normal disulfide
bonds.129 Both our work and this previous work show that the cysteine residues in
the N-terminal region of Env can have a varying disulfide connectivity. The V1 and
V2 region of the protein are important, because they shield the V3 region, preventing
antibodies from directly accessing neutralizing epitopes present in V3.129-131 Since
the disulfide linkages of the V1 region in CON-S gp140 ∆CFI are connected
differently than those described previously,96, 111-114 and many unpaired cysteine
residues are present, the disulfide connectivity in CON-S gp140 ∆CFI may cause the
epitopes in the V3 region to be more exposed, facilitating immune response to this
region.
In addition, our study identified an inter-subunit disulfide bond via the self-
linked peptide, CNDKK. This peptide is near the V2 loop and is responsible for the
oligomeric nature of CON-S gp140 ΔCFI.53 This result can be used to support and
further clarify previous studies that reported the deletion of the V2 domain on the HIV
Env causes the disruption of dimeric protein conformation, implicating that this region
145
would be involved in the inter-subunit connection in the oligomeric form of Env
protein.122
Aside from the disulfide linkages in V1 and V2 regions, the final interesting
implication of this work relates to the disulfide linkage in the V3 loop, which is
identified in our study to be consistent with the disulfide bonding established for
monomeric Env.96, 111-114 This is somewhat expected, since this region was
determined to be immunodominant, and it contributes to the improved
immunogenicity in CON-S gp140 ∆CFI.53 As demonstrated here, the disulfide bond
arrangement in the N-terminal region of CON-S gp140 ∆CFI is not in agreement with
the putative disulfide linkages in literature;96 however, marked improvement of
immunogenicity in CON-S gp140 ∆CFI was obtained and described previously.53
This implies that satisfactory immune response may rely on several factors including
the presence of V3 loop, the degree of accessibility to the neutralizing epitopes on
this region, and the oligomeric conformation of Env protein, etc. Further study of the
correlation between the disulfide linkages in Env protein and its immune response
will provide more information on understanding how the antigenic structures affect
the immnogenicity. The disulfide bond mapping for other synthetic and wild-type
recombinant Env proteins is on-going and will be presented separately.
5.4 Conclusions
Aiming to elucidate the correlation between the structure of the HIV-1 Env
protein and its immunogenicity, we developed a MS-based approach, LC/ESI-FTICR,
to characterize the disulfide linkages on the Env protein CON-S gp140 ∆CFI. Prior to
applying this approach to the Env protein, the method was validated using a

146
disulfide-rich protein, bovine serum albumin. In this protein, all the 35 cysteine
residues were detected. A total 17 disulfide-linked peptides and 1 unpaired half-
cysteine residue were identified with high mass accuracy, and confirmed by MS/MS
experiments. This data is in agreement with the putative disulfide linkages reported
previously for BSA.126
This approach was then applied to elucidate the disulfide connectivity in
CON-S gp140 ∆CFI. Out of 18 cysteine residues, 16 cysteine residues were
identified. In the N-terminal region of CON-S gp140 ∆CFI, one cysteine residue
Cys225 was identified as forming an inter-subunit disulfide bond, stabilizing the
dimeric composition of this HIV-1 Env protein. Six cysteines are involved in forming
disulfide bonds within the monomeric units. In addition to the cysteines that are
utilized in disulfide bond connectivity, five free cysteine residues are present in the N-
terminal region of CON-S gp140 ∆CFI.
Although the cysteine residues in the N terminal region of the protein are
different from the putative disulfide linkages from an analysis of a monomeric form of
HIV Env protein,96 the V3 and V4 loops formed in the later region of the protein are
indeed identified in CON-S gp140 ∆CFI. Among these two regions, the V3 loop is
immunodominant and contributes to the improved immunogenicity of CON-S gp140
∆CFI. The disulfide bond determination of CON-S gp140 ∆CFI indicates that the
satisfactory immune response may depend on several factors including the presence
of the V3 loop, the degree of accessibility to the neutralizing epitopes on this region,
and the oligomeric conformation of Env protein, etc.
Acknowledgements

147
The authors acknowledge the National Institute of Health for funding (project
number RO1GM077266, PO1AI61734) and a Collaboration for AIDS Vaccine
Development Grant from the Bill and Melinda Gates Foundation to Dr. Barton F.
Haynes.
5.5 References
1. Fukuyama, Y.; Iwamoto, S.; Tanaka, K.J. Rapid sequencing and disulfide mapping of peptides containing disulfide bonds by using 1,5-diminonaphthalene as a reductive matrix. J. Mass. Spectrom. 2006, 41, 191-201. 2. Leonard, C.K.; Spellman, M.W.; Riddle, L.; Harris, R. J.; Thomas, J. N.; Gregory, T. J. Assignment of intrachain disulfide bonds and characterization of potential glycosylation sites of the type 1 recombinant human immunodeficiency virus envelope glycoprotein (gp120) expressed in Chinese hamster ovary cells. J. Biol. Chem. 1990, 265, 10373-10382. 3. Wefing, S.; Schnaible, V.; Hoffmann, D. SearchXLinks. A program for the identification of disulfide bonds in proteins from mass spectra. Anal. Chem. 2006, 78, 1235-1241. 4. Zhang, M.; Kaltashov, I. A. Mapping of protein disulfide bonds using negative ion fragmentation with a broadband precursor selection. Anal. Chem. 2006, 78, 4820-4829. 5. Nguyen, D. N.; Bechker, G. W.; Riggin, R. M. Protein mass spectrometry: application to analytical biotechnology. J. Chromatogr. A. 1995, 705, 21-45. 6. Baneyx, F.; Mujacic, M. Recombinant protein folding and misfolding in Escherichia Coli. Nat. Biotechnol. 2004, 22, 1399-1408. 7. Gorman, J.J.; Wallis, T.P.; Pitt, J.J. Protein disulfide bond determination by mass spectrometry. Mass Spectrom. Rev. 2002, 21, 183-216. 8. Smith, D.L.; Zhou, Z. Strategies for locating disulfide bonds in proteins. Methods Enzymol. 1990, 193, 374-389. 9. Haniu, M.; Arakawa, T. Analysis of disulfide structures in proteins. Curr. Top. Pept. Protein Res. 1997, 2, 115-124. 10. Craik, D.J.; Daly, N.L. NMR as a tool for elucidating the structures of circular and knotted proteins. Mol. Biosyst. 2007, 3, 257-265.

148
11. Acharya, K. R.; Lloyd, M.D. The advantages and limitations of protein crystal structures. Trends Pharmacol. Sci. 2005, 26, 10-14. 12. Liu, H.; Hsu, J. Recent developments in structural proteomics for protein structure determination. Proteomics. 2005, 5, 2056-2068. 13. Andrews, P.C. Selective isolation of disulfide-containing peptides from trypsin digests using strong cation exchange HPLC. Curr. Res. Protein Chem. 1990, 95-102. 14. Crimmins, D.L.; Analysis of disulfide-linked homo- and hetero-peptide dimmers with a strong cation-exchange sulfoethyl aspartamide column. Pept. Res. 1989, 2, 395-401. 15. Brown J.R.; Kauffman, D.L.; Hartley, B.S. Primary structure of porcine pancreatic elastase; The N-terminus and disulfide bridges. Biochem. J. 1967, 103, 497-507. 16. Haniu, M.; Arakawa, T.; Bures, E.J.; Young, Y.; Hui, J.O.; Rohde, M.F.; Welcher, A.A; Horan, T. Human leptin receptor. Determination of disulfide structure and N-glycosylation sites of the extracellular domain. J. Biol. Chem. 1998, 273, 28691-28699. 17. Irungu, J.; Go, E.P.; Dalpathado, D.S.; Desaire, H. Simplification of mass spectral analysis of acidic glycoprptides using GlycoPep ID. Anal. Chem. 2007, 79, 3065-3074. 18. Owusu-Apenten, R.K.; Chee, C.; Hwee, O.P. Evaluation of a sulphydryl-disulphide exchange index (SEI) for whey proteins ─ β-lactoglobulin and bovine serum albumin. Food Chem. 2003, 83, 541-545. 19. Liao, H.; Sutherland, L.L.; Xia, S.; Brock, M. E.; Scearce, R. M.; Vanleeuwen, S.; Alam, S. M.; McAdams, M.; Weaver, E. A.; Camacho, Z. T.; Ma, B.; Li, Y.; Decker, J. M.; Nabel, G. J.; Montefiori, D. C.; Hahn, B. H.; Korber, B. T.; Gao, F.; Haynes, B. F. A group M consensus envelope glycoprotein induces antibodies that neutralize subsets of subtype B and C HIV-1 primary viruses. Virology 2006, 353, 268-282. 20. Kwong, P.D.; Wyatt, R.; Robinson, J.; Sweet, R.W.; Sodroski, J.; Hendrickson, W.A. Structure of an HIV gp120 envelope glycoprotein in complex with the CD4 receptor and a neutralizing human antibody. Nature 1998, 393, 648-659. 21. Wyatt, R.; Kwong, P.D.; Desjardins, E.; Sweet, R.W.; Robinson, J.; Hendrickson, W.A.; Sodroski, J.G. The antigenic structure of the HIV gp120 envelope glycoprotein. Nature 1998, 393, 705-711. 22. Zhou, T.; Xu, L.; Dey, B.; Hessell, A.J.; Van, R.D.; Xiang, S-H.; Yang, X.; Zhang, M-Y.; Zwick, M.B.; Arthos, J.; Burton D.R.; Dimitrov D.S.; Sodroski, J.; Wyatt, R.; Nabel, G.J.; Kwong, P.D. Structural definition of a conserved neutralization of epitope on HIV-1 gp120. Nature 2007, 445, 732-737.

149
23. Chen, B.; Vogan, E.M.; Gong, H.; Skehel, J.J.; Wiley, D.C.; Harrison, S.C. Structure of an unliganded simian immunodeficiency virus gp120 core. Nature 2005, 433, 834-841. 24. Flynn, N. M.; Forthal, D. N.; Harro, C. D.; Judson, F. N.; Mayer, K. H.; Para, M. F. Placebo-controlled phase 3 trial of a recombinant glycoprotein 120 vaccine to prevent HIV-1 infection. J. Infect. Dis. 2005, 191, 654-665. 25. Gilbert, P. B.; Peterson, M. L.; Follmann, D.; Hudgens, M. G.; Francis, D. P.; Gurwith, M.; Heyward, W. L.; Jobes, D. V.; Popovic, V.; Self, S. G.; Sinangil, F.; Burke, D.; Berman, P. W. Correlation between immunologic responses to a recombinant glycoprotein 120 vaccine and incidence of HIV-1 infection in a phase 3 HIV-1 preventive vaccine trial. J. Infect. Dis. 2005, 191, 666-677. 26. Sharma, V.A.; Kan, E.; Sun, Y.; Lian, Y,; Cisto, J.; Frasca, V.; Hilt, S.; Stamatotos, L.; Donnelly, J.J.; Ulmer, J.B.; Barnett, S.W.; Srivastava, I.K. Structural characteristic correlate with immune responses induced by HIV envelope glycoprotein vaccines. Virology 2006, 352, 131-144. 27. Srivastava, I.K.; Stamatatos, L.; Legg, H.; Kan, E.; Fong, A.; Coates, S.R.; Leung, L.; Wininger, M.; Donnelly, J.J.; Ulmer, J.B.; Barnett, S.W. Purification and characterization of oligomeric envelope glycoprotein from a primary R5 subtype B human immunodeficiency virus. J. Virol. 2002, 76, 2835-2847. 28. Srivastava, I.K.; Stamatatos, L.; Kan, E.; Vajdy, M.; Lian, Y.; Hilt, S.; Martin, L.; Vita, C.; Zhu, P.; Roux, K.H.; Vojtech, L.; Montefiori, D.C.; Donnelly, J.; Ulmer, J.B.; Barnett, S.W. Purification, characterization, and immunogenicity of a soluble trimeric envelope protein containing a partial deletion of the V2 loop derived from SF162, an R5-tropic human immunodeficiency virus type 1 isolate. J. Virol. 2003, 77, 11244-11259. 29. Barnett, S.W.; Srivastava, I.K.; Ulmer, J.B.; Donnelly, J.J.; Rappuoli, R. Development of V2-deleted trimeric envelope vaccine candidates from human immunodeficiency virus type 1 (HIV-1) subtypes B and C. Microbes Infect. 2005, 7, 1386-1391. 30. Yuan, W.; Craig, S.; Yang, X.; Sodroski, J. Inter-subunit disulfide bonds in soluble HIV-1 envelope glycoprotein trimers. Virology, 2005, 332, 369-383. 31. Center, R.J.; Earl, P.L.; Lebowitz, J.; Schuck, P.; Moss, B. The human immunodeficiency virus type 1 gp120 V2 domain mediates gp41-independent intersubunit contacts. J. Virol. 2000, 74, 4448-4455. 32. Center, R.J.; Leapman, R.D.; Lebowitz, J.; Arthur, L.O.; Earl, P.L.; Moss, B. Oligomeric structure of the human immunodeficiency virus type 1 envelope protein on the viron surface. J. Virol. 2002, 76, 7863-7867.

150
33. Ihling, C.; Berger, K.; Hoefliger, M.M.; Fuehrer, D.; Beck-Sickinger, A.G.; Sinz, A. Nano-high-performance liquid chromatography in combination with nano-electrospray ionization Fourier transform ion-cyclotron resonance mass spectrometry for proteome analysis. Rapid. Commun. Mass Spectrom. 2003, 17, 1240-1246. 34. Schnaible, V.; Wefing, S.; Buecker, A.; Wolf-Kuemmeth, S.; Hoffmann, D. Screening for disulfide bonds in proteins by MALDI in-source decay and LIFT-TOF/TOF-MS. Anal. Chem. 2002, 74, 2386-2393. 35. Brown, J.R. Structure of serum albumin: disulfide bridges. Fed. Proc. 1974, 33, 1389-1389. 36. Moritz, R.L.; Hall, N.E.; Connolly, L.M.; Simpson, R.J. Determination of the disulfide structure and N-glycosylation sites of the extracellular domain of the human signal transducer gp130. J. Biol. Chem. 2001, 276, 8244-8253. 37. Go, E.P.; Irungu, J.; Zhang, Y.; Dalpathado, D.S.; Liao, H-X.; Sutherland, L.L.; Alam, S.M.; Haynes, B.F.; Desaire, H. Glycosylation site-specific analysis of HIV envelope proteins (JR-FL and CON-S) reveals major differences in glycosylation site occupancy, glycoform profiles, and antigenic epitopes’ accessibility. Submitted 38. Jobes, D.V.; Daoust, M.; Nguyen, V.; Padua, A.; Michele, S.; Lock, M.D.; Chen, A.; Sinangil, F.; Berman, P.W. High incidence of unusual cysteine variants in gp120 envelope proteins from early HIV type 1 infections from a phase 3 vaccine efficacy trial. AIDS. Res. Hum. Retroviruses. 2006, 22, 1014-1021. 39. Mckeating, J.A.; Shotton, C.; Cordell, J.; Graham, S.; Balfe, P.; Sullivan, N.; Charles, M.; Page, M.; Bolmstedt, A. Characterization of neutralizing monoclonal antibodies to linear and conformation-dependent epitopes within the first and second variable domains of human immunodeficiency virus type 1 gp120. J. Virol. 1993, 67, 4932-4944. 40. Pinter, A.; Honnen, W.J.; He, Y.; Gorny, M.K.; Zolla-Pazner, S.; Kayman, S.C. The V1/V2 domain of gp120 is a global regulator of the sensitivity of primary human immunodeficiency virus type 1 isolates to neutralization by antibodies commonly induced upon infection. J. Virol. 2004, 78, 5205-5215.

151
Chapter IV
Conclusions
In order to understand biological functional properties of glycoproteins,
several efficient MS-based approaches have been developed in this study to
characterize glycans on the glycoproteins.
To identify the acidic functional groups (sulfate, and phosphate) on the
carbohydrates and glycopeptides, an ion-pairing strategy in conjunction with ESI-
MS/MS was developed on the model phosphorylated and sulfated monosaccharides
to differentiate between these two functional groups. Since both sulfate and
phosphate are highly acidic compounds with different proton affinities, differences in
the chemical reactivities with the ion-pairing reagents can be used to differentiate
these isobaric compounds in MS/MS experiments. This approach was subsequently
applied to the other biological relevant molecules, such as mono-, di-saccharides,
and sulfated glycopeptides to differentiate phosphorylation and sulfation on these
species.
Aside from identification of acidic glycans on the glycoproteins, we also
designed an experimental workflow that maximizes coverage of glycosylation
heterogeneity on glycoproteins that vary in the number of glycosylation sites and
their corresponding glycan profiles. All the features of glycopeptide-based MALDI-
MS analysis, including sample preparation methods, mass spectral data acquisition,
and data analysis were optimized. In doing so, we designed a work-flow for glycan
profiling on heavily glycosylated glycoproteins, such as HIV virus envelope protein ─
JR-FL gp 140 ∆CF, which contains 27 glycosylation sites. Out of 27 glycosylation
sites, 23 glycosylation sites and over 300 glycoforms have been detected on this

152
protein.
In addition to glycan profiling on glycoproteins, disulfide connectivity is
another predominant feature in elucidation of chemical structure of a protein and
define its functional domains. Aiming to elucidate the correlation between the
structure of HIV Env protein and its immunogenicity, we validated a MS-based
approach, LC/ESI-FTICR, by characterizing the disulfide linkages on bovine serum
albumin to optimize the experimental conditions. This approach was subsequently
applied in the determination of disulfide bonds in a HIV Env protein CON-S gp140
∆CFI. In this protein, out of 18 cysteine residues, 16 cysteine residues were
identified. Two functional domains previously identified in monomeric Env protein,
the third and forth variable regions (V3, and V4), are also conserved in the disulfide
bonding in CON-S gp140 ∆CFI. One cysteine residue Cys225 was identified as
forming an inter-subunit disulfide bond to stabilize the oligomeric structure of CON-S
gp140 ∆CFI. Aside from the cysteines that are utilized in disulfide bond connectivity,
the peptides with free cysteine residues are also present in CON-S gp140 ∆CFI. The
information obtained from this study will facilitate understanding how the disulfide
bond arrangement correlates to immunogenetic activities of oligomeric form of HIV
Env protein and may also provide the insights into the direction for the future vaccine
development.