method number: id-200 withdrawn
TRANSCRIPT
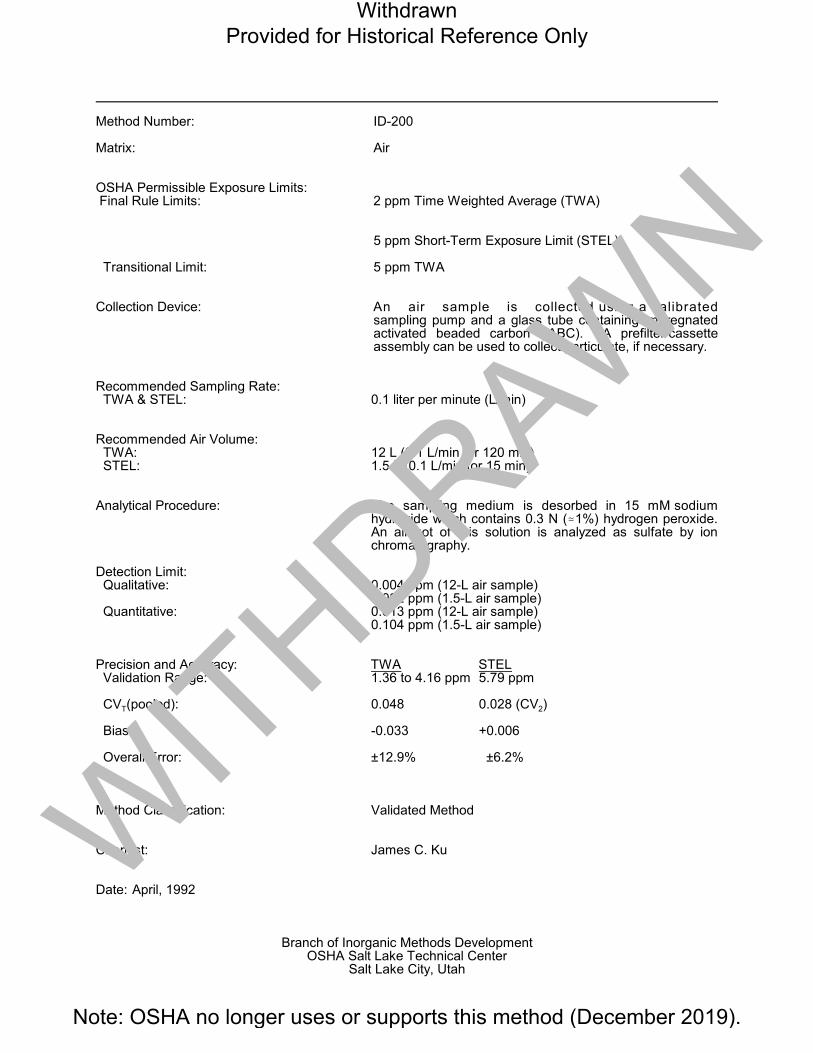
Method Number: ID-200
Matrix: Air
OSHA Permissible Exposure Limits: Final Rule Limits: 2 ppm Time Weighted Average (TWA)
5 ppm Short-Term Exposure Limit (STEL)
Transitional Limit: 5 ppm TWA
Collection Device: An air sample is collected using a calibrated sampling pump and a glass tube containing impregnated activated beaded carbon (IABC). A prefilter/cassette assembly can be used to collect particulate, if necessary.
Recommended Sampling Rate:
hydroxide which contains 0.3 N (.1%) hydrogen peroxide.
TWA & STEL: 0.1 liter per minute (L/min)
Recommended Air Volume: TWA: STEL:
12 L (0.1 L/min for 120 min) 1.5 L (0.1 L/min for 15 min)
Analytical Procedure: The sampling medium is desorbed in 15 mM sodium
An aliquot of this solution is analyzed as sulfate by ion chromatography.
Detection Limit: Qualitative: 0.004 ppm (12-L air sample)
0.032 ppm (1.5-L air sample) Quantitative: 0.013 ppm (12-L air sample)
0.104 ppm (1.5-L air sample)
Precision and Accuracy: TWA STEL Validation Range: 1.36 to 4.16 ppm 5.79 ppm
CVT(pooled): 0.048 0.028 (CV2)
Bias: -0.033 +0.006
Overall Error: ±12.9% ±6.2%
Method Classification: Validated Method
Chemist: James C. Ku
Date: April, 1992
Branch of Inorganic Methods DevelopmentOSHA Salt Lake Technical Center
Salt Lake City, Utah
Withdrawn Provided for Historical Reference Only
Note: OSHA no longer uses or supports this method (December 2019).
WITHDRAWN
______________________________________________________________________
______________________________________________________________________
Commercial manufacturers and products mentioned in this method are for descriptive use only and do not constitute endorsements by
USDOL-OSHA.
Similar products from other sources can be substituted.
Withdrawn Provided for Historical Reference Only
Note: OSHA no longer uses or supports this method (December 2019).
WITHDRAWN
1. Introduction
This method describes the sample collection and analysis of airborne sulfur dioxide (SO2). Samples are taken in the breathing zone of workplace personnel, and analysis is performed by ion chromatography (IC).
1.1. History
Previously, OSHA collected compliance samples for SO2 exposure determinations in midget-fritted glass bubblers containing 0.3 N (.1%) hydrogen peroxide (H2O2) which converted the SO2 to sulfuric acid (H2SO4). The amount of sulfate (SO42-) in the peroxide solution was measured by ICand gravimetrically converted to represent the amount of SO2 collected (5.1.). Because bubblers are inconvenient to use as personal samplers due to spillage or breakage, it was desirable to develop a solid-sorbent sampling method. A method for collecting SO2 was developed, which sampled SO2 in the air using a sampling tube containing impregnated charcoal (5.2., 5.3.). The chemical(s) used for charcoal impregnation were not specified and appear to be proprietary; however, the reaction implies an oxidation of SO2 using a metal hydroxide base. The impregnated charcoal oxidized SO2 to SO42-, which was then desorbed using a weakly basic solution. An aliquot of the solution was analyzed by IC (5.2., 5.3.). Unfortunately, background levels of SO42- found in the impregnated charcoal were considered unacceptable, especially when applying the current Permissible Exposure Limit (PEL) of 2 ppm. Previously, the OSHA Time Weighted Average (TWA) PEL was 5 ppm SO2. Because of this contamination and the PEL reduction, OSHA reinstituted use of the bubbler method listed in reference 5.1. until better methodology could be found.
Using the principle applied for the impregnated charcoal collection of SO2, a new material, impregnated activated beaded carbon (IABC) was developed. The IABC has a significantly lower background level of SO4
2- (< 3 µg). This current method was evaluated using the IABC as the collection media.
1.2. Principle
Sulfur dioxide is collected using IABC sorbent which is contained in a glass tube. The collected SO2
is converted to sulfite (SO32-) by the sorbent and then slowly oxidized to SO42-. This oxidation is augmented at the laboratory by addition of a desorbing solution containing 0.3 N (.1%) H2O2 in 15 mM sodium hydroxide (NaOH) to each IABC sample. The resultant SO42- is analyzed by IC usinga conductivity detector; a gravimetric conversion is used to calculate the amount of SO2 collected.
1.3. Advantages and Disadvantages
1.3.1. This method has adequate sensitivity for determining compliance with the OSHA Short-TermExposure Limit (STEL) of 5 ppm and the TWA-PEL of 2 ppm for workplace exposures to SO2.
1.3.2. The method is simple, rapid, and easily automated.
1.3.3. The SO42- contaminant (background) levels of the IABC sorbent are very low (< 3 µg),especiallywhen compared to the impregnated charcoal previouslyused in OSHA Method No.ID-107.
1.3.4. A disadvantage is the need for a desorption efficiency (DE) correction which is mass-dependent and may be lot-dependent (also see Sections 3.7.3. and 4.1.).
1.4. Method Performance
A synopsis of method performance is presented below. Further information can be found in Section 4.
1.4.1. This method was validated over the concentration range of 1.36 to 4.16 ppm. An air volume of 12 L and a flow rate of 0.1 L/min were used.
1.4.2. The qualitative detection limit was 0.0187 µg/mL or 0.187 µg (as SO42-) when using a 10-mL solution volume. This corresponds to 0.005 ppm SO2 for a 12-L air volume.
1.4.3. The quantitative detection limit was 0.0624 µg/mL or 0.624 µg (as SO42-) when using a 10-mL solution volume. This corresponds to 0.016 ppm SO2 for a 12-L air volume. A 50-µL sample
Withdrawn Provided for Historical Reference Only
Note: OSHA no longer uses or supports this method (December 2019).
WITHDRAWN
loop and a detector setting of 1 microsiemens (µS) full-scale output were used.
1.4.4. The sensitivity of the analytical method, when using the instrumental parameters listed in Section 3.6., was calculated from the slope of a linear working range curve (0.5 to 10 µg/mLSO42-). The sensitivity was 2.2 × 10⁷ area units per 1 µg/mL. A Dionex Series 4500i ion chromatograph with AI450 computer software was used (Dionex, Sunnyvale, CA).
1.4.5. This method compared favorably to OSHA Method no. ID-104 (modified) for SO2 (5.1.)which served as the reference method.
1.4.6. A desorption efficiency (DE) correction is required at mass loadings up to 400 µg SO2 (see Sections 3.7.3. and 4.1.).
1.4.7. The total pooled coefficient of variation (CVT) for samples taken at about 0.5, 1, and 2 timesthe OSHA PEL (1 to 4 ppm for TWA-type samples) was 0.048. The method exhibited slight negative bias (-3.3%) for this concentration range after DE corrections were applied. Other concentration range and TWA results are shown below:
TWA STEL LOW
CV 0.048 0.028 0.032
Bias -3.3% +0.6% -6.5%
OE ±12.9% ±6.2% ±12.9%
For the STEL evaluation, 5.32 ppm was used for test atmospheres. For sampling at a concentration (LOW) near what may be expected in indoor air monitoring, approximately 0.3 ppmSO2 was used. Bias and overall error (OE) values were calculated from those found analytically versus theoretical (known) values. The theoretical concentrations were calculated from flows of a certified cylinder of SO2 and dilution air.
1.4.8. The collection efficiency at 2 times the PEL was 100%. Samples were collected from a generated test atmosphere of 4 ppm SO2 for 120 min.
1.4.9. Breakthrough tests were performed at concentrations of 7.20 and 14.8 ppm SO2. No breakthrough was found for a sampling time of 240 min and an average sample flow rate of 0.1L/min.
1.4.10. Samples can be stored at ambient (20 to 25 EC) temperature for a period of at least 30 days. Storage stability results show the mean sample recovery after 30 days was within ±10% of thetheoretical calculations. Samples were stored on a laboratory bench.
1.5. Interferences
1.5.1. Other particulate sulfate compounds and H2SO4 will interfere in the analysis of SO2 if they are collected in the IABC. Particulate and H2SO4 mist can be removed from the air during samplingusing a modified sampling device which contains a Teflon® pre-filter (see Section 2.1.).
1.5.2. Sulfur trioxide gas (SO3), if present in a dry atmosphere, can give a positive bias in the SO2
determination.
1.5.3. Any substance that has the same retention time as SO42-, when using the ion chromatographic operating conditions described in this method, is an interference. If the possibility of an interference exists, changing the separation conditions (column, eluent flow rate and strength,etc.) may circumvent the problem.
1.6. Source of Exposure
Sulfur dioxide is generated as a by-product from many industrial processes. These include the smelting of sulfide ores, the combustion of coal or fuel oils containing sulfur as an impurity, papermanufacturing, and petroleum refining (5.4.).
Withdrawn Provided for Historical Reference Only
Note: OSHA no longer uses or supports this method (December 2019).
WITHDRAWN
____________________________________________________________________
____________________________________________________________________
1.7. Physical and Chemical Properties (5.4., 5.5.)
Sulfur dioxide (CAS No. 7446-09-5)
Chemical formula SO2
Formula weight 64.07 Melting point -72.7 EC Boiling point -10.0 EC Vapor density 2.3 (air = 1)
SO2 is a colorless, nonflammable gas with a characteristic, strong, and suffocating odor. It is soluble in water, methanol, ethanol, chloroform, ethyl ether, acetic acid, and sulfuric acid.
1.8. Toxicology (5.6.)
Information listed within this section is a synopsis of current knowledge of the physiological effectsof SO2 and is not intended to be used as a basis for OSHA policy.
Sulfur dioxide is intensely irritating to the eyes and respiratory tract. Workplace exposure to SO2
can cause both chronic and acute effects. The chronic effects of exposure include permanentpulmonary impairment, which is caused by repeated episodes of bronchoconstriction. It has been reported that workers exposure to high concentrations of SO2 (80 to 100 ppm) may cause an increased incidence of nasopharyngitis, shortness of breath on exertion (dyspnea), and chronic fatigue. Concentrations of SO2 from 2 to 36 ppm produced a significantly higher frequency of respiratory disease symptoms, including chronic coughing, expectoration, and dyspnea.
The acute effects include upper respiratory tract irritation, rhinorrhea, choking, and coughing. Within 5 to 15 minutes from the onset of exposure, workers develop temporary reflex bronchoconstriction and increased airway resistance.
2. Sampling
2.1.Equipment
2.1.1 Calibrated personal sampling pumps capable of sampling within ±5% of the recommendedflow rate of 0.1 L/min are used.
2.1.2. Solid sorbent sampling tubes are prepared using glass tubes, glass wool plugs, and IABC.Sampling tubes can be commercially obtained. Two types of sampling tubes are commercially available:
Withdrawn Provided for Historical Reference Only
Note: OSHA no longer uses or supports this method (December 2019).
WITHDRAWN
Type I is a glass tube packed with a 100-mg IABC front and 50-mg backup section (Cat. No. 226-80, SKC Inc., Eighty Four, PA). The IABC is held in place with glass wool, foam, and a stainless steel retainer clip. If interference from particulate is probable, a prefilter/cassette samplingassembly can be used with this tube. See Section 2.1.5. for more details regarding the prefilter.
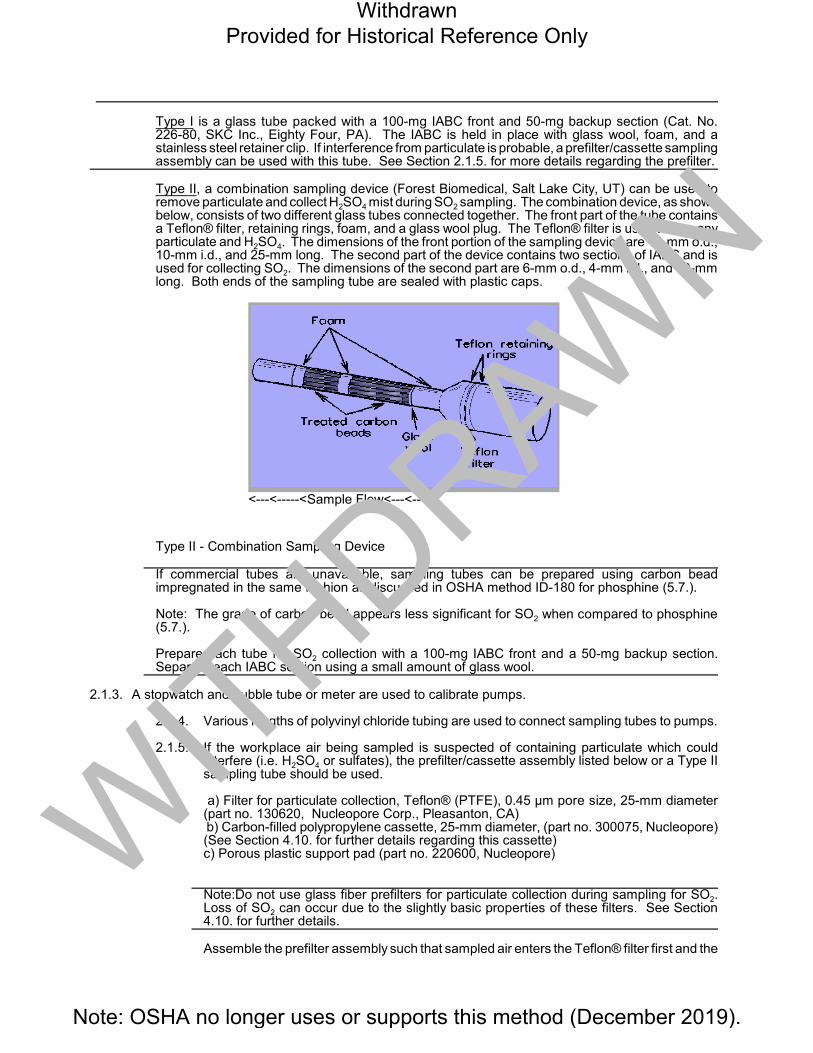
Type II, a combination sampling device (Forest Biomedical, Salt Lake City, UT) can be used to remove particulate and collect H2SO4 mist during SO2 sampling. The combination device, as shownbelow, consists of two different glass tubes connected together. The front part of the tube contains a Teflon® filter, retaining rings, foam, and a glass wool plug. The Teflon® filter is used to trap any particulate and H2SO4. The dimensions of the front portion of the sampling device are 12-mm o.d.,10-mm i.d., and 25-mm long. The second part of the device contains two sections of IABC and is used for collecting SO2. The dimensions of the second part are 6-mm o.d., 4-mm i.d., and 50-mm long. Both ends of the sampling tube are sealed with plastic caps.
<---<-----<Sample Flow<---<------
Type II - Combination Sampling Device
If commercial tubes are unavailable, sampling tubes can be prepared using carbon bead impregnated in the same fashion as discussed in OSHA method ID-180 for phosphine (5.7.).
Note: The grade of carbon bead appears less significant for SO2 when compared to phosphine (5.7.).
Prepare each tube for SO2 collection with a 100-mg IABC front and a 50-mg backup section. Separate each IABC section using a small amount of glass wool.
2.1.3. A stopwatch and bubble tube or meter are used to calibrate pumps.
2.1.4. Various lengths of polyvinyl chloride tubing are used to connect sampling tubes to pumps.
2.1.5. If the workplace air being sampled is suspected of containing particulate which could interfere (i.e. H2SO4 or sulfates), the prefilter/cassette assembly listed below or a Type IIsampling tube should be used.
a) Filter for particulate collection, Teflon® (PTFE), 0.45 ìm pore size, 25-mm diameter (part no. 130620, Nucleopore Corp., Pleasanton, CA)b) Carbon-filled polypropylene cassette, 25-mm diameter, (part no. 300075, Nucleopore)(See Section 4.10. for further details regarding this cassette) c) Porous plastic support pad (part no. 220600, Nucleopore)
Note:Do not use glass fiber prefilters for particulate collection during sampling for SO2. Loss of SO2 can occur due to the slightly basic properties of these filters. See Section 4.10. for further details.
Assemble the prefilter assembly such that sampled air enters the Teflon® filter first and the
Withdrawn Provided for Historical Reference Only
Note: OSHA no longer uses or supports this method (December 2019).
WITHDRAWN
___________________________________________________________
___________________________________________________________
plastic support pad faces the sampling tube. Use a minimum amount of tubing to connectthe Type I sampling tube to the prefilter assembly.
2.2. Sampling Procedure (Bulk or wipe samples are not applicable)
2.2.1. Connect the sampling tube (Type I or II) to the calibrated sampling pump, making sure sampled air enters the large section (100 mg) of IABC first. Place the sampling device on the employee such that air is sampled from the breathing zone.
2.2.2. For STEL samples, use a flow rate of 0.1 L/min and a minimum sampling time of 15 min. For TWA determinations, take consecutive 12-L samples at a flow rate of 0.1 L/min for 120min each. If possible, take enough consecutive samples to cover the entire work shift.
2.2.3. After sampling, place plastic end caps tightly on both ends of the tube and apply OSHA Form 21 seals. Record the sampling conditions.
2.2.4. Use the same lot of IABC tubes for blank and collected samples. Handle the blank sorbent tube in exactly the same manner as the sample tubes except that no air is drawn throughit. Submit at least one blank tube for each batch of ten samples.
2.2.5. When other compounds are known or suspected to be present in the air, such informationshould be transmitted with the sample.
2.2.6. Specify SO2 analysis and ship samples to the laboratory. If necessary, any Teflon® pre-filters used can be analyzed for H2SO4 (when H2SO4 is suspected to be present in the workplace atmosphere).
3. Analysis
3.1. Safety Precautions
3.1.1. Refer to appropriate IC instrument manuals and the Standard Operating Procedure (SOP)for proper instrument operation (5.8.).
3.1.2. Observe laboratory safety regulations and practices.
3.1.3. Sulfuric acid, sodium hydroxide, and hydrogen peroxide are corrosive. Use appropriatepersonal protective equipment such as safety glasses, gloves, and lab coat when handlingcorrosive chemicals. Prepare solutions in an exhaust hood.
3.2. Equipment
3.2.1. Ion chromatograph (Model 4000i or 4500i Dionex, Sunnyvale, CA) equipped with a conductivity detector.
3.2.2. Automatic sampler (Dionex Model AS-1) and sample vials (0.5 mL).
3.2.3. Laboratoryautomation system: Ion chromatograph interfaced with a data reduction system(AI450, Dionex).
3.2.4. Micromembrane suppressor, anion (Model AMMS-1, Dionex).
3.2.5. Separator and guard columns, anion (Model HPIC-AS4A and AG4A, Dionex).
3.2.6. Disposable syringes (1 mL).
3.2.7. Syringe pre-filters, 0.5-µm pore size (part no. SLSR 025 NS, Millipore Corp., Bedford, MA).
Note: Some syringe pre-filters are not cation- or anion-free. Tests should be performed with blank solutions first to determine contamination and suitability with the analyte.
3.2.8. Miscellaneous volumetric glassware: Micropipettes, volumetric flasks, Erlenmeyer flasks, graduated cylinders, and beakers.
Withdrawn Provided for Historical Reference Only
Note: OSHA no longer uses or supports this method (December 2019).
WITHDRAWN
___________________________________________________________
____________________________________________________________
3.2.9. Scintillation vials, glass, 20-mL.
3.2.10. Equipment for eluent degassing (vacuum pump, ultrasonic bath).
3.2.11. Analytical balance (0.01 mg).
3.3. Reagents - All chemicals should be at least reagent grade.
3.3.1. Principal reagents:
CAUTION: NaOH, H2SO4, or 30% H2O2 can cause skin irritation or burns.
Sodium carbonate (Na2CO3)Sodium bicarbonate (NaHCO3)Sodium hydroxide (NaOH) Sulfuric acid (H2SO4), concentrated, 98%Hydrogen peroxide (H2O2), 30%Sodium sulfate (Na2SO4), anhydrous Deionized water (DI H2O) with a conductance of <10 µS.
3.3.2. Eluent (1.0 mM Na2CO3 + 1.0 mM NaHCO3):Dissolve 0.212 g Na2CO3 and 0.168 g NaHCO3 in 2.0 L DI H2O. Sonicate this solution and degas under vacuum for 15 min.
3.3.3. Suppressor regenerant solution (0.02 N H2SO4):Carefully transfer 1.14 mL concentrated H2SO4 into a 2-L volumetric flask which contains approximately 500 mL DI H2O. Dilute to volume with DI H2O.
3.3.4. Desorbing solution [0.3 N (.1%) H2O2 in 15 mM NaOH]: Dissolve .0.6 g NaOH in approximately 500 mL of DI H2O contained in a 1-L volumetric flask. Carefully add 34 mL of 30% H2O2 and then dilute to the 1-L mark with DI H2O. Prepare weekly.
3.3.5. Sulfate (SO42-) stock standard (1,000 µg/mL):Dissolve and dilute 1.4792 g of Na2SO4 to 1.0 L with DI H2O. Prepare yearly.
3.3.6. Sulfate (SO42-) standard solutions, 100, 10, and 1 µg/mL:Pipette appropriate volumes of the 1,000 µg/mL SO42- stock standard into volumetric flasks and dilute to the mark with eluent. Prepare monthly.
3.4. Working Standard Preparation
3.4.1. Prepare SO42- working standards in eluent. A method for preparing a series of working standards using 10-mL final solution volumes is shown below:
Working Std Std Solution Aliquot Eluent Added µg/mL (µg/mL) (mL) (mL)
0.5 1 5 5 1 1 * * 2 10 2 8 5 10 5 5 10 10 * * 20 100 2 8 30 100 3 7 50 100 5 5
* Already prepared in Section 3.3.6.
Withdrawn Provided for Historical Reference Only
Note: OSHA no longer uses or supports this method (December 2019).
WITHDRAWN
3.4.2. To prepare each working standard listed above, pipette an appropriate aliquot of the specified standard solution (prepared in Section 3.3.6.) and add the specified amount of eluent.
3.4.3. As an alternative, pipette each aliquot into a 10-mL volumetric flask and dilute to volume with eluent.
3.5. Sample Preparation
Note: If H2SO4 is a requested analyte and a Type II sampling device or a PTFE prefilter was used, seeOSHA Stopgap Method ID-165SG or OSHA Method No. ID-113 for further details regarding sample preparation, analysis, and calculation of results for H2SO4.
3.5.1. Carefully remove and discard the rear glass wool plug (or foam for the Type II sampler) without losing any beaded carbon.
Note: The sorbent should always be removed from the glass tube via the opposite end of collection(i.e. 50-mg IABC backup section is removed first). This will minimize the possibility of contamination from any collected particulate.
3.5.2. Carefully transfer each IABC section from a sample tube and place in separate 25-mL Erlenmeyer flasks or scintillation vials.
3.5.3. Pipette 10 mL of desorbing solution into each flask. Cap each flask tightly and allow each solution to sit for at least 60 min. Occasionally swirl each solution.
3.6. Analysis
3.6.1. Pipette a 0.5- to 0.6-mL portion of each standard or sample solution into separate automatic sampler vials. Place a filtercap into each vial. The large filter portion of the cap should face the solution.
3.6.2. Load the automatic sampler with labeled samples, standards, and blanks.
3.6.3. Set up the ion chromatograph in accordance with the SOP (5.8.).
Note: An SOP is a written procedure for a specific instrument. It is suggested that SOPs be prepared for each type of instrument used in a lab to enhance safe and effective operation.
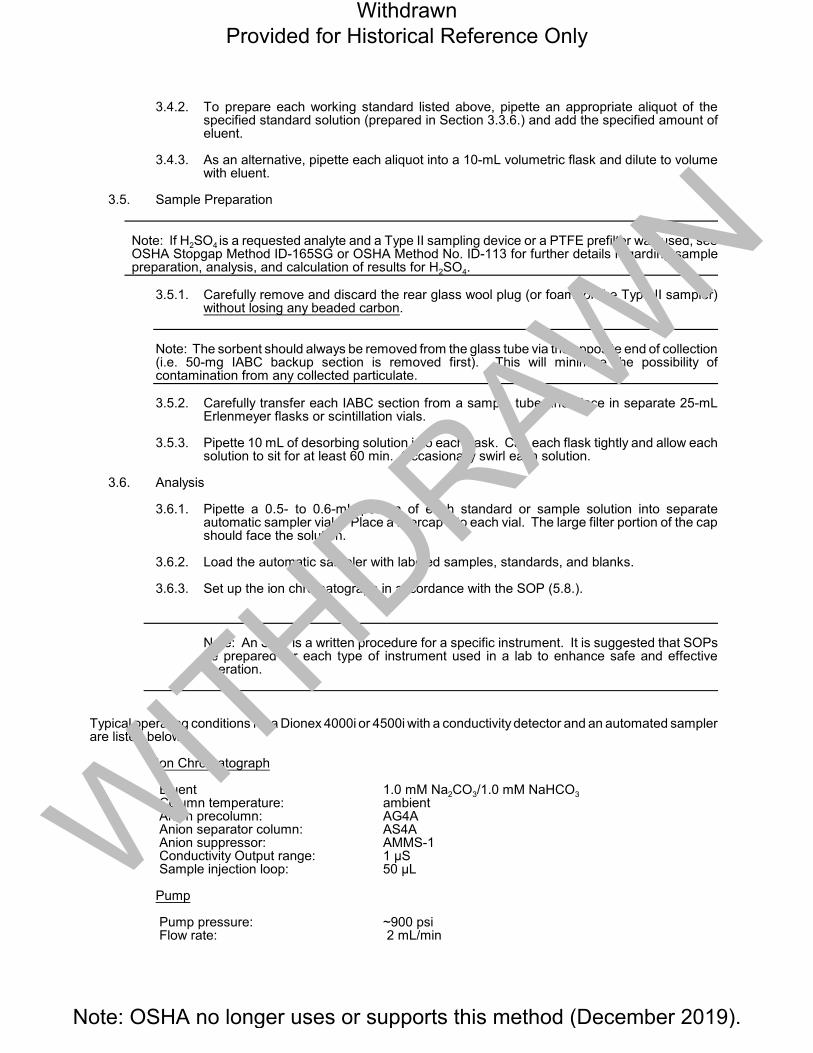
Typical operating conditions for a Dionex 4000i or 4500i with a conductivity detector and an automated sampler are listed below:
Ion Chromatograph
Eluent Column temperature: Anion precolumn: Anion separator column: Anion suppressor: Conductivity Output range: Sample injection loop:
1.0 mM Na2CO3/1.0 mM NaHCO3
ambientAG4A AS4A AMMS-11 µS50 µL
Pump
Pump pressure: Flow rate:
~900 psi 2 mL/min
Withdrawn Provided for Historical Reference Only
Note: OSHA no longer uses or supports this method (December 2019).
WITHDRAWN
Chromatogram
Run time: 10 min Peak retention time: ~6 min for SO42-
3.6.4. Follow the SOP for further instructions regarding analysis (5.8.).
3.7. Calculations
3.7.1. After the analysis is completed, retrieve the peak areas or heights. Obtain hard copies of chromatograms from a printer.
3.7.2. Prepare a concentration-response curve by plotting the peak areas or peak heights versusthe concentration of the SO42- standards in µg/mL.
3.7.3. Perform a blank correction for each IABC front and backup sections. Subtract the µg/mL SO42- blank value (if any) from each sample reading if blank and sample solution volumesare the same. If a different solution volume is used, subtract the total µg blank value from total ìg sample values.
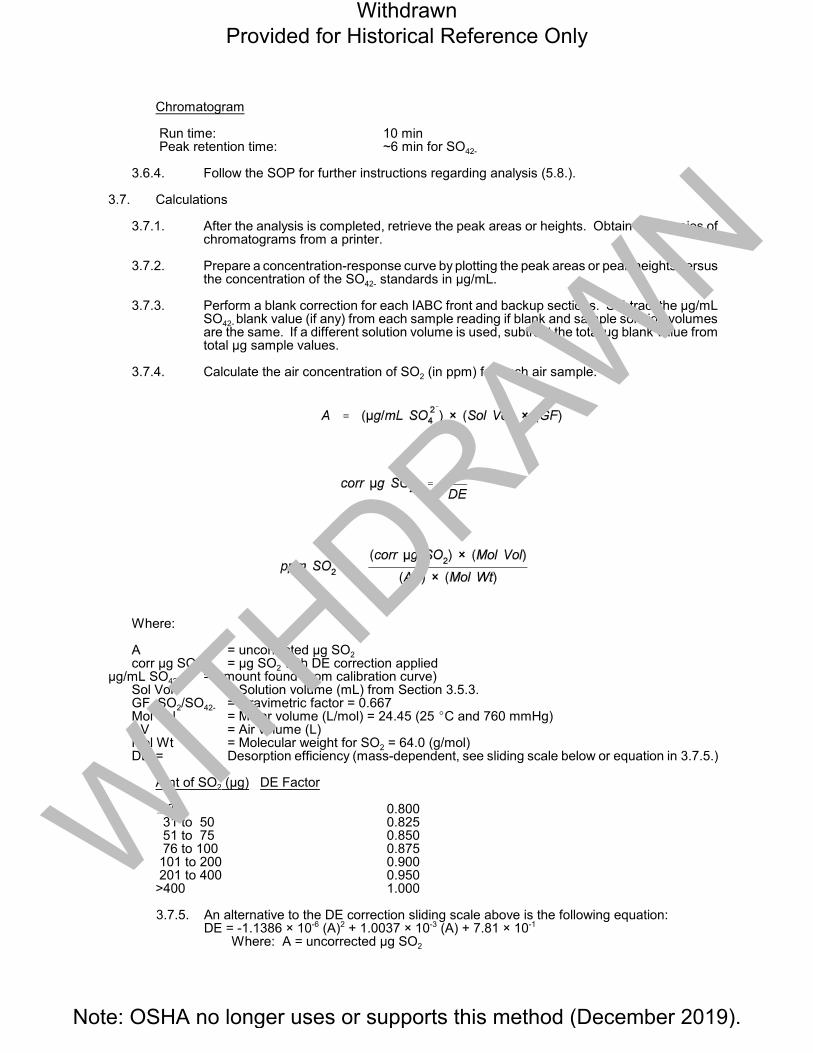
3.7.4. Calculate the air concentration of SO2 (in ppm) for each air sample:
Where:
A = uncorrected µg SO2
corr µg SO2 = µg SO2 with DE correction applied µg/mL SO42- = Amount found (from calibration curve)
Sol Vol = Solution volume (mL) from Section 3.5.3. GF, SO2/SO42- = Gravimetric factor = 0.667 Mol Vol = Molar volume (L/mol) = 24.45 (25 EC and 760 mmHg) AV = Air volume (L) Mol Wt = Molecular weight for SO2 = 64.0 (g/mol) DE = Desorption efficiency (mass-dependent, see sliding scale below or equation in 3.7.5.)
Amt of SO2 (µg) DE Factor
# 30 0.800 31 to 50 0.825 51 to 75 0.850 76 to 100 0.875 101 to 200 0.900 201 to 400 0.950 >400 1.000
3.7.5. An alternative to the DE correction sliding scale above is the following equation:DE = -1.1386 × 10⁻⁶ (A)2 + 1.0037 × 10⁻³ (A) + 7.81 × 10⁻¹
Where: A = uncorrected µg SO2
Withdrawn Provided for Historical Reference Only
Note: OSHA no longer uses or supports this method (December 2019).
WITHDRAWN
3.7.6. The DE correction may be lot-dependent. The corrections stated in this method were determined using lot no. 673 (Cat. no. 226-80, SKC Inc., Eighty Four, PA) or beaded carbon prepared for sampling phosphine (5.7.). A difference in DE was not noted for thesetwo preparations (Section 4.1.2.). Future lots or different grades should be evaluated for DE corrections.
3.8. Reporting Results
Add the backup section ppm SO2 result (if any) to the front section result for each sample. Reportresults to the industrial hygienist as ppm SO2.
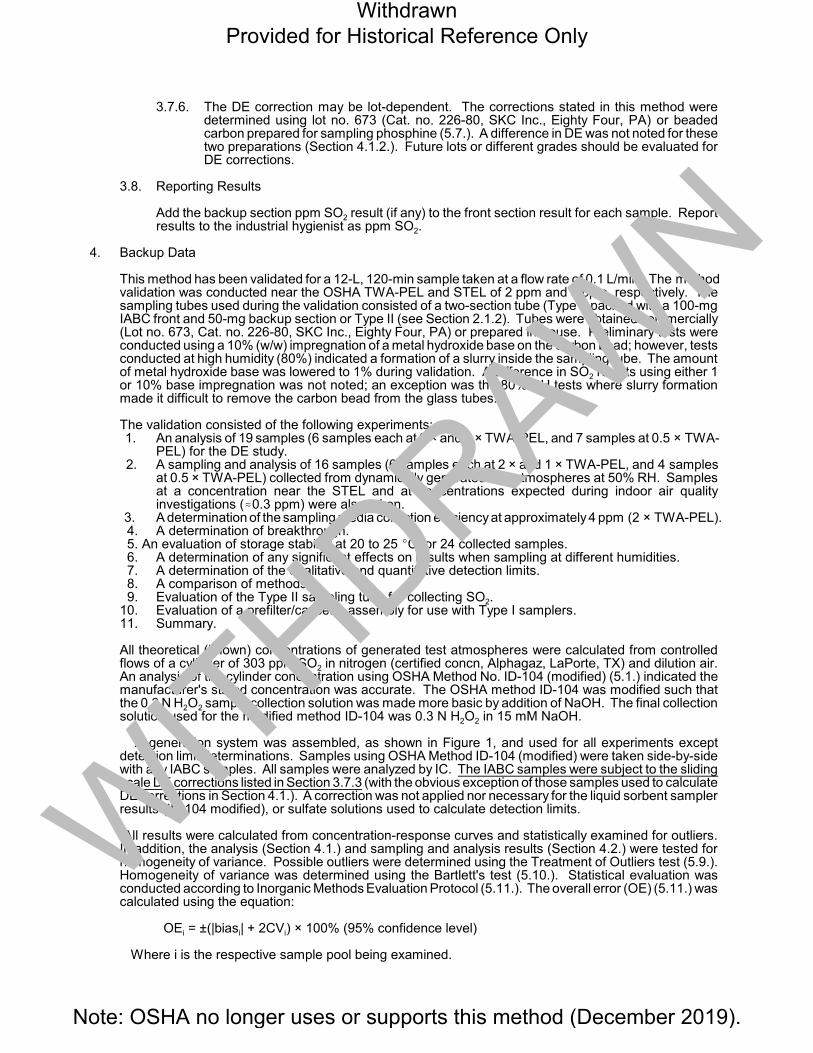
4. Backup Data
This method has been validated for a 12-L, 120-min sample taken at a flow rate of 0.1 L/min. The method validation was conducted near the OSHA TWA-PEL and STEL of 2 ppm and 5 ppm, respectively. The sampling tubes used during the validation consisted of a two-section tube (Type I) packed with a 100-mgIABC front and 50-mg backup section or Type II (see Section 2.1.2). Tubes were obtained commercially(Lot no. 673, Cat. no. 226-80, SKC Inc., Eighty Four, PA) or prepared in-house. Preliminary tests were conducted using a 10% (w/w) impregnation of a metal hydroxide base on the carbon bead; however, testsconducted at high humidity (80%) indicated a formation of a slurry inside the sampling tube. The amount of metal hydroxide base was lowered to 1% during validation. A difference in SO2 results using either 1 or 10% base impregnation was not noted; an exception was the 80% RH tests where slurry formation made it difficult to remove the carbon bead from the glass tubes.
The validation consisted of the following experiments: 1. An analysis of 19 samples (6 samples each at 2 × and 1 × TWA-PEL, and 7 samples at 0.5 × TWA-
PEL) for the DE study. 2. A sampling and analysis of 16 samples (6 samples each at 2 × and 1 × TWA-PEL, and 4 samples
at 0.5 × TWA-PEL) collected from dynamically generated test atmospheres at 50% RH. Samples at a concentration near the STEL and at concentrations expected during indoor air quality investigations (.0.3 ppm) were also taken.
3. A determination of the sampling media collection efficiency at approximately 4 ppm (2 × TWA-PEL).4. A determination of breakthrough.5. An evaluation of storage stability at 20 to 25 EC for 24 collected samples. 6. A determination of any significant effects on results when sampling at different humidities. 7. A determination of the qualitative and quantitative detection limits.8. A comparison of methods. 9. Evaluation of the Type II sampling tube for collecting SO2. 10. Evaluation of a prefilter/cassette assembly for use with Type I samplers. 11. Summary.
All theoretical (known) concentrations of generated test atmospheres were calculated from controlled flows of a cylinder of 303 ppm SO2 in nitrogen (certified concn, Alphagaz, LaPorte, TX) and dilution air. An analysis of the cylinder concentration using OSHA Method No. ID-104 (modified) (5.1.) indicated themanufacturer's stated concentration was accurate. The OSHA method ID-104 was modified such that the 0.3 N H2O2 sample collection solution was made more basic by addition of NaOH. The final collection solution used for the modified method ID-104 was 0.3 N H2O2 in 15 mM NaOH.
A generation system was assembled, as shown in Figure 1, and used for all experiments except detection limit determinations. Samples using OSHA Method ID-104 (modified) were taken side-by-side with any IABC samples. All samples were analyzed by IC. The IABC samples were subject to the slidingscale DE corrections listed in Section 3.7.3 (with the obvious exception of those samples used to calculateDE corrections in Section 4.1.). A correction was not applied nor necessary for the liquid sorbent samplerresults (ID-104 modified), or sulfate solutions used to calculate detection limits.
All results were calculated from concentration-response curves and statistically examined for outliers. In addition, the analysis (Section 4.1.) and sampling and analysis results (Section 4.2.) were tested for homogeneity of variance. Possible outliers were determined using the Treatment of Outliers test (5.9.). Homogeneity of variance was determined using the Bartlett's test (5.10.). Statistical evaluation was conducted according to Inorganic Methods Evaluation Protocol (5.11.). The overall error (OE) (5.11.) wascalculated using the equation:
OEi = ±(|biasi| + 2CVi) × 100% (95% confidence level)
Where i is the respective sample pool being examined.
Withdrawn Provided for Historical Reference Only
Note: OSHA no longer uses or supports this method (December 2019).
WITHDRAWN
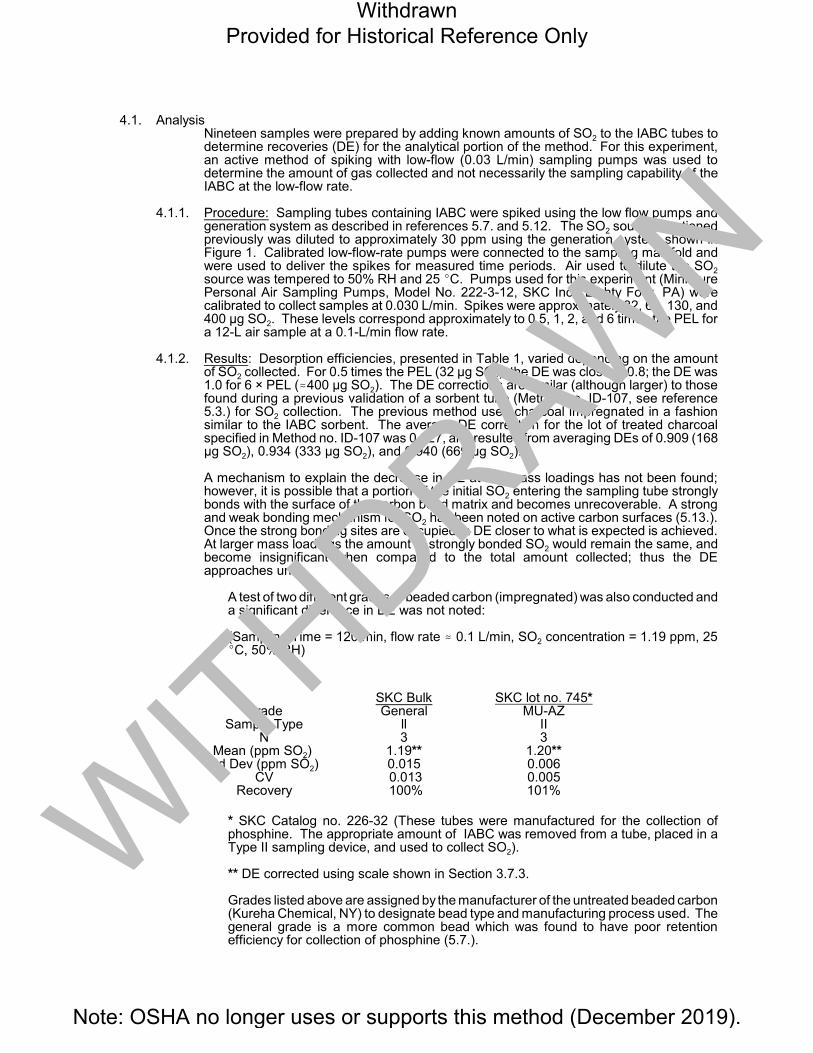
4.1. AnalysisNineteen samples were prepared by adding known amounts of SO2 to the IABC tubes to determine recoveries (DE) for the analytical portion of the method. For this experiment, an active method of spiking with low-flow (0.03 L/min) sampling pumps was used to determine the amount of gas collected and not necessarily the sampling capability of theIABC at the low-flow rate.
4.1.1. Procedure: Sampling tubes containing IABC were spiked using the low flow pumps andgeneration system as described in references 5.7. and 5.12. The SO2 source mentioned previously was diluted to approximately 30 ppm using the generation system shown in Figure 1. Calibrated low-flow-rate pumps were connected to the sampling manifold and were used to deliver the spikes for measured time periods. Air used to dilute the SO2
source was tempered to 50% RH and 25 EC. Pumps used for this experiment (Miniature Personal Air Sampling Pumps, Model No. 222-3-12, SKC Inc., Eighty Four, PA) were calibrated to collect samples at 0.030 L/min. Spikes were approximately 32, 64, 130, and 400 µg SO2. These levels correspond approximately to 0.5, 1, 2, and 6 times the PEL for a 12-L air sample at a 0.1-L/min flow rate.
4.1.2. Results: Desorption efficiencies, presented in Table 1, varied depending on the amount of SO2 collected. For 0.5 times the PEL (32 µg SO2), the DE was close to 0.8; the DE was 1.0 for 6 × PEL (.400 µg SO2). The DE corrections are similar (although larger) to those found during a previous validation of a sorbent tube (Method no. ID-107, see reference 5.3.) for SO2 collection. The previous method used charcoal impregnated in a fashion similar to the IABC sorbent. The average DE correction for the lot of treated charcoal specified in Method no. ID-107 was 0.927, and resulted from averaging DEs of 0.909 (168µg SO2), 0.934 (333 µg SO2), and 0.940 (669 µg SO2).
A mechanism to explain the decrease in DE at low mass loadings has not been found; however, it is possible that a portion of the initial SO2 entering the sampling tube stronglybonds with the surface of the carbon bead matrix and becomes unrecoverable. A strong and weak bonding mechanism for SO2 has been noted on active carbon surfaces (5.13.). Once the strong bonding sites are occupied, a DE closer to what is expected is achieved. At larger mass loadings the amount of strongly bonded SO2 would remain the same, and become insignificant when compared to the total amount collected; thus the DE approaches unity.
A test of two different grades of beaded carbon (impregnated) was also conducted and a significant difference in DE was not noted:
(Sampling Time = 120 min, flow rate . 0.1 L/min, SO2 concentration = 1.19 ppm, 25 EC, 50% RH)
SKC Bulk SKC lot no. 745* Grade General MU-AZ
Sample Type ll II N 3 3
Mean (ppm SO2) 1.19** 1.20** Std Dev (ppm SO2) 0.015 0.006
CV 0.013 0.005 Recovery 100% 101%
* SKC Catalog no. 226-32 (These tubes were manufactured for the collection of phosphine. The appropriate amount of IABC was removed from a tube, placed in a Type II sampling device, and used to collect SO2).
** DE corrected using scale shown in Section 3.7.3.
Grades listed above are assigned by the manufacturer of the untreated beaded carbon(Kureha Chemical, NY) to designate bead type and manufacturing process used. Thegeneral grade is a more common bead which was found to have poor retention efficiency for collection of phosphine (5.7.).
Withdrawn Provided for Historical Reference Only
Note: OSHA no longer uses or supports this method (December 2019).
WITHDRAWN
Although the data shows comparable DEs, even for different grades, future lots or gradesof beaded carbon should be evaluated for DE corrections.
4.2. Sampling and Analysis
To determine the precision and accuracyof the method, known concentrations of SO2 were generated, samples were collected, prepared, and analyzed.
4.2.1. Procedure: 1) The SO2 source mentioned previously was used to generate test atmospheres of SO2.
This source was diluted with filtered, humidified air using the system shown in Figure 1.
2) Dynamic generation systemA Miller-Nelson Research Inc. flow, temperature, and humidity control system (ModelHCS-301, Monterey, CA) was used for air flow control and conditioning. All generationsystem fittings and connections were Teflon®. A glass mixing chamber was used to mix the tempered, filtered air with the contaminant gas. The system was set to generate test atmospheres at 50% RH and 25 EC.
3) The SO2 and diluent air flow rates were adjusted using mass flow controllers. Flow rates were also measured using a dry test meter (for diluent air) and a soap bubble flow meter (for SO2 gas).
4) Samples were taken from the sampling manifold using constant-flow pumps. Calibrated P125 and Alpha 2 pumps (E.I. duPont de Nemours & Co., Wilmington, DE)were used. Pump flow rates were approximately 0.1 L/min and sampling time was 120min. Sample concentrations were approximately 0.5, 1, and 2 times the OSHA TWA-PEL for 12-L air samples. For samples taken near the STEL (.5.8 ppm SO2 was used), a 0.1 L/min sampling rate for 15 min was used. For low concentration samples, a test atmosphere of approximately 0.3 ppm was used.
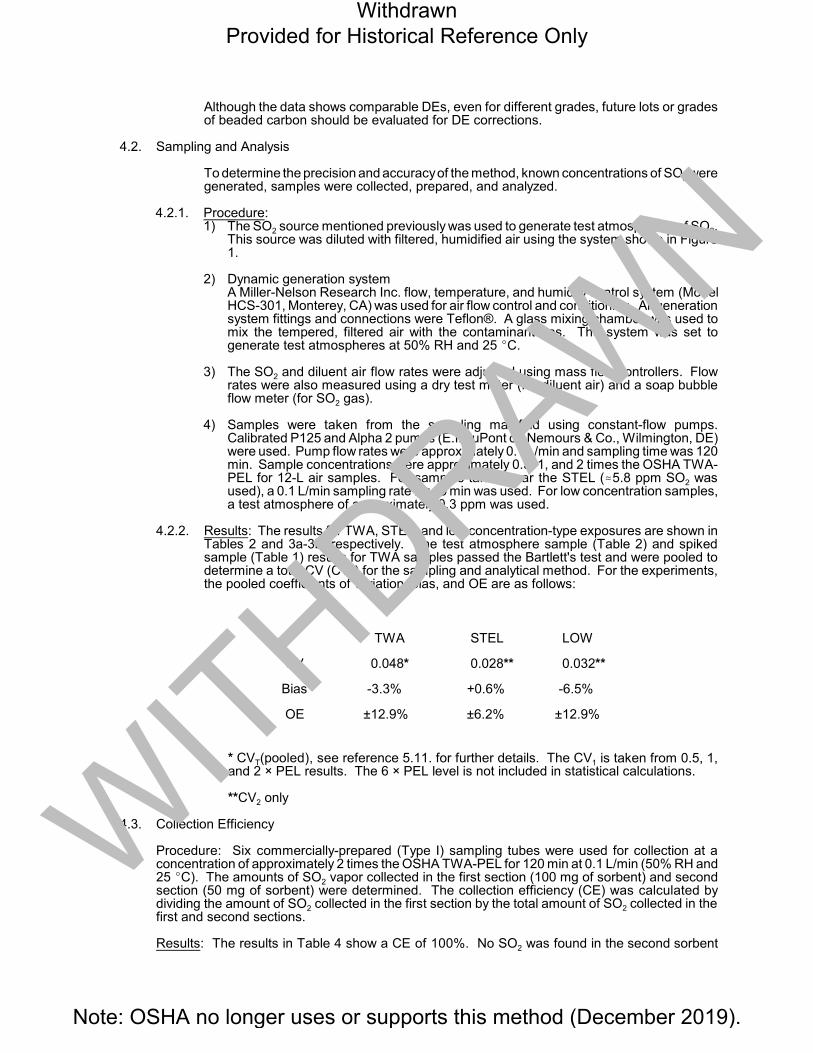
4.2.2. Results: The results for TWA, STEL, and low concentration-type exposures are shown in Tables 2 and 3a-3b, respectively. The test atmosphere sample (Table 2) and spiked sample (Table 1) results for TWA samples passed the Bartlett's test and were pooled to determine a total CV (CVT) for the sampling and analytical method. For the experiments, the pooled coefficients of variation, bias, and OE are as follows:
TWA STEL LOW
CV 0.048* 0.028** 0.032**
Bias -3.3% +0.6% -6.5%
OE ±12.9% ±6.2% ±12.9%
* CVT(pooled), see reference 5.11. for further details. The CV1 is taken from 0.5, 1, and 2 × PEL results. The 6 × PEL level is not included in statistical calculations.
**CV2 only
4.3. Collection Efficiency
Procedure: Six commercially-prepared (Type I) sampling tubes were used for collection at a concentration of approximately 2 times the OSHA TWA-PEL for 120 min at 0.1 L/min (50% RH and25 EC). The amounts of SO2 vapor collected in the first section (100 mg of sorbent) and second section (50 mg of sorbent) were determined. The collection efficiency (CE) was calculated by dividing the amount of SO2 collected in the first section by the total amount of SO2 collected in the first and second sections.
Results: The results in Table 4 show a CE of 100%. No SO2 was found in the second sorbent
Withdrawn Provided for Historical Reference Only
Note: OSHA no longer uses or supports this method (December 2019).
WITHDRAWN
____________________________________________________________________
section for the CE experiment.
4.4. Breakthrough Study
(Note: Breakthrough is defined as >5% loss of analyte through the sampling media at 50% RH) Procedure: Two separate experiments were conducted to test for breakthrough. For the first experiment, the same procedure as the CE test was used with two exceptions:
1) The concentration was increased to a level approximately 4 times the TWA-PEL (7.20 ppm SO2).2) Samples were collected at 0.1 L/min for 240 min.
The second experiment was conducted using the Type II sampling tube (Section 2.1.2.) at a concentration larger than expected during routine sampling of industrial hygiene operations (14.8ppm SO2). Experimental parameters for this test were: Four Type II sampling tubes, 25 EC, 50% RH, 240-min sampling time, 0.1 L/min sample rate, and 14.8 ppm SO2 test concentration.
The amount of breakthrough for each sampling tube was calculated by dividing the amount collected in the second section by the total amount of SO2 collected in the first and second sections.
Results: No breakthrough of SO2 into the second section was found. Results for both concentrations are shown in Table 5.
4.5. Storage Stability
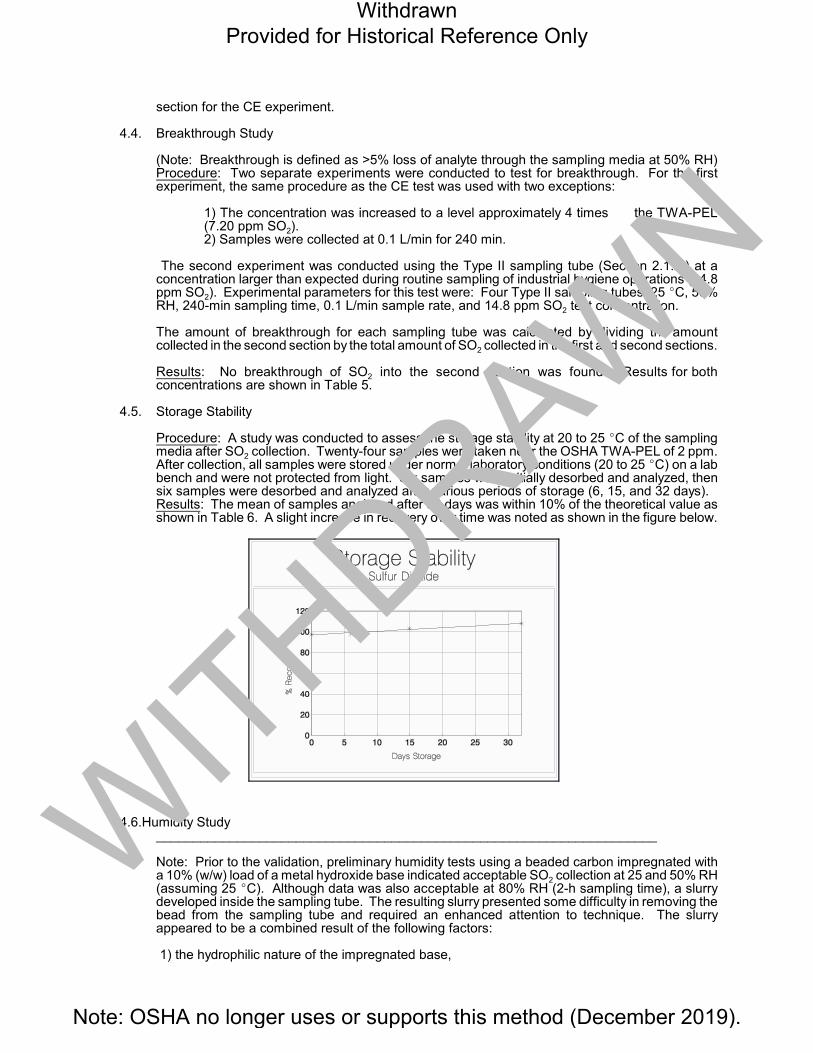
Procedure: A study was conducted to assess the storage stability at 20 to 25 EC of the sampling media after SO2 collection. Twenty-four samples were taken near the OSHA TWA-PEL of 2 ppm. After collection, all samples were stored under normal laboratory conditions (20 to 25 EC) on a lab bench and were not protected from light. Six samples were initially desorbed and analyzed, then six samples were desorbed and analyzed after various periods of storage (6, 15, and 32 days). Results: The mean of samples analyzed after 32 days was within 10% of the theoretical value asshown in Table 6. A slight increase in recovery over time was noted as shown in the figure below.
4.6.Humidity Study
Note: Prior to the validation, preliminary humidity tests using a beaded carbon impregnated witha 10% (w/w) load of a metal hydroxide base indicated acceptable SO2 collection at 25 and 50% RH (assuming 25 EC). Although data was also acceptable at 80% RH (2-h sampling time), a slurry developed inside the sampling tube. The resulting slurry presented some difficulty in removing the bead from the sampling tube and required an enhanced attention to technique. The slurry appeared to be a combined result of the following factors:
1) the hydrophilic nature of the impregnated base,
Withdrawn Provided for Historical Reference Only
Note: OSHA no longer uses or supports this method (December 2019).
WITHDRAWN
2) the hydrophobicity of the beaded carbon, and 3) complications arising from limited temperature control during sample generations at 80% RH. Factor (1) appeared to be the main factor in producing a slurry. The "wetting" effect apparently was assisted by differences in temperature during generation. The high humidity tests were conducted during the winter season and the ambient temperature in the laboratory was about 18 EC. The ambient temperature is normally near the test atmosphere temperature of 25 EC; due to a malfunctioning room thermostat it was somewhat cooler during these tests. The temperature of the sampling tubes are ambient because of the sampling manifold design. The test atmosphere condensation inside the tube probably was accelerated when entering the cooler sampling tube.
The amount of base impregnation was lowered to 1% (w/w) to alleviate potential formation of a slurry.
Procedure: A study was conducted to determine any effect on results when samples are collectedin different humidities. Samples were taken using the generation system and procedure described in Section 4.2. Test atmospheres were generated at 25 EC and at approximately 0.5, 1, and 2 times the OSHA TWA-PEL. Relative humidities of 30%, 50%, and 80% were used at each concentration level tested.
Results: Results of the humidity tests are listed in Table 7. An F test was used to determine if anysignificant effect occurred when sampling at different humidities. As shown, the calculated F values exceeded critical F values (5.14.) for all the concentrations tested and a significant difference in results occurred across the humidity ranges tested. An examination of the data indicates a decrease in recoveries as humidity increases; however, a correction for humidity effect was not instituted because results at higher humidities were considered acceptable in terms of overall error(< ±25%).
The finding that increasing humidity produces a decrease in the amount of sulfate found appears to contradict previous findings in the literature (5.15.). The previous study (5.15.) indicated the conversion of SO2 to sulfate on an active carbon surface was facilitated by the presence of an aqueous environment; however, testing carbons impregnated with a metal hydroxide base was not performed. The base appears to significantly alter the adsorption characteristics of the beaded carbon for SO2.
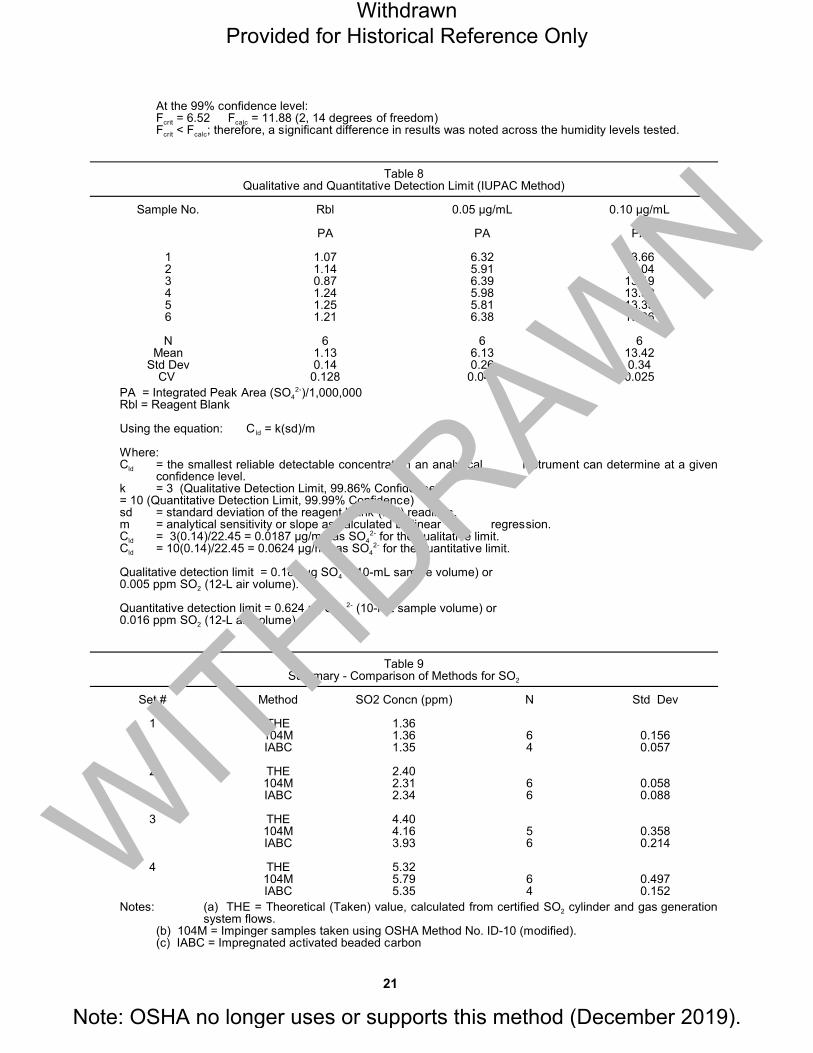
4.7. Qualitative and Quantitative Detection Limit Study
Procedure: Low concentration samples were prepared by spiking desorbing solutions (Section 3.3.4.) with aliquots of aqueous standards prepared from sodium sulfate. These samples were analyzed using a 50-µL sample injection loop and a detector setting of 1 microsiemens (µS). A derivation of the International Union of Pure and Applied Chemistry (IUPAC) detection limit equation(5.16.) was used for this study.
Results: The results are shown in Table 8 for qualitative and quantitative detection limits, respectively. The qualitative limit is 0.0187 µg/mL as SO42- at the 99.86% confidence level. The quantitative limit (99.99% confidence) is 0.0642 µg/mL as SO42-. Using a 12-L air volume and a 10-mL sample solution volume, the qualitative limit is 0.004 ppm and the quantitative limit is 0.013 ppm as SO2.
4.8. Comparison of Methods
Procedure: In order to compare the performance of this method and to confirm the theoretical SO2
concentrations, an independent method (OSHA Method no. ID-104 for SO2, modified) was used. The collection solution for Method ID-104 was modified as previously mentioned in Section 4, andimpingers were used to collect samples. The IABC and impinger samples were collected side-by-side from the generation system. All samples were analyzed by IC.
Results: Table 9 shows the results for different SO2 concentrations. As shown, the theoretical concentration of the generation system, the IABC, and impinger results are in good agreement.
4.9. Type II Tube Study
Procedure: Eight Type II sampling tubes (see Section 2.1.2. for a description of this tube) were chosen for a statistical study using the generation system described in Section 4.2. These tubes contained PTFE membranes as prefilters. Samples were collected side-by-side with impinger
Withdrawn Provided for Historical Reference Only
Note: OSHA no longer uses or supports this method (December 2019).
WITHDRAWN
samples at 25 EC, 80% RH, and at approximately the OSHA TWA-PEL for 120 min. The high humidity was selected as a worst-case test (Section 4.6.).
Results: Results are listed in Table 10. As shown, the Type II sampling device can be used to collect SO2 without significantly altering the concentration. A slight increase in recovery was notedwhen compared to the earlier Type I tube results at 80% RH (Section 4.6.).
4.10. Prefilter Evaluation
Procedure: Past research regarding aerosols (5.17.) has indicated that particulate in the air sampled may penetrate any glass wool plugs and deposit on the sorbent when using conventionalsampling tubes. To remedy this, a prefilter is generally used to stop the particulate before entry intothe sampling tube. A preliminary experiment was conducted using the Type II sampling tube withglass fiber prefilters instead of PTFE. Significant losses were noted and were apparently caused by the slightly basic glass fiber filters reacting with some of the SO2.
To further evaluate the possibility of SO2 reacting with a prefilter/cassette sampling device, an experiment was performed using six Type I sampling tubes with prefilter sampling assemblies consisting of PTFE filter/polypropylene backup pad/carbon-filled cassettes. These cassettes (as specified in Section 2.1.5.) have enjoyed popularity for asbestos sampling (5.18.) and for their limited reactivity to certain corrosive gases (5.19.).
The test was conducted by taking six IABC samples without prefilters side-by-side with six IABC with prefilters. Samples were taken such that the test atmosphere entered the prefilter assembly first and then entered the IABC with minimal contact at the connection between cassette and sampling tubes. Small pieces of Tygon® tubing were used to connect the cassettes and IABC sampling tubes. All samples were taken at a flow rate of about 0.1 L/min for 120 min. The generation system concentration was approximately the TWA-PEL.
Results: The results of the comparison of IABC samples taken with and without prefilters is shown in Table 11. As shown, a difference in the amount of SO2 collected was not noted between the prefilter/IABC and IABC sampling assembly. The PTFE prefilter/cassette assembly does not appear to inhibit the collection of SO2 when using the stated sampling conditions.
4.11. Summary
The validation results indicate the method meets both the NIOSH and OSHA criteria for accuracyand precision (5.10., 5.11.). Collection efficiency, breakthrough, and storage stabilityare adequate. Although it appears that humidity effects are significant when sampling at different humidities, theresults are within an acceptable range (OE < ±25%). Detection limits are adequate when samplesare taken for 120 min at 0.1 L/min, or for 15-min STEL determinations. The method is adequate for monitoring TWA, STEL, and indoor air types of exposures.
The contaminant levels of blank IABC samples, when compared to levels found in the sorbent usedin OSHA Method no. ID-107, were significantly lower. Blanks from IABC sorbent contained only 1 to 2 µg background (as SO42-), based on a sample solution volume of 10 mL. The previous impregnated charcoal sorbent contamination ranged from 20 to 100 µg SO42-.
5.References
5.1. Occupational Safety and Health Administration Salt Lake Technical Center: Sulfur Dioxide in Workplace Atmospheres (Bubbler) (USDOL/OSHA Method No. ID-104). In OSHA Analytical Methods Manual 2nd ed. Cincinnati, OH: American Conference of Governmental Industrial Hygienists, 1991.
5.2. Smith, D.L., W.S. Kim, and R.E. Kupel: Determination of Sulfur Dioxide by Adsorption on A SolidSorbent Followed by Ion Chromatography Analysis. Am.Ind.Hyg.Assoc.J. 41:485-488 (1980).
5.3. Occupational Safety and Health Administration Analytical Laboratory: Sulfur Dioxide in Workplace Atmospheres (Solid Sorbent) (USDOL/OSHA Method No. ID-107). In OSHA AnalyticalMethods Manual 1st ed. Cincinnati, OH: American Conference of Governmental Industrial Hygienists (Pub. No. ISBN: 0-936712-66-X), 1985.
5.4. Patty, F.A.; Ed. Industrial Hygiene and Toxicology, 2nd rev. ed. Vol. 2. New York: Interscience, 1963.
Withdrawn Provided for Historical Reference Only
Note: OSHA no longer uses or supports this method (December 2019).
WITHDRAWN
5.5. National Institute for Occupational Safety and Health: Criteria for a Recommended Standard - Occupational Exposure to Sulfur Dioxide [DHEW (NIOSH) Publication No. 74-111]. Washington,D.C.: U.S. Government Printing Office, 1974.
5.6. "Sulfur Dioxide" Federal Register 54:12 (19 Jan. 1989). pp 2524-2527
5.7. Occupational Safety and Health Administration Salt Lake Technical Center: Phosphine in Workplace Atmospheres (and Backup Data Report)(USDOL/OSHA Method No. ID-180). In OSHAAnalytical Methods Manual 2nd ed. Cincinnati, OH: American Conference of Governmental Industrial Hygienists, 1991.
5.8. Occupational Safety and Health Administration Salt Lake Technical Center: Ion ChromatographyStandard Operating Procedure (Ion Chromatographic Committee). Salt Lake City,UT. In progress.
5.9. Mandel, J.: Accuracy and Precision, Evaluation and Interpretation of Analytical Results, The Treatment of Outliers. In Treatise On Analytical Chemistry, 2nd ed., Vol.1, edited by I. M. Kolthoff and P. J. Elving. New York: John Wiley and Sons, 1978. pp. 282-285.
5.10. National Institute for Occupational Safety and Health: Documentation of the NIOSH Validation Tests by D. Taylor, R. Kupel, and J. Bryant (DHEW/NIOSH Pub. No. 77-185). Cincinnati, OH: National Institute for Occupational Safety and Health, 1977. pp. 1-12.
5 11. Occupational Safety and Health Administration Analytical Laboratory: Precision and Accuracy 5..1 Data Protocol for Laboratory Validations. In OSHA Analytical Methods Manual 1st ed. Cincinnati,OH: American Conference of Governmental Industrial Hygienists (Pub. No. ISBN: 0-936712-66-X),1985.
5.12. National Institute for Occupational Safety and Health: Backup Data Report No. S332 for Phosphine, Attachment A. Cincinnati, OH: National Institute for Occupational Safety and Health, 1977 (unpublished).
5.13. Davini, P.: Adsorption and Desorption of SO2 on Active Carbon: The Effect of Surface Basic Groups. Carbon 28:565-571 (1990).
5.14. Dowdy, S. and S. Wearden: Statistics for Research. New York: John Wiley and Sons, 1983. Chapter 8.
5.15. Halstead, J.A., R. Armstrong, B. Pohlman, S. Sibley, and R. Maier: NonaqueousHeterogeneous Oxidation of Sulfur Dioxide. J.Phys.Chem. 94:3261-3265 (1990).
5.16. Long, G.L. and J.D. Winefordner: Limit of Detection -- A Closer Look at the IUPAC Definition. Anal.Chem. 55:712A-724A (1983).
5.17. Fairchild, C.I., and M.I. Tillery: The Filtration Efficiency of Organic Vapor Sampling Tubes againstParticulates. Am.Ind.Hyg. Assoc.J. 38:277-283 (1977).
5.18. Occupational Safety and Health Administration Salt Lake Technical Center: Asbestos (USDOL/OSHA Method No. ID-160). In OSHA Analytical Methods Manual 2nd ed. Cincinnati, OH:American Conference of Governmental Industrial Hygienists, 1991.
5.19. Cassenelli, M.E.: Development of a Solid Sorbent Monitoring Method for Chlorine and Bromine in Air with Determination by Ion Chromatography. Appl.Occup.Environ.Hyg. 6:215-226 (1991).
Withdrawn Provided for Historical Reference Only
Note: OSHA no longer uses or supports this method (December 2019).
WITHDRAWN
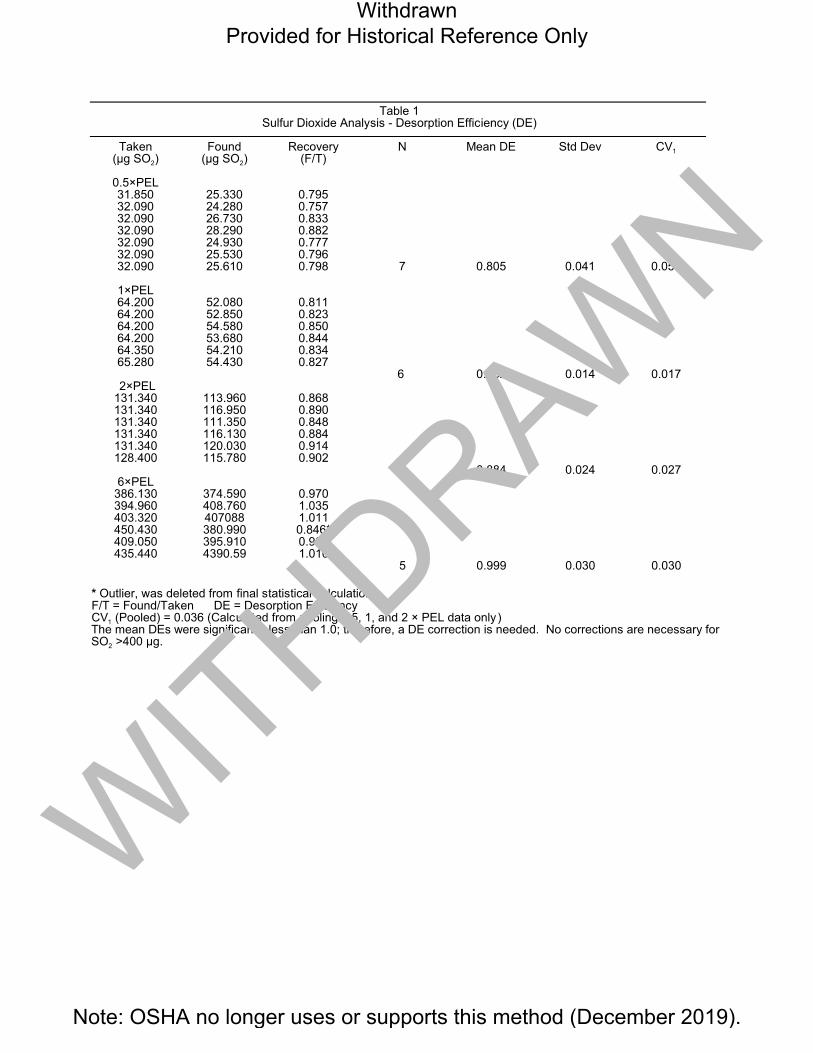
Table 1 Sulfur Dioxide Analysis - Desorption Efficiency (DE)
Taken (µg SO2)
Found (µg SO2)
Recovery(F/T)
N Mean DE Std Dev CV1
0.5×PEL 31.850 25.330 0.795 32.090 24.280 0.757 32.090 26.730 0.833 32.090 28.290 0.882 32.090 24.930 0.777 32.090 25.530 0.796 32.090 25.610 0.798 7 0.805 0.041 0.051
1×PEL 64.200 52.080 0.811 64.200 52.850 0.823 64.200 54.580 0.850 64.200 53.680 0.844 64.350 54.210 0.834 65.280 54.430 0.827
6 0.832 0.014 0.017 2×PEL
131.340 113.960 0.868 131.340 116.950 0.890 131.340 111.350 0.848 131.340 116.130 0.884 131.340 120.030 0.914 128.400 115.780 0.902
6 0.884 0.024 0.027 6×PEL
386.130 374.590 0.970 394.960 408.760 1.035 403.320 407088 1.011 450.430 380.990 0.846* 409.050 395.910 0.968 435.440 4390.59 1.010
5 0.999 0.030 0.030
* Outlier, was deleted from final statistical calculations F/T = Found/Taken DE = Desorption Efficiency CV1 (Pooled) = 0.036 (Calculated from pooling 0.5, 1, and 2 × PEL data only) The mean DEs were significantly less than 1.0; therefore, a DE correction is needed. No corrections are necessary for SO2 >400 µg.
Withdrawn Provided for Historical Reference Only
Note: OSHA no longer uses or supports this method (December 2019).
WITHDRAWN
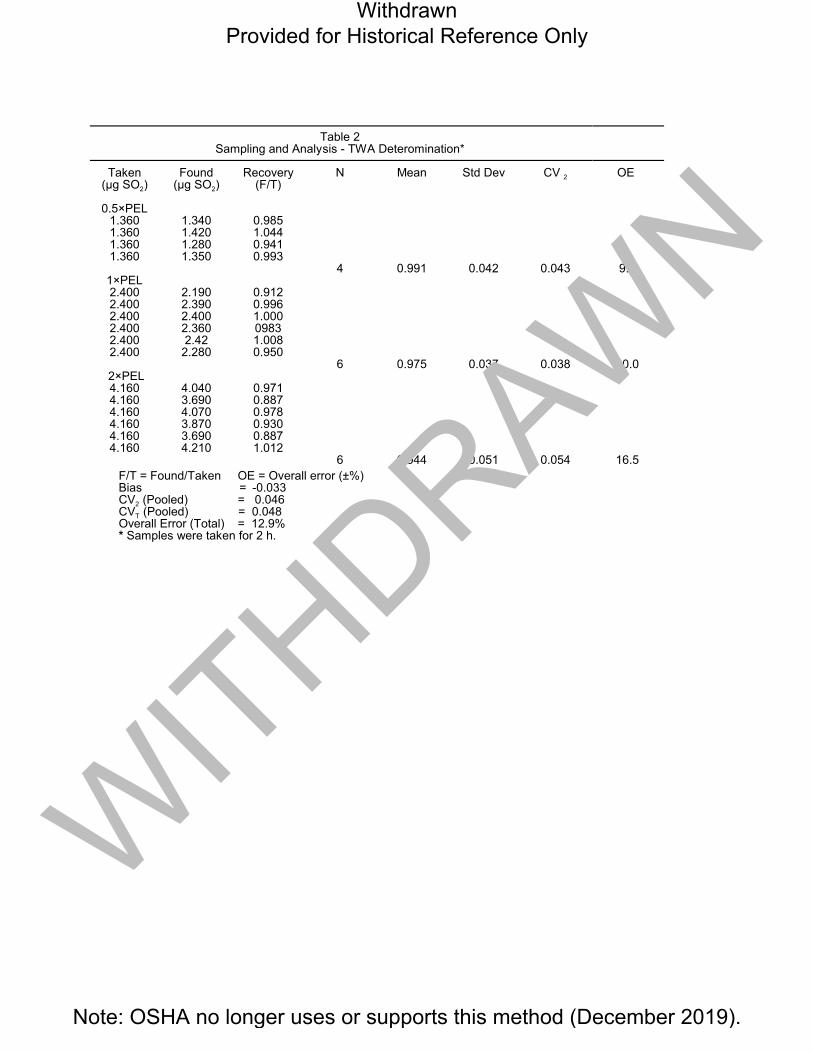
Table 2 Sampling and Analysis - TWA Deteromination*
Taken Found Recovery (µg SO2) (µg SO2) (F/T)
0.5×PEL 1.360 1.340 0.985 1.360 1.420 1.044 1.360 1.280 0.941 1.360 1.350 0.993
1×PEL 2.400 2.190 0.912 2.400 2.390 0.996 2.400 2.400 1.000 2.400 2.360 0983 2.400 2.42 1.008 2.400 2.280 0.950
2×PEL 4.160 4.040 0.971 4.160 3.690 0.887 4.160 4.070 0.978 4.160 3.870 0.930 4.160 3.690 0.887 4.160 4.210 1.012
N Mean Std Dev CV 2 OE
4 0.991 0.042 0.043 9.2
6 0.975 0.037 0.038 10.0
6 0.944 0.051 0.054 16.5
F/T = Found/Taken OE = Overall error (±%) Bias = -0.033 CV2 (Pooled) = 0.046 CVT (Pooled) = 0.048 Overall Error (Total) = 12.9% * Samples were taken for 2 h.
Withdrawn Provided for Historical Reference Only
Note: OSHA no longer uses or supports this method (December 2019).
WITHDRAWN
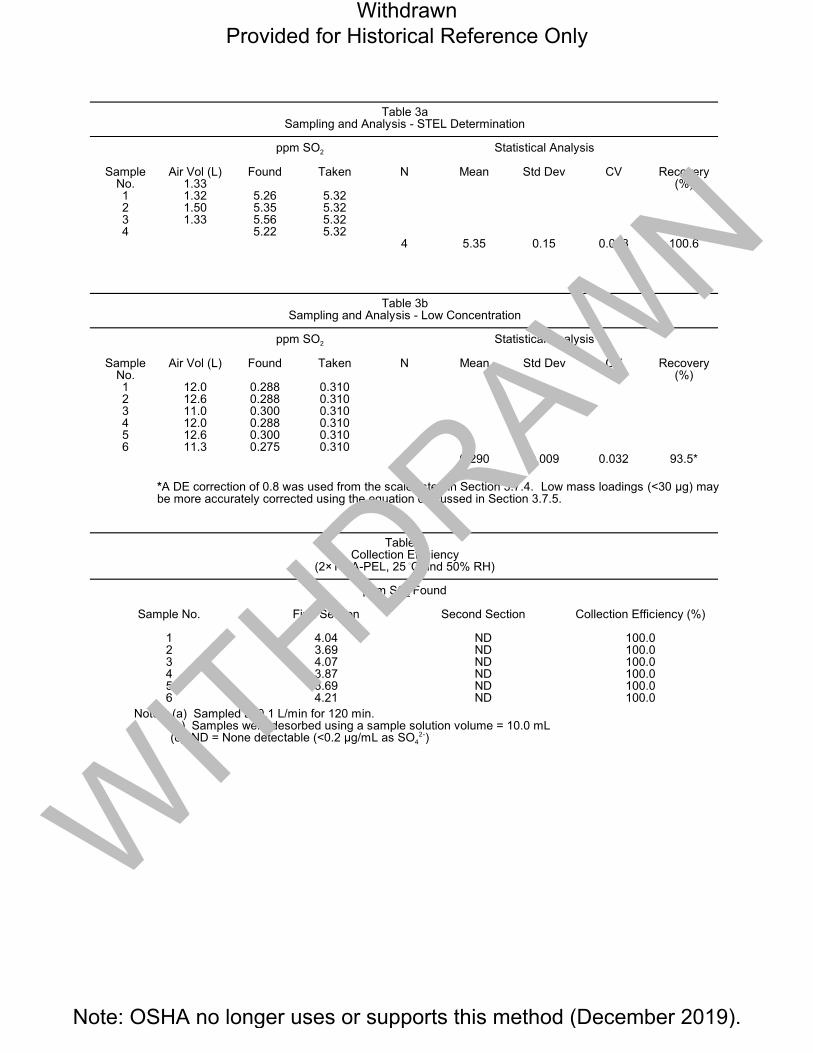
Table 3a Sampling and Analysis - STEL Determination
ppm SO2 Statistical Analysis
SampleNo. 1 2 3 4
Air Vol (L)1.33 1.32 1.50 1.33
Found
5.26 5.35 5.56 5.22
Taken
5.32 5.32 5.32 5.32
N
4
Mean
5.35
Std Dev
0.15
CV
0.028
Recovery(%)
100.6
Table 3b Sampling and Analysis - Low Concentration
ppm SO2 Statistical Analysis
Sample Air Vol (L) Found Taken N Mean Std Dev CV Recovery No. (%)1 12.0 0.288 0.310 2 12.6 0.288 0.310 3 11.0 0.300 0.310 4 12.0 0.288 0.310 5 12.6 0.300 0.310 6 11.3 0.275 0.310
6 0.290 0.009 0.032 93.5*
*A DE correction of 0.8 was used from the scale listed in Section 3.7.4. Low mass loadings (<30 µg) may be more accurately corrected using the equation discussed in Section 3.7.5.
Table 4 Collection Efficiency
(2×TWA-PEL, 25 BC and 50% RH)
ppm SO2 Found
Sample No. First Section Second Section Collection Efficiency (%)
1 4.04 ND 100.0 2 3.69 ND 100.0 3 4.07 ND 100.0 4 3.87 ND 100.0 5 3.69 ND 100.0 6 4.21 ND 100.0
Notes: (a) Sampled at 0.1 L/min for 120 min.(b) Samples were desorbed using a sample solution volume = 10.0 mL
2-) (c) ND = None detectable (<0.2 µg/mL as SO4
Withdrawn Provided for Historical Reference Only
Note: OSHA no longer uses or supports this method (December 2019).
WITHDRAWN
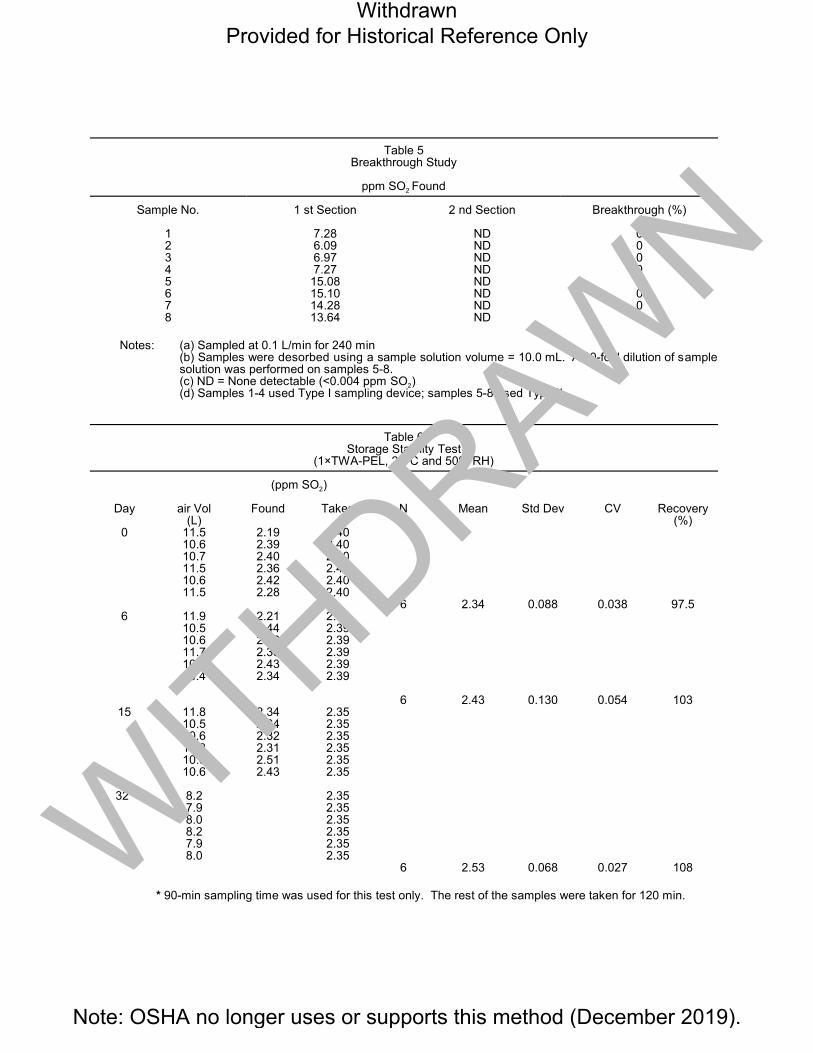
Table 5 Breakthrough Study
ppm SO2 Found
Sample No. 1 st Section 2 nd Section Breakthrough (%)
1 7.28 ND 0 2 6.09 ND 0 3 6.97 ND 0 4 7.27 ND 0 5 15.08 ND 0 6 15.10 ND 0 7 14.28 ND 0 8 13.64 ND 0
Notes: (a) Sampled at 0.1 L/min for 240 min(b) Samples were desorbed using a sample solution volume = 10.0 mL. A 10-fold dilution of sample solution was performed on samples 5-8.(c) ND = None detectable (<0.004 ppm SO2)(d) Samples 1-4 used Type I sampling device; samples 5-8 used Type II
Table 6 Storage Stability Test
(1×TWA-PEL, 25 BC and 50% RH)
(ppm SO2)
Day
0
air Vol (L)
11.5
Found
2.19
Taken
2.40
N Mean Std Dev CV Recovery(%)
10.6 2.39 2.40 10.7 2.40 2.40 11.5 2.36 2.40 10.6 2.42 2.40 11.5 2.28 2.40
6 2.34 0.088 0.038 97.5 6 11.9 2.21 2.39
10.5 2.44 2.39 10.6 2.26 2.39 11.7 2.33 2.39 10.3 2.43 2.39 10.4 2.34 2.39
6 2.43 0.130 0.054 103 15 11.8 2.34 2.35
10.5 2.64 2.35 10.6 2.32 2.35 11.8 2.31 2.35 10.5 2.51 2.35 10.6 2.43 2.35
32* 8.2 2.35 7.9 2.35 8.0 2.35 8.2 2.35 7.9 2.35 8.0 2.35
6 2.53 0.068 0.027 108
* 90-min sampling time was used for this test only. The rest of the samples were taken for 120 min.
Withdrawn Provided for Historical Reference Only
Note: OSHA no longer uses or supports this method (December 2019).
WITHDRAWN
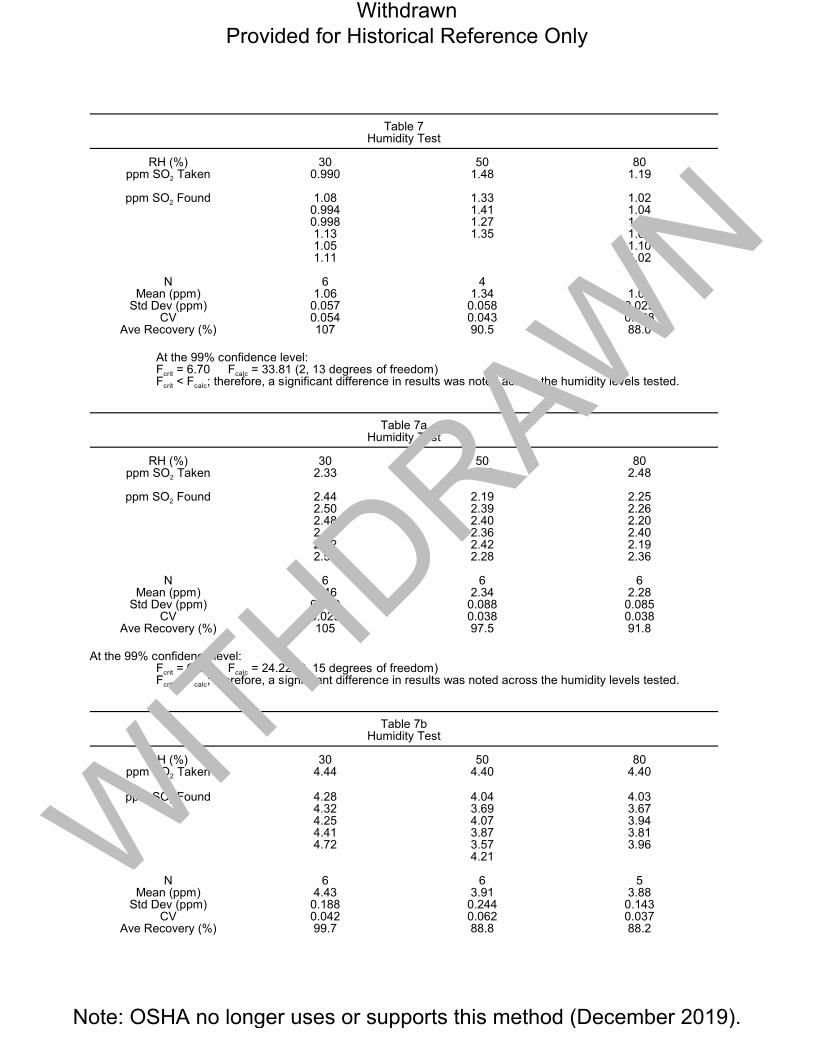
Table 7 Humidity Test
RH (%)ppm SO2 Taken
30 0.990
50 1.48
80 1.19
ppm SO2 Found 1.08 0.994 0.998 1.13 1.05 1.11
1.33 1.41 1.27 1.35
1.02 1.04 1.05 1.05 1.10 1.02
N Mean (ppm)
Std Dev (ppm)CV
Ave Recovery (%)
6 1.06
0.057 0.054 107
4 1.34
0.058 0.043 90.5
6 1.05
0.029 0.028 88.0
At the 99% confidence level: Fcrit = 6.70 Fcalc = 33.81 (2, 13 degrees of freedom) Fcrit < Fcalc; therefore, a significant difference in results was noted across the humidity levels tested.
RH (%)ppm SO2 Taken
ppm SO2 Found
N Mean (ppm)
Std Dev (ppm)CV
Ave Recovery (%)
Table 7a Humidity Test
30 2.33
50 2.40
80 2.48
2.44 2.50 2.48 2.48 2.32 2.51
2.19 2.39 2.40 2.36 2.42 2.28
2.25 2.26 2.20 2.40 2.19 2.36
6 2.46
0.070 0.029 105
6 2.34
0.088 0.038 97.5
6 2.28
0.085 0.038 91.8
At the 99% confidence level: Fcrit = 6.36 Fcalc = 24.22 (2, 15 degrees of freedom) Fcrit < Fcalc; therefore, a significant difference in results was noted across the humidity levels tested.
Table 7b Humidity Test
RH (%)ppm SO2 Taken
ppm SO2 Found
N Mean (ppm)
Std Dev (ppm)CV
Ave Recovery (%)
30 50 80 4.44 4.40 4.40
4.28 4.04 4.03 4.32 3.69 3.67 4.25 4.07 3.94 4.41 3.87 3.81 4.72 3.57 3.96
4.21
6 6 5 4.43 3.91 3.88
0.188 0.244 0.143 0.042 0.062 0.037 99.7 88.8 88.2
Withdrawn Provided for Historical Reference Only
Note: OSHA no longer uses or supports this method (December 2019).
WITHDRAWN
At the 99% confidence level: Fcrit = 6.52 Fcalc = 11.88 (2, 14 degrees of freedom) Fcrit < Fcalc; therefore, a significant difference in results was noted across the humidity levels tested.
Table 8 Qualitative and Quantitative Detection Limit (IUPAC Method)
Sample No. Rbl 0.05 µg/mL 0.10 µg/mL
PA PA PA
1 1.07 6.32 13.66 2 1.14 5.91 13.04 3 0.87 6.39 13.19 4 1.24 5.98 13.32 5 1.25 5.81 13.35 6 1.21 6.38 13.96
N 6 6 6 Mean 1.13 6.13 13.42
Std Dev 0.14 0.26 0.34 CV 0.128 0.042 0.025
PA = Integrated Peak Area (SO42-)/1,000,000
Rbl = Reagent Blank
Using the equation: Cld = k(sd)/m
Where: Cld = the smallest reliable detectable concentration an analytical instrument can determine at a given
confidence level. k = 3 (Qualitative Detection Limit, 99.86% Confidence)= 10 (Quantitative Detection Limit, 99.99% Confidence) sd = standard deviation of the reagent blank (Rbl) readings. m = analytical sensitivity or slope as calculated by linear regression. Cld = 3(0.14)/22.45 = 0.0187 µg/mL as SO4
2- for the qualitative limit. Cld = 10(0.14)/22.45 = 0.0624 µg/mL as SO4
2- for the quantitative limit.
Qualitative detection limit = 0.187 µg SO42- (10-mL sample volume) or
0.005 ppm SO2 (12-L air volume).
Quantitative detection limit = 0.624 µg SO42- (10-mL sample volume) or
0.016 ppm SO2 (12-L air volume).
Table 9 Summary - Comparison of Methods for SO2
Set # Method SO2 Concn (ppm) N Std Dev
1 THE 104M IABC
1.36 1.36 1.35
6 4
0.156 0.057
2 THE 104M IABC
2.40 2.31 2.34
6 6
0.058 0.088
3 THE 104M IABC
4.40 4.16 3.93
5 6
0.358 0.214
4 THE 104M IABC
5.32 5.79 5.35
6 4
0.497 0.152
Notes: (a) THE = Theoretical (Taken) value, calculated from certified SO2 cylinder and gas generation system flows.
(b) 104M = Impinger samples taken using OSHA Method No. ID-10 (modified). (c) IABC = Impregnated activated beaded carbon
21
Withdrawn Provided for Historical Reference Only
Note: OSHA no longer uses or supports this method (December 2019).
WITHDRAWN
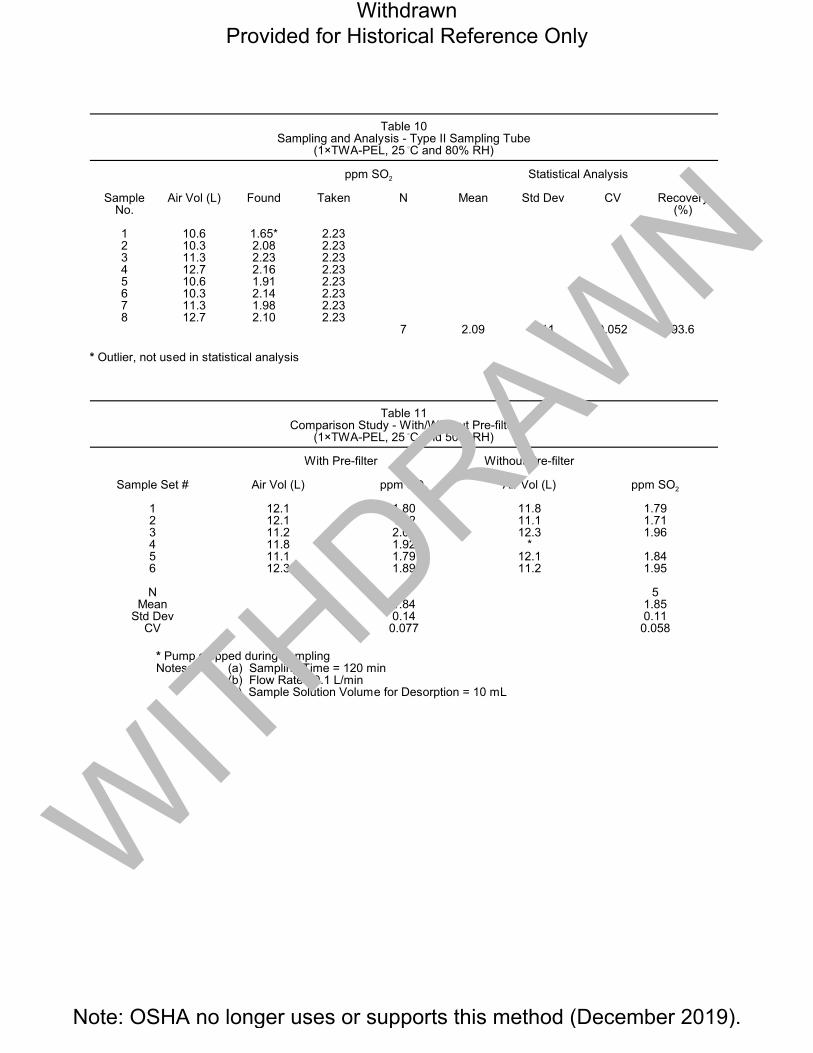
Table 10 Sampling and Analysis - Type II Sampling Tube
(1×TWA-PEL, 25 BC and 80% RH)
ppm SO2 Statistical Analysis
SampleNo.
Air Vol (L) Found Taken N Mean Std Dev CV Recovery(%)
1 2 3 4 5 6 7 8
10.6 10.3 11.3 12.7 10.6 10.3 11.3 12.7
1.65* 2.08 2.23 2.16 1.91 2.14 1.98 2.10
2.23 2.23 2.23 2.23 2.23 2.23 2.23 2.23
7 2.09 0.11 0.052 93.6
* Outlier, not used in statistical analysis
Table 11 Comparison Study - With/Without Pre-filter
(1×TWA-PEL, 25 BC and 50% RH)
With Pre-filter
Sample Set # Air Vol (L)
1 12.1 2 12.1 3 11.2 4 11.8 5 11.1 6 12.3
N Mean
Std Dev CV
* Pump stopped during sampling Notes: (a) Sampling Time = 120 min
(b) Flow Rate .0.1 L/min
ppm SO2
1.80 1.62 2.04 1.92 1.79 1.89
6 1.84 0.14
0.077
(c) Sample Solution Volume for Desorption = 10 mL
Without Pre-filter
Air Vol (L)
11.8 11.1 12.3
* 12.1 11.2
ppm SO2
1.79 1.71 1.96
1.84 1.95
5 1.85 0.11
0.058
Withdrawn Provided for Historical Reference Only
Note: OSHA no longer uses or supports this method (December 2019).
WITHDRAWN
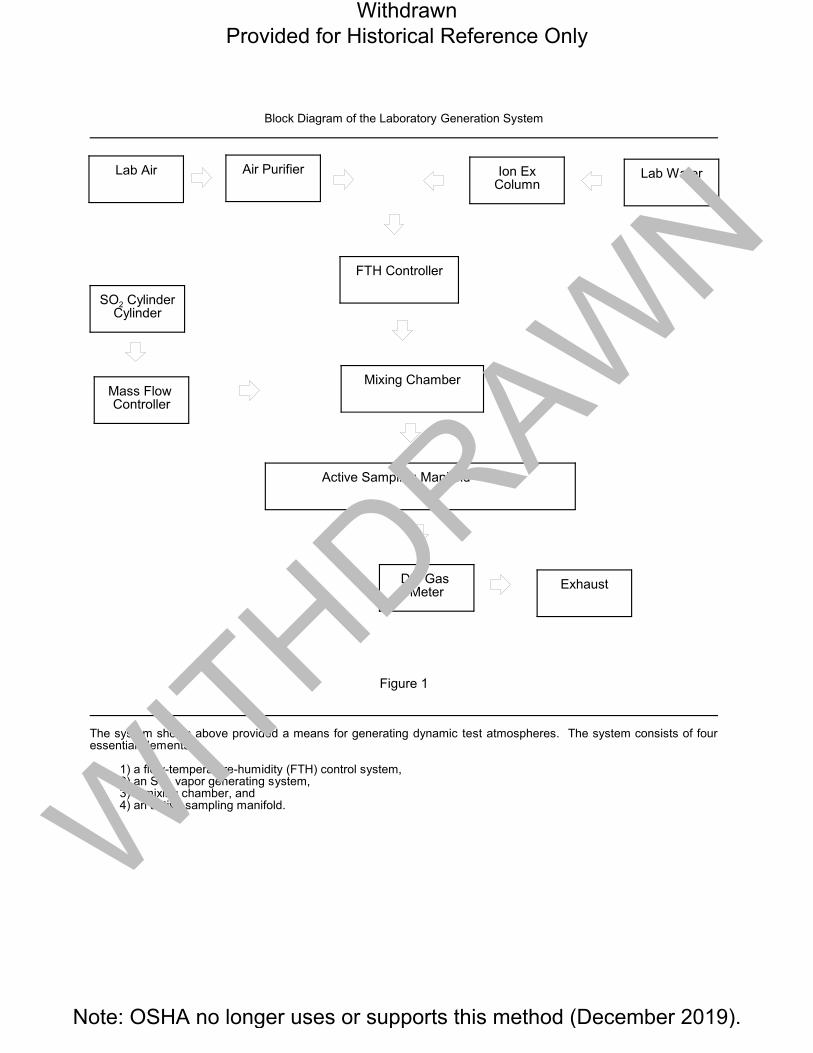
Block Diagram of the Laboratory Generation System
Lab Air Air Purifier Ion Ex Column
Lab Water
FTH Controller
SO2 CylinderCylinder
Mixing Chamber Mass Flow Controller
Active Sampling Manifold
Dry GasMeter
Exhaust
Figure 1
The system shown above provided a means for generating dynamic test atmospheres. The system consists of four essential elements:
1) a flow-temperature-humidity (FTH) control system,2) an SO2 vapor generating system,3) a mixing chamber, and4) an active sampling manifold.
Withdrawn Provided for Historical Reference Only
Note: OSHA no longer uses or supports this method (December 2019).
WITHDRAWN