methodologies for using data to gain insight into business...
TRANSCRIPT

IEEE SIGNAL PROCESSING MAGAZINE [83] SEPTEMBER 2011
Baniya merchants of the Mughal Empire, burgher merchants of the Swedish Empire, and chonin merchants of the Tokugawa Shogunate had the same questions on their mind as businesspeople do today. To which townspeople should I sell my wares? Of folks that buy from me, are there any that might stop buying from me? Which groups buy which goods? Which saris should I show Ranna Devi to make as much money as I can? How much timber
will people want in the coming weeks and months? The world has changed over the centuries with globalization, rapid transportation, instanta-
neous communication, expansive enterprises, and an explosion of data and signals along with ample computation to process them. In this new age, many continue to answer the aforementioned and
other critical business questions in the old-fashioned way, i.e., based on intuition, gut instinct, and personal experience. In our globalized world, however, this is not sufficient anymore and it is essential to replace the busi-nessperson’s gut instinct with science.
That science is business analytics.Business analytics is a broad umbrella entailing many
problems and solutions, such as demand forecasting and conditioning, resource capacity planning, workforce planning, salesforce modeling and optimization, revenue forecasting, customer/product analytics, and enterprise recommender systems. In our department, we are in-creasingly directing our focus on developing models and techniques to address such business problems. The goal of this article is to provide the reader with an overview of this interesting new area of research and then hone in on applications that might require the use of sophisticated signal processing methodologies and utilize financial signals as input.
[ Kush R. Varshney and Aleksandra Mojsilovic]
Digital Object Identifier 10.1109/MSP.2011.941554
Date of publication: 22 August 2011
[ Methodologies for using data to gain insight into
business performance and drive business planning]
© iSTOCKPHOTO.COM/NIKADA
1053-5888/11/$26.00©2011IEEE

IEEE SIGNAL PROCESSING MAGAZINE [84] SEPTEMBER 2011
WHAT IS BUSINESS ANALYTICS?The field of business analytics and optimization encompasses methodologies from applied mathematics, applied probability, applied statistics, computer science, and signal processing for using data to gain insight into business performance and drive business planning. Solutions developed within business ana-lytics are primarily used as decision support systems or as components of decision support systems to aid salespeople, managers, and other organizational leaders in strategy plan-ning, marketing campaign development, and other business decision-making tasks.
One may ask how business analytics differs from operations research. We view business analytics as an application area for signal processing, computer science, and statistics, whereas we view operations research as a technical area of study focused on constrained optimization. It has been said that management science is the application of operations research to business [1]. In the same vein, business analytics is an application area for operations research, which subsumes management science.
From the managerial perspective, business analytics is an outgrowth of what is known as business intelligence—systems that present trusted information in a clear way. Today’s expan-sive, global enterprises generate a deluge of data that is impos-sible for a human to make sense of. For example, a business may record every single sales opportunity pursued, including demographic information about the customer; by what medi-um the customer was approached; which products were offered; which products if any were purchased; the revenue obtained; the time it took to complete the sale; and the sales-people involved and their skills. Database systems, used to han-dle millions or even billions of such records, and especially reporting tools to allow a user to glean meaning from the data, are the essence of business intelligence.
Business intelligence systems typically present information collected and stored in a database or data warehouse in the form of a dashboard. In analogy with automobile instrument panels, business intelligence dashboards are graphical repre-sentations of the underlying state of the business. A panel on a dashboard may show aggregated sales revenue as a function of time with a line plot, or may show the percentage of sales opportunities that resulted in purchases in different regions of the world with a bar graph, perhaps coloring small percentage bars in red and large percentage bars in green. The user also typically has the ability to “slice and dice” the data and the abil-ity to “drill down” in the data. Instead of only looking at sales numbers aggregated across the entire business, a user could, for example, examine sales numbers for married female cus-tomers living in Australia, aged 18–25, approached through a direct phone call by individual salespeople located in the Philippines. Also, a user could first examine sales numbers for the Europe/Middle East/Africa region, then focus on Europe, and then focus on Italy.
Although business intelligence systems do enable the businessperson to extract a significant amount of insight through the reporting and graphical display of summarized
and aggregated data, they have a key limitation. They lack predictive modeling, signal processing, and algorithmically produced recommendations for decision making. Business intelligence systems cannot extend the line graph on the dashboard beyond the current time under different sales strategies and find the optimal strategy. H.P. Luhn of IBM developed the concept of business intelligence in 1958 [2], but due to this limitation, IBM has stated more recently that the future for data-driven business is business analytics and optimization.
The goal of analytics is to automatically discover predictive insights and turn them into operational reality [3]. Because business analytics, in its broad sense, is only now beginning to be seen as a unified domain, there are not yet many overview books or survey articles on the topic. A few recent books present holistic accounts of business analytics, e.g., [4]–[6], but from a popular or managerial perspective. This article attempts to over-view business analytics from a technical (specifically signal pro-cessing) perspective, albeit with greater emphasis on methods utilizing financial signals. Business analytics is a new endeavor that could benefit greatly from inputs from the signal process-ing community, and is also a source of new problems that can stimulate signal processing researchers.
We present several vignettes of business analytics applica-tions. We provide a brief introduction to various corporate financial signals that find use in business analytics. We describe a couple of signal processing methodologies that we have developed which may be applied to a variety of business analytics applications, as well as more generally. Application of these methods to a specific business realm (strategic outsourc-ing management) is discussed. Other business problems in which they may be applied is also discussed. We provide thoughts on the future of business analytics and its relation-ship to signal processing.
REVENUE OPPORTUNITY ESTIMATIONWhen customers enter the marketplace, what and how much they purchase depends greatly on how much money they have in their wallets, i.e., the total amount of money they have allo-cated to spend on a certain category of products. If vendors know the wallet amounts of all customers, they can adjust their sales strategy accordingly and target customers with larger wal-lets. However, these amounts are not known to vendors. The revenue opportunity estimation problem is to predict wallet amounts from various available sources of data.
One approach for revenue opportunity estimation is based on quantile regression [10]; the main idea is as follows. The wallet amount of a customer (which could be another com-pany) is a hidden variable, whereas other information about the customer is observed, e.g., historical sales amounts and demographics or firmographics (see the next section for the definition of firmographics). The amount a customer spends is less than or equal to their wallet amount. Thus, if we have the conditional distribution of spending given demograph-ics or firmographics, the maximum supported value of the

IEEE SIGNAL PROCESSING MAGAZINE [85] SEPTEMBER 2011
distribution is the wallet amount. However, realistically, customers rarely spend all of their money at one vendor. Therefore, the realistic wallet amount is a high quantile, e.g., the 80th percentile, of the spending distribution. Percentiles are estimated using spending and demographic/firmographic data from a large number of cus-tomers using quantile regression.
SALES RECOMMENDER SYSTEMOne of the first questions of this article asked “which saris should I show Ranna Devi to make as much money as I can?” The general form of the question is “which product should I offer to a certain customer next so as to maximize expected rev-enue?” A technology that answers such a question is known as a sales recommender system. Sales recommender systems are usually based on historical data of the buying patterns of all cus-tomers, including the customer under consideration and are thus a form of collaborative filtering [11].
Recommender systems based on association rules, including the Apriori algorithm [12], are now ingrained in the business community. The basic idea is that if many customers purchased Item B after Item A, and a particular customer has purchased Item A, he or she is likely to next purchase Item B; thus, Item B should be offered to the customer. Newer developments in col-laborative filtering have been spurred by electronic commerce and the Netflix prize [13], and are based on nonnegative matrix factorization and rank minimization ideas.
The main difference between sales recommender systems for business analytics and other recommender systems, e.g., for movies, is the nature of the available data. For movie recom-mendations, the available data includes both positive and nega-tive ratings. However in sales, only transactions of purchases (positive ratings) are recorded; data on which items the custom-er considered but decided not to purchase (negative ratings) are not recorded. This data characteristic leads to a problem known as one-class collaborative filtering, on which there has been recent work [14]. Further algorithmic enhancements in the sales setting include the estimation of the expected revenue and the expected time for a deal to close.
SKILLS CAPACITY PLANNINGA key component of operating a large company or organiza-tion is the management of the human resources, i.e., the workforce [7]. Different workers have different skills and long-term costs. Also, different projects and engagements by the company call for workers with different skills and result in different amounts of revenue. Skills capacity planning involves the evaluation and optimization of revenue-cost dynamics and tradeoffs between having too many underuti-lized workers that have no projects assigned, and having too few workers with the correct skills to deliver an engagement when needed. This problem is different from capacity plan-ning in supply chain management encountered in operations
research because of the human element: workers are not the same as machines.
One methodology for skills capacity planning models the human resources with a multi-
class stochastic loss network with simultaneous resource alloca-tion [8], [9]. Losses model the risk of lost demand and associated revenue due to insufficient human resources at the time of engagement delivery, and the multiple classes represent different types of service engagements and worker skills. The model is optimized to maximize business performance subject to worker supply constraints, producing skills capacity targets over a planning horizon.
WORKFORCE EVOLUTION AND OPTIMIZATIONSkills capacity planning approaches workforce management from a demand perspective: based on the expectation of work, how many workers with particular skills are needed. However, there is a supply perspective to the workforce as well, which again arises due to the human nature of the resources. Lathes cannot transform themselves into band saws, but a circuit verification engineer can develop design skills and become a circuit designer. Also, lathes do not tire of going around in circles and voluntarily leave the company, whereas human workers might. As opposed to machine resources, which have a fixed supply unless more are ordered, with human resources there are significant amounts of dynamics and uncertainty.
Workforces frequently have significant and complicated time-varying dynamics, with workers acquiring skills, gaining efficiencies, changing roles, leaving, and joining. These dynam-ics have been modeled using discrete time, time-varying multi-dimensional stochastic processes with states that count the number of workers with each possible combination of skills [8]. Control-theoretic optimization is carried out to maximize busi-ness performance, with the decision variables including various investment decisions, such as training, promotions, incentives to reduce attrition, and hiring.
BRIEF INTRODUCTION TO FINANCIAL SIGNALSThe signal processing of financial time series is most often considered in the context of quantitative finance and trading. However, business analytics is a different but equally important domain in which information is extracted from financial time series and used to support decision making. Time series of financial metrics provide a wealth of data that can be used in planning future business operations. Corporate signals indi-cate the financial health of a company, the willingness and ability of a company to start new initiatives, the decision-mak-ing apparatus of a company, and many other nuggets of infor-mation. In this section, we discuss various corporate financial signals, including their definitions, how such data may be obtained, and filtering and normalization steps that are often applied to raw signals.
TIME SERIES OF FINANCIAL METRICS PROVIDE A WEALTH OF DATA THAT CAN BE USED IN PLANNING FUTURE
BUSINESS OPERATIONS.

IEEE SIGNAL PROCESSING MAGAZINE [86] SEPTEMBER 2011
A CORNUCOPIA OF FINANCIAL METRICS: AN ACCOUNTING PRIMERThe stock price of a company is the foremost financial signal in popular awareness, but there are other financial metrics that better reflect the actual performance of a business rather than percep-tions of it in the market. We now present a brief primer on accounting to describe these signals.
The net sales of a company, usually reported quarterly (every three months), is the amount of money that it generates by sell-ing products, taking discounts and returned products into account. For a company that generates money only from selling products, net sales is the same as revenue. However, revenue may also include money generated from other business activi-ties, such as rental income or interest from a certificate of deposit. The cost of goods sold is the money required to buy and manufacture products, including the cost of raw materials and labor. The gross profit is the amount left when the cost of goods sold is subtracted from the revenue.
Businesses incur other expenses besides those directly incurred in production, such as advertising expenses, overhead costs, and salaries of business executives. These costs are col-lected in the metric selling, general, and administrative expens-es (SG&A). Taking SG&A away from gross profit gives the metric earnings before interest, taxes, depreciation, and amor-tization; further subtracting interest, depreciation, and amorti-zation costs results in the metric earnings before taxes (EBT). Once tax costs are subtracted, the remaining money is counted as net income. An intermediate metric is cash flow: net income plus depreciation.
Further financial metrics are defined as ratios. Profit margin is net income divided by revenue. Return on assets is net income divided by the total value of assets held by the company such as equipment and buildings, whereas asset turnover is rev-enue divided by total assets. Earnings per share is net income divided by the number of shares of common stock, which repre-sent ownership of the company. The price-earnings ratio is the value of a share of common stock (the stock price) divided by the earnings per share. Return on equity is net income divided by the sum of the investments by all shareholders. Inventory turnover is the ratio between net sales and inventory—all of the raw materials, partially completed products, and fully complet-ed products that are ready to sell.
Long-term credit rating is the opinion of a rating company such as Moody’s, Standard & Poor’s (S&P’s), or Fitch on the ability and willingness of a company to meet its financial obliga-tions of over a year. S&P’s ratings range from AAA to D with intermediate plus and minus rating levels; AAA-rated companies are most willing and able to repay their debts. The credit rating is reported monthly. All of the financial metrics discussed in this primer relay varied information important in different busi-ness analytics applications.
FIRMOGRAPHIC AND OTHER CORPORATE SIGNALSThe financial metrics described above are good indicators of the financial health of a company, but they do not tell the entire story needed for various business ana-lytics applications. There are other informative signals as well.
Firmographic data is information about a company akin to demographic data about a person. It includes counts of employ-ees as a function of time in various job roles and locations, including hiring numbers and attrition numbers, as well as the corporate organizational hierarchy. More specific information about employees including age, gender, years of experience, and skill set may be included as well. The number and location of offices and facilities as a function of time are other firmographic signals, as is the primary industry of the company.
News, significant corporate developments, and other one-time events are also valuable inputs in business analytics appli-cations. Management changes and corporate restructurings have effects on business performance. Events such as changes in the chief executive or financial officer, bankruptcy, mergers and acquisitions, share repurchases, and earnings pre-announcements, may all be viewed as different time signals con-sisting of impulse functions. Another type of signal includes information gathered through surveys, e.g., service or product satisfaction surveys.
SOURCES OF DATA, PREFILTERING,AND NORMALIZATIONFinancial, firmographic, and other corporate signals are most easily available for publicly traded companies, i.e., those compa-nies permitted to sell their stocks, bonds, and other financial securities to the general public. These public companies are required to release information to comply with government reg-ulations. (Private companies are not required to make most financial and firmographic signals available.)
For a signal processing researcher, the most straightfor-ward way to access historical corporate signals of public com-panies is through databases curated by different firms. S&P’s Capital IQ Compustat database is one example of a source of financial signals. The Dun & Bradstreet database is an example of a source of firmographic data. As a source of information about corporate events, Reuters combs through press releases to construct its Significant Developments database. For a vari-ety of reasons, information in these databases is riddled with missing values, which must be kept in mind during signal pro-cessing algorithm development. Survey information is usually proprietary and not generally available.
Raw financial metric signals are usually filtered before their use in further analysis. Finite-impulse response filters may be used to obtain the mean signal, trend rate, and year-to-year growth of a financial metric. The mean signal is simply the application of a boxcar window filter. The trend rate is the
FOR A SIGNAL PROCESSING RESEARCHER, THE MOST
STRAIGHTFORWARD WAY TO ACCESS HISTORICAL CORPORATE SIGNALS OF PUBLIC COMPANIES IS
THROUGH DATABASES CURATED BY DIFFERENT FIRMS.

IEEE SIGNAL PROCESSING MAGAZINE [87] SEPTEMBER 2011
slope of a linear regression fit over a moving window [15]. The year-to-year growth is the difference between the financial metric and its value one year before, averaged over a moving window. Another signal derived from the raw financial metric is the volatility; it is the standard deviation over a moving win-dow of the difference between the financial metric and its value one year before.
It is difficult to compare financial metrics for an airline and a health-care company because they belong to different industries—the airline industry overall may be slumping and the health-care industry overall may be booming, but particu-lar companies within industries may be doing well or poorly relative to their peers. The Global Industry Classification System, a taxonomy of companies at different granularities developed by S&P’s and MSCI Barra, is commonly used to identify the industry to which a company belongs. The differ-ent granularities are ten sectors at the highest level, 24 indus-try groups, 68 industries, and 154 subindustries at the lowest level. Typically in business analytics applications involving company financial metrics, a normalization is performed within a desired level of granularity so as to only examine a company relative to its peers.
Once corporate signals are gathered, filtered, and normal-ized, they may be used in algorithms for prediction and insight to enable smarter business decisions. In the following sections, we describe several signal processing methodologies for these purposes.
TWO SIGNAL PROCESSING METHODOLOGIES IN DETAILIn this section, we discuss signal processing approaches that are fairly general but have found a variety of applications in busi-ness analytics. We focus on two specific techniques: constrained logistic regression and the inference of common signal struc-ture. Business leaders are frequently faced with yes/no ques-tions: should I produce this, should I sell that to a client, should I hire additional resources; logistic regression provides guid-ance to answer such questions based on historical data. Business leaders also frequently want to measure the impact of initiatives they take: what happens after we enter new markets, what happens after I shake up the management structure, what happens after we discontinue items; signal structure inference is a way to understand these impacts.
After providing technical details about both methodologies in this section, we show their application to strategic out-sourcing management in the next section and discuss other business problems to which they may be applied in the section that follows.
LOGISTIC REGRESSION WITH RISK FACTOR CONSTRAINTSA prediction problem that commonly arises in business analyt-ics is the supervised binary classification problem, i.e., learning detection rules from training signals. Given signal and label pairs 1yj, hj 2 , j5 1, c, n, where yj is a measured signal or sig-
nals and hj [ 521, 1 16, the objective is to determine a func-tion h 1y 2 that classifies new, unseen signals y from the same distribution as the training signals y1, c, yn with small error.
However, prediction accuracy is not the only objective; learned decision rules must also be transparent and insightful to organizational leaders, since leaders may be reluctant to fol-low algorithmic directives that they do not fully comprehend. Algorithms must also accept business knowledge from the user in an intuitive way. Decision trees and decision lists are estab-lished methodologies for supervised classification that provide clear detection rules [16], [17]. However, these techniques may be suboptimal in accuracy compared to other classification methods on certain data sets, including sets with few training samples [18], [19], and do not have a mechanism for taking prior information as input.
Logistic regression and other margin-based classification methods [20], [21] may be successful from an accuracy perspec-tive on signal distributions that decision trees and decision lists are not. They also provide probabilities in addition to binary classifications [22]. However, the decision rules that are pro-duced are not as easily interpretable as those of decision trees and especially decision lists. Prior information about relation-ships between components of y, such as that in the mind of a businessperson, cannot be taken into account in the standard logistic regression formulation either.
These considerations motivate a logistic regression model with hidden or auxiliary variables for use in business analytics [23], [24], where constraints on hidden variables allow for the user to specify prior knowledge regarding components of sig-nals y in an intuitive way. After learning, properties of the hidden variables may be presented to the business user on a dashboard in a way that is interpretable. In the following, we present an extension of logistic regression with constrained optimization to estimate hidden variables.
The standard framework for logistic regression considers classifiers of the form h 1y 2 5 sign 1wTy 2 , where w is a parame-ter vector that is learned to minimize the loss
an
j51log 111 exp 12hjw
Tyj 22 . (1)
The minimization is often performed using the iteratively reweighted least squares algorithm [25].
The extension for hidden variables is as follows. First, we partition the components of yj into m groups such that yj5 3y1 j
c
ym j 4T; these groups are named risk factors. The dif-ferent risk factors combine signal components with a common business theme, e.g., one risk factor could be “financial health” and be composed of all financial metric signals, whereas anoth-er risk factor could be “significant developments” and be com-posed of all the management change and corporate restructuring signals.
Then, prior information of the form: company j has better financial health than company j r, can be specified through con-straints in the logistic regression (or equivalently through a regularization term obtained using the method of Lagrange

IEEE SIGNAL PROCESSING MAGAZINE [88] SEPTEMBER 2011
multipliers). An overall constraint to the objective function (1) is the following:
am
i51a
n
j51
1cij2wiTyij 2 2 # P. (2)
The variables cij in the constraint encode prior information; if “financial health” corresponds to i5 1, then the knowl-edge that company j has better financial health than compa-ny j r is expressed by having c1 j . c1 jr. The constrained optimization may also be solved iteratively, using a slight modification of the iteratively reweighted least squares update [23], [24].
Having the higher-level risk factors eases elicitation of knowledge from the business user. Also, in presenting results, the groupings may be used to report the risk factors that result in significant changes in parameter values and increases in classification accuracy. The logistic regression model may be further extended by considering tree-struc-tured adaptation to identify relationships among signal components [23], [24].
INFERENCE OF COMMON SIGNAL STRUCTUREA different signal processing problem that arises in business analytics is one of time-series analysis. Impulse response sig-nals of a system under different perturbations or conditions often share a common structure or shape, but with different amplitudes, time scales, and delays. A system in business ana-lytics might be an employee or a company, whereas different conditions may be different demographics or firmographics, respectively. Given a collection of several noisy impulse responses, we would like to infer the common shape function and understand the variability of amplitude, time scale, and delay in the collection.
Specifically, let us consider the collection of n signals with the form
hj 1t 2 5 Aj f 1bj t1 dj 2 1 noise 1t 2 , j5 1, c, n, (3)
where hj 1t 2 is the impulse response for system j, f 1t 2 is the com-mon structure of the responses, and Aj, bj, and dj are the scalings and shift. We present a Markov chain Monte Carlo (MCMC) meth-
od to infer f 1t 2 , Aj, bj, and dj from h1 1t 2 , c, hn 1t 2 based on a hierarchical Bayes framework [26].
The problem at hand is different from dynamic time warping in two ways [27]: signals with large amounts of addi-tive noise are considered whereas dynamic time warping is best for collections of signals with little noise, and we aim for interpretability through the parameterization using Aj, bj, and dj, which is not the case in dynamic time warping. Methodologies developed in [28] and [29] are suited for noisy signals but again do not have easily interpretable parameters, which is essential for methods to be adopted by the business community. Also, unlike our approach, the methods of [28] and [29] are not robust to signals with missing values, which are common in business analytics. The formulation of [30] is similar to the one herein. Note that methods for the multiple alignment of discrete-time sequences such as DNA sequences exist, but solve a problem quite different than the one we are interested in [31].
For tractability of inference, a particular form for the com-mon structure function f 1t 2 is needed. The form we consider is a piecewise linear interpolating spline with a fixed number of knots m. Let the times of the knots be t1, t2, c, tm, and the values of the common shape function at those times be f1, f2, c, fm. We also assume that the noise in (3) is white, which introduces statistical independence among times that we take advantage of for inference. With f 1t 2 a spline and the noise white, a probabilistic model for the collection of signals is expressed in terms of a Bayesian network in Figure 1. The variables uA, ub, and ud are parameters of the prior distribu-tions for the Aj, bj, and dj, common for all j. They may be fixed hyperparameters or may have prior distributions themselves.
We take a Gibbs sampling approach to estimate fi, i5 1, c, m, and Aj, bj, dj, j5 1, c, n [32]; the simple struc-ture shown in Figure 1 permits sampling one variable at a time with all others fixed. With additive white Gaussian noise, sam-pling fi involves sampling a Gaussian random variable with closed-form expressions for its mean and variance [26]. To sam-ple the Aj, bj, and dj, Metropolized independent sampling may be used [33], [34] in which the variable is sampled independent-ly according to its prior distribution and then accepted or rejected according to a closed-form Hastings ratio [26].
The fi samples that are produced provide a distribution for the common structure function. The expected f 1t 2 and its surrounding uncertainty is readily visualized on a business analytics dash-board. The Aj, bj, and dj samples may also be readily visualized in his-tograms to provide insight into the variability in amplitude, time scale, and time delay of responses to actions by different employees or different companies.
APPLICATION TO STRATEGIC OUTSOURCING MANAGEMENTHaving generally described two signal processing method-ologies in the previous section, we now apply them to a spe-cific business domain: outsourcing management. A strategic outsourcing engagement is a large contract by a
[FIG1] Bayesian network representation of model for common signal structure inference.
θA θb θd f1 fm
Aj bj dj
hjn
. . .

IEEE SIGNAL PROCESSING MAGAZINE [89] SEPTEMBER 2011
company to have its informa-tion technology operations run by a vendor firm that specializ-es in operating information technology efficiently and reli-ably, so that the client compa-ny may focus its attention on its core business [35]. For example, a chocolatier may wish to focus on innovations in truffle making and thus outsource its information technol-ogy operations to an information services company. There are several business analytics problems that arise in strate-gic outsourcing management; we describe two in this sec-tion that make use of financial signals and provide concrete applications for the constrained logistic regression and common signal structure inference methodologies dis-cussed in the preceding section.
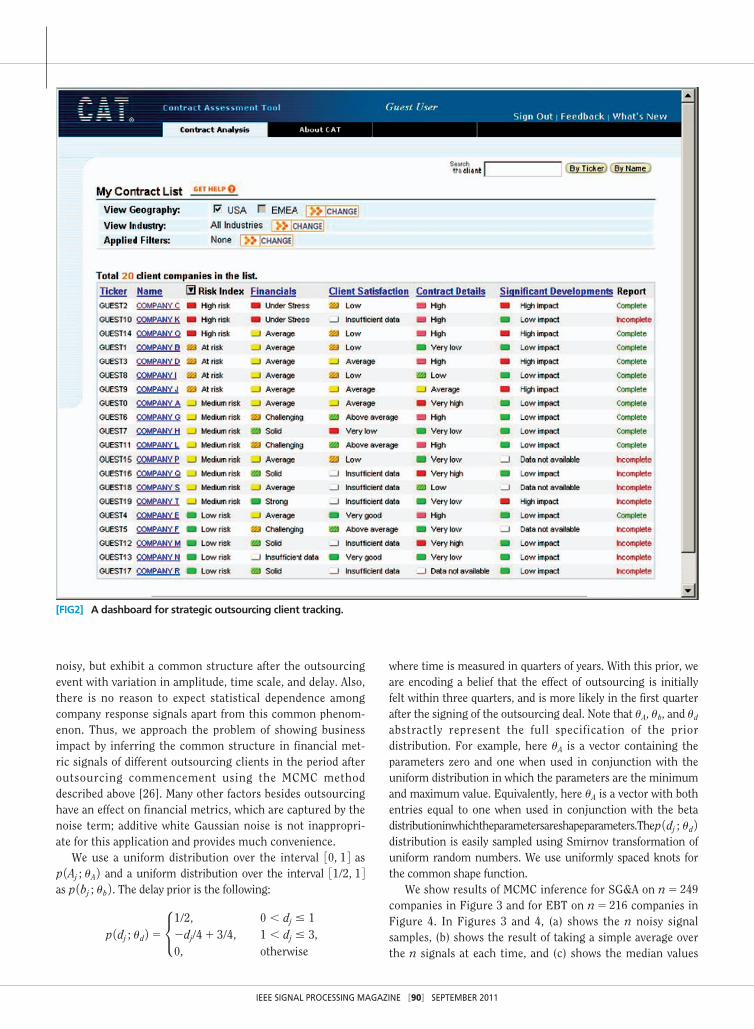
CLIENT TRACKINGOne business analytics problem that arises in strategic out-sourcing management is client tracking [23], [24]. The ven-dor (the information services provider) would like to examine its existing clients and predict which ones are likely to reduce, rescope, or even terminate their outsourcing con-tracts and which ones are not. All of the financial, firmo-graphic, and corporate signals, including client satisfaction surveys discussed previously provide relevant information for this problem because poor financial performance, changes in corporate strategy, and dissatisfaction with service are all possible reasons for the downsizing of outsourcing. Data detailing outsourcing contracts is also informative and is available to the vendor.
The client tracking problem is one of binary classification since vendors have historical information on which clients downsized or terminated their contracts and which ones did not. This information forms the training set for this problem. Besides predicting which clients are at risk for terminating their contracts, vendors would also like insight into reasons why those clients are at risk for termination. With this additional insight, the vendor may be able to take corrective action to pre-vent contract termination or reduction. Vendors have prior information about their client roster that is not captured in the available financial signals, but that they would like to be incor-porated in predictive models. Consequently, the constrained logistic regression approach described previously is an appropri-ate solution for client tracking.
In one such application that we developed for IBM Global Services, we trained the logistic regression classifier with risk factor constraints on a data set consisting of 84 large informa-tion technology services clients of IBM tracked over three years. We measured more than one data sample for some clients, yielding a data set with n5 148 samples, 79 samples of compa-nies that downsized their services engagement and 69 that had no significant changes to their services contract. Five risk fac-tors were used as follows:
■ Financials: (mean signal of SG&A, profit margin, and receiv-ables turnover; year-to-year growth of cost of goods sold, SG&A, price-earnings ratio, and return on equity; volatility of cost of goods sold, and earnings before interest and taxes)
■ Client satisfaction: (client satisfaction survey on overall satisfaction with service, client satisfaction survey on percep-tion of value that outsourcing brings)
■ Contract details ■ Significant developments: (restructurings or reorganiza-
tions, chief executive officer changes, chief financial officer changes)
■ Prior rescoping: previous history of contract changes.Details on parameter settings, constraint settings, and classifi-
cation accuracy results may be found in [24]. Accuracy in busi-ness analytics is generally measured in the same way as in other application domains, here through leave-one-out cross-validation.
It was found that deteriorating financial health along with significant client events were precursors of a downsizing deci-sion. These factors were modulated by customer satisfaction with the ongoing engagement and the client perception of the business value of the engagement. Figure 2 shows a dashboard that the vendor would use, which presents results from the constrained logistic regression. The dashboard lists 20 compa-nies along with their overall risk of outsourcing contract down-sizing and then breaks down that likelihood into the different risk factors. In the dashboard, it is not the binary classifications that are given, but probabilities from the logistic regression that have been quantized [22]. Thus, the results are presented in an appealing way for a business user. By clicking on a com-pany’s name, a further report may be viewed with greater details on all of the different financial, firmographic, and corpo-rate signals of the company described at the beginning of the article, including those not included in the risk factors.
BUSINESS IMPACT ANALYSISCompanies engage in outsourcing so that they may focus their energies on their core business with the intention that doing so will improve their bottom line. Outsourcing represents a large investment; thus to market and sell its outsourcing services, a vendor must show the tangible value of outsourcing to officers of prospective client companies. One way to show this value is via financial metrics, e.g., that outsourcing decreases expenses and increases earnings over time. Namely, the vendor would like to show the business impact of outsourcing [24], [36].
For a particular financial metric, such as EBT growth or SG&A growth (normalized by industry), we have signals from numerous companies available. Additionally, we have infor-mation on when these companies signed strategic outsourc-ing deals. Note that this date information is regarding contract signing, not when the outsourcing services were actually rolled out. As a function of time, the signals are
COMPANIES ENGAGE IN OUTSOURCING SO THAT THEY MAY FOCUS THEIR
ENERGIES ON THEIR CORE BUSINESS WITH THE INTENTION THAT
DOING SO WILL IMPROVE THEIR BOTTOM LINE.
IEEE SIGNAL PROCESSING MAGAZINE [90] SEPTEMBER 2011
noisy, but exhibit a common structure after the outsourcing event with variation in amplitude, time scale, and delay. Also, there is no reason to expect statistical dependence among company response signals apart from this common phenom-enon. Thus, we approach the problem of showing business impact by inferring the common structure in financial met-ric signals of different outsourcing clients in the period after outsourcing commencement using the MCMC method described above [26]. Many other factors besides outsourcing have an effect on financial metrics, which are captured by the noise term; additive white Gaussian noise is not inappropri-ate for this application and provides much convenience.
We use a uniform distribution over the interval 30, 1 4 as p 1Aj ; uA 2 and a uniform distribution over the interval 31/2, 1 4 as p 1bj ; ub 2 . The delay prior is the following:
p 1dj ; ud 2 5 •1/2, 0 , dj # 12dj/41 3/4, 1 , dj # 30, otherwise
,
where time is measured in quarters of years. With this prior, we are encoding a belief that the effect of outsourcing is initially felt within three quarters, and is more likely in the first quarter after the signing of the outsourcing deal. Note that uA, ub, and ud abstractly represent the full specification of the prior distribution. For example, here uA is a vector containing the parameters zero and one when used in conjunction with the uniform distribution in which the parameters are the minimum and maximum value. Equivalently, here uA is a vector with both entries equal to one when used in conjunction with the beta distribution in which the parameters are shape parameters. The p 1dj ; ud 2 distribution is easily sampled using Smirnov transformation of uniform random numbers. We use uniformly spaced knots for the common shape function.
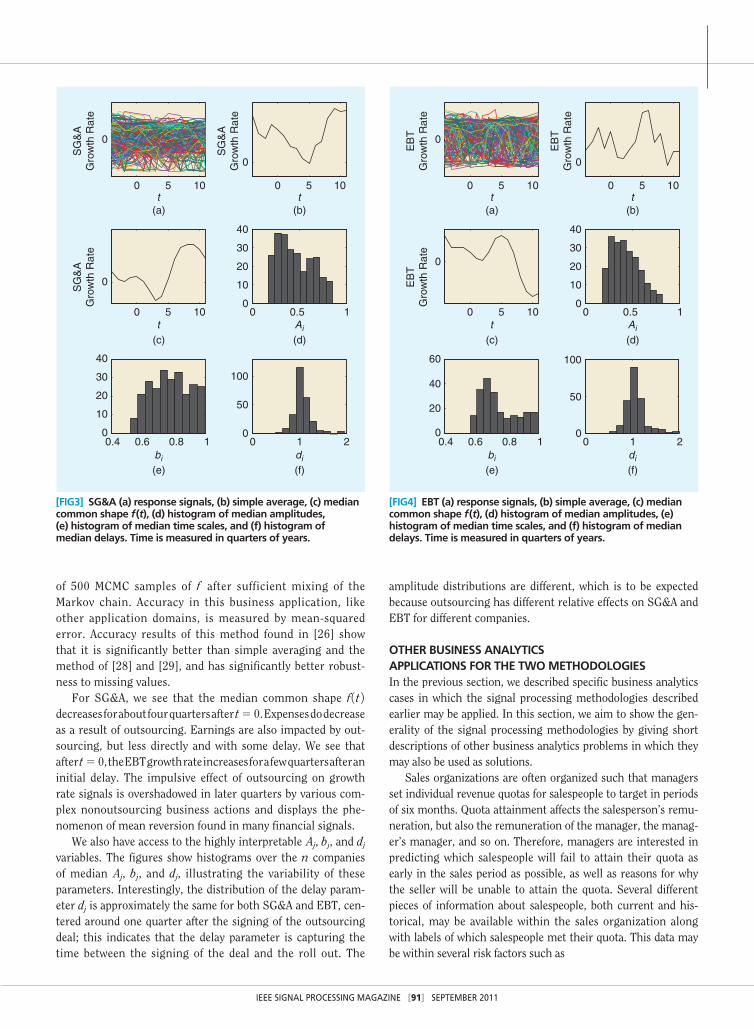
We show results of MCMC inference for SG&A on n5 249 companies in Figure 3 and for EBT on n5 216 companies in Figure 4. In Figures 3 and 4, (a) shows the n noisy signal samples, (b) shows the result of taking a simple average over the n signals at each time, and (c) shows the median values
[FIG2] A dashboard for strategic outsourcing client tracking.
IEEE SIGNAL PROCESSING MAGAZINE [91] SEPTEMBER 2011
of 500 MCMC samples of f after sufficient mixing of the Markov chain. Accuracy in this business application, like other application domains, is measured by mean-squared error. Accuracy results of this method found in [26] show that it is significantly better than simple averaging and the method of [28] and [29], and has significantly better robust-ness to missing values.
For SG&A, we see that the median common shape f 1t 2 decreases for about four quarters after t5 0. Expenses do decrease as a result of outsourcing. Earnings are also impacted by out-sourcing, but less directly and with some delay. We see that after t5 0, the EBT growth rate increases for a few quarters after an initial delay. The impulsive effect of outsourcing on growth rate signals is overshadowed in later quarters by various com-plex nonoutsourcing business actions and displays the phe-nomenon of mean reversion found in many financial signals.
We also have access to the highly interpretable Aj, bj, and dj variables. The figures show histograms over the n companies of median Aj, bj, and dj, illustrating the variability of these parameters. Interestingly, the distribution of the delay param-eter dj is approximately the same for both SG&A and EBT, cen-tered around one quarter after the signing of the outsourcing deal; this indicates that the delay parameter is capturing the time between the signing of the deal and the roll out. The
amplitude distributions are different, which is to be expected because outsourcing has different relative effects on SG&A and EBT for different companies.
OTHER BUSINESS ANALYTICS APPLICATIONS FOR THE TWO METHODOLOGIESIn the previous section, we described specific business analytics cases in which the signal processing methodologies described earlier may be applied. In this section, we aim to show the gen-erality of the signal processing methodologies by giving short descriptions of other business analytics problems in which they may also be used as solutions.
Sales organizations are often organized such that managers set individual revenue quotas for salespeople to target in periods of six months. Quota attainment affects the salesperson’s remu-neration, but also the remuneration of the manager, the manag-er’s manager, and so on. Therefore, managers are interested in predicting which salespeople will fail to attain their quota as early in the sales period as possible, as well as reasons for why the seller will be unable to attain the quota. Several different pieces of information about salespeople, both current and his-torical, may be available within the sales organization along with labels of which salespeople met their quota. This data may be within several risk factors such as
0 5 10
0
t
SG
&A
Gro
wth
Rat
e
SG
&A
Gro
wth
Rat
e
SG
&A
Gro
wth
Rat
e
0 5 10
0
t
t Ai
(a) (b)
(c) (d)
dibi
(e) (f)
0 5 10
0
0 0.5 10
10
20
30
40
0.4 0.6 0.8 10
10
20
30
40
0 1 20
50
100
[FIG3] SG&A (a) response signals, (b) simple average, (c) median common shape f (t), (d) histogram of median amplitudes, (e) histogram of median time scales, and (f) histogram of median delays. Time is measured in quarters of years.
[FIG4] EBT (a) response signals, (b) simple average, (c) median common shape f (t), (d) histogram of median amplitudes, (e) histogram of median time scales, and (f) histogram of median delays. Time is measured in quarters of years.
0 5 10
0
t
EB
TG
row
th R
ate
EB
TG
row
th R
ate
EB
TG
row
th R
ate
0 5 10
0
t
t Ai
(a) (b)
(c) (d)
dibi
(e) (f)
0 5 10
0
0 0.5 10
10
20
30
40
0.4 0.6 0.8 10
20
40
60
0 1 20
50
100

IEEE SIGNAL PROCESSING MAGAZINE [92] SEPTEMBER 2011
■ skills and training ■ experience ■ previous quota attainment ■ previous revenue ■ client portfolio.
The quota attainment problem is a binary supervised classifica-tion problem suited to constrained logistic regression. If a key risk factor predicting that a particular salesperson will fail to meet quota is skills and training, then the manager can help the salesperson by offering training. If it is client portfolio, then the manager can change the list of clients to which the salesperson is assigned.
A key problem in large organizations is churn: employees voluntarily leaving the organization. High employee attrition and turnover rates are costly; businesses would prefer to retain their talent. Risk factors for employee attrition include
■ dissatisfaction with the job ■ working hours/conditions ■ salary ■ accepting a new job ■ family reasons.
If employees at risk for leaving as well as key factors leading to that risk are identified, appropriate incentives may be offered for talent retention. A closely related problem is success in employee recruitment; it is costly for businesses to interview and offer jobs to candidates who ultimately decide not to accept the offer of employment. Predicting which candidates will accept job offers and which ones will not, like predicting which employees will leave voluntarily, is a classification problem that may be approached through logistic regression with risk factor constraints.
When salespeople are hired, they bring in little or no reve-nue initially and gradually ramp up their sales over time [37]. Similarly, software developers take time to reach their peak productivity after hiring [38]. For workforce planning purpos-es, it is useful to have a typical productivity time evolution of new hires along with characterization of variability. Given sales revenue signals or software development metric signals of a collection of employees starting at the time of hiring, we may infer the common productivity profile using an MCMC method as described earlier in the article, and also obtain information about variable time scales and amplitudes among new employees.
Returning to strategic outsourcing, in the opportunity or client targeting problem, the vendor predicts which companies, among those not currently clients, will purchase outsourcing services. These companies may then be approached to offer out-sourcing services. Unlike client tracking, customer satisfaction surveys and contract details are not available in this problem but financial, firmographic, and corporate signals are. This problem, like client tracking, may be approached through logis-tic regression with risk factor constraints [24].
The two signal processing methodologies we have detailed in the article are generally applicable both within business analyt-ics and in other applications. Outsourcing client tracking, out-
sourcing business impact, sales quota attainment, talent retention, recruitment success, employee productivity profile inference, and outsourcing opportunity targeting are just a few of the different business analytics problems that the two meth-odologies address. Many others may be imagined as well.
CONCLUSIONSThe detailed case studies of constrained logistic regression and signal structure inference surveyed in this article provide sub-stantive results of importance for business analytics applica-tions, but they and the surveyed vignettes are not the complete story. Business analytics is an emerging field that has not yet been fully defined as a discipline and has much room for devel-opment, including the adoption of advanced signal processing methods ranging from adaptive filtering to large-scale signal processing and beyond.
A few common themes that can be found within business analytics include the requirements for interpretability of predic-tive outputs, especially in the form of dashboards and reports; the elicitation and acceptance of soft prior information; and a multiscale nature, e.g., summarization of response signals into a higher-level common structure signal and the combination of lower-level feature signals into higher-level risk factors.
Defining future directions will require a synergy between the business community and the signal processing community. Each brings something different to the table. The business com-munity brings knowledge about the realities of today’s enter-prises and marketplaces—an understanding of the pressing informational needs and desires of businesspeople. The signal processing and allied communities, besides bringing the techni-cal know-how for translating business problems and use cases into a statistical and computational language in which solutions may be developed, brings an imagination to foresee models, algorithms, and techniques along with their requisite input data that perform analysis, provide insight, or answer questions that do not have even a nascent place in the businessperson’s realm of possibilities.
The first thought when considering signal processing for financial applications is investment and quantitative finance. “Money makes the world go around” is sung in the musical Cabaret. More than stock trading, the way that money makes the world and economy go around is through business deci-sions and actions, including sales, marketing, and hiring and attrition. Signal processing applied to those endeavors is the new frontier of business analytics, and it is open for business.
AUTHORSKush R. Varshney ([email protected]) received the B.S. degree (magna cum laude) in electrical and computer engineer-ing with honors from Cornell University, Ithaca, New York in 2004. He received the S.M. degree in 2006 and the Ph.D. degree in 2010, both in electrical engineering and computer science from the Massachusetts Institute of Technology (MIT), Cambridge. He is a research staff member in the Business Analytics and Mathematical Sciences Department at the IBM

IEEE SIGNAL PROCESSING MAGAZINE [93] SEPTEMBER 2011
Thomas J. Watson Research Center, Yorktown Heights, New York. While at MIT, he was a research assistant with the Stochastic Systems Group in the Laboratory for Information and Decision Systems and a National Science Foundation Graduate Research Fellow. He has been a visiting student at École Centrale, Paris and an intern at Lawrence Livermore National Laboratory, Sun Microsystems, and Sensis Corporation. His research interests include statistical signal processing, statistical learning, and image processing. He is a member of Eta Kappa Nu, Tau Beta Pi, and ISIF. He received the 2009 International Conference on Information Fusion Best Student Paper Travel Award. He is a Member of the IEEE.
Aleksandra Mojsilovic ([email protected]) received the B.S.E.E., M.S.E.E., and Ph.D. degrees from the University of Belgrade in 1992, 1994, and 1997, respectively. She manages the Probabilistic Analysis and Optimization Group, part of the Business Analytics and Mathematical Sciences Department at the IBM Thomas J. Watson Research Center in Yorktown Heights, New York. Prior to her current position, she was a member of the Visual Analysis Group at T.J. Watson, where she focused on image processing, computer vision models, and indexing and retrieval of visual information. She was previously a member of technical staff at Bell Laboratories. Her research interests include multidimensional signal processing, modeling, pattern recognition, with applications in business analytics, financial modeling, multimedia, and human perception. She is the author of more than 50 publications and holds ten patents. In 2001, she received the IEEE Signal Processing Society’s Young Author Best Paper Award. She is currently an associate editor for IEEE Signal Processing Magazine.
REFERENCES[1] S. Beer, Management Sciences: The Business Use of Operations Research. Garden City, NY: Doubleday, 1968.
[2] H. P. Luhn, “A business intelligence system,” IBM J. Res. Develop., vol. 2, no. 4, pp. 314–319, Oct. 1958.
[3] C. V. Apte, S. J. Hong, R. Natarajan, E. P. D. Pednault, F. A. Tipu, and S. M. Weiss, “Data-intensive analytics for predictive modeling,” IBM J. Res. Develop., vol. 47, no. 1, pp. 17–23, Jan. 2003.
[4] T. H. Davenport and J. G. Harris, Competing on Analytics: The New Science of Winning. Boston, MA: Harvard Business School Press, 2007.
[5] T. May, The New Know: Innovation Powered by Analytics. Hoboken, NJ: Wiley, 2009.
[6] G. H. N. Laursen and J. Thorlund, Business Analytics for Managers: Taking Business Intelligence Beyond Reporting. Hoboken, NJ: Wiley, 2010.
[7] A. Mojsilovic and D. Connors, “Workforce analytics for the services economy,” in Handbook of Service Science, P. P. Maglio, C. A. Kieliszewski, and J. C. Spohrer, Eds. New York: Springer-Verlag, 2010, pp. 437–460.
[8] H. Cao, J. Hu, C. Jiang, T. Kumar, T.-H. Li, Y. Liu, Y. Lu, S. Mahatma, A. Mojsilovic, M. Sharma, M. S. Squillante, and Y. Yu, “OnTheMark: Integrated sto-chastic resource planning of human capital supply chains,” in Proc. INFORMS Annu. Meeting, Austin, TX, Nov. 2010.
[9] K. Jung, Y. Lu, D. Shah, M. Sharma, and M. S. Squillante, “Revisiting sto-chastic loss networks: Structures and algorithms,” in Proc. ACM SIGMETRICS Conf. Measurement and Modeling of Computer Systems, Annapolis, MD, June 2008, pp. 407–418.
[10] R. Lawrence, C. Perlich, S. Rosset, J. Arroyo, M. Callahan, J. M. Collins, A. Ershov, S. Feinzig, I. Khabibrakhmanov, S. Mahatma, M. Niemaszyk, and S. M. Weiss, “Analytics-driven solutions for customer targeting and sales-force alloca-tion,” IBM Syst. J., vol. 46, no. 4, pp. 797–816, Oct. 2007.
[11] P. Melville and V. Sindhwani, “Recommender systems,” in Encyclopedia of Machine Learning, C. Sammut and G. I. Webb, Eds. New York: Springer-Verlag, 2011, pp. 829-838.
[12] R. Agrawal and R. Srikant, “Fast algorithms for mining association rules,” in Proc. Int. Conf. Very Large Data Bases, Santiago, Chile, Sept. 1994, pp. 487–499.
[13] J. Bennett and S. Lanning, “The Netflix prize,” in Proc. KDD Cup Workshop, San Jose, CA, Aug. 2007, pp. 3–6.
[14] V. Sindhwani, S. S. Bucak, J. Hu, and A. Mojsilovic, “One class matrix completion with low density factorizations,” in Proc. IEEE Int. Conf. Data Min-ing, Sydney, Australia, Dec. 2010, pp. 1055–1060.
[15] C. S. Turner, “Slope filtering: An FIR approach to linear regression,” IEEE Signal Processing Mag., vol. 25, no. 6, pp. 159–163, Nov. 2008.
[16] L. Breiman, J. H. Friedman, R. A. Olshen, and C. J. Stone, Classification and Regression Trees. Belmont, CA: Wadsworth International Group, 1984.
[17] R. L. Rivest, “Learning decision lists,” Mach. Learn., vol. 2, no. 3, pp. 229–246, Nov. 1987.
[18] S. J. Raudys and A. K. Jain, “Small sample size effects in statistical pattern recognition: Recommendations for practitioners,” IEEE Trans. Pattern Anal. Ma-chine Intell., vol. 13, no. 3, pp. 252–264, Mar. 1991.
[19] M. Basu and T. K. Ho, Eds., Data Complexity in Pattern Recognition. London: Springer-Verlag, 2006.
[20] B. Efron, “The efficiency of logistic regression compared to normal discrimi-nant analysis,” J. Amer. Stat. Assoc., vol. 70, no. 352, pp. 892–898, Dec. 1975.
[21] P. L. Bartlett, M. I. Jordan, and J. D. McAuliffe, “Convexity, classification, and risk bounds,” J. Amer. Stat. Assoc., vol. 101, no. 473, pp. 138–156, Mar. 2006.
[22] J. C. Platt, “Probabilities for SV machines,” in Advances in Large Margin Classifiers, A. J. Smola, P. L. Bartlett, B. Schölkopf, and D. Schuurmans, Eds. Cambridge, MA: MIT Press, 2000, pp. 61–74.
[23] A. Mojsilovic, “A logistic regression model for small sample classification problems with hidden variables and non-linear relationships: An application in business analytics,” in Proc. IEEE Int. Conf. Acoustics, Speech, and Signal Pro-cessing, Philadelphia, PA, Mar. 2005, vol. 5, pp. 329–332.
[24] A. Mojsilovic, B. Ray, R. Lawrence, and S. Takriti, “A logistic regression frame-work for information technology outsourcing lifecycle management,” Comput. Oper. Res., vol. 34, no. 12, pp. 3609–3627, Dec. 2007.
[25] P. J. Green, “Iteratively reweighted least squares for maximum likelihood es-timation, and some robust and resistant alternatives,” J. Roy. Stat. Soc. B, vol. 46, no. 2, pp. 149–192, 1984.
[26] D. A. Katz-Rogozhnikov, K. R. Varshney, A. Mojsilovic, and M. Singh, “MCMC inference of the shape and variability of time-response signals,” in Proc. IEEE Int. Conf. Acoustics, Speech, and Signal Processing, Prague, Czech Re-public, May 2011, 3956–3959.
[27] K. Wang and T. Gasser, “Alignment of curves by dynamic time warping,” Ann. Stat., vol. 25, no. 3, pp. 1251–1276, June 1997.
[28] J. Listgarten, R. M. Neal, S. T. Roweis, and A. Emili, “Multiple alignment of continuous time series,” in Advances in Neural Information Processing Systems, vol. 17. Cambridge, MA: MIT Press, 2005, pp. 817–824.
[29] J. Listgarten, R. M. Neal, S. T. Roweis, R. Puckrin, and S. Cutler, “Bayesian detection of infrequent differences in sets of time series with shared structure,” in Advances in Neural Information Processing Systems, vol. 19. Cambridge, MA: MIT Press, 2007, pp. 905–912.
[30] D. Telesca and L. Y. T. Inoue, “Bayesian hierarchical curve registration,” J. Amer. Stat. Assoc., vol. 103, no. 481, pp. 328–339, Mar. 2008.
[31] C. E. Lawrence, S. F. Altschul, M. S. Boguski, J. S. Liu, A. F. Neuwald, and J. C. Wootton, “Detecting subtle sequence signals: A Gibbs sampling strategy for multiple alignment,” Science, vol. 262, no. 5131, pp. 208–214, Oct. 1993.
[32] S. Geman and D. Geman, “Stochastic relaxation, Gibbs distributions, and the Bayesian restoration of images,” IEEE Trans. Pattern Anal. Machine Intell., vol. PAMI-6, no. 6, pp. 721–741, Nov. 1984.
[33] L. Tierney, “Markov chains for exploring posterior distributions,” Ann. Stat., vol. 22, no. 4, pp. 1701–1728, Dec. 1994.
[34] J. S. Liu, “Metropolized independent sampling with comparisons to rejection sam-pling and importance sampling,” Stat. Comput., vol. 6, no. 2, pp. 113–119, June 1996.
[35] J. B. Quinn and F. G. Hilmer, “Strategic outsourcing,” MIT Sloan Manage. Rev., vol. 35, no. 4, pp. 43–55, July 1994.
[36] “Business impact of outsourcing: A fact-based analysis,” IBM Corp., Armonk, New York, Jan. 2010.
[37] M. Sharma, A. Mojsilovic, M. Singh, and K. R. Varshney, “A framework for sales force productivity profile estimation,” in Proc. INFORMS Annu. Meeting, Austin, TX, Nov. 2010.
[38] S. E. Sim and R. C. Holt, “The ramp-up problem in software projects: A case study of how software immigrants naturalize,” in Proc. Int. Conf. Software Engineering, Kyoto, Japan, Apr. 1998, pp. 361–370. [SP]