methodology article open access in silico fragmentation
TRANSCRIPT
METHODOLOGY ARTICLE Open Access
In silico fragmentation for computer assistedidentification of metabolite mass spectraSebastian Wolf1*, Stephan Schmidt1, Matthias Müller-Hannemann2, Steffen Neumann1
Abstract
Background: Mass spectrometry has become the analytical method of choice in metabolomics research. Theidentification of unknown compounds is the main bottleneck. In addition to the precursor mass, tandem MSspectra carry informative fragment peaks, but the coverage of spectral libraries of measured reference compoundsare far from covering the complete chemical space. Compound libraries such as PubChem or KEGG describe alarger number of compounds, which can be used to compare their in silico fragmentation with spectra ofunknown metabolites.
Results: We created the MetFrag suite to obtain a candidate list from compound libraries based on the precursormass, subsequently ranked by the agreement between measured and in silico fragments. In the evaluationMetFrag was able to rank most of the correct compounds within the top 3 candidates returned by an exact massquery in KEGG. Compared to a previously published study, MetFrag obtained better results than the commercialMassFrontier software. Especially for large compound libraries, the candidates with a good score show a highstructural similarity or just different stereochemistry, a subsequent clustering based on chemical distances reducesthis redundancy. The in silico fragmentation requires less than a second to process a molecule, and MetFragperforms a search in KEGG or PubChem on average within 30 to 300 seconds, respectively, on an averagedesktop PC.
Conclusions: We presented a method that is able to identify small molecules from tandem MS measurements,even without spectral reference data or a large set of fragmentation rules. With today’s massive general purposecompound libraries we obtain dozens of very similar candidates, which still allows a confident estimate of thecorrect compound class. Our tool MetFrag improves the identification of unknown substances from tandem MSspectra and delivers better results than comparable commercial software. MetFrag is available through a webapplication, web services and as java library. The web frontend allows the end-user to analyse single spectra andbrowse the results, whereas the web service and console application are aimed to perform batch searches andevaluation.
BackgroundMass spectrometry has become the analytical method ofchoice in metabolomics research [1]. Various ionisationmethods are commonly used, such as electron impact(EI) used with gas chromatography (GC/MS), or the softelectrospray ionisation (ESI), which is employed in LC/ESI-MS systems. The main bottleneck in the interpreta-tion of metabolomics experiments is the identification ofcompounds. In addition to the exact mass, tandem MSspectra provide additional structural hints, providing a
fingerprint of the measured molecule. In tandem MS,the molecules are interacting with a collision gas at spe-cified kinetic energies, hence the name collision induceddissociation. Large spectral libraries of measured refer-ence spectra exist for GC/MS, such as the commercialNIST library ‘08 (Gaithersburg, MD) or the GMD [2],but for ESI-tandem MS spectral libraries are still fewand comparably small [3,4]. A different approachtowards identification is the interpretation of the mea-sured spectra, usually with regard to the known (orhypothetical) molecular structure.Fragmenter with a rule set like the commercial tools
ACD Fragmenter [5] and Mass Frontier [6] generate* Correspondence: [email protected] Institute of Plant Biochemistry- Department of Stress- andDevelopmental Biology, Weinberg 3, 06120 Halle(Saale), Germany
Wolf et al. BMC Bioinformatics 2010, 11:148http://www.biomedcentral.com/1471-2105/11/148
© 2010 Wolf et al; licensee BioMed Central Ltd. This is an Open Access article distributed under the terms of the Creative CommonsAttribution License (http://creativecommons.org/licenses/by/2.0), which permits unrestricted use, distribution, and reproduction inany medium, provided the original work is properly cited.

fragments based on cleavage rules known from the lit-erature, in both cases the algorithmic details arenot published. For some compounds, MassFrontier 5 isnot able to identify any fragments in negative mode [7].Hill et al. used Mass Frontier 4 to predict thetandem MS spectra of 102 test compounds, which wereanalysed using a Micromass Q-TOF II in positive mode,to identify the measured compound and its structure.Candidate compounds were retrieved from PubChemusing the exact mass. MassFrontier used those struc-tures as input and generated spectra which werecompared to the measured spectra. Finally, the com-pounds were ranked according to the peaks commonto both the predicted and measured spectra [8]. Combi-natorial Fragmenter such as Fragment Identificator(FiD) proposed by Heinonen et al. [9] try to predictthe fragmentation tree given both a metabolite’s mole-cular structure and its tandem mass spectrum. Due tohigh computational complexity, even for a single med-ium sized compound (around 300 Da) runtimes canreach several hours. Another approach is the systematicbond disconnection method without a rule set asdescribed in [10]. The resulting product ions from a sin-gle precursor structure are matched against thepeaks measured with a high-resolution mass spectro-meter. The software EPIC was tested against twohand annotated spectra from the literature and is notpublicly available. The runtime was reported to bearound 1 minute to process 1-(3-(5-(1,2,4-triazol-4-yl)-1H-indol-3-yl)propyl)-4-(2-(3-fluorophenyl)ethyl)pipera-zine (432 Da).
MetFrag is a combinatorial fragmenter using the bonddisconnection approach, which is fast enough to screendozens to thousands of candidates retrieved from e.g.KEGG, PubChem or ChemSpider compound databases.We do not attempt to create a mechanistically correctprediction of the fragmentation processes. Instead, wewant to perform a search in compound libraries usingthe measured fragments as additional structural hints.The paper is structured as follows: in the next section
we describe the architecture and the in silico fragmenta-tion algorithm, including heuristics to speed up calcula-tions and to account for molecular rearrangementsupon fragmentation. Afterwards, we explain the scoringfunction. In the results section we evaluate MetFrag ona set of 710 spectra from 151 compounds. The paperfinishes with our conclusions. All detailed results areavailable as additional files.
ImplementationThe workflow implemented in MetFrag is shown inFigure 1, and covered in detail in the following sections.MetFrag is implemented in Java and uses the ChemistryDevelopment Kit [11], an open source Java library. TheCDK provides algorithms and data structures for struc-tural Chemo- and Bioinformatics and is able to readand write common formats such as MDL, CML, InChI,and many more.
Retrieval of candidates from compound librariesFirst we perform a search in a general purpose com-pound database for candidate molecules based on the
Figure 1 Workflow of a search based on exact mass and tandem MS spectrum. First the upstream compound library is searched usingtheir respective web service API. The scoring ranks the measured peaks against the in silico fragments.
Wolf et al. BMC Bioinformatics 2010, 11:148http://www.biomedcentral.com/1471-2105/11/148
Page 2 of 12

exact mass (within an error range given in ppm) ofthe neutral and intact molecule. Currently threecompound databases can be queried: KEGG Com-pound (about 16 021 entries, October 2009) [12], Pub-Chem (37 million, June 2009) [13] and ChemSpider(23 million, October 2009) [14]. Optionally, the searchcan be restricted to compounds containing only theelements CHNOPS, commonly occurring in naturalproducts.Alternatively, the compound databases can be
searched with the elemental composition if this hasbeen derived from e.g. exact mass and isotopic patternof the precursor. Finally, the set of candidates can besupplied by simply enumerating all database IDs tobe processed, e.g. obtained by an independent searchfor metabolites of a pathway. To query other (local)libraries, a custom wrapper can be added which containsthe search logic.The results usually contain dozens to thousands of
hits with a similar (or identical in case of isomeric com-pounds) mass. The databases are accessed via their web-service interface and the resulting candidate compoundsare downloaded automatically. Hydrogens are addedexplicitly to the structure where necessary.
In silico fragmentation of candidatesMetFrag generates all possible topological fragments of acandidate compound in order to match the fragmentmass with the measured peaks. The problem of enumer-ating all possible molecular fragments can be solved bycreating a fragmentation tree. The root consists of theintact molecule, and each node represents a fragment,obtained by splitting the molecule at a given bond. Weimplemented this as an iterative, breadth-first algorithm.One major speed determining factor is the number offragments generated, because of the combinatorial nat-ure of the algorithm. Thus, the maximum tree depthwas introduced to improve the performance and specifi-city. We perform additional application-specific steps toprune the search space and take care of molecular rear-rangements, see below. For each candidate structure thefragments are generated in the following way (Figure 2):Initially the candidate structure is pushed into an
“unprocessed” queue. The candidate structure is prepro-cessed using a (small) set of rules, which describe mole-cular rearrangements during the CID fragmentation thatcan not be accounted for by the simple bond disconnec-tion approach. Each application of these rules results inone or more derived fragments which are added to the
Figure 2 Algorithm for in silico fragmentation. Each compound is fragmented using the bond dissociation approach. Bonds in ring systemsneed special treatment. Every possible structure is generated until a given tree depth is reached. The redundancy heuristics and mass checksreduce the search space.
Wolf et al. BMC Bioinformatics 2010, 11:148http://www.biomedcentral.com/1471-2105/11/148
Page 3 of 12

“unprocessed” queue. The actual rules will be describedlater in this paper.Then a structure is dequeued and its molecular graph
is traversed to collect all bonds to be split. A linearbond (which is not part of a ring system) only needs tobe cleaved and results in two new fragments. Within aring system two bonds have to be split simultaneously,to create the new fragments. Only the fragments largerthan the peak with the smallest mass are created, sincesmaller fragments can not explain an experimental peak.Before proceeding to the next fragment, a redundancy
check is performed to eliminate duplicate fragments.Redundancy occurs if a fragment A is part of both par-ent fragments AB and ABC, or the fragment A appearsin different places of the molecule, as in ABA. In bothcases the redundant structures would cause longer run-times and higher memory consumption without gainingany information. In addition to full (and time consum-ing) graph isomorphism checks we describe simplerheuristics later in this paper.Finally, the in silico fragments are matched against the
query peaklist. The measured peaks correspond to thecharged fragments, so the matching function adds (posi-tive mode) or removes (negative mode) a proton (1.007Da) to the fragment mass. In a few cases, fragment ionscan have an intrinsic charge, where one of the heteroa-toms is charged. In this case the fragment mass is usedas-is, but a penalty is added to the bond dissociationenergy of this fragment (see below).The accuracy of a mass measured by an MS instru-
ment is typically expressed relatively in ppm. In practicewe found that especially for low masses, an additional(absolute) deviation has to be considered. Hence Met-Frag uses two values mzppm and mzabs respectively, tocalculate the mass error used for fragment matching.Peaks that have such an explanation are subsequently
removed from the query peaklist and the fragment-peakpair is saved for the final scoring. If the peak with thesmallest mass has been explained, this will raise theminimal-mass cut-off, resulting in even fewer fragmentsthat need to be considered. The “unprocessed” queue isthen populated with the created and filtered fragmentsand processed as described above. The fragmentationterminates if the queue is empty or the maximum treedepth has been reached. The candidate is then scoredbased on all matched fragment-peak pairs as explainedin the following section.
Scoring candidates based on fragments explaining themeasured peaksThe score is an extension of a simple peak count: Si of acandidate compound i is calculated based on all frag-ments Fi that explain peaks in the measured spectrum
and the bond dissociation energy (BDE) calculated dur-ing the in silico fragmentation:
Sw
we
ei i i 1 12max( ) max( )
(1)
where
w
eF
i f
f F
f
ii
b
b Bf F
i
fi
(int ) ( )
| |
.0 6 3
1
mass
BDE
In general a peak with a high mass and intensity ismore characteristic than peaks with lower mass andintensity. This is reflected by the weighted peak countwi, as already proposed by [3,15]. The exponentsm = 0.6 and n = 3 we use are taken from the literature[15]. The weights wi are scaled by max(w) such that it isbetween 0 and 1. We also take the bond dissociationenergy (BDE) into account, the higher the BDE, the lesslikely we consider a fragment. We use the standardenthalpy change upon bond fragmentation from litera-ture, see e.g. [16]. For each candidate f we sum up BDEbfor all bonds Bf cleaved along the fragmentation tree forthe explained fragments Fi. Afterwards, for each candi-date the arithmetic mean ei of these BDEs is scaled by 2max(e) such that it is between 0 and 0.5.
Neutral loss rules account for rearrangementsThe ionised molecules typically have a single charge.After the fragmentation, the charge remains with eitherof the resulting fragments, the other is neutral. Becauseonly charged ions can be measured, the mass differencebetween the two charged ions before and after the frag-mentation is referred to as the “neutral loss” [17].One example of a common neutral loss is H2O, which
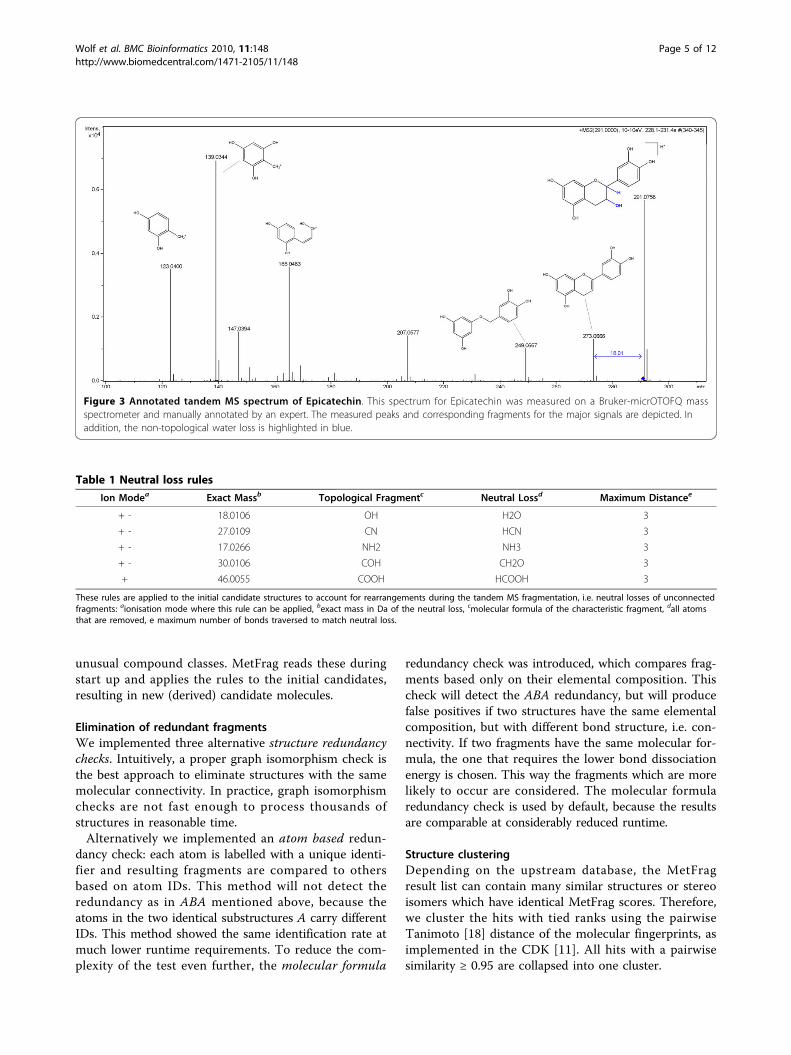
is not a true substructure of any molecule. Instead, H2Ois formed after a hydroxyl group (OH) and a single Hare split off at different (though usually nearby) positions(see Figure 3, where the distance is three). Because indi-vidual H atoms are not considered during the in silicofragmentation, the resulting fragment would never befound without special treatment. MetFrag is checkingfor structural patterns that can lead to such a non-topo-logical fragmentation. We check within a specified topo-logical distance of the OH-group for another hydrogenand remove both OH and H.This non-topological fragmentation is handled by the
rules shown in Table 1, other neutral losses are coveredby the bond-disconnection approach. Rules can beadded easily, e.g. if the compounds measured belong to
Wolf et al. BMC Bioinformatics 2010, 11:148http://www.biomedcentral.com/1471-2105/11/148
Page 4 of 12
unusual compound classes. MetFrag reads these duringstart up and applies the rules to the initial candidates,resulting in new (derived) candidate molecules.
Elimination of redundant fragmentsWe implemented three alternative structure redundancychecks. Intuitively, a proper graph isomorphism check isthe best approach to eliminate structures with the samemolecular connectivity. In practice, graph isomorphismchecks are not fast enough to process thousands ofstructures in reasonable time.Alternatively we implemented an atom based redun-
dancy check: each atom is labelled with a unique identi-fier and resulting fragments are compared to othersbased on atom IDs. This method will not detect theredundancy as in ABA mentioned above, because theatoms in the two identical substructures A carry differentIDs. This method showed the same identification rate atmuch lower runtime requirements. To reduce the com-plexity of the test even further, the molecular formula
redundancy check was introduced, which compares frag-ments based only on their elemental composition. Thischeck will detect the ABA redundancy, but will producefalse positives if two structures have the same elementalcomposition, but with different bond structure, i.e. con-nectivity. If two fragments have the same molecular for-mula, the one that requires the lower bond dissociationenergy is chosen. This way the fragments which are morelikely to occur are considered. The molecular formularedundancy check is used by default, because the resultsare comparable at considerably reduced runtime.
Structure clusteringDepending on the upstream database, the MetFragresult list can contain many similar structures or stereoisomers which have identical MetFrag scores. Therefore,we cluster the hits with tied ranks using the pairwiseTanimoto [18] distance of the molecular fingerprints, asimplemented in the CDK [11]. All hits with a pairwisesimilarity ≥ 0.95 are collapsed into one cluster.
Figure 3 Annotated tandem MS spectrum of Epicatechin. This spectrum for Epicatechin was measured on a Bruker-micrOTOFQ massspectrometer and manually annotated by an expert. The measured peaks and corresponding fragments for the major signals are depicted. Inaddition, the non-topological water loss is highlighted in blue.
Table 1 Neutral loss rules
Ion Modea Exact Massb Topological Fragmentc Neutral Lossd Maximum Distancee
+ - 18.0106 OH H2O 3
+ - 27.0109 CN HCN 3
+ - 17.0266 NH2 NH3 3
+ - 30.0106 COH CH2O 3
+ 46.0055 COOH HCOOH 3
These rules are applied to the initial candidate structures to account for rearrangements during the tandem MS fragmentation, i.e. neutral losses of unconnectedfragments: aionisation mode where this rule can be applied, bexact mass in Da of the neutral loss, cmolecular formula of the characteristic fragment, dall atomsthat are removed, e maximum number of bonds traversed to match neutral loss.
Wolf et al. BMC Bioinformatics 2010, 11:148http://www.biomedcentral.com/1471-2105/11/148
Page 5 of 12

User interface and available APIsOur MetFrag application features an user friendlyweb interface, http://msbi.ipb-halle.de/MetFrag/. Therequired input includes the tandem MS peaklist withintensities (Figure 4, top left), selection of the upstreamcompound database and respective search parameters(top right). Alternatively, a list of database IDs can beprovided explicitly. This allows e.g. to select the candi-dates based on their occurrence in specific pathways.Figure 4 also shows the results browser. A feedbackform allows to store all input data, user rating of thehypotheses, and further comments. This helps to collectuser-provided test- and training data. Spectra will not besaved unless explicitly granted. The web interface isbased on Java Server Faces (JSF) [19], using the ApacheMyFaces [20] implementation, ICEfaces [21] (a compo-nent library with AJAX capabilities) in an Apache Tom-cat [22] servlet container. Thus, MetFrag is platformindependent and accessible using most javascriptenabled browsers.We also provide a BioMoby [23] web service, which
can be called from other software, including the Tavernaworkflow engine. Finally, the actual MetFrag algorithmsare available as Java library, which can be used to per-form batch searches and evaluation.
Results and DiscussionIn this section we give an example of MetFrag resultsfor an exemplary compound, and describe the full testdata sets and evaluation criteria. We evaluate MetFragon two data sets, measured on different instruments,using either KEGG or PubChem as compound library.For the evaluation we use the merged spectra from
different collision energies of compounds where thedatabase id is known. If MetFrag returns multiplehypotheses with tied ranks, we report the most pessi-mistic position: even if the correct solution has the high-est observed score, if 9 other candidates also have thesame score, then we assign rank 10.In addition to the worst case rank we report the clus-
ter rank. Clusters of compounds having a structuralTanimoto similarity ≥ 0.95 are collapsed and treated asone compound cluster. Again, this measure is quite con-servative, because ranks are collapsed only within resultshaving identical scores, and still the worst case clusterrank is reported. The standard deviation of both the rawand cluster ranks for a larger benchmark data set can bequite high, therefore we report not only the averagerank, but also the median and 75% quantile.
Example: Spectrum of NaringeninAs an example we show the analysis of a tandem MSspectrum of Naringenin (C15H12O5, KEGG C00509)with MetFrag. Using KEGG as compound library with a
realistic 10 ppm window around the exact mass of272.068 Da will return 15 hits. Each candidate structureis retrieved and fragmented as described in the previoussection.After scoring each structure, the first three results can
be seen in Figure 4. The details window shows the frag-ments that can be explained by the spectrum. The samequery in PubChem yields 736 candidates, and Figure 5shows the 9 top ranked solutions, including the correctcompound at worst case rank 8. The similarity wouldcollapse the isomers into two clusters, resulting in acluster rank 5.
Benchmark data setsTwo data sets were used for evaluation, together con-sisting of 710 spectra of 151 known compounds. Cur-rent instruments allow the acquisition of so called rampspectra, which combine a range of collision energies inone measurement. In both data sets the compoundswere measured at different collision energies. Dependingon the compound, informative fragmentation mightoccur only at higher energies. For other compounds,even low collision energies can lead to a very highdegree of fragmentation. For this reason we use compo-site spectra: two peaks p1 and p2 from different collisionenergies are merged mz = avg(mz1, mz2) if |mz1 - mz2|≤ 0.01 Th, retaining the higher intensity max(int1, int2).Data set I with compound library KEGGThe first data set consists of 200 spectra from 49 com-pounds obtained on the API QSTAR Pulsar I in positivemode at several different collision energies, e.g. 10, 20,30 and 40 eV. The spectra were measured at the IPBand are publicly available in the MassBank databasehttp://msbi.ipb-halle.de/MassBank/, see additional file 1for a list of accession numbers.MetFrag was used to identify the compounds using
the 49 composite spectra within KEGG. Fragments aregenerated until a tree depth of two is reached. Theinstrument specific deviation was set to mzabs = 0.01and mzppm = 50.The initial list of candidates obtained from KEGG
contained on average 10.3 compounds. The correctcompound has a median of 3 in the MetFrag result list.25 of the correct compounds were ranked in the top 3hits and 11 of these are ranked first. MetFrag is a greatimprovement over a mass-only library search. With 16021 entries KEGG is a comparably small library. How-ever, the compounds are highly relevant to metabolo-mics research.Data set II searched against PubChemFor the second data set we used the PubChem database,with a much larger collection of natural and syntheticcompounds. A collection of 102 compounds with anaverage mass of 372.5 Da has been measured on a
Wolf et al. BMC Bioinformatics 2010, 11:148http://www.biomedcentral.com/1471-2105/11/148
Page 6 of 12

Figure 4 MetFrag web interface. The web interface with the search parameters at the top and the result list below. The extra window can beopened for each result and shows details such as the spectrum and matching fragment structures.
Wolf et al. BMC Bioinformatics 2010, 11:148http://www.biomedcentral.com/1471-2105/11/148
Page 7 of 12

Micromass Q-TOF II in positive mode and published byHill et al. in [8]. Each compound was measured at fivedifferent collision energies: 10, 20, 30, 40 and 50 eV, foran overall of 510 spectra. All spectra are available fromMassBank as well, see additional file 2 for a list of acces-sion numbers. For the spectra from this instrument weused 10 ppm (mzabs = 0) as mass deviation and a maxi-mum tree depth of two. Based on a PubChem snapshot(June 2009) we retrieved on average 2508 candidatecompounds.After the MetFrag scoring, the correct candidate
occurred at median rank 31.5, with the structure clus-tering the median decreased to 14.5. The completeresults are shown in additional file 2.
We were also interested in the effect of a larger treedepth: raising the tree depth to three increases the aver-age runtime 5-fold, and worse, the prediction accuracydecreases. The median of the correct compounddegraded to 39 (cluster rank 18). This behaviour can beexplained with the positive predictive value (PPV):
PPV
TPTP FP
where
TP
FP
peaks explained by correct compound
peaks explained byy other candidates.
Figure 5 Top candidates for Naringenin against PubChem. The 9 top ranked compounds where the correct solution (CID 932) is reported at(tied) rank 8. Two clusters of structures (green and blue) are identical apart from their stereochemistry, the remaining three structures (yellow)that explain all six tandem MS peaks have a Tanimoto similarity < 0.95. After clustering with a similarity ≥ 0.95 the stereoisomers are collapsedinto one cluster, resulting in a cluster rank 5 for the correct solution.
Wolf et al. BMC Bioinformatics 2010, 11:148http://www.biomedcentral.com/1471-2105/11/148
Page 8 of 12

The more (smaller) fragments are generated, the morepeaks can be matched, which leads to more false posi-tive hits. This dependency is the reason to include theexponent mass f
3 in the scoring function. The highernumber of false positives results in a PPV of only 0.017(tree depth three) versus 0.028 using tree depth of two.Similarly, we applied the neutral loss rules (Table 1) to
every generated fragment, not just the initial candidates.Again, we obtained more matching fragments, and thePPV decreased from 0.028 to 0.017, with an even highermedian of the correct compound cluster of 67.Another aspect of the evaluation was to use individual
spectra instead of the composite spectra. MetFragshowed a poor performance resulting in a median of 43using 10 ppm. An interesting observation is that themedian improved to 39.5 if the allowed mass deviationis increased from 10 ppm to 20 ppm. Because the mer-ging (and averaging) of peaks in the composite spectrausually results in a more accurate mass, some peaks inindividual spectra with a deviation beyond 10 ppm areonly matched after relaxing the allowed error window to20 ppm.Finally, we interpreted some of the cases where Met-
Frag did not return good results. Table 2 shows manytop 10 hits, but also several cases where MetFrag is notable to rank the correct compound even among the top100. Some of the problematic compounds are Ormeto-prim, Strychnine N-oxide and Tetramisole. One reasonis the high number of very similar candidate structures,and the difficulty to distinguish them based on the pre-dicted spectra. Another example where many similarstructures occur is Tetracycline, but here the ratherhigh rank decreased from 92 to cluster rank 10. Eventhese large result lists with many similar entries will stillgive a very good estimation of the possible compoundclass, which simplifies the subsequent (manual) interpre-tation and identification.We also evaluated data set I (measured on the API
QSTAR Pulsar I) against PubChem 2009. Because thisolder mass spectrometer has a much lower mass accu-racy than the Micromass Q-TOF II, both the candidatesearch and the scoring found more false positivematches. Within the 3896 (average) candidates, themedian of the correct solution is only 91. This leads tothe conclusion that a good mass accuracy of ≤10 ppm isrequired. Almost all current QTOF instruments are spe-cified at 5 ppm or less, and even higher accuracies areavailable from Orbitrap or FTICR-MS instruments.Comparison between MetFrag and MassFrontierIn their paper [8] Hill et al. evaluate the prediction per-formance of MassFrontier 4.0 with an approach similarto MetFrag, using PubChem (in the version from Febru-ary 2006, with 6·106 entries) as compound database. Weadded a constraint to our candidate search to include
only compounds added in or before February 2006. Oursimulated PubChem snapshot returns on average 338candidates, the previous study only 272 structures.Nevertheless, we use following results to compare Met-Frag and MassFrontier. Both MetFrag and the searchprocedure by Hill consider only compounds containingthe elements CHNOPS and ignore molecules whichconsist of C, H only. The previous study reports twoseparate evaluation strategies: the first combines theautomatic ranking with the manual a-posteriori selectionof the best spectrum, obtaining the correct result on amedian rank 2.5. In practice, this knowledge will not bereadily available. The more realistic results are presentedin the supplementary material of [8], where a heuristicwas used to select one spectrum per compound. Theheuristic rule chooses the spectrum with the lowest col-lision energy which has at most 22% of the precursorion intensity. In this case the median drops to 4 (3rd
quantile at 17.5).The median for MetFrag is 8 (3rd quantile at 19), and
decreases to 4 (3rd quantile at 11.75) if the 95% similar-ity criterion is used. If the results are compared in moredetail, this improvement is significant (p = 0.01), testedwith a one-tailed, paired Wilcoxon signed rank test. Theresults for both systems are available as additional file 3.It would be interesting to evaluate the MassFrontier
approach with composite or ramp spectra, where neitherautomatic nor manual spectra selection would berequired.
Empirical runtime evaluationThe naïve and recursive bond-disconnection approachhas very high theoretical complexity. We evaluated thereal-world runtime by sampling 5900 compounds (unre-lated to the test sets) from PubChem with a massbetween 100 and 1000 Da. In metabolomics research,only few compounds exceed a mass of 1000. Each com-pound was fragmented (minimum fragment mass 30Da) to a given tree depth of two and three. Figure 6shows the runtime of MetFrag on a PC with IntelQ9400 CPU at 2.66 Ghz and 8 Gb RAM with Ubuntu8.04, and JVM Sun Java 1.6.0_16-b01. Each point showsthe time needed to compute all fragments above 30 Da.The yellow and red lines show the non-linear runtimefor tree depth two (on average 0.2 s) or three (on aver-age 3.4s), respectively. In practice a tree depth of twohas the best prediction accuracy (see above) and is fastenough to analyse compounds on demand, even withmasses up to 1000 Da.
ConclusionsWe have presented an algorithm which is able to identifysmall molecules from tandem MS measurements amonga large set of candidate structures. The scoring function
Wolf et al. BMC Bioinformatics 2010, 11:148http://www.biomedcentral.com/1471-2105/11/148
Page 9 of 12
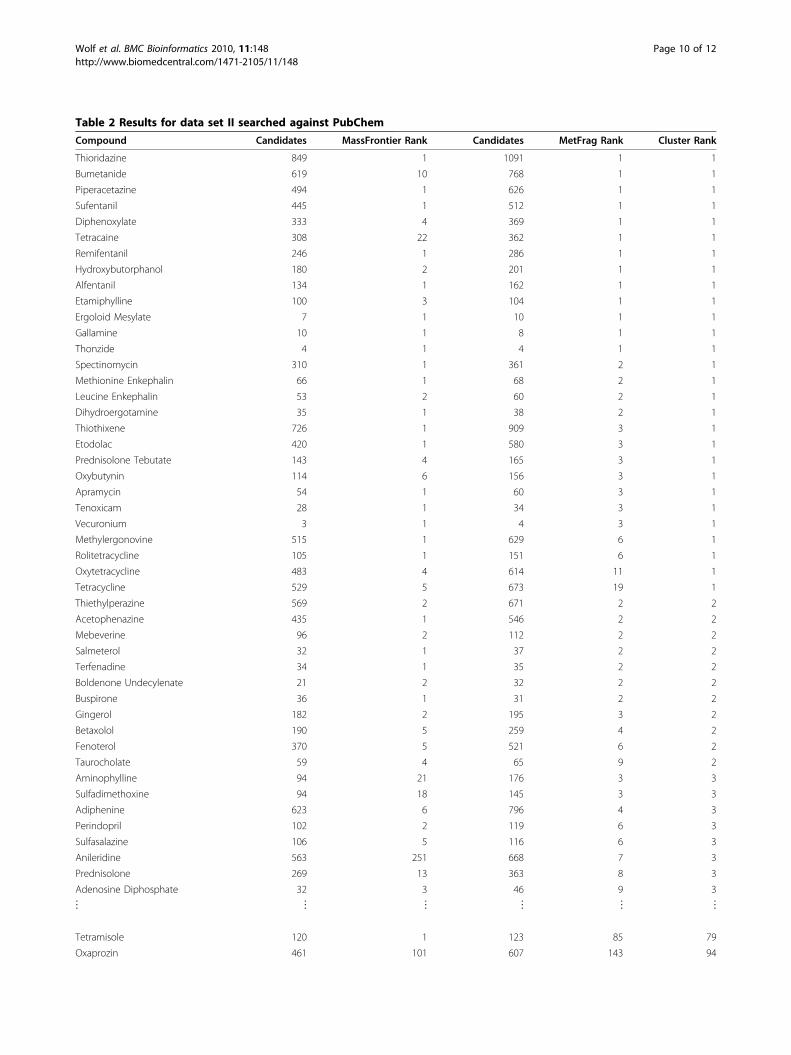
Table 2 Results for data set II searched against PubChem
Compound Candidates MassFrontier Rank Candidates MetFrag Rank Cluster Rank
Thioridazine 849 1 1091 1 1
Bumetanide 619 10 768 1 1
Piperacetazine 494 1 626 1 1
Sufentanil 445 1 512 1 1
Diphenoxylate 333 4 369 1 1
Tetracaine 308 22 362 1 1
Remifentanil 246 1 286 1 1
Hydroxybutorphanol 180 2 201 1 1
Alfentanil 134 1 162 1 1
Etamiphylline 100 3 104 1 1
Ergoloid Mesylate 7 1 10 1 1
Gallamine 10 1 8 1 1
Thonzide 4 1 4 1 1
Spectinomycin 310 1 361 2 1
Methionine Enkephalin 66 1 68 2 1
Leucine Enkephalin 53 2 60 2 1
Dihydroergotamine 35 1 38 2 1
Thiothixene 726 1 909 3 1
Etodolac 420 1 580 3 1
Prednisolone Tebutate 143 4 165 3 1
Oxybutynin 114 6 156 3 1
Apramycin 54 1 60 3 1
Tenoxicam 28 1 34 3 1
Vecuronium 3 1 4 3 1
Methylergonovine 515 1 629 6 1
Rolitetracycline 105 1 151 6 1
Oxytetracycline 483 4 614 11 1
Tetracycline 529 5 673 19 1
Thiethylperazine 569 2 671 2 2
Acetophenazine 435 1 546 2 2
Mebeverine 96 2 112 2 2
Salmeterol 32 1 37 2 2
Terfenadine 34 1 35 2 2
Boldenone Undecylenate 21 2 32 2 2
Buspirone 36 1 31 2 2
Gingerol 182 2 195 3 2
Betaxolol 190 5 259 4 2
Fenoterol 370 5 521 6 2
Taurocholate 59 4 65 9 2
Aminophylline 94 21 176 3 3
Sulfadimethoxine 94 18 145 3 3
Adiphenine 623 6 796 4 3
Perindopril 102 2 119 6 3
Sulfasalazine 106 5 116 6 3
Anileridine 563 251 668 7 3
Prednisolone 269 13 363 8 3
Adenosine Diphosphate 32 3 46 9 3
⋮ ⋮ ⋮ ⋮ ⋮ ⋮
Tetramisole 120 1 123 85 79
Oxaprozin 461 101 607 143 94
Wolf et al. BMC Bioinformatics 2010, 11:148http://www.biomedcentral.com/1471-2105/11/148
Page 10 of 12

does not require a set of fragmentation reactions or anactual simulation of the fragmentation process. MetFragis able to query KEGG, PubChem and ChemSpider, andlocal databases can be integrated with little effort.In comparison to the system described in [8] (which
included human expertise), MetFrag achieves betterresults than MassFrontier.For dedicated metabolite databases such as KEGG, the
correct identification is generally among the first fewcandidates. Given the sheer size of generic compoundlibraries such as PubChem, it is no surprise that theresult lists contain many structurally highly similar
compounds. Hence, an unambiguous identification isgenerally not possible, but usually the compound classcan be derived from the results. A principal limitation isthe inability to distinguish stereoisomers which is notpossible from MS data alone. The final identificationaccording to MSI recommendations [24] requires thecomparison against spectra of authentic standards, oreven complementary analysis methods such as NMR.Our tool MetFrag improves the identification of
unknown substances from tandem MS spectra. It isfast enough to be used in the interactive web applica-tion, and has a user-friendly interface and resultbrowser.
Availability and Requirements• Project home page: http://metware.org/• Operating system(s): Platform independent• Programming language: Java• Other requirements: Java ≥ 1.6, Tomcat ≥ 6.0• License: GNU LGPL v3 (or later)
Additional file 1: MassBank_KEGG_results. Full list of mass spectra andcompounds used in section “Data set I searched against KEGG”. Thisincludes accession numbers in the MassBank system. For eachcompound the number of candidates and the rank of the correctsolution is given.
Additional file 2: HillData_PubChem2009. Full list of mass spectra andcompounds used in section “Data set II searched against PubChem”. Thisincludes accession numbers in the MassBank system. For eachcompound the number of candidates and the rank of the correctsolution is given.
Additional file3: Comparison_MassFrontier_MetFrag_PubChem2006. This fileincludes the full results from table 2 in section “Data set II searchedagainst PubChem”. The candidate search was restricted to the PubChemas of February 2006. For convenience, we also include the resultsreported in [8].
AcknowledgementsWe thank the CDK team (especially Egon Willighagen and Rajarshi Guha) forthis cheminformatics library, and Michael Gerlich, Carsten Kuhl and Ralf
Table 2: Results for data set II searched against PubChem (Continued)
Antipyrine 306 97 341 122 104
Mefenamic Acid 579 328 633 146 124
Strychnine 664 575 882 259 171
Dimefline 644 644 876 294 175
Ormetoprim 270 124 317 233 191
Strychnine N-oxide 1185 1098 1672 1012 618
Average: 272.2 (± 24.2) 44.2 (± 14.1) 338.4 (± 31.5) 34.2 (± 10.9) 21.6 (± 6.8)
Median: 183.5 4 231.5 8 4
75% Quantile: 431.3 17.5 518.8 19 11.8
Std. Deviation: 244.1 142.4 318.1 109.8 69.1
The results on the left were reported in [8]. The corresponding MetFrag results are on the right where the candidate search was restricted to the PubChem as ofFebruary 2006 (we retrieved slightly more candidates than reported by Hill et. al.). Only the best 47 and eight worst Metfrag results are shown, the full table isgiven as additional file 3.
200 400 600 800 1000
m/z
time
in s
010
2030
4050
60
treedepth=2treedepth=3
Performance of the Fragmentation
Figure 6 Empirical runtime. Runtime for the in silicofragmentation step on 5900 compounds randomly drawn fromPubChem, with uniform mass distribution between 100 and 1000Da. Limiting the tree depth of the in silico fragmentation to two(orange) results in an average runtime of 0.2 s for one compound.The exponential runtime can be seen especially when a larger treedepth (red) is used, raising the runtime to 3.4s.
Wolf et al. BMC Bioinformatics 2010, 11:148http://www.biomedcentral.com/1471-2105/11/148
Page 11 of 12

Tautenhahn for helpful discussions. SS is funded by the BMBF (GABI-ProTect0315051C).
Author details1Leibniz Institute of Plant Biochemistry- Department of Stress- andDevelopmental Biology, Weinberg 3, 06120 Halle(Saale), Germany.2Institut für Informatik, Martin-Luther-Universität, Halle-Wittenberg,Von-Seckendorffplatz 1, 06120 Halle (Saale), Germany.
Authors’ contributionsSW implemented the MetFrag application, web interface and performed theevaluation. SS provided the MS expertise, MM-H and SN provided input forthe requirements, the algorithmic design and architecture. All authorscontributed to, read and approved the final manuscript.
Received: 24 November 2009 Accepted: 22 March 2010Published: 22 March 2010
References1. Dunn WB: Current trends and future requirements for the mass
spectrometric investigation of microbial, mammalian and plantmetabolomes. Physical Biology 2008, 5:011001, (24pp).
2. Kopka J, Schauer N, Krueger S, Birkemeyer C, Usadel B, Bergmuller E,Dormann P, Weckwerth W, Gibon Y, Stitt M, Willmitzer L, Fernie AR,Steinhauser D: [email protected]: the Golm Metabolome Database.Bioinformatics 2005, 21(8):1635-1638.
3. Horai H, Arita M, Nishioka T: Comparison of ESI-MS Spectra in MassBankDatabase. BioMedical Engineering and Informatics, 2008. BMEI 2008.International Conference on 2008, 2:853-857.
4. Smith CA, Maille GO, Want EJ, Qin C, Trauger SA, Brandon TR, Custodio DE,Abagyan R, Siuzdak G: METLIN: A Metabolite Mass Spectral Database.Proceedings of the 9th International Congress of Therapeutic Drug Monitoringand Clinical Toxicology Louisville, Kentucky 2005, 27:747-751.
5. ACD/MS Fragmenter. [http://www.acdlabs.com/products/adh/ms/ms_frag/].6. Mass Frontier. [http://www.highchem.com/].7. Heinonen M, Rantanen A, Mielikäinen T, Kokkonen J, Kiuru J, Ketola RA,
Rousu J: FiD: a software for ab initio structural identification of productions from tandem mass spectrometric data. Rapid Communications inMass Spectrometry 2008, 22(19):3043-3052.
8. Hill DW, Kertesz TM, Fontaine D, Friedman R, Grant DF: Mass SpectralMetabonomics beyond Elemental Formula: Chemical Database Queryingby Matching Experimental with Computational Fragmentation Spectra.Analytical Chemistry 2008, 80(14):5574-5582.
9. Heinonen M, Rantanen A, Mielikäinen T, Pitkanen E, Kokkonen J, Rousu J:Ab initio prediction of molecular fragments from tandem massspectrometry data. German Conference on Bioinformatics 2006, 40-53.
10. Hill AW, Mortishire-Smith RJ: Automated assignment of high-resolutioncollisionally activated dissociation mass spectra using a systematic bonddisconnection approach. Rapid Communications in Mass Spectrometry 2005,19(21):3111-3118.
11. Steinbeck C, Han Y, Kuhn S, Horlacher O, Luttmann E, Willighagen E: TheChemistry Development Kit (CDK): An Open-Source Java Library forChemo- and Bioinformatics. Journal of Chemical Information and ComputerSciences 2003, 43(2):493-500.
12. KEGG Compound. [http://www.genome.jp/kegg/compound/].13. PubChem. [http://pubchem.ncbi.nlm.nih.gov/].14. Chemspider. [http://www.chemspider.com/].15. Stein SE, Scott DR: Optimization and testing of mass spectral library
search algorithms for compound identification. Journal of the AmericanSociety for Mass Spectrometry 1994, 5(9):859-866.
16. Luo Y: Handbook of bond dissociation energies in organic compounds BocaRaton, CRC Press 2003.
17. Gross JH: Mass Spectrometry: A Textbook Springer, Berlin, 1 2004, corr. 2ndprinting edition 2004.
18. Butina D: Unsupervised Data Base Clustering Based on Daylight’sFingerprint and Tanimoto Similarity: A Fast and Automated Way ToCluster Small and Large Data Sets. Journal of Chemical Information andComputer Sciences 1999, 39(4):747-750.
19. Java Server Faces. [http://java.sun.com/javaee/javaserverfaces/].20. Apache My Faces. [http://myfaces.apache.org/core12/index.html].21. ICEfaces. [http://www.icefaces.org/].
22. Apache Tomcat 6. [http://tomcat.apache.org/].23. Biomoby. [http://www.biomoby.org/].24. Sumner LW, Amberg A, Barrett D, Beale M, Beger R, Daykin C, Fan T,
Fiehn O, Goodacre R, Griffin JL, Hankemeier T, Hardy N, Harnly J, Higashi R,Kopka J, Lane A, Lindon JC, Marriott P, Nicholls A, Reily M, Thaden J,Viant MR: Proposed minimum reporting standards for chemical analysis.Metabolomics 2007, 3(3):211-221.
doi:10.1186/1471-2105-11-148Cite this article as: Wolf et al.: In silico fragmentation for computerassisted identification of metabolite mass spectra. BMC Bioinformatics2010 11:148.
Submit your next manuscript to BioMed Centraland take full advantage of:
• Convenient online submission
• Thorough peer review
• No space constraints or color figure charges
• Immediate publication on acceptance
• Inclusion in PubMed, CAS, Scopus and Google Scholar
• Research which is freely available for redistribution
Submit your manuscript at www.biomedcentral.com/submit
Wolf et al. BMC Bioinformatics 2010, 11:148http://www.biomedcentral.com/1471-2105/11/148
Page 12 of 12