methodology for road roughness profiling and rut depth
TRANSCRIPT

Methodology for Road Roughness Profiling and Rut
Depth Measurement
T. D. Gillespie M. W. Sayers M. R. Hagan
July 1987
UMTRI The University of Michigan Transportation Research Institute


Technical Report Documentation Page 1. RIport No.
FHWA/RD-87-042 2 Gowmmmt Accewion No. 3. Recipient's CaWog No.
4. nu. and Subtitla
METHODOLOGY FOR ROAD ROUGHNESS PROFILING AND RUT DEPTH MEASUREMENT
7. Author(#)
T. D. Gillespie, M. W. Sayers, and M. R. Hagan 9. Pwforming OrgrnlzaUon N u n and Addrua
The University of Michigan Transportation Research Institute 2901 Baxter Road, AM Arbor, Michigan 48 109 1 2 Spo~oring Agency N8mr and Addroar
Federal Highway Administration U. S. Delartment of Transportation Washington, D. C. 20590 15. Supplmwntuy N o w
5. Repor( Dab
July 1987 b Plrforming Orgmiution Cod.
8. Performing Orgmiution Report No.
UMTRI-86-54 10. Work Unit No. (TRAIS)
3 1 W3-062 11. Contract w Grant No.
DTFH6 1-83-C-00123 13. Typr d Rapofl and Plriod Covuod
Final 9/83 - 1/87
14. Sponsoring Agency Coda
Contract Technical Representative: Dr. R. R. Hegrnon
1s. Aktnc l
This document presents an overview of a profiling and rut depth project. The objectives were to (1) assess the capabilities that are needed in to measure profile and rut depth at highway apeeds, (2) develop a design tailored to minimize life costs of the system, (3) build the system for delivery to FHWA, and (4) validate the system. A system based on the IBM PC microcomputer was designed. With the exception of a signal conditioning unit, the system is constructed from commercial components. The software controls the measurement of road profile and rut depth, the viewing of the data, and daily checks of the hardware integrity. A prototype-presently known as the PRORUT system-was built and delivered to the FHWA.
A Road Profdometer Meeting (RPM) was organized to determine performance limits of the profiling capabilities of the PRORUT and 10 other profdometers. (The capability for measuring rut depth was added after the meeting; thus, the rut depth performance has not yet been tested to the same extent as the profiling capabilities.)
There are three companion reports prepared as part of the same project. One is the PRORUT user's manual (FHWA/RD-87/043), another is a reference manual (FHWA/RD-871044) containing details of the hardware and software design, and the third presents results from the profdometer meeting (FHWA/RD-861100).
17. K q Words
longitudinal profile, profdometer, road roughness, quarter-car, digital data acquisition systems, IBM PC, rut depth, road profile
18. Distribution Stabmnt
No restrictions. This document is available to the public through the National Technical Information Service, Springfield, VA 22161
1% Security Chuif. (of thia nporo
Unclassified 21. No. of Pagaa
50 20. Socurly Ciurif. (of thk page)
Unclassified 2 2 Priw


TABLE OF CONTENTS
Section Page
INTRODUCTION .................................................................................. 1 Background ..................................................................................... 1
. . Objectives. ...................................................................................... 2
DESIGN CONSIDERATIONS .................................................................. 3 Functional Concept.. .......................................................................... 3 Sensors .......................................................................................... 5 Computer System .............................................................................. 7 Recording System .............................................................................. 9 . . Signal Con&tionmg ............................................................................ 9 Vehicle .......................................................................................... 10 Software ........................................................................................ 10
PROFILOMETER DESCRIErTlON ............................................................. 12 Hardware ....................................................................................... 12 Software ........................................................................................ 24
PERFORMANCE EVALUATION .............................................................. 35 The Road Profilometer Meeting .............................................................. 35 Performance Summary ........................................................................ 37
............................................. CONCLUSIONS AND RECOMMENDATIONS 43
REFERENCES .................................................................................... 46


LIST OF FIGURES
Figure page
1 . Functional diagram of inertial prof~lometer ............................................... 4
..................................................... . 2 Mounting of noncontact road sensors 6
......................................................................... . 3 FHWA profilometer 13
.................................................... 4 . Diagram of data acquisition system.. 14
.................... 5 . Infrared noncontacting sensor from Southwest Research Institute 16
.............................................................. 6 . Selcom Optocator road sensor 17
7 . Signal conditioner for Selcom Optocator installed in the rear of the van .............. 18
8 . UMTRI signal conditioner unit installed in the instrumentation console (top). and showing internal components (bottom) ................................................. 19
......................................................... 9 . UMTRI signal conditioning card.. 20
10 . Front view of instrumentation console located behind the driver's seat.. ............. 22
11 . View of the monitor and keyboard installed next to passenger's seat.. ............... 23
12 . Three of the menus used in the proflometer program ................................... 25
.................................................................. 13 . Set up for daily calibration 28
................................ 14 . Example plots of left and right profile filtered at 500 f t. 29
.................................. 15 . Example plots of left and right profile filtered at 20 ft 31
..................... 16 . Example printout of roughness and rut depth along a test section 32
17 . Example plot of IRI roughness along a test section ...................................... 33
......... 18 . PSD functions from the FHWA/Selcom system on a moderately rough site 38
19 . Invalid profile measure. with the IR system on a rough. patched surface ............ 41
20 . Invalid profle measured with Selcom system on an unusually textured surface ..... 42


INTRODUCTION
Background
This document reports on the Federal Highway Administration (FHWA) project entitled, "Methodology for Road Roughness Profiling and Rut Depth Measurement," (Contract No. DTFH61-83-C-00 123), as conducted by The University of Michigan Transportation Research Institute (UMTRT). The immediate objectives were to develop and validate a profdometer for FHWA use in demonstrating the applications of profilometry in pavement evaluation.
A road profilometer is a vehicle-mounted instrumentation system intended to measure vertical deviations of the road surface along the direction of travel. They have been in existence since the 1960's[l] with a variety of profdometer hardware and designs available to the highway community. The most universal purpose for road profile measurement is to assess the roughness of the surface. Roughness, in this context, may be defined as the surface deviations causing vibrations in road-using vehicles, affecting the comfort of the vehicle passengers, cost of operation, and safety;12] and which induce dynamic loads on the pavement contributing to their deterioration.[3]
Approximately 15 road profdometers are in existence throughout the world. Although several have been designed and constructed by the user, the majority have been commercially produced by K. J. Law, Engineers, Inc. of Fannington, Michigan based on the original design concept from General Motors Research. Among the commercial units, the design has evolved through several models over the years. Currently, prices for commercial profilometers begin at approximately $250,000, depending on options. Major items in the cost are the custom construction of each unit, the sophisticated computer and tape recording systems on board, and the special hardware that is required.
The project described in this report provided the opportunity to carefully assess the capabilities that are needed in a profdometer, and to then develop a design tailored to minimize life costs of the system. A profiling and rut depth system (sometimes called the PRORUT system) was designed, constructed, validated, and delivered to the FHWA. Additional information about the system is provided in three companion reports:
User's Manual for the UMTRIIFHWA Road Profiling (PRORUT) System[4] provides instructions for using the profilometer.
Reference Manual for the UMTRIIFHWA Road Profiling (PRORUT) System[5] provides reference documentation on the hardware and software of the system.
* The Ann Arbor Road Profdometer Meetingl61 describes some of the testing and analysis methods used in its development, along with validation results.

Objectives
The overall objective of the project can be broken down into specific objectives, as follows:
Assess the capabilities of currently available hardware and software (applicable to road profile and rut depth measurement) to establish a basis for defining what is available within current technology.
Perform an economic analysis of the use of profilometers in highway departments to provide guidance in decisions between cost and performance in the system design.
Develop concepts and specifications for a prototype proflometer system,
Design and construct a profdometer system.
Validate the measurement capabilities of the system.
During the course of the project the last objective-to validate the system-was expanded to allow operators of other profilometers to validate their equipment in parallel with the testing of the FHWA unit. This exercise, known as the Ann Arbor Road Profilometer Meeting (RPM), provided a meeting ground at which all profilometers obtained profile measurements on the same roads. Those profiles were processed in identical fashion by UMTRI to determine the accuracy and performance limits of each proflometer. Some details of the Road Profilometer Meeting are presented in Chapter 4 of this report. A complete description of the meeting and its results is available in the separate project report identified above.[q

DESIGN CONSIDERATIONS
Functional Concept
The purpose of a road prohlometer is to measure the vertical deviations of the pavement surface along the direction of travel. Rut depth measurements along a transverse profile are desired as well. Several concepts may be used to achieve each of these objectives.
From a simple conceptual viewpoint, a profile can be measured by moving an accelerometer along the road surface on a wheel or trolley. An acceleration profile is obtained which can be integrated once to obtain a slope profile, or twice to produce a displacement profile. In practice, this method is not viable because the acceleration .spectrum of the road surface is not uniform but contains high intensity in the short wavelength (high frequency) range. Thus an accelerometer selected to endure the high frequency inputs will lack the sensitivity needed to detect the long wavelengths.
The inertial profilometer developed at General ~ o t o r s [ l ] solves this problem by mounting the accelerometer on the body of a motor vehicle where the acceleration levels are relatively low, such that it can be sensitive enough to detect long wavelengths. This approach requires an additional sensor (a height transducer) to detect the road surface relative to the accelerometer. The GM inertial profilometer concept is illustrated in figure 1. To obtain an elevation profile, the accelerometer signal is integrated twice and added to the height signal. Then, as the vehicle is driven along the road at a constant speed, the combined signal represents elevation as a function of distance along the roadway. In the original design, height was measured via a potentiometer connected from the body to a roadwheel, which was spring-loaded to remain in contact with the road surface. Durability of the roadwheels proved to be a problem,in severe service. This problem has been solved by development of noncontact systems which use light or sound sensors to measure height. Optical sensors are used in the current Model 690DNC profdometer marketed by K. J. Law, Engineers, Inc. The latest versions include improvements to eliminate the need for a constant speed of travel, along with a number of optional software programs for utilizing the profdes that are measured.
The inertial concept can be implemented in other ways. For example, the APL profilometer developed in France is essentially a mechanical equivalent of the GM concept, with different performance lirnitations.[~ The South Dakota Department of Transportation has developed an inertial-type profdometer using acoustic road sensors.[al In theory, the inertial profilometer concept can also be implemented by replacing the height sensor with an accelerometer attached to the axle of the vehicle.[gI
An entirely different concept of profdometry has been developed by the Transport and Road Research Laboratory in England, which does not involve any form of accelerometer. The TRRL Laser Profdometer consists of a rigid beam with laser road sensors installed at

Fig. 1 Functional diagram of inertial profilometer

four points along its length. As the trailer advances, road elevation at the leading sensor is referenced to that at the other sensors so that a continuing profile is
Among the profilometer concepts, the GM-inertial method (accelerometer with road height sensor) is the most straightforward and proven. Thus it was selected for the FHWA profilometer design.[ll]
Rut depth measurement simply requires concurrent measurement of height from an array of road sensors distributed across the direction of travel. The depression in the wheeltracks defines the rut depth. Technology of measurement is not well established at this time, although several systems are in use. 131 Given a detailed transverse profile, different rut depths may be obtained depending on whether a "string-line" or "straightedge" method is used. At the current time, rut depth is not being measured by enough users to establish any particular approach as the best or most common. Estimates of rut depth can be obtained by use of three or five sensors distributed across the lane. The measure is an estimate because there is no assurance that the low point of the wheeltrack is being detected by the sensor. For the demonstration purpose of this project, the three-sensor method, which provides an approximation of average rut depth in both wheeltracks, was selected. .
Sensors
The GM-inertial profilometer concept requires three types of sensors-accelerometers, height sensors, and a speedldistance sensor.
Accelerometers are commercially available with performance qualities more than adequate for profilometer applications. Selection of an accelerometer is simply a price- performance decision. The selection should consider two criteria First, the accuracy of the accelerometers (resulting from the combination of hysteresis, resolution, precision, etc.) should be representative of the higher quality equipment available, so that the long wavelengths are adequately reproduced. Second, the accelerometers should have minimal cross-axis sensitivity in order to avoid excessive error in the profile arising from lateral vibrations of the vehicle body.
Monitoring the distance from the vehicle body to the road surface requires one sensor for each wheeltrack and one or more additional sensors for rut depth. These are mounted on the vehicle as shown in figure 2. In general, it is advisable to measure profile in both wheeltracks because of the differential roughness that is common on many roads. The height measurement must be sufficient to ensure accqate measurement of roughness on the smoothest roads.
Presently, there is no consensus as to the precision required. Specifications from 1.0 mm (.04 in) to 0.025 mm (0.001 in) have been proposed at various times. An analysis of profdes measured in Brazil showed that the precision requirement is proportional to the roughness level.[l4] Based on that study, a precision of .5 mm (0.02 in) has been recommended for measuring very smooth roads.[l5] ASTM standard E950 recommends 0.25 mm (-01 in).
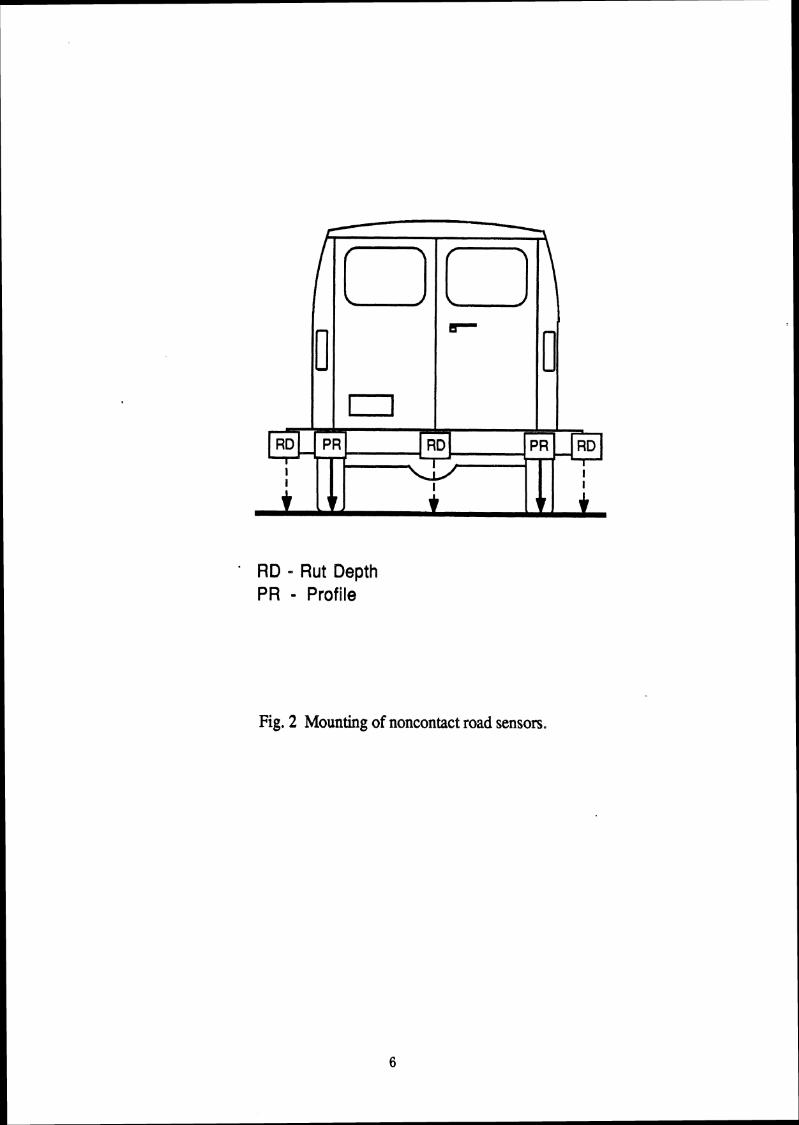
RD - Rut Depth PR - Profile
Fig. 2 Mounting of noncontact road sensors.
To ensure that the measured profile contains enough detail for the roughness analyses now in use, accurate measurements should be obtained down to 300-mm (l-ft) wavelengths. The (conservative) rule of thumb is that the sample interval should be one fourth of the shortest wavelength of interest, which implies a capability for sampling along the roadway at intervals of 75 mm (3 in). At 88 kmlh (55 mi/%) the bandwidth of the instnunentation must be on the order of 300 Hz to achieve the 75-mm sample interval.
Infrared noncontacting sensors developed by Southwest Research 1nstitute[l6] were provided by FHWA for use with the profilometer. Early tests with these sensors identified some color sensitivity which might cause e m in the measured profde. [I71 Accordingly, a set of Selcom Optocators was obtained on loan for the projeet.[lgl
The transducers used for speed and distance measurement can be any of a number of available choices. The speed should be measured continuously and accurately. Distance measurement is important in that it provides registration of the profile along the road. Although fifth wheels have been used in some of the earlier commercial profilometers, measurements made directly off a wheel of the vehicle can be sufficiently accurate with proper maintenance of the tires. Experience with both systems has lead to the conclusion that the additional attention to the condition of the wheels on the vehicle involves far less difficulty than maintenance of a fifth wheel.
Computer System
A computer with a number of special features is the heart of the profilometer system. It can serve a multitude of functions, viz.:
Calibration of the electronics
Monitoring signal levels to ensure that the system is functioning properly
Interface with the user for operation of the profiometer
Control of data acquisition and recording during measurement
Processing the raw data to produce profiles
Processing the profiles to obtain other roughness measures
Graphical and tabular display of the various measures made by the system
A number of considerations are relevant to the selection of a computer system for use in a profdometer. These generally involve the trade-off between price and performance. High power computers offer the advantage of fast data processing at the expense of higher initial cost, greater complexity (and possibly reduced reliability), and larger size. A costbenefit study was performed to provide guidance for the selection pmcess.[ll] The aspects addressed were:
Perfonnance-The "power" of a computer is a qualitative assessment of its overall capacity and computation speed. Computing power affects the rate at which data

can be acquired, which in turn affects length of test, measurement speed, and number of channels. It is also a major factor in determining data reductionfprocessing times that impact on duty cycle, or turnaround time between tests. For this purpose, the various functions and operating modes which profdometers must satisfy were identified, and constraints imposed by computer power limits were estimated.
Economics-Computer "power" comes at the price of higher initial cost. An economic model was set up to determine mual costs of a profilometer built around three candidate computer systems spanning the range of capability. The costs reflected hardware investment, system maintenance, and labor costs in operation.
Reliability-Although economic costs could not be quantified, consideration was also given to the reliability of the computer system. The notion of reliability is used here in its broadest sense to reflect the potential to keep the system operational at all times. Thus it is not only the absence of equipment failures, but the availability of repair s e ~ c e s (proximity and repair time) when failures occur, and the "familiarity" of the computer system to the potential users who must identify problems and m g e repairs.
At the cunent level of technology, the analysis favored use of an IBM-PC computer system for a most cost-effective profdometer. The advantage comes primarily from the low initial cost of the basic computer system, and the commercial availability of the miscellaneous internal boards required for special functions (memory boards, analog-to- digital converters, recorder control boards, etc.). The multiple sources for these components, in contrast to proprietary equivalents needed on higher-priced computers, results in more competitive pricing and ready availability of repair/replacement services. Because it is the most commonly used business and office computer system, an IBM-PC also offers additional advantages, in that:
servicing is conveniently available in every city,
* it is compatible with other computers in most office systems,
a large number of software programs are available,
users are familiar with the operating system, and
it will retain compatibility with newer, more powerful systems that will be available in the near future.
The primary disadvantage of the IBM-PC system has been the limited computational speed. At the time of system design and construction, the PC was the only suitable microcomputer available from IBM. (More recently the PC line has been complemented with an AT model with roughly three times the coqutation speed and a much larger memory range.) With the level of "power" available in the IBM-PC, profde cannot be computed concurrently with measurement. However, the additional labor costs associated with these shortcomings in typical applications do not justify the additional investment

necessary for a computer system that would overcome these shortcomings. The more powerful IBM-AT now available would be a possible substitute which would provide improved performance without redesigning the system.
Recording System
Approximately 126k bytes of data are accumulated with every mile of single-track profile measurement. With multitrack measurements, conventional floppy discs are not large enough to store the data accumulated on a reasonable length of test; therefore, a high capacity recording capability is needed. Historically, Ptrack digital tape recorders have been used with computer systems, but in recent years compact cartridge-based digital recording systems ideal for mobile applications have been developed. The cartridge recorders are both more compact, and require lower power levels. Among the many available on the market, the 3M cartridge format offers as much as 64 megabytes of storage on a cassette that is about twice the physical size of a common audio cassette.
Digital tape recorders using this format are commercially available for use with the DM-PC. A typical system consists of a 3M tape drive, controller module, power supplies, and an IBM interface card. The interface card, the only external component, is installed in the computer and provides the communication link between the computer and the tape system.
Signal Conditioning
Conditioning of the analog signal generated by the transducers must be provided by a component for which there is no suitable commercial source. The analog circuitry should be intimately linked to the computer, so that the computer can set the offset and filtering frequency for each channel, provide calibration service, and provide diagnostic capability. Since analog signal conditioning systems possessing this capability have been designed and used in-house at UMTRI for a number of years in the digital data acquisition systems required for research experimentation, the UMTRI hardware was the logical choice for this component. Photographs and circuitry are provided in the reference manual prepared for the profilometer. [41
The signal-conditioning system consists of a backplane, a control card, and amplifier cards for each of the transducers. The backplane provides the physical mounting and connection points for each card. All transducer inputs, computer communication, and amplifier outputs are routed through these connectors. The-control card provides the address decoding and generates the control signals that are supplied through the backplane to the individual amplifier cards.
Amplifier cards contain a high performance instrumentation amplifier, computer programmable filters, and computer adjustable offsets. In addition, they provide a calibration relay through which the computer can disconnect the transducer and switch in a

D/A (digital to analog) generated calibration signal to each amplifier input, so that it can measure the actual offset, gain, and linearity of each signal-conditioning card.
Vehicle There were no special considerations given to the selection of a vehicle in which to
install the profdometer equipment, in part, because the FHWA supplied a van in which it was to be installed. In general, use of a passenger car provides adequate room for a profdometer constructed of these components, although a van is preferable for ease of installation of transducers and convenience of the crew when traveling on the road.
Software
The computer software necessary to comprise a profdometer system is specific to the hardware and operating modes provided. The software must contain the following elements:
Operating system--controIling the computer itself
Main program--controlling the different operating modes of the profilometer
Configuration mode-for setting up the transducers and electronics
Calibration mod~ontrol l ing calibration of the hardware
Testing mode-controlling operations during measurement
Data analysis mode-for computing profile, rut depth, and roughness
Presentation mode-for graphical display of the measured road data
Various portions of the sofmare exist from different sources. The operating system is provided by IBM with the computer, programs to control the tape recording system are provided with it, and various routines needed for configuration, calibration, and test operations already exist with Uh4'R.I digital data acquisition systems. In addition, copies of profilometry software developed by other FHWA contractors are among the resources available. These various programs were reviewed for use where appropriate, although it was necessary to write and assemble software specifically to fit the IBM computer in order to produce a profdometer with the desired capabilities. A description of the software programs is provided in the profdometer reference manual.[q
h the generation of software for any profdometer, user-friendliness is considered an important attribute. Most frequently, profilometers are operated by personnel who do not necessarily have extensive computer experience or familiarity with the details of the lengthy programs required for their operation. Thus, it is important that the programs be tolerant of operator errors, and deal with such problems in an intuitive manner. Of particular importance was the observation from the Road Profdometer Meeting that the computer

should monitor the functioning of the profdometer and warn the operator of potential problems that would produce invalid d a d 6 1

PROFILOMETER
Hardware
The FHWA Prof~lometer is built on the chassis of the 1974 Dodge B300 van shown in figure 3, which was provided by the Federal Highway Administration. It is an inertial profilometer with road sensors and accelerometers (see figure 1) for measuring profiles in both wheeltracks. It includes a centrally mounted road sensor measuring the crown between the wheeltracks from which "average" rut depth is determined, The electronics system has provisions for two additional outboard road sensors so that rut depth in the separate wheeltracks can be measured should the additional sensors be installed.
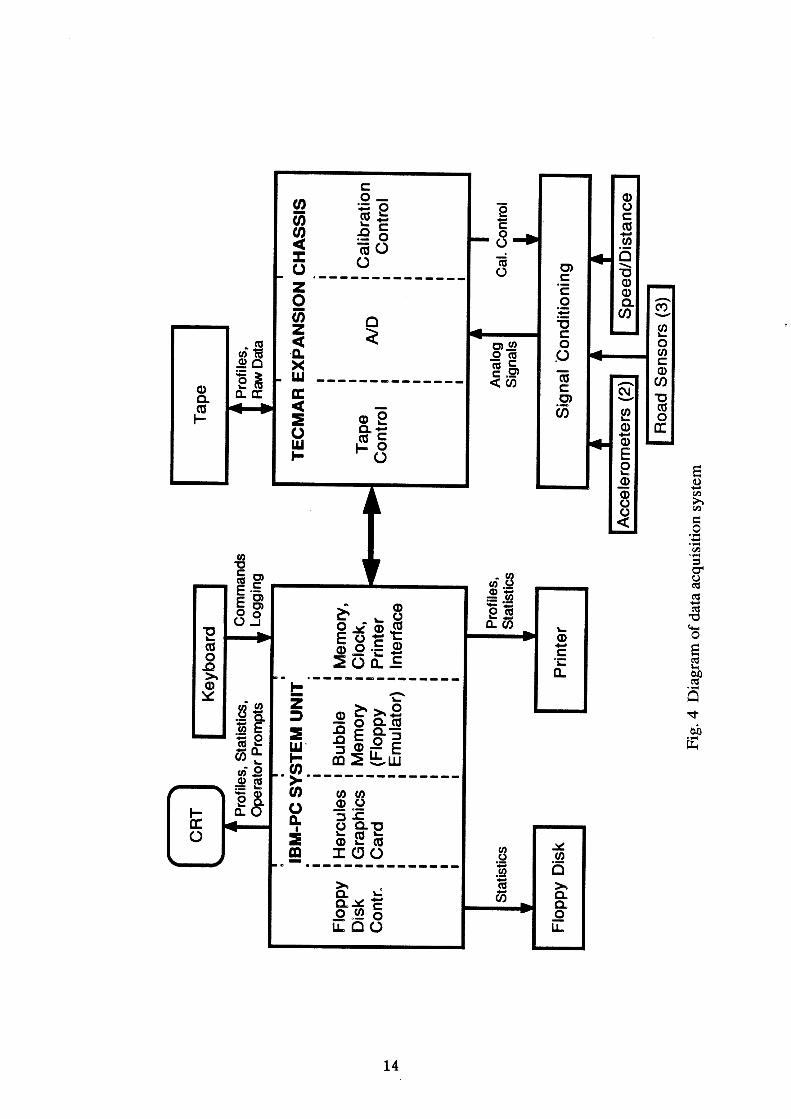
The hardware consists of transducers for measuring the speed of travel, vertical accelerations on the vehicle body above each wheeltrack, height above the road at the midpoint and in each wheeltrack, and a computer and recording system. A detailed description of the hardware is provided in the separate reference manual.[5] Figure 4 shows a diagram of the hardware system.
SpeedlDistance Transducer
The vehicle speed and distance of travel is measured by a pulser installed in the right front wheel.* Within the back side of the disc brake rotor is installed an exciter ring in the form of a disc with 120 notches (3 degree intervals). Rotation is sensed by a magnetic pickup which generates two pulses with the passage of each notch. Each distance pulse corresponds to 10 mm (0.37 in) of forward travel. The pulse train goes to the analog signal-conditioning unit, where it feeds into a fkquency-to-voltage converter to produce an analog speed signal. The pulse train is also fed to the computer to communicate distance traveled. Within the computer, a counter synchronized to the pulse train triggers data sampling at the selected intervals along the road.
Accelerometers
Two accelerometers are installed in the profilometer-one above the road sensor in each wheeltrack. The accelerometers are Sunstrand model QA-900 servo types rated at 30 g's full range (250 g's shock), and 500 Hz natural frequency. These have a threshold and resolution, each better than 0.005 mg, and a maximum cross-axis sensitivity of 2 mg/g.
The accelerometers are rigidly mounted in the vertical orientation on fixtures just above the road sensors. A rigid mount is important to ensure that the accelerometers do not
* The magnetic pickup used for the prototype system was left over from a previous project at UMTRI. The unit is similar to the AIRPAX 1-0007 pickup manufactured by the Airpax Corp., Ft. Lauderdale, FL.

Fig. 3 FHWA profdometer.

experience any vibrations not present on the road sensors. They are powered by 215 volts DC supplied from the signal-conditioning system. The acceleration signals feed directly into the signal conditioner where offset voltages are compensated, and the signals are amplified appropriately for input to the analog-to-digital converter.
Road Height Sensors
Two types of road sensors were provided for test by FHWA- infrared noncontacting sensors developed by Southwest Research Institute[lq (see figure 5), and a set of Selcom Optmators[l8] (see figure 6). The van is modified by installation of enclosures below the floor level where the sensors are mounted This is necessary pnmanly to place the sensors at the proper distance from the road, nominally 250 mm (10 in), but has the additional advantage of minimizing obstruction of the vehicle interior.
The enclosures are designed to accommodate either sensor. The infrared sensors are self-contained, requiring only a 12 volt DC power supply (obtained directly from the inverter connections) and signal wires going to the signal conditioner. The Selcom Optmators require their own signal conditioning box, which is mounted at the rear of the van, as seen in figure 7.
The distance output from road sensors is analog and is sent to the signal-conditioning system, where offsets and amplification are accomplished prior to digitization.
Signal Conditioner
The signal conditioner is a custom-built electronic system, which provides the following functions:
Signal offset compensation
Signal amplification
Signal filtering
* Switchable reference voltages for channel calibration
Transducer excitation voltage
A photograph of the signal conditioning unit is shown in figure 8. A detailed description is provided in the reference manual.[q The signal conditioning unit is mounted with the computer in the instnunentation console installed in the left side of the profilometer behind the driver's seat, It is powered by 110 volts AC supplied from the on-board inverter. Wiring from the transducers and to the computer are internal to the console. Voltage check points for diagnosing system problems are provided on its front face.
The circuitry on a typical signal conditioning card is shown in figure 9. The transducers are connected to the card via a 9-pin connector. Fed through this connector are the necessary excitation voltages for the transducer, which may be different for each type.

Fig. 5 Infrared noncontacting sensor from Southwest Research Institute.
16

Fig. 6 Selcom Optocator road sensor.

Fig. 7 Signal conditioner for Selcom Optocator installed in the rear of the van.

Fig. 8 UMTRI signal conditioner unit installed in the instrumentation console (top), and showing internal components (bottom).


The incoming signal goes through a calibration relay allowing the input to the card to be switched from the transducer to a computer-generated voltage for checking the gain and offset of the channel. After amplification, the signal goes through a 4-pole Butterworth filter to strip off any high frequency noise that can cause aliasing e m when the output signal is digitized.
Computer
An IBM-PC is the heart of the profdometer serving to control its calibration, operation, data acquisition, data processing, and data viewing. The PC is a standard commercial version with the following components:
IBM-PC, 256k memory, 2 DS DD floppy disc drives, and floating point processor
Hercules graphics card and IBM monochrome monitor
AST Six Pack Plus with 384k memory, clock, serial port and parallel port
Data Translation Analog YO, model DT-2801-A
Hicomp 5 1 2 bubble memory card
Dot matrix printer
ADIC tape control card
Calibration control card (custom-built with the signal conditioning unit)
A Tecmar expansion chassis is required with the PC to accommodate all of the extra cards. Both units are mounted in the instnunentation console behind the driver's seat as seen in figure 10. A more rugged "industrial" version of the PC was not available at the time the system was procured, so the console is "shock" mounted with Aeroflex cable-type isolators. The printer is mounted atop the console, and the keyboard and monitor are installed on a pedestal next to the front passenger seat, as seen in figure 11.
The system software,installed on the 5 12k bubble memory card, is retained in memory even when the system power is turned off. The floppy discs are not necessary for operation of the system, but can be used to transport information into and out of the computer. The AST Six Pack Plus supplements the computer memory to the limit of 640k, and the parallel port is used to drive the printer. The Data Translation Analog VO is the analog-to-digital converter system. It has 8 double-ended inputs and is capable of digitization at 35k Hz. The ADIC Tape Control card is purchased from the tape manufacturer, and is used to control the tape recording system. The Calibration card is a custom-built card designed to interface with the signal conditioning card, communicating signals needed for calibrating the data channels.

Fig. 10 Front view of instrumentation console located behind the driver's seat.

Fig. 11 View of the monitor and keyboard installed next to passenger's seat.

Tape Recorder
An ADIC model 550 Tape Recorder system is used with the proflometer. It is a 64- megabyte cartridge recorder capable of recording at up to 35k Hz. The recorder is self- calibrating (performed when it is first turned on) and looks like a disc drive to the computer. The recorder is installed in the instrumentation console, just below the computer (see figure 10).
Software
The profilometer system contains a software package configured especially for this application. The elements are:
IBM DOS 2.1
Microsoft Foxtrim (subset of Fortran 77)
Halo Graphics Package (with Fortran drivers)
UM'rRIFortmEibrary
Profdometer Program
The first four items are commercially-available software required to support the various elements of the Profilometer Program. The Profdometer Program is software written especially for the profdometer, using the Fortran language. More details on the program and its operation are provided in the User's Manual and the Reference ~anual . [~p 51
Overview of the System Operation
The profilometer software is designed so that persons with little or no experience with computers or the IBM PC can use the system effectively. There are no commands to l e a . for normal operation. Selection of options and modes of operation is accomplished through the use of menus, such as the three shown in figure 12.
The proflometer program consists of a main program that initially presents the user with the menu of options shown in the top of the figure. Most of the time, the operator will select the first and second items for measuring and viewing data. The third and fourth items are used for changing tapes. From the user's point of view, this involves inserting a new tape cartridge into the slot (load) or extracting the cartridge when ejected by the computer (unload).
The configuration mode is invoked when transducers are removed, replaced, or added to the system. The mode for exercising the input/output system provides several diagnostic tools that allow a knowledgeable user to read and set voltages at various points in the system. These tools can be used in the profilometer system in place of common laboratory

VIEW IWD PROCESS DATA
LOAD NEW DATA TAPE UNLO&D DATA TAPE
C O N r I ~ TRANSDUCERS EXERCISE IN?UT/OVTPUT SYSTEM -------I-------------------
DISPIAY LOGO QmT
DO BOUNQ TEST CB&CIC PULSER m7mJMROH)
PROClGSS DATA x I T T O b a m W & N ( 3
\
' VIE# PROCOSS DATA
oom TEXT PILE OPBS BaDNCE BILE
RA# DATA ORE-PROCESS PILES
PLOTTING.. . - PROPILE (DETAILFD)
- ROUGBNESS L RUT-DEPTH - RAW DATA ....................... PRINT m c s ------------------,----
BACX. TO P m m s m.. .
Figure 12. Three of the menus used in the prof~lometer program.

instruments such as voltmeters and precision voltage sources. They are mainly for use by an electrical engineer or technician in tracing malfunctions.
In addition to being easy to understand, the profdometer software is designed to be easy to use. Whenever possible, efforts were made to simplify and reduce the amount of input required from the user. Generally, when information must be entered or modified, all of the ikms to be changed are shown on the meen together. The individual pieces of information shown on the screen can be edited from the keyboard, using the arrow keys to move between the items. For example, when setting up to measure a road, the screen will display the distance between elevation measures (the sample interval), the estimated length of the run, the estimated speed, the name of the operator, the name of the road, the name of the output file, and so on. If the only item to be changed is the name of the road, the operator uses arrow keys to go to that item on the screen (indicated by highlighting). The arrow keys are also used to move the cursor to the point where a change is needed. For example, to change "1-94 East, mi-184" to "1-94 East, mi-192" the cursor is positioned over the 8 and the operator types "92".
Whenever possible, default values are shown for names and numbers that are set by the operator. If the operator is unsure of what number to use, the default value can simply be accepted.
Measuring Data and Pe$muming Calibratiom
When "MAME ROAD MEASUREMENTS" is selected from the main menu shown at the top of figure 12, the second menu in the figure appears on the screen, showing the actions associated with measurement that can be taken.
The first item in the menu, "SELECT CONFIGURATION," allows the operator to use a subset of the transducers installed in the profdometer. For example, the system may have the transducers needed to measure two longitudinal profiles and one rut-depth profile. But, if the operator is interested only in the rut depth measures, the system will run more efficiently (less data, faster processing, etc.) if only those data are collected. To do so, the "SELECT CONFIGURATION" option is used to tell the system software to act as if the additional sensors are not installed, so that only the rut-depth profile is measured (It is not necessary to actually disconnect the extra transducers.)
The test or measurement mode is selected by choosing "MEASURE ROAD", from the menu. In this mode, the operator sets up a test by entering header information-test location, file name for the data records, and other data by which he chooses to identify the test. Thereafter, the measurement process is started and stopped by depressing the space bar on the computer keyboard. Internally, the program handles the data input and transfer to the tape recorder.
In addition to the obvious function of making road measurements, there are several options that involve calibrating and checking the hardware components in the profdometer.
Several calibration checks are used to check the functional state of the profilometer on a daily basis to ensure that accurate data are being a c q u . The option, "DO ELECI'RICAL CALIBRATION," should be performed daily before making any road measurements. This initiates a test procedure in which the computer calibrates the electrical components in the system by supplying voltages at various input points and measuring voltages at output points. At the same time, the road sensors are checked to ensure they are at the proper zero and gain settings: This is accomplished by running the vehicle up on blocks and installing a calibration bar that passes under all three sensors, as shown in figure 13. The bar mounts directly to the sensor enclosures to ensure its proper relationship to the vehicle.
In addition to the electrical calibration, the height sensors are checked for malfunction using the calibration bar. The bar has three possible positions. The center position corresponds to "zero" and is used to check the zero outputs from the sensors during the calibration of the electronic components. Under prompts from the computer, it is then moved to positions that are 25.4 mm (1 in) above and below zero for pasdfail check of the height sensor. (The calibration constants for the sensors are obtained from a precise laboratory measurement that should be performed about once per year.)
The accelerometers are checked via a bounce test, selected as the menu option "DO BOUNCE TEST." With the vehicle sitting stationary, the operator jumps on the rear bumper to bounce the body up and down while a profile measurement is made. If a flat profile is obtained the accelerometers are still correctly calibrated.
A check of the speed/distance calibration is provided under the menu option "CHECK PULSER." It is performed by running the vehicle over a measured distance. It is designed for daily use as a check that the pulser and associated circuitry are functioning properly, although it is also a useful tool for calibrating the pulser every month or so.
Viewing and Processing Data
Examining the data obtained by the prof~lometer is accomplished by choosing from the options shown in the third menu of figure 12. Initially, the data are stored as the raw acceleration, height and distance measurements. The raw transducer signals may be viewed by the operator as a first level check that the system is functioning correctly. The data are transformed to longitudinal profiles and rut-depth profiles by two stages of data processing. Typically, both of those passes are performed automatically by the system the first time an operator asks to view the processed data.
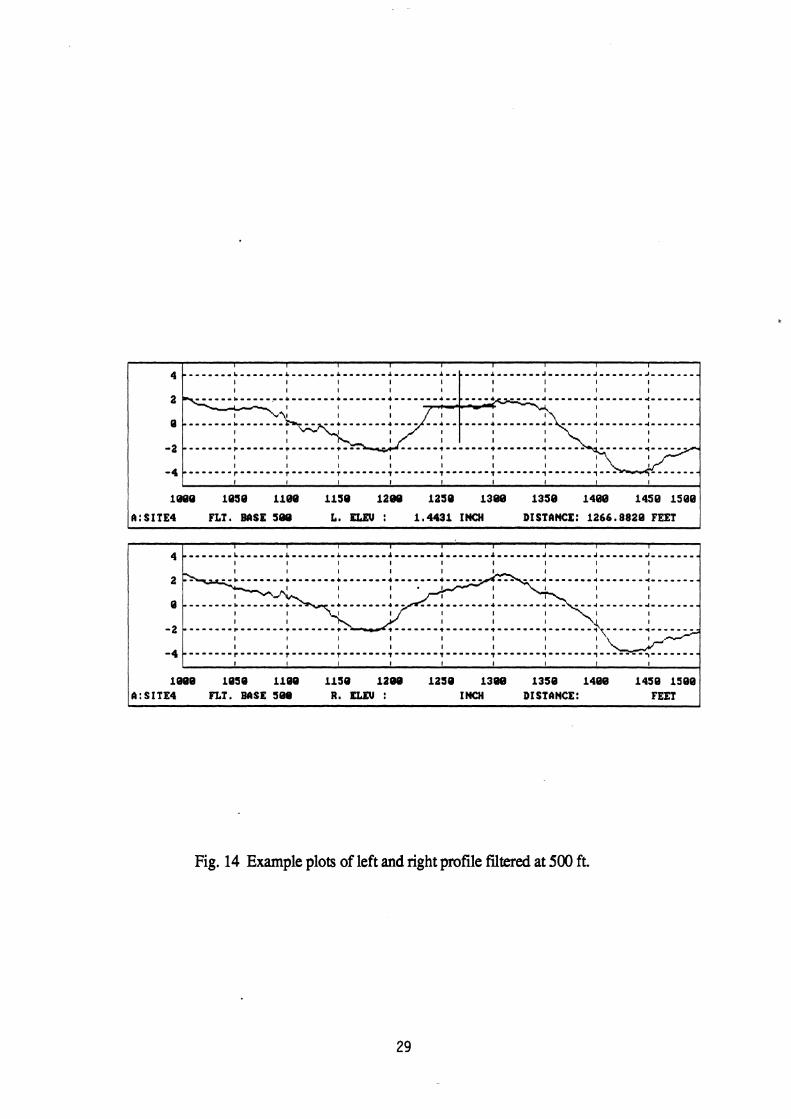
The measurements are displayed graphically using plotting routines, or printed out in tabular form. The output is presented in English units on the profilometer, and will be referenced accordingly in the remainder of this section. The operator may examine data (raw signals, elevation profiles, slope profiles, roughness profiles, and rut profiles) plotted as a function of distance along the road, as shown in figure 14. The cursor, visible as a
For rut depth measurement, it is essential that all three road sensors used to measure a rut are calibrated to the same z m .

Fig. 13 Set up for daily calibration.
I I I I I I I - . - - - - . v - - . - - - - T - . - . . . . T - - . * - - - , . - - - - . . T - . - - - - - T - - - - - - - l - - - - - - - , . - - I L-g------
I I I I I I I I 1
1900 1050 1100 1150 1290 1250 l 3 m 1356 1466 1450 lS06
&:SITE4 FLT. BASE 589 L. ELEU : 1,4431 INCH DISTANCE: 1266.8820 FEET
L I I I I I I I I I
1000 1058 1100 1154 1200 1250 1306 1350 1468 1450 l50@ &:SITE4 FLT. BASE SW R. ELEU : INCH DISTANCE: FEET
Fig. 14 Example plots of left and right profile fdtered at 500 ft.

cross on the graph, can be moved with arrow keys to read individual data values. In figure 14, the cursor is located on the upper plot. As indicated in the "DISTANCE" readout immediately below the plot, it is located at the point 1266.882 feet into the test record. The elevation value at that point is 1.4331 inches, as read from the caption "L. ELEV" underneath the plot. The operator can scroll the graph along the distance axis, and zoom in and out interactively. The software is designed so that any part of the data can be plotted quickly and easily. For example, a 50-ft section of road contained in the middle of a 15-mi test can be viewed without scrolling through any other portion of the test.
The software that displays the data also contains tools to reduce the data to forms that aid in its interpretation. The tools include smoothing filters, high-pass filters, and a roughness analysis based on the quarter-car simulation, called the International Roughness Index (IRI).[14] Examples of some applications are explained below.
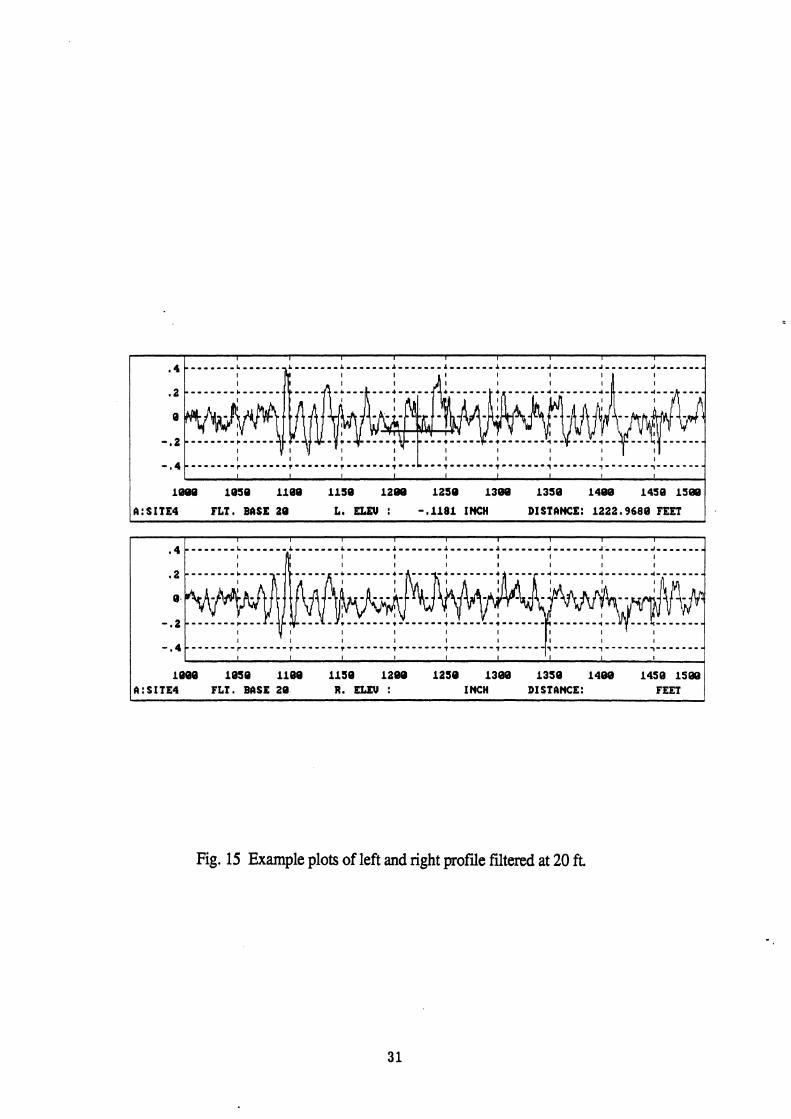
When viewing longitudinal profiles of road elevation, the plot is always dominated visually by the longest wavelengths included in the measurement. Figure 14 shows this very clearly. In these plots, which were filtered to remove wavelengths of 500 ft and longer (recorded in the caption of the plots as "FLT. BASE 500"), the most noticeable shapes are the undulations that are about 200 ft in length. Other features that are perhaps more important f'rom the perspective of engineers are harder to see. For example, there is a sharp bump at 1095 ft which might be of interest, but which is hard to see due to the scaling required to show the longer undulations. Figure 15 shows the same profile, filtered to remove wavelengths of 20 ft and longer. The bump at 1095 ft is more clearly visible, as are other surface features involving shorter wavelengths. This filtering is called high-pass, because the low frequencies (long wavelengths) are stripped from the profile, leaving the high frequencies. Whenever elevation profiles are viewed, the baselength for the high-pass filter can be adjusted by the operator.
Roughness is a property that is defined over a section of road. It is meaningless to talk of the roughness of a point--one must always consider roughness as a property of the profde interval between two points. IRI roughness measures can be printed for any combination of interval, starting position, and stopping position using the "PRINT NUMERICS" option. Figure 16 shows an example printout, for an interval of 528 ft (1110 mi). In addition to roughness, mean rut depth was also printed. (The software treats rut- depth as a measure that can have positive or negative amplitudes. In this example, some of the rut depth numerics are negative, indicating that the average of the elevations in the two wheeltracks is above the elevation in the center of the road.)
The profilometer also has the capability of showing roughness and rut depths graphically, as shown in figure 17 for roughness. This figure shows a very useful representation of roughness which is unique to this profilometer. Each point shown represents the roughness over an interval of 528 ft, as indicated at the bottom of the plot by "AVE, BASE 528.'"e first point at the beginning of the graph 0(=264 ft) is the average over 528 ft centered at 264 ft, covering the interval of 0 to 528 ft. This roughness value was printed in figure 16 and has a value of 210.88 inlmi. The next printed value was
lee@ 1050 1160 1150 1200 1250 1300 1350 1400 1 4 5 @ 1 5 w
&:SITE4 FLX, BASE 20 La ELEU : -,1181 INCH DISTANCE: 1222.9680 FEET
I I I I I I I I I
1000 1050 1100 1150 1280 1250 1300 1350 1409 1450 1500 A:SITE4 FLT. BASE 20 R. ELEU : I NCH DISTANCE: FEET
Fig. 15 Example plots of left and right profile Ntered at 20 ft.

DISTANCE - FEET FROM.. . TO
L. IRI IN/MI
R. IRI IN/MI
C. RUT INCH
Fig. 16 Example printout of roughness and rut depth along a test section.

I . I I 1 I I
I I I I I I I I I I I I
I I I I I I I I I I I I
588 1888 1590 2888 25B8 3888 A:SITE4 AWE, BASE S28 L. IRI : 345.9789 IN/MI DISTANCE: 1045.6920 FEET
Fig. 17 Example plot of IRI roughness along a test section.

322.91 in/mi, covering the interval of 528 to 1056 ft. The value corresponds to the point on the graph at 792 ft, the center of that interval. Between the points at 264 and 792 ft, the plot also shows roughness for every possible 528 ft interval. For example, there is a local maximum of 250 in/mi at about 400 ft, for the interval covering 136 to 664 ft. The highest roughness level anywhere in the test is easily seen to be at the cursor location, which is the interval centered at 1045.7 ft. Because the cursor was positioned at that point, that roughness level is displayed numerically below the plot as the value 345.98 Wmi.
One of the difficulties involved in repeating profile measures involves the imprecision in starting the measurement at precisely the same road location for each test. Plots such as the one shown in figure 17 show very clearly those e m in repeat tests, because the same roughness profile is obtained but it is shifted along the x axis. This plottinglanalysis tool solves the problem of determining whether differences in roughness indices from two runs are due to starting position, or whether they are due to something else.
The rut depth profiles are plotted using the same method as the roughness. In this case, the baselength is a distance over which the rut depth is averaged.
In all of the plotting options, the operator has a choice of one or two plots on the screen. In addition, the filter baselength, used for high-pass filtering of the elevation profile or for selecting an interval for the roughness measure, is specified by the operator.

PERFORMANCE EVALUATION
The Road Profilometer Meeting
With the construction of any new profilorneter, it is appropriate to conduct experiments to verify that desired performance is being achieved. In this regard, it is necessary to determine the performance limits, in terms of operating speed, surface type, and roughness level, at which valid profiles are obtained. The key elements of such an experiment are to select a series of test sites covering the variables of surface type and roughness, conduct profile measurements on these surfaces (both with the profilometer and with an alternative method of known accuracy), and analyze the profiles to quantlfy the degree of agreement between the profdometer and the reference measurements, At the request of the FHWA, this experiment was set up to allow participation by a number of profdometers owned by states and other organizations. The experiment was conducted in September 1984, and was known as the Ann Arbor Road Profilometer Meeting (RPM). A separate report was written to cover this part of the projec~[61 The experiment is only briefly reviewed here for purposes of documenting performance of the FHWA profilometer, and noting the observations from the experiment that influenced later development of the system.
Test Site Selection
The proper evaluation of a prof~lometer is obtained from measurements on actual road surfaces (rather than, for example, a laboratory dynamic test) using operators that are representative of the end user. Knowing the characteristics of profilometer instruments and, in particular, areas in which the various designs might produce errors, a series of 27 sites was selected in the vicinity of Ann Arbor. Eighteen of these were public road sites and 9 were at the General Motors Proving Ground (GMPG) in Milford, Michigan. The sites at GMPG were selected because they could be closed off from traffic for rod and level surveys. With proper methods, rod and level measurements can exceed the capability of profilometers, thus providing the reference profile measurements needed for validation.
The sites were selected to provide the broadest available range of roughness levels. The smoothest sites were needed to ensure that the system had the resolution and signal level needed to measure smooth roads correctly; and the roughest sites ensured that system could handle the large amplitudes. A range of surface textures were included: open textures, longitudinal grooves, lateral grooves, longitudinal cracks, and lateral cracks. Open-textured surfaces can create difficulties for acoustic road sensors because of poor sound reflectiveness, and difficulty for laser spot sensors because of loss of the image in the surface voids. The longitudinal and lateral grooves and cracks can create several types of difficulties with optical road sensors. Signal loss may occur if the light image drops into a surface opening, or a dither may be added to the profile if the sensor is so precise as to follow individual grooves. Finally, the sites included the range of surface colors to

challenge the performance of the road sensors-highly reflective new Portland Cement Concrete (white), low reflectiveness new bituminous asphalt (black), and combinations of each in patched areas.
The sites were marked by roadside signs at the beginning and end of each section, and with paint mar. on the surface to indicate the desired test track in the lane.
Test Procedwe
The public road sites were located in a circuit around the Ann Arbor area that allowed testing at the convenience of the profilometer crews during the three days of the Meeting. All profilometers visited the GMPG test sites together for testing to minimize disruption for the Proving Ground staff. Tests over a range of speeds were performed in order to verify operation over a speed range, and to permit evaluation of the wavelength range possible with each profdometer. Repeat tests were also performed on selected sites to verify ability to obtain consistent measurements.
At the time of the Meeting, the FHWA profdometer was operated by the UMTRI crew over all sites with both the Selcom Optocator and the Southwest Research infrared road sensors installed. The same sites were used in later testing to verify modifications and improvements to the system. Then, at the time the profilometer was delivered to the M A , the FHWA Contract Technical Representative tested it again on the public road sites to verify that it was functional as operated by an inexperienced person.
Data Analysis
The profiles measured by various profilometry methods cannot be compared meaningfully by simply comparing the elevation values. The profdes obtained from most profilometers are filtered to exclude long wavelengths, which gives each a different appearance. Even if the profiles were expressed as absolute elevation points, imprecision in the longitudinal positions of the points would create errors. Thus a part of the RPM. experiment was to develop a rational means for validating the performance of profilometers.
The appropriate philosophy for validating profdometer measurements is to recognize that the accuracy of a measured profile can only be judged in the context of its end use, or application. Even though no profilometer measures true absolute elevation, the adulterated profile still has many useful purposes. Hence, profdometers may be validated by assessing the accuracy of their measurements when used for the different applications.
The most common application of a profilometer measurement today is for calculation of a roughness index. The most universal. measure of roughness is the sc~called "in/min statistic, as measwed with response-type systems or computed with a quarter-car analysis. A standardized form of the quarter-car index-the International Roughness Index O - w a s routinely calculated from the profdes as an indicator of their accuracy. Results involving the IRI have a relevance extending beyond the IRI statistic itself, because IRI

requires accuracy over a range of wavelengths of profile measurement that is also required for many other roughness indices.
To produce a broader picture of the performance range of the profdometer, the profiles were also processed to obtain power spectral densities (PSDs), and these were averaged over certain wavebands to provide numerical values that could be used to quantlfv performance. By comparing PSDs and the level of roughness in wavebands, it is possible to quantify the range of wavelengths over which the profilometer is accurate.
Performance Summary
At the time of the RPM, the FHWA profilometer was in a prototype stage. The performance was largely as expected, with several exceptions. In the period following the RPM, as the profdometer was being developed into its deliverable form, certain changes were made to correct deficiencies noted in the RPM testing.
Wavelength Range
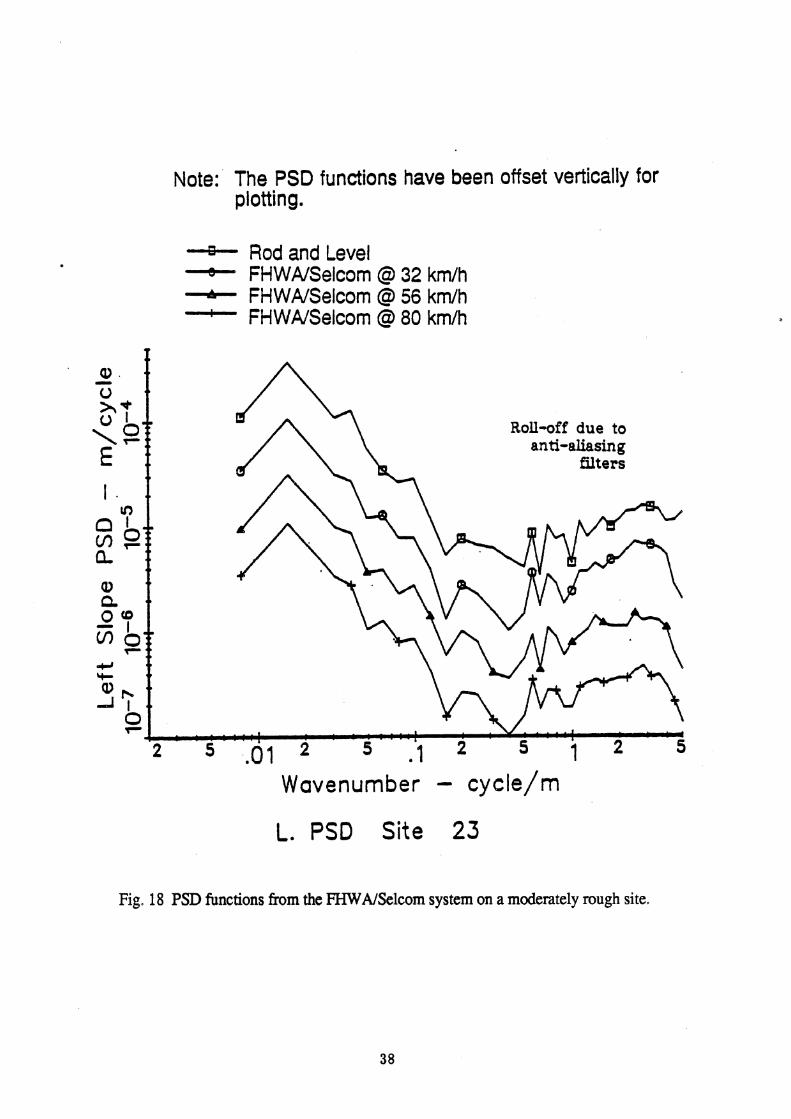
The FHWA profilometer has a demonstrated measurement capability over the wavelength range of 0.3 to well over 90 m (1 to 300 ft). The performance in this regard is shown by the PSD of profile slope shown in figure 18. Although the profiles shown were obtained with the Selcom road sensors, similar performance is achieved with the Southwest Research infrared sensors. (However, on some surfaces the IR sensors attenuated the very short wavelengths.)
The short wavelength limit of 0.3 m is determined by the profile sampling interval of 75 rnm (3 in) selected for the profdometer. The limit is evidenced in figure 18 by roll-off in the PSD measured by the profilometer above wavenumbers of 3 cycledm (corresponding to a wavelength of 0.3 dcycle). A closer sampling interval could be used on the profilometer, but carries with it the penalty of recording more data without any real benefit for most applications. The only benefit from closer sampling intervals would be to characterize pavement texture, but this requires more than an order of magnitude increase in the data sampling rate and storage requirements. That objective was not within the design intent of the FHWA profilometer.
The long wavelength performance is demonstrated in figure 13 by the close agreement between the profdometer and the rod and level measurements down to wavenumbers less than 0.01 cycles/meter (conesponding to wavelengths of 100 meters/cycle). The long wavelength limit appears to be in the range of 300 to 600 m (1000 to 2000 ft); however, this is hard to demonstrate because no reference measurements of that length are available for comparison. The long wavelength limit is imposed because at normal highway speeds the acceleration caused by these very long wavelengths is so small that there is a problem with the signal-to-noise ratio in the instrumentation, even using the highesi quality transducers. With a GM-type inertial profilometer, the quality of the measurement of the longest wavelengths increases with speed. That is, measurements made at higher speeds
Note: The PSD functions have been offset vertically for plotting.
-+ Rod and Level - FHWA/Selcom @ 32 kmlh + FHWPJSelcom @ 56 km/h + FH WNSelcom @ 80 km/h
Wavenumber - cycle/m
L. PSD Site 23
Fig. 18 PSD functions from the FHWA/Selcom system on a moderately rough site,

can be processed to include longer wavelength than measurements made at low speeds. The filtering on the FHWA profilometer automatically cuts off the longest wavelengths as a function of the test speed, so that the maximum valid bandwidth for a given measurement is always available when profiles are viewed.
Roughness Range
The FHWA profdometer is capable of roughness measurement over the range of 1 to 10 m/km IRI roughness. This is the maximum range available from the test sites found in the Ann Arbor vicinity, and used in the RPM. By and large, most public roads fall in the range of 1 to 4 m/km IRI; while the special test sites at the GMPG were the source of roughness near the 10 m/km limit.
During the RPM the FHWA profilometer was found to be capable of measurement only up to about 8m/km IRI because of saturation of the accelerometer signal. The saturation problem was unknown at the time, so the RPM report shows that limitation. Because of that finding, the amplifier settings in the profilometer were changed to allow a greater range, up to IRI values of 10 m/km (630 inlmi). (The Southwest Research Infrared sensors have a smaller height measurement range, and their ability to measure roughness up to the 10 m/km range was not confirmed.) The software includes error checking during the data processing steps, and will alert the operator should any of the data channels reach saturation.
Repeatability
Repeatability was evaluated in the RPM by obtaining repeated tests on some of the road sites. Generally speaking, the repeatability of the profilometer measurements was much better than the operator's ability to start the test at identical points, or maintain the vehicle on the identical road path. The repeatability of the FHWA profilometer can be fairly characterized as on the urder of 0.1 m/km IRI or better, although in repeat testing a range of 0.3 m/km may be observed because of the operator variables.
Reproducibility
Reproducibility was evaluated by comparing the measures from the FHWA profilometer with those obtained from rod and level and from the other profilometers in the RPM. As with repeatability, the reproducibility of the instrument appear to be better than that of the operator. It is approximately the same as the repeatability: 0.1 m/km for the machine, or 0.3 m/km when including the effects of the operator.
Operating Speed Range
The FHWA profilometer is designed for operation in the normal traffic speed range. In the RPM, tests were conducted at speeds of 32, 56 and 80 km/h (20, 35 and 50 mi/h).
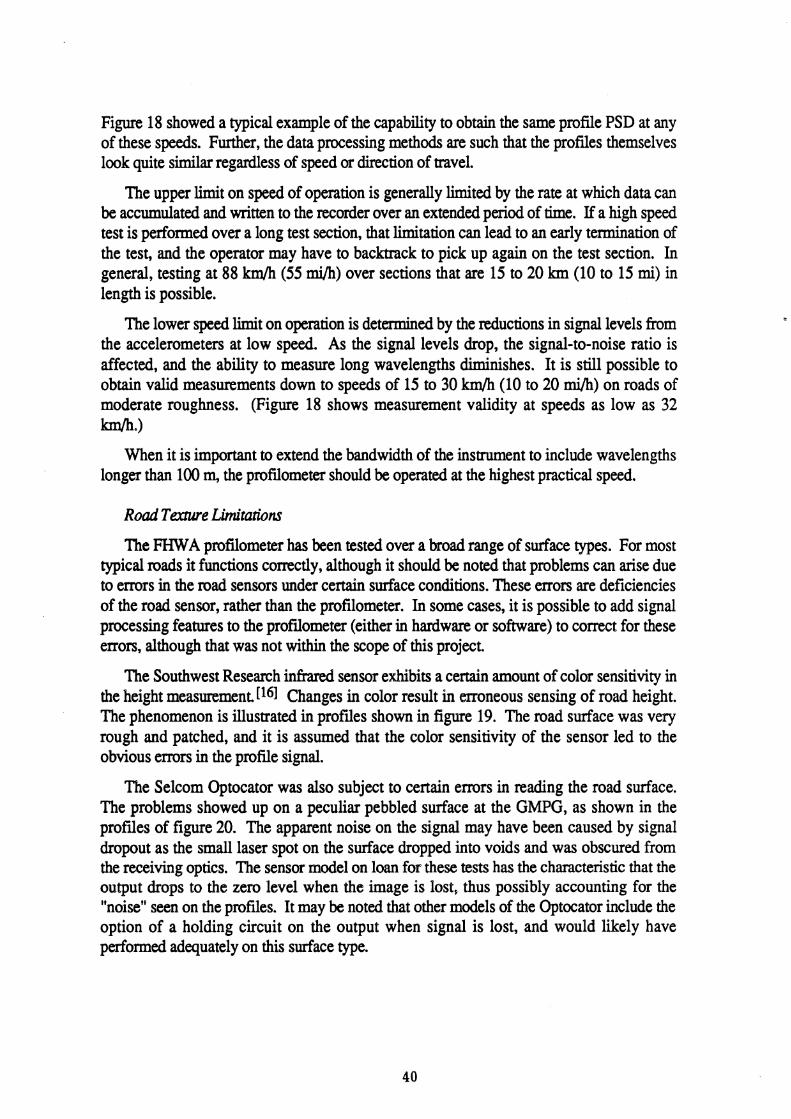
Figure 18 showed a typical example of the capability to obtain the same profile PSD at any of these speeds. Further, the data processing methods are such that the profiles themselves look quite similar regardless of speed or direction of travel.
The upper limit on speed of operation is generally limited by the rate at which data can be accumulated and written to the recorder over an extended period of time. If a high speed test is performed over a long test section, that limitation can lead to an early termination of the test, and the operator may have to backtrack to pick up again on the test section. In general, testing at 88 km/h (55 mi/h) over sections that are 15 to 20 km (10 to 15 mi) in length is possible.
The lower speed limit on operation is determined by the reductions in signal levels from the accelerometers at low speed. As the signal levels drop, the signal-to-noise ratio is affected, and the ability to measure long wavelengths diminishes. 1t is still possible to obtain valid measurements down to speeds of 15 to 30 km/h (10 to 20 mi/h) on roads of moderate roughness. (Figure 18 shows measurement validity at speeds as low as 32 Inn/h.)
When it is important to extend the bandwidth of the instrument to include wavelengths longer than 100 m, the profilometer should be operated at the highest practical speed.
Road Texture Limitations
The FHWA profilometer has been tested over a broad range of surface types, For most typical roads it functions correctly, although it should be noted that problems can arise due to errors in the road sensors under certain surface conditions. These errors are deficiencies of the road sensor, rather than the profilometer. In some cases, it is possible to add signal processing features to the profilometer (either in hardware or software) to correct for these errors, although that was not within the scope of this project.
The Southwest Research infrared sensor exhibits a certain amount of color sensitivity in the height measurement Changes in color result in erroneous sensing of road height. The phenomenon is illustrated in profiles shown in figure 19. The road surface was very rough and patched, and it is assumed that the color sensitivity of the sensor led to the obvious m r s in the profile signal,
The Selcom Optocator was also subject to certain errors in reading the road surface. The problems showed up on a peculiar pebbled surface at the GMPG, as shown in the profiles of figure 20. The apparent noise on the signal may have been caused by signal dropout as the small laser spot on the surface dropped into voids and was obscured from the receiving optics. The sensor model on loan for these tests has the characteristic that the output drops to the zero level when the image is last, thus possibly accounting for the "noise" seen on the profiles. It may be noted that other models of the Optocator include the option of a holding circuit on the output when signal is lost, and would likely have performed adequately on this surface type.

- Minnesota -+ FHWA/IR
200 220 240 260 280 300 Longitudinal Distance - m
L. Elev. Site 15
Fig. 19 Invalid profde measured with the IR system on a rough, patched surface.

0 0 -+ Rod and Level
---ti. FHWAlSelcom @ 32 km/h
E - FHWAISelcom @ 56 km/h
E - FHWNSeicom @ 80 k
I0 . c 0 .- 4 0 > . Q)
is 0 rO
G I Q) .J
L. Elev. Site 24
a 8 F
Fig. 20 Invalid proffie measured with Selcom system on an unusually textured surface.
, n Note: The profiles have been off set veflically for #. lotting and fiitered with a 10-m moving average.
L'160 180 200 220 240 260 280 300 32; Longitudinal Distance - m
CONCLUSIONS AND RECOMMENDATIONS The overall objective of this project has been to assess the capabilities that are needed in
a road profilometer and to develop a design tailored to minimize life costs of the system. That process led to the development of a system based on the DM-PC microcomputer. The advantage of that system is the low cost of the computer hardware, its familiarity to the typical professional, the availability of software, the potential for making the system easy to use and understand, and the capability for showing processed data immediately in graphical form.
Table 1 shows a cost breakdown of the system, based on the 1984 list prices of the components. (Although prices have changed since 1984, figures in the table may be useful for estimating the cost involved in duplicating the system.) The table shows that the most costly item is the noncontacting height sensor, estimated by FHWA to cost $8,000 per sensor. Other optical height sensors, such as the SELCOM Laser sensors delivered with the system, are more expensive. If the system needs only to measure a single longitudinal profile, the cost can be reduced by $17,000 by eliminating two of the height sensors and one of the accelerometers. On the other hand, if the system is upgraded to measure rut depth in the two travelled wheeltracks, two additional height sensors would be needed at a cost of $16,000. To summarize, the system cost is comprised of instrumentation costs in the $20,000 range, plus the vehicle, road sensors, and installation costs. The cost of the overall system depends mainly on the choice of the height sensor, and the number of sensors installed.
If the instrumentation hardware used in the FHWA profilometer is duplicated, the software should be directly transportable to other systems. Minor modifications are needed to run on the more recent IBM AT microcomputer.
The conduct of the Road Profdometer Meeting (RPMJ proved the capabilities of current profilometer technology in road measurement, and led to the discovery of some of the major shortcomings in practice. The most profound observation from the RPM was that erroneous measurements can be made without operator knowledge, with the risk that erroneous data may be entered into a highway department database. Because of the complexity of a road profilometer, the operator cannot always be expected to detect malfunctions in the system Aside from the extensive training that may be required for this purpose, not all malfunctions are obvious to an operator. Thus, it is essential to incorporate more self-checking and diagnostic features into profilometer design, if profilometers are to achieve their potential as pavement monitoring systems.
Keeping in mind the limitations of microcomputer technology embodied in the DM- PC, vintage 1984, the design has achieved profilometer capability with a reasonable level of user-friendliness, and self-checking and diagnostics capability. The selection of that computer family leaves open the door to further development of the system as successive computer models become available. At this time, certain extensions of the system and its capability appear to be worthy of further development, and FHWA projects in these areas are recommended These are:

Table 1 . Approximate costs of the components in the profiling and rut depth system .
NOTE: All prices are approximate and applied in 1984 . Ut Price
COMPUTER IBM PC with 256K memory. 2 DS DD floppy disk drives.
......................... monochrome monitor. floating point processor .................... .................. System Software and manuals ...
.................................................. Hercules Graphics Board
AST "Six Pack Plus" 384K memory. clock, serial port. parallel port ......................................... Data Translation Analog digitizer
................................................ Tecmar Expansion Chassis ........................................ ADIC Model Model Tape System
....................................................... Printer and Cable ,.................*..,...... ........... Hicomp 5 12K Bubble Memory ..
SIGNAL CONDITIONING UNfl Amplifiers. anti-aliasing filters. calibration control ....................
........................... Power supplies. cable. conectors. enclosures ....................................................................... Inverter
TRANSDUCERS (as presently configured)
Magnetic Pickup for speed .............. ... ...... .. .................a ............................................................ 2 Accelerometers
......................................... 3 FHWA Infrared height sensors
............................................................................. VEHICLE 10, 000
VIBRATION ISOLATION. ........................................................ 400

Profile Analysis Exrensions-The more data analysis methods available on a profilometer, the more ways in which a system can be used. The delivered system measures profiles for display in several formats, or for calculation of roughness statistics. The addition of the waveband analysis software used in the RPM is recommended as a reasonable next step in development. Waveband analysis allows the operators to examine roughness from a different perspective with possible utility in better characterizing how a road surface is deteriorating.
Certain problems with calculation of roughness statistics were noted in the RPM that warrant further attention. Specifically, on profilometer systems that have the accuracy and resolution to measure open cracks in a surface, the resulting roughness statistic will be affected. The profile excursions into cracks are not actually seen by the tire of a motor vehicle, because the tire will bridge the crack. Thus, roughness analysis methods need to deal with this anomaly, and a practice for dealing with this problem should be developed.
Rut Depth Measuremenr-Rut depth measurement systems as features on road profilometers are drawing greater interest. Several methods for measuring rut depth are in use which require different sensor configurations and different computation methods. Although ruts will show up by any reference, the numerical values are not necessarily the same. A standard definition of rut depth needs to be established. Otherwise, even more approaches will appear in practice, with the age-old problem that the measures. from the different designs will not be comparable, and the exchange of knowledge will be impeded
Texrure Measurement-The laser road sensors have sampling capabilities sufficient for measurement of road surface texture at the scale that should relate to road friction gradient. With suitable development (to overcome the loss of signal problems) it should be possible to characterize surface texture concurrently with profile measurement.
Road Geometry Mearurement-Technology has been demonstrated by which the vertical and horizontal geometry of a road can be measured from a moving vehicle. The development of a system in conjunction with the profilometer allows a more complete mapping of a road system and its condition.

\
REFERENCES [l] E. Spangler and W. Kelly, "GMR Road Profilometer - A Method for Measuring
Road Profile." Highway Research Record 121, Highway Research Board, 1966.
[2] A. D. Brickman, W. H. Park and J. C. Wambold, "Road Roughness Effects on Vehicle Performance." Pennsylvania Transportation and Traffic Safety Center, The Pennsylvania State University, Report No. 73°C-7207, 1972.
[3] R. D. Ervin, et al., "Influence of Size and Weight Variables on the Stability and Control Properties of Heavy Trucks." The University of Michigan Transportation Research Institute, Report No. UMTRT-83- 10-2, April 1983, 175 pp.
[4] M. W. Sayers, T. D. Gillespie, and M. R. Hagan, "User's Manual for the UMTRIJFHWA Road Profiling (PRORUT) System." Report FHWAJRD-871043, July 1987.
[5] M. R. Hagan and M. W. Sayers, "Reference Manual for the UMTRVrmWA Road Profiling (PRORUT) System." Report FHWAIRD-871044, July 1987.
[6] M. W. Sayers and T. D. Gillespie, "The Ann Arbor Road Profilometer Meeting." Report No. FHWAIRD-861'100, April 1986,226 pp.
[7] J. Lucas and A. Viano, "Systematic Measurement of Evenness on the Road Network: High Output Longitudinal Profile Analyser." LCPC Report No. 10 1, June 1979.
[8] D. L. Huft, "South Dakota Profilometer." Transportation Research Record No. 1000, 1984.
\
[9] M. Sayers and T. D. Gillespie, "An Overview of Road Meter Operation in Measuring Pavement Roughness, with Suggested Improvements." Transportation Research Record No, 836, 1981, pp. 29 - 35.
[lo] P. B, Still and P. G. Jordan, "Evaluation of the TRRL High-Speed Profilometer." TRRL Laboratory Report 922, Crowthorne, UK, 45 pp.
[ l l ] T. D. Gillespie, M. R. Hagan, M, W. Sayers, and L. Kostyniuk, "System Design Concepts and Profilometer Correlation Program Plan." The University of Michigan Transportation Research Institute, Report No. UMTRI-84-21, May 1984,88 pp.
[12] P. W. Amberg, "The Laser Road Surface Tester." Swedish National Road & Traffic Research Institute, Report No. 255A, 1983.
[I31 Specifications for the Model 690DNC Surface Dynamics Profilometer. available from K. J. Law, Engineers, Inc., 23660 Research Drive, Farmington Hills, Michigan 48024-1089.

[14] M. W. Sayers, T. D. Gillespie, and C. A. V. Queiroz, "The International Road Roughness Experiment: Extablishing Correlation and A Calibration Standard for Measurements." World Bank Technical Paper No. 45, 1986, pp. 276 - 283.
[IS] M. W. Sayers, T. D. Gillespie, and W. D. 0. Paterson, "Guidelines for Conducting and Calibrating Road Roughness Measurements." World Bank Technical Paper No. 46, 1986, 87 pp.
[16] J. D. King and S. A. Cerwin, "System for Inventorying Road Surface Topography (SIRST)." Report No. FHWARD-821062, August 1982,269 pp.
[17] J, D. Campbell and M. W. Sayers, "An Infrared Distance Sensor, Analysis and Test Results." The University of Michigan Transportation Research Institute, Report No. UMTRI-84-14, March 1984, 114 pp.
[18] Precision Non-Contact Measurement is Simpler than You Think, Available from Selective Electronic Inc., P.O. Box 100, Valdese, N.C. 28690.
[19] W. R. Rawlinson, "The ARRB Road Geometry Instrumented Vehicle-User Manual." Australian Road Research Board, Technical Manual ATM 18, 1986, 118 pp.
