methodology for the use of alternative materials to
TRANSCRIPT

METHODOLOGY FOR THE USE OF
ALTERNATIVE MATERIALS TO DISPLACE THE PRODUCTION OF PLASTICS
Title Use of Alternative Materials to Displace the Production of Plastics
Version 1.0
Date of Issue 27 August 2021
Type Methodology
Sectoral Scope 3. Energy demand
Prepared By Carbonomics, LLC
Contact Seth Baruch
5077 Blackhawk Drive, Danville CA 94506
202-236-5253
Methodology: VCS Version 4.0
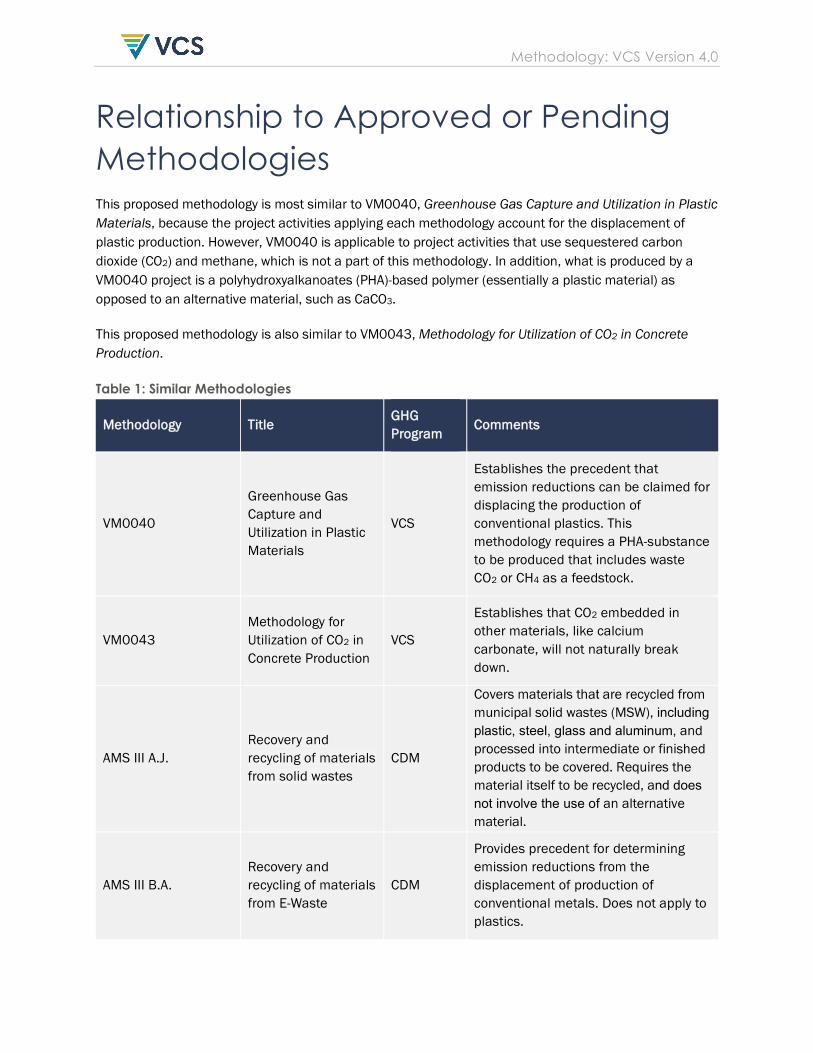
Relationship to Approved or Pending Methodologies This proposed methodology is most similar to VM0040, Greenhouse Gas Capture and Utilization in Plastic Materials, because the project activities applying each methodology account for the displacement of plastic production. However, VM0040 is applicable to project activities that use sequestered carbon dioxide (CO2) and methane, which is not a part of this methodology. In addition, what is produced by a VM0040 project is a polyhydroxyalkanoates (PHA)-based polymer (essentially a plastic material) as opposed to an alternative material, such as CaCO3.
This proposed methodology is also similar to VM0043, Methodology for Utilization of CO2 in Concrete Production.
Table 1: Similar Methodologies
Methodology Title GHG Program
Comments
VM0040
Greenhouse Gas Capture and Utilization in Plastic Materials
VCS
Establishes the precedent that emission reductions can be claimed for displacing the production of conventional plastics. This methodology requires a PHA-substance to be produced that includes waste CO2 or CH4 as a feedstock.
VM0043 Methodology for Utilization of CO2 in Concrete Production
VCS
Establishes that CO2 embedded in other materials, like calcium carbonate, will not naturally break down.
AMS III A.J. Recovery and recycling of materials from solid wastes
CDM
Covers materials that are recycled from municipal solid wastes (MSW), including plastic, steel, glass and aluminum, and processed into intermediate or finished products to be covered. Requires the material itself to be recycled, and does not involve the use of an alternative material.
AMS III B.A. Recovery and recycling of materials from E-Waste
CDM
Provides precedent for determining emission reductions from the displacement of production of conventional metals. Does not apply to plastics.
Methodology: VCS Version 4.0
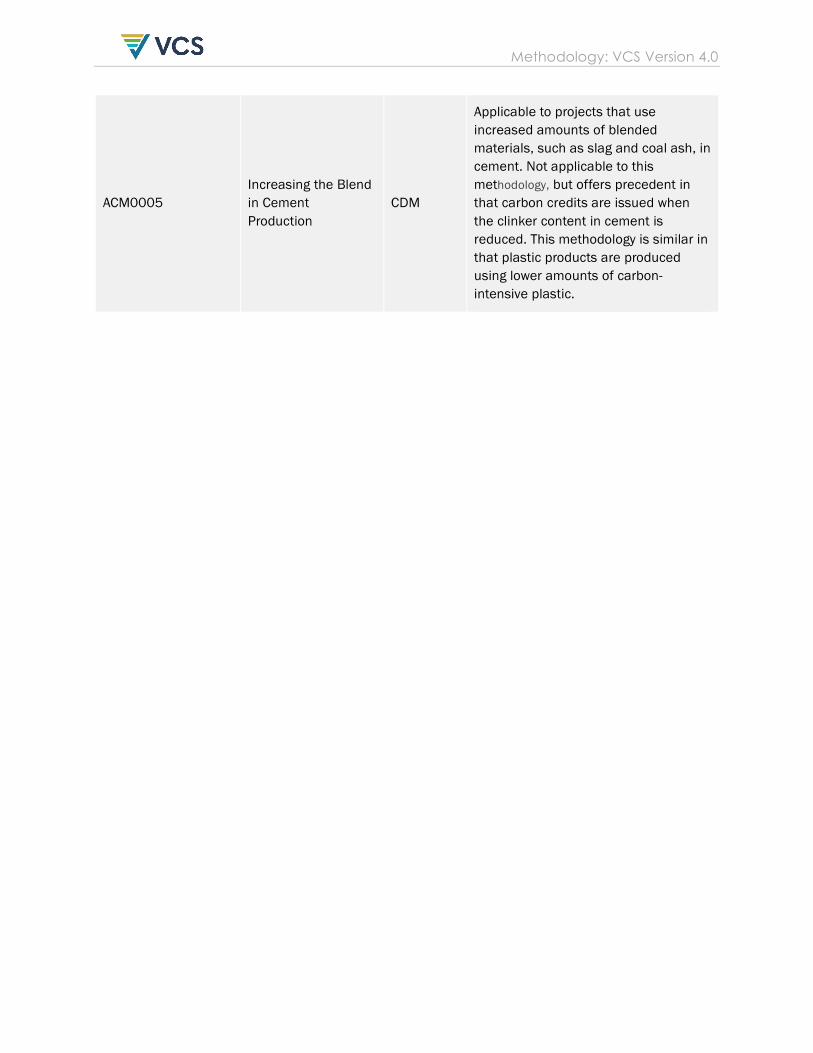
ACM0005 Increasing the Blend in Cement Production
CDM
Applicable to projects that use increased amounts of blended materials, such as slag and coal ash, in cement. Not applicable to this methodology, but offers precedent in that carbon credits are issued when the clinker content in cement is reduced. This methodology is similar in that plastic products are produced using lower amounts of carbon-intensive plastic.

Methodology: VCS Version 4.0
CONTENTS 1 SOURCES .............................................................................................................. 5
2 SUMMARY DESCRIPTION OF THE METHODOLOGY ............................................ 5
3 DEFINITIONS ......................................................................................................... 5
4 APPLICABILITY CONDITIONS .............................................................................. 6
5 PROJECT BOUNDARY .......................................................................................... 8
6 BASELINE SCENARIO ......................................................................................... 10
7 ADDITIONALITY .................................................................................................. 10
8 QUANTIFICATION OF GHG EMISSION REDUCTIONS AND REMOVALS .......... 11
8.1 Baseline Emissions ............................................................................................................. 11
8.2 Project Emissions ............................................................................................................... 12
8.3 Leakage ............................................................................................................................. 15
8.4 Net GHG Emission Reductions and Removals .............................................................. 15
9 MONITORING .................................................................................................... 16
9.1 Data and Parameters Available at Validation ............................................................ 16
9.2 Data and Parameters Monitored ................................................................................... 20
9.3 Description of the Monitoring Plan ................................................................................. 24
10 REFERENCES ....................................................................................................... 26
APPENDIX I: ACTIVITY METHOD .................................................................................. 28
APPENDIX II: EMISSION FACTORS ............................................................................... 32

Methodology: VCS Version 4.0
5
1 SOURCES This methodology is based in part on the following methodologies:
• VM0040: Methodology for Greenhouse Gas Capture and Utilization in Plastic Materials
• VM0043: Methodology for Utilization of CO2 in Concrete Production
2 SUMMARY DESCRIPTION OF THE METHODOLOGY
Additionality and Crediting Method
Additionality Activity Method
Crediting Baseline Project Method
This methodology is globally applicable to project activities that include the manufacture and sale of plastic substitutes that displace those made by conventional, petroleum-based plastics. These substitutes are made entirely or partially from alternative materials, such as calcium carbonate or seaweed, which require less fossil fuel to produce compared to conventional plastics. Alternative materials may be blended with conventional plastic polymers to produce a substitute that has the same uses and quality as conventional plastic. Alternative materials may also be used to make products that completely displace the use of conventional plastics.
3 DEFINITIONS Alternative materials Alternative materials are incorporated into plastic substitutes—products that have the same uses as conventional plastic—thereby displacing the need for such plastic. An example of an alternative material is calcium carbonate, which can be blended with conventional plastic or used alone to produce a plastic substitute. There are potentially other alternative materials, such as seaweed, that can be manufactured with a lower carbon footprint than petroleum-based plastic. Blended products Blended products are products that are made from a mixture of alternative materials and conventional plastic.

Methodology: VCS Version 4.0
6
Conventional plastic Plastic material used in products that the project activity would be displacing. Conventional plastic is typically made from petroleum-based materials. There are a number of plastic polymers, such as polypropylene (PP), polystyrene (PS), polyethylene (PE), thermoplastic urethane (TPU), acrylonitrile butadiene styrene (ABS), polycarbonate (PC) and polyethylene terephthalate (PET), each having their own emissions factor as measured in tCO2eq emitted per ton of plastic type produced.
Plastics market The plastics market refers to the companies that manufacture plastic products and the companies that buy those products. In the context of this methodology, alternative materials are used to produce products that can be sold into the plastics market in the same manner as conventional plastics. Plastic substitutes Projects applying this methodology will manufacture products that have the same functions as conventional plastic but are partially or completely made from alternative materials. These substitutes displace the production of more carbon-intensive conventional plastic. For the purposes of this methodology, a plastic substitute is a product that is either completely made from one or more alternative materials or a combination of conventional plastic and alternative material. Useful products Useful products refer to products that have a commercial use and are bought by customers who intend to use the products.
4 APPLICABILITY CONDITIONS This methodology is globally applicable to project activities that use alternative materials for the production of useful products, which generate lower GHG emissions in manufacturing than the petroleum-based plastics materials they would replace. These products could include anything that would, in the baseline scenario, be made from conventional plastics. The project activities must meet all the following criteria:
1. Production of a useful product that can displace one or more of the following conventional plastic polymers:
• Polypropylene (PP) • Polystyrene (PS) • Polyethylene (PE), including high-density and low-density polyethylene (HDPE,
LDPE) and linear low-density polyethylene (LLDPE)

Methodology: VCS Version 4.0
7
• Thermoplastic polyurethane (TPU) • Acrylonitrile butadiene styrene (ABS) • Polycarbonate (PC) • Polyethylene terephthalate (PET) • Polyvinyl Chloride (PVC)
2. Project proponents shall indicate and keep records of which type of polymer listed above is being displaced by the plastic substitute, because each polymer has a different emission factor (EF). Those records should be provided to the verifier. If no specific displaced polymer is identified, project proponents shall use the most conservative EF, as indicated in Appendix 2, which is HDPE with an EF of 1.47 tCO2eq emitted per tonne of plastic. For blended products, the project proponent shall also indicate for each plastic substitute manufactured the content of alternative material vs. conventional plastic.
3. The material produced by the project activity must be made partially or completely from an alternative material that has a lower EF than the plastic material it is displacing.
4. Project activities must produce a material used to manufacture useful products that are sold in the commercial market. The project proponent must specify what products are being sold in the market and demonstrate to the auditor that the products have in fact been sold.1
5. Evidence should be provided as to whether the alternative material in the plastic substitute will degrade over time. If the alternative material will degrade over time, the carbon content of that alternative material shall be considered released as CO2 as a project emission.
6. Data should be available in the country where the project activity is taking place that indicate the amount or percentage of plastic material in the overall solid waste stream that is incinerated. It will be assumed that these plastic substitutes are incinerated at the same percentage as traditional plastic materials, in which case any CO2 content would be released. For example, if the average incineration rate of plastic in a particular country’s solid waste stream is 20% and the alternative material is calcium carbonate (CaCO3), it will be assumed that 20% of the alternative material used in the project activity is incinerated and CO2 would be released (CaCO3 CaO + CO2).
7. The project activity will cause no greater negative environmental or social impact than the production and use of conventional petroleum-based plastics. This can be demonstrated through third-party data and analyses, including life-cycle analyses (LCA).
1 Receipts, sales records or other evidence should be provided to the VVB.

Methodology: VCS Version 4.0
8
5 PROJECT BOUNDARY As illustrated in Figure 1 below, the spatial extent of the project boundary encompasses:
• The upstream extraction of raw materials and production of alternative materials;
• The project facility that uses the alternative materials to manufacture plastic substitutes, which then enter the plastic market; and
• Petroleum extraction and the facilities where displaced conventional plastics are produced.
Figure 1. Spatial Boundary of the Project Activity
The greenhouse gases included in or excluded from the project boundary are shown in Table 2 below.

Methodology: VCS Version 4.0
9
Table 2: GHG Sources included in or excluded from the project boundary
Source Gas Included? Justification/Explanation
Base
line
GHGs from displacement of traditional plastics production
CO2 Yes
The use and combustion of fossil fuels is the primary source of emissions from the traditional process of manufacturing plastics, including the refining of raw materials and process energy for production of plastics. See Appendix II for further detail.
Note – transportation of plastic materials is not considered in either the baseline or project scenario because it is assumed that under either scenario, conventional plastics or products containing alternative materials require similar means of transport.
CH4 No Excluded for simplicity
N2O No Excluded for simplicity
Other N/A Other GHGs (HFCs, PFCs, SF6) are not used in this process.
Proj
ect
GHGs from the project facility
CO2 Yes
Use of electricity and combusted natural gas or liquid/solid fuels are the primary energy sources that would be used to power a facility producing plastic substitutes, and thus CO2 would be the primary emission from that combustion.
CH4 No Excluded for simplicity
N2O No Excluded for simplicity
Other N/A Other GHGs (HFCs, PFCs, SF6) are not used in this process.
GHGs from incineration of alternative materials
CO2 Yes Incineration of alternative material, re-releasing CO2 into the atmosphere
CH4 No Excluded for simplicity
N2O No Excluded for simplicity
Other No Other GHGs (HFCs, PFCs, SF6) are not used in this process.
Methodology: VCS Version 4.0
10
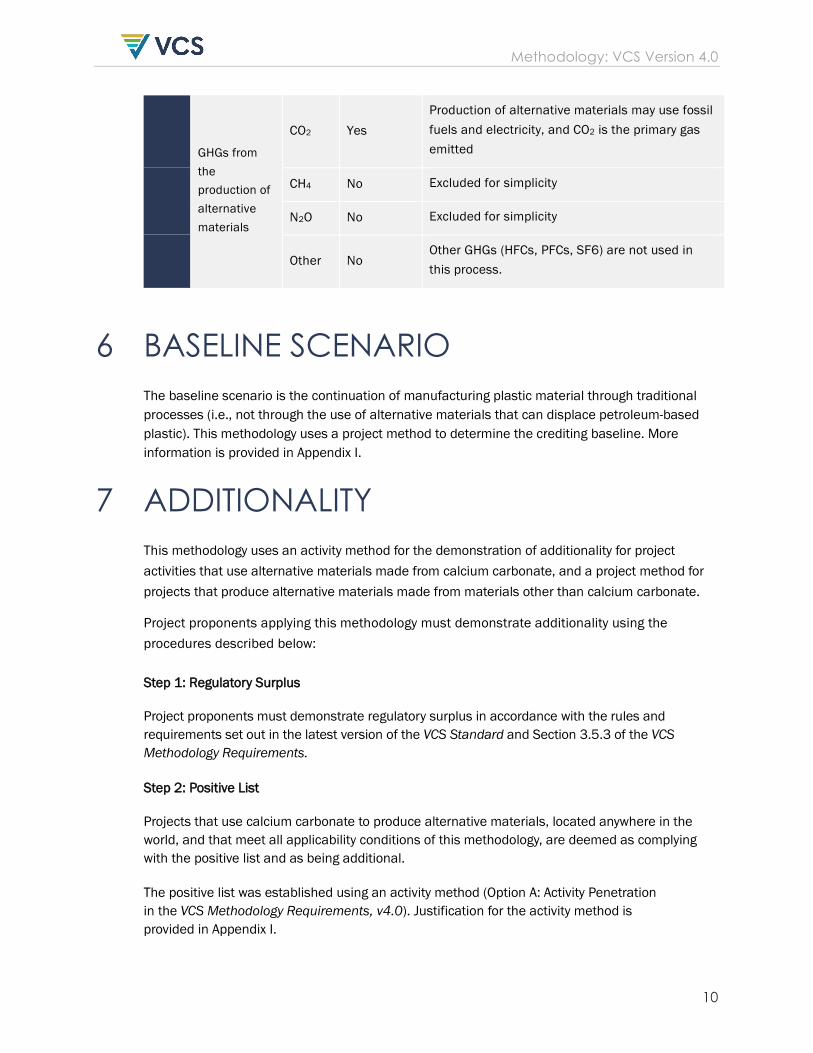
GHGs from the production of alternative materials
CO2 Yes Production of alternative materials may use fossil fuels and electricity, and CO2 is the primary gas emitted
CH4 No Excluded for simplicity
N2O No Excluded for simplicity
Other No Other GHGs (HFCs, PFCs, SF6) are not used in this process.
6 BASELINE SCENARIO The baseline scenario is the continuation of manufacturing plastic material through traditional processes (i.e., not through the use of alternative materials that can displace petroleum-based plastic). This methodology uses a project method to determine the crediting baseline. More information is provided in Appendix I.
7 ADDITIONALITY This methodology uses an activity method for the demonstration of additionality for project activities that use alternative materials made from calcium carbonate, and a project method for projects that produce alternative materials made from materials other than calcium carbonate.
Project proponents applying this methodology must demonstrate additionality using the procedures described below:
Step 1: Regulatory Surplus
Project proponents must demonstrate regulatory surplus in accordance with the rules and requirements set out in the latest version of the VCS Standard and Section 3.5.3 of the VCS Methodology Requirements.
Step 2: Positive List
Projects that use calcium carbonate to produce alternative materials, located anywhere in the world, and that meet all applicability conditions of this methodology, are deemed as complying with the positive list and as being additional.
The positive list was established using an activity method (Option A: Activity Penetration in the VCS Methodology Requirements, v4.0). Justification for the activity method is provided in Appendix I.
Methodology: VCS Version 4.0
11
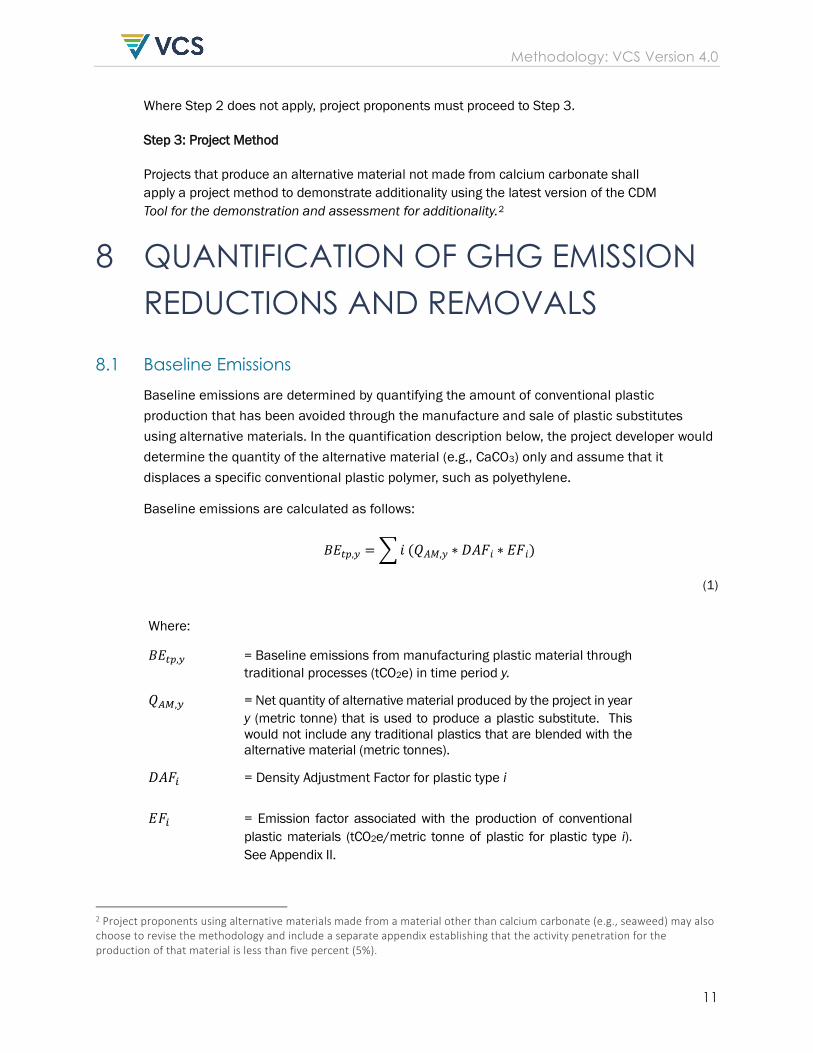
Where Step 2 does not apply, project proponents must proceed to Step 3.
Step 3: Project Method
Projects that produce an alternative material not made from calcium carbonate shall apply a project method to demonstrate additionality using the latest version of the CDM Tool for the demonstration and assessment for additionality.2
8 QUANTIFICATION OF GHG EMISSION REDUCTIONS AND REMOVALS
8.1 Baseline Emissions Baseline emissions are determined by quantifying the amount of conventional plastic production that has been avoided through the manufacture and sale of plastic substitutes using alternative materials. In the quantification description below, the project developer would determine the quantity of the alternative material (e.g., CaCO3) only and assume that it displaces a specific conventional plastic polymer, such as polyethylene.
Baseline emissions are calculated as follows:
𝐵𝐵𝐵𝐵𝑡𝑡𝑡𝑡,𝑦𝑦 = �𝑖𝑖 (𝑄𝑄𝐴𝐴𝐴𝐴,𝑦𝑦 ∗ 𝐷𝐷𝐴𝐴𝐹𝐹𝑖𝑖 ∗ 𝐵𝐵𝐹𝐹𝑖𝑖)
(1)
Where:
𝐵𝐵𝐵𝐵𝑡𝑡𝑡𝑡,𝑦𝑦 = Baseline emissions from manufacturing plastic material through traditional processes (tCO2e) in time period y.
𝑄𝑄𝐴𝐴𝐴𝐴,𝑦𝑦 = Net quantity of alternative material produced by the project in year y (metric tonne) that is used to produce a plastic substitute. This would not include any traditional plastics that are blended with the alternative material (metric tonnes).
𝐷𝐷𝐴𝐴𝐹𝐹𝑖𝑖 = Density Adjustment Factor for plastic type i
𝐵𝐵𝐹𝐹𝑖𝑖 = Emission factor associated with the production of conventional plastic materials (tCO2e/metric tonne of plastic for plastic type i). See Appendix II.
2 Project proponents using alternative materials made from a material other than calcium carbonate (e.g., seaweed) may also choose to revise the methodology and include a separate appendix establishing that the activity penetration for the production of that material is less than five percent (5%).
Methodology: VCS Version 4.0
12
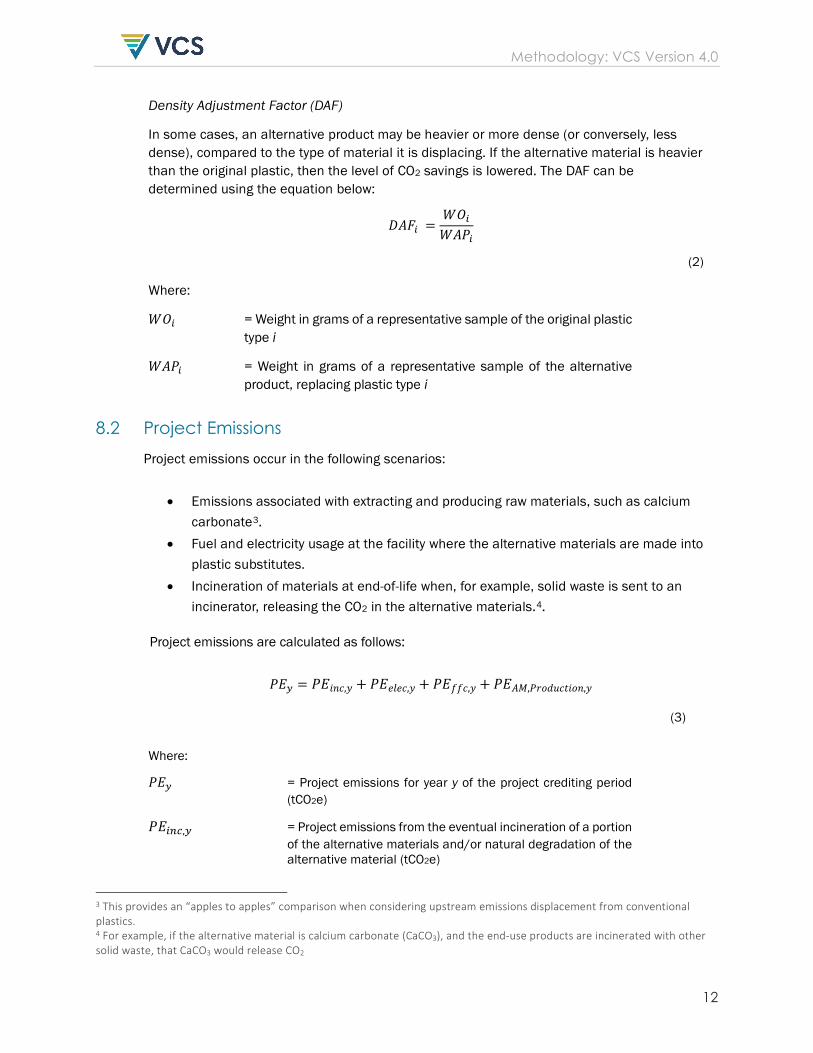
Density Adjustment Factor (DAF)
In some cases, an alternative product may be heavier or more dense (or conversely, less dense), compared to the type of material it is displacing. If the alternative material is heavier than the original plastic, then the level of CO2 savings is lowered. The DAF can be determined using the equation below:
𝐷𝐷𝐴𝐴𝐹𝐹𝑖𝑖 =𝑊𝑊𝑂𝑂𝑖𝑖𝑊𝑊𝐴𝐴𝑃𝑃𝑖𝑖
(2)
Where:
𝑊𝑊𝑂𝑂𝑖𝑖 = Weight in grams of a representative sample of the original plastic type i
𝑊𝑊𝐴𝐴𝑃𝑃𝑖𝑖 = Weight in grams of a representative sample of the alternative product, replacing plastic type i
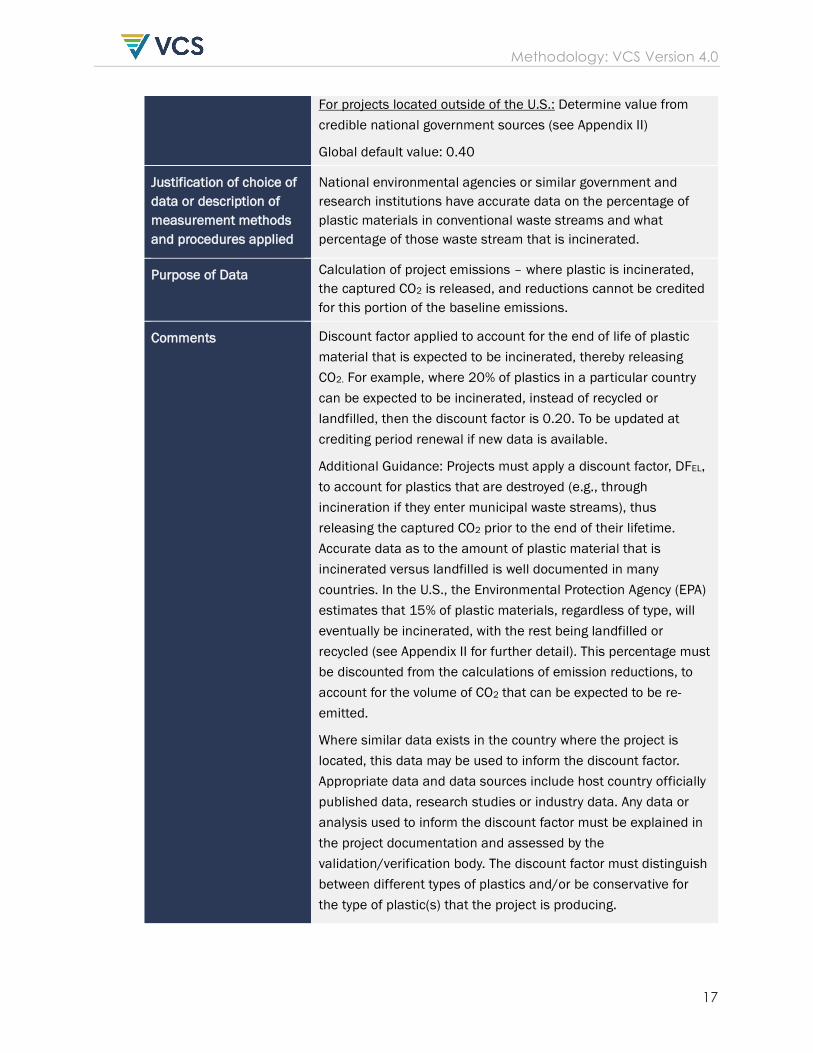
8.2 Project Emissions Project emissions occur in the following scenarios:
• Emissions associated with extracting and producing raw materials, such as calcium
carbonate3. • Fuel and electricity usage at the facility where the alternative materials are made into
plastic substitutes. • Incineration of materials at end-of-life when, for example, solid waste is sent to an
incinerator, releasing the CO2 in the alternative materials.4. Project emissions are calculated as follows:
𝑃𝑃𝐵𝐵𝑦𝑦 = 𝑃𝑃𝐵𝐵𝑖𝑖𝑖𝑖𝑖𝑖,𝑦𝑦 + 𝑃𝑃𝐵𝐵𝑒𝑒𝑒𝑒𝑒𝑒𝑖𝑖,𝑦𝑦 + 𝑃𝑃𝐵𝐵𝑓𝑓𝑓𝑓𝑖𝑖,𝑦𝑦 + 𝑃𝑃𝐵𝐵𝐴𝐴𝐴𝐴,𝑃𝑃𝑃𝑃𝑃𝑃𝑃𝑃𝑃𝑃𝑖𝑖𝑃𝑃𝑖𝑖𝑃𝑃𝑖𝑖,𝑦𝑦
(3)
Where:
𝑃𝑃𝐵𝐵𝑦𝑦 = Project emissions for year y of the project crediting period (tCO2e)
𝑃𝑃𝐵𝐵𝑖𝑖𝑖𝑖𝑖𝑖,𝑦𝑦 = Project emissions from the eventual incineration of a portion of the alternative materials and/or natural degradation of the alternative material (tCO2e)
3 This provides an “apples to apples” comparison when considering upstream emissions displacement from conventional plastics. 4 For example, if the alternative material is calcium carbonate (CaCO3), and the end-use products are incinerated with other solid waste, that CaCO3 would release CO2

Methodology: VCS Version 4.0
13
𝑃𝑃𝐵𝐵𝑒𝑒𝑒𝑒𝑒𝑒𝑖𝑖,𝑦𝑦 = Project emissions from the use of electricity at the facility producing the plastic substitutes (tCO2e)
𝑃𝑃𝐵𝐵𝑓𝑓𝑓𝑓𝑖𝑖,𝑦𝑦 = Project emissions from the combustion of fossil fuels at the facility producing the plastic substitutes (tCO2e)
𝑃𝑃𝐵𝐵𝐴𝐴𝐴𝐴,𝑃𝑃𝑃𝑃𝑃𝑃𝑃𝑃𝑃𝑃𝑖𝑖𝑡𝑡𝑖𝑖𝑃𝑃𝑖𝑖,𝑦𝑦 = Project emissions from the production of the alternative material/raw material (tCO2e)
Project emissions from incineration are calculated as follows:
𝑃𝑃𝐵𝐵𝑖𝑖𝑖𝑖𝑖𝑖,𝑦𝑦 = 𝑄𝑄𝐴𝐴𝐴𝐴,𝑦𝑦 ∗ 𝑅𝑅𝐶𝐶𝑂𝑂2𝑃𝑃𝑒𝑒𝑒𝑒𝑒𝑒𝑟𝑟𝑟𝑟𝑒𝑒𝑃𝑃,𝑦𝑦 ∗ 𝐷𝐷𝐹𝐹𝐸𝐸𝐸𝐸
(4)
𝑃𝑃𝐵𝐵𝑖𝑖𝑖𝑖𝑖𝑖,𝑦𝑦 = Project emissions from the eventual incineration of a portion of plastic, which are then re-emitted (tCO2e). This would also include the natural degradation of the alternative material after disposal5.
𝑄𝑄𝐴𝐴𝐴𝐴,𝑦𝑦 = Net quantity of alternative material produced by the project in year y
(metric tonne).
𝑅𝑅𝐶𝐶𝑂𝑂2𝑃𝑃𝑒𝑒𝑒𝑒𝑒𝑒𝑟𝑟𝑟𝑟𝑒𝑒𝑃𝑃,𝑦𝑦 = Ratio of CO2 released when the alternative material is incinerated in year y to produce plastic material i by the project (metric tonnes per year)6.
𝐷𝐷𝐹𝐹𝐸𝐸𝐸𝐸 = Discount factor applied for volume of end-of-life plastic material that can be expected to be incinerated (in VM0040 for the US, this figure is 15%, meaning that it is expected that 15% of all plastic material will be incinerated. This figure came from detailed analysis of the EPA Waste Reduction Model). More details is provided in Appendix II.
Project emissions from the use of electricity at the project production facility are calculated as follows:
𝑃𝑃𝐵𝐵𝑒𝑒𝑒𝑒𝑒𝑒𝑖𝑖,𝑦𝑦 = 𝑄𝑄𝑒𝑒𝑒𝑒𝑒𝑒𝑖𝑖,𝑦𝑦 ∗ 𝐵𝐵𝐹𝐹𝑒𝑒𝑒𝑒𝑒𝑒𝑖𝑖
(5)
5 The project developer should indicate at validation whether the alternative material is likely to degrade over time, after disposal, and thus assume any CO2 contained in the alternative material – or CO2 that can be formed as a result of the degradation of the alternative material – is considered a project emission. For example, calcium carbonate would not normally degrade naturally, but other alternative materials might. 6 For example, for CaCO3, one CO2 molecule would be released when one CaCO3 molecule is destroyed through incineration: CaCO3 CaO + CO2. The project developer shall provide the molecular formula. In this example, one ton of CaCO3 incinerated would release one ton of CO2, and the ratio is 1:1.

Methodology: VCS Version 4.0
14
Where:
𝑃𝑃𝐵𝐵𝑒𝑒𝑒𝑒𝑒𝑒𝑖𝑖,𝑦𝑦 = Project emissions from the use of electricity at the facility in year y (tCO2e)
𝑄𝑄𝑒𝑒𝑒𝑒𝑒𝑒𝑖𝑖,𝑦𝑦 = Quantity of electricity from the grid in year y used to power the project production facility in year y (MWH)
𝐵𝐵𝐹𝐹𝑒𝑒𝑒𝑒𝑒𝑒𝑖𝑖 = Emissions intensity of the electricity in tCO2/MWH.
Project emissions from the combustion of fossil fuels at the project production facility are calculated as follows:
𝑃𝑃𝐵𝐵𝑓𝑓𝑓𝑓𝑖𝑖,𝑦𝑦 = 𝑄𝑄𝑓𝑓𝑓𝑓,𝑦𝑦 ∗ 𝐹𝐹𝐹𝐹𝑟𝑟 ∗ 𝐵𝐵𝐹𝐹𝑟𝑟
(6)
Where:
𝑃𝑃𝐵𝐵𝑓𝑓𝑓𝑓𝑖𝑖,𝑦𝑦 = Project emissions from the combustion of fossil fuel in year y (tCO2e)
𝑄𝑄𝑓𝑓𝑓𝑓,𝑦𝑦 = Quantity of fossil fuel used in year y (metric tonnes)
𝐹𝐹𝐹𝐹𝑟𝑟 = Energy content of fuel type a (terajoule or TJ).
𝐵𝐵𝐹𝐹𝑟𝑟 = Emission factor of fuel a (tCO2e/TJ).
Project emissions from the production of the alternative material/raw material are calculated as follows:
𝑃𝑃𝐵𝐵𝐴𝐴𝐴𝐴,𝑃𝑃𝑃𝑃𝑃𝑃𝑃𝑃𝑃𝑃𝑖𝑖𝑡𝑡𝑖𝑖𝑃𝑃𝑖𝑖,𝑦𝑦 = 𝑄𝑄𝐴𝐴𝐴𝐴,𝑦𝑦 ∗ 𝐵𝐵𝐹𝐹𝐴𝐴𝐴𝐴
(7)
Where:
𝑄𝑄𝐴𝐴𝐴𝐴,𝑦𝑦 = Net quantity of alternative material produced by the project in year y (metric tonne).
𝐵𝐵𝐹𝐹𝐴𝐴𝐴𝐴 = Emissions factor for producing one ton of alternative material in tCO2eq/ton of material produced. This can be based on data from the supplier or through a third-party lifecycle analysis (see monitoring table).

Methodology: VCS Version 4.0
15
8.3 Leakage
Leakage is defined as GHG emissions that occur not as a result of the project activity itself, but which take place outside the project boundary. In this case, the project activity is the production of alternative materials to displace traditional plastic products. A potential source of leakage could be the extraction of raw materials to make the plastic substitutes and other upstream emissions; however, this is considered in the project emissions calculation (Eq. 7). It is assumed that the end-of-life process is similar to any other plastic material (e.g., landfill, incineration), and those potential emissions are also considered. In some cases, leakage is considered when the project activity causes a change in practice somewhere else in the market that might increase GHG emissions. For example, could the use of an alternative material push something else out of the market that has an even lower carbon footprint? In the case of this project activity, what is being displaced is solely plastic material, and the vast majority of these products are made with petroleum-based plastics, and thus leakage does not have to be considered in this methodology.
8.4 Net GHG Emission Reductions and Removals
Net GHG emission reductions and removals are calculated as follows:
𝐵𝐵𝑅𝑅𝑦𝑦 = 𝐵𝐵𝐵𝐵𝑦𝑦 − 𝑃𝑃𝐵𝐵𝑦𝑦 − 𝐿𝐿𝐵𝐵𝑦𝑦
(8)
Where:
𝐵𝐵𝑅𝑅𝑦𝑦 = Net GHG emissions reductions and removals in year y (tCO2e)
𝐵𝐵𝐵𝐵𝑦𝑦 = Baseline emissions in year y (tCO2e)
𝑃𝑃𝐵𝐵𝑦𝑦 = Project emissions in year y (tCO2e)
𝐿𝐿𝐵𝐵𝑦𝑦 = Leakage in year y (tCO2e)

Methodology: VCS Version 4.0
16
9 MONITORING
9.1 Data and Parameters Available at Validation
Data / Parameter 𝐵𝐵𝐹𝐹𝑖𝑖
Data unit tCO2e/metric tonne of plastic material type i produced
Description Emission factor for GHGs caused by the production of virgin plastic materials in tCO2e/metric tonne of plastic material
Equation 1
Source of data Use values from credible international or national government sources, such as the U.S. EPA (see Appendix II for more information on the data used to calculate this variable in the U.S.).
Value applied See Appendix II
Justification of choice of data or description of measurement methods and procedures applied
National environmental agencies or similar government and research institutions have accurate data on energy requirements for each segment of the plastic production process, including raw materials extraction and the production process itself.
To be updated at crediting period renewal if new data is available.
Purpose of Data Calculation of baseline emissions
Comments N/A
Data / Parameter 𝐷𝐷𝐹𝐹𝐸𝐸𝐸𝐸
Data unit Unitless
Description Discount factor applied to account for the end of life of plastic material that is incinerated, releasing CO2
Equation 1
Source of data U.S. EPA or similar source in other countries (see Appendix II)
Value applied For projects located in the U.S.: 0.15
Methodology: VCS Version 4.0
17
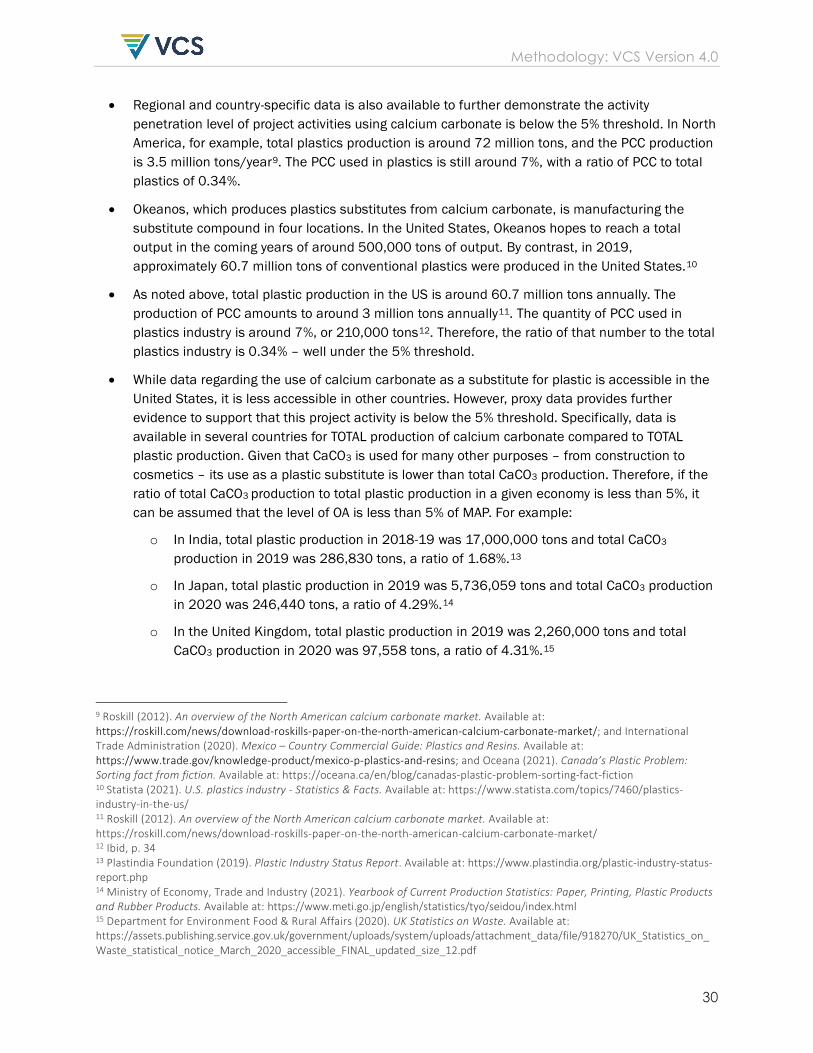
For projects located outside of the U.S.: Determine value from credible national government sources (see Appendix II)
Global default value: 0.40
Justification of choice of data or description of measurement methods and procedures applied
National environmental agencies or similar government and research institutions have accurate data on the percentage of plastic materials in conventional waste streams and what percentage of those waste stream that is incinerated.
Purpose of Data Calculation of project emissions – where plastic is incinerated, the captured CO2 is released, and reductions cannot be credited for this portion of the baseline emissions.
Comments Discount factor applied to account for the end of life of plastic material that is expected to be incinerated, thereby releasing CO2. For example, where 20% of plastics in a particular country can be expected to be incinerated, instead of recycled or landfilled, then the discount factor is 0.20. To be updated at crediting period renewal if new data is available.
Additional Guidance: Projects must apply a discount factor, DFEL, to account for plastics that are destroyed (e.g., through incineration if they enter municipal waste streams), thus releasing the captured CO2 prior to the end of their lifetime. Accurate data as to the amount of plastic material that is incinerated versus landfilled is well documented in many countries. In the U.S., the Environmental Protection Agency (EPA) estimates that 15% of plastic materials, regardless of type, will eventually be incinerated, with the rest being landfilled or recycled (see Appendix II for further detail). This percentage must be discounted from the calculations of emission reductions, to account for the volume of CO2 that can be expected to be re-emitted.
Where similar data exists in the country where the project is located, this data may be used to inform the discount factor. Appropriate data and data sources include host country officially published data, research studies or industry data. Any data or analysis used to inform the discount factor must be explained in the project documentation and assessed by the validation/verification body. The discount factor must distinguish between different types of plastics and/or be conservative for the type of plastic(s) that the project is producing.

Methodology: VCS Version 4.0
18
Where no similar data exists in the country where the project is located, a conservative global default factor may be used, as set out in Appendix II.
Data / Parameter 𝑅𝑅𝐶𝐶𝑂𝑂2𝑃𝑃𝑒𝑒𝑒𝑒𝑒𝑒𝑟𝑟𝑟𝑟𝑒𝑒𝑃𝑃,𝑦𝑦
Data unit Unitless
Description Ratio of how much alternative material is required to displace one mass unit of conventional plastics
Equation 4
Source of data Project proponent
Value applied N/A
Justification of choice of data or description of measurement methods and procedures applied
Ratio of CO2 released when the alternative material is incinerated in year y to produce plastic material i by the project (metric tonnes per year). For example, for CaCO3, one CO2 molecule would be released when one CaCO3 molecule is destroyed through incineration: CaCO3 CaO + CO2. The project developer shall provide the molecular formula. In this example, one tonne of CaCO3 incinerated would release one tonne of CO2, and the ratio is 1:1.
Purpose of Data Calculation of project emissions
Comments N/A
Data / Parameter 𝐹𝐹𝐹𝐹𝑟𝑟
Data unit tCO2e/TJ
Description Emission factor of fuel type a
Equation 6
Source of data IPCC
Value applied The IPCC Guidelines for National Greenhouse Gas Inventories is internationally recognized and the data provided in the guidelines is peer reviewed.

Methodology: VCS Version 4.0
19
Justification of choice of data or description of measurement methods and procedures applied
Project proponent shall provide analysis to the auditor as to how much alternative material is required to displace a mass unit of conventional plastic
Purpose of Data Calculation of project emissions
Comments N/A
Data / Parameter 𝐵𝐵𝐹𝐹𝑟𝑟
Data unit TJ
Description Energy content per unit of fuel type a
Equation 6
Source of data IPCC
Value applied The IPCC Guidelines for National Greenhouse Gas Inventories is internationally recognized and the data provided in the guidelines is peer reviewed.
Justification of choice of data or description of measurement methods and procedures applied
Project proponent shall provide analysis to the auditor as to how much alternative material is required to displace a mass unit of conventional plastic
Purpose of Data Calculation of project emissions
Comments N/A
Data / Parameter 𝐵𝐵𝐹𝐹𝐴𝐴𝐴𝐴
Data unit tCO2eq/ton of alternative material produced
Description Emission factor for producing one tonne of alternative material.
Equation 7
Source of data Project proponent should provide evidence either through data from the supplier of the alternative material and/or through an independent life cycle analysis.

Methodology: VCS Version 4.0
20
Value applied N/A
Justification of choice of data or description of measurement methods and procedures applied
Data should be transparent and the sources of the data – the alternative material supplier(s) for example – should be available for assessment and/or an interview by the auditor. If a third-party life cycle analysis of the upstream emissions associated with the processing of alternative materials is used to justify the EFAM, then that third party should be available to the auditor as well. Note that the transportation of alternative materials does not need to be included in this analysis, because as indicated in Appendix II, the transportation of conventional plastics is not incorporated into that emission factor.
Purpose of Data Calculation of project emissions
Comments N/A
9.2 Data and Parameters Monitored
Data / Parameter 𝑄𝑄𝐴𝐴𝐴𝐴,𝑦𝑦
Data unit Metric tonnes
Description Quantity of alternative materials produced by the project used in plastic substitutes, which displace conventional plastic
Equation 1, 4 and 7
Source of data Project proponent
Description of measurement methods and procedures to be applied
The quantity of alternative materials used in plastic substitutes must be weighed on scales that have available calibration procedures from the manufacturer.
Frequency of monitoring/recording
Continuous and reported daily
QA/QC procedures to be applied
Calibration of scales must be conducted according to the equipment manufacturer’s specifications.
Purpose of data Calculation of baseline and project emissions
Calculation method N/A
Comments N/A

Methodology: VCS Version 4.0
21
Data / Parameter 𝑊𝑊𝑂𝑂𝑖𝑖
Data unit Grams
Description Weight in grams of a representative sample of the original plastic type i
Equation 2
Source of data Project proponent
Description of measurement methods and procedures to be applied
The project proponent will weigh a sample of the original plastic that is being displaced by the project activity.
Frequency of monitoring/recording
Once during the crediting period.
QA/QC procedures to be applied
Calibration of scales must be conducted according to the equipment manufacturer’s specifications. Alternatively, the sample can be weighed on two scales.
Purpose of data Calculation of baseline emissions
Calculation method N/A
Comments N/A
Data / Parameter 𝑊𝑊𝐴𝐴𝑃𝑃𝑖𝑖
Data unit Grams
Description Weight in grams of a representative sample of the alternative product that displaces plastic type i
Equation 2
Source of data Project proponent
Description of measurement methods and procedures to be applied
The project proponent will weigh a sample of the alternative product that is being produced by the project activity. The sample will be the same dimensions as the WOi sample.

Methodology: VCS Version 4.0
22
Frequency of monitoring/recording
Once during the crediting period.
QA/QC procedures to be applied
Calibration of scales must be conducted according to the equipment manufacturer’s specifications. Alternatively, the sample can be weighed on two scales.
Purpose of data Calculation of baseline emissions
Calculation method N/A
Comments N/A
Data / Parameter: 𝑄𝑄𝑒𝑒𝑒𝑒𝑒𝑒𝑖𝑖,𝑦𝑦
Data unit MWH
Description Quantity of electricity used by project facility supplied by the grid in year y
Equation 5
Source of data Project proponent
Description of measurement methods and procedures to be applied
Use calibrated electricity meters. Calibration must be conducted according to the equipment manufacturer’s specifications. Alternatively, utility billing data can be used.
Frequency of monitoring/recording
Data must be monitored continuously and recorded on at least a daily basis. If utility data is used, monthly bills are acceptable
QA/QC procedures to be applied
The consistency of metered electricity generation should be cross checked with receipts from electricity purchases where applicable
Purpose of data Calculation of baseline emissions
Calculation method N/A
Comments N/A

Methodology: VCS Version 4.0
23
Data / Parameter 𝐵𝐵𝐹𝐹𝑒𝑒𝑒𝑒𝑒𝑒𝑖𝑖
Data unit tCO2e/MWH
Description Emission intensity of electricity
Equation 5
Source of data US eGrid or utility data or similar source if the project is located outside of the US.
Description of measurement methods and procedures to be applied
In developing countries, project proponents may use the “Tool to calculate the emission factor for an electricity system” to calculate this parameter.
In the US, eGrid emissions factor for the sub-region where the facility is located may be used. Project proponents shall use the latest available information.
Frequency of monitoring/recording
Annual
QA/QC procedures to be applied
Following “Tool to calculate the emission factor for an electricity system”
Purpose of data Calculation of project emissions
Calculation method N/A
Comments N/A
Data / Parameter 𝑄𝑄𝑓𝑓𝑓𝑓,𝑦𝑦
Data unit Gallons (oil fuels), cubic meters (natural gas), metric tonnes (solid fuels)
Description Quantity of fossil fuel used by the project facility in year y
Equation 6
Source of data Measurements at project facility
Description of measurement methods and procedures to be applied
Use calibrated flow or gas meters. Calibration must be conducted according to the equipment manufacturer’s specifications.

Methodology: VCS Version 4.0
24
Frequency of monitoring/recording
Data must be monitored and recorded monthly.
QA/QC procedures to be applied
The consistency of metered fuel use should be cross checked with receipts from fuel suppliers, where applicable
Purpose of data Calculation of project emissions
Calculation method N/A
Comments N/A
9.3 Description of the Monitoring Plan The project proponent must establish, maintain and apply a monitoring plan and GHG information system that includes criteria and procedures for obtaining, recording, compiling and analyzing data, parameters and other information important for quantifying and reporting GHG emissions relevant for the project and baseline scenarios. Monitoring procedures must address the following:
• Types of data and information to be reported;
• Units of measurement;
• Origin of the data;
• Monitoring methodologies (e.g., estimation, modeling, measurement and calculation);
• Type of equipment used;
• Monitoring times and frequencies;
• QA/QC procedures;
• Monitoring roles and responsibilities, including experience and training requirements; and
• GHG information management systems, including the location, back up, and retention of stored data.
Where measurement and monitoring equipment is used, the project proponent must ensure the equipment is calibrated according to current good practice (e.g., relevant industry standards).
All data collected as part of monitoring must be archived electronically and kept at least for 2 years after the end of the last project crediting period. QA/QC procedures must include, but are not limited to:

Methodology: VCS Version 4.0
25
• Data gathering, input and handling measures;
• Input data checked for typical errors, including inconsistent physical units, unit conversion errors;
• Typographical errors caused by data transcription from one document to another, and missing data for specific time periods or physical units;
• Input time series data checked for large unexpected variations (e.g., orders of magnitude) that could indicate input errors;
• All electronic files to use version control to ensure consistency;
• Physical protection of monitoring equipment;
• Physical protection of records of monitored data (e.g., hard copy and electronic records);
• Input data units checked and documented; and
• All sources of data, assumptions and emission factors documented.

Methodology: VCS Version 4.0
26
10 REFERENCES Blitz Co. (2021). Precipitated Calcium Carbonate. Available at: https://blitzco.de/
City of Winnipeg (2012). Emission Factors in kg CO2-Equivalent per Unit. Available at: https://www.winnipeg.ca/finance/findata/matmgt/documents/2012/682-2012/682-2012_Appendix_H-WSTP_South_End_Plant_Process_Selection_Report/Appendix%207.pdf
Department for Environment Food & Rural Affairs (2020). UK Statistics on Waste. Available at: https://assets.publishing.service.gov.uk/government/uploads/system/uploads/attachment_data/file/918270/UK_Statistics_on_Waste_statistical_notice_March_2020_accessible_FINAL_updated_size_12.pdf
Government of India Ministry of Chemicals & Fertilizers (2021). Annual Report. Available at: https://chemicals.nic.in/sites/default/files/Annual_Report_2021.pdf
Ministry of Economy, Trade and Industry (2021). Yearbook of Current Production Statistics: Paper, Printing, Plastic Products and Rubber Products. Available at: https://www.meti.go.jp/english/statistics/tyo/seidou/index.html
Office for National Statistics (2020). UK Manufacturers’ Sales by Product Survey. Available at: https://www.ons.gov.uk/businessindustryandtrade/manufacturingandproductionindustry/datasets/ukmanufacturerssalesbyproductprodcom
Plastics Europe (2015). Plastics–The Facts 2014: An Analysis of European Plastics Production, Demand and Waste Data. Available at: https://www.plasticseurope.org/application/files/5515/1689/9220/2014plastics_the_facts_PubFeb2015.pdf
Plastindia Foundation (2019). Plastic Industry Status Report. Available at: https://www.plastindia.org/plastic-industry-status-report.php
Roskill Information Services (2012). An Overview of the North American Calcium Carbonate Market.
Roskill Information Services (2012). Ground & Precipitated Calcium Carbonate: Global Industry, Markets & Outlook. Available at: https://roskill.com/market-report/ground-precipitated-calcium-carbonate/
Sezer, Nurettin (2013). Production of Precipitated Calcium Carbonate from Marble Wastes. Available at: https://etd.lib.metu.edu.tr/upload/12616347/index.pdf
Statista (2020). Production volume of precipitated calcium carbonate in Japan from 2012 to 2019. Available at: https://www.statista.com/statistics/731746/japan-precipitated-calcium-carbonate-production-volume/
Statista (2021). U.S. plastics industry - Statistics & Facts. Available at: https://www.statista.com/topics/7460/plastics-industry-in-the-us/

Methodology: VCS Version 4.0
27
Statista (2021). Annual Production of Plastic Worldwide 2020. Available at: https://www-statista-com.marshall.idm.oclc.org/statistics/282732/global-production-of-plastics-since-1950/
U.S. Environmental Protection Agency Office of Resource Conservation and Recovery (2020). Documentation for Greenhouse Gas Emission and Energy Factors Used in the Waste Reduction Model (WARM): Containers, Packaging, and Non-Durable Good Materials Chapters. Available at: https://www.epa.gov/sites/production/files/2020-12/documents/warm_containers_packaging_and_non-durable_goods_materials_v15_10-29-2020.pdf
U.S. Environmental Protection Agency (2016). Advancing Sustainable Materials Management: 2014 Fact Sheet Assessing Trends in Material Generation, Recycling, Composting, Combustion with Energy Recovery and Landfilling in the United States. Available at: https://www.epa.gov/sites/production/files/2016-11/documents/2014_smmfactsheet_508.pdf

Methodology: VCS Version 4.0
28
APPENDIX I: ACTIVITY METHOD Background
• The development of alternatives to plastics has been slow to develop. Part of the problem has been the low cost of virgin plastic, which has become even more significant due to pervasive low oil prices and an explosion of hydraulic fracturing. A number of commentators have stated that it is cheaper to produce new plastic than recycle existing plastic. This is particularly an issue for plastic substitutes that are usually more expensive and, in some cases, slightly heavier. Plastic has the advantage of being very light and durable, despite the negative publicity around plastic pollution and microplastics. The trend of plastics consumption continues to go upward7.
• Numerous studies have highlighted the barriers to alternatives to petroleum-based plastics.8 Among the barriers cited are the higher cost of plastics alternatives, customer demand, and hesitancy among large-scale users of plastic materials to switch away from what they know customers accept. This has been a barrier in the adoption of Okeanos’ products, which are made from calcium carbonate. In addition, studies cite a lack of manufacturing facilities to produce alternatives at scale, a lack of financial support to develop alternatives (which contribute to the higher cost) and lack of government incentives.
• In addition, it should be noted that as of the writing of this methodology, Okeanos’ technology – the use of calcium carbonate as a substitute for conventional plastic – has been available for more than three years, demonstrating that while the project is commercially available at a modest scale, its growth has been limited – indicating barriers to penetration in the wider market.
• The activity penetration option requires that the total amount of plastic production from this alternative does not amount to more than five percent (5%) of total plastic production worldwide. Activity penetration is equal to: Observed Activity (OA) divided by the Maximum Adoption Potential (MAP).
Determining the Activity Penetration Level Globally and in Individual Countries
• Examining more granular information to better refine the overall analysis reinforces the low penetration rate of the project activity. There are two main types of calcium carbonate, Precipitated Calcium Carbonate (PCC), and Ground Calcium Carbonate (GCC). PCC is a finely ground version of the stone used in multiple industries including the paper, paint, rubber, cosmetics, and plastics industries. GCC is more commonly used in the construction industry. GCC has a wide range of particle sizes, and PCC has a much smaller particle size range – and is the only form of CaCO3 used in the proposed project activity.
7 Statista (2021). Annual production of plastics worldwide from 1950 to 2020. Available at: https://www.statista.com/statistics/282732/global-production-of-plastics-since-1950/ 8 Vimal, K. et al (2020). Analysis of barriers that impede the elimination of single-use plastic in developing economy context. Journal of Cleaner Production. Available at: https://doi.org/10.1016/j.jclepro.2020.122629 and Senechal, K. (2018). Barriers to the Elimination of Plastic in Single Use Beverage Containers in Byron Bay, NSW. School for International Training. Available at: https://digitalcollections.sit.edu/isp_collection/2851/

Methodology: VCS Version 4.0
29
• On the global level, breakdown of PCC and GCC data is available, as indicated in the following table, which shows the levels of penetration of PCC in the plastics industry (and the reference sources):
Table 3: GHG Sources Included In or Excluded From the Project Boundary
1. Global Plastics Production 370 million tons
2. Global Plastic Production in the Packaging Industry
78 million tons
3. Global CaCO3 Production (GCC & PCC) 120.5 million tons
4. Global PCC Consumption 14 million tons
5. PCC Global Consumption rate in the Plastic Industry
5%
6. Amount of PCC used in the Plastic industry
14M tons * 5% = 0.7 million tons
7. Percentage of PCC used in the Global Plastic Industry to global plastic production
0.7M tons / 370M tons = 0.19%
8. Percentage of PCC used in the Global Plastic Packaging Industry to global plastic packaging production
0.7M tons) / 78M tons = 0.90%
Sources:
1. Statista (2021). Annual Production of Plastic Worldwide 2020. Available at: https://www-statista-com.marshall.idm.oclc.org/statistics/282732/global-production-of-plastics-since-1950/
2. Ma, Xuezi, et al. (2020). Factors for eliminating plastic in packaging: The European FMCG experts’ view. Journal of Cleaner Production. 256. Available at: https://doi.org/10.1016/j.jclepro.2020.120492
3. Grand View Research (2021). Calcium Carbonate Market Size, Share & Trends Analysis Report. Available at: https://www.grandviewresearch.com/industry-analysis/calcium-carbonate-market and Markets and Markets (2021). Calcium Carbonate Market. Available at: https://www.marketsandmarkets.com/Market-Reports/calcium-carbonate-market-86344547.html
4. Sezer, Nurettin (2013). Production of Precipitated Calcium Carbonate from Marble Wastes. Available at: https://etd.lib.metu.edu.tr/upload/12616347/index.pdf and Roskill Information Services (2012). Ground & Precipitated Calcium Carbonate: Global Industry, Markets & Outlook. Available at: https://roskill.com/market-report/ground-precipitated-calcium-carbonate/
5. Sezer, Nurettin (2013). Production of Precipitated Calcium Carbonate from Marble Wastes. Available at: https://etd.lib.metu.edu.tr/upload/12616347/index.pdf and Blitz Co. (2021). Precipitated Calcium Carbonate. Available at: https://blitzco.de and Roskill Information Services (2012). Ground & Precipitated Calcium Carbonate: Global Industry, Markets & Outlook. Available at: https://roskill.com/market-report/ground-precipitated-calcium-carbonate/
Methodology: VCS Version 4.0
30
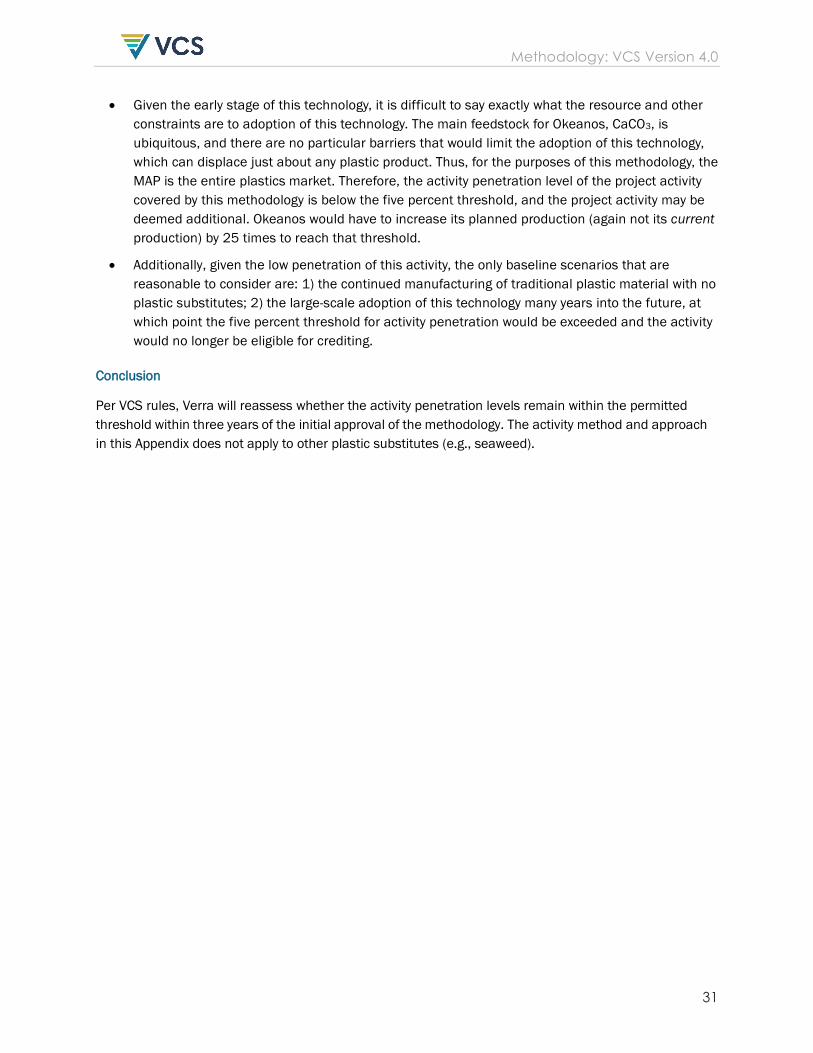
• Regional and country-specific data is also available to further demonstrate the activity penetration level of project activities using calcium carbonate is below the 5% threshold. In North America, for example, total plastics production is around 72 million tons, and the PCC production is 3.5 million tons/year9. The PCC used in plastics is still around 7%, with a ratio of PCC to total plastics of 0.34%.
• Okeanos, which produces plastics substitutes from calcium carbonate, is manufacturing the substitute compound in four locations. In the United States, Okeanos hopes to reach a total output in the coming years of around 500,000 tons of output. By contrast, in 2019, approximately 60.7 million tons of conventional plastics were produced in the United States.10
• As noted above, total plastic production in the US is around 60.7 million tons annually. The production of PCC amounts to around 3 million tons annually11. The quantity of PCC used in plastics industry is around 7%, or 210,000 tons12. Therefore, the ratio of that number to the total plastics industry is 0.34% – well under the 5% threshold.
• While data regarding the use of calcium carbonate as a substitute for plastic is accessible in the United States, it is less accessible in other countries. However, proxy data provides further evidence to support that this project activity is below the 5% threshold. Specifically, data is available in several countries for TOTAL production of calcium carbonate compared to TOTAL plastic production. Given that CaCO3 is used for many other purposes – from construction to cosmetics – its use as a plastic substitute is lower than total CaCO3 production. Therefore, if the ratio of total CaCO3 production to total plastic production in a given economy is less than 5%, it can be assumed that the level of OA is less than 5% of MAP. For example:
o In India, total plastic production in 2018-19 was 17,000,000 tons and total CaCO3 production in 2019 was 286,830 tons, a ratio of 1.68%.13
o In Japan, total plastic production in 2019 was 5,736,059 tons and total CaCO3 production in 2020 was 246,440 tons, a ratio of 4.29%.14
o In the United Kingdom, total plastic production in 2019 was 2,260,000 tons and total CaCO3 production in 2020 was 97,558 tons, a ratio of 4.31%.15
9 Roskill (2012). An overview of the North American calcium carbonate market. Available at: https://roskill.com/news/download-roskills-paper-on-the-north-american-calcium-carbonate-market/; and International Trade Administration (2020). Mexico – Country Commercial Guide: Plastics and Resins. Available at: https://www.trade.gov/knowledge-product/mexico-p-plastics-and-resins; and Oceana (2021). Canada’s Plastic Problem: Sorting fact from fiction. Available at: https://oceana.ca/en/blog/canadas-plastic-problem-sorting-fact-fiction 10 Statista (2021). U.S. plastics industry - Statistics & Facts. Available at: https://www.statista.com/topics/7460/plastics-industry-in-the-us/ 11 Roskill (2012). An overview of the North American calcium carbonate market. Available at: https://roskill.com/news/download-roskills-paper-on-the-north-american-calcium-carbonate-market/ 12 Ibid, p. 34 13 Plastindia Foundation (2019). Plastic Industry Status Report. Available at: https://www.plastindia.org/plastic-industry-status-report.php 14 Ministry of Economy, Trade and Industry (2021). Yearbook of Current Production Statistics: Paper, Printing, Plastic Products and Rubber Products. Available at: https://www.meti.go.jp/english/statistics/tyo/seidou/index.html 15 Department for Environment Food & Rural Affairs (2020). UK Statistics on Waste. Available at: https://assets.publishing.service.gov.uk/government/uploads/system/uploads/attachment_data/file/918270/UK_Statistics_on_Waste_statistical_notice_March_2020_accessible_FINAL_updated_size_12.pdf
Methodology: VCS Version 4.0
31
• Given the early stage of this technology, it is difficult to say exactly what the resource and other constraints are to adoption of this technology. The main feedstock for Okeanos, CaCO3, is ubiquitous, and there are no particular barriers that would limit the adoption of this technology, which can displace just about any plastic product. Thus, for the purposes of this methodology, the MAP is the entire plastics market. Therefore, the activity penetration level of the project activity covered by this methodology is below the five percent threshold, and the project activity may be deemed additional. Okeanos would have to increase its planned production (again not its current production) by 25 times to reach that threshold.
• Additionally, given the low penetration of this activity, the only baseline scenarios that are reasonable to consider are: 1) the continued manufacturing of traditional plastic material with no plastic substitutes; 2) the large-scale adoption of this technology many years into the future, at which point the five percent threshold for activity penetration would be exceeded and the activity would no longer be eligible for crediting.
Conclusion
Per VCS rules, Verra will reassess whether the activity penetration levels remain within the permitted threshold within three years of the initial approval of the methodology. The activity method and approach in this Appendix does not apply to other plastic substitutes (e.g., seaweed).

Methodology: VCS Version 4.0
32
APPENDIX II: EMISSION FACTORS Introduction
This appendix provides additional information about the calculation of the following emission factors:
1) EFi: the emission factor for GHGs caused by the production of virgin plastic materials; and 2) DFEL: the discount factor applied to account for the end of life of plastic material that is
incinerated, releasing CO2
Emission Factor for the Production of Plastic Material (EFi)
Introduction and Background
This methodology relies on emission factors for each type of plastic produced by the project activity in order to calculate baseline emissions associated with the displacement of virgin plastic production (EFi). This appendix provides additional information about how EFi is determined, including default factors for projects located in the United States and the process that must be used by projects located outside of the United States to calculate EFi.
Emissions associated with the manufacture of plastic materials through conventional processes include the extraction and processing of raw materials, which are primarily petroleum products, emissions associated with the manufacturing process itself, and emissions associated with the transportation of plastic materials. These emissions vary depending on the type of plastic material – the production of polypropylene, for example, generates almost 40% fewer emissions than the production of polystyrene.
Calculation of Default Factors for Projects in the United States
Projects located in the United States may use a default value for EFi, based on the United States Environmental Protection Agency (U.S. EPA) Waste Reduction Model (WARM), which was created to calculate the GHG emissions of waste management practices in the United States, including from the recycling and landfilling of plastic materials.
The WARM model disaggregates the different sources of emissions associated with plastic production and includes process energy from the petroleum refining process, process non-energy emissions, and transportation emissions, as shown in Table 3a below16. For the purposes of this methodology, only process and process non-energy emissions are included because emissions from the transportation of plastic materials are not expected to be different in the baseline and project scenarios (e.g., because traditional plastic or GHG-containing plastic both must be transported to their final destination).
16 U.S. Environmental Protection Agency Office of Resource Conservation and Recovery (2020). Documentation for Greenhouse Gas Emission and Energy Factors Used in the Waste Reduction Model (WARM): Containers, Packaging, and Non-Durable Good Materials Chapters. Available at: https://www.epa.gov/sites/production/files/2020-12/documents/warm_containers_packaging_and_non-durable_goods_materials_v15_10-29-2020.pdf

Methodology: VCS Version 4.0
33
Note – The tCO2e in Table 3a and Table 3b, below, are expressed in short tons. For the purposes of calculating baseline emissions in Equation 2, the default values included in Table 4, below, have been converted into metric tCO2e.
Table 3a: Source Reduction Emission Factors for Plastic
Material (a)
Process Energy (b)
Transportation Energy (c)
Process Non-Energy (d)
Net emissions (e) [e=b+c+d]
HDPE 1.18 0.15 0.20 1.53
LDPE 1.40 0.15 0.21 1.76
PET 1.74 0.07 0.39 2.20
LLDPE 1.14 0.15 0.25 1.54
PP 1.17 0.13 0.21 1.51
PS 1.86 0.15 0.45 2.46
PVC 1.68 0.08 0.14 1.90
The WARM model takes into account that some plastic is created from recycled materials, and therefore not all plastic materials on the market are from 100% raw materials, in its calculation of net emissions from plastic production. Table 3b, below, includes the emissions from “raw material acquisition” for the current mix of recycled vs. virgin plastic in the market (column “b”), as opposed to column “c” which calculates the emission factor for 100% virgin inputs. Note that the values in Table 3b are negative because this section of the WARM model is referencing reductions in emissions for every ton of plastic where its use is avoided.
Note that the figures in column “e” in Table 3a do not match column “b” in Table 3b below. This is because the transportation energy in the WARM model does not include retail transportation, which is 0.04 tCO2/t of plastic for all plastic types17. The values in column “e” of Table 3a are equal to: [net emissions from 100% virgin inputs, Table 3b] – [0.04].
17 See Table 5-4 on page 5-5 of U.S. Environmental Protection Agency Office of Resource Conservation and Recovery (2020). Documentation for Greenhouse Gas Emission and Energy Factors Used in the Waste Reduction Model (WARM): Containers, Packaging, and Non-Durable Good Materials Chapters. Available at: https://www.epa.gov/sites/production/files/2020-12/documents/warm_containers_packaging_and_non-durable_goods_materials_v15_10-29-2020.pdf
Methodology: VCS Version 4.0
34
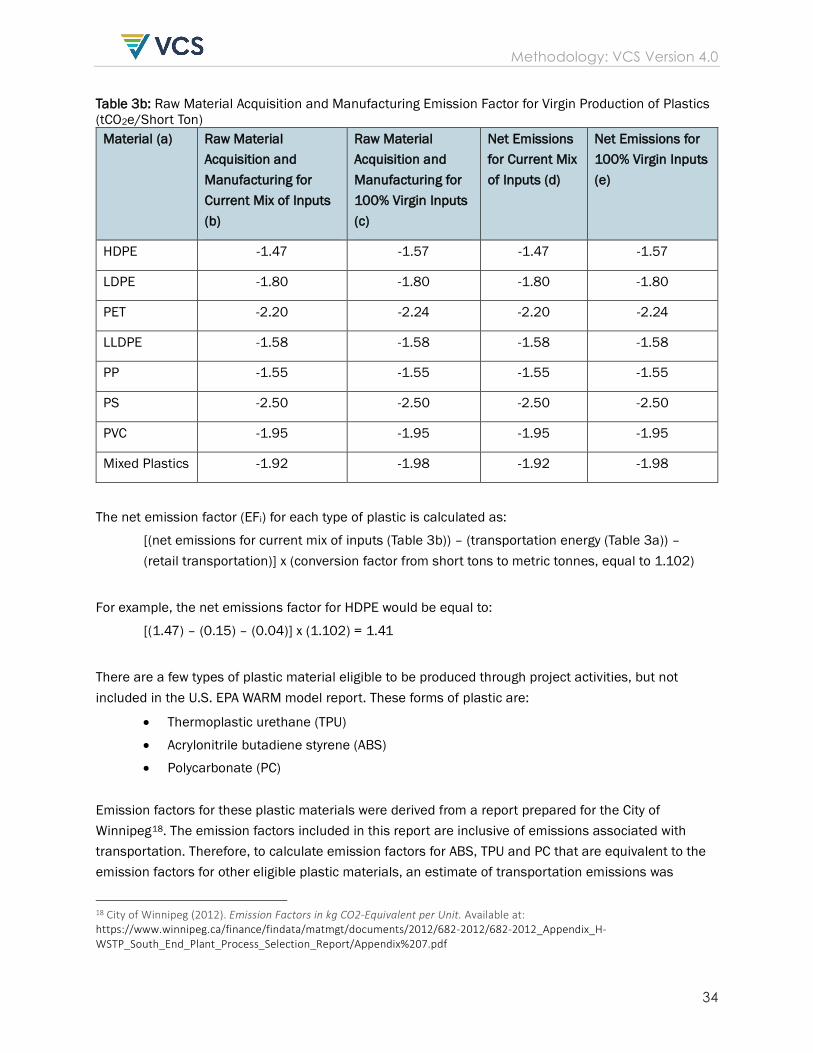
Table 3b: Raw Material Acquisition and Manufacturing Emission Factor for Virgin Production of Plastics (tCO2e/Short Ton)
Material (a) Raw Material Acquisition and Manufacturing for Current Mix of Inputs (b)
Raw Material Acquisition and Manufacturing for 100% Virgin Inputs (c)
Net Emissions for Current Mix of Inputs (d)
Net Emissions for 100% Virgin Inputs (e)
HDPE -1.47 -1.57 -1.47 -1.57
LDPE -1.80 -1.80 -1.80 -1.80
PET -2.20 -2.24 -2.20 -2.24
LLDPE -1.58 -1.58 -1.58 -1.58
PP -1.55 -1.55 -1.55 -1.55
PS -2.50 -2.50 -2.50 -2.50
PVC -1.95 -1.95 -1.95 -1.95
Mixed Plastics -1.92 -1.98 -1.92 -1.98
The net emission factor (EFi) for each type of plastic is calculated as:
[(net emissions for current mix of inputs (Table 3b)) – (transportation energy (Table 3a)) – (retail transportation)] x (conversion factor from short tons to metric tonnes, equal to 1.102)
For example, the net emissions factor for HDPE would be equal to:
[(1.47) – (0.15) – (0.04)] x (1.102) = 1.41
There are a few types of plastic material eligible to be produced through project activities, but not included in the U.S. EPA WARM model report. These forms of plastic are:
• Thermoplastic urethane (TPU)
• Acrylonitrile butadiene styrene (ABS)
• Polycarbonate (PC) Emission factors for these plastic materials were derived from a report prepared for the City of Winnipeg18. The emission factors included in this report are inclusive of emissions associated with transportation. Therefore, to calculate emission factors for ABS, TPU and PC that are equivalent to the emission factors for other eligible plastic materials, an estimate of transportation emissions was
18 City of Winnipeg (2012). Emission Factors in kg CO2-Equivalent per Unit. Available at: https://www.winnipeg.ca/finance/findata/matmgt/documents/2012/682-2012/682-2012_Appendix_H-WSTP_South_End_Plant_Process_Selection_Report/Appendix%207.pdf

Methodology: VCS Version 4.0
35
subtracted from the total emissions. The EPA data from the WARM model specifies 0.19 metric tonnes of CO2/per short ton of plastic (equal to 0.21 metric tonne of CO2/per metric tonne of plastic) as the highest (and therefore most conservative) value for emissions from transportation. This value was subtracted from total emissions for the emission factors for ABS, TPU and PC included in Table 4 below. It is reasonable to infer that transporting ABS, TPU and PC would be similar in cost and energy to all other types of plastics, a point reinforced by the fact that the transport figures in the WARM model (except for PVC) are all in a very small range. The emission factors for TPU and PC were derived from the “Other Plastics” emission factor. Table 4: Default Emission Factors for EFi for projects located in the United States
Plastic Type Emission Factor (tCO2e/metric tonne of plastic material produced)
HDPE 1.41
LDPE 1.77
PET 2.30
LLDPE 1.53
PP 1.52
PS 2.55
PVC 2.02
ABS 3.25
TPU 2.49
PC 2.49
Note that project proponents must use the latest version of the WARM model (or similar sources of data in other countries) when developing a new project.
Discount Factor for Incinerated Plastic Material (DFEL)
Introduction
DFEL is the discount factor that is applied to account for the fact that a certain amount of GHGs captured as part of the project may be re-released when plastic is incinerated. Where plastic materials that are made through project activities are incinerated, CO2 would be released to the atmosphere through the combustion process, and therefore the incinerated plastic materials would not represent a permanent sequestration of the GHG feedstock used in the production process. DFEL represents the proportion of incinerated plastic to non-incinerated plastic.
This section sets out in more detail the three ways that DFEL can be determined: 1) a default value for U.S.-based projects; 2) criteria for projects to determine DFEL where appropriate data is available, and; 3) a conservative global default value.
Methodology: VCS Version 4.0
36
Default Factor for Projects Located in the United States
The U.S. Environmental Protection Agency (U.S. EPA) has collected and reported data on the generation and disposition of waste in the United States for more than 30 years. This information is used to measure the success of waste reduction and recycling programs across the country and characterize the U.S. national waste stream, and can be used to determine DFEL in the United States.
Based on the information included in the U.S. EPA Advancing Sustainable Materials Management: 2014 Fact Sheet Assessing Trends in Material Generate, Recycling, Composting, Combustion with Energy Recovery and Landfilling in the United States (November 2016)19, 15% of total plastics are incinerated in the U.S. Therefore, the default factor for DFEL in the U.S. is: 0.15.
Procedure for Projects Located Outside of the United States
Where projects are located outside of the United States, they must determine the percent of plastic incinerated in the country or geographic region of the project in order to determine DFEL. Independent market estimates from government, academic or trade association sources may be used to determine the level of plastic incineration in a particular country. Where a single source does not include sufficient information to determine the percent of plastic incinerated in a particular country, multiple sources of data may be used. For example, where 5 million tons of waste is incinerated in a country and 10% of such waste is plastic products, then 500,000 tons of plastic may be assumed to be incinerated in that country. Where another source shows that 1.5 million tons of plastics is consumed in that country, then the default factor may be set at 30% (equal to: (plastic products incinerated) / (total plastic consumed) = (500,000) / (1,500,000)).
The project proponent must calculate DFEL in terms of tCO2e/metric tonne of plastic material produced and apply this calculated discount factor to determine emissions in Equation 2.
Global Default Value
Where data is not available to determine a specific default factor for the percent of plastic that is incinerated in a particular country, a conservative global default value must be used. The conservative global default for DFEL is: 0.40.
This conservative global default value for DFEL is based on an estimate of the percent of plastic that is incinerated in Europe, which has the highest level of plastics incineration of any known country or region. According to a report from Plastics Europe20, 36% of post-consumer plastic produced in Europe
19 See Table 1. Generation, Recycling, Composting, Combustion with Energy Recovery and Landfilling of Materials in MSW, 2014*, in the column for “combustion as a percent of generation”, which refers to the percent combusted as a percent of total waste generation for that category, in the U.S. Environmental Protection Agency (2016). Advancing Sustainable Materials Management: 2014 Fact Sheet Assessing Trends in Material Generation, Recycling, Composting, Combustion with Energy Recovery and Landfilling in the United States. Available at: https://www.epa.gov/sites/production/files/2016-11/documents/2014_smmfactsheet_508.pdf 20 Plastics Europe (2015). Plastics–The Facts 2014: An Analysis of European Plastics Production, Demand and Waste Data. Available at: https://www.plasticseurope.org/application/files/5515/1689/9220/2014plastics_the_facts_PubFeb2015.pdf

Methodology: VCS Version 4.0
37
was incinerated for energy generation. Therefore, for the purposes of the methodology, where a project proponent cannot find data on the level of baseline plastics incineration in a country where a project facility is located, the global default value for DFEL is conservatively set at 40%.