methods andtechniques for segmentationof consumers in ... · methods andtechniques for...
TRANSCRIPT

Methods and Techniques for
Segmentation of Consumers in
Social Media
PhD Thesis
Oscar Munoz Garcıa (MSc Artificial Intelligence)
Departamento de Inteligencia Artificial
ETS de Ingenieros Informaticos
SupervisorsAsuncion Gomez Perez (PhD Computer Science, MBA)
Raul Garcıa Castro (PhD Computer Science and Artificial Intelligence)
2015


Tribunal nombrado por el Sr. Rector Magfco. de la Universidad Politecnica de
Madrid, el dıa de de .
Presidente:
Vocal:
Vocal:
Vocal:
Secretario:
Suplente:
Suplente:
Realizado el acto de defensa y lectura de la Tesis el dıa de
de en la Escuela Tecnica Superior de Ingenieros Informaticos.
Calificacion:
EL PRESIDENTE LOS VOCALES
EL SECRETARIO
i

ii
A Mari. Gracias por tu comprension durante todo el tiempo que he
dedicado a la tesis.
A mis padres. Gracias por todo vuestro apoyo y motivacion sin los
cuales no habrıa llegado hasta aquı.
A mi hija Lucıa.

iv

Acknowledgements
This thesis represents the final stage of a long period of my life I had
never completed without the help of many people whom I thank for
their inestimable support that worth its weight in gold.
First of all, I want to acknowledge all the co-authors of the research
works that have contributed to the contents included in these the-
sis: Silvia, Ines, Nuria, March, Beatriz, Gloria, Javier, Daniel, Jesus,
David, Guadalupe, Auxi, Socorro, Elena, Vıctor, and Carlos. This
thesis would not have been possible without their hard work.
Havas Media Group deserves a special recognition. I want to ac-
knowledge my colleagues there for all their lessons about marketing
and advertising. I could not imagine my professional career from now
on without their support and training. Specially, I have no words to
express my gratitude to Gloria.
I also want to acknowledge the Spanish Centre for the Development
of Industrial Technology that has partially supported this research
under the CENIT program in the context of the Social Media Project
(CEN-20101037). Thanks a lot to all the partners in this project.
Finally, I want to acknowledge my supervisors, Asun and Raul, for
their guidance, reviews and patience, during and before the writing
of this thesis. I hope I have lived up to their expectations.

vi

Abstract
Social media has revolutionised the way in which consumers relate to
each other and with brands. The opinions published in social media
have a power of influencing purchase decisions as important as adver-
tising campaigns. Consequently, marketers are increasing efforts and
investments for obtaining indicators to measure brand health from
the digital content generated by consumers.
Given the unstructured nature of social media contents, the tech-
nology used for processing such contents often implements Artificial
Intelligence techniques, such as natural language processing, machine
learning and semantic analysis algorithms.
This thesis contributes to the State of the Art, with a model for
structuring and integrating the information posted on social media,
and a number of techniques whose objectives are the identification
of consumers, as well as their socio-demographic and psychographic
segmentation. The consumer identification technique is based on the
fingerprint of the devices they use to surf the Web and is tolerant to
the changes that occur frequently in such fingerprint. The psycho-
graphic profiling techniques described infer the position of consumer
in the purchase funnel, and allow to classify the opinions based on a
series of marketing attributes. Finally, the socio-demographic profil-
ing techniques allow to obtain the residence and gender of consumers.

viii
Resumen
Los medios sociales han revolucionado la manera en la que los con-
sumidores se relacionan entre sı y con las marcas. Las opiniones publi-
cadas en dichos medios tienen un poder de influencia en las decisiones
de compra tan importante como las campanas de publicidad. En con-
secuencia, los profesionales del marketing cada vez dedican mayores
esfuerzos e inversion a la obtencion de indicadores que permitan medir
el estado de salud de las marcas a partir de los contenidos digitales
generados por sus consumidores.
Dada la naturaleza no estructurada de los contenidos publicados en
los medios sociales, la tecnologıa usada para procesar dichos con-
tenidos ha menudo implementa tecnicas de Inteligencia Artificial, tales
como algoritmos de procesamiento de lenguaje natural, aprendizaje
automatico y analisis semantico.
Esta tesis, contribuye al estado de la cuestion, con un modelo que
permite estructurar e integrar la informacion publicada en medios so-
ciales, y una serie de tecnicas cuyos objetivos son la identificacion
de consumidores, ası como la segmentacion psicografica y sociode-
mografica de los mismos. La tecnica de identificacion de consumi-
dores se basa en la huella digital de los dispositivos que utilizan para
navegar por la Web y es tolerante a los cambios que se producen
con frecuencia en dicha huella digital. Las tecnicas de segmentacion
psicografica descritas obtienen la posicion en el embudo de compra
de los consumidores y permiten clasificar las opiniones en funcion de
una serie de atributos de marketing. Finalmente, las tecnicas de seg-
mentacion sociodemografica permiten obtener el lugar de residencia y
el genero de los consumidores.

x

Contents
1 INTRODUCTION 1
1.1 Thesis Structure . . . . . . . . . . . . . . . . . . . . . . . . . . . . 5
1.2 Dissemination of Results . . . . . . . . . . . . . . . . . . . . . . . 7
2 STATE OF THE ART 9
2.1 Semantic Vocabularies for Representing Social Media Information 10
2.1.1 Conclusions . . . . . . . . . . . . . . . . . . . . . . . . . . 12
2.2 Techniques for Tracking Users in the Web . . . . . . . . . . . . . 13
2.2.1 Techniques for Capturing Web Activity . . . . . . . . . . . 14
2.2.1.1 Technique Based on Web Logs . . . . . . . . . . 15
2.2.1.2 Technique Based on Web Beacons . . . . . . . . . 18
2.2.1.3 Technique Based on JavaScript Tags . . . . . . . 19
2.2.1.4 Technique Based on Packet Sniffing . . . . . . . . 21
2.2.2 Techniques for Identifying Unique Users . . . . . . . . . . 22
2.2.2.1 Technique Based on Cookies . . . . . . . . . . . . 22
2.2.2.2 Technique Based on Fingerprint . . . . . . . . . . 23
2.2.3 Conclusions . . . . . . . . . . . . . . . . . . . . . . . . . . 26
2.3 Technique for Detecting the Evolution of Temporary Records . . . 27
2.3.1 Early Binding Algorithm [Li et al., 2011] . . . . . . . . . . 28
2.3.2 Late Binding Algorithm [Li et al., 2011] . . . . . . . . . . 28
2.3.3 Adjusted Binding Algorithm [Li et al., 2011] . . . . . . . . 29
2.3.4 Conclusions . . . . . . . . . . . . . . . . . . . . . . . . . . 30
2.4 Social Media Analysis Applied to Market Research . . . . . . . . 30
2.4.1 KPIs Based on Social Media Analysis . . . . . . . . . . . . 32
xi

2.4.2 Conclusions . . . . . . . . . . . . . . . . . . . . . . . . . . 35
2.5 Marketing Background . . . . . . . . . . . . . . . . . . . . . . . . 35
2.5.1 The Consumer Decision Journey . . . . . . . . . . . . . . . 37
2.5.2 The Marketing Mix . . . . . . . . . . . . . . . . . . . . . . 39
2.5.3 Research on Human Emotions . . . . . . . . . . . . . . . . 40
2.5.4 Owned, Paid and Earned Media . . . . . . . . . . . . . . . 43
2.5.5 Marketing Technology . . . . . . . . . . . . . . . . . . . . 44
2.5.6 Conclusions . . . . . . . . . . . . . . . . . . . . . . . . . . 45
2.6 Analysis of Social Media Content . . . . . . . . . . . . . . . . . . 47
2.6.1 Lemmatisation and Part-Of-Speech Tagging . . . . . . . . 47
2.6.2 Normalisation of Microposts . . . . . . . . . . . . . . . . . 48
2.6.3 Sentiment Analysis . . . . . . . . . . . . . . . . . . . . . . 49
2.6.4 Identification of Wishes . . . . . . . . . . . . . . . . . . . . 51
2.6.5 Detection of Place of Residence . . . . . . . . . . . . . . . 52
2.6.6 Detection of Gender . . . . . . . . . . . . . . . . . . . . . 53
2.6.7 Conclusions . . . . . . . . . . . . . . . . . . . . . . . . . . 53
2.7 Open Research Problems . . . . . . . . . . . . . . . . . . . . . . . 55
3 APPROACH 57
3.1 Objectives . . . . . . . . . . . . . . . . . . . . . . . . . . . . . . . 57
3.2 Contributions to the State of the Art . . . . . . . . . . . . . . . . 61
3.3 Assumptions . . . . . . . . . . . . . . . . . . . . . . . . . . . . . . 64
3.4 Hypotheses . . . . . . . . . . . . . . . . . . . . . . . . . . . . . . 65
3.5 Restrictions . . . . . . . . . . . . . . . . . . . . . . . . . . . . . . 67
4 RESEARCH METHODOLOGY 71
4.1 Terminology . . . . . . . . . . . . . . . . . . . . . . . . . . . . . . 71
4.2 Research Methodology . . . . . . . . . . . . . . . . . . . . . . . . 73
4.3 Method Followed for Obtaining the Artefacts Provided by this Thesis 74
4.3.1 Method Followed for Ontology Engineering . . . . . . . . . 76
4.3.2 Method Followed for the Data Mining Techniques . . . . . 79
4.3.2.1 Business Understanding . . . . . . . . . . . . . . 80
4.3.2.2 Data Understanding . . . . . . . . . . . . . . . . 80
xii

4.3.2.3 Data Preparation . . . . . . . . . . . . . . . . . . 81
4.3.2.4 Modelling . . . . . . . . . . . . . . . . . . . . . . 81
4.3.2.5 Evaluation . . . . . . . . . . . . . . . . . . . . . 82
4.3.2.6 Deployment . . . . . . . . . . . . . . . . . . . . . 82
5 SOCIAL MEDIA ONTOLOGY FOR CONSUMER ANALYT-
ICS 83
5.1 Ontology Modules . . . . . . . . . . . . . . . . . . . . . . . . . . . 85
5.2 Notation Used . . . . . . . . . . . . . . . . . . . . . . . . . . . . . 86
5.3 Core Ontology Module . . . . . . . . . . . . . . . . . . . . . . . . 90
5.4 Publication Channels Module . . . . . . . . . . . . . . . . . . . . 96
5.5 Contents Module . . . . . . . . . . . . . . . . . . . . . . . . . . . 97
5.6 Users Module . . . . . . . . . . . . . . . . . . . . . . . . . . . . . 98
5.7 Opinions Module . . . . . . . . . . . . . . . . . . . . . . . . . . . 103
5.8 Topics and Keywords Module . . . . . . . . . . . . . . . . . . . . 105
5.9 Geographical Locations Module . . . . . . . . . . . . . . . . . . . 106
6 MORPHOSYNTACTIC CHARACTERISATION OF SOCIAL
MEDIA CONTENTS 109
6.1 Types of Social Media Analysed . . . . . . . . . . . . . . . . . . . 110
6.2 Distribution of Part-of-Speech Categories . . . . . . . . . . . . . . 111
6.2.1 Distribution of Nouns . . . . . . . . . . . . . . . . . . . . . 113
6.2.2 Distribution of Adjectives . . . . . . . . . . . . . . . . . . 113
6.2.3 Distribution of Adverbs . . . . . . . . . . . . . . . . . . . 114
6.2.4 Distribution of Determiners . . . . . . . . . . . . . . . . . 114
6.2.5 Distribution of Conjunctions . . . . . . . . . . . . . . . . . 114
6.2.6 Distribution of Pronouns . . . . . . . . . . . . . . . . . . . 115
6.2.7 Distribution of Prepositions . . . . . . . . . . . . . . . . . 115
6.2.8 Distribution of Punctuation Marks . . . . . . . . . . . . . 115
6.2.9 Distribution of Verbs . . . . . . . . . . . . . . . . . . . . . 116
6.3 Hypothesis Validation . . . . . . . . . . . . . . . . . . . . . . . . 116
xiii

7 TECHNIQUE FOR UNIQUE USER IDENTIFICATION BASED
ON EVOLVING DEVICE FINGERPRINT DETECTION 117
7.1 Data Understanding Activity . . . . . . . . . . . . . . . . . . . . 118
7.1.1 Collect Initial Data Task . . . . . . . . . . . . . . . . . . . 119
7.1.2 Describe Data Task . . . . . . . . . . . . . . . . . . . . . . 123
7.1.3 Explore Data Task . . . . . . . . . . . . . . . . . . . . . . 124
7.1.4 Verify Data Quality Task . . . . . . . . . . . . . . . . . . . 130
7.2 Data Preparation Activity . . . . . . . . . . . . . . . . . . . . . . 131
7.2.1 Select Data Task . . . . . . . . . . . . . . . . . . . . . . . 131
7.2.2 Clean Data Task . . . . . . . . . . . . . . . . . . . . . . . 131
7.2.3 Construct Data Task . . . . . . . . . . . . . . . . . . . . . 132
7.3 Modelling Activity . . . . . . . . . . . . . . . . . . . . . . . . . . 133
7.3.1 Select Modelling Technique Task . . . . . . . . . . . . . . 133
7.3.1.1 Cluster Signature . . . . . . . . . . . . . . . . . . 135
7.3.1.2 Similarity Computation . . . . . . . . . . . . . . 137
7.3.1.3 Attribute Weight Computation . . . . . . . . . . 138
7.3.2 Generate Test Design Task . . . . . . . . . . . . . . . . . . 140
7.3.3 Build Model Task . . . . . . . . . . . . . . . . . . . . . . . 140
7.3.3.1 X-Real-IP Header . . . . . . . . . . . . . . . . . 143
7.3.3.2 X-Forwarded-For Header . . . . . . . . . . . . . . 145
7.3.3.3 User-Agent Header . . . . . . . . . . . . . . . . . 146
7.3.3.4 Accept Header . . . . . . . . . . . . . . . . . . . 147
7.3.3.5 Accept-Language Header . . . . . . . . . . . . . . 148
7.3.3.6 Accept-Charset Header . . . . . . . . . . . . . . . 149
7.3.3.7 Accept-Encoding Header . . . . . . . . . . . . . . 151
7.3.3.8 Cache-Control Header . . . . . . . . . . . . . . . 152
7.3.3.9 Plugins . . . . . . . . . . . . . . . . . . . . . . . 153
7.3.3.10 Fonts . . . . . . . . . . . . . . . . . . . . . . . . 154
7.3.3.11 Video . . . . . . . . . . . . . . . . . . . . . . . . 156
7.3.3.12 Time zone . . . . . . . . . . . . . . . . . . . . . . 157
7.3.3.13 Session Storage . . . . . . . . . . . . . . . . . . . 158
7.3.3.14 Local Storage . . . . . . . . . . . . . . . . . . . . 160
7.3.3.15 Internet Explorer Persistence . . . . . . . . . . . 161
xiv

7.4 Evaluation . . . . . . . . . . . . . . . . . . . . . . . . . . . . . . . 162
7.4.1 Evaluation Metrics . . . . . . . . . . . . . . . . . . . . . . 163
7.4.1.1 Rand Index . . . . . . . . . . . . . . . . . . . . . 164
7.4.1.2 Error Rate . . . . . . . . . . . . . . . . . . . . . 164
7.4.1.3 Recall . . . . . . . . . . . . . . . . . . . . . . . . 164
7.4.1.4 Specificity . . . . . . . . . . . . . . . . . . . . . . 164
7.4.1.5 False Positive Rate . . . . . . . . . . . . . . . . . 165
7.4.1.6 False Negative Rate . . . . . . . . . . . . . . . . 165
7.4.1.7 Precision . . . . . . . . . . . . . . . . . . . . . . 165
7.4.1.8 F-measure . . . . . . . . . . . . . . . . . . . . . . 165
7.4.1.9 Purity . . . . . . . . . . . . . . . . . . . . . . . . 166
7.4.2 Evaluation Results . . . . . . . . . . . . . . . . . . . . . . 166
7.4.2.1 Variant Based on Uniform Weights . . . . . . . . 166
7.4.2.2 Variant Based on Attribute Entropy . . . . . . . 167
7.4.2.3 Variant Based on Time Decay . . . . . . . . . . . 169
7.4.2.4 Variant Based on Attribute Entropy and Time
Decay . . . . . . . . . . . . . . . . . . . . . . . . 170
7.4.2.5 Comparison of the Variants . . . . . . . . . . . . 171
7.5 Hypothesis Validation . . . . . . . . . . . . . . . . . . . . . . . . 173
8 TECHNIQUES FOR SEGMENTATION OF CONSUMERS FROM
SOCIAL MEDIA CONTENT 175
8.1 Common Elements Used by the Techniques . . . . . . . . . . . . . 176
8.1.1 Collect Initial Data Task . . . . . . . . . . . . . . . . . . . 177
8.1.2 Data Preparation Activity . . . . . . . . . . . . . . . . . . 178
8.1.2.1 Select Data Task . . . . . . . . . . . . . . . . . . 179
8.1.2.2 Clean Data Task . . . . . . . . . . . . . . . . . . 180
8.1.2.3 Construct Data Task . . . . . . . . . . . . . . . . 182
8.1.3 Rule-based Modelling Technique . . . . . . . . . . . . . . . 187
8.2 Technique for Detecting Consumer Decision Journey Stages . . . . 191
8.2.1 Data Understanding Activity . . . . . . . . . . . . . . . . 191
8.2.1.1 Collect Initial Data Task . . . . . . . . . . . . . . 192
8.2.1.2 Describe Data Task . . . . . . . . . . . . . . . . 195
xv

8.2.1.3 Explore Data Task . . . . . . . . . . . . . . . . . 196
8.2.1.4 Verify Data Quality Task . . . . . . . . . . . . . 197
8.2.2 Modelling Activity . . . . . . . . . . . . . . . . . . . . . . 200
8.2.2.1 Select Modelling Technique Task . . . . . . . . . 200
8.2.2.2 Build Model Task . . . . . . . . . . . . . . . . . 201
8.3 Technique for Detecting Marketing Mix Attributes . . . . . . . . . 205
8.3.1 Data Understanding Activity . . . . . . . . . . . . . . . . 205
8.3.1.1 Collect Initial Data Task . . . . . . . . . . . . . . 205
8.3.1.2 Describe Data Task . . . . . . . . . . . . . . . . 207
8.3.1.3 Explore Data Task . . . . . . . . . . . . . . . . . 208
8.3.1.4 Verify Data Quality Task . . . . . . . . . . . . . 208
8.3.2 Modelling Activity . . . . . . . . . . . . . . . . . . . . . . 210
8.3.2.1 Select Modelling Technique Task . . . . . . . . . 210
8.3.2.2 Build Model Task . . . . . . . . . . . . . . . . . 211
8.4 Technique for Detecting Emotions . . . . . . . . . . . . . . . . . . 212
8.4.1 Data Understanding Activity . . . . . . . . . . . . . . . . 213
8.4.1.1 Collect Initial Data Task . . . . . . . . . . . . . . 213
8.4.1.2 Describe Data Task . . . . . . . . . . . . . . . . 214
8.4.1.3 Explore Data Task . . . . . . . . . . . . . . . . . 215
8.4.1.4 Verify Data Quality Task . . . . . . . . . . . . . 216
8.4.2 Modelling Activity . . . . . . . . . . . . . . . . . . . . . . 218
8.4.2.1 Select Modelling Technique Task . . . . . . . . . 218
8.4.2.2 Generate Test Design Task . . . . . . . . . . . . 219
8.4.2.3 Build Model Task . . . . . . . . . . . . . . . . . 219
8.5 Technique for Detecting Place of Residence . . . . . . . . . . . . . 223
8.5.1 Data Understanding Activity . . . . . . . . . . . . . . . . 223
8.5.1.1 Collect Initial Data Task . . . . . . . . . . . . . . 224
8.5.1.2 Describe Data Task . . . . . . . . . . . . . . . . 224
8.5.1.3 Explore Data Task . . . . . . . . . . . . . . . . . 225
8.5.2 Data Preparation Activity . . . . . . . . . . . . . . . . . . 225
8.5.3 Modelling Activity . . . . . . . . . . . . . . . . . . . . . . 225
8.5.3.1 Select Modelling Technique Task . . . . . . . . . 226
8.5.3.2 Generate Test Design Task . . . . . . . . . . . . 235
xvi

8.6 Technique for Detecting Gender . . . . . . . . . . . . . . . . . . . 235
8.6.1 Data Understanding Activity . . . . . . . . . . . . . . . . 235
8.6.1.1 Collect Initial Data Task . . . . . . . . . . . . . . 235
8.6.1.2 Describe Data Task . . . . . . . . . . . . . . . . 236
8.6.1.3 Explore Data Task . . . . . . . . . . . . . . . . . 236
8.6.2 Data Preparation Activity . . . . . . . . . . . . . . . . . . 236
8.6.3 Modelling Activity . . . . . . . . . . . . . . . . . . . . . . 237
8.6.3.1 Select Modelling Technique Task . . . . . . . . . 237
8.6.3.2 Generate Test Design Task . . . . . . . . . . . . 240
8.7 Evaluation . . . . . . . . . . . . . . . . . . . . . . . . . . . . . . . 241
8.7.1 Evaluation Metrics . . . . . . . . . . . . . . . . . . . . . . 241
8.7.1.1 Accuracy . . . . . . . . . . . . . . . . . . . . . . 242
8.7.1.2 Recall . . . . . . . . . . . . . . . . . . . . . . . . 242
8.7.1.3 Precision . . . . . . . . . . . . . . . . . . . . . . 242
8.7.1.4 F-measure . . . . . . . . . . . . . . . . . . . . . . 242
8.7.2 Evaluation Results . . . . . . . . . . . . . . . . . . . . . . 243
8.7.2.1 Technique for Detecting Consumer Decision Jour-
ney Stages . . . . . . . . . . . . . . . . . . . . . . 243
8.7.2.2 Technique for Detecting Marketing Mix Attributes 246
8.7.2.3 Technique for Detecting Emotions . . . . . . . . 249
8.7.2.4 Technique for Detecting Place of Residence . . . 252
8.7.2.5 Technique for Detecting Gender . . . . . . . . . . 252
8.8 Validation of Hypotheses . . . . . . . . . . . . . . . . . . . . . . . 255
9 CONCLUSIONS AND FUTURE WORK 257
9.1 Social Media Data Model for Consumer Analytics . . . . . . . . . 258
9.2 Morphosyntactic Characterisation of Social Media Contents . . . 258
9.3 Technique for Unique User Identification
Based on Evolving Device Fingerprint . . . . . . . . . . . . . . . . 259
9.4 Techniques for Segmentation of Consumers from Social Media Con-
tent . . . . . . . . . . . . . . . . . . . . . . . . . . . . . . . . . . 261
9.4.1 Technique for Detecting Consumer Decision Journey Stages 261
9.4.2 Technique for Detecting Marketing Mix Attributes . . . . 262
xvii

9.4.3 Technique for Detecting Emotions . . . . . . . . . . . . . . 262
9.4.4 Technique for Identifying the Place of Residence of Social
Media Users . . . . . . . . . . . . . . . . . . . . . . . . . . 265
9.4.5 Technique for Identifying the gender of Social Media Users 265
9.4.6 Normalisation of User-Generated Content . . . . . . . . . 265
9.4.7 Evaluation of Scalability . . . . . . . . . . . . . . . . . . . 266
xviii

List of Figures
2.1 Process followed by the technique based on web logs (adapted from
Kaushik [2007]) . . . . . . . . . . . . . . . . . . . . . . . . . . . . 15
2.2 Process followed by the technique based on web beacons (adapted
from Kaushik [2007]) . . . . . . . . . . . . . . . . . . . . . . . . . 19
2.3 Process followed by the technique based on JavaScript tags (adapted
from Kaushik [2007]) . . . . . . . . . . . . . . . . . . . . . . . . . 20
2.4 Process followed by the tags or web beacons techniques for gath-
ering data from multiple sites (adapted from [Kaushik, 2007]) . . 20
2.5 Process followed by the technique based on packet sniffing (adapted
from Kaushik [2007]) . . . . . . . . . . . . . . . . . . . . . . . . . 21
2.6 Consumer Decision Journey stages adopted in this thesis . . . . . 39
3.1 Contributions to the State of the Art . . . . . . . . . . . . . . . . 64
3.2 Relationships between the objectives, contributions, assumptions,
hypothesis and restrictions . . . . . . . . . . . . . . . . . . . . . . 69
4.1 Relations between methodology, methods, techniques, processes,
activities and tasks (adapted from Gomez-Perez et al. [2004]) . . . 72
4.2 Iterative research methodology using exploratory and experimental
approaches . . . . . . . . . . . . . . . . . . . . . . . . . . . . . . . 73
4.3 Web mining framework (adapted from Hu and Cercone [2004]) . . 75
4.4 The CRISP-DM reference model (adapted from Shearer [2000]) . 79
5.1 Ontology network . . . . . . . . . . . . . . . . . . . . . . . . . . . 84
5.2 Social Graph Ontology Modeles . . . . . . . . . . . . . . . . . . . 86
xix

5.3 Class Example . . . . . . . . . . . . . . . . . . . . . . . . . . . . . 87
5.4 Object Property Example . . . . . . . . . . . . . . . . . . . . . . 87
5.5 Inverse Object Properties Example . . . . . . . . . . . . . . . . . 88
5.6 Class Inheritance Example . . . . . . . . . . . . . . . . . . . . . . 88
5.7 Property Inheritance Example . . . . . . . . . . . . . . . . . . . . 89
5.8 Instances Example . . . . . . . . . . . . . . . . . . . . . . . . . . 89
5.9 Core ontology module of the SGO . . . . . . . . . . . . . . . . . . 91
5.10 Publication Channels module of the SGO . . . . . . . . . . . . . . 96
5.11 Contents module of the SGO . . . . . . . . . . . . . . . . . . . . . 97
5.12 Users module of the SGO . . . . . . . . . . . . . . . . . . . . . . 100
5.13 Opinions module of the SGO . . . . . . . . . . . . . . . . . . . . . 104
5.14 Topics and Keywords module of the SGO . . . . . . . . . . . . . . 105
5.15 Locations module of the SGO . . . . . . . . . . . . . . . . . . . . 107
7.1 Format of the data used by the technique for unique user identifi-
cation based on evolving device fingerprint detection . . . . . . . 124
7.2 Daily distribution of visitors during the period of study . . . . . . 125
7.3 Daily distribution of visits during the period of study . . . . . . . 125
7.4 Daily distribution of page views during the period of study . . . . 125
7.5 Distribution of the activity records captured by unique user . . . 126
7.6 Distribution of visits per country . . . . . . . . . . . . . . . . . . 127
7.7 Disagreement decay for the X-Real-IP header (second interval) . . 144
7.8 Disagreement decay for the X-Real-IP header (first interval) . . . 144
7.9 Agreement decay for the X-Real-IP header . . . . . . . . . . . . . 145
7.10 Agreement decay for the X-Forwarded-For header . . . . . . . . . 145
7.11 Disagreement decay for the User-Agent header . . . . . . . . . . . 146
7.12 Agreement decay for the User-Agent header . . . . . . . . . . . . 147
7.13 Disagreement decay for the Accept header . . . . . . . . . . . . . 148
7.14 Agreement decay for the Accept header . . . . . . . . . . . . . . . 148
7.15 Disagreement decay for the Accept-Language header . . . . . . . . 149
7.16 Agreement decay for the Accept-Language header . . . . . . . . . 149
7.17 Disagreement decay for the Accept-Charset header . . . . . . . . . 150
7.18 Agreement decay for the Accept-Charset header . . . . . . . . . . 150
xx

7.19 Disagreement decay for the Accept-Encoding header . . . . . . . . 151
7.20 Agreement decay for the Accept-Encoding header . . . . . . . . . 151
7.21 Disagreement decay for the Cache-Control header . . . . . . . . . 152
7.22 Agreement decay for the Cache-Control header . . . . . . . . . . 153
7.23 Disagreement decay for the Plugins attribute . . . . . . . . . . . . 154
7.24 Agreement decay for the Plugins attribute . . . . . . . . . . . . . 154
7.25 Disagreement decay for the Fonts attribute (second interval) . . . 155
7.26 Disagreement decay for the Fonts attribute (first interval) . . . . 155
7.27 Agreement decay for the Fonts attribute . . . . . . . . . . . . . . 156
7.28 Disagreement decay for the Video attribute . . . . . . . . . . . . . 157
7.29 Agreement decay for the Video attribute . . . . . . . . . . . . . . 157
7.30 Disagreement decay for the Time zone attribute . . . . . . . . . . 158
7.31 Agreement decay for the Time zone attribute . . . . . . . . . . . 158
7.32 Disagreement decay for the Session Storage attribute . . . . . . . 159
7.33 Agreement decay for the Session storage attribute . . . . . . . . . 159
7.34 Disagreement decay for the Local storage attribute . . . . . . . . . 160
7.35 Agreement decay for the Local Storage attribute . . . . . . . . . . 160
7.36 Disagreement decay for the Internet Explorer persistence attribute 161
7.37 Agreement decay for the Internet Explorer persistence attribute . 162
7.38 Performance of the variants evaluated for the technique for unique
user identification based on evolving device fingerprint detection . 172
8.1 Initial Data Collection task executed by the content-analysis tech-
niques . . . . . . . . . . . . . . . . . . . . . . . . . . . . . . . . . 177
8.2 Data Preparation Activity implemented by the content-analysis
techniques . . . . . . . . . . . . . . . . . . . . . . . . . . . . . . . 179
8.3 Clean data task executed by the content-analysis techniques . . . 180
8.4 Construct data task executed by the content-analysis techniques . 183
8.5 Format of the data used by the technique for detecting Consumer
Decision Journey stages . . . . . . . . . . . . . . . . . . . . . . . 195
8.6 Distribution of the texts along the media sources and sectors for
the Consumer Decision Journey gold standard . . . . . . . . . . . 196
xxi

8.7 Distribution of the texts along the Consumer Decision Journey
categories . . . . . . . . . . . . . . . . . . . . . . . . . . . . . . . 197
8.8 Example annotation of a post according to a Consumer Decision
Journey category using Amazon Mechanical Turk . . . . . . . . . 199
8.9 Format of the data used by the technique for detecting Marketing
Mix attributes . . . . . . . . . . . . . . . . . . . . . . . . . . . . . 208
8.10 Example annotation of a post according to a Marketing Mix Cat-
egory using Amazon Mechanical Turk . . . . . . . . . . . . . . . . 209
8.11 Format of the data used by the technique for detecting emotions . 215
8.12 Example annotation of a post according to a Emotions category
using Amazon Mechanical Turk . . . . . . . . . . . . . . . . . . . 217
8.13 Data format of the corpus used by the technique for detecting the
place of residence of social media users . . . . . . . . . . . . . . . 225
8.14 Example of user profile location metadata . . . . . . . . . . . . . 227
8.15 Example of an output of the Google Geocoding API . . . . . . . . 228
8.16 Example execution of table location filtering process . . . . . . . . 230
8.17 Example of user profile description metadata . . . . . . . . . . . . 232
8.18 Example of location extraction from content . . . . . . . . . . . . 234
8.19 Data format of the corpus used by the technique for detecting the
gender of social media users . . . . . . . . . . . . . . . . . . . . . 236
8.20 Example of user profile name metadata . . . . . . . . . . . . . . . 238
8.21 Dependency tree obtained from a tweet that mentions to a user . 240
8.22 Accuracy of the Consumer Decision Journey classifier for English 244
8.23 Accuracy of the Consumer Decision Journey classifier for Spanish 245
8.24 Accuracy of the Consumer Decision Journey classifier by sector . 246
8.25 Accuracy of the Marketing Mix classifier for English . . . . . . . . 247
8.26 Accuracy of the Marketing Mix classifier for Spanish . . . . . . . 248
8.27 Accuracy of the emotions classifier . . . . . . . . . . . . . . . . . 250
8.28 Accuracy of the emotions classifier by sector . . . . . . . . . . . . 251
8.29 Accuracy of the emotions classifier by social media type . . . . . . 251
8.30 Performance of the gender recognition approaches . . . . . . . . . 253
xxii

List of Tables
2.1 Prefixes that can be declared in a web server log file . . . . . . . . 16
2.2 Identifiers that can be declared in a web server log file . . . . . . . 17
2.3 Subcategories of the Marketing Mix elements . . . . . . . . . . . . 40
2.4 Categories for the sentiment classification, organised according to
their polarity . . . . . . . . . . . . . . . . . . . . . . . . . . . . . 42
2.5 Relations between the conceptual framework of emotions used in
this thesis and the Wordnet-Affect taxonomy . . . . . . . . . . . . 43
2.6 Example lemmatisation and part-of-speech tagging of an example
text . . . . . . . . . . . . . . . . . . . . . . . . . . . . . . . . . . 48
5.1 Vocabularies selected for defining the Social Graph Ontology . . . 84
5.2 Properties of the class sioc:UserAccount . . . . . . . . . . . . . . 92
5.3 Properties of the class sioc:Post (1/2) . . . . . . . . . . . . . . . . 93
5.4 Properties of the class sioc:Post (2/2) . . . . . . . . . . . . . . . . 94
5.5 Properties of the class sioc:Forum . . . . . . . . . . . . . . . . . . 94
5.6 Properties of the class marl:Opinion . . . . . . . . . . . . . . . . 95
5.7 Properties of the class skos:Concept . . . . . . . . . . . . . . . . . 95
5.8 Properties of the class sioc:Community . . . . . . . . . . . . . . . 95
5.9 Properties of the class rdfg:Graph . . . . . . . . . . . . . . . . . . 95
5.10 Properties of the class sioc:Site . . . . . . . . . . . . . . . . . . . 96
5.11 Properties of the class foaf:Document . . . . . . . . . . . . . . . . 98
5.12 Properties of the class schema:Review . . . . . . . . . . . . . . . . 98
5.13 Property of the class sioc:Role . . . . . . . . . . . . . . . . . . . . 101
5.14 Properties of the class foaf:Agent . . . . . . . . . . . . . . . . . . 101
5.15 Properties of the class foaf:Person . . . . . . . . . . . . . . . . . . 101
xxiii

5.16 Properties of the class foaf:Activity . . . . . . . . . . . . . . . . . 101
5.17 Properties of the class sgo:Cookie . . . . . . . . . . . . . . . . . . 102
5.18 Properties of the class sgo:Fingerprint . . . . . . . . . . . . . . . 102
5.19 Properties of the class tzont:PoliticalRegion . . . . . . . . . . . . . 107
5.20 Properties of the class tzont:Country . . . . . . . . . . . . . . . . 108
5.21 Properties of the class tzont:State . . . . . . . . . . . . . . . . . . 108
5.22 Properties of the class tzont:County . . . . . . . . . . . . . . . . . 108
5.23 Properties of the class tzont:City . . . . . . . . . . . . . . . . . . 108
5.24 Properties of the class schema:Continent . . . . . . . . . . . . . . 108
5.25 Properties of the class tzont:TimeZone . . . . . . . . . . . . . . . 108
6.1 Distribution of part-of-speech categories by social media type . . . 112
7.1 Statistics associated to the number of records gathered per unique
user . . . . . . . . . . . . . . . . . . . . . . . . . . . . . . . . . . 126
7.2 Distribution of visits for the 10 countries that generated more site
activity . . . . . . . . . . . . . . . . . . . . . . . . . . . . . . . . 128
7.3 Entropy of fingerprint attributes . . . . . . . . . . . . . . . . . . . 128
7.4 Cross-entropy between pairs of fingerprint attributes . . . . . . . 129
7.5 Conditional entropy between pairs of fingerprint attributes . . . . 130
7.6 User-Agent values for Google, Bing, and Yahoo! robots . . . . . . 132
7.7 Disagreement decay of fingerprint attributes . . . . . . . . . . . . 142
7.8 Agreement decay of fingerprint attributes . . . . . . . . . . . . . . 143
7.9 Evaluation results for the variant based on uniform weights . . . . 167
7.10 Evaluation results for the variant based on attribute entropy . . . 168
7.11 Evaluation results for the variant based on time decay . . . . . . . 169
7.12 Evaluation results for the variant based on attribute entropy and
time decay . . . . . . . . . . . . . . . . . . . . . . . . . . . . . . . 171
7.13 Comparison of the variants with more performance . . . . . . . . 173
8.1 Examples of the linguistic patterns for identifying Consumer De-
cision Journey stages . . . . . . . . . . . . . . . . . . . . . . . . . 202
8.2 Primary and secondary sentiments . . . . . . . . . . . . . . . . . 214
8.3 Distribution of texts for the sentiment corpus by social media type 215
xxiv

8.4 Distribution of texts for the sentiment corpus by domain . . . . . 216
8.5 Distribution of texts for the sentiment corpus for the training and
test sets by domain . . . . . . . . . . . . . . . . . . . . . . . . . . 219
8.6 Excerpt from sentiments in Badele3000 . . . . . . . . . . . . . . . 221
8.7 Examples of rules for classifying emotions . . . . . . . . . . . . . 223
8.8 Collocations of “odio” in Badele3000 . . . . . . . . . . . . . . . . 223
8.9 Accuracy of the place of residence identification approaches . . . . 252
8.10 Coverage of the gender recognition approaches . . . . . . . . . . . 253
8.11 Confusion matrix with the results of the approach based on men-
tions to users. . . . . . . . . . . . . . . . . . . . . . . . . . . . . . 254
9.1 Rule reordering example . . . . . . . . . . . . . . . . . . . . . . . 264
xxv

xxvi

Chapter 1
INTRODUCTION
The rise of Web 2.0 technologies and social media has enabled users to author their
own content. This has populated the Web with huge amounts of user-generated
content that can be exploited for many different and interesting purposes, such
as explaining or predicting real world outcomes through opinion mining, which
provides a valuable tool for market research. Data scientists in almost every
industry that is exposed to public opinion are under pressure to deal with the
explosive growth of social media. Such professionals must be aware of what is
said about the issues that affect their business in different social media channels.
Social media are media in which information is created by the interaction
of users, who express their opinions freely and spontaneously. This has rev-
olutionised the way in which organisations and consumers interact. Users have
adopted massively these channels to engage in conversations about content, prod-
ucts, and brands, while organisations are striving to adapt proactively to the
threats and opportunities that this new dynamic environment poses. Social me-
dia is a knowledge mine about users, communities, preferences and opinions,
which has the potential to impact positively marketing and product development
activities [Weber, 2007].
In the marketing field, media and society digitalisation has revolutionised the
rules of traditional brand communication with an explosion of channels and pos-
sibilities for brands to contact consumers. Brands and media agencies are facing
a big challenge developing systems to assure the best communication strategy
for the brand (in terms of cost, effectiveness and efficiency). Activities such as
1

word-of-mouth advertising where products or brands are promoted via oral or
written communication have successfully adapted to social media through viral
processes. It is becoming essential to know the views of consumers towards brands
and products for designing advertisement campaigns, estimating future sales and
deciding the strategy to follow when launching a new brand image. According to
a Nielsen [2012b] report, 70% of social media users take into account the product
experience published by other users; 65% declare to search information about
brands, products and services; 53% express positive comments on brands; and
50% express complaints at least once per month.
Social media monitoring tools are being used successfully in a range of do-
mains (including market research, online publishing, etc.). However, tools avail-
able nowadays to analyse social media do not leverage completely the rich and
complex information structure generated by users. Most of these tools elaborate
their reports from metrics based on volume of posts, opinion polarity about the
subject that is being studied, and users’ reputation. Although such metrics are
good indicators of a subject’s popularity and relevance, these metrics are often
inadequate for capturing complex multi-modal dimensions of the subjects to be
measured that are relevant to business, and must be complemented with ad-hoc
studies such as opinion polls. Therefore, existing opinion-mining techniques must
be extended for discovering other aspects of discourse, such as consumer intents,
mood and emotions. Overcoming some of the limitations of current tools to man-
age and analyse the information produced in social media is a pending challenge
that this thesis addresses.
The main goal of this thesis is to provide a data model and a set of
techniques based on Web users tracking and natural language process-
ing for extracting semantic information from the contents generated
by consumers in social media. In the following paragraphs we introduce the
specific contributions of this thesis to the State of the Art.
The disparity of formats, mechanisms for accessing the information, content
sizes, and metadata hinders the collection, integration and processing of the con-
tent published in social media, forcing to use specific methods and techniques for
each kind of media. In this thesis, we provide a data model for the mar-
keting domain that can be using for standardising and normalising the
2
information that can be extracted from social media about consumers,
brands, media and opinions of consumers about brands (C1).
The distributed nature of the Web and the disparity of devices, that can
be used to access social media (PCs, smartphones, tablets, smart TVs, etc.)
make difficult to track the actions performed by users for web analytics purposes.
Unique user identification is a key task within the web analytics data collec-
tion process, and is useful for measuring the effectiveness of online advertising
campaigns, among other applications. The fingerprinting technique consists in
tracking user activity on a set of sites by capturing technical information about
the browser and the machine that the user employs to navigate the Web. Browser
fingerprinting has been demonstrated to be an effective method for unique user
identification when the device used to navigate the Web does not support cookies.
However as the attributes used for generating browser fingerprint evolve, multi-
ple distinct fingerprint records are created for the same user, leading to incorrect
unique user identification. This thesis contributes to the State of the Art
with a technique for unique user identification that detects browser
fingerprint evolution (C3).
In the last decade, the availability of digital user-generated documents from
social media has dramatically increased. This massive growth of user-generated
content has also affected traditional shopping behaviour. Customers have em-
braced new communication channels such as microblogs and social networks that
enable them not just to talk with friends and acquaintances about their shopping
experience, but also to search for opinions expressed by complete strangers as
part of their decision making processes. Uncovering how customers feel about
specific products or brands and detecting purchase habits and preferences has
traditionally been a costly and highly time-consuming task which involved the
use of methods such as focus groups and surveys. However, the new scenario calls
for a deep assessment of current market research techniques in order to better
interpret and profit from this ever-growing stream of attitudinal data.
With this purpose, we present a novel analysis and classification of
user-generated content in terms of it belonging to one of the four stages
of the Consumer Decision Journey [Court et al., 2009] (i.e. the purchase
process from the moment when a customer is aware of the existence of the product
3

to the moment when he or she buys, experiences and talks about it) (C4.1).
Using a corpus of short texts written in English and Spanish and extracted from
different social media, this thesis identifies a set of linguistic patterns for each
purchase stage that will be then used in a rule-based classifier. Additionally,
we use machine-learning algorithms to automatically identify business
indicators such as the Marketing Mix elements [McCarthy and Brogowicz,
1981] (C4.2).
Sentiment analysis of social media is of commercial interest as user-generated
content published in the Web reaches and influences many potential customers.
Most work in this field has focused on opinion polarity (positive or negative) and,
therefore, does not specify the kind of sentiment related to that opinion. In order
to provide this information, this thesis establishes four polarised categories
that capture the main sentiments that can be found on social media:
satisfaction-dissatisfaction (SD), trust-fear (TF), love-hate (LH), and
happiness-sadness (HS). It develops a rule-based system that classifies
texts in Spanish from those social media, according to this sentiment
classification with respect to a brand, company or product. The rules
have been written in a simple grammar after (linguistically) analysing a corpus
of different business domains whose texts had been manually classified (C4.3).
Characterising users through demographic attributes is a necessary step be-
fore conducting opinion surveys from information published by such users in
social media. In this thesis, we describe, compare and evaluate different
techniques for the identification of the attributes “gender” (C4.4) and
“place of residence” (C4.5) by mining the metadata associated to the users,
the content published and shared by themselves, and their friendship networks.
Natural language processing techniques are a key technology for analysing
user-generated content. Despite some efforts have been done to structure social
media information, such as Twitlogic [Shinavier, 2010], there is still the need for
approaches that are able to cope with the different channels in the Social Web
and with the challenges they pose. The content published in social media is char-
acterised by the use of casual language; social media posts contain texts that
vary in length from short sentences in microblogs to medium-size articles in web
logs. Very often the text published in social media contains misspellings, is com-
4

pletely written in uppercase or lowercase letters, or it is composed of set phrases,
among other characteristics that challenge existing content analysis techniques,
leading to problems regarding the accuracy of natural language processing tools
like part-of-speech taggers. As an example, for the Spanish language, the absence
of an accent in a word may give such word a completely different meaning.
As a minor contribution, this thesis studies the differences of the lan-
guage used in heterogeneous social media sources, by analysing the dis-
tribution of the part-of-speech categories extracted from the analysis of the mor-
phology of a sample of texts published in such sources, showing that the task
of normalising user-generated content is a necessary step before analysing social
media posts, particularly on Twitter1 (C2). Therefore the content analysis tech-
niques proposed by this thesis implement a stage that performs a morphological
normalisation of user-generated content that makes use of on-line and collectively
developed resources, including Wikipedia2 and a SMS lexicon. The results ob-
tained demonstrate that the normalisation of user-generated content improves
slightly the accuracy of the content analysis techniques presented in this thesis.
1.1 Thesis Structure
This thesis is structured as follows:
• Chapter 2 reviews the State of the Art and identifies the open research
problems addressed in this thesis.
• Chapter 3 presents the objectives of this thesis, which were defined accord-
ing to the open research problems identified in Chapter 2. In addition, we
present the contributions to the State of the Art, as well as the assump-
tions and hypotheses on which our contributions rely. Finally we describe
the restrictions, which define the scope of the different contributions.
• Chapter 4 presents the research methodology, and the method followed
for obtaining the artefacts provided by this thesis, which is inspired in an
1http://twitter.com2http://www.wikipedia.org
5

existing framework for web mining. For defining the model of the data
warehouse we have followed an existing methodology for building ontology
networks. For addressing the rest of the phases defined by the framework,
we have followed an existing data mining process model.
• Chapter 5 describes the data model that we have designed for representing
the information extracted from social media for the marketing domain.
• Chapter 6 characterises the different kinds of social media according to the
morphosyntactic characteristics of the textual content published in such
media.
• Chapter 7 provides a technique for uniquely identifying users in social media
based on the fingerprint of their devices, regardless the evolution of such
fingerprints. The chapter also presents the evaluation results and describes
the data set used for evaluating the technique.
• Chapter 8 presents a collection of techniques for extracting sociodemo-
graphic and psychographic profiles from social media users applied to the
marketing domain, through the analysis of the opinions they express about
brands, as well as from the profiles published by them in social networks.
The chapter also presents the evaluation results and describes the data sets
used for evaluating the techniques.
• Finally, Chapter 9 presents research conclusions and possible future lines of
research and innovation.
6

1.2 Dissemination of Results
Some of the contributions produced within the framework of this thesis have been
published in international peer-reviewed journals, conferences and workshops. In
the following we list the contributions along with the publications that support
them.
The technique proposed for uniquely identifying users in social media based
on the fingerprint of their devices has been published in an international journal:
Oscar Munoz-Garcıa, Javier Monterrubio-Martın, Daniel Garcıa-
Aubert. Detecting browser fingerprint evolution for identi-
fying unique users. International Journal of Electronic Business,
10(2):120–141, 2012, ISSN 1470-6067, DOI 10.1504/IJEB.2012.051116.
The techniques proposed for classifying user-generated content into Consumer
Decision Journey stages and Marketing Mix elements have been published in an
international journal indexed by JCR:
Silvia Vazquez, Oscar Munoz-Garcıa, Ines Campanella, Marc Poch,
Beatriz Fisas, Nuria Bel, Gloria Andreu. A classification of user-
generated content into Consumer Decision Journey stages.
Neural Networks, 58:68–81, October 2014, ISSN 0893-6080,
DOI 10.1016/J.NEUNET.2014.05.026.
The technique proposed for detecting emotions has been published in the
proceedings of a Spanish conference:
Guadalupe Aguado-de-Cea, Marıa Auxiliadora Barrios, Marıa So-
corro Bernardos, Ines Campanella, Elena Montiel-Ponsoda, Oscar
Munoz-Garcıa, Vıctor Rodrıguez. Analisis de sentimientos en
un corpus de redes sociales. In Proceedings of the 31st AESLA
(Asociacion Espanola de Linguıstica Aplicada) International Confer-
ence, San Cristobal de la Laguna, Tenerife, Spain, April 2014.
7

The techniques proposed for identifying the place of residence and gender of
social media users have been published in a Spanish journal:
Oscar Munoz-Garcıa, Jesus Lanchas Sampablo, David Prieto Ruız.
Characterising social media users by gender and place of res-
idence. Procesamiento del Lenguaje Natural, 51:57–64 , September
2013, ISSN 1135-5948.
The characterisation of the different kinds of social media according to the
morphosyntactic characteristics of the textual content published in such media
has been published in the proceedings of an international workshop:
Oscar Munoz-Garcıa, Carlos Navarro. Comparing user gener-
ated content published in different social media sources. In
Proceedings of the NLP can u tag #user generated content ?! via lrec-
conf.org Workshop co-located with Eighth International Conference on
Language Resources and Evaluation (LREC 2012), pp. 1–8, Istanbul,
Turkey, 26 May 2012.
Finally, the approach that we follow for performing morphological normali-
sation of social media posts has been published in the proceedings of a Spanish
workshop:
Oscar Munoz-Garcıa, Silvia Vazquez Suarez, Nuria Bel. Exploit-
ing Web-based collective knowledge for micropost normalisa-
tion. In Proceedings of the Tweet Normalization Workshop co-located
with 29th Conference of the Spanish Society for Natural Language
Processing (SEPLN 2013), pp. 10–14, Madrid, Spain, 20 September
2013, ISSN 1613–0073.
8

Chapter 2
STATE OF THE ART
This chapter reviews the State of the Art regarding the objectives of this thesis.
The information published in social media consists of connected data by na-
ture, due to the interlinked nature of social networks. Therefore, graph-based
data models are an appropriate way of representing the relationships between
the users and contents included in social media. Section 2.1 describes existing
semantic vocabularies that can be used for representing social media information.
Such vocabularies will be reused in this thesis to provide a normalised schema for
structuring the information published in social media.
This thesis provides a technique for unique user identification which is an
essential step for tracking the activity of users in the Web. Section 2.2 describes
the existing techniques for tracking users in the Web, while Section 2.3 describes
a technique for detecting the evolution of temporary records, upon which our user
technique for identifying unique users is based.
Additionally, this thesis has a strong business context, and its objectives are
devoted to solve specific problems related with the marketing field. Section 2.4
describes the State of the Art on social media analysis applied to market re-
search, while Section 2.5 introduces the marketing background upon which the
contributions of our thesis are based.
Finally, many of the contributions of this thesis rely on natural language
processing techniques applied to the analysis of textual content published in social
media, whose State of the Art is described in Section 2.6. In the following we
detail the State of the Art and existing research problems related with it.
9

2.1 Semantic Vocabularies for Representing So-
cial Media Information
Social media and the online communities built around them are silos whose users,
contents, topics, etc. are rarely connected among them (e.g. Twitter data is
not connected with Facebook3 data), except for minor service integrations (e.g.
publishing a tweet whenever an status update is made in a LinkedIn4 account).
In addition, there is no unified data format according to which to express the
information posted to every social media. For example, the data published using
the Facebook Graph API5 does not match the one used by the Twitter API6,
neither do match the content syndication formats RSS7 and Atom [Nottingham
and Sayre, 2005], commonly used by weblogs and news publication sites.
Format heterogeneity and cross-social network integration issues difficult data
gathering and the integrated analysis of the data published in social media. SIOC
[Breslin et al., 2006] is a Semantic Web ontology designed to cope with these is-
sues. It uses RDF8 for representing data published in social media, allowing
linking posts, authors, topics, and other concepts, regardless specific social net-
works, therefore providing a mechanism for integrating information related to
online communities.
The SIOC vocabulary is linked with FOAF [Graves et al., 2007] for repre-
senting information about users and user-accounts. FOAF defines a data model
of persons and relationships between persons, including mappings with other Se-
mantic Web vocabularies, like Schema.org9.
Schema.org is a vocabulary designed for marking up HTML10 pages to improve
indexing and metadata visualisation by search providers like Google11, Yahoo!12
3http://www.facebook.com4http://www.linkedin.com5http://developers.facebook.com/docs/graph-api6https://dev.twitter.com7http://www.rssboard.org/rss-specification8http://www.w3.org/TR/rdf11-concepts9http://schema.org
10http://www.w3.org/TR/html511http://www.google.com12http://www.yahoo.com
10
and Bing13. This vocabulary includes a rich set of classes and properties that can
be used for complementing the ones provided by SIOC and FOAF for annotating
users and contents.
Additionally, SIOC reuses the Dublin Core vocabulary14 for aggregating meta-
data to posts (e.g. title, summary, publication date) using properties standardised
by DCMI (Dublin Core Metadata Initiative)15.
The SIOC specification16 suggests using SKOS [Miles et al., 2005] for repre-
senting topics according to which contents can be categorised. SKOS is a RDF
vocabulary that provides a model for representing conceptual schemes such as,
thesauri, classification schemes, subject heading lists, taxonomies, and other king
of controlled vocabularies within the framework of the Semantic Web.
Regarding geo-localisation of contents and users, FOAF is linked with the
WGS8417 vocabulary that allows annotating resources with geographical coordi-
nates. In addition, for representing time zones and political regions (e.g. coun-
tries and states) the ontology Time Zone18 can be used. Schema.org also provides
ontology elements for describing spatial features of web resources.
SIOC does not provide ontology elements, neither a recommendation for an-
notating the content with the results of natural language analysis processes. Nev-
ertheless there exists multiple vocabularies that can be used for performing this
task. As an example, the categorisation model ISOcat [Kemps-Snijders et al.,
2008] can be used for annotating contents with linguistic information based on a
standardised set of categories.
With respect to Opinion Mining, Marl [Westerski et al., 2011] is an ontology
used for annotating and describing opinions according to the polarity expressed
in them with respect to specific entities (e.g. brands, persons) mentioned in
social media. Therefore it provides ontology elements for classifying opinions
into three possible categories of polarity (i.e. positive, negative, neutral) and for
quantifying such polarity according to a numeric scale. Additionally, the Onyx
13http://www.bing.com14http://dublincore.org/documents/dcmi-terms15http://dublincore.org16http://rdfs.org/sioc/spec17http://www.w3.org/2003/01/geo18http://www.w3.org/2006/timezone
11

ontology [Sanchez-Rada and Iglesias, 2013] allows categorising opinions into a
broader set of emotions, like the ones described by the Wordnet-Affect taxonomy
[Valitutti et al., 2004].
Multiple instances of social graphs can be used to perform analyses with dif-
ferent data sets (e.g. for analysing different domains or markets). These instances
can be treated separately with RDF named graphs, and each named graph can
be described by using the graph description metadata, like the one provided by
the RDFG vocabulary [Carroll et al., 2005].
Finally, the PROV-O (PROV Ontology)19 provides a set of ontology elements
that can be used for representing and exchanging information of the provenance
of data generated by different systems. Therefore, it can be used within the
social media field for indicating the content authoring entities and referencing
publication sources. PROV-O has been mapped with the Dublin Core vocabu-
lary20, which in turn is mapped with FOAF. Thus, expressing social media facts
using the FOAF and Dublin Core vocabularies automatically adds provenance
information through the existing mappings.
All these vocabularies are richer enough for describing general-purpose social
graphs. However, we have not found during our survey vocabularies that allow
describing some of the concepts related with the Marketing domain this thesis
deals with and that will be explained in the following sections. Neither there
exists a unified model that integrates the different vocabularies.
2.1.1 Conclusions
Open Research Problem 1. While there exist data models for representing
information captured from social media, either generic or social-network-specific,
there are not schemas that integrate such information with marketing-specific clas-
sifications and KPIs (Key Performance Indicators) obtained from the analysis of
the content generated by the consumers and the activity produced by them in so-
cial media. Therefore, the existing vocabularies may be extended with ontology
elements that model marketing-related knowledge.
19http://www.w3.org/TR/prov-o20http://www.w3.org/TR/prov-dc
12

Open Research Problem 2. The existing data models for representing social
media information characterise the metadata that accompany the content pub-
lished in the different kind of media. However, there is not a characterisation of
such media according to the linguistic features of the textual contents published
on them.
2.2 Techniques for Tracking Users in the Web
User tracking consists in registering the activity of users as they interact with
one or more websites so that such activity can be related with specific, uniquely
identified users.
The tracking of users is an essential activity in order to perform Web Ana-
lytics. Web Analytics is the professional discipline designed to draw conclusions,
define strategies, or establish business rules on the basis of data collected in all
web environments on which a company has control [Maldonado, 2009]. Web An-
alytics is a professional discipline because there is an industry related to Business
Intelligence, Market Research and Marketing, which demands professionals with
Web Analytics skills, which provide insights to their customers. Web Analytics
allows studying the behaviour of users in websites, drawing conclusions, such as
why they came to the site and from where, why they leave and where they went
to, why they do not perform the actions we were expecting them to perform, or
what search terms were used to get to the website. The strategies and business
rules that Web Analytics enable are oriented to drive a continous improvement of
the online experience that customers and potential customers have, leading them
to website desired outcomes [Kaushik, 2009].
Web Analytics are used for measuring the performance of websites in a com-
mercial context, providing a measurement model to Digital Marketing, allowing
to quantify the effectiveness and impact of advertisement campaigns in digital
media. Data gathered by applying Web Analytics (e.g. number of persons that
have visualised a banner) are typically compared against KPI (e.g. outreach of
a campaign) and used to improve the audience response to marketing campaigns
(e.g. move the banner to a site with more audience). The most significant KPIs
depend on counting unique visitors.
13

Within a Web Analytics context, the data collection process consists in record-
ing the activity generated by users while they interact with a set of websites. Such
recorded activity may contain records about advertisement impressions, clicks on
web page hyperlinks, and other navigational information. Collected data is useful
for a number of marketing activities, such as, analysing advertisement campaign
outreach or performing behavioural targeting, which involves tracking the on-line
activities of users in order to deliver tailored ads to them. Specifically, ad target-
ing techniques, such as the one described by Deane et al. [2011], rely on data with
users uniquely identified. For collecting such data, firstly the activity itself must
be captured. After that, such activity must be associated with unique visitors.
Visits and unique visitors are the basic web metrics required for nearly every
web metric calculation [Kaushik, 2009]. As defined by the Digital Analytics
Association [Burby and Brown, 2007]:
Definition 1. A visit is an interaction, by an individual, with a website con-
sisting of one or more requests for an analyst-definable unit of content (i.e. page
view).
Definition 2. The KPI unique visitors refers to the number of inferred indi-
vidual people (filtered for spiders and robots), within a designated reporting time-
frame, with activity consisting of one or more visits to a site. Each individual is
counted only once in the unique visitor measure for the reporting period.
At least six of the eight critical web metrics defined by Kaushik [2009] depend
on uniquely identifying users (i.e. unique visitors, time on page, time on site,
bounce rate, exit rate, and engagement). The other two are visits and conversion
rate. Conversion rate can be calculated by taking into account either unique
visitors or visits, depending on business objectives.
2.2.1 Techniques for Capturing Web Activity
There are four main ways of capturing the activity (a.k.a. clickstream data) of
website users [Kaushik, 2007]: web logs, web beacons, JavaScript tags, and packet
sniffing. This section describes these approaches and analyses their advantages
and disadvantages.
14

23
4
Web Servers1
Log files
Figure 2.1: Process followed by the technique based on web logs (adapted fromKaushik [2007])
2.2.1.1 Technique Based on Web Logs
Web logs are a classic system for capturing clickstream data. This technique is
implemented by web servers and consists in registering one log entry each time
there is a request to a web server by a web client. In such log-based systems, the
web server triggers the log action when it receives a request from the client.
Figure 2.1 shows the process followed by this technique. The steps of this
process are the following:
1. A user requests a resource (e.g. a web page) through its URL [Berners-Lee,
1994].
2. The request is sent to a web server.
3. The server receives the request and creates a record in its log describing the
request.
4. Finally, the server sends the resource to the user.
The format of web server logs has been standardised by W3C21. The standard
proposes to describe log files as a sequence of log entries preceded by a header
with one or more of the metadata described next:
Version. Specifies the version of the log file format used.
21http://www.w3.org/TR/WD-logfile.html
15

Prefix Descriptionc Client.s Server.r Remote.cs Client to Server.sc Server to Client.sr Server to Remote Server. This prefix is used by proxies.rs Remote Server to Server. This prefix is used by proxies.x Application specific identifier.
Table 2.1: Prefixes that can be declared in a web server log file
Fields. Specifies the fields recorded in the log. Such fields are defined by using
a prefix and a field identifier. The prefix refers to the information transfer
mode, while the identifier refers to an entry data type. For example, the
identifier cs-method refers to the HTTP method [Fielding and Reschke,
2014b] used for data transfer from client to server. Table 2.1 shows the list
of available prefixes, while Table 2.2 shows the possible fields that can be
registered, indicating if the field requires or does not require to declare a
prefix.
Software. Identifies the software that generated the log.
Start-Date. The date and time at which the log was started.
End-Date. The date and time at which the log was finished.
Date. The date and time at which the entry was added.
Remark. Comment information. Analysis tools should ignore data recorded in
this field.
Listing 2.1 shows an example file log that includes a header in which the
version used (line 1), the recording date (line 2), and fields registered (line 3) are
specified. Registered fields correspond to the timestamp of particular requests,
the HTTP method used, and the URI of the resource requested.
The technique based on logs is the most accessible from all the techniques
for recording web activity, since most web servers implement it. Also, there are
16

Identifier Description Prefix Typedate Date at which transaction completed. No Datetime Time at which transaction completed. No Timetime-taken Time taken for transaction to complete in
seconds.No Fixed
bytes Number bytes transferred. No Integercached Records whether a cache hit occurred. No Integerip IP [Postel, 1981] address and port. Yes Addressdns DNS name [Mockapetris, 1987]. Yes Namestatus Status code [Fielding and Reschke, 2014b]. Yes Integercomment Comment returned with status code. Yes Textmethod HTTP method. Yes Nameuri URI [Berners-Lee et al., 2005]. Yes URIuri-stem Stem portion alone of URI (omitting query). Yes URIuri-query Query portion alone of URI. Yes URI
Table 2.2: Identifiers that can be declared in a web server log file
1 #Version: 1.02 #Date: 12−Jan−1996 00:00:003 #Fields: time cs−method cs−uri4 00:34:23 GET /foo/bar.html5 12:21:16 GET /foo/bar.html6 12:45:52 GET /foo/bar.html7 12:57:34 GET /foo/bar.html
Listing 2.1: Example log file
numerous tools that allow analysis of logs such as AWStats22, Webalizer23 and
Analog24.
The main criticism to this technique is that the information captured in log
files is often too technical (HTTP errors [Fielding and Reschke, 2014b], browser
types, etc.) to be used directly for business purposes (e.g. marketing intelligence).
Similarly, the information recorded in the logs is too large, since it records the
download of any resource provided by the web server (style sheets, images, etc.)
22http://awstats.sourceforge.net23http://www.webalizer.org24http://www.analog.cx
17

regardless it worths been measured or not. Therefore the log files must be con-
veniently filtered prior to their analysis.
The technique based in logs is able to register any activity that implies an
HTTP request [Fielding and Reschke, 2014a] from the client to the server. How-
ever it is not able to register users’ behaviour on web pages that do not require a
resource download operation. Such operations are becoming more common due
to dynamic web pages.
2.2.1.2 Technique Based on Web Beacons
The web beacons technique consists in placing banners, or 1×1 pixel transparent
images, in web pages within img src HTML tags. When these tags are processed,
a request to a tracking server is performed, what triggers the recording of the
activity.
Figure 2.2 shows the process followed by this technique. The steps of this
process are the following:
1. A user requests a web page through its URL.
2. The request is sent to a web server.
3. The server sends the web page including an image of 1 × 1 pixels whose
URL points to a data collection server.
4. When the web page is loaded in the user’s browser, a request of the image
is sent to the data collection server.
5. The data collection server sends the image to the user, taking advantage of
the HTTP protocol for managing cookies in the user’s device, and capturing
user data, such as the web page that the user is viewing, the IP address of
the user’s device, the timestamp of the activity, etc.
Web beacons are used not only to capture information relating to the navi-
gation of web pages; they can also can be inserted into email messages, so KPIs
about an email sent can be recorded (e.g. number of email views). However,
users often disable the download of images within their email applications.
18

4
5Data Collector1
2
3
Website Servers
Figure 2.2: Process followed by the technique based on web beacons (adaptedfrom Kaushik [2007])
2.2.1.3 Technique Based on JavaScript Tags
The JavaScript tags technique is the most used nowadays, existing multiple com-
mercial tools that implement it (e.g. Adobe Marketing Cloud25, IBM EMM26,
webtrends27, and Google Analytics28). It consists in placing JavaScript [ECMA,
2011] code within HTML pages, so that, when an event to be measured is pro-
duced, the scripting code is evaluated. Such code includes a request to a tracking
server. Thus, when the script is evaluated, the request is performed and the
activity is recorded.
Figure 2.3 shows the process followed by this technique. The steps of this
process are the following:
1. A user requests a web page through its URL.
2. The request is sent to a web server.
3. The server sends the web page including a script of JavaScript code assigned
to different events (e.g. web page load, click on an active item).
4. When an event is triggered, its assigned JavaScript code is executed. Such
code includes sending an HTTP request to a data collection server.
25http://www.adobe.com/en/solutions/digital-marketing.html26http://www.ibm.com/software/products/category/enterprise-marketing-management27http://webtrends.com28http://www.google.com/analytics
19

5. The data collection server processes the request, taking advantage of the
HTTP protocol for managing cookies in the user’s device, and capturing
user data, such as the web page that the user is viewing, the IP address of
the user’s device, the timestamp of the activity, etc.
Both, the technique based in web beacons and the technique based in JavasS-
cript tags, allow collecting the web activity produced in multiple websites into a
single data collection system. Figure 2.4 illustrates this scenario.
4
5Site AnalyticsServices
12
3
Website Servers
Figure 2.3: Process followed by the technique based on JavaScript tags (adaptedfrom Kaushik [2007])
4
5
Site AnalyticsServices
1
2
3
Website 1 servers
2
3
Website 2 servers
Data Collector
Figure 2.4: Process followed by the tags or web beacons techniques for gatheringdata from multiple sites (adapted from [Kaushik, 2007])
20

2.2.1.4 Technique Based on Packet Sniffing
The packet sniffing technique consists in inspecting IP packages exchanged be-
tween web browsers and web servers. Packet sniffers can be implemented as a
software layer over the web server, or as an independent module that intercepts
and analyses the packages sent by web browsers before re-routing them to web
servers.
Figure 2.5 shows the process followed by this technique. The steps of this
process are the following:
1. A user requests a web page through its URL.
2. The request is intercepted in its route to the web server by a packet sniffer
that extracts the request data from the HTTP header of the request.
3. The packet sniffer re-routes the request to the web server.
4. The web server sends its response to the user’s browser. The response is
intercepted by the packet sniffer, which extracts the information about the
web page being served. Additionally, some sniffers add JavaScript tags to
the web page, with the aim of obtaining additional information, once the
browser processes the scripts.
5. The packet sniffer re-routes the response to the web browser.
2
5
1Website Servers
3
4
Packet Sniffer
Figure 2.5: Process followed by the technique based on packet sniffing (adaptedfrom Kaushik [2007])
21

2.2.2 Techniques for Identifying Unique Users
This section describes the existing techniques for identifying unique users. Sec-
tion 2.2.2.1 describes the widely used technique based on cookies, while Sec-
tion 2.2.2.2 describes a novel technique based on the fingerprint of the device
used for browsing the Web.
2.2.2.1 Technique Based on Cookies
With respect to the technique for uniquely identifying users, the one based on
cookies is the most extended. A cookie is a message sent to a web browser from
a web server. The browser stores the message and forwards it to the server each
time the web browser requests a page from the server. The web server can send
two different kinds of cookies:
1. Session cookies, which have a lifetime limited to the user interaction with
the website.
2. Persistent cookies, which remain on the machine of the user until a date of
cookie expiration.
The second type of cookies is the one used for user identification. Each time a
request comes from a web browser to a web server, the server checks if a specific
cookie exists on the client. If the cookie exists, the server obtains it and reads
a unique user identifier stored on it. If the cookie does not exist, the server
generates a new one, with a new unique user identifier, and sends it to the client.
Typically, cookies used to identify users contain a user identifier, unique and
anonymous, which identifies the browser. Therefore, this type of cookies identifies
browsers used by users to access the Web. If a user uses multiple devices, the
same user will be identified multiple times as a unique user (once per device).
Cookies may be disabled in web browsers, or not supported by certain devices,
such as smart TVs, so the user identification technique based on cookies cannot
be universally applied. In addition, the browser may be configured to delete
cookies periodically, or they can be erased by anti-spyware applications.
22

2.2.2.2 Technique Based on Fingerprint
The technique based on fingerprint is an alternative to the technique based on
cookies. This technique consists in identifying users from a number of attributes of
the web browser or that can be queried through it. These attributes are sent from
the web browser to the web server within the headers of each HTTP request, or are
available once a page has been loaded in the browser so that attribute values can
be sent to the web server using the JavaScript tags technique explained before.
Eckersley [2010] demonstrated the effectiveness of this technique by extracting
and collecting the fingerprints of 470,161 browsers. After analysing the data
Eckersley [2010] obtained the following conclusions:
• 83.6% of browsers have a unique fingerprint.
• In addition, 94.2% of the browsers with Adobe Flash Player29 or Java Vir-
tual Machine30 installed have a unique fingerprint. This is because, making
use of these technologies, more data are available for differentiating one
browser from another (e.g. the fonts installed on the system).
• The entropy [Shannon, 1948] associated with the distribution of fingerprints
is 18.1 bits, which means that, if a browser is taken at random, at most one
in 286,777 browsers share the same fingerprint.
• However, the fingerprint of each web browser may change quickly. The
number of unstable fingerprints was of 37.4% during the period of study.
The approaches for implementing user identification based on browser finger-
print are described next [Eckersley, 2010].
Use the fingerprint as a global identifier. The strength of this technique is
that, while cookies can be removed, disabled or not supported by certain
web browsers or specific devices (e.g. smartphones and set-top boxes), a
fingerprint can be always obtained. The weakness of this technique is that
changes on the client (e.g. updating the browser version) imply changes on
29http://www.adobe.com/products/flashplayer.html30http://www.java.com
23

the fingerprint and, therefore, unique user identification fails, since there
exist distinct fingerprints that correspond to the same user.
Use the fingerprint along with the IP address assigned to the user. The
strength of this approach is that it improves accuracy with respect to using
fingerprint as a global identifier, since adding the IP address to the finger-
print increments its entropy. However, the weakness of this approach is
that it fails in environments where the IP may change, as occur when using
DHCP [Droms, 1997].
Use the fingerprint along with the IP address to regenerate cookies. The
strength of this technique is that correspondences between the cookies and
the fingerprint of the users are maintained, so fingerprint is used to identify
users with a cookie previously assigned, when such cookie is lost due to
cookie expiration or deleted by anti-spyware software.
Eckersley [2010] proposes to construct the fingerprint from the attributes de-
scribed next.
User-Agent header. This HTTP header contains information about the device
used for requesting the web resource, like the browser version, and the
operating system installed in such device.
Accept header. This HTTP header determines the MIME [Freed and Boren-
stein, 1996] type of the content expected in a response to a HTTP request.
E.g.:
• The value text/html indicates that a web page in HTML format is
expected.
• The value image/jpg indicates that an image in JPEG format31 is
expected.
• The value text/* indicates that plain text is expected.
• The value */* indicates that any kind of content is expected.
31http://www.jpeg.org
24

Accept-Language header. This HTTP header determines the language ex-
pected in the response from a set of standard ones defined by Alvestrand
[1995].
Accept-Charset header. This HTTP header indicates the charset expected in
the response (e.g. UTF-8 [Yergeau, 2003]).
Accept-Encoding header. This HTTP header determines the encoding or com-
pression format expected in the response. Frequent values are gzip or de-
flate.
Cookies enabled. Represents the browser’s capability for accepting cookies.
This attribute is set to true when the browser responds with cookie val-
ues when asked by the web server. Otherwise the attribute is set to false.
Installed plugins. This attribute is composed by the names of the plugins in-
stalled in the web browser, their versions, and their assigned MIME types.
Installed fonts. The fonts installed in the computer where the browser is run-
ning.
Video. The video resolution and colour depth configured in such computer.
Time zone. The time zone of the user.
Session Storage. The capability of the browser for storing session data32 through
key-value pairs.
Local Storage. The capability of the browser for storing local data through
key-value pairs.
IE Persistence. The capability for persisting data when the user’s browser is
Internet Explorer33. This capability is enabled by modifying XML34 DOM
(Document Object Model)35 elements through JavaScript code.
32http://www.w3.org/TR/webstorage33http://windows.microsoft.com/internet-explorer34http://www.w3.org/TR/xml1135http://www.w3.org/DOM
25
The User-Agent and Accept headers are sent via HTTP from the user’s
browser to the web server. The rest of attributes are sent to the tracking server
by applying the technique based on JavaScript tags explained in Section 2.2.1.3.
An advantage of the browser fingerprinting technique is that a thorough se-
lection of fingerprint attributes may lead to cross-browser identification (i.e. as-
signing users to multiple browsers). Boda et al. [2012] have shown that a subset
of browser-independent attributes is enough to uniquely identifying most users.
A disadvantage of existing browser fingerprinting techniques is the evolution
of fingerprint over time, since the fingerprint makes use of attributes whose value
may change. Therefore, the tracking server may interpret that two different
fingerprints of the same browser correspond to different browsers. To solve this
problem, Eckersley [2010] describes an algorithm for detecting the evolution of the
fingerprints. This algorithm consists in measuring the lexical similarity between
pairs of different fingerprints. If this similarity exceeds a threshold (θ = 0.85), it
is considered that the two fingerprints represent the same user. This algorithm
can be significantly improved if different weights are assigned to the fingerprint
attributes, according to their importance, or if the time elapsed between finger-
prints registration is taken into account.
2.2.3 Conclusions
The metric unique visitors measures the audience of a site in terms of people that
have accessed site contents.
Counting unique visitors of websites is an essential activity in order to perform
Web Analytics, since many Web Analytics KPIs depend on individuals counted
only once (e.g. new visitors, return visitors, etc.).
There are many techniques to capture user activity, such as recording server
logs, using web bugs or JavaScript tags that make use of HTTP, HTML, and
JavaScript capabilities for triggering events that cause the registration of such
activity, or inspecting complex low-level network packets exchanged between
browsers and web servers.
The techniques most used for uniquely identifying users from captured web ac-
tivity are the ones that combine cookies and web bugs or JavaScript tags [Harding
26

et al., 2001]. This approach is being affected by several factors, such as strict pri-
vacy restrictions implemented by web browsers [Kaushik, 2007] or the use of new
devices for navigating the Web that do not support cookies (e.g. many set-top
boxes and certain video game consoles). Furthermore, several security programs,
such as antispyware ones, remove cookies periodically, making it difficult to trace
recurring visits to websites [Kaushik, 2007]. Thus, these security measures, en-
abled to protect the privacy of users, affect basic aggregated metrics obtained
with Web Analytics, from which valuable business insights can be derived, such
as the number of unique visitors of a website, or the bounce rate.
Open Research Problem 3. An alternative to cookies for uniquely identify-
ing users consists in capturing distinctive technical attributes of the system used
by such users to navigate the Web (i.e. their browser fingerprint). While Eck-
ersley [2010] demonstrated the effectiveness of this technique, such technique is
not entirely accurate, since browser fingerprint is built from attributes that evolve
over time. Thus, changes in values of fingerprint attributes lead to incorrectly
accounting new users.
2.3 Technique for Detecting the Evolution of
Temporary Records
Li et al. [2011] describe a method for detecting the evolution of temporary records.
This method takes into account the time elapsed between the capture of the
records for being compared, introducing the concept of time decay and defining
the probabilities described next.
Definition 3. Disagreement decay is the probability that an entity changes
the value of an attribute A within the time Δt. This probability is denoted by
d �=(A,Δt) [Li et al., 2011].
Definition 4. Agreement decay is the probability that two different entities
share the same value of A within the time Δt. This probability is denoted by
d=(A,Δt) [Li et al., 2011].
27

In addition, Li et al. [2011] describe two algorithms to learn agreement and
disagreement decays from existing training data, and different ways of calculating
the similarity between two records taking into account the probabilities defined
above, and the cardinality of the attributes (e.g. single-valued or multivalued).
Finally, the three algorithms for clustering temporal records described next are
provided.
2.3.1 Early Binding Algorithm [Li et al., 2011]
This algorithm processes the records in ascending time order. For each record,
the algorithm creates a new cluster, or adds it to an existing cluster.
Specifically, given a record r and a set of clusters C1, ..., Cn, the algorithm
consists in the execution of the following steps:
1. Calculate the similarity between r and each Ci, i ∈ [1, n].
2. Let sim(r, Cx) be the similarity between r a cluster Cx, choose the cluster
C with the biggest similarity.
(a) If sim(r, C) > θ add r to C, where θ is a threshold that indicates a
high similarity.
(b) Otherwise, create a new cluster Cn+1 for r.
3. Update the signature of the cluster (i.e. cluster description) to which r as
been added.
Given a set of records for being clustered, the computational complexity of this
algorithm is O(n2) (i.e. quadratic complexity), because the algorithm compares
once each pair of records.
2.3.2 Late Binding Algorithm [Li et al., 2011]
The strength of this algorithm is that, unlike the previous algorithm in which
decisions were made early, this algorithm stores information about all the com-
parisons between records and clusters and takes the decisions at end the process,
improving accuracy.
28

To store the information of the comparisons the algorithm makes use of a
data structure that stores a bipartite graph (Nr, NC , E) in which each node nr
represents a record, each node nC represents a cluster, and each edge (nr, nC) ∈ E
is labelled as the probability for a record r to belong to a cluster C.
The algorithm is implemented in two phases, called Evidence Collection and
Decision Making.
1. The Evidence Collection phase creates the bipartite graph and calculates
the weight for each edge. This step behaves in a similar way to the previous
algorithm, but storing all the probabilities instead of taking early decisions.
2. The Decision Making phase deletes edges with lower weights until each
record r belongs to a unique cluster C.
The weakness of this algorithm is that it adds a further analysis phase which
increments processing time, in comparison to early binding which runs in a single
phase. In addition, early binding has lower memory usage requirements than
late binding, as for each cluster the early binding algorithm maintains only the
last record that was added. In contrast, the late binding algorithm maintains all
records within the cluster as the cluster signature.
The computational complexity of late binding algorithm is also O(n2).
2.3.3 Adjusted Binding Algorithm [Li et al., 2011]
The strength of this algorithm is that, unlike previous algorithms, it allows com-
paring records with clusters created after the arrival of any record, improving
accuracy over the previous algorithms.
This algorithm starts after executing any of the previous algorithms, and
consists in the execution of the following steps:
1. Initialisation. Set the initial assignment as the result of early of late binding.
2. Estimation. Compute the similarity of each record-cluster pair as it is done
in the first step of late binding.
3. Maximisation. Chose the clustering with the maximum probability as in
step 2 of late binding.
29

4. Termination. Repeat steps 2-3 until the results converge or oscillate.
The weakness of this algorithm is that it add additional steps of quadratic
computational complexity (O(n2)) that have to be executed after running early
binding or late binding. Thus, the number of iterations to run over data makes
this algorithm less scalable than the other ones.
2.3.4 Conclusions
One of the objectives of this thesis is to study the feasibility of a novel browser
identification technique in a real-time scenario, where the tracking server assigns
fingerprints to particular users as they arrive to the system. Of the three algo-
rithms described before, the most suitable for this scenario is early binding due
to the reasons explained next.
• The adjust binding approach is discarded, due to the scalability reasons
explained before.
• In addition, in a real time scenario, there is always a set of zero or more
clusters created previously, and only one record to classify on each invoca-
tion of the algorithm, so the computational complexity early binding and
late binding is reduced to O(n) (i.e. linear complexity).
Therefore, the algorithm early binding is the most suitable for achieving the
objective of this research.
2.4 Social Media Analysis Applied to Market
Research
Internet has transformed the way in which consumers’ word-of-mouth (i.e. non-
formal exchange of information between at least two individuals, which is per-
ceived as trustworthy) is created and propagated [De Bruyn and Lilien, 2008;
Gupta and Harris, 2010; Kozinets et al., 2010]. Digitised customer feedback in-
formation (i.e. electronic word-of-mouth or e-WOM) can be accessed any time
30

and anywhere through diverse social media such as blogs, social networks, cus-
tomer reviews, and forums, which further increases its influence among fellow
customers [Dellarocas, 2003; Schindler and Bickart, 2005]. Nowadays, a person
who is looking for information about some product is not limited to asking to
friends or relatives about it, instead he or she can expand this search by consult-
ing user reviews, specialised blogs or even brief opinions stated by microbloggers.
According to a survey by Nielsen [2012a], 70% of global consumers trust buyer’s
reviews, while 92% of consumers indicate they trust recommendations from peers,
family and word-of-mouth above other forms of advertising.
This shopping scenario, if disruptive for traditional business models, opens up
opportunities for corporations to grow, innovate and improve their relationship
with customers [Hennig-Thurau et al., 2010]. Marketers are in an advantageous
position to monitor and derive a benefit from this unparalleled volume of con-
sumer conversations, which are increasingly taking place in social media channels.
Accordingly, companies have reorganised their traditional methods of gathering
customer opinions (such as polls, and surveys) in order to adapt them to these
new media. This novel source of consumer data is not only extremely massive
and complex but also completely unfiltered, which facilitates a real-time, deeper
comprehension of consumer’s needs and thoughts [Han et al., 2014]. This im-
proves in turn the level of responsiveness to reputation crisis, emergencies and
situations alike. However, although the proliferation of social media has allowed
organisations and companies to collect a massive amount of information about
user’s opinions, the majority of this user-generated content is unstructured and
therefore, hard to interpret, classify and summarise.
In order to solve these new requirements, fields such as Sentiment Analysis and
Opinion Mining [Liu, 2012] have developed technology to automatically analyse
user-generated content. Research in these areas started to work in several aspects,
such as subjectivity detection, automatic classification of opinionated texts, and
automatic opinion summarisation. At the beginning, the main objective of these
fields was limited to summarising the overall opinion expressed in these user-
generated texts, and generally based on the distinction between positive and
negative comments conveyed by buyers. However, the task started to evolve
[Cambria et al., 2013; Cambria and White, 2014] and currently there is a broader
31

interest to carry out a very fine-grained analysis of the available data [Gangemi
et al., 2014]. The content of the user-generated texts is so rich and varied that it
can be analysed from very different perspectives. For example, in works such as
Asur and Huberman [2010]; Joshi et al. [2010]; Sadikov et al. [2009] authors make
predictions about the profit of movies from user-generated content of microblogs,
reviews and blogs.
However, the validity of social metrics [Sterne, 2010] depends to a large ex-
tent on the population over which they are applied. Social media users cannot
be considered a representative sample until the vast majority of people regularly
use social media. Therefore, until then, it is necessary to identify the differ-
ent strata of users in terms of socio-demographic attributes (e.g. gender, age or
geographical precedence) in order to weight their opinions according to the pro-
portion of each stratum in the population [Gayo-Avello, 2011]. As an example,
the comparison performed by Mislove et al. [2011] between the U.S. and Twitter
populations along three axes (place of residence, gender and race) showed that
Twitter users significantly overrepresent the densely population regions of the
U.S., are predominantly male, and represent a highly non-random sample of the
overall race/ethnicity distribution.
2.4.1 KPIs Based on Social Media Analysis
In the world of marketing and business, predicting real-world outcomes is a chal-
lenging task that normally requires indicators from heterogeneous data sources.
For instance, traditional media content analysis has been used to forecast the
financial market [Chan, 2003; Fung et al., 2003; Tetlock et al., 2008], and sev-
eral works have demonstrated connections between online content and customer
behaviour (e.g. purchase decisions).
Since social media feeds can be effective indicators of real-world performance
[Asur and Huberman, 2010], different forecasting models have been studied for
using online chatter to predict real world outcomes related to the sales of different
kinds of goods, such as movies [Asur and Huberman, 2010; Mishne and Glance,
2006; Zhang and Skiena, 2009] or books [Gruhl et al., 2005].
Predictive models range from gross income predictions [Asur and Huberman,
32

2010; Joshi et al., 2010; Mishne and Glance, 2006; Sharda and Delen, 2006; Zhang
and Skiena, 2009] to revenue estimations per product distributor (i.e. stores that
offer a product or service) [Mishne and Glance, 2006] or spike predictions in sales
ranks [Gruhl et al., 2005]. Besides, social media plays an increasingly important
role in how customers discover and engage with various forms of content, including
traditional media, such as TV. In this line, a study by Nielsen [Subramanyam,
2011] found correlations between online buzz and TV ratings.
Many social media have started to be exploited to obtain the indicators that
enable such prediction models (e.g. from Twitter [Asur and Huberman, 2010],
blog feeds [Gruhl et al., 2005; Mishne and Glance, 2006], review texts [Joshi et al.,
2010], online news [Zhang and Skiena, 2009]). Indicators are based on volume,
sentiment analysis, or combinations between them and economic data or product
metadata.
Volume-based indicators can be simple or composed. Among the simple pre-
dictors we find the raw count of posts referring to a brand [Gruhl et al., 2005;
Mishne and Glance, 2006; Zhang and Skiena, 2009], the number of mentions for
a brand (i.e. count of entity references, taking into account that one post can
mention the same entity multiple times) [Zhang and Skiena, 2009], or the num-
ber of unique authors that refer to the brand. Among composed predictors we
find the post rate [Asur and Huberman, 2010] (which denotes the rate at which
publications about particular topics are created, i.e. the number of posts about
a topic divided by time) and the post-per-source (which measures the average
number of posts published about a topic in particular feed sources, e.g. a set of
forums). These volume-based indicators have been demonstrated to be effective.
For example, spikes in references to books in blogs are likely to be followed by
spikes in their sales [Gruhl et al., 2005].
Sentiment analysis-based indicators are based on the hypothesis that products
that are talked about positively will produce better results than those discussed
negatively, because positive and negative opinions influence people as they prop-
agate through a social network. Basic sentiment-based predictors include the
numbers of positive, negative and non-neutral posts (i.e. positive plus negative)
about a brand [Mishne and Glance, 2006]. Composite indicators include the pos-
itive and negative ratios [Zhang and Skiena, 2009] (i.e. the number of positive
33

or negative posts divided by the total number of posts), and the mean or the
variance of sentiment values [Mishne and Glance, 2006]. Other important com-
posite sentiment-based indicators include the Net Promoter ScoreSM (NPS36), the
polarity index and the subjectivity index. NPS is commonly used to gauge the
loyalty of a firm’s customer relationships [Zhang and Skiena, 2009]. NPS can
be approximated by dividing the difference of positive and negative posts by the
total number of posts. The polarity index is calculated in different manners: by
dividing the posts with positive sentiment by the post with negative sentiment
[Asur and Huberman, 2010; Mishne and Glance, 2006], or by dividing the posts
with positive sentiment by the number of non-neutral posts [Zhang and Skiena,
2009]. Subjectivity is measured by dividing the number of non-neutral posts by
the number of neutral or total publications [Zhang and Skiena, 2009].
Low-level textual feature-based indicators, combined with metadata features,
have been also demonstrated to achieve a good performance [Joshi et al., 2010].
Such textual features include term n-grams, part-of-speech n-grams and depen-
dency relations.
All these indicators can be combined with other numerical and categorical
predictors, such as product metadata [Joshi et al., 2010; Mishne and Glance,
2006; Sharda and Delen, 2006; Zhang and Skiena, 2009], advertising investment,
overall budget [Joshi et al., 2010; Zhang and Skiena, 2009], number of product
distributors [Mishne and Glance, 2006; Zhang and Skiena, 2009], or even, the
Time Value of Money [Zhang and Skiena, 2009].
The forecasting models used range from linear or logistic regression models
[Asur and Huberman, 2010; Joshi et al., 2010; Zhang and Skiena, 2009] to k-
nearest neighbour models (k-NN) [Zhang and Skiena, 2009]. Gruhl et al. [2005]
base their models on time-series analysis and construct a moving average predic-
tor [Box and Jenkins, 1990], a weighted least squares predictor, and a Markov
predictor. Sharda and Delen [2006] convert the forecasting problem into a clas-
sification problem by discretising the continuous predicted variables to a finite
number of categories, and then they use a neural network model for performing
the classification.
Finally, the scale of the data is a key aspect when analysing online content. To
36Service mark owned by Bain & Company (http://www.netpromotersystem.com)
34

get an idea, the work presented by Asur and Huberman [2010] uses 2.98 million
tweets from 1.2 million users, with feeds extracted hourly during three months;
the Nielsen study about social TV uses data from 250 TV programs and 150
million social media sites; and in Gruhl et al. [2005] the authors analyse the daily
rank values of 2,340 books over a period of four months.
2.4.2 Conclusions
The proliferation of new social media channels provides marketing practitioners
with a huge quantity of data about consumer preferences, likes and dislikes. The
large amount of data provides more and richer information that is, however, lost
because of the lack of means if it is to be analysed by using manual methods.
In comparison with traditional quantitative techniques such as questionnaires,
the collection of opinions extracted from social media sources means less intru-
sion since it enables the gathering of spontaneous perceptions and desires of con-
sumers, without introducing any bias. In addition, the possibility of doing this
in real time poses a clear advantage over other techniques based on retrospective
data. Overall, this allows for a more efficient and complex business decision mak-
ing based on a comprehensive assessment of users propensity to buy and concrete
opinions shared about a brand or product.
Open Research Problem 4. While there are approaches for obtaining KPIs
derived from the volume of posts about the opinionated entities, or the polarity
of opinion about them, there are other KPIs that cannot be obtained due to the
lack of user-generated-content-analysis techniques that allow to classify consumers
according to multiple socio-demographic and psychographic attributes commonly
used in the field of marketing for consumer segmentation.
The next section describes the marketing and psychological backgrounds upon
which the set of socio-demographic and psychographic attributes are based.
2.5 Marketing Background
Marketing is the process of communicating the value of a product or service to
consumers for the purpose of selling that product or service to them. If marketing
35

has one goal, it is to understand the most adequate way to reach consumers to
offer them the product or service recommended for them. To that extent, it is
important to get familiarised with the various buying processes that consumers
go through depending on the product at hand. Furthermore, what is considered
in fact of great value is being able to detect the different stages that consumers
have to go through during this process, as well as the conditioning factors that
produce a shift from one stage to another.
In the past, the construction of the media plan for a media agency was far
less complicated as there were fewer media, i.e. TV, printed newspapers, etc.
Back then, placing an advert in television would guarantee the delivery of the
marketing message to the consumer. However, nowadays the task of reaching the
consumer is not that straightforward anymore due to the fragmentation of both
traditional and digital media.
Marketing teams today are swimming in data —online, offline, internal, ex-
ternal, customer demographics, Web Analytics, media modelling, visibility, im-
pressions, click-through rates, conversions, engagement metrics (see [Burby and
Brown, 2007] for some examples). The most important thing to remember is that
all that the brand teams really want is to connect with its customers, or potential
customers, in a personal and meaningful way.
The goal for marketers today is first to tie all their disparate proprietary
data together. But that’s only step one. To send appropriate messages to recep-
tive consumers, brands need to be able to identify and segment customers and
prospective customers using predictive attributes: What are they likely to buy?
How are they thinking? And what is the best way to reach them?
To optimise media spending, marketers also need to look for solutions that
effectively manage their campaigns and divide consumers into psychographic and
demographic clusters —a way for marketers and their agencies to overlay pro-
prietary data and look for the right targets based on who they are, what they
have done, what they like and what they’re likely to buy. Thus consumers are
benefited with pertinent and meaningful communications directed by the brands,
which take into account their context, preferences and particular needs, avoiding
the over-saturation of massive marketing. There is nothing worst to a customer
than receiving “junk” advertisement on something that they do not need, want
36

or that they already have.
This section presents the theoretical marketing backgrounds related to the
work presented in this thesis. We introduce the Consumer Decision Journey
[Court et al., 2009] and Marketing Mix [Borden, 1964] models, as well as a sum-
mary of psychological research on human emotions, which are conceptual frame-
works upon which the analytic tools we propose are based on. Additionally, we
describe the different kind of media that marketers must deal with nowadays and
describe the different kinds of tools used for solving the problems arisen on each
media type.
2.5.1 The Consumer Decision Journey
The Purchase Funnel, proposed in the early twentieth century by Lewis [1903],
is a marketing model that illustrates the purchase process in several stages, from
the moment when a customer is aware of the existence of the product (awareness)
to the moment when he or she buys the product (purchase). The model evolved
during the last years and at present there are many different purchase funnel
models, some of them with many different intermediate stages. However, the
basic conceptual framework and stages remain the same in all of them [De Bruyn
and Lilien, 2008; Franzen and Goessens, 1999].
Modern versions of the purchase funnel model take into account the influence
of Internet and social media in the decision-making path of the customer, and
also include a postpurchase stage. The version of the purchase funnel proposed
by Forrester [Noble et al., 2010] is a good example of the introduction of the new
technologies and social media to the classic Elmo Lewis’ model [Lewis, 1903].
This work highlights the great influence of user-generated content on the final
purchase decision of the customers. In the model proposed by McKinsey [Court
et al., 2009], the Consumer Decision Journey, the traditional funnel shape of the
decision journey is transformed in a purchasing loop and the notion of trigger (as
the cause because of which potential customers start to investigate the brand and
therefore enter into the purchase funnel) is introduced.
Knowing the exact stage of the decision journey where the customer is lo-
cated is essential in order to design specific promotional campaigns, interact with
37

customers at the appropriate touch-points and improve customer relationships
management (CRM) systems [Edelman, 2010]. To discover this, the analysis of
the different social media channels is crucial, since the online conversations be-
tween potential customers play a very important role in the purchase decision
pathway [Divol et al., 2012]. Findings of Ng and Hill [2009] and Gupta and Har-
ris [2010] revealed that consumers do actively search the Web for non-commercial
bias opinions prior to making a purchase decision. Pookulangara and Koesler
[2011] state that, in addition to transforming the evaluation and purchase stages,
online social networks enable consumers to become advocates of their preferred
brands. Related work by other researchers found that online consumer conversa-
tions influence purchase decisions in a variety of ways, which include reinforcing
of product involvement [Wang et al., 2012]. De Bruyn and Lilien [2008] stud-
ied which factors affect consumers in the various phases of their online decision
making processes, and found that while tie strength (i.e. closeness of relationship
between two individuals) facilitates awareness, it has no apparent power over
triggering interest or decision to buy. In summary, it is safe to say that social
media have drastically changed the shopping experience, which calls for further
research in this area.
While the shopping experience of some goods involves very little deliberation
and an emotional response (e.g. greeting cards), other products require deeper
forethought either because its cost is significantly higher or because the conse-
quences of making a good or bad decision are much more profound (e.g. life
insurance, mortgages) [Vaughn, 1986]. Similarly, the duration and intensity of
the different purchase phases might be affected by the features of the product
being purchased or evaluated (e.g. novelty, price) as well as by buyers’ char-
acteristics (e.g. their previous experience with the brand) [van Bruggen et al.,
2010].
In this work we adopt the following, widely agreed, purchase stages: aware-
ness, evaluation, purchase, and post-purchase experience. This straightforward
model can be easily applied to a wide variety of products and purchase contexts.
Therefore, our aim is to use a consumer decision-making model whose basic
stages can be reasonably traceable in a big data scenario consisting of online
consumer texts, rather than using a sophisticated conceptual model that incor-
38

Awareness Evaluation PurchasePost-purchase
Experience
Figure 2.6: Consumer Decision Journey stages adopted in this thesis
porates customer experience complexity to its fullest. Figure 2.6 illustrates the
model adopted as conceptual framework in this work.
The first stage, awareness, refers to the very first contact of the customer with
the product or brand, with or without the desire of purchase. Customers usu-
ally convey their interest through references or expressions about the advertising
campaigns.
In the evaluation phase, the customer already knows the product or brand
and evaluates it, frequently with respect to other similar products or brands. In
this step, buyers actively investigate the brand in comparison with its competi-
tors (asking for opinions, formulating questions, consulting product reviews, etc.)
and/or express their preference towards a specific brand or product.
In the purchase stage customers either explicitly convey their decision to buy
the product or make comments referring to the transaction involved when buying
the item.
Finally, the post-purchase experience phase refers to the moment when cus-
tomers, having tried the product, criticise, recommend it or simply talk about
their personal experience with it.
2.5.2 The Marketing Mix
The concept of “Marketing Mix” was coined by Borden [1964] who identified
twelve marketing elements to manage business operations in a more profitably
way. McCarthy and Brogowicz [1981] reduced these twelve elements to just four:
Product, Price, Promotion, and Place (the “4P’s”). These four elements usually
imply different subcategories that can vary depending on the interests of the
marketing company. For example, the element Product could be subdivided into
Quality, Design and Warranty; within Place one could distinguish Point of Sale
and Customer Service, and Promotion has also different subcategories such as
39

Product Place Price PromotionQuality Point of Sale Price PromotionDesign Customer Service Sponsorship
Warranty Loyalty MarketingAdvertisement
Table 2.3: Subcategories of the Marketing Mix elements
Sponsorship, Loyalty Marketing, and Advertisement (that can also be divided
into different subtypes of advertisement depending on the media used). The 4P’s
Marketing Mix framework is used by marketers from all over the world, taking it
as a basis to develop their operational marketing plans.
Table 2.3 identifies the subcategories in which we have divided each element
of the Marketing Mix framework. In this thesis, we have developed classifiers
for the following subcategories: “quality”, “design”, “point of sale”, “customer
service”, “price”, “promotion”, “sponsorship” and “advertisement”.
2.5.3 Research on Human Emotions
Sentiment studies have been present in different areas and for different purposes.
Many researchers have pursued different approaches to analyse human emotions,
feelings, opinions, preferences and evaluations, and, unfortunately, there is no
agreement on the nature and number of basic human emotions. From the psychol-
ogy field, we can distinguish two main traditions [Gendron and Feldman Barrett,
2009]:
1. the basic emotion tradition, founded on the study of the basic and instinc-
tive emotions, mainly with an evolutionary approach, and
2. the appraisal tradition, focused on the individual evaluation of world ob-
jects.
Within the first approach, we find the works of Plutchik [1989] and Ekman
[2005], among others. Plutchik proposed a taxonomy of eight multidimensional
emotions grouped into four categories, namely, joy-sadness, trust-disgust, fear-
anger, and surprise-anticipation; whereas Ekman differentiated six primary uni-
40

versal (innate and cross-cultural) emotions, which can be recognised from facial
expressions: happiness, sadness, anger, disgust, surprise, and fear.
One of the main representatives of the second tradition is Arnold [1960], who
created a classification of eleven primary emotions (anger, aversion, courage, de-
jection, desire, despair, fear, hate, hope, love, sadness). Following also the ap-
praisal tradition, but applying the prototype approach [Rosch, 1978], we find the
work of Shaver et al. [1987], who distinguished six primary emotions (love, joy,
anger, sadness, fear, and perhaps, surprise) with (related) groups of descriptors
drawn from a lexicon of words with emotional connotation (for instance, nervous-
ness and anxiety as descriptors of fear).
A comprehensive definition of emotion that comprises all these approaches in
this field is given by [Kleinginna and Kleinginna, 1981]:
Emotion is a complex set of interactions among subjective and
objective factors, mediated by neural-hormonal systems, which can
1. give rise to affective experiences such as feelings of arousal, plea-
sure/displeasure;
2. generate cognitive processes such as emotionally relevant percep-
tual effects, appraisals, labelling processes;
3. activate widespread physiological adjustments to the arousing
conditions; and
4. lead to behaviour that is often, but not always, expressive, goal
directed, and adaptive.
Since emotions are affected by the context in which they are produced [Phillips
and Baumgartner, 2002], the taxonomies proposed in the psychological domain
were adapted for consumption-related studies, the field in which we are inter-
ested. In this sense, Richins [1997] elaborated the Consumption Emotions Set
(CES) taxonomy, which distinguished between emotions and mood, and grouped
emotions into sixteen clusters (e.g. fear: scared, afraid and panicky). In the same
line, Westbrook and Oliver [1991] showed that affective experiences (which can be
understood here as emotions) coexisted and were related to consumer satisfaction
41

and dissatisfaction, which is the traditional approach used to measure consumer
experiences.
In line with the Artificial Intelligence studies, Ortony et al. [1990] proceeded
on the assumption that progress in psychological research on emotion could be
attained through an analysis of the cognitions that underlie emotions. To this
end, their account of emotions is in terms of classes of emotions types, and not in
terms of specific words. An important guiding principle in developing the theory
was that it could be sufficient to permit empirical testing, such as computationally
tractable model of emotions to be used in Artificial Intelligence. Obviously, this
perspective is also very relevant for our work.
In this thesis we have established the categories of sentiments shown in Ta-
ble 2.4 as our conceptual framework. This conceptual framework is based on
Ekman [2005]; Richins [1997]; Shaver et al. [1987], and consists of the follow-
ing four polarized categories: SD (satisfaction-dissatisfaction), TF (trust-fear),
LH (love-hate) and HS (happiness-sadness), where the first one, SD, subsumes
the other three (i.e. a text classified as TF, LH or HS is also categorized as
SD). This decision is based on previous works (e.g. Oliver [1989]; Westbrook
and Oliver [1991]) that confirm that the satisfaction-dissatisfaction scale conceals
much more fine-grained sentiments. Finally, Table 2.5 shows the relationship
between our conceptual framework and the Wordnet-Affect taxonomy [Valitutti
et al., 2004], already introduced in Section 2.1, meaning that a given category
of our conceptual framework subsumes the corresponding set of categories in the
Wordnet-Affect taxonomy.
CategoryPolarity
+ −SD satisfaction dissatisfactionTF trust fearHS happiness sadnessLH love hate
Table 2.4: Categories for the sentiment classification, organised according to theirpolarity
42
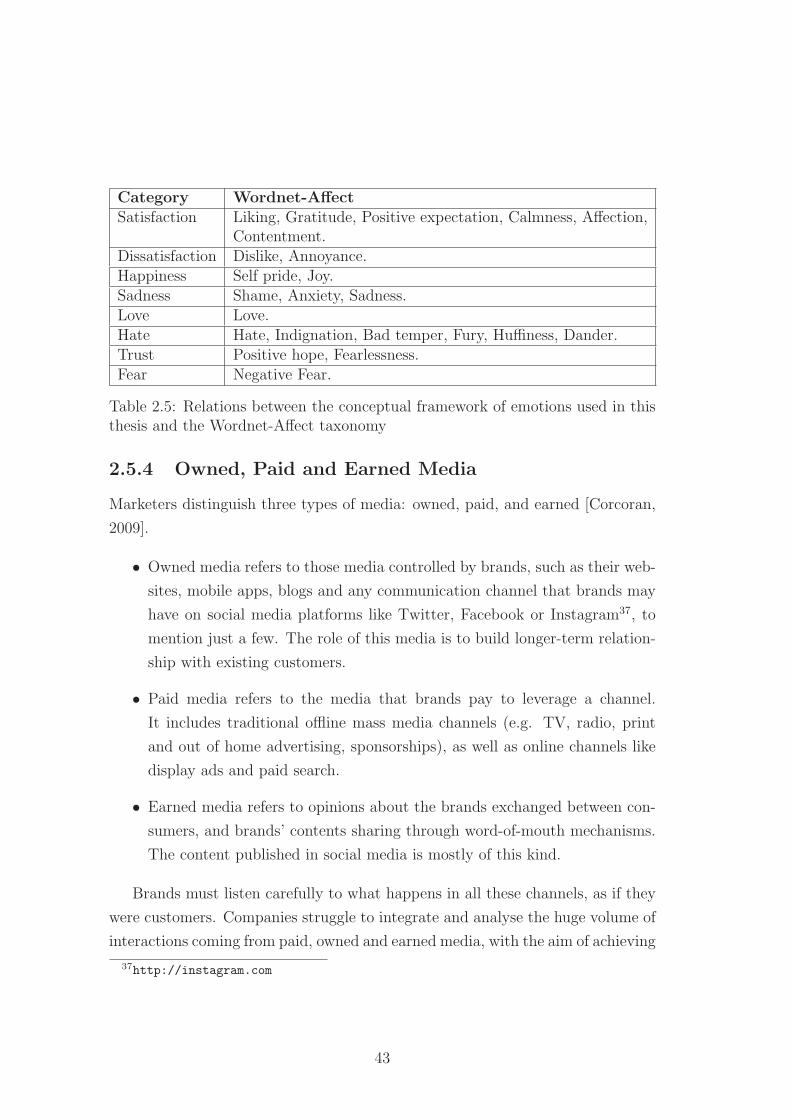
Category Wordnet-AffectSatisfaction Liking, Gratitude, Positive expectation, Calmness, Affection,
Contentment.Dissatisfaction Dislike, Annoyance.Happiness Self pride, Joy.Sadness Shame, Anxiety, Sadness.Love Love.Hate Hate, Indignation, Bad temper, Fury, Huffiness, Dander.Trust Positive hope, Fearlessness.Fear Negative Fear.
Table 2.5: Relations between the conceptual framework of emotions used in thisthesis and the Wordnet-Affect taxonomy
2.5.4 Owned, Paid and Earned Media
Marketers distinguish three types of media: owned, paid, and earned [Corcoran,
2009].
• Owned media refers to those media controlled by brands, such as their web-
sites, mobile apps, blogs and any communication channel that brands may
have on social media platforms like Twitter, Facebook or Instagram37, to
mention just a few. The role of this media is to build longer-term relation-
ship with existing customers.
• Paid media refers to the media that brands pay to leverage a channel.
It includes traditional offline mass media channels (e.g. TV, radio, print
and out of home advertising, sponsorships), as well as online channels like
display ads and paid search.
• Earned media refers to opinions about the brands exchanged between con-
sumers, and brands’ contents sharing through word-of-mouth mechanisms.
The content published in social media is mostly of this kind.
Brands must listen carefully to what happens in all these channels, as if they
were customers. Companies struggle to integrate and analyse the huge volume of
interactions coming from paid, owned and earned media, with the aim of achieving
37http://instagram.com
43

a holistic 360◦ approach to brand communication, that will lead to more efficient
and effective marketing campaigns.
2.5.5 Marketing Technology
In the online marketing field, Big Data Analytics is a big challenge that companies
and agencies are facing with applications that address different brand-customer
communication dimensions individually. Such applications are described next.
Programmatic advertising. These systems are oriented to automatise the pro-
cess of paid-media planning (i.e. buying of advertisement spaces), perform-
ing Big Data analysis for finding ad placement plans that should lead to
optimum performance KPIs (e.g. maximising the click through rate of dis-
play advertising). Demand-Side-Platforms (DSPs) like MediaMath38, or
Data Management Platforms (DMPs) like Oracle Bluekai39 belong to this
category. The scope of these applications is limited to sites with web ad-
vertising capabilities.
Site analytics and digital customer experience management. These sys-
tems are devoted to analyse and optimise brand-customer communication
processes on owned digital media (i.e. sites owned by the brand). Within
this group we find the following kind Web Analytics applications (e.g.
Adobe Marketing Cloud, IBM EMM, webtrends, and Google Analytics)
and solutions for digital customer experience management and customer
behaviour analysis (e.g. IBM Tealeaf40).
The scope of these applications is generally limited to brands’ sites and
microsites. Recently, services like Google Analytics have extended mea-
surement capabilities to mobile apps.
Social media analytics and social CRM. Within these systems we find ap-
plications for measuring brand reputation on earned media (i.e. media not
38http://www.mediamath.com39http://www.bluekai.com40http://www-01.ibm.com/software/info/tealeaf
44

controlled by the brand, like social networks, Web 2.0, etc.) and applica-
tions for social CRM (i.e. community management in social networks).
Regarding social media monitoring applications, given the massive amount
of posts published every day through different social media, the fact of
having a system able to evaluate the global sentiment towards an entity
(e.g. brand or product) is becoming a must for marketing experts. This is
one of the main reasons for the increased attention that sentiment analysis
has received in these last few years. Actually, there are already several
commercial tools able to provide a polarity figure measuring the attitude
towards a brand or any other queried topic, such as Radian641, Sysomos42
and Brandwatch43. Market analysts and social media researchers in general
use these tools and other similar ones to classify opinions about brand
sentiments in terms of polarity (positive or negative). The State of the Art
regarding techniques for sentiment analysis is described in Section 2.6.3.
Social CRM applications implement features for monitoring social media
opinions and conversation, and communicating with the consumers using
the same social networks where the opinions have been captured. Example
applications of this kind are HootSuite44 and TweetDeck45.
2.5.6 Conclusions
There exists tons of data related with advertising and communication activities
that are underexploited, many of which are currently in such format that cannot
be treated, processed or used. Companies are sitting on “gold mines” without
even realising, and the power of data utilisation is beyond measure.
The first step to influence social media conversations is to understand them
to its fullest. In other words, managers and marketers need to know and under-
stand the content of these conversations and, further, be able to classify them
into categories that are relevant for their day-to-day tasks such as Consumer
41http://www.salesforcemarketingcloud.com42http://www.sysomos.com43http://www.brandwatch.com44http://hootsuite.com45http://tweetdeck.twitter.com
45

Decision Journey stages and Marketing Mix elements.
In the first case (purchase funnel stages), to monitor in real time and ac-
cordingly react to the experiences and needs that those customers are sharing,
advertisers must know in which purchase stages are consumers gained and lost in
order to refine touch points, impact consumers and achieve the desire result (e.g.
a transaction). Other applications are, among others, the analysis of shopping
behaviour of users in comparison with brands from the rivals, to confirm whether
any particular marketing strategy has had the desired effect on purchase atti-
tudes (e.g. if there has been a rise in awareness after the launch of an advertising
campaign), to explore whether the distribution of users in Consumer Decision
Journey stages is seasonally affected, etc.
In the second case (Marketing Mix elements), uncovering the exact content
of the dialogues that costumers are having, e.g. which product attributes worry
them the most, lets marketers and advertisers have a better track of consumers’
mind-set.
The combination of these two categories (purchase funnel stages and mar-
keting mix elements) gives answers to extremely significant questions that have
an influence on the position of the brand in the market such as: which are the
features by which a brand is known, which are the elements that are driving
awareness to the brand (i.e. price), which characteristics of the product make it
desirable and which characteristics are not relevant.
Open Research Problem 5. While there are tools for analysing brand health
in earned media through the analysis of the polarity of the opinions produced by
consumers when talking about the brand, there are not approaches that specifically
address the classification of electronic word-of-mouth according to the Consumer
Decision Journey, useful for market analysis purposes.
Open Research Problem 6. Additionally, there are not tools for identifying
the Marketing Mix elements consumers are referring to when publishing opinions
about brands in social media.
46

2.6 Analysis of Social Media Content
This section describes existing activities and techniques for the analysis of the
textual contents published in social media that are related with the contributions
of this thesis.
Specifically, we describe the lemmatisation and part-of-speech tagging tasks
[Jurafsky and Martin, 2009] and introduce content normalisation approaches [Ale-
gria et al., 2013; Sproat et al., 2001], which are fundamental preliminary steps in
all the techniques provided by this thesis.
After that, we describe the related work regarding sentiment analysis [Liu,
2012] and discuss existing research results on automatic identification of wishful
sentences [Goldberg et al., 2009], which are the areas where we have found more
similarities with our work both in terms of objectives and used technologies.
Finally, we describe the existing techniques for detecting the gender and place
of residence of social media users, upon which our techniques for recognising socio-
demographic attributes are based.
2.6.1 Lemmatisation and Part-Of-Speech Tagging
Many content-analysis techniques rely on particular Natural Language Processing
tools, to lemmatise (i.e. grouping together different inflected forms of a word to
process them as one single element) and to add morphological information (i.e.
part-of-speech, to distinguish between homographs such as “walk-verb” or “walk-
noun”, verb tense, and person). Thus, a text such as
This Volkswagen I got my eye on is so sexy
gets the representation shown in Table 2.6, where the first column shows the
words in the text, the second column shows lemmas corresponding to each word,
and the third column the part-of-speech tag, where DT means determiner, NN
means common noun singular, NNP means proper noun singular, PRP means
personal pronoun, VBD means verb in past tense, IN means preposition, VBZ
means verb in present tense in third person singular, RB refers to adverb, and JJ
to adjective.
47

Word Lemma Part-Of-SpeechThis this DT
Volkswagen volkswagen NNPI i PRP
got get VBDmy my PRPeye eye NNon on INis be VBZso so RBsexy sexy JJ
Table 2.6: Example lemmatisation and part-of-speech tagging of an example text
Example tools for part-of-speech tagging and lemmatisation are Freeling [Padro
and Stanilovsky, 2012] and TreeTagger [Schmid, 1994]. Such tools usually make
use of standardised vocabularies of tags (e.g. Santorini [1991] defines a tag-set for
English and Leech and Wilson [1996] define a tag-set normally used for the Span-
ish language). Generally, such tools provide more features beyond lemmatisation
and part-of-speech tagging. As an example, Freeling is an open-source multilin-
gual language processing library providing a wide range of analysers for several
languages, including named entity detection and classification, dependency pars-
ing and nominal co-reference resolution, among others.
2.6.2 Normalisation of Microposts
The activity of normalising user-generated content is a crucial step before analysing
social media posts, particularly on Twitter. User-generated content published in
social media (specially in microblogs) is characterised by informality, brevity,
frequent grammatical errors and misspellings, and by the use of abbreviations,
acronyms, and emoticons. These features add additional difficulties in text min-
ing processes that frequently make use of tools designed for dealing with texts,
which conform to the canons of standard grammar and spelling [Hovi et al., 2013].
The micropost normalisation activity enhances the accuracy of NLP tools
when applied to short fragments of texts published in social media, e.g. the
syntactic normalisation of tweets improves the accuracy of existing part-of-speech
48

taggers [Codina and Atserias, 2012].
There are several techniques that can be combined for micropost normalisa-
tion, which are described next.
1. Pre-processing the micropost for detecting, removing and transforming spe-
cific social network’s metalanguage elements (e.g. hashtags, user names,
URLs) into standard language constructions; e.g. Kaufmann and Jugal
[2010] propose several rules for dealing with hashtags and user names.
2. Performing orthographic correction of content by relying in lexical resources
like SMS lexicons for identifying abbreviations. List of correct forms are
also used for performing spell correction, e.g. Gamallo et al. [2013] rely on a
list of correct forms in Spanish generated by an automatic conjugator from
the lemmas found in the Real Academia Espanola Dictionary (DRAE46).
As an example result of the micropost normalisation task, the following mi-
cropost published in Twitter
#worstfeeling buying a fresh laptop..then ur screen blowz out :((
may be normalised to the following text47:
worst feeling is buying a fresh laptop.. then your screen blowz out.
2.6.3 Sentiment Analysis
According to Pang and Lee [2008], the analysis of emotions, opinions and ap-
praisal regarding commercial companies, gained momentum from 2001 following
slightly different perspectives and, consequently, using terminological variations:
sentiment analysis, opinion mining, brand monitoring, buzz monitoring, online
anthropology, market influence analytics, conversation mining, online consumer
intelligence, or user-generated content analysis are some of the terms used. These
terminological divergences reflect differences in the connotation that each research
group wants to project in their work, as well as the different uses given in the
different epistemological communities.
46http://www.rae.es/recursos/diccionarios/drae47Example extracted from the paper by Kaufmann and Jugal [2010]
49

In this thesis, we have adopted a term satisfying the psychological, the lin-
guistic and the computational projections: sentiment analysis, where sentiment is
conceptualised as emotion in Clore et al. [1987] (a detectable human reaction, i.e.
traceable, identifiable and with a particular valence). Undetermined cognitive
states, with no specific sign either positive or negative, like surprise or boredom,
and bodily states, such as sleepiness are excluded from the study. We also leave
out the analysis of mood, because we agree with previous work by Thayer [1989]
and Ekman [1994] in the sense that mood is a relatively persistent and often sub-
tle emotional state, which is different from emotion, as mood is less intense and
variable, less likely to be related to a particular event, and thus less likely to be
readily identifiable. Although we will mainly use the term sentiment, sometimes
emotion will be employed, both terms matching the definition just stated.
Pang and Lee [2008], and Liu [2010] have made a comprehensive survey de-
scribing the different approaches followed in sentiment analysis research. They
have reviewed and discussed a wide collection of related works. In general, deter-
mining which sentiment is conveyed in a text is seen as a classification problem,
which can be addressed with machine-learning techniques (supervised or unsuper-
vised) [Mullen and Collier, 2004], rule-based systems [Chetviorkin et al., 2011;
Ding and Liu, 2007], or combinations of them [Prabowo and Thelwall, 2009;
Rentoumi et al., 2010]. Machine-learning classifiers have been fed considering
different features extracted from the text, like the simple presence of words (or
n-grams in general) in the message, part-of-speech annotations or TF-IDF (Term
Frequency – Inverse Document Frequency) measures. Rule-based systems have
been applied both on plain texts and on part-of-speech annotated texts.
Many of these systems rely on sentiment lexicons, where each lexical unit
is associated to a sentiment category and, sometimes, also to a score specifying
the degree of association. These lexical units can be extracted automatically
(e.g. from other dictionaries) or, more uncommonly, manually. The works by
Hatzivassiloglou and McKeown [1997], and Turney [2002] are examples of the
first approach. An instance of the second one is Taboada et al. [2011], whose
sentiment dictionaries were created manually to produce a system for measuring
the semantic orientation of texts. Some publicly available lexicons for English
are SentiWordnet [Esuli and Sebastiani, 2006], the MPQA (Multi-Perspective
50

Question Answering) Subjectivity Lexicon [Wiebe et al., 2005], and the Harvard
General Inquirer [Stone et al., 1966]. A multilingual perspective is being ad-
dressed by the Eurosentiment project [Buitelaar et al., 2013], whose main goal is
to provide a shared language resource pool for fostering sentiment analysis.
However, studies on languages different from English are still scarce. For
Spanish, we can mention Brooke et al. [2009], who adapted the lexicon-based
sentiment analysis system described in Taboada et al. [2011] by automatically
translating the core lexicons and adapting other resources; Sidorov et al. [2013],
who presented an analysis of various parameter settings for the most popular
machine-learning classifiers; and Vilares et al. [2013], who used the syntactic
structure of the text to deal with some linguistic constructions (e.g. negation).
All in all, most of the research in sentiment analysis focuses on polarity clas-
sification. Some examples of projects that go beyond polarity can be found in
Strapparava and Mihalcea [2007], which summarises the evaluation of sentiment
analysis systems taking place for SemEval 2007 task on “Affective Text”. The
data consisted of news headlines extracted from news websites and/or newspa-
pers, and they were annotated according to their valence (i.e. polarity) and/or six
emotions (anger, disgust, fear, joy, sadness, and surprise) by different evaluators.
Three systems participated in the annotation of the six emotions: SWAT [Katz
et al., 2007], UA [Kozareva et al., 2007] and UPAR7 [Chaumartin, 2007] , and
only the last one followed a linguistic approach. None of them outperformed the
others for all emotions. The organisers concluded that the gap between the re-
sults obtained by the systems and the upper bound represented by the annotator
agreement suggested that there was room for future improvements.
2.6.4 Identification of Wishes
The first attempt to automatically classify sentences containing wishes was per-
formed by Goldberg et al. [2009]. The authors reported that, after a manual
annotation of a corpus of wishful texts, a number of linguistic patterns related
to wishes expression were identified. These patterns were used to automatically
extract the sentences that contained wishes. The precision results stated by Gold-
berg et al. [2009] was 80%, but combining these linguistic patterns with the most
51

frequent words and for user-generated texts related to the area of politics. When
applying the same method to product reviews, precision falls to 56%.
More recent works in this area are those carried out by Wu and He [2011]
and Ramanand et al. [2010]. In these studies the authors investigate methods to
automatically identify different types of wishes (specifically the wish to suggest
and the wish to purchase) and find linguistic patterns to extract them.
Ramanand et al. [2010] also used linguistic patterns to discover two specific
types of wishes, as mentioned before: sentences that make suggestions about
existing products, and sentences that indicate purchasing interest. Note that
Ramanand et al. [2010] wish types are similar to the evaluation and purchase
stages of the Consumer Decision Journey we address in this paper. Ramanand
et al. [2010] reported precision and recall are 62% and 48.5% respectively for
suggestions and 86.7% and 57.8% for purchase.
2.6.5 Detection of Place of Residence
The identification of the geographical origin of social media users has been tackled
in the past by several research works.
Mislove et al. [2011] estimate geographical location for Twitter users by ex-
ploiting the self-reported location field in the user profile. Content-analysis ap-
proaches are appropriate when the user location is not self-declared in the user
profile. Cheng et al. [2010] propose to obtain user location based on content anal-
ysis. The authors use a generative probabilistic model that relates terms with
geographic focuses on a map, placing 51% of Twitter users within 100 miles of
their actual location. Backstrom et al. [2008] described also a probabilistic model.
Chang et al. [2012] follow a similar approach, consisting in estimating the city
distribution on the use of each word. In addition, Rao et al. [2010] describe a
method for obtaining user regional origin from content analysis, testing different
models based on Support Vector Machines (SVM) [Cortes and Vapnik, 1995],
achieving a 71% of accuracy when applying a model of socio-linguistic features.
52

2.6.6 Detection of Gender
With respect to gender identification, Mislove et al. [2011] use the user name
for identifying his/her gender, achieving a coverage (i.e. proportion of users
classified) of 64.2%. Burger et al. [2011] propose to use more metadata and
content features for training an automatic classifier. Using only the full name
of the users, an accuracy of 0.89 is reached. An accuracy of 0.92 is achieved by
using the descriptions of the users, their screen names and the text of the tweets
published by them.
Rao et al. [2010] authored another relevant related work regarding gender
identification. In this case the proposed method, based on SVM, tries to distin-
guish the author gender exclusively from the content and style of their writing.
This solution needs an annotated seed corpus with authors classified as male or
female, to create the model used by the SVM classifier. In this case the accuracy
of the best model is 0.72, lower than considering the full name of the author.
2.6.7 Conclusions
Lemmatisation and part-of-speech tagging tools offer text processing and lan-
guage annotation facilities to NLP application developers, lowering the cost of
building those applications.
Social media user-generated content has particular characteristics (informal-
ity, brevity, frequent grammar errors and misspellings, abusive use of abbrevia-
tions, acronyms and emoticons, etc.). Text mining is based on the use of tools that
cannot handle this broad range of variations in a language. Therefore the task of
linguistic normalisation is a necessary step before performing NLP activities like
part-of-speech tagging.
Open Research Problem 7. Regarding sentiment analysis, while polarity de-
tection has been addressed for many languages, including English and Spanish,
and there are techniques for detecting emotions beyond polarity classification for
English, there are not existing approaches for identifying emotions for the Spanish
language.
The work we present in this thesis offers a more in-depth analysis of user-
53

generated content than sentiment analysis. In our work, we identify critical infor-
mation about consumer behaviour: we provide information about how customers
are distributed along the four stages of the Consumer Decision Journey and about
the nature of their comments in terms of categories of the Marketing Mix. The
automatic identification of wishful sentences is the area where we have found more
similarities with our work, both in terms of objectives and used technologies. To
the best of our knowledge, there is no previous work that addresses these tasks.
Nevertheless, the identification of wishful sentences offers some similarities that
allow for a basic comparison.
Author and content metadata is not enough for capturing socio-demographic
attributes like gender and place of residence. As an example, not all the so-
cial media channels qualify their users neither with gender nor with geographical
location. Some channels, such as Twitter, allow their authors to specify their geo-
graphical location via a free text field. However, this text field is often left empty,
or filled with ambiguous information (e.g. Paris - France vs. Paris - Texas), or
with other data that is useless for obtaining real geographical information (e.g.
“Neverland”).
Open Research Problem 8. The existing techniques for identifying the place
of residence of social media users do not combine different metadata that may
improve their accuracy. Among the metadata that can be used for this purpose
are the descriptions included in users’ profiles, the friendship networks, and the
locations found in the content shared and produced by them.
Open Research Problem 9. The existing techniques for identifying the gender
of social media users achieve good results of coverage and accuracy by using fea-
tures extracted from metadata about users, as well as from the content published
by them in the form of character n-grams. However, none of them take the ad-
vantage of the linguistic information that can be extracted from the content, such
as gender concord (a.k.a. agreement). This may improve the proportion of users
with a gender identified when it is not possible to recognise it from user’s profile
metadata.
54
2.7 Open Research Problems
We have identified the following open research problems in the State of the Art
that are addressed in this thesis.
1. There is a lack of data models for modelling the information that can be
extracted from social media for the marketing domain.
2. There is a lack of a characterisation of social media according to linguistic
features of the textual contents published on them.
3. The technique for uniquely identifying users in the Web based on the fin-
gerprint of their navigation devices fails when such fingerprint evolves over
time.
4. There is a lack of techniques for classifying consumer opinions according to
multiple socio-demographic and psychographic attributes commonly used
in the field of marketing for consumer segmentation.
5. There are not techniques for the classification of electronic word-of-mouth
according to the Consumer Decision Journey framework.
6. There are not techniques for identifying Marketing Mix attributes in con-
sumer opinions.
7. There are not techniques for detecting emotions in Spanish that go beyond
polarity detection.
8. The existing techniques for identifying the place of residence of social media
users do not take advantage of combining useful metadata that may improve
their accuracy.
9. The existing techniques for identifying the gender of social media users do
not take advantage of the linguistic information that can be extracted from
the content, such as gender concord.
55

56

Chapter 3
APPROACH
In this chapter we describe the objectives pursued by this thesis together with its
main contributions. We also present the hypothesis along with the restrictions
and assumptions upon which our research relies.
3.1 Objectives
The goal of this thesis is to provide techniques for extracting consumer
segmentations from the content generated by consumers in social me-
dia, their profile metadata, and their activities when navigating social
media websites.
According to the overall objective and to the open research problems identified
in the State of the Art (see Chapter 2), we have defined the specific objectives of
this thesis, which are described next.
O1. To provide a normalised schema for structuring the information
published in social media that can be used for marketing purposes.
As depicted by the Open Research Problem 1, there are not data mod-
els for representing information captured from social media that integrate
marketing-specific classifications and KPIs obtained from the analysis of
the content generated by consumers and their social network profiles, as
well as from the activity produced by them in social media.
57

The data model described in this thesis will allow integrating, using a single
format, data from social media as well as the data inferred by applying the
analysis techniques presented in this thesis. In addition, the model will
unify the semantics of the information extracted from heterogeneous sites,
by linking social media instances (e.g. posts, users, topics) regardless their
specific publication channels.
O2. To characterise the different social media types from the point
of view of the morphosyntactic characteristics of their textual
contents.
As shown by the Open Research Problem 2, there is not a characterisation
of the different kinds of social media with respect to the linguistic charac-
teristics of the content published on these media.
O3. To provide a fingerprint-based technique for identifying the ac-
tivity of consumers in different websites that is able to detect
changes in the device fingerprint.
As shown by the Open Research Problem 3, the existing techniques for
counting unique visitors are losing effectiveness, because of privacy restric-
tions and of new devices for navigating the Web. The fingerprinting tech-
nique deals with such restrictions and devices but is quite sensible to changes
in the attributes of the web browser, which leads to counting unique visitors
imprecisely.
O4. To provide a collection of automatic techniques for extracting con-
sumer segmentations according to their demographic and psycho-
graphic traits, from the analysis of content generated by them in
social media.
As reflected by the Open Research Problem 4, there are no techniques for
obtaining many of the demographic and psychographic attributes used in
marketing from which to obtain KPIs beyond the polarity of opinion and
the volume of publications. In this work we propose to automate the iden-
tification of a collection socio-demographic and psychographic attributes
from the content generated by consumers, by providing a set of individual
58

techniques for capturing each of these attributes. We aim for an analytic
technology that is able to perform a fine-grained analysis and that provides
information about the consumer behaviour. The automation of the activi-
ties oriented to capture these attributes from social media is unavoidable in
order to drastically reduce analysis time and the efforts required to process
the available large amount of data.
Specifically, this objective is limited to the following sub-objectives:
O4.1. To provide techniques for classification of consumer opinions
produced in social media according to the Consumer Decision
Journey framework.
As shown by the Open Research Problem 5, there are not techniques
that address the classification of consumer opinions according to the
Consumer Decision Journey framework. Our objective in this work is
to build a classifier for English and Spanish to assign e-WOM (elec-
tronic word-of-mouth) short texts to one single phase of the so-called
Consumer Decision Journey (see Section 2.5.1). Such a textual clas-
sification on different stages of the purchase process places customers
in the exact moment of their purchase journey.
O4.2. To provide techniques for classification of consumer opinions
produced in social media according to the Marketing Mix
framework.
As shown by the Open Research Problem 6, there are not techniques
that address the classification of consumer opinions according to the
Marketing Mix framework. Our objective in this work is to build
a classifier for English and Spanish to assign comments published by
consumers about brands to Marketing Mix elements (see Section 2.5.2)
expressed in a text. The classification of texts extracted from differ-
ent social media channels in terms of them belonging to one or more
Marketing Mix elements gives us information about what marketing-
related issues are the customers talking about.
O4.3. To provide a technique for identifying emotions expressed by
consumers in social media for Spanish.
59

As shown by the Open Research Problem 7, there are not techniques
that address the identification of emotions for the Spanish language
that go beyond polarity detection (i.e. automatically discovering plea-
sure or displeasure in texts). Specifically, this thesis addresses the
identification of emotions according to the eight categories shown in
Table 2.4 (satisfaction, dissatisfaction, trust, fear, happiness, sadness,
love, and hate), overcoming the limitations of current sentiment anal-
ysis approaches, which analyse only the polarity of the sentiments
expressed in user messages written in Spanish. Classification of user-
generated content according to the emotions expressed in them might
be useful not only for several Business Intelligence fields such as mar-
keting, sales, or customer service but also for public opinion analysis
where research on people’s behaviour is crucial.
O4.4. To provide a technique for recognising the place of residence
of social media users that improves the accuracy of existing
techniques.
As shown by the Open Research Problem 8, different approaches and
kinds of metadata can be used for improving the accuracy of existing
techniques. Our objective is to define and validate a technique that ex-
ploits user profiles descriptions, friendship networks, and geographical
entity recognition within contents for detecting the place of residence
of social media users.
O4.5. To provide a technique for recognising the gender of social
media users that improves the coverage of the techniques
based in profile metadata by exploiting the linguistic infor-
mation that can be extracted from the content written in
Spanish.
As shown by the Open Research Problem 9, the existing techniques for
gender identification do not take into account the linguistic informa-
tion that can be extracted from content analysis for improving their
coverage.
60

3.2 Contributions to the State of the Art
This thesis contributes to the State of the Art with a data model and a set of
techniques that address the objectives described in the previous section. The
contributions of this thesis are explained next.
C1. A normalised schema for representing the information extracted
from heterogeneous social media about brands, consumers and
opinions of consumers about brands, useful for the marketing do-
main.
This schema includes concepts and attributes for modelling the content and
metadata defined explicitly in social media. In addition to these explicitly-
defined data, the schema provides concepts and attributes for representing
the data enrichments inferred when applying the user identification tech-
nique (C2) and consumer segmentation techniques (C3).
The schema has been designed as a semantic data model defined by an
ontology network reusing ontologies widely used in the Semantic Web and
Linked Data fields.
C2. A descriptive characterisation of social media types from the point
of view of the morphosyntactic characteristics of the content pub-
lished on them.
We have processed and characterised corpora of user-generated content ex-
tracted from different social media sources. Specifically, we have studied
differences of the language used in distinct types of social media content by
analysing the distribution of part-of-speech categories in such sources.
C3. A technique for the identification of unique users from the finger-
print of the devices they use when interacting with social media,
which is tolerant to changes in such fingerprint.
This thesis will contribute to the State of the Art with an algorithm, based
on the fingerprinting technique defined by Eckersley [2010], which allows
identifying unique visitors accurately, regardless of changes in browser at-
tributes. For doing so, our algorithm is able to detect the evolution of
61

fingerprint and therefore, to effectively group distinct fingerprints that cor-
respond to the same user.
C4. A collection of techniques for extracting socio-demographic and
psychographic profiles from social media users applied to the mar-
keting domain.
The socio-demographic variables considered include gender and place of
residence, while the psychographic information includes purchase intention,
Marketing Mix elements, and emotional perceptions about brands.
Specifically, this thesis provides the following contributions to the State of
the Art.
C4.1. A technique for classifying consumer opinions produced in
social media according to the Consumer Decision Journey
stages for texts written in English and Spanish.
We have developed a classifier based on the identification of linguistic
patterns in short texts. These linguistic patterns were then used as a
part of a set of rules to classify each particular text into one of the
Customer Decision Journey stages.
C4.2. A technique for classifying consumer opinions produced in
social media according to the Marketing Mix framework for
texts written in English and Spanish.
We have developed a classifier based on machine-learning techniques,
specifically on Decision Tree (DT) learning algorithms.
C4.3. A technique for analysing consumer opinions written in Span-
ish according to the emotions expressed in such opinions that
goes beyond polarity identification by identifying the follow-
ing sentiment categories: satisfaction, dissatisfaction, trust,
fear, happiness, sadness, love, and hate.
We have developed a technique for classifying the texts of a corpus
of consumer opinions about brands according to the sentiment they
express. Unlike many existing solutions that focus on polarity clas-
sification, which deal with English texts and extract documents from
62

specific channels and a few domains, in the work presented in this
thesis we are interested in an eight-sentiment classification of Spanish
texts that consist of documents with different sizes and characteristics
from diverse social media and product domains.
C4.4. A technique for identifying the place of residence of social me-
dia users that improves the accuracy of existing techniques.
The technique proposed exploits the metadata declared by social media
users in their social network profiles, the locations included in the
contents published and shared by them, and their friendship networks.
C4.5. A technique for identifying the gender of social media users
that exploits the gender concord existing for the Spanish lan-
guage.
The technique proposed exploits the metadata declared by social me-
dia users in their social network profiles and takes the advantage of
the linguistic concord existing in certain languages like Spanish for de-
termining the gender of the users mentioned in the content produced
by other users.
Figure 3.1 depicts the contributions to the State of the Art of this thesis. The
contributions of this thesis can be grouped into three tiers.
• The Earned Media Knowledge Base provides the data warehouse for storing
marketing-oriented structured information extracted from social media or
inferred from it. The contribution C1 provides the ontology network that
models such data warehouse.
• The Inference Layer provides the engine that can reason about the facts
extracted from social media producing new inferences. The contribution C3
provides a technique for identifying users uniquely from their web activity,
while the contribution C4 provides a collection of techniques for segmenting
consumers from the information shared and published by them in social
media.
• The Social Media Characterisation tier provides observations on social me-
dia content attributes that may be considered for producing the algorithms
63

Inference Layer
C3. Technique for unique user identification based on evolving fingerprint detection
C4. Techniques for segmentation of consumers from social media content C4.1. Technique for detecting Consumer Decision Journey stagesC4.2. Technique for detecting Marketing Mix attributesC4.3. Technique for detecting emotionsC4.4. Technique for detecting the place of residence of social media usersC4.5. Technique for detecting the gender of social media users
Earned Media Knowledge Base
C1. Social media data model for consumer analytics
Social Media Characterisation
C2. Morphosyntactic characterisation of social media contents
Figure 3.1: Contributions to the State of the Art
of the Inference Layer. The contribution C2 provides a characterisation
form the point of view of the morphosyntactic attributes of the content
published in social media.
3.3 Assumptions
The models and techniques proposed in this thesis rely on the following assump-
tions.
Assumption 1. It is possible to structure the content published on social media
(and the associated metadata) according to a single normalised data schema.
64
Assumption 2. The information structured according to the data model pro-
posed, including data explicitly defined in social media and data enrichments ob-
tained by our analysis techniques can be used for higher-level Business Intelligence
processes, like the ones presented in Section 2.4.
Assumption 3. Consumers’ demographic and psychographic profiles (feelings,
interests, etc.) can be obtained from social media, even if those profiles are not
declared explicitly by the user, by analysing the content published and shared by
such consumers, as well as other metadata, such as profile information and friend-
ship networks.
3.4 Hypotheses
The overall research hypothesis of this work is that is possible to extract infor-
mation useful for marketing activities from the content and activity generated
by consumers in social media, despite the heterogeneity of textual contents and
metadata, and disparate access devices. The specific hypothesis are described
next.
Hypothesis 1. The contents published in social media statistically present differ-
ent morphosyntactic features depending on the specific kind of media where they
have been published.
Hypothesis 2. The online activity generated by consumers in social media can
be grouped and identified effectively through the digital fingerprint of their devices
by using the technique described in this thesis, even when such fingerprint varies
over time.
The technique must outperform the existing approach authored by Eckersley
[2010], whose accuracy, false positive rates, and coverage (i.e. percentage of
browsers classified) are 0.991, 0.0086 and 65% respectively.
Hypothesis 3. Consumers utilise different expressions along the four stages of
the Consumer Decision Journey. Therefore, if we are able to identify the par-
ticular linguistic expressions used in each of the stages of the purchase process,
we will be able to classify texts along the different phases and, consequently, we
65

will be able to approximate distributions of consumers in different moments of the
Consumer Decision Journey process.
Although there are not existing techniques for identifying Consumer Decision
Journey Stages from user-generated content, the results provided by this this the-
sis must be in line with existing approaches for the identification of wishes with
precisions that vary from 56% to 86.7%, depending on the wish type.
Hypothesis 4. The vocabulary used by consumers when publishing comments
about brands in social media can be used to identify the Marketing Mix attributes
they are referring to. Therefore, if we are able to identify the particular lexical
elements that refer to such attributes, we will be able to classify text according to
the Marketing Mix framework and, consequently, we will be able to approximate
distributions of consumers that refer to the distinct Marketing Mix elements.
Hypothesis 5. Consumers utilise different expressions to express their senti-
ment about brands beyond their pleasure and displeasure about brand products —
specifically for expressing the satisfaction, dissatisfaction, trust, fear, love, hate,
happiness, and sadness sentiments. Thus, if we are able to identify the partic-
ular linguistic expressions used for each of these sentiments, we will be able to
classify texts along the different emotions and, consequently, we will be able to ap-
proximate distributions of consumers according to fine-grained sentiments about
brands.
Hypothesis 6. The homophily existing between the users of a social network
[McPherson et al., 2001] can be used for improving the accuracy of existing tech-
niques for identifying their place of residence (from 51% to 71%). Specifically
the friendship network of a given user can be used for estimating her/his place of
residence, as the major part of her/his friends may share her/his location.
Hypothesis 7. The linguistic concord existing in the posts written in Spanish that
explicitly mention social media users can be exploited for enhancing the coverage
of the gender identification techniques that make use of the name declared by users
in their profiles.
66

3.5 Restrictions
Restriction 1. The technique for identifying unique users from their online ac-
tivity is restricted to the identification of the unique devices that they use for
browsing the Web. The consolidation of multiple devices in a unique user iden-
tity (e.g. relating her smartphone and tablet fingerprints) is out of the scope of the
technique proposed. Cross-device and cross-site identification can be performed by
combining logged sessions with fingerprints records or third party cookies and do
not suppose a research problem.
Restriction 2. The techniques for the analysis of user-generated content pre-
sented in this thesis are restricted to textual content. Therefore the analysis of
audio-visual content is out of the scope of this thesis.
Restriction 3. This thesis provides techniques for inferring psychographic char-
acteristics of consumers related with their position in the Consumer Decision
Journey and the Marketing Mix attributes they consider when talking about prod-
ucts and brands. The mining of other psychographic characteristics, such as hob-
bies or interests, is out of the scope of this thesis.
Restriction 4. This thesis provides techniques for inferring socio-demographic
characteristics of consumers related with their gender and place of residence. The
mining of other socio-demographic characteristic used in the marketing domain,
such as age or purchasing power, is out of the scope of this thesis.
Restriction 5. The technique for detecting Consumer Decision Journey stages
in user-generated content is limited to the English and Spanish languages. Other
languages are out of the scope of this thesis.
Restriction 6. The technique for detecting Marketing Mix elements in user-
generated-content is limited to the English and Spanish languages. Other lan-
guages are out of the scope of this thesis.
Restriction 7. The technique for detecting emotions in user-generated content
is limited to the Spanish language. Other languages are out of the scope of this
thesis.
67

Restriction 8. The text-mining techniques provided by this thesis have been
evaluated with corpora extracted from social media consisting in posts mention-
ing brands of the following commercial sectors: automotive, banking, beverages,
sports, telecommunications, food, retail, and utilities. The accuracy of the tech-
niques may vary significantly when applied to posts mentioning brands belonging
to other sectors.
Restriction 9. The deployment of the techniques proposed by this thesis in an
industrial environment, as well as the validation of their scalability is out of
the scope of this thesis. Nevertheless, we have performed some preliminary tests
regarding scalability whose results are shown in Section 9.4.7.
Restriction 10. We have chosen Freeling for executing the lemmatisation, part-
of-speech tagging and dependency parsing tasks of contribution C4, because it is
customisable, extensible and robust, and offers a high reliability for Spanish. The
evaluation results could vary slightly if another computational linguistic software
was used.
Restriction 11. As an exception, for contribution C2 we have used TreeTagger
for Spanish due to project technology requirements at the moment in which the
study was performed. Therefore, the part-of-speech distributions provided may
also may vary with the use of a different part-of-speech tagging.
Finally, to conclude this chapter, Figure 3.2 show the relationships among the
objectives, contributions, assumptions, hypotheses and restrictions of this thesis.
68

Objectives
O1
O2
O3
O4
O4.1
O4.2
O4.3
O4.4
Contributions
C1
C2
C3
C4
C4.1
C4.2
C4.3
C4.4
achieve apply to
O4.5 C4.5
Hypotheses, Assumptions and Restrictions
H1
H2
H3
H4
H5
H6
H7
A1 A2
A3
R1
R2 R3 R4
R5
R6
R7
R8
R9
R11
R10
Figure 3.2: Relationships between the objectives, contributions, assumptions,hypothesis and restrictions
69

70

Chapter 4
RESEARCH METHODOLOGY
This chapter describes the research methodology followed for obtaining the con-
tributions of this work. Before describing the methodology, Section 4.1 provides
definitions for the terms methodology, method, techniques, process, activity and
task, which appear frequently in this thesis. After providing these definitions,
Section 4.2 describes the research methodology, and Section 4.3 details the meth-
ods followed for obtaining the ontology and techniques provided by this thesis.
4.1 Terminology
Throughout literature, the terms methodology, method, technique, process, ac-
tivity, etc. are used indistinctively. Therefore, for the shake of clarity, in this
thesis we have adopted several IEEE48 definitions, which are described in detail
in different sources [IEEE, 1990, 1995a,b, 1997; Sommerville, 2007] and shown in
Figure 4.1.
Definition 5. A methodology is a comprehensive, integrated series of tech-
niques or methods that create a general system theory of how a class of thought-
intensive work ought to be performed [IEEE, 1995a].
Definition 6. Methods are parts of methodologies. A method is a set of “or-
derly processes or procedures used in the engineering of a product or in performing
a service” [Sommerville, 2007]. Methods are composed of processes.48http://www.ieee.org
71

Methodology
Method Technique
Process
Activity
Task
specify
composed of
composed ofcomposed of
composed of
composed of
Figure 4.1: Relations between methodology, methods, techniques, processes, ac-tivities and tasks (adapted from Gomez-Perez et al. [2004])
Definition 7. Techniques are parts of methodologies. Techniques are “the ap-
plication of accumulated technical or management skills and methods in the cre-
ation of a product or in performing a service” [IEEE, 1990]. Techniques detail
methods and their components (processes, activities and tasks).
Definition 8. A process is a set of activities whose goal is the development or
the evolution of software [Sommerville, 2007].
Definition 9. An activity is a defined body of work to be performed, including
its required input and output information [IEEE, 1997]. Activities can be divided
into zero or more tasks.
Definition 10. A task is the smallest unit of work subject to management ac-
countability. A task is a well-defined work assignment for one or more project
members. Related tasks are usually grouped to form activities [IEEE, 1995b].
72
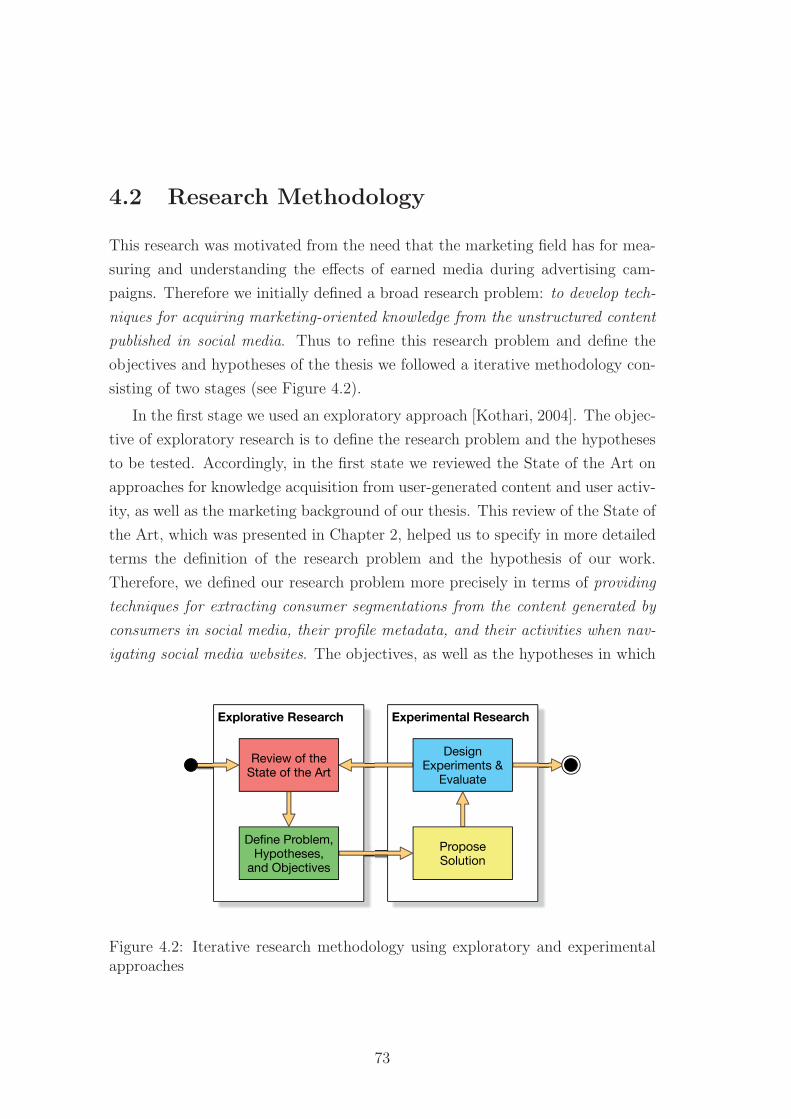
4.2 Research Methodology
This research was motivated from the need that the marketing field has for mea-
suring and understanding the effects of earned media during advertising cam-
paigns. Therefore we initially defined a broad research problem: to develop tech-
niques for acquiring marketing-oriented knowledge from the unstructured content
published in social media. Thus to refine this research problem and define the
objectives and hypotheses of the thesis we followed a iterative methodology con-
sisting of two stages (see Figure 4.2).
In the first stage we used an exploratory approach [Kothari, 2004]. The objec-
tive of exploratory research is to define the research problem and the hypotheses
to be tested. Accordingly, in the first state we reviewed the State of the Art on
approaches for knowledge acquisition from user-generated content and user activ-
ity, as well as the marketing background of our thesis. This review of the State of
the Art, which was presented in Chapter 2, helped us to specify in more detailed
terms the definition of the research problem and the hypothesis of our work.
Therefore, we defined our research problem more precisely in terms of providing
techniques for extracting consumer segmentations from the content generated by
consumers in social media, their profile metadata, and their activities when nav-
igating social media websites. The objectives, as well as the hypotheses in which
Explorative Research Experimental Research
Review of the State of the Art
Define Problem, Hypotheses,
and ObjectivesPropose Solution
Design Experiments &
Evaluate
Figure 4.2: Iterative research methodology using exploratory and experimentalapproaches
73

we rely to propose a solution for this problem were presented in Chapter 3.
Once we had defined the research problem we proceeded to the second state
where we followed an experimental approach [Dodig-Crnkovic, 2002; Kothari,
2004]. Our objective in the experimental research was to propose a solution based
on the hypotheses to fulfil the research objectives and design experiments to val-
idate the hypotheses. In this stage we investigated existing techniques in other
research fields such as Natural Language Processing and Information Retrieval
which might help to reach the objectives. Then we adapted these techniques to
the requirements defined by the particularities of our research. After this, we
designed the experiments to validate the proposed solutions, using well-known
evaluation metrics. Next, we carried out an abstraction exercise over the pro-
cedure that we had followed when developing the techniques, and designing and
executing the experiments. The objective was to elicit commonalities in the form
of data models, activities, and tasks. Thus, with these components we produced
the contributions of this thesis.
We performed five interactions, one per technique provided (contributions C3,
C4.1, C4.2, C4.3, C4.4, and C4.5). The ontology (contribution C1) was contin-
uously refined during the execution of each interaction. The morphosyntactic
characterisation of social media contents (contribution C2) was produced at a
preliminary stage of the first interaction.
4.3 Method Followed for Obtaining the Arte-
facts Provided by this Thesis
Extracting knowledge from social media information requires: (i) building a data
warehouse from which obtaining insights by querying it and, (ii) applying different
analysis techniques for obtaining knowledge from the data warehouse, such as
graph and time series analyses. The method that we have followed for obtaining
the artefacts provided by this thesis is inspired in an existing framework defined
by Hu and Cercone [2004] for Web mining and Business Intelligence reporting.
This framework follows the data warehousing approach proposed by Kimball et al.
[1998]; Kimball and Ross [2002] and provides guidelines for performing research
74

Data Capture
(clickstream, sale, customer, product, etc.)
Data Webhouse Construction
(clickstream, sale, customer, product, etc.)
Mining, OLAP
(rules, prediction models, cubes, reports, etc.)
Pattern Evaluations & Deployment
Figure 4.3: Web mining framework (adapted from Hu and Cercone [2004])
on data extracted from the Web, including guidelines for the data warehouse
construction, among other activities.
Figure 4.3 illustrates the data flow proposed by the framework, which involves
the following phases:
1. Data Capture. This phase consists in capturing and cleansing data com-
ing from heterogeneous web data sources.
2. Data Webhouse Construction. This phase consists in creating a database
for storing the data gathered in the previous activity. To do this, the
database requirements are analysed, the database schema is defined, and
the data captured are transformed according to this schema.
3. Mining, OLAP. This phase consists in the execution of data mining tasks
in order to derive useful knowledge from the data stored in the database
created in the previous activity.
4. Pattern Evaluations and Deployment. This phase consists in the eval-
uation of the models obtained in the previous activity, as well as on the
deployment of the learning validated.
We follow two methods for dealing with the data mining phases defined by
Hu and Cercone [2004]:
• For addressing theData Webhouse Construction phase we follow the method-
ology proposed by Suarez-Figueroa et al. [2012] for constructing ontology
networks. Section 4.3.1 describes the method followed for constructing the
social media data model that will be described in Chapter 5.
75
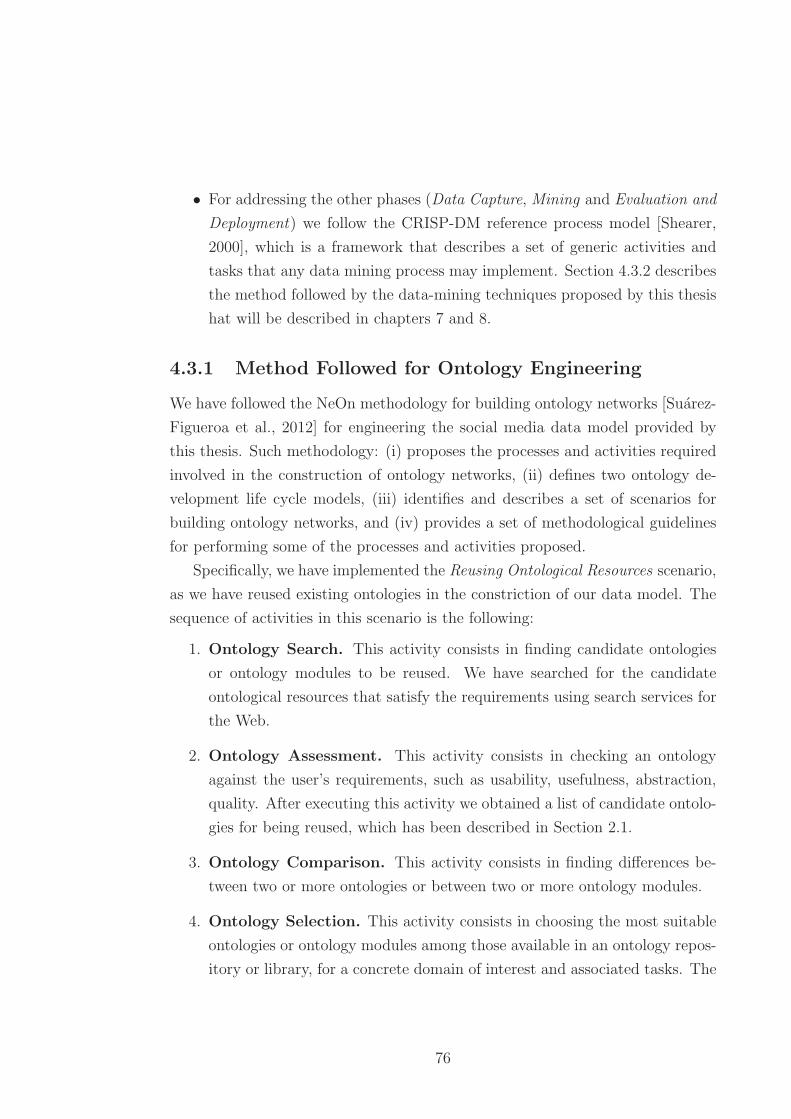
• For addressing the other phases (Data Capture, Mining and Evaluation and
Deployment) we follow the CRISP-DM reference process model [Shearer,
2000], which is a framework that describes a set of generic activities and
tasks that any data mining process may implement. Section 4.3.2 describes
the method followed by the data-mining techniques proposed by this thesis
hat will be described in chapters 7 and 8.
4.3.1 Method Followed for Ontology Engineering
We have followed the NeOn methodology for building ontology networks [Suarez-
Figueroa et al., 2012] for engineering the social media data model provided by
this thesis. Such methodology: (i) proposes the processes and activities required
involved in the construction of ontology networks, (ii) defines two ontology de-
velopment life cycle models, (iii) identifies and describes a set of scenarios for
building ontology networks, and (iv) provides a set of methodological guidelines
for performing some of the processes and activities proposed.
Specifically, we have implemented the Reusing Ontological Resources scenario,
as we have reused existing ontologies in the constriction of our data model. The
sequence of activities in this scenario is the following:
1. Ontology Search. This activity consists in finding candidate ontologies
or ontology modules to be reused. We have searched for the candidate
ontological resources that satisfy the requirements using search services for
the Web.
2. Ontology Assessment. This activity consists in checking an ontology
against the user’s requirements, such as usability, usefulness, abstraction,
quality. After executing this activity we obtained a list of candidate ontolo-
gies for being reused, which has been described in Section 2.1.
3. Ontology Comparison. This activity consists in finding differences be-
tween two or more ontologies or between two or more ontology modules.
4. Ontology Selection. This activity consists in choosing the most suitable
ontologies or ontology modules among those available in an ontology repos-
itory or library, for a concrete domain of interest and associated tasks. The
76
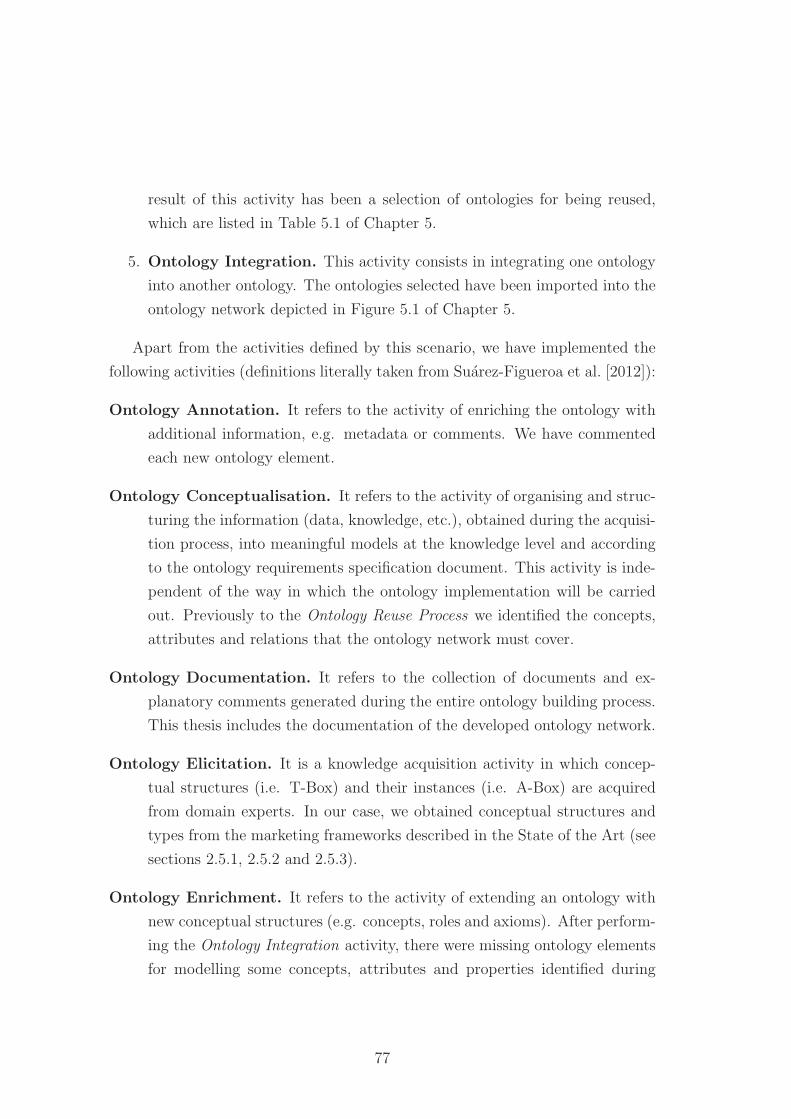
result of this activity has been a selection of ontologies for being reused,
which are listed in Table 5.1 of Chapter 5.
5. Ontology Integration. This activity consists in integrating one ontology
into another ontology. The ontologies selected have been imported into the
ontology network depicted in Figure 5.1 of Chapter 5.
Apart from the activities defined by this scenario, we have implemented the
following activities (definitions literally taken from Suarez-Figueroa et al. [2012]):
Ontology Annotation. It refers to the activity of enriching the ontology with
additional information, e.g. metadata or comments. We have commented
each new ontology element.
Ontology Conceptualisation. It refers to the activity of organising and struc-
turing the information (data, knowledge, etc.), obtained during the acquisi-
tion process, into meaningful models at the knowledge level and according
to the ontology requirements specification document. This activity is inde-
pendent of the way in which the ontology implementation will be carried
out. Previously to the Ontology Reuse Process we identified the concepts,
attributes and relations that the ontology network must cover.
Ontology Documentation. It refers to the collection of documents and ex-
planatory comments generated during the entire ontology building process.
This thesis includes the documentation of the developed ontology network.
Ontology Elicitation. It is a knowledge acquisition activity in which concep-
tual structures (i.e. T-Box) and their instances (i.e. A-Box) are acquired
from domain experts. In our case, we obtained conceptual structures and
types from the marketing frameworks described in the State of the Art (see
sections 2.5.1, 2.5.2 and 2.5.3).
Ontology Enrichment. It refers to the activity of extending an ontology with
new conceptual structures (e.g. concepts, roles and axioms). After perform-
ing the Ontology Integration activity, there were missing ontology elements
for modelling some concepts, attributes and properties identified during
77

the conceptualisation phase. Therefore we enriched the ontology network
with our own ontology elements, which have been grouped under a specific
namespace.
Ontology Environment Study. It refers to the activity of analysing the envi-
ronment in which the ontology is going to be developed. Such environment
has been described in Section 2.5.
Ontology Implementation. It refers to the activity of generating computable
models according to the syntax of a formal representation language (e.g.
RDFS49 and OWL50). Our ontology has been implemented using OWL.
Ontology Modularisation. It refers to the activity of identifying one or more
modules in an ontology with the purpose of supporting reuse or mainte-
nance. We have structured our ontology into seven modules that are de-
scribed in Chapter 5.
Ontology Summarisation. It refers to the activity of providing an abstract
or summary of the ontology content. We have summarised the ontology
network using a UML [OMG, 2011] representation, which has been included
in Chapter 5.
Regarding the ontology development life-cycle, we have selected an iterative-
incremental ontology network life cycle model, as requirements were changing
during the ontology development.
49http://www.w3.org/TR/rdf-schema50http://www.w3.org/TR/owl2-primer
78

4.3.2 Method Followed for the Data Mining Techniques
This research is framed within the reference model CRISP-DM (Cross Industry
Standard Process for Data Mining), applied to the extraction of information from
social media. Therefore, we have instantiated the activities and tasks within this
process for performing our research.
Figure 4.4 shows the activities involved in the CRISP-DM process. Next, each
of the activities are described, as well as the tasks that have been instantiated by
the contributions of this thesis.
Modeling
Data
Business Understanding
Data Understanding
Data Preparation
Evaluation
Deployment
Figure 4.4: The CRISP-DM reference model (adapted from Shearer [2000])
79

4.3.2.1 Business Understanding
This initial activity focuses on understanding the project objectives and require-
ments from a business perspective, then converting this knowledge into a data
mining problem definition and a preliminary plan designed to achieve the objec-
tives.
The result of this activity has been included in Chapter 2 where the State of
the Art, and specifically the marketing frameworks have been described, as well
as in Chapter 3, where the objectives, contributions, assumptions, hypotheses
and restrictions of this research have been detailed.
4.3.2.2 Data Understanding
This activity starts with initial data collection and proceeds with tasks that enable
data analysts to become familiar with the data, identify data quality problems,
discover first insights into the data, and/or detect interesting subsets to form
hypotheses regarding hidden information.
The tasks involved in this activity are the following:
Collect Initial Data. The goal of this task is to acquire the data used for learn-
ing purposes.
Describe Data. This task consists in examining the “gross” or “surface” proper-
ties of the acquired data, describing the format of the data and the quantity
of the data, as any other relevant features that have been discovered.
Explore Data. This task addresses data mining questions using querying, vi-
sualisation, and reporting techniques, obtaining distributions of key at-
tributes, relations between pairs of attributes and other simple statistical
analyses.
Verify Data Quality. This task examines the quality of the data, addressing
questions such as data completeness.
The data mining techniques proposed by this thesis, which are described in
chapters 7 and 8, implement this activity.
80

4.3.2.3 Data Preparation
This activity covers all tasks needed to construct the final dataset —data that
will be fed into the modelling tools—, from the initial raw data.
The tasks involved in this activity are the following:
Select Data. The goal of this task is to decide on the data to be used for anal-
ysis. Criteria include relevance to the data mining goals, quality, and tech-
nical constraints such as limits on data volume or data types.
Clean Data. The goal of this task is to raise the data quality to the level required
by the selected analysis techniques. This task may involve the selection
of clean subsets of the data, the insertion of suitable defaults, or more
ambitious techniques such as the estimation of missing data by modelling.
Construct Data. This task performs data preparation operations such as the
production of transformed values for existing attributes.
This activity is also implemented by the data mining techniques proposed by
this thesis, which are described in chapters 7 and 8.
4.3.2.4 Modelling
This activity applies one or more techniques for obtaining a final model. When
the performance of the model obtained depends on parameters, such parameters
are calibrated to optimal values.
The tasks involved in this activity are the following:
Select Modelling Technique. The goal of this task is to select the actual mod-
elling technique to be used (e.g. decision-tree building, rule-set engineering).
Generate Test Design. The goal of this task is to generate a procedure to
test the model for quality and validity. This involves choosing evaluation
metrics like precision or recall, and separating the dataset into training and
test sets.
Build Model. The goal of this task is to create the model. This typically in-
volves running a modelling tool on the prepared dataset and performing
81

human supervision on the model, depending on the modelling technique
chosen.
This activity is also implemented by the data mining techniques proposed by
this thesis, which are described in chapters 7 and 8.
4.3.2.5 Evaluation
This activity consists in evaluating the model obtained in order to assess that it
has a high quality from a data analysis perspective as well as to be certain the
model properly achieves the business objectives.
This activity is also implemented by the data mining techniques proposed by
this thesis, which are described in chapters 7 and 8.
4.3.2.6 Deployment
This activity integrates the model obtained into the application that will make
use of it.
As stated by Restriction 9, the deployment of the data mining techniques pro-
posed by this thesis is part of the future work. However, we have performed some
preliminary tests regarding scalability whose results are shown in Section 9.4.7.
82

Chapter 5
SOCIAL MEDIA ONTOLOGY
FOR CONSUMER ANALYTICS
This chapter describes the ontology for representing the information extracted
from social media as well as the knowledge about consumers that can be inferred
from such information by applying the analysis techniques presented in this thesis,
which are described in the following chapters.
The social media ontology has been defined as an ontology network, called
Social Graph Ontology (SGO)51. Such ontology reuses existing semantic vocabu-
laries, which have been already described in Section 2.1. The reused vocabularies
are enumerated in Table 5.1.
Figure 5.1 shows the import relations between the Social Graph Ontology
and the rest of vocabularies (non-dashed lines). In addition, the dashed lines
represent the existing import relations between the vocabularies reused. The
colours associated to each vocabulary are used to denote the namespaces to which
the classes and properties of the ontology network belong.
51The Social Graph Ontology OWL implementation has not been made public due to theexploitation rights defined by the Social TV Project (TSI-100600-2013-53)
83

Vocabulary Prefix NamespaceSIOC sioc http://rdfs.org/sioc/ns#
FOAF foaf http://xmlns.com/foaf/0.1/
schema.org schema http://schema.org/
Dublin Core dcterms http://purl.org/dc/terms/
SKOS skos http://www.w3.org/2004/02/skos/core#
ISOcat isocat http://www.isocat.org/ns/dcr.rdf#
Marl marl http://purl.org/marl/ns#
Onyx onyx http://www.gsi.dit.upm.es/onlogies/onyx/ns#
WGS84 geo http://www.w3.org/2003/01/geo/wsq84_pos#
Time Zone Ontology tzont http://www.w3.org/2006/timezone#
Named Graphs rdfg http://www.w3.org/2004/03/trix/rdfg-1/
Table 5.1: Vocabularies selected for defining the Social Graph Ontology
dcterms
sgo
tzont
isocat
skos
rdfg
sioc
foaf
onyx
marl
geo
schema
Figure 5.1: Ontology network
84

5.1 Ontology Modules
The ontology is divided into seven ontology modules that are shown in Fig-
ure 5.2. The arrows represent usages of ontology elements contained in the mod-
ules pointed by such arrows.
The modules of the Social Graph Ontology are the following:
1. The Core Ontology Module defines the main components of the ontology
(see Section 5.3).
2. The Publication Channels Module defines the ontology elements in charge
of representing information related to the content publication media (see
Section 5.4).
3. The Contents Module defines the ontology elements used for representing in-
formation related to the contents published in social media (see Section 5.5).
4. The Users Module defines the ontology elements used for representing in-
formation related to social media users (see Section 5.6).
5. The Opinions Module defines ontology elements used for representing infor-
mation related to opinions expressed within the contents (see Section 5.7).
6. The Topics Module defines the ontology elements used for representing in-
formation related to the topics that the contents are about (see Section 5.8).
7. Finally, the Locations Module defines the ontology elements used for repre-
senting information related to the geographical locations associated to users
and contents (see Section 5.9).
Before explaining the SGO modules in detail, we briefly summarise next the
notation used for describing the ontology.
85
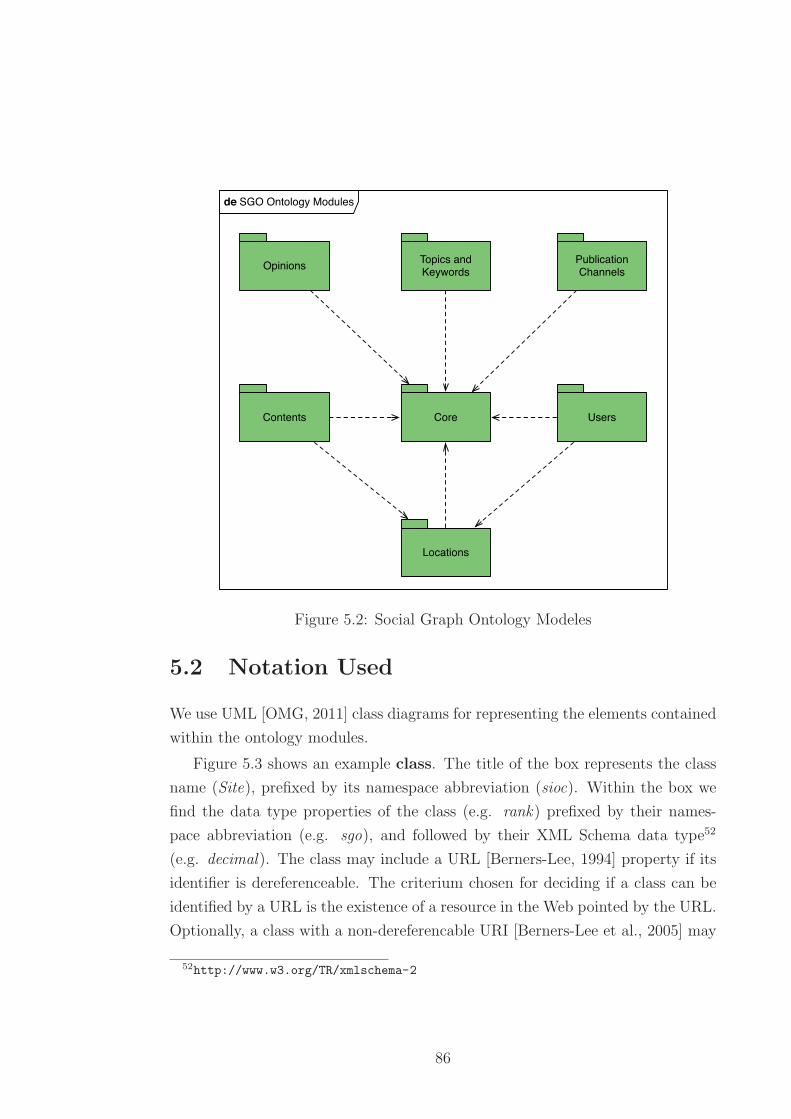
Core
Publication Channels
Contents Users
OpinionsTopics and Keywords
Locations
de SGO Ontology Modules
Figure 5.2: Social Graph Ontology Modeles
5.2 Notation Used
We use UML [OMG, 2011] class diagrams for representing the elements contained
within the ontology modules.
Figure 5.3 shows an example class. The title of the box represents the class
name (Site), prefixed by its namespace abbreviation (sioc). Within the box we
find the data type properties of the class (e.g. rank) prefixed by their names-
pace abbreviation (e.g. sgo), and followed by their XML Schema data type52
(e.g. decimal). The class may include a URL [Berners-Lee, 1994] property if its
identifier is dereferenceable. The criterium chosen for deciding if a class can be
identified by a URL is the existence of a resource in the Web pointed by the URL.
Optionally, a class with a non-dereferencable URI [Berners-Lee et al., 2005] may
52http://www.w3.org/TR/xmlschema-2
86

URLsgo:rank: decimalsgo:monthlyVisitors: nonNegativeIntegersgo:pagesPerVisit: nonNegativeIntegersgo:visitsPerVisitor: nonNegativeIntegersgo:minutesPerVisitor: nonNegativeIntegersgo:backlinks: nonNegativeIntegersgo:percentageMale: decimalsgo:percentageFemale: decimal
sioc:Site
Figure 5.3: Class Example
foaf:namefoaf:agefoaf:mboxdcterms:languagedcterms:description
foaf:Agent
dcterms:created
sgo:Activitysgo:hasActivity
1 *
Figure 5.4: Object Property Example
include a URI property with a clue on how can it be constructed from some of
its properties in order to warranty identifiers’ uniqueness.
Figure 5.4 shows an example object property represented by a labelled
arrow with the name of the property (e.g. hasActivity) prefixed by its namespace
abbreviation (sioc). The direction of the arrow is used for notating the domain
and range of the property. The range is represented as the class pointed by
the arrow (e.g. sgo:Activity), while the range is the other class (e.g foaf:Agent).
Properties are annotated with its domain and range cardinalities. Some object
properties may have inverse object properties. We notate these cases with a
bidirectional arrow annotated with the name of the property and its inverse, as
shown in Figure 5.5.
Class inheritance is represented with UML notation as shown in Figure 5.6,
where the classes foaf:Organisation and foaf:Person are subclasses of the class
foaf:Agent. In an analogous way, property inheritance is represented as shown
in Figure 5.7. In the example, the properties sioc:reply of, sioc:has reply, sioc:copies
and sioc:shares are subproperties of the property sioc:related to.
87

URLsgo:rank: decimalsgo:monthlyVisitors: nonNegativeIntegersgo:pagesPerVisit: nonNegativeIntegersgo:visitsPerVisitor: nonNegativeIntegersgo:minutesPerVisitor: nonNegativeIntegersgo:backlinks: nonNegativeIntegersgo:percentageMale: decimalsgo:percentageFemale: decimal
sioc:Site
sioc:has_host* *URI: concat(site, type)dcterms:type
sioc:Forum
sioc:host_of
Figure 5.5: Inverse Object Properties Example
foaf:Organisation
foaf:givenNamefoaf:familyNameschema:jobTitlefoaf:gender
foaf:Person
foaf:namefoaf:agefoaf:mboxdcterms:languagedcterms:description
foaf:Agent
Figure 5.6: Class Inheritance Example
Finally, instances are represented as shown in Figure 5.8 with underscored
names for instances and dashed lines for the instantiation relationship. In the ex-
ample the resources marl:Positive, marl:Neutral and marl:Negative are instances
of the class marl:Polarity.
88

*
*sioc:
relat
ed_t
osio
c:ha
s_re
ply
sioc:content (language tagged)dcterms:identifierdcterms:createddcterms:titledcterms:dateCopyrighteddcterms:mediumsioc:num_viewssioc:num_repliesgeo:latgeo:longschema:wordCountschema:contentRatingschema:articleBodyschema:isFamilyFriendlysgo:numLikes: xsd:nonNegativeIntegersgo:numShares: xsd:nonNegativeIntegersgo:impact: xsd:decimalsgo:reach: xsd:nonNegativeIntegersgo:engagement: xsd:decimalsgo:relevance: xsd:decimalsgo:isPromotion: xsd:boolean
sioc:Postsio
c:re
ply_
of* *
*
*
sgo:copies* *
sgo:shares
Figure 5.7: Property Inheritance Example
marl:Polarity
marl:Positive
marl:Negative
marl:Neutral
Figure 5.8: Instances Example
89

5.3 Core Ontology Module
Figure 5.9 shows a UML representation of the core ontology module. The classes
defined by this module are the following:
• The class sioc:UserAccount represents users accounts defined for specific
social media. The properties defined for the sioc:UserAccount class are
shown in Table 5.2.
• The class sioc:Post represents specific contents published in publication
channels by social media users. Such contents can take the form of text,
video, image, etc. The properties defined for this class are shown in Tables
5.3 and 5.4.
• The class sioc:Forum represents publication channels into which users pub-
lish contents. The properties defined for this class are shown in Table 5.5.
• The classmarl:Opinion represents opinions extracted from posts. The prop-
erties defined for this class are shown in Table 5.6.
• The class skos:Concept represents the subjects that contents are about,
around which online communities are organised, or users are interested in.
It also represents the specific entities (e.g. brands), which are opinionated
by users. As an indeterminate number of types of subjects and entities may
be opinionated by social media users, we have chosen not to create specific
concept subclasses, but to annotate such concepts with standard semantic
and syntactic categories. Further details are provided in Section 5.8. The
properties defined for this class are shown in Table 5.7.
• The class sioc:Community represents online communities of users that share
interest in specific topics. The object properties defined for this class are
shown in Table 5.8.
• Finally, the class rdfg:Graph represents named graphs that correspond to
specific social graphs instances. Such instances can be used for grouping
specific data analysis projects. The data properties defined for this class
are shown in Table 5.9.
90

cd Social Graph Ontology
marl:hasOpinion
*
*sioc:
relat
ed_t
o
*
URIrdfs:labeldcterms:description
rdfg:Graph
sioc:subscriber_of
sioc:container_of
sioc:creator_of
sioc:
has_
repl
y
marl:extractedFrom
marl:describesObject
*
*
*
sioc:topic
*
* dcterms:contributor
URI: hash(post, text)marl:optinionTextmarl:polarityValue
marl:Opinion
URLsioc:content (language tagged)dcterms:identifierdcterms:createddcterms:titledcterms:dateCopyrighteddcterms:mediumsioc:num_viewssioc:num_repliesgeo:latgeo:longschema:wordCountschema:contentRatingschema:articleBodyschema:isFamilyFriendlysgo:numLikes: xsd:nonNegativeIntegersgo:numShares: xsd:nonNegativeIntegersgo:impact: xsd:decimalsgo:reach: xsd:nonNegativeIntegersgo:engagement: xsd:decimalsgo:relevance: xsd:decimalsgo:isPromotion: xsd:boolean
sioc:Post
*
URI: concat(site, accountName)foaf:nickfoaf:accountNamedcterms:createddcterms:modifiedsgo:verified: xsd:booleansgo:private: xsd:booleansgo:outreach: xsd:decimalsgo:influence: xsd:decimalsgo:numPosts: xsd:nonNegativeIntegersgo:numFollowers: xsd:nonNegativeIntegersgo:numFollowing: xsd:nonNegativeIntegersgo:numLikes: xsd:nonNegativeIntegersgo:declaredLocation: xsd:string
sioc:UserAccount
URI: concat(site, type)dcterms:type
sioc:Forum
*
*
URI: concat(language, prefLabel)skos:prefLabel (language tagged)
skos:Concept
sioc:has_subscriber*
sioc:has_creator
*
*
sioc:has_container
*
*
dcterms:references
*
*dcterms:contributor
*
sioc:
repl
y_of
* *
*
*
sgo:copies* *
*
sioc:Community
dcterms:isPartOf
*
**
*
sioc:topic
sioc:topic* *
sioc:follows
* *
sgo:shares
dcterms:isPartOf
**
Figure 5.9: Core ontology module of the SGO
91

Property DescriptionURI An instance of sioc:UserAccount can be uniquely identified by a
URI constructed with the URL of the website in which the useraccount is registered, together with the account name of the userin the site.
sioc:follows User account followed by the user account being described, as forexample a Facebook friend or a Twitter followee.
sioc:subscriber of Publication channel to which the user account is subscribed.sioc:topic Subject in which the owner of the user account is interested.dcterms:isPartOf Online community to which a user belongs.dcterms:contributor Other account that can contribute to the content published by the
user account being described, or that can published in its name.foaf:nick Nick of the user in the publication channel (e.g. the screen name
in the case of Twitter).foaf:accountName Id of the user in the publication channel (in the case of Facebook
and Twitter numeric identifiers are used).foaf:page Web page that describes the user profile in the publication channel
being defined.foaf:avatar An image that represents the user in the publication channel.sioc:account of Person or organisation that owns the user account.sioc:has function Role that the user plays in the publication channel (e.g. influencer,
owner, etc.).dcterms:created Date and time of creation of the user account.dcterms:modified Date and time of modification of the user account.sgo:verified Determines if the publication channel has verified the person or
organisation that has been declared as the owner of the user ac-count.
sgo:private Determines whether the profile defined by the user account andthe content produced can be only accessed by authorised users, orare publicly available in the Web.
sgo:outreach KPI that measures the overall outreach of the user account interms of outreach metrics like the one provided by Kred (http://kred.com).
sgo:influence KPI that measures the overall influence of the user account interms of influence metrics like the one provided by Klout (http://klout.com) or Kred.
sgo:numPosts KPI that measures the number of posts published by the useraccount.
sgo:numFollowers KPI that measures the number of followers of the user account.sgo:numFollowing KPI that measures the number of user accounts followed by the
user account being described.sgo:numLikes Number of likes that hasve been received by the user account.sgo:withHeldIn Country in which the user account has been banned due to legal
restrictions, etc.sgo:declaredLocation Location declared by a user in her/his profile of a given social
medium.
Table 5.2: Properties of the class sioc:UserAccount
92

Property DescriptionURL Posts can be uniquely identified by the URL of the web resources
that annotate.sioc:has container Channel in which the post has been published. This property
is the inverse of the propertysioc:container of, which has beendefined by Table 5.5.
sioc:has creator User account that has published the post being described. Thisproperty is the inverse of the propertysioc:creator of, which hasbeen defined by Table 5.2.
dcterms:contributor User account that has contributed to the post being described.dcterms:references User account being mentioned in the post.sioc:related to Other post related to the content being described.sioc:reply of Publication of which the post being described is a reply. This
property is a sub property of the propertysioc:related to.sioc:has reply Post that is a reply of the content being described. This property
is also a sub property of sioc:related to, and the inverse of theproperty sioc:reply of.
sgo:shares Post that is being spread by the post being described, for exampleby using a retweet when disseminating through Twitter. Thisproperty is also a sub property of sioc:related to, and the inverseof the property sioc:reply of.
sgo:copies Other post whose content has been copied fully of partially inthe post being described, without explicitly declaring it in con-tent’s metadata (e.g. by setting the retweet flag when the publi-cation channel is Twitter). This property is also a sub propertyof sioc:related to.
marl:hasOpinion Object property that relates the post with an opinion containedin it.
sioc:topic Keyword included in the content of post, or subject that the postis about.
sioc:content Textual content of the post. The value of this property may beannotated with its language according to the mechanisms providedby RDF for tagging the language of string literals.
sioc:links to Multimedia content (videos, photos, etc.) linked from the post.dcterms:identifier Identifier assigned by the publication channel to the post.dcterms:created Publication date of the post.dcterms:dateCopyrighted Copyright date of the post.
Table 5.3: Properties of the class sioc:Post (1/2)
93

Property Descriptiondcterms:medium Main format of the content (text, video, etc.).foaf:based near Location from which the content has been published.geo:lat Geographical latitude from which the content has been published.geo:long Geographical longitude from which the content has been pub-
lished.schema:articleBody Content of the post in HTML format.sioc:num views KPI that measures the number of views of the content.sioc:num replies KPI that measures the number of replies to the content.sgo:numLikes KPI that measures number of times that the content has been
liked.sgo:numShares KPI that measures the number of times that the content has been
shared.sgo:impact KPI that measures the degree in which the content has been
viewed and shared.sgo:reach KPI constructed from the summatory of the influence of the au-
thor of the post and of the users that have disseminated the post.sgo:engagement KPI that measures the engagement of the content.sgo:relevance KPI that measures the relevance of the content. It is calculated
as an aggregation of the KPIs of the post, the author and the site.schema:wordCount Number of words included in the content.sgo:isPromotion Indicates if the post contains and advertising message.schema:isFamilyFriendly Indicates if the post does not include sensible content (e.g. vio-
lence).sgo:withHeldIn Country in which the post has been banned due to legal restric-
tions, etc.sgo:contentRating Rating of the post according to its publication channel (e.g. Twit-
ter rates the tweets according to its degree of dissemination).
Table 5.4: Properties of the class sioc:Post (2/2)
Property DescriptionURI An instance of the class sioc:Forum can be uniquely identified
by a URI constructed with the URL of the website to which thepublication channel belongs together with the type of publicationchannel.
sioc:has subscriber User account that is subscribed to the publication channel be-ing described. This property is the inverse of the propertysioc:subscriber of, which has been defined by Table 5.2.
sioc:container of Post published within the publication channel being described.dcterms:type Type of publication channel (e.g. weblog, microblog, social net-
work, etc.).sioc:has host Website to which the publication channel belongs.
Table 5.5: Properties of the class sioc:Forum
94

Property DescriptionURI Hashes constructed from the concatenation of the URL of the
posts where the opinion has been described and the text of theopinion may uniquely identify instances of marl:opinion.
marl:extractedFrom Post from which the opinion has been extracted. This propertyis the inverse of the property marl:hasOpinion, which has evendefined by Table 5.3
marl:describesObject Entity that is the object of the opinion being described (e.g. abrand or product).
marl:opinionText Text of the opinion.marl:polarityValue Numeric value of the opinion polarity. The Marl ontology speci-
fication (http://www.gsi.dit.upm.es/ontologies/marl/) rec-ommends using a real number in the interval [0, 1] for this value.
marl:hasPolarity Category of the opinion polarity (i.e. positive, negative or neutral)onyx:hasEmotionCategory Kind of emotion expressed in the opinion.sgo:hasPurchaseStage Purchase stage in the Consumer Decision Journey.sgo:hasMarketingMixAttribute Marketing Mix attribute.
Table 5.6: Properties of the class marl:Opinion
Property DescriptionURI An instance of the class skos:Concept can be uniquely identified by a
URI that includes the language and the label of the topic or keyword.skos:prefLabel Label of the concept. The value of this property may be annotated with
its language according to the mechanisms provided by RDF for taggingthe language of string literals.
isocat:datcat Lexical or semantic classification of the concept expressed according toa ISOcat [Kemps-Snijders et al., 2008] category. The categories reusedby this module are the following: verb, adjective, noun, common noun,proper noun, named entity, location, organisation, person, male, female,metadata tag, trademark (i.e. brand or product), and domain (i.e. busi-ness sector).
Table 5.7: Properties of the class skos:Concept
Property Descriptionsioc:topic Subject (or topic) around which the community has been con-
structed.dcterms:isPartOf Broader community of which the community being described is
part.
Table 5.8: Properties of the class sioc:Community
Property DescriptionURI Used for uniquely identifying the graphrdfs:label Name assigned to the social graph instance.dcterms:description Text that describes the social graph instance.
Table 5.9: Properties of the class rdfg:Graph
95

5.4 Publication Channels Module
This module describes the classes and properties related with content publication
channels, i.e. sites and sections within sites where social media contents are pub-
lished. Figure 5.10 shows a UML representation of this module, which includes
the class sioc:Site that describes websites. The properties defined for this class
are shown in Table 5.10.
URLsgo:rank: decimalsgo:monthlyVisitors: nonNegativeIntegersgo:pagesPerVisit: nonNegativeIntegersgo:visitsPerVisitor: nonNegativeIntegersgo:minutesPerVisitor: nonNegativeIntegersgo:backlinks: nonNegativeIntegersgo:percentageMale: decimalsgo:percentageFemale: decimal
sioc:Sitesioc:has_host
cd Publication Channels
* *URI: concat(site, type)dcterms:type
sioc:Forum
sioc:host_of
Figure 5.10: Publication Channels module of the SGO
Property DescriptionURL The URLs of the websites are used for identifying the instances
of this class.sgo:rank KPI that ranks the site according to a relevance metric like
Google’s PageRank [Page et al., 1999] or MozRank (http://moz.com/learn/seo/mozrank).
sgo:monthlyVisitors KPI that measures the average number of unique visitors to thesite per month. The correct identification of unique visitors mayrely on techniques like the ones described in Section 2.2.2, or onthe contribution of this thesis to the State of the Art described inChapter 7.
sgo:visitsPerVisitor KPI that measures the average number of visits to the site pervisitor and month.
sgo:pagesPerVisit KPI that measures the average number of pages viewed by a vis-itor per visit.
sgo:minutesPerVisitor KPI that measures the average time in minutes spent by a visitorof the site per visit.
sgo:backlinks KPI that measures the number of links to the site from other webpages.
sgo:percentageMale Percentage of male visitors.sgo:percentageFemale Percentage of female visitors.sioc:host of Publication channels that belong to the site being described. This
property is the inverse of the property sioc:has host, which hasbeen defined by Table 5.5.
Table 5.10: Properties of the class sioc:Site
96

5.5 Contents Module
This module describes the classes and properties related with the contents pub-
lished in social media. Figure 5.11 shows a UML representation of this module.
The classes defined by this module are the following:
• The class foaf:Document represents any kind of multimedia document pub-
lished online. The properties defined for this class are shown in Table 5.11.
• The class schema:Review is used for creating posts annotations by social
media analysts, community managers, or CRM operators. The properties
defined for this class are shown in Table 5.12.
The classes tzont:PoliticalRegion and tzont:Country are defined within in the
module that deals with geographical locations (see Section 5.9).
cd Contents
*
* *sgo:withheldIn
tzont:PoliticalRegion* *
sioc:links_to
URL
foaf:Document
foaf:based_near
URLsioc:content (language tagged)dcterms:identifierdcterms:createddcterms:titledcterms:dateCopyrighteddcterms:mediumsioc:num_viewssioc:num_repliesgeo:latgeo:longschema:wordCountschema:contentRatingschema:articleBodyschema:isFamilyFriendlysgo:numLikes: xsd:nonNegativeIntegersgo:numShares: xsd:nonNegativeIntegersgo:impact: xsd:decimalsgo:reach: xsd:nonNegativeIntegersgo:engagement: xsd:decimalsgo:relevance: xsd:decimalsgo:isPromotion: xsd:boolean
sioc:Post*
dcterms:createddcterms:creatorschema:reviewBodyschema:keywordssgo:starred: xsd:booleansgo:checked: xsd:booleansgo:status: rdfs:Literalsgo:priority: rdfs:Literal
schema:Review
* *schema:review
URI: (identifier)
tzont:Country
Figure 5.11: Contents module of the SGO
97

Property DescriptionURL Documents can be uniquely identified by their URLs of the resources that
annotate.
Table 5.11: Properties of the class foaf:Document
Property Descriptiondcterms:created Date of creation of the review.dcterms:creator Name of the reviewer.dcterms:reviewBody Text of the review.schema:keywords Tags assigned by the reviewer to the post.sgo:starred Indicates if the post has been highlighted by the reviewer.sgo:checked Indicates if the review task has finished.sgo:status Status of the actions derived from the review.sgo:priority Priority of the review.
Table 5.12: Properties of the class schema:Review
5.6 Users Module
This module describes the classes and properties related with social media users.
Figure 5.12 shows a UML representation of this module. The classes defined by
this module are the following:
• The class sioc:Role represents roles that the user accounts play in social
media, like influencer, content propagator, etc. The property defined for
this class is shown in Table 5.13.
• The class foaf:Agent defines persons or organisations that own user ac-
counts. The properties defined for this class are shown in Table 5.14.
• The class foaf:Organisation is used for describing organisations. We do not
have defined additional properties for the class foaf:Organisation. This class
is a subclass of foaf:Agent.
• The class foaf:Person is used for defining persons. This class is a subclass
of foaf:Agent. The properties defined for this class are shown in Table 5.15.
• The class foaf:Image is a subclass of the class foaf:Document, which has been
described in Section 5.5. This class is used for defining images assigned to
user accounts.
98

• The class foaf:PersonalProfileDocument is a also a subclass of the class
foaf:Document. This class is used for defining web pages that describe user
accounts.
• The class sgo:Activity is used for registering an activity record captured
by a tracking server. This activity record can be associated to a cookie,
a fingerprint, or both. The properties defined for this class are shown in
Table 5.16.
• The class sgo:Cookie is used for describing cookies installed in web browsers
used by users. A cookie is used in the context of this thesis as a mechanism
for uniquely identifying browsers, as it has been described in Section 2.2.2.1.
The properties defined for this class are shown in Table 5.17.
• The class sgo:Fingerprint is used for describing device fingerprints. The
properties defined for this class are shown in Table 5.18.
The classes tzont:PoliticalRegion and tzont:Country are defined within in the
module that deals with geographical locations (see Section 5.9).
99

cd Users
sioc:account_of*
*
sgo:withheldIn
foaf:Image
sioc:avatar
tzont:PoliticalRegion*
foaf:Organisation
*
*
* *
* *
foaf:page*
0..1
URI: hash(label,value,domain,path)rdfs:labeldcterms:createddcterms:validsgo:value: xsd:stringsgo:domain: xsd:NMTOKENsgo:path: xsd:normalizedStringsgo:isSecure: xsd:booleansgo:httpOnly: xsd:boolean
sgo:Cookie
sgo:hasCookie
URI: hash(all attributes)dcterms:createdsgo:xRealIP: xsd:NMTOKENsgo:xForwardedFor: xsd:NMTOKENsgo:userAgent: xsd:stringsgo:accept: xsd:stringsgo:acceptLanguage: xsd:stringsgo:acceptCharset: xsd:stringsgo:acceptEncoging: xsd:stringsgo:cacheControl: xsd:stringsgo:plugins: xsd:stringsgo:fonts: xsd:stringsgo:video: xsd:stringsgo:timeZone: xsd:stringsgo:sessionStorage: xsd:booleansgo:localStorage: xsd:booleansgo:iePersistence: xsd:boolean
sgo:Fingerprint
*
sgo:hasFingerprint0..1
*
foaf
:bas
ed_n
ear
sioc:Rolesioc:has_function
*
*foaf:page
*
*
sioc:function_of
foaf:account
foaf:PersonalProfileDocument
foaf:givenNamefoaf:familyNameschema:jobTitlefoaf:gender
foaf:Person
foaf:namefoaf:agefoaf:mboxdcterms:languagedcterms:description
foaf:Agentdcterms:created
sgo:Activitysgo:hasActivity
1 *
URI: concat(site, accountName)foaf:nickfoaf:accountNamedcterms:createddcterms:modifiedsgo:verified: xsd:booleansgo:private: xsd:booleansgo:outreach: xsd:decimalsgo:influence: xsd:decimalsgo:numPosts: xsd:nonNegativeIntegersgo:numFollowers: xsd:nonNegativeIntegersgo:numFollowing: xsd:nonNegativeIntegersgo:numLikes: xsd:nonNegativeIntegersgo:declaredLocation: xsd:string
sioc:UserAccount
URL
foaf:Document
URI: (identifier)
tzont:Country
*
Figure 5.12: Users module of the SGO
100

Property Descriptionfoaf:function of User account that plays the role being described. This property
is the inverse of the property sioc:has function, which has beendefined by Table 5.2.
Table 5.13: Property of the class sioc:Role
Property Descriptionfoaf:name Name of the agent.foaf:age Age of the agent.foaf:mbox E-mail of the agent.foaf:page Web page owned by the agent (e.g. weblog, homepage, etc.).foaf:account A user account owned by the agent. This property is the inverse
of sioc:account of, which has been defined by Table 5.13.foaf:based near Normalised geographical location of the agent (e.g. place of resi-
dence). In Section 8.5 we provide a technique for identifying theplace of residence of social media users.
dcterms:language Language spoken by the agent.dcterms:description Description declared by the user about herself/himself in her/his
profile of the social medium.sgo:hasActivity Activity record registered for the agent.
Table 5.14: Properties of the class foaf:Agent
Property Descriptionfoaf:givenName Given name (e.g. first name) of the person being described.foaf:familyName Family name (e.g. last name) of the person being described.schema:jobTitle Profession of the person being described.foaf:gender Gender of the person ( “male” or “female”). In Section 8.6 we pro-
vide a technique for identifying the gender of social media users.
Table 5.15: Properties of the class foaf:Person
Property Descriptiondcterms:created Timestamp in which the activity record has been gathered. It is
defined at the granularity of milliseconds.sgo:hasCookie Cookie assigned to a web browser when registering the activity.sgo:hasFingerprint Fingerprint of a device when registering the activity.
Table 5.16: Properties of the class foaf:Activity
101
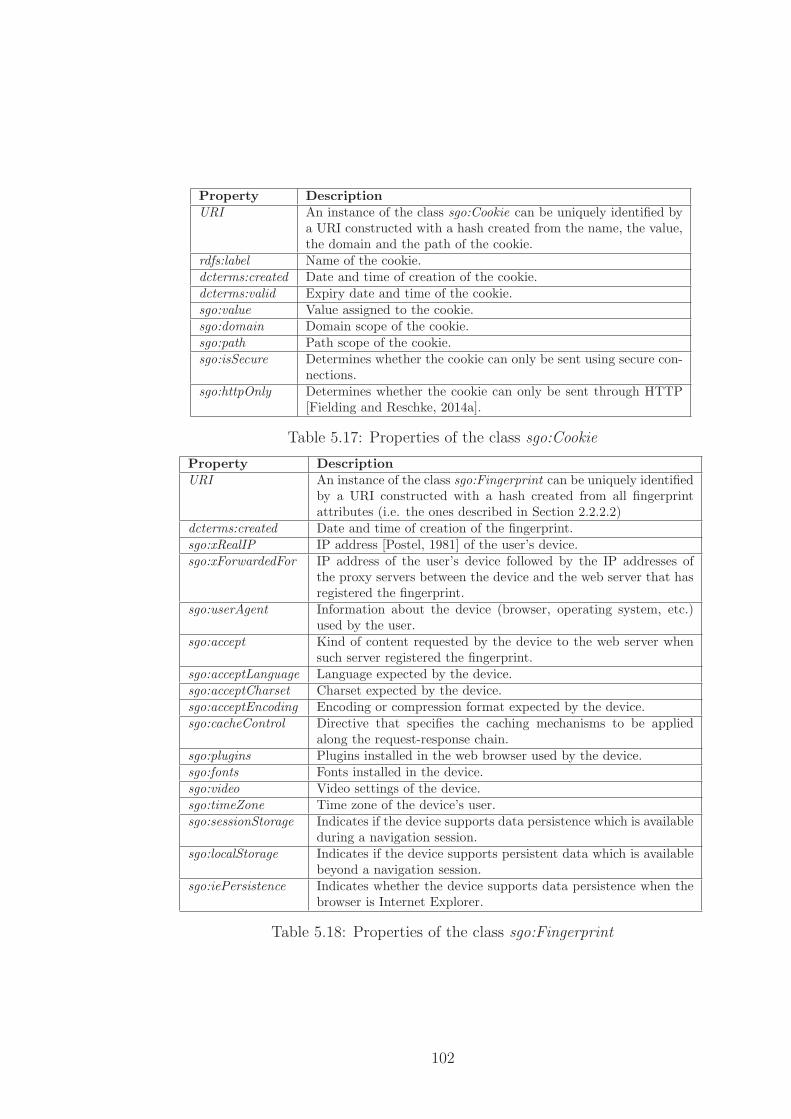
Property DescriptionURI An instance of the class sgo:Cookie can be uniquely identified by
a URI constructed with a hash created from the name, the value,the domain and the path of the cookie.
rdfs:label Name of the cookie.dcterms:created Date and time of creation of the cookie.dcterms:valid Expiry date and time of the cookie.sgo:value Value assigned to the cookie.sgo:domain Domain scope of the cookie.sgo:path Path scope of the cookie.sgo:isSecure Determines whether the cookie can only be sent using secure con-
nections.sgo:httpOnly Determines whether the cookie can only be sent through HTTP
[Fielding and Reschke, 2014a].
Table 5.17: Properties of the class sgo:Cookie
Property DescriptionURI An instance of the class sgo:Fingerprint can be uniquely identified
by a URI constructed with a hash created from all fingerprintattributes (i.e. the ones described in Section 2.2.2.2)
dcterms:created Date and time of creation of the fingerprint.sgo:xRealIP IP address [Postel, 1981] of the user’s device.sgo:xForwardedFor IP address of the user’s device followed by the IP addresses of
the proxy servers between the device and the web server that hasregistered the fingerprint.
sgo:userAgent Information about the device (browser, operating system, etc.)used by the user.
sgo:accept Kind of content requested by the device to the web server whensuch server registered the fingerprint.
sgo:acceptLanguage Language expected by the device.sgo:acceptCharset Charset expected by the device.sgo:acceptEncoding Encoding or compression format expected by the device.sgo:cacheControl Directive that specifies the caching mechanisms to be applied
along the request-response chain.sgo:plugins Plugins installed in the web browser used by the device.sgo:fonts Fonts installed in the device.sgo:video Video settings of the device.sgo:timeZone Time zone of the device’s user.sgo:sessionStorage Indicates if the device supports data persistence which is available
during a navigation session.sgo:localStorage Indicates if the device supports persistent data which is available
beyond a navigation session.sgo:iePersistence Indicates whether the device supports data persistence when the
browser is Internet Explorer.
Table 5.18: Properties of the class sgo:Fingerprint
102

5.7 Opinions Module
This module describes the classes and properties related with the opinions ex-
pressed by consumers in their posts. Figure 5.13 shows a UML representation of
this module. The classes defined by this module are the following:
• The class marl:Polarity indicates the polarity of the opinion. There are
three possible instances of this class: marl:Positive, marl:Negative and
marl:Neutral.
• The class onyx:EmotionCategory is used for indicating the kind of emo-
tion expressed within an opinion according to the categories defined in the
State of the Art (see Table 2.4). Therefore, we have defined the follow-
ing instances for this class: sgo:Satisfaction, sgo:Dissatisfaction, sgo:Love,
sgo:Hate, sgo:Happiness, sgo:Sadness, sgo:Trust and sgo:Fear. This thesis
provides a technique for identifying these emotion categories in Section 8.4.
• The class sgo:PurchaseStage is used for indicating the purchase stage ex-
pressed by a consumer according to the categories defined in the State
of the Art (see Figure 2.6). Therefore, we have defined the following in-
stances for this class: sgo:Awareness, sgo:Evaluation, sgo:Purchase and
sgo:PostpurchaseExperience. This thesis provides a technique for identi-
fying these Consumer Decision Journey stages in Section 8.2.
• The class sgo:MarketingMixAttribute is used for indicating the Marketing
Mix attributes to which consumers refer within their opinions according to
the categories defined in the State of the Art (see Table 2.3). Therefore,
we have defined the following instances for this class: sgo:CustomerService,
sgo:Sponsorship, sgo:Quality, sgo:Promotion, sgo:Advertisement, sgo:Price,
sgo:Design, sgo:PointOfSale, sgo:Warranty and sgo:LoyaltyMarketing. This
thesis provides a technique for identifying these purchase stages in Sec-
tion 8.3, with the exception of Warranty and Loyalty Marketing, which are
out of the scope.
103
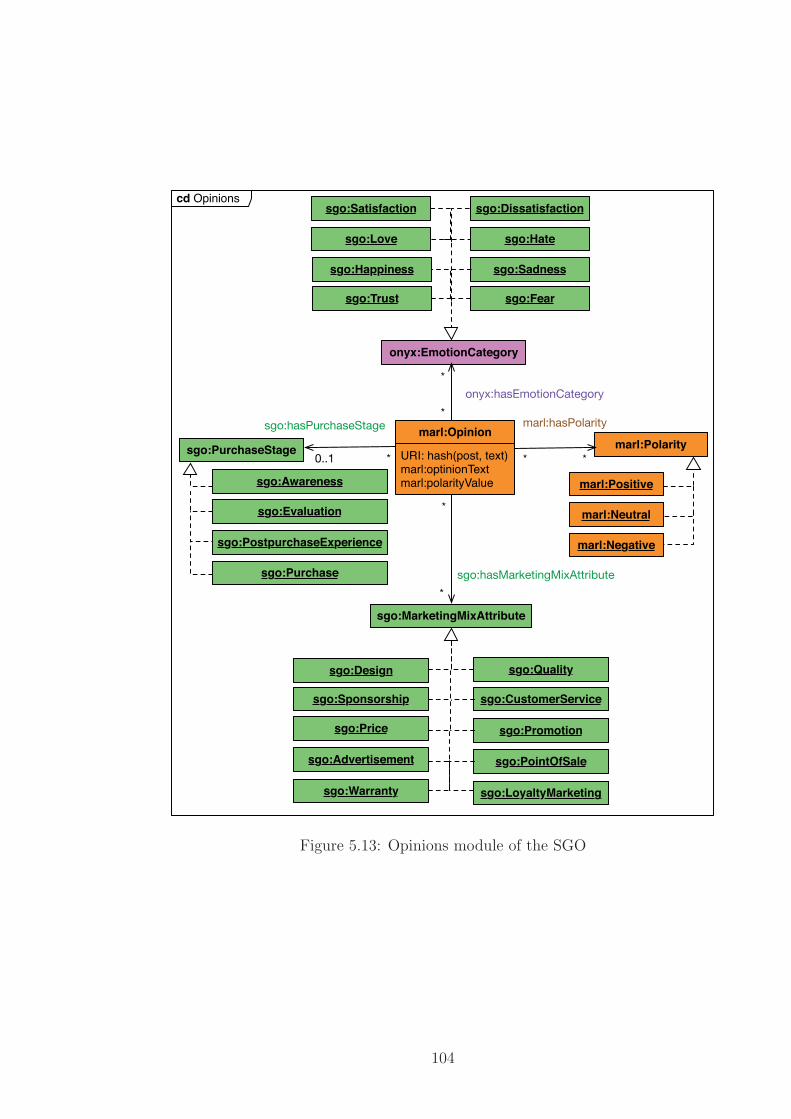
cd Opinions
sgo:MarketingMixAttribute
sgo:hasMarketingMixAttribute
sgo:PointOfSalesgo:Advertisement
sgo:Design
onyx:EmotionCategory
onyx:hasEmotionCategory
*
*
sgo:Satisfaction sgo:Dissatisfaction
sgo:Love sgo:Hate
sgo:Happiness sgo:Sadness
sgo:Trust sgo:Fear
*
*
sgo:PurchaseStage marl:Polarity
sgo:hasPurchaseStage marl:hasPolarity
0..1 * * *
marl:Positive
marl:Negative
marl:Neutral
sgo:Price sgo:Promotion
sgo:Quality
sgo:Sponsorship sgo:CustomerService
URI: hash(post, text)marl:optinionTextmarl:polarityValue
marl:Opinion
sgo:LoyaltyMarketingsgo:Warranty
sgo:PostpurchaseExperience
sgo:Awareness
sgo:Evaluation
sgo:Purchase
Figure 5.13: Opinions module of the SGO
104

5.8 Topics and Keywords Module
This module describes the instances used for annotating the topics and keywords
included in social media content.
Figure 5.14 shows a UML representation of this module. Note that there
exists part-of relationships between some of the categories show in the figure
(e.g. between noun types). The definition of this mereology is out of the scope
of this work since they are specified by ISOCat [Kemps-Snijders et al., 2008].
cd Topics and Keywords
URI: concat(language, prefLabel)skos:prefLabel (language tagged)
skos:Concept
isocat:datcat*
*
(verb)
isocat:DC-1424
(noun)
isocat:DC-1333
(adjective)
isocat:DC-1230
(common noun)
isocat:DC-1256
(proper noun)
isocat:DC-1371
(named entity)
isocat:DC-2275
(location)
isocat:DC-4339
(Person)
isocat:DC-2978
(Organisation)
isocat:DC-2979
(female)
isocat:DC-2950
(male)
isocat:DC-2949
(metadata tag)
isocat:DC-5436
(domain)
isocat:DC-2212
(trademark)
isocat:DC-414
rdfs:Resource
Figure 5.14: Topics and Keywords module of the SGO
105
5.9 Geographical Locations Module
This module describes the classes and properties related with the locations of
users and contents. Figure 5.15 shows a UML representation of this module. The
classes defined by this module are the following:
• The class tzont:PoliticalRegion represents a location that corresponds to any
kind of political region (e.g. country, state, city). The properties defined
for this class are shown in Table 5.19.
• The class tzont:Country represents a political region that corresponds to a
country. The properties defined for this class are shown in Table 5.20.
• The class tzont:State represents a political region that corresponds to an
administrative region of first level within a country (e.g. state, autonomous
community). The properties defined for this class are shown in Table 5.21.
• The class tzont:County represents a political region that corresponds to
an administrative region of second level within a country (e.g. county,
province). The properties defined for this class are shown in Table 5.22.
• The class tzont:City represents a political region that corresponds to an
administrative region of third level within a country (e.g. city, town, village,
settlement). The properties defined for this class are shown in Table 5.23.
• The class schema:Continent represents a continent of the world. The prop-
erties defined for this class are shown in Table 5.24.
• The class tzont:TimeZone represents a time zone to which a political region
belongs. The properties defined for this class are shown in Table 5.25.
106
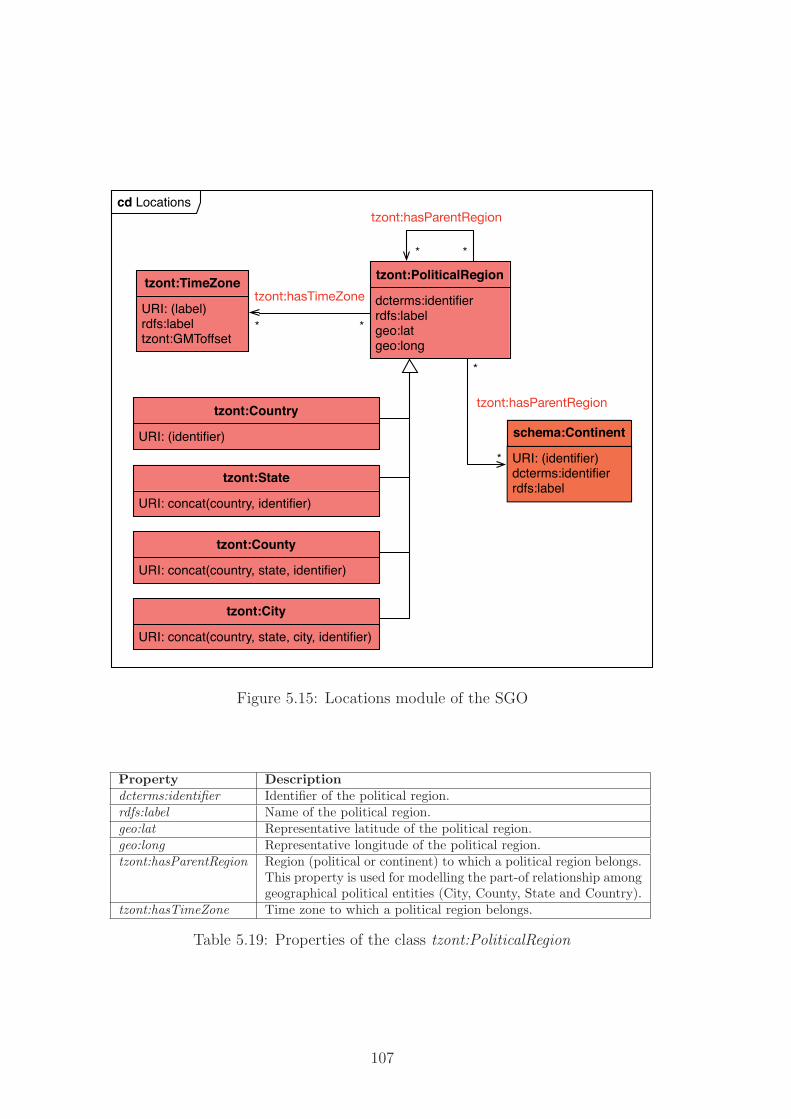
cd Locations
URI: (label)rdfs:labeltzont:GMToffset
tzont:TimeZonetzont:hasTimeZone
* *
* *
tzont:hasParentRegion
URI: (identifier)dcterms:identifierrdfs:label
schema:ContinentURI: (identifier)
tzont:Country
URI: concat(country, identifier)
tzont:State
URI: concat(country, state, identifier)
tzont:County
URI: concat(country, state, city, identifier)
tzont:City
dcterms:identifierrdfs:labelgeo:latgeo:long
tzont:PoliticalRegion
tzont:hasParentRegion
*
*
Figure 5.15: Locations module of the SGO
Property Descriptiondcterms:identifier Identifier of the political region.rdfs:label Name of the political region.geo:lat Representative latitude of the political region.geo:long Representative longitude of the political region.tzont:hasParentRegion Region (political or continent) to which a political region belongs.
This property is used for modelling the part-of relationship amonggeographical political entities (City, County, State and Country).
tzont:hasTimeZone Time zone to which a political region belongs.
Table 5.19: Properties of the class tzont:PoliticalRegion
107

Property DescriptionURI The instances of the class tzont:Country can be uniquely identified
by a URI constructed from the identifier of the country.
Table 5.20: Properties of the class tzont:Country
Property DescriptionURI The instances of the class tzont:State can be uniquely identified
by a URI constructed from the identifiers of the country and thestate.
Table 5.21: Properties of the class tzont:State
Property DescriptionURI The instances of the class tzont:County can be uniquely identified
by a URI constructed from the identifiers of the country, the state,and the county.
Table 5.22: Properties of the class tzont:County
Property DescriptionURI The instances of the class tzont:City can be uniquely identified by
a URI constructed from the identifiers of the country, the state,the county and the city.
Table 5.23: Properties of the class tzont:City
Property DescriptionURI The instances of the class schema:Continent can be uniquely iden-
tified by a URI constructed from the identifier of the continent.dcterms:identifier Identifier of the continent.rdfs:label Name of the continent.
Table 5.24: Properties of the class schema:Continent
Property DescriptionURI The instances of the class tzont:TimeZone can be uniquely iden-
tified by a URI constructed from the name of the time zone.rdfs:label Name of the time zone.tzont:GMToffset Difference of the time zone from Greenwich Meridian Time
(GMT).
Table 5.25: Properties of the class tzont:TimeZone
108

Chapter 6
MORPHOSYNTACTIC
CHARACTERISATION OF
SOCIAL MEDIA CONTENTS
In this chapter, we make use of a part-of-speech tagger to process and characterise
a corpus of user-generated content extracted from different social media sources.
Specifically, we have studied differences in the language used in distinct types of
social media content by analysing the distribution of part-of-speech categories in
such sources. The chapter is structured as follows:
• Firstly, Section 6.1 describes the kinds of social media that we have com-
pared, from which we have extracted the contents to be analysed.
• Secondly, Section 6.2 explains the distributions of part-of-speech categories
by type of social media.
• Finally, Section 6.3 presents the conclusions of the analysis, validating the
first hypothesis of this thesis: the contents published in social media statis-
tically present different morphosyntactic features depending on the specific
kind of media where they have been published.
109

6.1 Types of Social Media Analysed
We have characterised the following types of social media by extracting and
analysing a random sample of 10,000 textual contents published on them, uni-
formly distributed among the following media types:
Blogs. We have extracted the texts of posts published in feeds of blog publishing
platforms such as Wordpress53 and Blogger54. Content published in these
sites usually consists on medium-sized posts and small comments about
such posts.
Forums. We have scrapped the text of the comments published in web forums
constructed with vBulletin55 and phpBB56 technologies. Content published
in these sites consists in dialogues between users in the form of a timely
ordered sequence of small comments.
Microblogs. We have extracted the short messages published in Twitter and
Tumblr57 by querying their APIs. Content published in these sources con-
sists on small pieces of text (e.g. maximum 140 characters for Twitter).
Social networks. We have extracted the messages published in Facebook and
Google Plus58 by querying their APIs. Content published in these sites goes
from small statuses or comments to medium-sized posts.
Review sites. We have scrapped the text of the comments published in Ciao59,
Dooyoo60 and reviews published in Amazon61. The length of the content
published in these sites is also variable.
53http://wordpress.org54http://www.blogger.com55http://www.vbulletin.com56http://www.phpbb.com57http://www.tumblr.com58http://plus.google.com59http://www.ciao.com60http://www.dooyoo.com61http://www.amazon.com
110

Audio-visual content publishing sites. We have extracted the textual com-
ments associated to the audio-visual content published in YouTube62 and
Vimeo63. Textual content published in these sites takes the form of small
textual comments.
News publishing sites. We have extracted the articles from the feeds pub-
lished in such sources. Sites of this kind can be classified as traditional
editorially controlled media. However, comments posted by article readers
can be catalogued as user-generated content. Thus, content published in
news sites consists on articles and small comments about such articles.
Other sites not classified in the categories above (e.g. Content Manage-
ment Systems) that publish their content as structured feeds, or that have
a known HTML structure from which a scrapping technique can be applied.
The content published in these sites is heterogeneous.
6.2 Distribution of Part-of-Speech Categories
For performing the study of the distribution of part-of-speech (PoS) categories in
user-generated content, we have collected a corpus with 10, 000 posts written in
Spanish, obtained from the sources described in the previous section. The posts
extracted are related to the telecommunications domain. We have performed the
PoS analysis by implementing a GATE [Cunningham et al., 2011] pipeline, with
TreeTagger [Schmid, 1994] as the PoS tagger. Therefore, the PoS distributions
obtained are based on an automatic tagger. A previous work by Garcıa Moya
[2008] includes an evaluation of TreeTagger with a Spanish parameterisation when
applied to a corpus of news articles. The precision, recall and F-measure obtained
on such evaluation were 0.8831, 0.8733 and 0.8782, respectively.
Table 6.1 shows the distributions obtained. The TreeTagger tag-set for Span-
ish64 determines the PoS categories. As shown in the table, there are variations
in the distribution of these categories with respect to the publication source.
62http://www.youtube.com63http://vimeo.com64ftp://ftp.ims.uni-stuttgart.de/pub/corpora/spanish-tagset.txt
111

Table 6.1: Distribution of part-of-speech categories by social media typePoS Category News Blogs Audiov. Reviews Microbl. Forums Other S. Net. AllNoun 30.9% 30.0% 29.0% 23.2% 33.7% 22.0% 26.6% 32.7% 27.4%Common 53.3% 56.9% 50.5% 71.5% 50.4% 68.8% 60.9% 50.2% 59.2%Proper 42.3% 37.3% 42.9% 23.8% 36.1% 25.7% 34.1% 43.1% 34.6%Foreign word 0.2% 0.5% 1.4% 0.5% 1.8% 0.9% 0.7% 1.0% 0.8%Measure unit (e.g.GHz)
0.2% 0.8% 0.0% 0.6% 0.1% 0.2% 0.2% 0.2% 0.3%
Month name (e.g.Feb)
0.5% 1.1% 0.4% 0.1% 0.1% 0.3% 0.5% 0.4% 0.4%
Acronym (e.g. UN) 0.3% 0.5% 0.5% 0.1% 0.3% 0.5% 0.3% 0.5% 0.3%Letter of the alpha-bet (e.g. b)
0.6% 1.1% 2.3% 1.0% 4.0% 1.7% 1.0% 1.9% 1.5%
Alphanumeric code(e.g. A4)
2.2% 1.5% 1.9% 0.9% 1.1% 1.2% 1.9% 1.1% 1.5%
Symbol (e.g. $, £) 0.4% 0.3% 0.1% 1.4% 6.1% 0.7% 0.5% 1.5% 1.3%Adjective 8.6% 8.3% 6.4% 8.2% 9.4% 7.1% 8.4% 6.2% 8.0%Quantity ordinal 4.6% 2.7% 1.4% 1.5% 0.4% 1.1% 1.7% 1.1% 1.9%Quantity cardinal 34.7% 30.6% 28.5% 22.0% 33.0% 24.8% 34.3% 25.5% 29.6%Quantity other 7.5% 12.0% 14.5% 23.6% 7.4% 23.3% 13.8% 19.3% 15.7%Other 53.3% 54.8% 55.6% 53.0% 59.1% 50.8% 50.1% 54.1% 52.9%Adverb 2.5% 3.4% 3.2% 4.9% 3.9% 4.5% 3.7% 3.4% 3.8%Negation 18.2% 18.1% 29.7% 23.9% 36.2% 30.0% 30.6% 29.1% 27.4%Other 81.8% 81.9% 70.3% 76.1% 63.8% 70.0% 69.4% 70.9% 72.6%Determiner 11.5% 9.8% 7.6% 8.0% 5.8% 8.0% 8.7% 7.5% 8.5%Conjunction 6.1% 7.8% 6.6% 9.7% 6.2% 10.1% 8.7% 7.4% 8.3%Adversative coordi-nating
2.4% 3.1% 3.9% 5.7% 7.0% 5.7% 4.1% 3.7% 4.6%
Negative coordinat-ing
0.3% 0.9% 0.7% 1.5% 1.0% 1.5% 1.3% 1.3% 1.2%
Other coordinating 44.3% 44.2% 36.6% 29.3% 36.6% 32.5% 38.9% 41.6% 36.7%”que” 28.5% 26.9% 27.0% 34.4% 26.1% 31.7% 29.5% 26.7% 30.1%Subordinating(finite clauses)
2.2% 3.1% 1.6% 4.4% 1.4% 3.0% 2.9% 2.2% 3.0%
Subordinating (infi-nite clauses)
10.6% 9.7% 18.7% 10.8% 10.7% 11.1% 10.2% 12.0% 10.8%
Other subordinating 11.7% 12.0% 11.5% 13.9% 17.2% 14.6% 13.1% 12.6% 13.5%Pronoun 1.9% 3.4% 5.0% 5.6% 4.7% 5.8% 4.3% 4.4% 4.4%Demonstrative 23.7% 24.3% 15.4% 20.2% 15.1% 13.9% 18.3% 16.2% 17.8%Interrogative 0.7% 0.9% 0.0% 0.8% 1.8% 1.1% 0.6% 0.8% 0.9%Personal (clitic) 17.1% 16.0% 11.4% 11.4% 16.3% 17.2% 14.6% 12.8% 14.6%Personal (non-clitic) 15.7% 22.1% 37.3% 44.3% 42.9% 50.3% 39.0% 42.5% 40.8%Posessive 38.4% 34.3% 33.0% 21.2% 22.0% 15.9% 24.8% 24.6% 23.4%Relative 4.3% 2.4% 2.8% 2.1% 1.9% 1.6% 2.7% 3.1% 2.4%Preposition 15.2% 14.6% 11.8% 12.7% 8.2% 11.9% 12.9% 11.5% 12.6%Portmanteau word“al”
3.8% 3.1% 3.4% 2.8% 2.1% 2.8% 3.1% 3.0% 3.1%
Portmanteau word“del”
7.6% 4.2% 3.9% 4.5% 3.2% 3.9% 4.3% 4.8% 4.8%
Other 88.6% 92.7% 92.8% 92.6% 94.7% 93.3% 92.6% 92.3% 92.1%Punctuationmark
10.7% 8.5% 12.9% 9.4% 8.3% 9.2% 9.7% 10.5% 9.7%
Full stop 4.9% 17.1% 41.5% 8.7% 29.8% 25.5% 13.2% 25.0% 16.8%Comma 48.9% 54.5% 29.1% 50.1% 25.2% 44.1% 44.7% 33.8% 43.7%Colon 3.8% 3.8% 2.4% 5.4% 13.9% 4.8% 5.2% 15.2% 6.6%Semicolon 1.0% 0.9% 1.3% 0.5% 0.6% 0.5% 0.5% 0.6% 0.7%Dash 2.5% 1.4% 3.4% 1.5% 0.7% 2.1% 3.6% 3.3% 2.4%Ellipsis 2.9% 4.3% 7.7% 8.8% 16.3% 8.4% 6.2% 9.2% 7.4%Slash 0.5% 0.0% 0.0% 0.6% 3.8% 0.1% 0.3% 0.1% 0.5%Percent sign 1.3% 1.1% 0.0% 0.9% 0.0% 0.7% 1.3% 0.4% 0.9%Left parenthesis 13.4% 6.2% 5.2% 8.8% 2.1% 5.1% 11.1% 4.1% 8.1%Rigth parenthesis 13.4% 6.2% 4.7% 8.6% 4.1% 5.5% 11.0% 4.6% 8.3%Quotation symbol 7.5% 4.5% 4.6% 6.2% 3.5% 3.2% 2.9% 3.6% 4.5%Verb 12.0% 13.8% 16.8% 17.8% 19.1% 20.5% 16.4% 16.0% 16.7%To be (“estar”) 1.6% 1.9% 0.5% 1.7% 1.1% 1.5% 1.5% 1.3% 1.5%To have (“haber”) 5.8% 3.5% 2.4% 3.5% 2.0% 3.2% 3.9% 1.9% 3.4%Lexical past partici-ple
16.0% 13.4% 11.7% 10.2% 5.8% 10.0% 12.2% 8.9% 10.8%
Lexical finite 47.2% 48.8% 48.5% 46.8% 50.1% 50.2% 48.5% 51.8% 48.8%Lexical gerund 1.0% 0.7% 0.3% 0.9% 0.4% 0.8% 0.8% 1.1% 0.8%Lexical infinitive 20.4% 22.9% 28.1% 25.5% 32.0% 26.7% 25.0% 26.9% 26.0%Modal 1.5% 1.8% 0.8% 1.4% 0.8% 1.9% 1.6% 1.9% 1.6%To be (“ser”) pastpart.
0.6% 0.3% 0.6% 0.9% 0.1% 0.2% 0.4% 0.1% 0.4%
To be (“ser”) infini-tive
0.4% 0.4% 0.4% 0.6% 0.3% 0.3% 0.5% 0.5% 0.4%
To be (“ser”) other 5.6% 6.4% 6.8% 8.7% 7.3% 5.3% 5.7% 5.6% 6.3%“Se” (as particle) 0.7% 0.6% 0.7% 0.5% 0.7% 0.7% 0.6% 0.6% 0.6%
112

The distribution of all PoS categories in news publishing sites and blogs is
very similar, because the posts published in these sources have a similar writing
style, as there are no limitations on the size of such posts.
In addition, the sources not classified (i.e. “other”) have a similar distribution
to the combination of all sources. This may be due to the heterogeneity of the
publications contained in the web pages that have not been classified as specific
content type.
Next, we discuss some relevant insights obtained from the distribution of each
PoS category.
6.2.1 Distribution of Nouns
As shown in Table 6.1 the distribution of common and proper nouns is very
different for forums and reviews. It seemed strange to us that proper nouns,
found in the sources where discussions about specific product models are raised,
were less used than in the other sources. After examining a sample of 100 texts,
we noticed that in those sources, product names are often written in lower case,
which lead to an incorrect PoS annotation. After reprocessing the corpus using
gazetteers, including proper names in lower case, we found that this is a problem
with TreeTagger precision. Such problem makes entity recognition less accurate,
when such entity recognition requires a previous step of detecting proper nouns
using PoS tagging. Although the use of gazetteers improves entity detection, this
solution is domain-dependent.
In addition, foreign words are less used in news than in other sources, because
the style rules of traditional media require avoiding such foreign words, as far as
possible, whenever a Spanish word exists.
Finally, the relative big distribution of letters of the alphabet category is due
to a TreeTagger accuracy error (overall when analysing short texts published in
Twitter).
6.2.2 Distribution of Adjectives
As shown in Table 6.1, the distribution of adjectives of quantity is near 50% for
most of the sources (adding quantity ordinal, quantity cardinal, and other). The
113
adjectives of quantity commonly used are the cardinals and the less used are the
ordinals, whose use is insignificant in all sources, except in news publishing sites.
The rest of quantifying adjectives (quantity others) are used quite frequently
in forums and reviews, because such sites include publications of quantitative
evaluations and comparisons of products. Specifically, in these sites, we find
multiplicative (e.g. doble, triple), partitive (e.g. medio, tercio), and indefinite
quantity adjectives (e.g. mucho, poco, bastante).
6.2.3 Distribution of Adverbs
The adverbs of negation (e.g. jamas, nada, no, nunca, tampoco) are used with
more frequency in the sources with limitations of posts length. Moreover, there
is an inverse correlation between the size of the texts and the use of adverbs of
negation. The detection of such negations is essential when performing sentiment
analysis, since they reverse the sentiment of the opinion about specific entities.
6.2.4 Distribution of Determiners
Determiners are used to a lesser extent in microblogs than in the other media
types (overall un news and blogs), because the limitation of post length (e.g.
140 characters in Twitter) requires that posts are written more concisely, and
therefore meaningless grammatical categories tend to be used less.
6.2.5 Distribution of Conjunctions
With respect to conjunctions, the distribution of coordinating conjunctions is
higher in sources where the texts are longer (i.e. news and blogs), and lower in
sources were posts are shorter, especially in forums and reviews because these
sources have a question-answer structure dominated by short sentences. Coordi-
nating conjunctions are useful for opinion mining to identify opinion chunks, as
well as punctuation marks.
114

6.2.6 Distribution of Pronouns
The distribution of personal pronouns (e.g. yo, tu, mı) is higher in microblogs, re-
views, forums and audio-visual content publishing sites because, in these sources,
conversations between the users that generate the content are predominant, in
contrast to the narrative style of news and blogs articles.
Generally, pronouns make it difficult to identify entities within opinions, be-
cause such entities are not explicitly mentioned when using pronouns.
6.2.7 Distribution of Prepositions
As happened with determiners, prepositions are used to a lesser extent in mi-
croblogs than in the other media types, because of the use of a concise language.
6.2.8 Distribution of Punctuation Marks
Full stops are less used in news than in other sources, because longer sentences
are published in news articles which require other kinds of punctuation marks
(e.g. comma), in comparison to the rest of social media sources, where concise
phrases finished are usually written, which implies a bigger density of full stops.
The use of comma is lower in sources where there is less writing, that is, on
Twitter and sites with comments on audio-visual content.
The heavy use of the colon and slash in microblogs is due to the inclusion of
these characters in the emoticons and the sources cited through links embedded
in tweets.
Ellipses are more used in microblogs than in the rest of the sources, because
of the limitation of the size of the messages. In this source, unfinished messages
are posted frequently, so ellipses are added to express that such messages are
incomplete. Furthermore, some Twitter clients truncate messages longer than
140 characters, and automatically add the ellipsis.
Finally, parenthesis and other non-commonly used punctuation marks (e.g.
percent sign) are less used in microblogs, because of the limited length of the
tweets and the difficulty for introducing these characters on mobile terminals.
115

6.2.9 Distribution of Verbs
With respect to verbs, in forums and microblogs its use is more extensive, in
proportion to the rest of the PoS categories, than in the other social media sources.
A reason for this may be that intentions and actions are expressed more often in
these sources.
In addition, there is less use of the past participle within microblogs than in
other sources. This is because microblogs are used to transmit immediate expe-
riences, so most of the posts are communicated in the present tense. Similarly,
the infinitive is more used in microblogs for lexical verbs.
Finally, lexical finite verbs are used similarly in all the social media channels.
6.3 Hypothesis Validation
We have demonstrated that the distribution of PoS categories varies across dif-
ferent social media types, which validates Hypothesis 1. Since PoS tagging is a
previous step for many NLP techniques, the performance of such techniques may
vary according to the social media source from which the user-generated content
has been extracted.
As an example, a disambiguation strategy for topic identification may use
nouns as context for performing disambiguation. Thus, sources with a higher
distribution of nouns will provide more context than sources in which such dis-
tribution is smaller. The proportion of other categories may have impact over
the performance of other techniques (e.g. adjectives and adverbs over sentiment
analysis).
116

Chapter 7
TECHNIQUE FOR UNIQUE
USER IDENTIFICATION
BASED ON EVOLVING
DEVICE FINGERPRINT
DETECTION
As we have explained in Section 2.2.2.2, any technique for identifying users based
on browser fingerprint must be accompanied with an algorithm to detect differ-
ent fingerprints corresponding to a single browser, because browser fingerprint
changes very often [Eckersley, 2010].
This chapter describes a novel technique that takes into account the temporal
evolution of fingerprints, as well as the entropy of fingerprint attributes for weight-
ing the importance of each fingerprint attribute according to its discriminative
power.
This technique consists in the instantiation of a set of activities defined by
the CRISP-DM methodology [Shearer, 2000]. Such activities are the following:
1. The Data Understanding activity collects the fingerprint data and analyses
them from different perspectives, ensuring that they are valid for model
learning purposes. This activity is explained in Section 7.1.
117

2. The Data Preparation activity covers all the tasks required to construct the
dataset used for learning and evaluating the technique, including ensuring
that users are uniquely identified and removing non-human activity from
it. This activity is explained in Section 7.2.
3. The Modelling activity consists in selecting the modelling technique and in
learning the specific models that will be used for identifying unique users.
This activity is explained in Section 7.3.
4. The Evaluation activity consists in evaluating the models obtained. This
activity is explained in Section 7.4.
Next, each of the activities are described. After that, in Section 7.5 we vali-
date the hypothesis formulated in Section 3.4 regarding unique user identification
through device’s fingerprint.
7.1 Data Understanding Activity
This activity consists in the ordered execution of the following tasks:
1. The Collect Initial Data task consists in obtaining the activity produced in
websites. This task is described in Section 7.1.1.
2. The Describe Data task consists in performing a description of the format
and volume of the data gathered. This task is described in Section 7.1.2.
3. The Explore Data task consists in performing a deeper statistical analysis of
data from several viewpoints to ensure that the data are valid for modelling
purposes. This task is described in Section 7.1.3.
4. The Verify Data Quality task consists in examining the quality of the data
by attending to the analyses performed in the previous tasks. This task is
described in Section 7.1.4.
118

7.1.1 Collect Initial Data Task
This task consists in collecting the activity produced by users in websites as well
as in collecting their fingerprints. Such fingerprints are made of a set of values
for several HTTP headers [Fielding and Reschke, 2014b] and other attributes
accessible by executing JavaScript [ECMA, 2011], Java or Flash code within the
browser.
This task gathers the same HTTP headers as Eckersley [2010] (User-Agent,
User-Agent, Accept, Accept-Language, Accept-Encoding, and Accept-Charset). Such
headers have been described in Section 2.2.2.2. In addition, this task collects the
values for the additional HTTP headers described next.
X-Real-IP header. This non-standard header identifies the IP address [Postel,
1981] of the user’s device. The Nginx reverse proxy [Reese, 2008], which is
used in our implementation, adds this header. This reverse proxy receives
every message sent from the web browser, and redirects it to the tracking
server, which processes and persists the activity record.
X-Forwarded-For header. This header is a multivalued attribute that includes
the IP address of the web browser machine, as well as the IP addresses of
the successive proxy servers that have routed the HTTP message [Reese,
2008]. The Nginx proxy also adds this header.
Cache-Control header. This header is used to specify directives that must be
obeyed by all caching mechanisms along the HTTP request/response chain.
Unlike the approach followed by Eckersley [2010], our work does not make
use of the Cookies Enabled attribute. The rest of the attributes (Plugins, Fonts,
Video, Time Zone, Session Storage, Local Storage, and IE Persistence) have been
collected by using a technique implemented by Eckersley [2010], which consists
on the execution of a combination of JavaScript, Java and Flash code.
To obtain the Plugins attribute it is necessary to distinguish the user browsers,
since this conditions the way in which this information is accessed.
119

• In the case of the Mozilla Firefox65, Google Chrome66, Apple Safari67, and
Opera68 browsers, this attribute is obtained through the DOM (Document
Object Model) by accessing to the navigator.plugins element. Such element
contains an array of objects and each object contains the name, the descrip-
tion, and the version of a plugin. Listing 7.1 shows the JavaScript code for
obtaining the Plugins attribute for these browsers.
• In the case of Internet Explorer a different technique is applied because
most versions of this browser do not include plugin information in its DOM.
Such technique relies on the PluginDetect JavaScript library69 that receives
a lost of the plugins for being detected and returns the information related
to these plugins. Specifically, we have obtained information for the follow-
ing plugins: Java, QuickTime70, DevalVR71, Shockwave72, Flash, Windows
Media Player73, Silverlight74, and Acrobat75.
The Fonts attribute is obtained through a Flash component. Therefore it
cannot be obtained if Flash is not installed in user’s device. To extract the
fonts information from the Flash component we make use of the jQuery Flash
library76, which allows querying Flash objects from JavaScript. Listing 7.2 shows
the JavaScript code for obtaining the Fonts attribute.
To extract video information we access the screen object included in the
browsers’ DOM. Specifically, we obtain the values for the following attributes:
• The attribute height, which contains the number of vertical pixels in the
device’s screen.
65http://www.mozilla.org/firefox66http://www.google.es/chrome/browser67http://www.apple.com/safari68http://www.opera.com69http://www.pinlady.net/PluginDetect70http://www.apple.com/quicktime71http://www.devalvr.com72http://www.adobe.com/shockwave73http://windows.microsoft.com/en-us/windows/windows-media-player74http://www.microsoft.com/silverlight75http://www.adobe.com/products/acrobat.html76http://jquery.lukelutman.com/plugins/flash
120

1 var plugins = navigator.plugins;2 var plist = new Array();3
4 for (var i = 0; i < plugins.length; i++) {5 plist [ i ] = plugins[i ]. name + ”; ”;6 plist [ i ] += plugins[i ]. description + ”; ”;7 plist [ i ] += plugins[i ].filename + ”;”;8
9 for (var n = 0; n < plugins[i ]. length; n++)10 plist [ i ] += ” (” + plugins[i][n ]. description + ”; ” +11 plugins[ i ][ n ]. type + ”; ” + plugins[i ][ n ]. suffixes + ”)”;12
13 plist [ i ] += ”. ”;14 }15
16 plist . sort () ;
Listing 7.1: Script for obtaining the Plugins attribute
1 var fonts = ””;2 var obj = document.getElementById(”flashfontshelper”);3
4 if (obj && typeof(obj.GetVariable) != ”undefined”) {5 fonts = obj.GetVariable(”/:user fonts”);6 fonts = fonts.replace(/,/g,”, ”);7 fonts += ” (via Flash)”;8 }9
10 if (fonts == ””)11 fonts = ”No Flash fonts detected”;
Listing 7.2: Script for obtaining the Fonts attribute
• The attribute width, which contains the number of horizontal pixels in the
device’s screen.
• The attribute colorDepth, which contains information about the number of
colours supported by user’s device.
Listing 7.3 shows the JavaScript code for obtaining the Video attribute.
121

1 video = screen.width + ”x” + screen.height + ”x” + screen.colorDepth;
Listing 7.3: Script for obtaining the Video attribute
1 timezone = (new Date()).getTimezoneOffset();
Listing 7.4: Script for obtaining the Time Zone attribute
1 sessionStorage . fingerprint = ”yes”;2 sessionStorageCapability = (sessionStorage. fingerprint == ”yes”)
Listing 7.5: Script for obtaining the Session Storage attribute
The Time Zone attribute is obtained, as in previous cases, by using JavaScript
code. To do so, an instance of the object Date is created and the property
timezoneOffset is queried. Such property returns the offset in minutes of the
local time zone with respect to UTC (Coordinated Universal Time). Listing 7.4
shows the JavaScript code for obtaining the Time Zone attribute.
The technique for obtaining the Session Storage and Data Storage attributes
consists in finding out whether the browser allows storing session or local data.
To do so, the objects sessionStorage and localStorage are used. Listings 7.5 and
7.6 show the JavaScript code for obtaining these attributes. The process followed
by both scripts is the following:
1. Firstly, we try to store a value in the object sessionStorage (or localStorage)
for the fingerprint keyword (line 1).
2. Next, we query the value for the fingerprint keyword stored in the object
sessionStorage (or localStorage) (line 2).
(a) If the value obtained is equal to the assigned in step 1, then the browser
is able to store session (or local) data.
(b) Otherwise, the browser is not able to do so.
The technique for obtaining the IE Persistence attribute consists in finding
whether the browser lets modifying XML DOM elements. Listing 7.7 shows the
122

1 localStorage . fingerprint = ”yes”;2 localStorageCapability = (localStorage. fingerprint == ”yes”)
Listing 7.6: Script for obtaining the Local Storage attribute
1 oDiv.setAttribute(” fingerprint ”, ”yes”);2 oDiv.save(”oXMLStore”);3 ieStorageCapability = (oDiv.getAttribute(”fingerprint”)) == ”yes”)
Listing 7.7: Script for obtaining the IE Persistence attribute
JavaScript code for obtaining this attributes. The process followed by this script
is the following:
1. Firstly, we try to store a value in a div object for an attribute called fin-
gerprint (line 1).
2. Next, the div object is stored within the browser’s cache (line 2).
3. After that, we query the value for the fingerprint keyword stored in the
browser’s cache (line 3).
(a) If the value obtained is equal to the assigned in Step 1, then the browser
is able to store data within Internet Explorer cache.
(b) Otherwise, the browser is not able to do so.
In the experiment conducted in this thesis, we have collected the data used
for the experiment by using a web tracking server based on cookies, generating
records containing fingerprint attributes and a user identifier. These records have
been obtained using the JavaScript tags technique for capturing web activity
explained in Section 2.2.1.3, combined with the technique based on cookies for
identifying users explained in Section 2.2.2.1.
7.1.2 Describe Data Task
Regarding data format, the dataset used has the structure shown in Figure 7.1,
which reflects the ontology elements of the Social Graph Ontology that the tech-
123

cd Unique User Identification Data Format
sgo:hasCookie
sgo:xRealIPsgo:xForwardedForsgo:userAgentsgo:acceptsgo:acceptLanguagesgo:acceptCharsetsgo:acceptEncogingsgo:cacheControlsgo:pluginssgo:fontssgo:videosgo:timeZonesgo:sessionStoragesgo:localStoragesgo:iePersistence
sgo:Fingerprint
sgo:hasFingerprint
1
*
foaf:Agent
dcterms:created
sgo:Activity
sgo:hasActivity
0..1 * dcterms:created
sgo:Cookie
* 0..1
Figure 7.1: Format of the data used by the technique for unique user identificationbased on evolving device fingerprint detection
nique reads or writes, hiding those properties not required by the technique. The
data format consists in a set of activity records captured by the tracking server.
Each activity record corresponds to a single user and is related with a fingerprint
and a cookie that uniquely identifies a given user. The classes and properties
included in the diagram have been already described in Section 5.6.
With respect to data quantity, the data used in the experiment conducted in
this thesis consists in a set of 18,391 records extracted from a website, between
September 28 and October 19, 2011.
7.1.3 Explore Data Task
This task characterises the data from different viewpoints to ensure that the
dataset is rich enough for model training. Specifically the objective of this task
is to describe the distribution of the data with respect to unique visitors, web
browsers used and countries of origin of the activity collected, and to study the
characteristics of the fingerprint attributes from an Information Theory [Shannon
and Warren, 1949] perspective.
Next, we characterise the data used in our experiment according to the pre-
vious guidelines.
During the period of the study, 10,834 unique visitors visited the website from
124

www.pocketinvaders.comVisitors Overview
28 Sep 2011 - 19 Oct 2011
0
500
1,000
0
500
1,000
3 Oct 10 Oct 17 Oct
Visitors
10,501 people visited this site
11,932 Visits
10,501 Absolute Unique Visitors
18,425 Pageviews
1.54 Average Pageviews
00:01:00 Time on Site
78.58% Bounce Rate
83.74% New Visits
Technical Profile
Browser Visits % visits
Figure 7.2: Daily distribution of visitors during the period of studywww.pocketinvaders.comTraffic Sources Overview
28 Sep 2011 - 19 Oct 2011
0
500
1,000
0
500
1,000
3 Oct 10 Oct 17 Oct
Visits
All traffic sources sent a total of 11,932 visits
8.40% Direct Traffic
15.61% Referring Sites
75.96% Search Engines
Search Engines
Referring Sites
Direct Traffic
Other
Top Traffic Sources
Sources Visits % visits Keywords Visits % visits
Figure 7.3: Daily distribution of visits during the period of studywww.pocketinvaders.comContent Overview
28 Sep 2011 - 19 Oct 2011
0
1,000
2,000
0
1,000
2,000
3 Oct 10 Oct 17 Oct
Pageviews
Pages on this site were viewed a total of 18,425 times
18,425 Pageviews
15,400 Unique Views
78.59% Bounce Rate
Top Content
Pages Pageviews % Pageviews
Figure 7.4: Daily distribution of page views during the period of study
which we have extracted the data, distributed daily as shown in Figure 7.2. Such
visitors may include humans and web crawlers. These users made a total of 11,932
site visits distributed daily as shown in Figure 7.3. The visitors registered a total
of 18,391 web page views distributed daily as shown in Figure 7.4. Each web
page view generates a record within the fingerprint log used.
On average, each visitor viewed 1.7 pages, remaining about one minute average
time on the website. The bounce rate (i.e. percentage of visitors leaving the site
after viewing a single web page) was 79%, while the percentage of new visitors
was 84%, so there is a percentage of about 16% of users who visited the website
before beginning the study. The minimum number of web pages viewed by a single
visitor was 1, while the maximum was 389. Figure 7.5 shows the distribution of
web pages viewed by single user. Table 7.1 shows the summary statistics relating
to the distribution of the number of records captured by a single user. It includes
125

Figure 7.5: Distribution of the activity records captured by unique user
Statistic ValueCount 10,834Mean 1.7Standard Deviation 5.34Coefficient of Variation 314.5%Minimum 1Maximum 389Range 388Systematic Error 1,921.62Kurtosis 60,503.1
Table 7.1: Statistics associated to the number of records gathered per unique user
measures of tendency, variability and shape.
With respect to web browsers, there is a representation of the most used
browsers in the sample (39% of the activity was generated by Google Chrome,
30% by Mozilla Firefox, 18% by Internet Explorer, 6% by Android77, 3% by Apple
Safari, and 4% by other non-catalogued browsers). This distribution affects the
diversity of values for different attributes, such as the User-Agent header, or the
plugins installed.
The sample used in our experiment contains activity generated in 63 different
countries, as reflected in Figure 7.6.
77http://www.android.com
126

www.pocketinvaders.comMap Overlay
28 Sep 2011 - 19 Oct 2011
Visits
1 5,277
11,932 visits came from 63 countries/territories
Visits11,932
100.00%
Pages/Visit1.54
1.54
Avg. Time on Site00:01:00
00:01:00
% New Visits83.80%
83.74%
Bounce Rate78.58%
78.58%
Visits
5,277
2,173
904
874
578
360
325
173
151
130
Figure 7.6: Distribution of visits per country
Table 7.2 shows the activity generated by the users of the 10 countries with
more visits to the site from which data has been extracted. The table shows the
number of visits per visitor, the average page views per visit, the average time
spent on the website per visitor, the percentage of new pages viewed per visitor,
and the bounce rate.
The distribution of countries affects different fingerprint attributes, such as
the time zone and the Accept-Language header.
Table 7.3 shows the entropy [Shannon, 1948] of each fingerprint attribute.
The first column shows the variable name assigned to the attribute. The second
column shows the attribute itself. The third column indicates the entropy of
the attribute in our dataset. The fourth column shows the entropy obtained by
Eckersley [2010] for the same attributes. The entropy associated with headers
X-Real-IP, X-Forwarded-For and Cache-Control was not studied by Eckersley
[2010], while the attribute that indicates whether the browser supports cookies has
not been used in our work. On the other hand, the entropy associated with Accept
HTTP headers was studied jointly by Eckersley [2010], whereas in our work it has
127

Country Visits Pages Time Spent New Visits Bounce RateSpain 5277 1.73 1′20′′ 75.67% 75, 52%Mexico 2173 1.34 41′′ 90.43% 84, 49%Argentina 904 1.41 39′′ 87.94% 79, 98%Chile 874 1.49 53′′ 92.11% 79, 41%Colombia 578 1.40 45′′ 89.79% 80, 28%Venezuela 360 1.66 59′′ 90.28% 70, 28%Peru 325 1.37 48′′ 90.46% 80, 62%Unknown 173 1.51 1′47′′ 91.91% 82, 08%USA 151 1.42 45′′ 93.38% 78, 15%Ecuador 130 1.38 32′′ 93.08% 81, 54%
Table 7.2: Distribution of visits for the 10 countries that generated more siteactivity
X Attribute H(X) H(X) [Eckersley, 2010]X1 X-Real-IP 12,5061 –X2 X-Forwarded-For 12,52 –X3 User-Agent 7,51458 10X4 Accept 2,05302
6,09X5 Accept-Language 3,68173X6 Accept-Charset 1,89086X7 Accept-Encoding 1,81318X8 Cache-Control 0,299063 –X9 Plugins 11,7677 15,4X10 Fonts 8,38331 13,9X11 Video 5,50273 4,83X12 Time zone 2,30895 3,04X13 Session storage 0,299995
2,12X14 Local storage 0,297941X15 IE persistence 0,560692−− Cookies enabled – 0,353
Table 7.3: Entropy of fingerprint attributes
been studied separately; the same happens with browser storage capabilities. The
quantitative differences between the entropy values of obtained in our work and
those obtained by Eckersley [2010] are due the size of the datasets; the longer
dataset of Eckersley [2010] contains data from 470,161 browsers, whereas our
dataset contains 10,834.
128

Table 7.4 shows the cross-entropy values when pairs of fingerprint attributes
are combined. The pairs of fingerprint attributes with more discriminative power
are the X-Real-IP header combined with the plugins or the font, and the X-
Forwarded-For header combined with the plugins, the fonts, or the Accept header.
The cross-entropy values of X-Real-IP and X-Forwarded-For are quite similar
because the value of the former is always included within the value of the latter,
and most of fingerprint records do not correspond to a proxy route.
X-R
eal-IP
X-Forw
arded
-For
User-Agent
Accep
t
Accep
t-Language
Accep
t-Charset
Accep
t-Encoding
Cache-Control
Plugins
Fonts
Video
Tim
ezone
Sessionstorage
Localstorage
IEpersisten
ce
H(X,Y ) X1 X2 X3 X4 X5 X6 X7 X8 X9 X10 X11 X12 X13 X14 X15
X1 –X2 12,5 –X3 12,6 12,6 –X4 12,6 12,7 7,8 –X5 12,6 12,6 8,3 4,2 –X6 12,6 12,6 7,5 2,6 3,8 –X7 12,6 12,6 7,6 3 4,2 2,4 –X8 12,5 12,5 7,7 2,3 3,9 2,2 2,1 –X9 12,7 12,7 12,3 12 12 11,8 11,9 11,8 –X10 12,7 12,7 11,1 9,3 9,8 9,2 9,2 8,5 12 –X11 12,6 12,6 9,7 6,3 7,6 6,3 6,4 5,7 12,3 10,7 –X12 12,5 12,5 9 4,2 5,4 4,1 4,1 2,6 12 9,4 7,4 –X13 12,5 12,5 7,5 2,3 3,8 2,1 2 0,6 11,8 8,5 5,7 2,6 –X14 12,5 12,5 7,5 2,3 3,8 2,1 2 0,6 11,8 8,5 5,7 2,6 0,3 –X15 12,5 12,5 7,5 2,9 3,9 2,2 2,2 0,9 11,8 8,5 5,9 2,9 0,8 0,8 –
Table 7.4: Cross-entropy between pairs of fingerprint attributes
129

X-R
eal-IP
X-Forw
arded
-For
User-Agent
Accep
t
Accep
t-Language
Accep
t-Charset
Accep
t-Encoding
Cache-Control
Plugins
Fonts
Video
Tim
ezone
Sessionstorage
Localstorage
IEpersisten
ce
H(X|Y ) X1 X2 X3 X4 X5 X6 X7 X8 X9 X10 X11 X12 X13 X14 X15
X1 – 0 5,13 10,59 8,88 10,66 10,74 12,22 0,91 4,3 7,13 10,21 12,21 12,21 11,95X2 0,01 – 5,13 10,60 8,89 10,67 10,75 12,23 0,91 4,3 7,14 10,22 12,23 12,23 11,97X3 0,13 0,13 – 5,73 4,65 5,65 5,83 7,36 0,58 2,71 4,24 6,68 7,22 7,22 6,96X4 0,13 0,13 0,26 – 0,57 0,74 1,18 2,04 0,23 0,91 0,79 1,94 1,98 1,98 1,93X5 0,05 0,05 0,82 2,2 – 1,92 2,36 3,64 0,24 1,44 2,08 3,13 3,54 3,54 3,31X6 0,05 0,04 0,03 0,57 0,13 – 0,63 1,88 0,08 0,82 0,83 1,81 1,82 1,81 1,59X7 0,05 0,04 0,13 0,94 0,49 0,55 – 1,78 0,12 0,79 0,94 1,75 1,75 1,75 1,67X8 0,01 0,01 0,15 0,28 0,26 0,28 0,27 – 0,04 0,13 0,24 0,28 0,3 0,3 0,3X9 0,17 0,16 4,83 9,94 8,33 9,96 10,07 11,51 – 3,6 6,79 9,73 11,52 11,52 11,21X10 0,17 0,17 3,58 7,24 6,14 7,31 7,36 8,21 0,22 – 5,16 7,09 8,23 8,23 7,95X11 0,13 0,12 2,23 4,24 3,9 4,44 4,63 5,44 0,53 2,28 – 5,12 5,36 5,36 5,33X12 0,01 0,01 1,47 2,19 1,76 2,23 2,24 2,29 0,27 1,02 1,92 – 2,28 2,28 2,3X13 0,01 0,01 0,01 0,23 0,16 0,22 0,23 0,3 0,05 0,15 0,16 0,27 – 0,01 0,28X14 0,01 0,01 0,01 0,22 0,15 0,22 0,23 0,29 0,05 0,14 0,16 0,27 0,01 – 0,28X15 0,01 0,01 0,01 0,44 0,19 0,26 0,41 0,56 0,01 0,13 0,39 0,55 0,54 0,54 –
Table 7.5: Conditional entropy between pairs of fingerprint attributes
Finally, Table 7.5 shows the entropy of every fingerprint attribute when the
value of another attribute is known (i.e. conditional entropy). The columns
in the table correspond to the attribute Y known, while the rows indicate the
attribute X whose entropy we want to know, given a known value of Y . As it can
be seen in the table, there is not uncertainty for the attribute X-Real-IP when
the header X-Forwarded-For is known. This is because the value of the former is
always included in the value of the latter. In addition, many fingerprint attributes
provide a few information over others (e.g. there is not much uncertainty for the
time zone attribute when the value of the header X-Forwarder-For is known).
7.1.4 Verify Data Quality Task
The study of the dataset used in our experiment shows that the data is assorted
enough to perform model training, from the point of view of records per unique
user (from 1 to 389), web browsers and countries of origin. In addition, as shown
with the study of the entropy, any variable is not enough by itself for determining
unique users, neither any combination of variables. Therefore, the dataset will be
useful for stressing the model in order to demonstrate its classification power.
130

7.2 Data Preparation Activity
This activity consists in the ordered execution of the following tasks:
1. The Select Data task consists in deciding the data to be used for the anal-
ysis, removing from the dataset the fingerprint records that may conduct
to deficiencies in the model resulting from the learning phase. This task is
described in Section 7.2.1.
2. The Clean Data task consists in cleansing the dataset in order to ensure
that it contains activity records corresponding to human agents uniquely
identified. This task is described in Section 7.2.2.
3. The Construct Data task consists in performing data transformations to the
values of some of the fingerprint attributes gathered. This task is described
in Section 7.2.3.
7.2.1 Select Data Task
As the goal of this technique is to uniquely identify users from web activity
records, the records used for model learning must contain the activity of users
uniquely identified, i.e. the dataset must not contain activity records assigned to
multiple identifiers that correspond to the same user.
Additionally, the dataset must not contain non-human activity (i.e. records
generated by robots).
Therefore, the activity corresponding to users with multiple identifiers and
the activity generated by non-human agents must be removed. This is performed
in the task described next.
7.2.2 Clean Data Task
This task cleans the dataset in order to satisfy the selection criteria identified in
the previous section.
As the users in the dataset used in the experiment conducted in this thesis
have been collected using the technique based on cookies, users may have been
identified more than once, due to the problems identified in Section 2.2.2.1. To
131

Search Engine User-AgentGoogle Mozilla/5.0 (compatible; Googlebot/2.1; + http://www.google.com/bot.html)Bing Mozilla/5.0 (compatible; bingbot/2.0; +http://www.bing.com/bingbot.htm)Yahoo! Mozilla/5.0 (compatible; Yahoo! Slurp; http://help.yahoo.com/help/us/ysearch/slurp)
Table 7.6: User-Agent values for Google, Bing, and Yahoo! robots
deal with this issue we have only taken into account the users identified before the
data-gathering period by removing the activity records of those users that were
firstly identified after the initial gathering date. For doing so, all the activity
records that are related to a cookie that has been created after the initial date
have been removed. This data cleansing action allows to evaluate the performance
of the technique with respect to a gold standard based on cookies that do not
include multiple identifiers for single users.
Finally, since the technique is focused on users, this task filters the activity
generated by web crawlers. To do this, it discards the activity records with a
User-Agent header whose value is recognised as a robot. For example, 7.6 show
the values corresponding to Google, Bing, and Yahoo! robots.
Since not all robots are identified through the User-Agent header, this tech-
nique implements an additional mechanism that consists in filtering the activity
produced by agents that perform more than 3 requests every 0.5 seconds. To de-
termine that two records are from the same agent, such records must be identical.
In the experiment conducted in this thesis, by using this method, we have
filtered 73 records produced by crawlers.
7.2.3 Construct Data Task
For each fingerprint record, this task stores the attribute values within a database,
according to the format explained in Section 7.1.2. We apply a compression
function to the values of the Plugins and Fonts attributes, so they can be included
within the parameters of the HTTP GET requests [Fielding and Reschke, 2014b]
that are sent from the browser to the tracking server, as the data obtained from
such attributes can be extensive. The compression function used by this technique
is the cryptographic hash function SHA-1 [Eastlake and Jones, 2001]. Similar one-
way functions could be applied to other attributes for avoiding persisting personal
data (e.g. IP addresses, time zones, etc.), thus warranting users’ privacy.
132

7.3 Modelling Activity
This activity consists in the ordered execution of the following tasks:
1. The Select Modelling Technique task consists in selecting and describing
a modelling technique for begin applied for unique user identification pur-
poses. This task is described in Section 7.3.1.
2. The Generate Test Design task consists in defining the approach followed
for evaluating the technique. This task is described in Section 7.3.2.
3. The Build Model task consists in learning the model used for identifying
unique users. This task is described in Section 7.3.3.
Next, each of these tasks are described.
7.3.1 Select Modelling Technique Task
This section describes the classification approach (i.e. the modelling technique)
used for unique user identification.
We have adapted the early binding algorithm introduced in Section 2.3.1.
The input of this algorithm is a sequence of fingerprints R ordered by timestamp
ascending. The output of the algorithm is a set of clusters C, in which each
cluster C ∈ C, includes fingerprints in R identified as belonging to the same
browser. Listing 7.8 formalises the algorithm proposed. The steps executed in
the algorithm are explained next.
1. Firstly, we initialise the set of clusters C at the empty set (line 3).
2. Next, for each fingerprint ri we calculate the maximum similarity between
such fingerprint and each cluster Cj generated so far (line 5). Similarity
computation between clusters and fingerprint is explained in Section 7.3.1.2.
(a) If the maximum similarity is greater or equal than a threshold θ, then
there exists a cluster C to which we can add the fingerprint ri that is
been processed, so we execute the following steps (lines 6-8):
i. Obtain the cluster that is more similar to the fingerprint (line 6).
133

ii. Add the fingerprint to such cluster (line 7).
iii. Update cluster signature (line 8). Such signature is used to com-
pare candidate fingerprints with the cluster. Section 7.3.1.1 de-
scribes the steps that must be followed for updating the signature.
(b) If the maximum similarity is less than the threshold θ, then there does
not exist a cluster C to which we can add the fingerprint, so we execute
the following steps (lines 10-12):
i. Create a new cluster C and add the fingerprint ri to it (line 10).
ii. Add the cluster C to the set of clusters C (line 11).
iii. Generate a new signature for cluster C (line 12). Section 7.3.1.1
describes the steps that must be followed for creating the signa-
ture.
3. Finally, the set of clusters C is returned (line 15).
1 function ClusterF ingerprints(R)2 begin3 C ⇐ ∅4 for each ri ∈ R do5 if maxCj∈C sim(ri, Cj) ≥ θ then6 C ⇐ argmaxCj∈C sim(ri, Cj)7 C ⇐ C ∪ {ri}8 UpdateSignature(ri, C)9 else
10 C ⇐ {ri}11 C ⇐ C ∪ {C}12 CreateSignature(ri, C)13 end if14 end for15 return C
16 end
Listing 7.8: Algorithm for clustering fingerprints of the same browser
134

7.3.1.1 Cluster Signature
The signature of a cluster allows obtaining similarities between the clusters and
candidate fingerprints for being included in such clusters. Such signature is a
tuple (V, Te, Tl), in which:
• V = (C.X1, ..., C.Xi, ..., C.X15) is a sequence, in which each component
corresponds with the value observed for the attribute Xi ∈ X in the last
fingerprint added to the cluster C, where X is the set of attributes.
• Te = (te(C.X1), ..., te(C.Xi), ..., te(C.X15)) is a sequence, in which each com-
ponent corresponds with the timestamp of the first observation of the value
C.Xi for the attribute Xi within a fingerprint added to the cluster C.
• Tl = (tl(C.X1), ..., tl(C.Xi), ..., tl(C.X15)) is a sequence, in which each com-
ponent corresponds with the timestamp of the last observation of the value
C.Xi for the attribute Xi within a fingerprint added to the cluster C.
Next, the operations for creating and updating clusters signatures are de-
scribed.
Signature creation. Listing 7.9 details the operation for creating a cluster sig-
nature. The inputs of this operation are the fingerprint r and the cluster C,
whose signature will be created from r. When this operation is executed,
the cluster C contains only the fingerprint r. Thus the first time that the
value of an attribute Xi is observed for the cluster C (i.e. te(C.Xi)) cor-
responds to the timestamp of fingerprint creation r.t, as happens with the
last time that the value of an attribute Xi is observed for the cluster C (i.e.
tl(C.Xi)).
Signature updating. Listing 7.10 details the operation for updating a cluster
signature. The inputs of this operation are the fingerprint r and the cluster
C, whose signature we want to update from r. In this operation, for each
fingerprint attribute Xi we execute the following steps (lines 4-13):
1. Compute the similarity between fingerprint attribute value r.Xi and
cluster attribute value C.Xi. The similarity computation between at-
tributes is defined in Section 7.3.1.2.
135

1 procedure CreateSignature(r, C)2 begin3 for each Xi ∈ X do4 te(C.Xi) ⇐ r.t5 tl(C.Xi) ⇐ r.t6 C.Xi ⇐ r.Xi
7 end for8 end
Listing 7.9: Operation for creating a cluster signature
(a) If the similarity s is less than a threshold θl, we consider that the
value of the attribute has changed. Thus, we assign the times-
tamp of fingerprint creation r.t to te(C.Xi) (lines 5-6). We have
considered θl = 0.5 in our experiment.
(b) If the similarity s is greater than a threshold θh, we consider that
the value of the attribute has not changed. Thus, we maintain the
value of te(C.Xi) (lines 7-8). We have considered θh = 0.9 in our
experiment.
(c) If θl ≤ s ≤ θh, we consider that the attribute maintains its value
with probability s, so it changes its value with probability 1 −s. Thus we estimate the instant of time in which the attribute
changed its value by combining the timestamp of current attribute
value, with fingerprint creation timestamp as shown in line 10.
2. Assign the fingerprint creation timestamp r.t to tl(C.Xi) (line 12).
3. Assign attribute value Xi of fingerprint r (i.e. r.Xi) to the cluster
signature for the attribute Xi (i.e. C.Xi) (line 13).
136

1 procedure UpdateSignature(r, C)2 begin3 for each Xi ∈ X do4 s ⇐ sim(r.Xi, C.Xi)5 if s < θl then6 te(C.Xi) ⇐ r.t7 else if s > θh then8 (∗ The previous value of te(C.Xi) is maintained ∗)9 else
10 te(C.Xi) ⇐ s · te(C.Xi) + (1− s) · r.t11 end if12 tl(C.Xi) ⇐ r.t13 C.Xi ⇐ r.Xi
14 end for15 end
Listing 7.10: Operation for updating a cluster signature
7.3.1.2 Similarity Computation
The similarity between a fingerprint r and a cluster C is calculated as the weighted
average of the similarities between the values of each of the attributes in the
fingerprint and the values of the same attributes in the signature of the cluster
(see Equation 7.1). Section 7.3.1.3 explains the different alternatives for obtaining
the weights wX .
sim(r, C) =
∑X∈X sim(r.X,C.X) · wX∑
X∈XwX
(7.1)
With respect to similarity between fingerprint attribute values and cluster
signature attribute values, the similarity measure considered for the most part of
the attributes is the equality (see Equation 7.2).
sim(r.X,C.X) =
{1 r.X = C.X
0 r.X = C.X(7.2)
When the fingerprint attribute being compared is X2 (i.e. X-Forwarded-For
header), we apply the index proposed by Jaccard [1901] for measuring the similar-
137
ity between sets (see Equation 7.3), as suggested by Li et al. [2011] for multivalued
attributes.
sim(r.X2, C.X2) = Jaccard(r.X2, C.X2) =r.X2 ∩ C.X2
r.X2 ∪ C.X2
(7.3)
Finally, if the fingerprint attribute being compared is X3 (i.e. User-Agent
header), we apply a similarity calculated from the normalized Levenshtein [1966]
distance shown in Equation 7.4. Such distance is appropriate for the attribute
X3, because the value of the User-Agent header changes slightly over time, due
to browser or operating system version updates.
sim(r.X3, C.X3) = 1− Levenshtein(r.X3, C.X3)
maxv∈{r.X3,C.X3}
length(v)(7.4)
7.3.1.3 Attribute Weight Computation
The algorithm described above has been tested with four different variants. These
alternatives consists in using different weights to ponder similarity computation
between values of the fingerprint attributes and cluster signature attributes. Next,
the four variants are described.
Variant based on uniform weights. The first alternative is the most simple
and consists in assigning the same weight for all fingerprint attributes, as
shown by Equation 7.5.
wX = 1 (7.5)
Variant based on attribute entropy. The second variant consists in using
the entropy of the attribute as the attribute weight, as shown by Equa-
tion 7.6.
wX = H(X) (7.6)
Variant based on time decay. The third variant takes into account attribute
agreement and disagreement decays. Equation 7.7 shows how to calculate
138

attribute weight according to this variant for single-valued attributes (i.e.
all attributes with the exception of X-Forwarded-For header).
wX =
⎧⎪⎨⎪⎩
1− d=(X,Δtl) s > θh
1− d �=(X,Δte) s < θl
1− s · d=(X,Δtl)− (1− s) · d �=(X,Δte) θl < s < θh
(7.7)
As defined by Li et al. [2011], given a similarity s = sim(r.X,C.X) be-
tween two values of an attribute, with probability s, the two values are
the same and we shall use the complement of the agreement decay as at-
tribute weight. On the other hand, with probability 1 − s, the values are
different and we shall use the complement of the disagreement decay as at-
tribute weight. Thus attribute weight is computed by combining the com-
plements of agreement and disagreement decays. For high similarity values
(i.e. s > θh = 0.9), we only use the complement of agreement decay, while
for low similarity values (i.e. s > θl = 0.5), we only use the complement of
disagreement decay.
With respect to the time periods Δt used for computing disagreement decay,
we take into account the time lapsed between fingerprint capturing r.t and
the first time that the current attribute value was observed in the cluster,
as shown in Equation 7.8.
Δte = |r.t− te(C.X)| (7.8)
On the other hand, for computing agreement decay, we take into account
the time lapsed between r.t and the last time that the current attribute
value was observed in the cluster, as shown in Equation 7.9.
Δtl = |r.t− tl(C.X)| (7.9)
Finally, for the X-Forwarded-For header, we only take into account agree-
ment decay, as explained by Li et al. [2011], since such header is a multi-
139

valued attribute. Thus, in such case, we calculate he attribute weight as
shown in Equation 7.10.
wX2 = 1− d=(X2,Δtl) (7.10)
Variant based on attribute entropy and time decay. The last variant takes
into account both attribute evolution and entropy. Therefore, the attribute
weights are obtained by multiplying the weight obtained according to the
previous variant by attribute entropy, as shown in Equation 7.11 for single-
valued attributes.
wX =
⎧⎪⎨⎪⎩
H(X) · (1− d=(X,Δtl)) s > θh
H(X) · (1− d �=(X,Δte)) s < θl
H(X) · (1− s · d=(X,Δtl)− (1− s) · d �=(X,Δte)) θl < s < θh(7.11)
Finally, for the X-Forwarded-For header we calculate the attribute weight
as shown in Equation 7.12.
wX2 = H(X2) · (1− (d=(X2,Δtl))) (7.12)
7.3.2 Generate Test Design Task
The test designed consists in performing a 2-fold cross-validation with the gold
standard previously constructed. The gold standard consists in a corpus of ac-
tivity records with users identified by using the technique based on cookies.
We have ensured in the Clean Data task (see Section 7.2.2) that there is a
unique cookie that identifies every single user.
The evaluation results are discussed in Section 7.4.
7.3.3 Build Model Task
This task consists in learning the model used for unique user identification. It
consists in the following steps:
140

1. Obtain the entropy for each fingerprint attribute.
2. Obtain the evolution parameters (i.e. agreement decay and disagreement
decay) for each fingerprint attribute.
The result of applying Step 1 to the dataset has been shown in Table 7.3. The
results of Step 2 are described next.
We have implemented the algorithms described by Li et al. [2011] for learn-
ing agreement and disagreement decays. Once we have obtained the temporal
values of these probabilities for each attribute, we have performed simple regres-
sion analyses, obtaining explanatory models for the agreement and disagreement
decays.
Each model corresponds to a function dp(X,Δt), where
• p is the type of decay (d �=(X,Δt) for disagreement decay and d=(X,Δt) for
agreement decay),
• X is the fingerprint attribute, and
• Δt is a time increment, such that Δt ∈ [0,∞).
The time unit of measurement that we used in our experiment is the minute,
although we maintain a precision of five fractional digits for time units because
users activity timestamps are defined at the granularity of milliseconds.
In addition, each function dp(X,Δt) complies with the properties defined by
Li et al. [2011] for agreement and disagreement decays:
• Any value of dp(X,Δt) is defined within the interval [0, 1].
• dp(X,Δt) is a monotonically increasing function.
Tables 7.7 and 7.8 show agreement and disagreement decays respectively for
the fingerprint attributes.
The attributes with faster disagreement decays include the X-Real-IP and the
User-Agent headers. In the case of the X-Real-IP header, IP addresses [Postel,
1981] use to change with DCHP (Dynamic Host Configuration Protocol) [Droms,
1997] assignments, mostly in mobile environments. In addition, browser versions
141

Attribute Disagreement decay
X-Real-IP d �=(X1,Δt) =
⎧⎨⎩
0.0033855 + 0.00348067√Δt 0 < Δt < 1047.895444√
−0.23349 + 0.00721289√Δt 1047.895444 ≤ Δt < 29245.06883
1 Δt ≥ 29245.06883
X-Forwarded-For N/A when the attribute is multivalued [Li et al., 2011]
User-Agent d �=(X3,Δt) =
⎧⎨⎩
0 0 < Δt < 133.8336005−0.0047762 + 0.0000356876Δt 133.8336005 ≤ Δt < 28154.77084
1 Δt ≥ 28154.77084
Accept d �=(X4,Δt) =
{(0.279051 + 0.00387899
√Δt)2 Δt < 34543.93180
1 Δt ≥ 34543.93180
Accept-Language d �=(X5,Δt) =
{e−4.09968+3.23283·10−9Δt2 Δt < 35610.94887
1 Δt ≥ 35610.94887
Accept-Charset d �=(X6,Δt) =
{(0.0281337 + 4.35781 · 10−10Δt2)2 Δt < 47224.69002
1 Δt ≥ 47224.69002
Accept-Encoding d �=(X7,Δt) =
{e−4.67385+0.000115853Δt Δt < 40342.93458
1 Δt ≥ 40342.93458
Cache-Control d �=(X8,Δt) =
{e−4.41392+0.0222535
√Δt Δt < 39341.62217
1 Δt ≥ 39341.62217
Plugins d �=(X9,Δt) =
{(0.0835439 + 0.00570466
√Δt)2 Δt < 25808.56167
1 Δt ≥ 25808.56167
Fonts d �=(X10,Δt) =
⎧⎨⎩
(0.012879 + 0.0605308 lnΔt)2 0 < Δt < 1102.506998√−0.230069 + 0.00692895
√Δt 1102.506998 ≤ Δt < 31515.49207
1 Δt ≥ 31515.49207
Video d �=(X11,Δt) =
{(0.233452 + 0.00417302
√Δt)2 Δt < 33742.54047
1 Δt ≥ 33742.54047
Time zone d �=(X12,Δt) =
{(0.12658 + 0.000024006Δt)2 Δt < 36383.40415
1 Δt ≥ 36383.40415
Session storage d �=(X13,Δt) =
{e−5.91823+0.0303167
√Δt Δt < 38108.32197
1 Δt ≥ 38108.32197
Local storage d �=(X14,Δt) =
{e−6.04222+0.0306873
√Δt Δt < 38768.20650
1 Δt ≥ 38768.20650
IE persistence d �=(X15,Δt) =
{e−6.29214+0.0331916
√Δt Δt < 35936.88071
1 Δt ≥ 35936.88071
Table 7.7: Disagreement decay of fingerprint attributes
use to be updated frequently (Google Chrome updates itself automatically), what
changes the value of the User-Agent header. The attributes with slower disagree-
ment decays include the Accept* headers. These headers tend to be stable, since
they specify attributes such as the user language or the expected character en-
coding. The agreement decay of most of the fingerprint attributes present a total
linearity with fast agreement decays (the agreement decay is 1 before the 3rd
minute). The attributes X-Real-IP and X-Forwarded-For grow even faster than
the others, since the same IP address can be assigned unsing NAT (Network
Address Translator) [Egevang, 1994] to different machines at the same time.
142

Attribute Agreement decay
X-Real-IP d=(X1,Δt) =
{e−5.59227+0.550263 lnΔt Δt < 25923.46755
1 Δt ≥ 25923.46755
X-Forwarded-For d=(X2,Δt) =
{e−5.06924+0.498956 lnΔt Δt < 25840.37422
1 Δt ≥ 25840.37422
User-Agent d=(X3,Δt) =
{e−10.1715+0.993395 lnΔt Δt < 27976.76015
1 Δt ≥ 27976.76015
Accept d=(X4,Δt) =
{0.000033494 + 0.000033083Δt Δt < 30225.99238
1 Δt ≥ 30225.99238
Accept-Language d=(X5,Δt) =
{0.0000347399 + 0.0000330993Δt Δt < 30211.06972
1 Δt ≥ 30211.06972
Accept-Charset d=(X6,Δt) =
{0.0000339481 + 0.0000330917Δt Δt < 30218.03207
1 Δt ≥ 30218.03207
Accept-Encoding d=(X7,Δt) =
{0.0000333693 + 0.0000330786Δt Δt < 30230.01671
1 Δt ≥ 30230.01671
Cache-Control d=(X8,Δt) =
{−0.0112165 + 0.00005847Δt − 8.0021 · 10−10Δt2 Δt < 28104.69216
1 Δt ≥ 28104.69216
Plugins d=(X9,Δt) =
{e−10.1405+0.98999 lnΔt Δt < 28086.17546
1 Δt ≥ 28086.17546
Fonts d=(X10,Δt) =
{0.0000332742 + 0.0000330753Δt Δt < 30233.03570
1 Δt ≥ 30233.03570
Video d=(X11,Δt) =
{0.0000673283 + 0.0000331751Δt Δt < 30141.05976
1 Δt ≥ 30141.05976
Time zone d=(X12,Δt) =
{0.0000337212 + 0.0000337212Δt Δt < 30222.05737
1 Δt ≥ 30222.05737
Session storage d=(X13,Δt) =
{0.0000331289 + 0.0000330721Δt Δt < 30235.96539
1 Δt ≥ 30235.96539
Local storage d=(X14,Δt) =
{0.0000331289 + 0.0000330721Δt Δt < 30235.96539
1 Δt ≥ 30235.96539
IE persistence d=(X15,Δt) =
{0.0000331737 + 0.0000330731Δt Δt < 30235.04982
1 Δt ≥ 30235.04982
Table 7.8: Agreement decay of fingerprint attributes
Next, the agreement and disagreement decays are described for the fingerprint
attributes used in this work.
7.3.3.1 X-Real-IP Header
Figure 7.7 shows the values learned for the disagreement decay of the X-Real-
IP header in blue, while the regression model obtained is shown in green. The
regression function is not defined for the interval [0, 1047.89544) as for values in
this interval the radicand expression produces negative numbers. For such interval
the model shown in Figure 7.8 has been obtained by performing and additional
regression specifically for the interval [0, 1047.89544). Joining both models, the
disagreement decay the X-Real-IP header is described by Equation 7.13.
143

d �=(X1,Δt) =
⎧⎪⎨⎪⎩
0.0033855 + 0.00348067√Δt 0 < Δt < 1047.895444√
−0.23349 + 0.00721289√Δt 1047.895444 ≤ Δt < 29245.06883
1 Δt ≥ 29245.06883
(7.13)
Figure 7.9 shows the model learned for the agreement decay of the X-Real-IP
header, which is described by Equation 7.14.
d=(X1,Δt) =
{e−5.59227+0.550263 lnΔt Δt < 25923.46755
1 Δt ≥ 25923.46755(7.14)
Figure 7.7: Disagreement decay for the X-Real-IP header (second interval)
Figure 7.8: Disagreement decay for the X-Real-IP header (first interval)
144

Figure 7.9: Agreement decay for the X-Real-IP header
7.3.3.2 X-Forwarded-For Header
The X-Forwarded-For header is a multivalued attribute (i.e. it contains multiple
IP addresses) differing from the rest of fingerprint attributes, which are single-
valued (i.e. only contain one value per attribute).
As stated by Li et al. [2011], for multivalued attributes only agreement decay
must be learned due to the following reasons: (i) having different values for such
attributes does not indicate record un-match, and (ii) sharing the same value for
such attributes is additional evidence for record match.
Therefore, for the X-Forwarded-For header we have only learned its agreement
decay. Figure 7.10 shows the model learned, which is described by Equation 7.15.
Figure 7.10: Agreement decay for the X-Forwarded-For header
145

d=(X2,Δt) =
{e−5.06924+0.498956 lnΔt Δt < 25840.37422
1 Δt ≥ 25840.37422(7.15)
As it can be observed, the model is quite similar to the one corresponding to
the agreement decay for the X-Real-IP header, because the value of the X-Real-
IP header is always included within the values of the X-Forwarded-For header,
and, in most cases, the X-Forwarded-For header includes a unique value that
corresponds to the value of the X-Real-IP header. In addition, as shown in
Table 7.5, the values of their conditioned entropy are very low: H(X1|X2) = 0
and H(X2|X1) = 0.01.
7.3.3.3 User-Agent Header
Figure 7.11 shows the model learned for the disagreement decay for the User-
Agent header. As it can be seen, this header changes in a lineal fashion, slower
than the X-Real-IP header. Therefore it is a more stable fingerprint attribute.
Equation 7.16 describes the disagreement decay of the User-Agent header.
d �=(X3,Δt) =
⎧⎪⎨⎪⎩
0 0 < Δt < 133.8336005
−0.0047762 + 0.0000356876Δt 133.8336005 ≤ Δt < 28154.77084
1 Δt ≥ 28154.77084
(7.16)
Figure 7.11: Disagreement decay for the User-Agent header
146

Figure 7.12: Agreement decay for the User-Agent header
Figure 7.12 shows the model learned for the agreement decay of the User-
Agent header, which is described by Equation 7.17.
d=(X3,Δt) =
{e−10.1715+0.993395 lnΔt Δt < 27976.76015
1 Δt ≥ 27976.76015(7.17)
7.3.3.4 Accept Header
Figure 7.13 shows the model learned for the disagreement decay of the Accept
header, which is described by Equation 7.18.
d �=(X4,Δt) =
{(0.279051 + 0.00387899
√Δt)2 Δt < 34543.93180
1 Δt ≥ 34543.93180(7.18)
Figure 7.14 shows the model learned for the agreement decay of the Accept
header, which is described by Equation 7.19.
d=(X4,Δt) =
{0.000033494 + 0.000033083Δt Δt < 30225.99238
1 Δt ≥ 30225.99238(7.19)
147

Figure 7.13: Disagreement decay for the Accept header
Figure 7.14: Agreement decay for the Accept header
7.3.3.5 Accept-Language Header
Figure 7.15 shows the model learned for the disagreement decay of the Accept-
Language header, which is described by Equation 7.20. As it can be seen in the
figure, such disagreement decay grows very slowly (it is very unlikely for a browser
to change its language requested to web servers).
d �=(X5,Δt) =
{e−4.09968+3.23283·10−9Δt2 Δt < 35610.94887
1 Δt ≥ 35610.94887(7.20)
Figure 7.16 shows the model learned for the agreement decay of the Accept-
Language header, which is described by Equation 7.21.
148

Figure 7.15: Disagreement decay for the Accept-Language header
Figure 7.16: Agreement decay for the Accept-Language header
d=(X5,Δt) =
{0.0000347399 + 0.0000330993Δt Δt < 30211.06972
1 Δt ≥ 30211.06972(7.21)
7.3.3.6 Accept-Charset Header
Figure 7.17 shows the model learned for the disagreement decay of the Accept-
Charset header, which is described by Equation 7.22. As happened with the
previous header, such disagreement decay grows very slowly.
149

Figure 7.17: Disagreement decay for the Accept-Charset header
Figure 7.18: Agreement decay for the Accept-Charset header
d �=(X6,Δt) =
{(0.0281337 + 4.35781 · 10−10Δt2)2 Δt < 47224.69002
1 Δt ≥ 47224.69002(7.22)
Figure 7.18 shows the model learned for the agreement decay of the Accept-
Charset header, which is described by Equation 7.23.
d=(X6,Δt) =
{0.0000339481 + 0.0000330917Δt Δt < 30218.03207
1 Δt ≥ 30218.03207(7.23)
150

7.3.3.7 Accept-Encoding Header
Figure 7.19 shows the model learned for the disagreement decay of the Accept-
Encoding header, which is described by Equation 7.24. As happened with the
Accept-Language and Accept-Charset, such disagreement decay grows very slowly.
d �=(X7,Δt) =
{e−4.67385+0.000115853Δt Δt < 40342.93458
1 Δt ≥ 40342.93458(7.24)
Figure 7.20 shows the model learned for the agreement decay of the Accept-
Encoding header, which is described by Equation 7.25.
Figure 7.19: Disagreement decay for the Accept-Encoding header
Figure 7.20: Agreement decay for the Accept-Encoding header
151
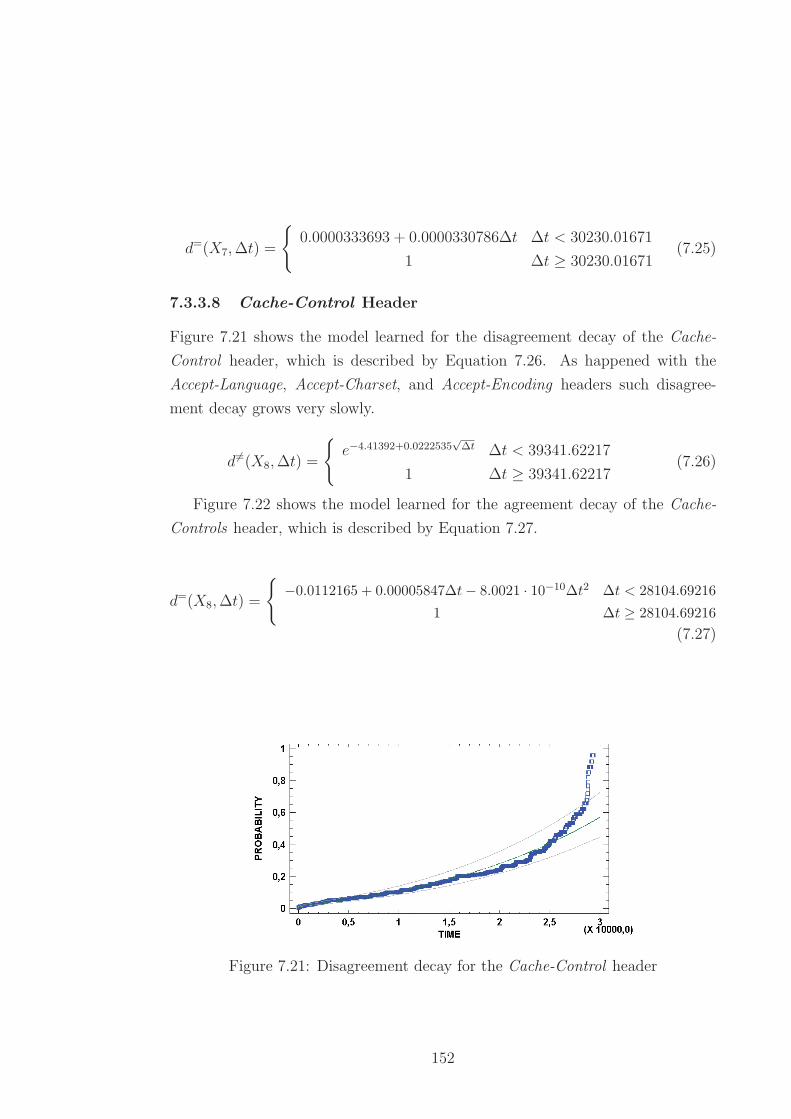
d=(X7,Δt) =
{0.0000333693 + 0.0000330786Δt Δt < 30230.01671
1 Δt ≥ 30230.01671(7.25)
7.3.3.8 Cache-Control Header
Figure 7.21 shows the model learned for the disagreement decay of the Cache-
Control header, which is described by Equation 7.26. As happened with the
Accept-Language, Accept-Charset, and Accept-Encoding headers such disagree-
ment decay grows very slowly.
d �=(X8,Δt) =
{e−4.41392+0.0222535
√Δt Δt < 39341.62217
1 Δt ≥ 39341.62217(7.26)
Figure 7.22 shows the model learned for the agreement decay of the Cache-
Controls header, which is described by Equation 7.27.
d=(X8,Δt) =
{−0.0112165 + 0.00005847Δt− 8.0021 · 10−10Δt2 Δt < 28104.69216
1 Δt ≥ 28104.69216
(7.27)
Figure 7.21: Disagreement decay for the Cache-Control header
152

Figure 7.22: Agreement decay for the Cache-Control header
7.3.3.9 Plugins
Figure 7.23 shows the model learned for the disagreement decay of the Plugins
installed within the browser, which is described by Equation 7.28.
d �=(X9,Δt) =
{(0.0835439 + 0.00570466
√Δt)2 Δt < 25808.56167
1 Δt ≥ 25808.56167(7.28)
Figure 7.24 shows the model learned for the agreement decay of the Plugins
attribute, which is described by Equation 7.29.
d=(X9,Δt) =
{e−10.1405+0.98999 lnΔt Δt < 28086.17546
1 Δt ≥ 28086.17546(7.29)
153

Figure 7.23: Disagreement decay for the Plugins attribute
Figure 7.24: Agreement decay for the Plugins attribute
7.3.3.10 Fonts
Figure 7.25 shows the model learned for the disagreement decay of the Fonts
attribute. The regression function is not defined in the interval [0, 1102.506998)
as the radicand expression produces negative numbers. For such interval the
model shown in Figure 7.26 has been obtained by performing and additional
regression specifically for the interval [0, 1102.506998). Joining both models, the
disagreement decay the Fonts attribute is described by Equation 7.30.
154

Figure 7.25: Disagreement decay for the Fonts attribute (second interval)
Figure 7.26: Disagreement decay for the Fonts attribute (first interval)
d �=(X10,Δt) =
⎧⎪⎨⎪⎩
(0.012879 + 0.0605308 lnΔt)2 0 < Δt < 1102.506998√−0.230069 + 0.00692895
√Δt 1102.506998 ≤ Δt < 31515.49207
1 Δt ≥ 31515.49207
(7.30)
Figure 7.27 shows the model learned for the agreement decay of the Fonts
attribute, which is described by Equation 7.31.
d=(X10,Δt) =
{0.0000332742 + 0.0000330753Δt Δt < 30233.03570
1 Δt ≥ 30233.03570(7.31)
155

Figure 7.27: Agreement decay for the Fonts attribute
7.3.3.11 Video
Figure 7.28 shows the model learned for the disagreement decay of the Video
attribute, which is described by Equation 7.32.
d �=(X11,Δt) =
{(0.233452 + 0.00417302
√Δt)2 Δt < 33742.54047
1 Δt ≥ 33742.54047(7.32)
Figure 7.29 shows the model learned for the agreement decay of the Video
attribute, which is described by Equation 7.33.
d=(X11,Δt) =
{0.0000673283 + 0.0000331751Δt Δt < 30141.05976
1 Δt ≥ 30141.05976(7.33)
156

Figure 7.28: Disagreement decay for the Video attribute
Figure 7.29: Agreement decay for the Video attribute
7.3.3.12 Time zone
Figure 7.30 shows the model learned for the disagreement decay of the Time zone
attribute, which is described by Equation 7.34.
d �=(X12,Δt) =
{(0.12658 + 0.000024006Δt)2 Δt < 36383.40415
1 Δt ≥ 36383.40415(7.34)
Figure 7.31 shows the model learned for the agreement decay of the Time
zone attribute, which is described by Equation 7.34.
157

Figure 7.30: Disagreement decay for the Time zone attribute
Figure 7.31: Agreement decay for the Time zone attribute
d=(X12,Δt) =
{0.0000337212 + 0.0000337212Δt Δt < 30222.05737
1 Δt ≥ 30222.05737(7.35)
7.3.3.13 Session Storage
Figure 7.32 shows the model learned for the disagreement decay of the Ses-
sion storage attribute, which is described by Equation 7.36. As happened with
the Accept-Language, Accept-Charset, Accept-Encoding, and Cache-Control at-
tributes such disagreement decay grows very slowly.
158

Figure 7.32: Disagreement decay for the Session Storage attribute
Figure 7.33: Agreement decay for the Session storage attribute
d �=(X13,Δt) =
{e−5.91823+0.0303167
√Δt Δt < 38108.32197
1 Δt ≥ 38108.32197(7.36)
Figure 7.33 shows the model learned for the agreement decay of the Session
storage attribute, which is described by Equation 7.37.
d=(X13,Δt) =
{0.0000331289 + 0.0000330721Δt Δt < 30235.96539
1 Δt ≥ 30235.96539(7.37)
159
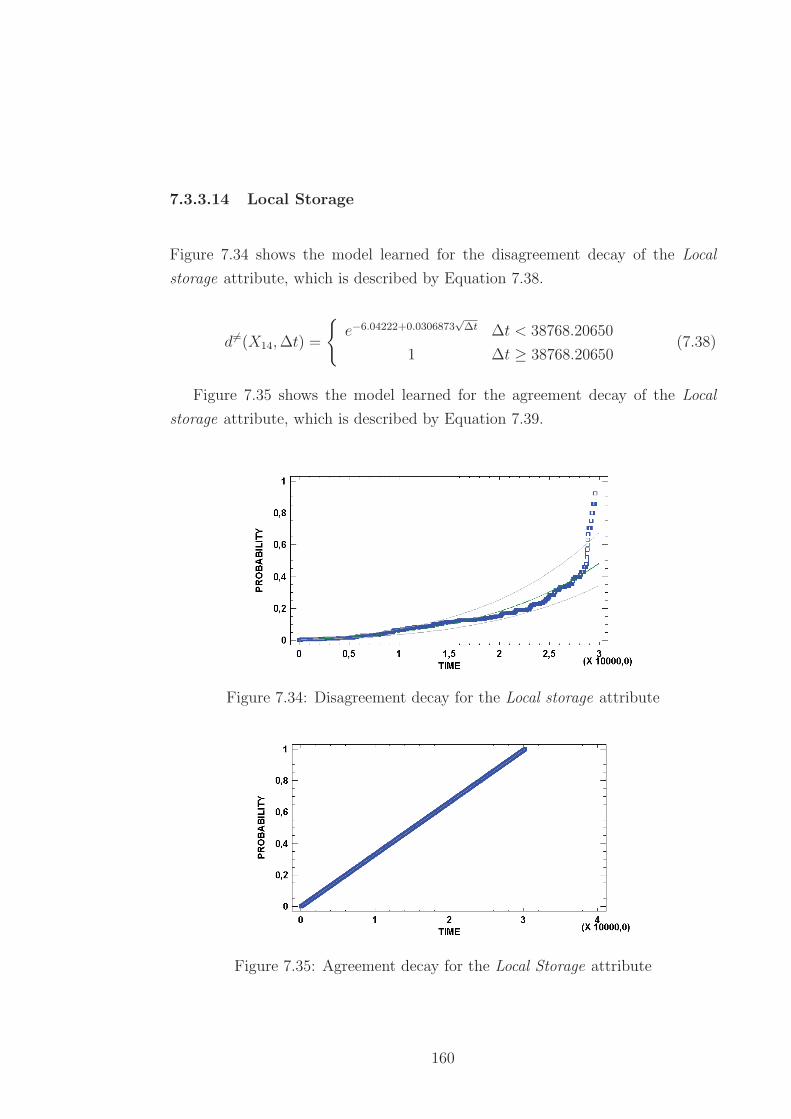
7.3.3.14 Local Storage
Figure 7.34 shows the model learned for the disagreement decay of the Local
storage attribute, which is described by Equation 7.38.
d �=(X14,Δt) =
{e−6.04222+0.0306873
√Δt Δt < 38768.20650
1 Δt ≥ 38768.20650(7.38)
Figure 7.35 shows the model learned for the agreement decay of the Local
storage attribute, which is described by Equation 7.39.
Figure 7.34: Disagreement decay for the Local storage attribute
Figure 7.35: Agreement decay for the Local Storage attribute
160

d=(X14,Δt) =
{0.0000331289 + 0.0000330721Δt Δt < 30235.96539
1 Δt ≥ 30235.96539(7.39)
7.3.3.15 Internet Explorer Persistence
Figure 7.36 shows the model learned for the disagreement decay of the Internet
Explorer persistence attribute, which is described by Equation 7.40.
d �=(X15,Δt) =
{e−6.29214+0.0331916
√Δt Δt < 35936.88071
1 Δt ≥ 35936.88071(7.40)
Figure 7.37 shows the model learned for the agreement decay of the Internet
Explorer persistence attribute, which is described by Equation 7.41.
d=(X15,Δt) =
{0.0000331737 + 0.0000330731Δt Δt < 30235.04982
1 Δt ≥ 30235.04982(7.41)
Figure 7.36: Disagreement decay for the Internet Explorer persistence attribute
161

Figure 7.37: Agreement decay for the Internet Explorer persistence attribute
7.4 Evaluation
We have evaluated the four variants of the technique for uniquely identifying
users based in the fingerprint of their devices described in this chapter, which are
the following:
1. Assigning equal weight to each fingerprint attribute.
2. Assigning the entropy of the attribute as attribute weight.
3. Taking into account agreement and disagreement decays.
4. Combining attribute entropy with agreement and disagreement decay.
As described in Section 7.3.2 we have used a corpus of activity records with users
identified with the technique based on cookies as gold standard.
The evaluation has been performed with different values of θ (i.e. threshold at
which it is considered that two fingerprints correspond to the same browser). For
each variant and threshold, we have measured algorithm performance, according
to a set of evaluation metrics.
For the variants that require to train a decay and/or entropy model (i.e. all
with the exception of the one based on uniform weights), we have performed
2-fold cross-validation, dividing the dataset into two subsets. We have assigned
randomly records to each subset, so that both subsets are equal in size. For each
subset, we have learned decay and entropy values, and evaluated the algorithm
162

performance with the other subset, letting us to recommend the best algorithm
variant, and to compare our results with previous work.
This section is structured as follows:
• Section 7.4.1 describes the metrics used for evaluating the technique.
• Section 7.4.2 presents the evaluation results obtained for each variant and
threshold, comparing such results and obtaining an optimum setting.
7.4.1 Evaluation Metrics
The technique proposed for unique user identification can be evaluated as a clus-
tering algorithm since its objective is to group fingerprint records corresponding
to unique users.
Most of the metrics used for evaluating this work interpret the clustering as
a set of decisions, one for each of the N(N − 1)/2 pairs of elements (i.e. pairs of
fingerprint records). In this context:
• TP is the number of true positive decisions. A true positive decision assigns
two fingerprints corresponding to the same user to the same cluster.
• TN is the number of true negative decisions. A true negative decision
assigns two fingerprints corresponding to distinct users to different clusters.
• FP is the number of false positive decisions. A false positive decision assigns
two fingerprints corresponding to distinct users to the same cluster.
• FN is the number of false negative decisions. A false negative decision
assigns two fingerprints corresponding to a same user to different clusters.
Taking into account the TP , TN , FP , and FN indicators, the metrics used
for evaluating the performance of the technique for unique user identification are
described next.
163

7.4.1.1 Rand Index
The Rand Index metric [Rand, 1971] measures the percentage of correct clustering
decisions. Equation 7.42 shows its definition.
RI =TP + TN
TP + FP + TN + FN(7.42)
The range of this metric is [0..1]. We consider satisfactory values for this
metric those that are over 0.9.
7.4.1.2 Error Rate
The Error Rate metric [Kohavi and Provost, 1998] measures the percentage of
incorrect decisions. Equation 7.43 shows its definition.
Error =FP + FN
TP + FP + FN + TN(7.43)
The range of this metric is [0..1]. We consider satisfactory values for this
metric those that are bellow 0.1, as Error = 1−RI.
7.4.1.3 Recall
The Recall metric [Kowalski, 1997] (a.k.a. sensitivity or hit rate) is the true
positive rate. Equation 7.44 shows its definition.
Recall =TP
TP + FN(7.44)
The range of this metric is [0..1]. We consider satisfactory values for this
metric those that are over 0.85.
7.4.1.4 Specificity
The Specificity metric [Kohavi and Provost, 1998] is the true negative rate. Equa-
tion 7.45 shows its definition.
Specificity =TN
FP + TN(7.45)
164

The range of this metric is [0..1]. We consider satisfactory values for this
metric those that are over 0.9.
7.4.1.5 False Positive Rate
Equation 7.46 defines the False Positive Rate metric [Kohavi and Provost, 1998]
(a.k.a. fall-out).
FPR =FP
FP + TN(7.46)
The range of this metric is [0..1]. We consider satisfcactory values for this
metric those that are bellow 0.1.
7.4.1.6 False Negative Rate
Equation 7.47 defines the False Negative Rate [Kohavi and Provost, 1998] metric.
FNR =FN
FN + TP(7.47)
The range of this metric is [0..1]. We consider satisfactory values for this
metric those that are bellow 0.15, as FNR = 1−Recall.
7.4.1.7 Precision
The Precision metric [Kowalski, 1997] is defined as the positive predictive value.
Equation 7.48 shows its definition.
Precision =TP
TP + FP(7.48)
The range of this metric is [0..1]. We consider satisfactory values for this
metric those that are over 0.9.
7.4.1.8 F-measure
The F-measure metric [Larsen and Aone, 1999] combines the precision and recall
metrics offering an overall vision of how the technique behaves. It is defined as
165

the harmonic mean of precision and recall. Equation 7.49 shows its definition.
F1 =2 · Precision ·Recall
Precision+Recall(7.49)
The range of this metric is [0..1]. We consider satisfactory values for this
metric those that are over 0.87, taking into account the minimum Precision and
Recall satisfactory values.
7.4.1.9 Purity
This metric, defined by Zhao and Karypis [2001], represents clusters’ purity. To
calculate it we assign the most frequent user in the cluster for each fingerprint
cluster obtained. Then, the classification performance is measured as the number
of fingerprint records assigned correctly to a cluster, divided by the total number
of records.
Let Ω = {ω1, ω2, ..., ωk} be the set of clusters obtained, C = c1, c2, ..., cj the
number of users, and N the total number of fingerprint records, the Purity metrics
is obtained as shown by Equation 7.50.
Purity(Ω, C) =1
N
∑k
maxj
|ωk ∩ cj| (7.50)
The range of this metric is [0..1]. We consider satisfactory values for this
metric those that are over 0.85.
7.4.2 Evaluation Results
This section presents the evaluation results for the variants of the technique and
compares them, obtaining and optimum combination of variant and threshold at
which it is considered that two fingerprints correspond to the same user’s browser.
7.4.2.1 Variant Based on Uniform Weights
This variant assigns the same weight for all the fingerprint attributes. Therefore,
all of these attributes have the same importance for determining whether two
fingerprints correspond to a same browser.
166

Measure θ = 0.7 θ = 0.75 θ = 0.8 θ = 0.85 θ = 0.9 θ = 0.95
Rand Index 0.9978 0.9994 0.9998 0.9998 0.9996 0.9994
Error Rate 0.0011 0.0003 0.0001 0.0001 0.0002 0.0003
Recall 0.41 0.74 0.91 0.91 0.63 0.39
Specificity 0.99836 0.99965 0.99985 0.99986 0.99995 0.99996
False Positive Rate 0.00164 0.00035 0.00015 0.00014 0.00005 0.00004
False Negative Rate 0.59 0.26 0.09 0.09 0.37 0.61
Precision 0.20 0.67 0.85 0.86 0.92 0.91
F-measure 0.27 0.7 0.88 0.88 0.75 0.54
Purity 0.44 0.77 0.92 0.92 0.96 0.96
Table 7.9: Evaluation results for the variant based on uniform weights
Table 7.9 shows the evaluation results corresponding to different values of θ,
from where the following insights can be obtained:
• The Rand Index and Error Rate metrics are good for all the values assigned
to θ.
• The Specificity and False Positive Rate metrics are good for all the values
assigned to θ.
• The Recall and False Negative Rate metrics are good for θ = 0.8 y θ = 0.85.
• The Precision metric is good for θ = 0.9 and θ = 0.95, although for these
values, the recall is not admissible.
• The F-measure metric is acceptable for θ = 0.8 and θ = 0.85.
• The Purity metric is good for θ > 0.8.
The values that optimise the corresponding metrics among all the variants are
marked in bold in Table 7.9.
7.4.2.2 Variant Based on Attribute Entropy
This variant assigns to the weight of each fingerprint attribute its corresponding
entropy. Therefore, each attribute has an importance that is proportional to the
quantity of information that it provides for distinguishing a fingerprint record
167

from other, or for clustering fingerprints that correspond to a same user. As an
example, the plugins installed in the browser will have more weight than the time
zone.
Table 7.10 shows the evaluation results corresponding to different values of θ,
from where the following insights can be obtained:
• The Rand Index and Error Rates metrics are good for all the values assigned
to θ.
• The Specificity and False Positive Rate metrics are good for all the values
assigned to θ.
• The Recall and False Negative Rate metrics are not as good as with other
variants.
• The Precision metric is good for all values of θ.
• The F-measure metric is not as good as with other variants.
• The Purity metric is good for all the values of θ.
The values that optimise the corresponding metrics among all the variants are
marked in bold in Table 7.10.
Measure θ = 0.7 θ = 0.75 θ = 0.8 θ = 0.85 θ = 0.9 θ = 0.95
Rand Index 0.9996 0.9996 0.9996 0.9994 0.9994 0.9994
Error Rate 0.0002 0.0002 0.0002 0.0003 0.0003 0.0003
Recall 0.64 0.64 0.64 0.44 0.41 0.40
Specificity 0.99995 0.99995 0.99995 0.99996 0.99996 0.99996
False Positive Rate 0.00005 0.00005 0.00005 0.00004 0.00004 0.00004
False Negative Rate 0.36 0.36 0.36 0.56 0.59 0.60
Precision 0.92 0.92 0.92 0.91 0.91 0.91
F-measure 0.76 0.75 0.75 0.60 0.56 0.56
Purity 0.95 0.95 0.96 0.96 0.96 0.97
Table 7.10: Evaluation results for the variant based on attribute entropy
168

7.4.2.3 Variant Based on Time Decay
This variant assigns to the weight of each fingerprint attribute its corresponding
agreement and disagreement decays. Therefore each attribute has an importance
proportional to the probability of change or sharing between fingerprint records.
Table 7.11 shows the evaluation results corresponding to different values of θ,
from where the following insights can be obtained:
• The Rand Index and Error Rates metrics are good for all the values assigned
to θ.
• The Specificity and False Positive Rate metrics are good for all the values
assigned to θ.
• The Recall and False Negative Rate metrics are not as good as with other
variants.
• The Precision metric is good for θ = 0.95.
• The F-measure metric is not as good as with other variants.
• The Purity metric is good for θ = 0.9 y θ = 0.95.
The values that optimise the corresponding metrics among all the variants are
marked in bold in Table 7.11.
Measure θ = 0.7 θ = 0.75 θ = 0.8 θ = 0.85 θ = 0.9 θ = 0.95
Rand Index 0.9977 0.9986 0.9991 0.9994 0.9997 0.9995
Error Rate 0.0012 0.0007 0.0005 0.0003 0.0002 0.0002
Recall 0.31 0.36 0.42 0.61 0.74 0.53
Specificity 0.99832 0.99921 0.99964 0.99981 0.99991 0.99996
False Positive Rate 0.00168 0.00079 0.00036 0.00019 0.00009 0.00004
False Negative Rate 0.69 0.64 0.58 0.39 0.26 0.47
Precision 0.15 0.31 0.53 0.76 0.89 0.92
F-measure 0.2 0.22 0.47 0.68 0.81 0.67
Purity 0.32 0.45 0.61 0.79 0.89 0.95
Table 7.11: Evaluation results for the variant based on time decay
169

7.4.2.4 Variant Based on Attribute Entropy and Time Decay
This variant assigns to the weight of each fingerprint attribute a combination
of its corresponding entropy, and agreement and disagreement decays. Therefore
each attribute has an importance proportional to the quantity of information that
adds for distinguishing a fingerprint from another, as well as to the probability
of change or sharing between fingerprint records.
Table 7.12 shows the evaluation results corresponding to different values of θ,
from where the following insights can be obtained:
• The Rand Index and Error Rates metrics are good for all the values assigned
to θ.
• The Specificity and False Positive Rate metrics are good for all the values
assigned to θ.
• The Recall and False Negative Rate metrics are good for θ = 0.7, θ = 0.75
y θ = 0.8.
• The Precision metric is good for all the values of θ.
• The F-measure metric is good for θ = 0.7, θ = 0.75, and θ = 0.8.
• The Purity metric is good for all values of θ.
The values that optimise the corresponding metrics among all the variants are
marked in bold in Table 7.12.
170

Measure θ = 0.7 θ = 0.75 θ = 0.8 θ = 0.85 θ = 0.9 θ = 0.95
Rand Index 0.9998 0.9998 0.9998 0.9996 0.9994 0.9994
Error Rate 0.0001 0.0001 0.0001 0.0002 0.0002 0.0002
Recall 0.89 0.88 0.87 0.62 0.46 0.45
Specificity 0.9999 0.99992 0.99993 0.99995 0.99996 0.99996
False Positive Rate 0.00010 0.00008 0.00007 0.00005 0.00004 0.00004
False Negative Rate 0.11 0.12 0.13 0.38 0.54 0.55
Precision 0.9 0.91 0.93 0.92 0.91 0.91
F-measure 0.9 0.9 0.9 0.74 0.61 0.6
Purity 0.88 0.91 0.94 0.95 0.95 0.96
Table 7.12: Evaluation results for the variant based on attribute entropy andtime decay
7.4.2.5 Comparison of the Variants
Figure 7.38 shows a ROC (Receiver Operating Characteristic) graph [Egan, 1975]
with plots representing the algorithm variants with different thresholds. A ROC
space is defined by False Positive Rate and Recall (or True Positive Rate) metrics
as x and y axes respectively, which depicts relative trade-offs between true positive
(benefits) and false positive (costs). The best possible prediction method would
yield a point in the upper left corner or coordinate (0,1) of the ROC space,
representing no false negatives and no false positives (perfect classification).
Therefore, the best-performing variants are in the upper left corner of the
figure. Such variants are the one that uses the same weight for all fingerprint
attributes (for θ = 0.8 and θ = 0.85), and the one that takes into account entropy
and decay (for θ = 0.7, θ = 0.75 and θ = 0.8). Taking into account entropy or
decay by separate (second and third variant) do not produce the better results
than the uniform weights variant.
Table 7.13 compares the variants that provide better results (optimous results
in bold), showing the following insights:
• The Rand Index and Error Rate metrics are the same for all the variants
and thresholds.
• The Recall and False Negative Rate metrics are slightly better for the vari-
ant that assigns the same weight for all the attributes (first variant), al-
171

Figure 7.38: Performance of the variants evaluated for the technique for uniqueuser identification based on evolving device fingerprint detection
though they are acceptable for the variant that takes into account decay
and entropy (fourth variant).
• On the other hand, Specificity and False Positive Rate are slightly better
for the fourth variant, although they are acceptable for the first variant.
• Precision is better for the fourth variant (over 0.9).
• F-measure is higher for the fourth variant (over 0.9).
• In addition, the algorithm achieves better purity values for the fourth vari-
ant with θ = 0.8 (Purity = 0.94).
In summary, the variant that behaves better is the one that takes into account
entropy and decay, since it provides the maximum values of Rand Index, F-
measure and Purity.
172

Uniform weights Decay and entropy
Measure θ = 0.8 θ = 0.85 θ = 0.7 θ = 0.75 θ = 0.8
Rand index 0.9998 0.9998 0.9998 0.9998 0.9998
Error rate 0.0001 0.0001 0.0001 0.0001 0.0001
Recall (or sensitivity) 0.91 0.91 0.89 0.88 0.87
Specificity 0.99985 0.99986 0.9999 0.99992 0.99993
False positive rate 0.00015 0.00014 0.00010 0.00008 0.00007
False negative rate 0.09 0.09 0.11 0.12 0.13
Precision 0.85 0.86 0.9 0.91 0.93
F-measure 0.85 0.86 0.9 0.9 0.9
Purity 0.92 0.92 0.88 0.91 0.94
Table 7.13: Comparison of the variants with more performance
7.5 Hypothesis Validation
In comparison with the algorithm proposed by Eckersley [2010], our algorithm
behaves better, since the accuracy of the former is 0.991, while the accuracy of
the latter is 0.9998. The false positive rate of Eckersley [2010] is 0.0086 while ours
is almost zero (0.00007). Moreover, the algorithm described by Eckersley [2010]
only classifies the 65% of the fingerprints (when the browser has Java Virtual
Machine or Flash installed). By contrast, our algorithm makes a classification in
all the cases, regardless Flash or Java Virtual Machine.
The evaluation performed to our approach for unique user identification val-
idates the Hypothesis 2 of this work, since our technique allows grouping and
identifying the activity generated by website visitors through the digital finger-
print of their devices, even when such fingerprint varies over time, with a higher
performance along different metrics than the previous existing approach.
173

174

Chapter 8
TECHNIQUES FOR
SEGMENTATION OF
CONSUMERS FROM SOCIAL
MEDIA CONTENT
This chapter describes another main contribution of this thesis to the State of the
Art, which consists in a collection of techniques for extracting socio-demographic
and psychographic profiles from social media users applied to the marketing do-
main, trough the analysis of the opinions they express about brands, as well as
from the profiles published by them in social networks. Specifically, these tech-
niques are the following:
• A technique for classifying consumer opinions produced in social media
according to the Consumer Decision Journey stages, which is described in
Section 8.2.
• A technique for classifying consumer opinions produced in social media ac-
cording to the Marketing Mix framework, which is described in Section 8.3.
• A technique for analysing consumer opinions written in Spanish according
to the emotions expressed in such opinions, which is described in Section 8.4.
175

• A technique for obtaining the place of residence of social media users, which
is described in Section 8.5.
• A technique for identifying the place of residence of social media users,
which is described in Section 8.6.
Additionally, the contributions of this thesis that perform content analysis
rely in a common task for gathering the corpora used for learning and evaluation
purposes, a common activity for pre-processing user-generated contents before
modelling, and a modelling technique based on rule matching. Section 8.1 de-
scribes such common elements.
Finally, the evaluation results are presented in Section 8.7. After that, in
Section 8.8 we validate the hypotheses formulated in Section 3.4 regarding so-
ciodemographic and psychographic segmentation of consumers.
The techniques described in this chapter implement generic activities and
tasks defined by the CRISP-DM methodology [Shearer, 2000], which has been
described in Section 4.3.2.
8.1 Common Elements Used by the Techniques
The content-analysis techniques described in this thesis have been trained and
evaluated with corpora extracted from social media. Section 8.1.1 describes the
data collection task used for obtaining such corpora, while Section 8.1.2 describes
the technique used for preparing the corpora used by the content-analysis contri-
butions of this thesis.
In addition, two techniques presented in this thesis (i.e. the technique for
detecting Consumer Decision Journey stages and the technique for identifying
emotions) make use of rule-based models, which rely on a variety of linguistic
information such as lexical items or morphosyntactic features (e.g. future tense).
Such models have been developed following the modelling technique described in
Section 8.1.3.
176

ad Collect Initial Data Task
Search
language brand terms
«parallel»
links linkOpinion Clipping
text clipsExtract paragraphs
Figure 8.1: Initial Data Collection task executed by the content-analysis tech-niques
8.1.1 Collect Initial Data Task
This task implements the Collect Initial Data generic task of the CRISP-DM
methodology [Shearer, 2000] (see Section 4.3.2.2). It is oriented to find and
retrieve from different social media textual contents that mention brands. The
workflow followed by this task is shown in Figure 8.1 and consists in the ordered
execution of the steps described next.
Search. This step consists in defining a pool of brands with a list of lexical
variants for each one (e.g. “Coca Cola” and “Coke” for the brand Coca
Cola and using social media search services for looking for texts written in
a set of objective languages that mention any of those brands, retrieving
the links highlighted by the search results.
In our work we used the search services provided by Google78, Facebook79,
and Twitter80.
Extract. This step consists in retrieving and extracting the textual content re-
ferred by the links of the search results.
Texts from structured data sources (i.e. from Twitter and Facebook) are
directly retrieved from the values of the message attribute included in
78https://developers.google.com/custom-search79https://developers.facebook.com/docs/graph-api80https://dev.twitter.com/docs/api/1.1/get/search/tweets
177

the structured data object obtained by querying the corresponding REST
[Fielding, 2000] API.
Texts from unstructured data sources (i.e. web pages) are obtained by
performing a scraping technique oriented to remove HTML mark-up.
Opinion Clipping. Once the texts from each specific social media format have
been collected, this step extracts the paragraphs (i.e. clips) that mention
the selected brands (i.e. that contain at least one term of the list of terms
used by the Search task).
8.1.2 Data Preparation Activity
This task implements the Data Preparation generic activity of the CRISP-DM
methodology (see Section 4.3.2.3). Once the content is retrieved, the goal of this
activity is to filter the texts that are not relevant, either because they do not
mention the brand, are written in a different language than the target language,
or do not contain user-generated content.
In addition, NLP (Natural Language Processing) tools were used to obtain
the linguistic information upon which the content-analysis techniques were based.
The texts were processed and annotated with linguistic information such as part-
of-speech, verb tense, and person. For these NLP tools to work properly, it
was also crucial to normalise the texts that contain many typos, abbreviations,
emoticons, etc.
For enhancing the performance of the content analysis techniques described
in this thesis, the data preparation activity executes a morphological normalisa-
tion of user-generated content. Such technique makes use of several gazetteers
extracted from different open data sources collectively developed, including a
SMS lexicon and Wikipedia. Wikipedia has been used in the past for different
NLP activities, such as text categorisation [Gabrilovich and Markovitch, 2006],
topic identification [Coursey et al., 2009], measuring the semantic similarity be-
tween texts [Gabrilovich and Markovitch, 2007], and word sense disambiguation
[Mihalcea, 2007], among others.
This activity consists in the ordered execution of the tasks shown in Figure 8.2,
which are described next.
178

ad Data Preparation Activity
dataselectioncriteria
Select Data Clean Data Construct Data
language brands paragraphs
paragraphscleansed
normalised posts
Figure 8.2: Data Preparation Activity implemented by the content-analysis tech-niques
8.1.2.1 Select Data Task
As described in Section 8.1.1 the Collect Initial Data task looks for contents
written in a target language that refer to a commercial brand. For doing so, it
uses the content retrieval APIs provided by social media. Such APIs may output
false positives of the following kinds:
1. Posts that syntactically contain a brand term that do not refer to the brand
itself. This is mainly due to the use of ambiguous terms (e.g. “Orange”
may refer to a telecommunications company, a fruit or a colour).
2. The social network’s API do not have language detection capabilities, or
retrieves posts that have been tagged with a given language but are not
actually written in such language.
For dealing with these situations, this task establishes the criteria for selecting
the textual contents to be used from the collected raw data. Such contents must
satisfy the following criteria:
1. The text of each post must contain a mention to a commercial brand. For
automatically selecting the correct senses, two lists are added to the data
selection criteria:
• A list of mandatory terms that includes terms related to senses that
refer to the brand (e.g. a text that contains “phone” or “mobile” may
refer to the telecommunication company Orange).
179

• A list of forbidden terms that includes terms related to senses in which
we are not interested (e.g. a text that contains “fruit” or “dessert” is
more likely to refer to a sense of the word Orange different than the
telecommunication company).
2. The text must be written in the target language for which the model will
be learned.
The task described next deals with removing contents from the dataset that do
not satisfy the previous criteria.
8.1.2.2 Clean Data Task
This task consists in removing the contents that are not relevant for the goal of
the activity to be performed after preparing data. The workflow followed by this
task is shown in Figure 8.3 and consists in the ordered execution of the steps
described next.
Filter Irrelevant Content. This step consists in automatically filtering the
texts that syntactically contain one of the brand terms used for looking
up the opinions, but do not refer to the correct sense (i.e. the brand). For
ad Clean Data Task
Manual Revision
[paragraph is notrelevant]
paragraph
paragraphsparagraph
Filter Language
[otherlanguage]
Filter SPAM
«parallel»
paragraph
[paragraphis SPAM]
paragraph
filtered paragraphs
paragraphs cleansed
data selection criteria
Filter Irrelevant Content
languageforbidden
termsmandatory
terms
Figure 8.3: Clean data task executed by the content-analysis techniques
180

doing so, this task takes out the texts that contain at least one forbidden
term or that do not contain at least one mandatory term.
Filter Language. This step consists in automatically removing the texts that
are not written in the language for which the texts are being extracted. To
do so, we have implemented a language detection component that combines
multiple language classifiers and returns the language which has been de-
tected the most by such classifiers. The language classifiers used are the
following:
• The Freeling’s [Padro and Stanilovsky, 2012] language identification
module.
• The Java Text Categorising Library81 that implements the text cate-
gorisation algorithm described by Cavnar and Trenkle [1994].
• The LingPipe82 toolkit for computational linguistics.
• The language identification components provided by the Apache Tika83
framework.
• The JLangDetect84 library.
Filter SPAM. Since the text extraction technique applied in the Data Collec-
tion Task for unstructured formats may return pieces of text included in
advertisements or navigation options of the web page, this step discards
those texts in which brands are not part of the main content of the docu-
ment, following Ntoulas et al. [2006] guidelines.
After studying a representative set of 1,000 texts extracted from web pages,
we decided that a text (with at least an occurrence of a brand) is invalid (i.e.
it does not belong to the main content) unless it includes at least 30% of
words belonging to the following list of grammatical categories: adpositions,
determiners, conjunctions and pronouns.
81http://textcat.sourceforge.net82http://alias-i.com/lingpipe83http://tika.apache.org84http://github.com/melix/jlangdetect
181

To get the grammatical category of each word of the texts we made use of
a part-of-speech tagger (see Section 2.6.1). Specifically, we used Freeling.
Manual Revision. This step consists in manually reviewing the texts obtained
after applying the automatic filtering heuristics described above, discarding
irrelevant or useless contents, such as texts written in other languages that
are not detected by the Filter Language step, or texts referring to other
senses different than the brand that are not detected by the Filter Not
Relevant Content step.
The final corpus obtained after performing this step consists of the re-
maining texts, with annotations of the source from which they have been
collected, the brand mentioned in the texts, and the domain to which they
belong.
8.1.2.3 Construct Data Task
The content analysis techniques presented in this thesis rely on linguistic patterns.
In order to match these patterns with texts, these texts have to be processed and
annotated with linguistic information such as part-of-speech, verb tense, and per-
son. Linguistic processing is carried out by an automatic tagger. However, such
tagger cannot properly work with user-generated texts as the ones our techniques
analyse. This is because social media user-generated texts contain a large num-
ber of misspellings, abbreviations and jargon words. Badly written texts imply a
great amount of errors in the part-of-speech annotation process and, consequently,
without a normalisation phase the developed classifiers do not work correctly. For
dealing with this issue we have implemented the workflow shown in Figure 8.4.
The phases involved in the data preparation task are described next.
Sanitise. This phase transforms the text received by removing non-printable
characters (i.e. control and format characters like the null character) and
by converting different variations of the space character (e.g. non-breaking
space, tab) into the standard whitespace symbol.
Tokenise. This phase receives the text to be normalised and breaks it into
words, Twitter metalanguage elements (e.g. hash-tags, user IDs), emoti-
182

ad Construct Data Task
«parallel»
Tokenise
sanitisedpost
«parallel»
tokensClassify Token
standard languagedictionary
token
Classify OOV Word
Twittermetalanguage
element
correct OOV words
SMS dictionary
Normalise Twitter Metalanguage
Element
OOVword
word in standardvocabulary
correctOR
variation
Check & Correct Spell
OOVword
spell checker
dictionary
OOV word
normalised form
Sanitise
variationOR
unknownOR
correct
Concatenate Normalised
Forms
normalised forms
normalised posts
paragraphs cleansed
normalised post
Figure 8.4: Construct data task executed by the content-analysis techniques
cons, URLs, etc. The output (i.e. the list of tokens) is sent to the Classify
Tokens phase.
In our experiments, we used Freeling for social media content tokenisation.
Its specific tokenisation rules and its user map module were adapted for
dealing with smileys and particular elements typically used in Twitter, such
as hash-tags, RTs, and user IDs.
Classify Tokens. The input of this phase is the list of tokens generated by the
tokeniser. It classifies each of them into one of the following categories:
• Twitter metalanguage elements (i.e. hash-tags, user IDs, RTs and
URLs). Such elements are detected by matching regular expressions
against the token (e.g. if a token starts by the symbol “#”, then it
is a hash-tag). Each token classified in this category is sent to the
Normalise Twitter Metalanguage Element phase.
• Words contained in a standard language dictionary, excluding proper
183

nouns. Each token classified in this category is sent to the Concatenate
Normalised Forms phase.
• Out-Of-Vocabulary (OOV) words. These are words that neither are
found in a standard dictionary nor are Twitter metalanguage elements.
Each token classified in this category is sent to the Classify OOV Word
phase.
We use the part-of-speech tagging module of Freeling within this phase. As
we deactivate Freeling’s probability assignment and unknown word guesser
module, all the words that are not contained in Freeling’s POS-tagging
dictionaries are not marked with a tag and are considered as OOV words.
Our standard vocabularies are, thus, the Freeling dictionaries themselves
for English and Spanish. Additionally, for Spanish we have extended the
standard vocabulary with a list of correct forms generated from the lemmas
found in the Real Academia Espanola Dictionary (DRAE) by Gamallo et al.
[2013].
Classify OOV Word. This phase receives every token previously classified as
out-of-vocabulary by the previous phase and detects if it is correct, wrong,
or unknown. If the token is wrong, it returns the correct form of the token.
The task executes the following steps:
1. Firstly, the token is looked up in a secondary dictionary for those words
that are not in a standard dictionary but that are known to correspond
to correct forms (mostly proper nouns). The search disregards both
case and accents. We have populated this secondary dictionary by
making use of the list of article titles from Wikipedia85. To speed-
up the process of querying the Wikipedia article titles (31,528,653 for
English and 4,391,392 for Spanish), we uploaded them to a HBASE
store86. In order to increase the coverage of this dictionary, we incorpo-
rated into it two lists of first names obtained from the United States
Census Bureau87 and from the Spanish National Institute of Statis-
85http://en.wikipedia.org/wiki/Wikipedia:Database_download86http://hbase.apache.org87http://www.census.gov
184

tics88. The list of first names for the English language contains 1,218
male names and 4,273 female names, while the list for the Spanish
language contains 18,679 male names and 19,817 female names.
(a) If an exact match of the token is found in the dictionary (e.g.
both forms are capitalised), then the token is classified as Correct
and sent to the Concatenate Normalised Forms phase with no
variation.
(b) If the token is found with variations of case or accentuation, then
the token is classified as Variation and its correct form is sent to
Concatenate Normalised Forms phase.
(c) If the token is not found in the dictionary, then the process con-
tinues in step 2.
2. The token is looked up in a SMS dictionary that contains tuples with
the SMS term and its corresponding correct form. The search is case-
insensitive, and does not consider accent marks. We have populated
such a dictionary with 898 common-used SMS terms for English ex-
tracted from different web sources. For Spanish, we have reused the
SMS dictionary of the Spanish Association of Internet Users89, which
contains 53,281 entries.
(a) If the token is found in the SMS dictionary, then it is classified as
Variation and its correct form is retrieved and sent to the Con-
catenate Normalised Forms phase.
(b) If the token is not found in the dictionary, then it is sent to the
Check and Correct Spell phase.
Check and Correct Spell. This phase checks the spelling of the token received
and returns its correct form when possible. To do so, it executes the fol-
lowing steps:
1. Firstly, the token is matched against regular expressions to find whether
it contains characters (or sequences of characters) repeated more than
88http://www.ine.es/inebmenu/indice.htm89http://aui.es
185

twice (e.g. “loooooollll” and “hahaha”).
(a) If the token contains repeated characters (or sequences of charac-
ters), then the repeated ones are removed (e.g. “lol” and “ha”),
and the resulting form is sent back to the Classify OOV word
phase, since the new form may be included into the correct words
set.
(b) If the token does not contain repeated characters (or sequences of
characters), then the process continues in step 2.
2. The token is sent to an existing spell checking and correction imple-
mentation. We make use of Jazzy90, an open-source Java library. For
the creation of the spell checker dictionaries used by Jazzy, we made
use of the different varieties of English and Spanish dictionaries91. The
resulting dictionaries contain 237,667 terms for English and 683,462
terms for Spanish.
(a) If the spell checking is correct, then the token is classified as Cor-
rect and sent to the Concatenate Normalised Forms phase without
a variation.
(b) If the spell checking is not correct, then the token is classified
as Variation and the first correct form returned by the spelling
corrector is sent to Concatenate Normalised Forms phase.
(c) If the spell checker is not able to propose a correct form, the token
is classified as Unknown and is sent to the Concatenate Normalised
Forms phase without a variation.
Normalise Twitter Metalanguage Element. This phase performs a syntac-
tic normalisation of Twitter meta-language elements. Specifically, it exe-
cutes the rules enumerated next.
1. Remove the sequence of characters “RT” followed by a mention to a
Twitter user (marked by the symbol “@”) and, optionally, by a colon
punctuation mark;
90http://jazzy.sourceforge.net91http://sourceforge.net/projects/jazzydicts
186

2. Remove user IDs that are not preceeded by a coordinating or subor-
dinating conjunction, a preposition, or a verb;
3. Remove the word “via” followed by a user mentioned at the end of the
tweet;
4. Remove all the hash-tags found at the end of the tweet;
5. Remove all the “#” symbols from the hash-tags that are maintained;
6. Remove all the hyper-links contained within the tweet;
7. Remove ellipsis points that are at the end of the tweet, followed by a
hyper-link;
8. Replace underscores with blank spaces; and
9. Divide camel-cased words into multiple words (e.g. “DoNotLike” is
converted to “Do Not Like”).
As an example, after applying metalanguage normalisation, the tweet
RT @AshantiOmkar: Fun moments with @ShwetaMohan at the
O2! She was wearing a #DVY #DarshanaVijayYesudas outfit!
http://t.co/...
is converted into the text
Fun moments with Shweta Mohan at the O2! She was wearing a
DVY Darshana Vijay Yesudas outfit!
which is easier for being processed by a part-of-speech tagger.
Concatenate Normalised Forms. This phase receives the normalised form of
each token and amends the post.
8.1.3 Rule-based Modelling Technique
The techniques for detecting Consumer Decision Journey stages and for identify-
ing emotions in user-generated content are based on the recognition of patterns
187

1 <rule set> ::= (<chunk rule> | < classification rule>)∗2 <chunk rule> ::= <pattern> .3 < classification rule > ::= <pattern> ”−>” <action>4 <pattern> ::= (<word> | <lemma> | <part of speech> |5 <lemma and part of speech> | <entity> |6 <any number of words between> |7 <max number of words between>)+8 <word> ::= ’”’ <string> ’”’9 <lemma> ::= <string>
10 <part of speech> ::= [ <string> ]11 <lemma and part of speech> ::= <string> # <string>12 <entity> ::= ENTITY13 <any number of words between> ::= ”∗”14 <max number of words between> ::= / <positive integer number> /15 <action> ::= <class> <operation> <value>16 <class> ::= <string>17 <operation> ::= ”+” | − | ”∗”18 <value> ::= <decimal number>
Listing 8.1: BNF grammar of the linguistic rules
as sequences of particular words. These patterns are part of what we called “lin-
guistic rules”; a description of the pattern as particular conditions that have to
be met in order to consider the text and example of a particular category. The
general structure of the linguistic rules is shown next.
<Linguistic Pattern> → <Classification Action>
The antecedent of the rule reflects the pattern/template of an expression in
natural language and the consequent defines an action to be performed, which
consists in modifying a numerical value associated to a given category.
Listing 8.1 shows the BNF (Backus Naur Form) grammar [Backus et al., 1963]
according to which the rules are expressed.
Rules can be either defined for performing classification actions (e.g. incre-
menting the value for a given category) or as chunk actions (i.e. for dividing the
text into fragments).
The first component of classification and chunk rules is a linguistic pattern (see
pattern in Listing 8.1). Such pattern describes the relevant features of a expression
188

in natural language at the morphosyntactic level. Each word of the pattern can
be represented by itself —e.g. “girls”— or as its lemma —e.g. girl— alone,
or with (some components of) its part-of-speech tag —e.g. girl#N. Sometimes,
only the part-of-speech tag is important —e.g. [N]—, and some others, only the
maximum number —e.g. /1/— or the existence —e.g. *— of words matters.
This allows for quite a flexible specification (see sections 8.2.2.2 and 8.4.2.3 for
examples).
Regarding classification rules (see classification rule in Listing 8.1), such rules
perform an arithmetic operation over a value corresponding to a given category
whenever the linguistic pattern is matched against the text. The operations
available are addition, subtraction and multiplication, denoted by the operators
“+”, “−” and “∗”, respectively. The addition and subtraction operations are
used to designate the polarity of a classification, as in the case of sentiment
analysis (e.g. the adjective “smart” can be modelled with “+1”, while “fool” can
be modelled with “−1” ). The multiplication operation is useful to invert the
polarity of a unit (e.g. the negation particle “no” can be modelled with “∗− 1”),
and to increase or decrease its value (e.g. the adverb “very” can be modelled
with “∗2”, while “little” can be modelled with “∗0.5”).The rule engine executes the following steps for classifying a text:
1. Firstly, the lemma and the part-of-speech tag of every token (i.e. lexical
unit) included in the text are obtained, outputting a sequence of tuples
made up of the token, its lemma and its morphosyntactic category. There-
fore, this step performs the lemmatisation and part-of-speech tagging of the
tokens received as described in Section 2.6.1.
In our experiments, the morphosyntactic annotations were added by the
use of the Freeling part-of-speech tagger. Therefore, the part-of-speech
tags used for English are those defined by Santorini [1991] and for Spanish
those standardised by Leech and Wilson [1996].
2. In this second step, a sentence splitter divides the texts. Additionally, the
set of chunk rules is applied in order to divide the text into the different
sequence units to be analysed (e.g. the conjunction “and” can determine
two units: the one on its left side and the one on its right side).
189

In our experiments we reused Freeling’s sentence splitter.
3. The third step consists in identifying the linguistic patterns that match the
entire text or a part of the text obtained in the previous step. For each
sequence unit, it identifies the antecedents of the rules that match all or
part of the unit. If there are several antecedents that match the same part
of the unit that overlap:
(a) If their corresponding consequents affect the same category, it selects
the first rule among the most restrictive ones (i.e. among the ones
that match the longest text, the one found in first place). Once the
matching expressions have been detected, a tuple made up of the cat-
egory (e.g. “PURCHASE”), the operation (e.g. “+”), and the value
(e.g. “1”) of the consequent is appended to a list of operations.
(b) If their corresponding consequents affect different categories, a tuple
for each category is appended.
Otherwise, i.e. if there is not a matching expression, nothing is appended
to the list.
As misspellings are likely to be found in user-generated content, this match-
ing step is not case-sensitive and does not take into account accent marks.
Therefore, all the words and lemmas contained either in the rules and in
the texts are transformed to lowercase and accent marks are stripped from
them.
4. When all the units of the text have been processed, the list of operations
is computed. First the sum operations are carried out (i.e. the positive
and the negative values are added up) and then the product operations are
applied to the result of that addition (e.g. “* -1” for inverting the value
due to a negation, or “* 2” for doubling the value due to an intensifying
adverb).
5. As a result of that computation, a numeric value is obtained for each cate-
gory contained in the consequents of the rules.
190

In the case of chunk rules (see chunk rule in Listing 8.1), such rules split a text
into the fragments delimited by the linguistic pattern. For example the following
rule “[CC] .” implies than whenever a coordinating conjunction is found within a
text, such text will be divided into two fragments, the one before the coordinating
conjunction, and the one after the coordinating conjunction. Classification rules
will apply to each fragment separately.
8.2 Technique for Detecting Consumer Decision
Journey Stages
In order to achieve one the objectives of this thesis, i.e. to develop a technique for
automatically classifying short user-generated texts into stages of the Consumer
Decision Journey, we have carried out the activities described next.
1. The Data Understanding activity collects a corpus of texts generated by
consumers, creates a gold standard from the gathered corpus and validates
that the gold standard is valid for learning purposes. The instantiation of
this activity for gathering the corpus for the detection of Consumer Decision
Journey stages is explained in Section 8.2.1.
2. The Data Preparation activity covers all the tasks required to construct the
dataset for learning and evaluating the technique, including data cleans-
ing and content normalisation. This activity is common to other content-
analysis techniques, and has been described in Section 8.1.2.
3. The Modelling activity engineers a rule-based model for classifying user-
generated content into Consumer Decision Journey stages. This activity is
explained in Section 8.2.2.
8.2.1 Data Understanding Activity
This activity consists in the ordered execution of the following tasks:
191

1. The Collect Initial Data task consists in gathering the corpus and creating
the gold standard required for learning purposes. This task is described in
Section 8.2.1.1.
2. The Describe Data task consists in performing a description of the format
and volume of the gold standard. This task is described in Section 8.2.1.2.
3. The Explore Data task consists in performing a deeper statistical analysis
of the gold standard from several viewpoints to ensure that it is valid for
modelling purposes. This task is described in Section 8.2.1.3.
4. The Verify Data Quality task consists in examining the quality of the gold
standard by attending to the analyses performed in the previous tasks. This
task is described in Section 8.2.1.4.
8.2.1.1 Collect Initial Data Task
This task applies the approach described in Section 8.1.1 for retrieving textual
contents mentioning commercial brands from different social media, and con-
structs the gold standard required for model creation and evaluation.
In order to identify the linguistic patterns utilised to express the different
stages of the Consumer Decision Journey, and also to carry out the evalua-
tions, this task builds a gold standard by manually annotating a corpus of user-
generated content according to the Consumer Decision Journey stages that can
be derived from such content. To do so, human annotators are asked to tag each
text with just one label following the description provided below.
Awareness. All the texts that refer to advertisement campaigns or opinions
about advertisements are generally expressed in first person. These texts
should contain information about the user’s experience with respect to the
advertisement or the knowledge of the brand. For example92:
I love Ford’s ad
92The examples included in this thesis correspond to individual comments about brands.Therefore, opinions presented in this document do not necessarily correspond to the view ofthe author, neither represent the majority judgements of consumers.
192

Evaluation. All the texts that state interest and/or show an active research
towards the brand or product. For example:
My daughter and I are looking for a Fiat-like van in good condi-
tion
The annotator should also annotate as evaluation all the texts that express
a preference (positive or negative) and that we cannot infer user experience
from them. For instance:
Well, I’d rather fly with Emirates than with Ryanair
Purchase. All the texts that explicitly express the decision to buy are generally
conveyed in first person and in future tenses. Texts that refer to the exact
moment of the purchase also belong to this stage. For example:
The car is in the authorized dealer, I’m buying it tomorrow
Post-purchase. All the texts that explicitly refer to a past purchase and/or an
actual user experience, are generally expressed in first person, in present
as well as in past tenses. Texts that convey the possession or the use of
some product are also annotated as “post-purchase”, although there is no
opinion about it. Some examples:
We went on the Mazda
I bought a 2002 Jaguar two days ago
I’ve been using a pair of Nike for the past two years, and I’m
delighted
However, not all the texts in the corpus clearly pertained to one of the Con-
sumer Decision Journey categories. It was obvious that a great amount of the
texts did not imply user experience, or the stages appeared mixed. Therefore,
we established two other categories under which the human annotators could tag
the texts: ambiguous and no corresponding. The specific instructions to annotate
these kinds of texts are the following:
193

Ambiguous. All the texts where the author recommends or criticises the prod-
uct or brand but they do not imply active evaluation or user experience.
Also, all the texts in which one cannot distinguish if the author is express-
ing a post-purchase experience or an evaluation, or all those texts where
the author explicitly recommends some product or brand. For instance:
I want the Mazda
I love the clothes from Zara
I advise you to buy this Bimbo bread
Ambiguous texts are discarded from the gold standard.
No corresponding. All the texts that contain news headlines or corporative or
informative messages about the brand or product, without user’s opinions or
statements. Also belong to this category all the questions where one cannot
infer user experience, evaluation, or purchase intention, texts that express
user experience, evaluation or purchase intention of a third person, and
texts that imply the sale of the product and do not contain user experience.
Some examples:
Nike opens its first shop in Madrid
My father bought the gasoline 1.6 gls full
Land Rover car year ’99 for sale
In the experiment conducted in this thesis, two experts on marketing an-
notated each text as belonging to one of the four Consumer Decision Journey
stages (i.e. awareness, evaluation, purchase or post-purchase). All the annota-
tions were then checked by one reviewer with social sciences background and by
two reviewers with computational linguistics background. The consensus between
annotators was sought during the execution of this process.
194

8.2.1.2 Describe Data Task
Regarding data format, the dataset used has a structure containing the text
gathered, plus other metadata, and its classification. The data schema –a view of
the Social Graph Ontology with the ontology elements required by this technique–
is shown in Figure 8.5. The classes and properties included in the diagram have
been already described in Chapter 5.
Regarding its volume, the dataset used for modelling and evaluating the tech-
nique for detecting Consumer Decision Journey stages (i.e. the gold standard)
consists in 13,980 opinions written in English and 22,731 opinions written in
Spanish.
The length of the texts ranged from 2 to 194 words. The texts were collected
from five different social media sources (forums, blogs, reviews, social networks,
and microblogs) and refer to different domains: automotive industry, banking,
beverages, sports, telecommunication, food, retail and utilities.
The opinions were selected by looking for a set of 72 particular trademarks of
the different domains (or business sectors).
cd Data Format for the Consumer Decision Journey Identification Technique
sgo:PurchaseStagesgo:hasPurchaseStage
sgo:awareness
sgo:evaluation
sgo:postpurchase
sgo:purchase
0..1 * marl:optinionText (language-annotated)
marl:Opinionsioc:Post
marl:extractedFrom
* *
dcterms:type
sioc:Forum
sioc:has_container
*
*
marl:describesObject
skos:Concept
*
*
(trademark)
isocat:DC-414 isocat:datcat
* *
skos:Concept
sioc:topic
*
*
(domain)
isocat:DC-2212 isocat:datcat
* *
Figure 8.5: Format of the data used by the technique for detecting ConsumerDecision Journey stages
195

8.2.1.3 Explore Data Task
This task characterises the data from different viewpoints to ensure that the gold
standard is richer enough for model learning purposes. Specifically the objective
of this task is to describe the distribution of the data with respect to media
sources, business sectors, and Consumer Decision Journey categories.
Figure 8.6 shows the distribution of the texts along the media sources and
business sectors for which the data used in our experiments were gathered, while
Figure 8.7 shows the distribution of texts along the Consumer Decision Journey
categories.
Automotive Banking Beverages Sports Telecom. Food Retail UtilitiesSocial Networks 678 122 746 778 809 0 248 9Reviews 420 647 7 351 661 0 170 0Microblogs 2488 2165 6792 2671 1940 3876 3140 1871Blogs 219 608 768 498 553 371 110 55Forums 673 652 54 731 720 23 72 5
0
1000
2000
3000
4000
5000
6000
7000
8000
9000
Figure 8.6: Distribution of the texts along the media sources and sectors for theConsumer Decision Journey gold standard
196

Automotive Banking Beverages Sports Telecom. Food Retail UtilitiesPostpurchase 474 411 327 886 1395 340 569 411Purchase 55 12 53 113 66 34 242 167Evaluation 125 42 29 116 82 49 99 39Awareness 195 146 514 138 182 293 89 60
0
200
400
600
800
1000
1200
1400
1600
1800
Figure 8.7: Distribution of the texts along the Consumer Decision Journey cate-gories
8.2.1.4 Verify Data Quality Task
This task examines the quality of the data, ensuring that the gold standard is
valid enough for modelling the classifier.
Thanks to the variety of sectors selected, it was possible to have a cross-
domain and cross-source perspective, being able to carry out generalisations on
the linguistic rules proposed and studying the relation among different stages,
product typology and number of texts produced.
All the texts of the corpus were written by users of different sites and social
media, thus we found a lot of grammatical errors and misspellings that supposed
additional difficulties to pattern identification. Moreover, all the texts were in En-
glish and Spanish but with different geographical language varieties in both cases
(e.g. American Spanish, European Spanish, American English, British English),
thus some lexical units were especially hard to detect.
We observed that there is a general tendency to comment or analyse the qual-
ity and features of expensive or high involvement products while cheaper ones
197
received much less feedback. Particularly, in the case of cars, mobile providers or
sportive clothes and shoes (sectors Automotive Industry, Telecommunication, and
Sports, respectively), we appreciated that customers tend to write more evalua-
tive texts, investigating the pros and cons of different brands before buying them.
Users are also inclined to comment their personal experiences with the product
after using it. Accordingly, it is more difficult to find evaluative messages about
consumer-packaged goods such as beverages or food whose cost is typically much
lower. In these cases, consumers require less deliberation, show less involvement,
and they usually do not compare these products with their competitors before
purchasing them. However, in the case of cheaper products, consumers tend to
pay much more attention to the advertising campaigns (awareness). Correspond-
ingly, the number of comments about their post-purchase experience is also lower
in this kind of products.
As it can be seen in Figure 8.7, the number of texts per category is un-
balanced along the different stages of the Consumer Decision Journey for the
different business sectors. Despite these differences across domains, we consider
the corpus varied enough for learning and evaluating the technique for identifying
Consumer Decision Journey stages, since it consists in an random sample of the
posts produced for the domains being monitored, and the overall volume of texts
for each stage is adequate for learning and evaluation purposes.
In order to estimate how reliable the annotation was, an excerpt of the classi-
fied corpus (1,000 texts) along with the annotation criteria were given to a group
of annotators through the Amazon Mechanical Turk93 annotation services (see
question 3 in Figure 8.8 for an example). Each text was classified by two differ-
ent anonymous human annotators and compared against the annotation in the
gold standard. To measure the inter-annotator agreement we chose Fleiss’ kappa
metric [Fleiss, 1973], which takes the value of 1 for a perfect matching between
the annotators and 0 (or a negative number) if the matching is the same as (or
worse than) expected. In our case, the value for this metric was 0,503, which is
generally regarded as a moderate value.
93http://www.mturk.com
198

Figure 8.8: Example annotation of a post according to a Consumer DecisionJourney category using Amazon Mechanical Turk
199

8.2.2 Modelling Activity
The goal of this activity is to develop an automatic classifier for identifying Con-
sumer Decision Journey stages within user-generated content. This activity con-
sists in the ordered execution of the following tasks.
1. The Select Modelling Technique task consists in selecting an describing a
modelling technique for being applied for identifying Consumer Decision
Journey stages from user-generated content.
2. The Build Model task consists in implementing a rule set against which the
posts will be matched in order to identify the Consumer Decision Journey
stages.
Next, each of these tasks are described.
8.2.2.1 Select Modelling Technique Task
The goal of this technique is to perform a classification of an arbitrary content
into zero or one Consumer Decision Journey stages. For doing so, this technique
relies on the rule-based modelling technique described in Section 8.1.3.
Therefore, the resulting classifier matches the textual content received against
a rule set, outputting a set of numeric values associated to each of the four
categories, meaning a value distinct from zero that the post is classified according
to its corresponding Consumer Decision Journey stage.
As described in Section 8.1.3, the selected rule-based classification technique
may output several candidate classification categories. However, as the output of
the Consumer Decision Journey classifier must consist on a unique category, the
following heuristic is executed after rule matching:
(a) If the text is classified into one Consumer Decision Journey stage (i.e. only
one category has a value distinct from zero), then the classifier outputs such
category.
(b) If the text is classified into more than one Consumer Decision stage (i.e.
more than one category has a value distinct from zero), then the one that
200

corresponds to the latest stage in the Consumer Decision Journey workflow
(shown in Figure 2.6) is selected, discarding the rest of the classifications.
(c) If the text cannot be classified into any of the stages (i.e. all the categories
have a zero value associated), then the classifier finishes without returning a
classification.
8.2.2.2 Build Model Task
This task consists in the development of the rule set capable of recognising frag-
ments of text from which a stage of the Consumer Decision Journey can be
derived, therefore classifying the social media posts which embed such fragments
of text according to the stage detected.
Although this task has been mainly executed by researchers of the group Tech-
nologies of Language Resources (TRL) of the Institut Universitari de Linguıstica
Aplicada of the Universitat Pompeu Fabra94, we include its description in this
thesis for self-containment purposes. The result of the joint work regarding the
identification of Consumer Decision Journey stages in user-generated content has
been published by Vazquez et al. [2014].
A set of linguistic patterns was compiled by studying the gold standard in
order to distinguish among the different stages of the Consumer Decision Journey.
The developed classifier was based on the recognition of these particular linguistic
expressions.
Linguistic rules were built as to match the occurrence of a lemma and its syn-
onyms or antonyms (to increase recall); the particular context where they could
occur is used as a restriction. The description of the context includes morphosyn-
tactic information as obtained with the tagger. The inclusion of morphosyntactic
information allows to differentiate, for example, between “I bought” that is an
expression related to postpurchase and “I’m buying” related to purchase.
Some examples of linguistic patterns for matching Consumer Decision Journey
stages are given in Table 8.1. For example, the first pattern matches the gerund
form of the verb “to laugh”, followed by a preposition (any), the word “a” and
the lemma “commercial” at a maximum distance of one word.
94http://www.iula.upf.edu/trl/rpresuk.htm
201

Language Linguistic Pattern CDJ Stage
English
laugh#VBG [IN] “a” /1/ commercial Awarenesswonder if ENTITY [MD] offer Evaluationi “will” buy Purchasei call#VBD /1/ customer service Postpurchase
Spanish
[PP1] [VA] gustar [DI] vıdeo Awarenessestar#V IP1 buscar#V G Evaluationir#V I 1S “a” pillar [D] Purchase[PP1] quedar#V I 1 con ENTITY Postpurchase
Table 8.1: Examples of the linguistic patterns for identifying Consumer DecisionJourney stages
In the development of these linguistic patterns, we started by looking for the
most frequent content words, bigrams and trigrams in the texts of each stage try-
ing to relate them to just one of the phases, but the results were not satisfactory.
On the one hand, the most frequent bigrams and trigrams did not help to clearly
identify any specific stage. On the other hand, content words used individually
allowed us to identify some portions of texts as belonging to one of the stages of
the Consumer Decision Journey, but the recall and precision were very low.
Therefore, we decided to use these lexical elements (i.e. the most frequent
content words) as starting point to build sets of more restrictive rules that in-
cluded morphosyntactic features, functional words, and synonyms and antonyms.
The inclusion of morphosyntactic tags allowed us to easily differentiate, for ex-
ample, between “I bought” used in postpurchase experience and “I will buy” that
classifies into the purchase stage. The introduction of functional words permitted
us to identify more complex expressions, as for example, “I’m going to buy” or
“thinking of buying something”. Finally, with the use of synonyms, antonyms and
other meaning-related words, we could increase the recall of our system.
In order to identify the morphological variations of the tokens, we used the
lemmas of the most frequent words (if we needed the exact word we put inverted
commas round it). This avoided us to create a pattern for each form of the word.
Additionally, we added morphosyntactic tags to specify what tense of the verb
or what morphological element we wanted to identify. Different heuristics for
engineering the rules for every stage are discussed next.
202

Identifying Awareness. As commented in previous sections, in the texts be-
longing to the awareness stage authors tend to comment, criticise or talk
about their experience with respect to specific advertising campaigns or
promotions of the selected product or brand. Therefore, the rules that we
created to identify sentences pertaining to this stage (996 for English and 65
for Spanish) mostly rely on particular lexical items belonging to the adver-
tisement word family. Some examples are: “advertisement”, “campaign”,
“promotion”, “video”, “sign”, etc. In the initial analysis of this kind of
texts, we created more restrictive rules, matching longer portions of text,
however further analysis of the classifier results showed that, when using
more lexicalised and less restrictive rules (with a small set of part-of-speech
tags and functional words), the final results of the classifier were equal or
even better.
Identifying Evaluation. Rules designed to identify evaluative texts (440 for
English and 167 for Spanish) showed more complexity than those created
to distinguish awareness. For this Consumer Decision Journey stage, rules
are longer and contain more morphosyntactic information, although the
weight of the lexical elements continues to be high. Generally, the rules of
this class are more restrictive than those for awareness.
Since in this step the user tends to compare products or brands, a great
amount of the rules identify comparative constructions. For example: “all
the best /1/” or “more [AQ] than”.
There are also rules which incorporate specific vocabulary usually used to
convey preference or comparisons such as “stand out”, “prefer”, “recom-
mend” and “suggest”.
Identifying Purchase. For this stage we defined 1,267 rules for English and
906 rules for Spanish. Generally, users tend to write a lot of comments
before and after purchasing some product but the number of remarks about
the specific moment of the transaction is low. Additionally, the number of
different ways to express this specific stage is also shorter with respect to
other stages. We identified a set of verbs, generally expressed in future
203

tenses, whose meaning is related to “buy” or imply a purchase: “acquire”,
“hunt down”, “reserve”, “try”, “grab”, etc.
Identifying Postpurchase Experience. This is the stage with the most com-
plex rules (710 for English and 769 for Spanish). We found that there is
a strong relation between the type of product and the linguistic expres-
sion of the postpurchase experience, being ambiguous in many of the cases.
In consequence, for this stage, we decided to build rules with a consider-
able amount of morphosyntactic information (to consider past tenses of the
verbs, for example) and lexical elements related to postpurchase customer
services (e.g. “complaint”, “unsubscribe”).
The rules have been defined for being used within the technique described in
Section 8.1.3, thus expressed according to the grammar shown in Listing 8.1. The
objective of the classifier is to obtain the Consumer Decision Journey category
according to which a social media post can be classified. Therefore all the rules
consist on a linguistic pattern to be matched and a classification action oriented
to make the numeric value associated to a category distinct from zero whenever
the linguistic pattern is matched, meaning that a text could be classified in a
given Consumer Decision Journey stage. Therefore, from all the possible numeric
operations that can be modelled with the rules grammar, this task only make
use of addition operations, specifically adding one unit to the category for which
a pattern has been matched. An example of a linguistic rule obtained by this
activity is shown next.
about [TO] get /2/ tablet → PURCHASE + 1
204

8.3 Technique for Detecting Marketing Mix At-
tributes
In order to achieve one objective of our research, i.e. to develop a technique for
automatically classifying short user-generated texts into one or more the Mar-
keting Mix categories, we have carried out the same activities as in the previous
technique (Data Understanding, Data Preparation, and Data Modelling), which
are described next.
8.3.1 Data Understanding Activity
As in the previous technique, this activity consists in the ordered execution of the
tasks Collect Initial Data, Describe Data, Explore Data and Verify Data Quality,
which are described next.
8.3.1.1 Collect Initial Data Task
This task applies the approach described in Section 8.1.1 for retrieving textual
contents mentioning commercial brands from different social media and constructs
the gold standard required for model creation and evaluation.
After retrieving the corpus, this task generates the gold standard used for
modelling and evaluating the Marketing Mix classifier. For doing so, human
annotators are asked to tag each text according to the following instructions:
Quality. All the texts that refer to the quality, performance, or positive or nega-
tive characteristics of a product that affect its user experience. For example:
Converse are extremely uncomfortable from the moment you put
them on
Design. All the texts that include a reference about specific traits or features of
the product such as size, colour, packaging, presentation, and styling. For
example:
Anybody notices the car? GQ’s design collaboration with Citroen
205

Customer Service. All the texts that refer to the responsiveness and service
given by companies to customers in every stage of the Consumer Decision
Journey. Also texts that refer to technical and post-purchase support to
current and prospective customers. For example:
@MissTtheTeacher hiya, nope, I’m not through there. I’ve been
on at that Scottish Power mob for weeks. Their customer service
is laughable
Point of Sale. All the texts that include a mention to the physical place where
the product can be found and purchased. Similarly, texts that convey dif-
ficulty with finding the product in the right distribution channels such as
supermarkets, stores, outlets, dealerships, and stations. For example:
About to spend mad money at this Nike store!
Promotion. All the texts that refer to marketing strategies oriented to increase
demand such as contests, freebies, coupons, competitions, discounts, gifts,
and offers. For example:
@Jennorocks lego promotion on at Shell garages :)
Price. Texts that refer to the cost, value or price of the product. It may also
comprise texts that refer to specific price promotion such as discounts and
price cut, in which case the text should be annotated as Price and also as
Promotion. This category also includes texts with numerical references to
product prices. Some examples:
This Volkswagen I got my eye on is so sexy & it’s an affordable
price
@carllongs on lighter hearted note soreen on offer at tesco! 80p
£1.47 and four slices have holes in them?! What on earth war-
burtons http://t.co/S9jSKS3LMo
206

Sponsorship. Texts that refer to awards, competitions, teams, foundations, per-
sons, charity fundraising, concerts and alike events which are organised, en-
dorsed or financially supported by the company or brand. Some examples:
Breaking News Sainsbury’s becomes title sponsor of the first Sport
Relief Games
School event this morning was sponsored by Scottish Power. Think-
ing of charging an extra 10% without telling them
Advertisement. All the texts that include a reference to public, paid brand
announcements or messages broadcasted in the media or placed in outdoor
settings. Some examples:
These tv adverts are great aren’t they, Rory “interestin” McIlroy
on Santander, and best of of all Kerry Katona on pay day loans,
priceless!
The lidl ad on Rte Two just now had delicious written on the
screen. Surely its delicious? or is it subliminal advertising. #lidl
As in the previous technique, two experts on marketing annotated each text
as belonging to one or more Marketing Mix elements (i.e. quality, design, point
of sale, customer service, sponsorship, advertisement, promotion and price), and
the annotations were then checked by one reviewer with social sciences back-
ground and by two reviewers with computational linguistics background, seeking
consensus between annotators and reviewers.
8.3.1.2 Describe Data Task
Regarding data format, the data schema used by this technique is analogous to
the one used in the previous technique, but including Marketing Mix annotations
instead of Consumer Decision Journey ones (see Figure 8.9.).
The opinions used by the experiment conducted in this thesis were the same as
the one used for the technique for detecting Consumer Decision Journey stages.
Therefore, its characteristics regarding volume are the ones described in Sec-
tion 8.2.1.2.
207

cd Data Format for the Marketing Mix Identification Technique
sgo:hasMarketingMixAttribute
* * marl:optinionText (language-annotated)
marl:Opinionsioc:Post
marl:extractedFrom
* *
dcterms:type
sioc:Forum
sioc:has_container
*
*
marl:describesObject
skos:Concept
*
*
(trademark)
isocat:DC-414 isocat:datcat
* *
skos:Concept
sioc:topic
*
*
(domain)
isocat:DC-2212 isocat:datcat
* *
sgo:MarketingMixAttribute
sgo:pointOfSalesgo:advertisement
sgo:design
sgo:price sgo:promotion
sgo:quality
sgo:sponsorship sgo:customerService
Figure 8.9: Format of the data used by the technique for detecting MarketingMix attributes
8.3.1.3 Explore Data Task
As the corpus used for learning the classifier used by this technique and evaluating
it is the same used for the technique for identifying Consumer Decision Journey
stages in user-generated content, its distribution across social media sources and
business sectors is the same (i.e. the one shown in Figure 8.6).
8.3.1.4 Verify Data Quality Task
In the construction of the corpus we could observe the difficulty of filtering texts
by their belonging to one of the Marketing Mix categories; the great majority
of the texts are irrelevant for our classification given that just a small group of
them implies Marketing Mix elements (25% of the corpus). Nevertheless, we
consider the corpus varied enough for learning and evaluating this technique,
since it consists in an random sample of the posts produced for the domains
being monitored and the overall volume of texts for each stage is adequate for
learning and evaluation purposes.
As in the previous technique we used Amazon Mechanical Turk for estimating
annotation reliability (see question 2 in Figure 8.10 for an example). The value
for Fleiss’ kappa was 0,397, which is generally regarded as a fair value.
208

Figure 8.10: Example annotation of a post according to a Marketing Mix Cate-gory using Amazon Mechanical Turk
209

8.3.2 Modelling Activity
The goal of this activity is to develop an automatic classifier for identifying Mar-
keting Mix attributes within user-generated content. This activity consists in the
ordered execution of the following tasks.
1. The Select Modelling Technique task consists in selecting and describing a
modelling technique for being applied for identifying Marketing Mix At-
tributes from user-generated content.
2. The Build Model task consists in implementing a machine-learning classifier
identifies the Marketing Mix attributes.
Next, each of these tasks are described.
8.3.2.1 Select Modelling Technique Task
In order to automate the classification of texts based on the Marketing Mix
elements conveyed in them, this technique makes use of the Decision Tree (DT)
modelling technique defined by Quinlan [1993].
Specifically one binary classifier per Marketing Mix category is trained. Each
binary classifier determines whether the post belongs or not to a given Marketing
Mix category. Therefore, the classification for each category is made between the
positive class (for example, Advertisement) and the negative class (for example,
No Advertisement).
As a given text can belong to more than one category due to the use of mul-
tiple binary classifiers, we built a multi-category classifier that combines all the
binary classifiers in a process that iteratively identifies the set of Marketing Mix
attributes expressed in each text, returning the set of Marketing Mix attributes
for which its corresponding binary classifiers outputted a positive class.
We also tried to use classifiers based on the Logistic Regression model [le Cessie
and van Houwelingen, 1992] but the results were better with the DT classifiers in
terms of precision and recall. Additionally, DT shows relevant features for clas-
sification and therefore, is easily interpretable by humans. This fact made the
results of these classifiers very useful for final visualisation and human consump-
tion purposes. In order to create real-life applications in the marketing field, this
210

is a very important feature, being able to visually show consumers of marketing
agencies the criteria followed for text classification. Moreover, the DT model can
also be manually revised in order to remove terms that can appear as relevant
features due to biased samples. For example, “trainer” appeared as one of the
discriminative features to decide if a text belongs to the “design” category for the
sports domain. With the direct visualisation we could identify and eliminate it.
8.3.2.2 Build Model Task
This task consists in applying a machine-learning technique for learning the auto-
matic classifier for identifying Marketing Mix attributes in the content generated
by consumers. For doing so, the task executes the following steps:
1. Build Learning Datasets. This step constructs individual learning datasets
for each Marketing Mix category, as each individual classifier is trained with
its own corpus containing positive and negative examples for a given cate-
gory.
In the experiment conducted in this thesis, we built a dataset with all
the texts manually annotated as belonging to a given category (advertis-
ing, customer service, design, point of sale, price, promotion, quality, and
sponsorship) as positive examples. For each category, we also utilised all
the texts that do not belong to that given category as negative examples.
The size of the datasets ranged between 85 and 1046 texts for the positive
examples.
2. Part-Of-Speech Tagging. This step consists in tokenising, lemmatising
and annotating the texts with their corresponding part-of-speech tags, as
described in Section 2.6.1.
In our experiments, for executing this step we made use of Freeling.
3. Filter Stop-Words. This step consists in removing a list of stop-words
from the list of tuples outputted by the previous task, by attending to
their lemmas and part-of-speech tags. Such stop-words include not only
functional words but also brands and proper nouns.
211
The output of this task consists only of the lemmas of adjectives, verbs
(with the exception of auxiliary verbs) and common nouns, considering the
rest of categories irrelevant or less important for the identification of the
Marketing Mix attributes.
4. Features Vector Construction. This step receives the filtered output of
the previous task and generates a vector of features.
We adopted a bag-of-words approach where words occurring in texts are
used as features of a vector. Thus, each text is represented as the occurrence
(or frequency) of words in it. This approach embodies the intuition that
the more frequent the word is in the texts of the class (i.e. Marketing Mix
element selected), the more representative it is of the content and therefore
of the class.
5. Features Selection. This step applies a chi-square feature selection method
in order to reduce vector dimensions by selecting the more relevant features.
The idea behind this feature selection method is that the most relevant
words to distinguish positive examples are those that are distributed most
differently in the positive and negative class examples.
6. Model Training. This step uses the vectors previously created for learning
a set of C4.5 [Quinlan, 1993] decision tree classifiers as implemented in Weka
[Hall et al., 2009].
The results for the negative class are generally much better than those
obtained for the positive class due to the larger number of texts of the
negative class used to train the classifiers. However, as the main objective of
our work is being able to introduce this tool in a real marketing scenario, we
find that it is preferable to classify a text in a negative class if the classifier
does not find enough cues than to erroneously classify it in a positive class.
8.4 Technique for Detecting Emotions
In order to achieve one objective of this thesis, i.e. to develop a technique for
automatically classifying short user-generated texts into one or more emotions,
212

we have carried out the same activities as in the previous techniques, which are
described next.
8.4.1 Data Understanding Activity
This activity consists in the ordered execution of the same tasks that were exe-
cuted for the previous techniques. These tasks are explained next.
8.4.1.1 Collect Initial Data Task
This task applies the approach described in Section 8.1.1 for retrieving textual
contents mentioning commercial brands from different social media, and con-
structs the gold standard required for model creation and evaluation. In this
task several people participated with different background knowledge.
The gold standard is created by annotating the corpus gathered according to
the conceptual framework defined in Section 2.5.3. Annotators were asked to tag
each text with zero or more labels. In order to understand the sentiments involved
in each category —and to help to annotate the corpus—, we have specified the
secondary sentiments related to each of them. The set of sentiments is based on
a reformulation of Richins [1997] and Shaver et al. [1987]; there is a list of them
for each sense within a category (see Table 8.2).
In the experiment conducted in this thesis we gathered a corpus of posts
written in Spanish about several commercial brands from various social media
and different business/market domains. The manual annotation of the texts was
carried out first by a person who annotated the resulting corpus of the Data Gath-
ering Activity according to the conceptual framework of emotions/sentiments (see
Section 2.5.3). This person followed some specific guidelines (e.g. if a secondary
sentiment in Table 8.2 was identified for a text, then it was classified under its
corresponding basic sentiment). This annotation process was supervised by two
more persons, who examined the annotations and discussed them with the anno-
tator in case of disagreement. They came from different backgrounds, though in
close relation to the project field: the annotator had an advertising and public
relations background, one of the reviewers was an expert in social sciences and
the other one was from the computational side.
213

Primary Secondary Sentiments
Trust - Optimism, Hope, Security
Satisfaction - Fulfilment, Contentment
Happiness- Joy, Gladness, Enjoyment, Delight, Amusement- Joviality, Enthusiasm, Jubilation- Pride, Triumph
Love - Passion, Excitement, Euphoria, Ecstasy
Fear- Nervousness, Alarm, Anxiety, Tenseness, Apprehension, Worry- Shock, Fright, Terror, Panic, Hysteria, Mortification
Dissatisfaction- Dislike, Rejection, Revulsion, Disgust- Irritation, Aggravation, Exasperation, Frustration, Annoyance
Sadness
- Depression, Defeat, Unhappiness, Anguish, Sorrow, Agony- Melancholy- Disappointment, Hopelessness, Dejection- Shame, Humiliation, Guilt, Regret, Remorse- Alienation, Isolation, Loneliness, Insecurity
Hate- Rage, Fury, Wrath, Hostility, Ferocity- Bitterness, Resentment, Spite, Contempt, Vengefulness- Envy, Jealously
Table 8.2: Primary and secondary sentiments
8.4.1.2 Describe Data Task
Regarding data format, the data schema used by this technique (see Figure 8.11)
is analogous to the one used in the previous techniques, but including emotion
annotations instead of Consumer Decision Journey or Marketing Mix ones.
Regarding volume and other gross attributes of the texts gathered, the corpus
we have used in our experiments is made up of 26,505 texts (709,095 words) in
Spanish taken from different channels including blogs, forums, microblogs (specif-
ically, from Twitter), product review sites, and social networks (specifically, from
Facebook). These texts are related to several brands belonging to nine busi-
ness sectors. Their choice is based on their relevance for the media agency that
participated in this work, Havas Media Group95, and on the number of opin-
ions that they generate according to their social media monitoring tools. These
domains also constitute a representative set of both, low-involvement and high-
involvement products —i.e. products which are bought frequently and with a
95http://www.havasmg.com
214

cd Data Format for the Emotions Identification Technique
* * marl:optinionText (language-annotated)
marl:Opinionsioc:Post
marl:extractedFrom
* *
dcterms:type
sioc:Forum
sioc:has_container
*
*
marl:describesObject
skos:Concept
*
*
(trademark)
isocat:DC-414 isocat:datcat
* *
skos:Concept
sioc:topic
*
*
(domain)
isocat:DC-2212 isocat:datcat
* *
onyx:EmotionCategory
sgo:fearsgo:trust
sgo:satisfaction
sgo:happiness sgo:sadness
sgo:dissatisfaction
sgo:love sgo:hate
onyx:hasEmotionCategory
Figure 8.11: Format of the data used by the technique for detecting emotions
Social Media Type Distribution of textsBlogs 19%Forums 18%Forums 39%Review sites 10%Social Networks 14%
Table 8.3: Distribution of texts for the sentiment corpus by social media type
minimum of thought and effort (e.g. soft drinks) and products for which the
buyer is prepared to spend considerable time and effort (e.g. cars)—, as well as
of products with different cost.
8.4.1.3 Explore Data Task
This task characterises the data from different viewpoints to ensure that the gold
standard is richer enough for model learning purposes. Specifically the objective
of this task is to describe the distribution of the data with respect to media
sources, business sectors, and emotion categories.
The distributions of the texts in the gold standard by social media type and
by business sector are shown in tables 8.3 and 8.4 respectively.
According to the resulting annotation, only 27% of the texts could be said to
express a sentiment (14% expressed satisfaction, 13% expressed dissatisfaction,
215

Domain Number of brands Distribution of texts
Foods 4 7%
Automotive industry 10 10%
Financial services 10 11%
Drinks 3 24%
Cosmetics 6 7%
Sports 2 12%
Insurance companies 12 11%
Telecommunication services 11 10%
Tourism 7 8%
Table 8.4: Distribution of texts for the sentiment corpus by domain
1% expressed trust, 1% expressed fear, 1% expressed happiness, 0.5% expressed
sadness, 2% expressed love, and 3% expressed hate)96. The remaining 73% was
annotated as neutral regarding sentiments.
8.4.1.4 Verify Data Quality Task
An excerpt of the classified corpus (300 texts) along with the annotation criteria
was given to a new annotator. This allowed us to estimate how reliable the
manual annotation was. To measure the inter-annotator agreement we chose
Cohen’s kappa metric [Cohen, 1960], which takes the value of 1 for a perfect
matching between annotators and 0 (or a negative number) if the matching is
the same as (or worse than) expected. In our case, the value for this metric was
0,511, which is generally regarded as a moderate value.
Additionally, another excerpt of the classified corpus (1,000 texts) along with
the annotation criteria were given to a group of annotators through the Amazon
Mechanical Turk annotation services (see question 1 in Figure 8.12), as we did
in the previous techniques. Each text was classified by two different anonymous
human annotators and compared against the annotation in the gold standard.
To measure the inter-annotator agreement we chose Fleiss’ kappa metric (while
Cohen’s metric evaluates the agreement between two annotators, Fleiss’ metric
let us evaluate the agreement for more annotators). The value for this metric was
0,415, which is also regarded as a moderate value.
96The reason why the addition of these percentages is over 27% is the subsumption by SD.
216
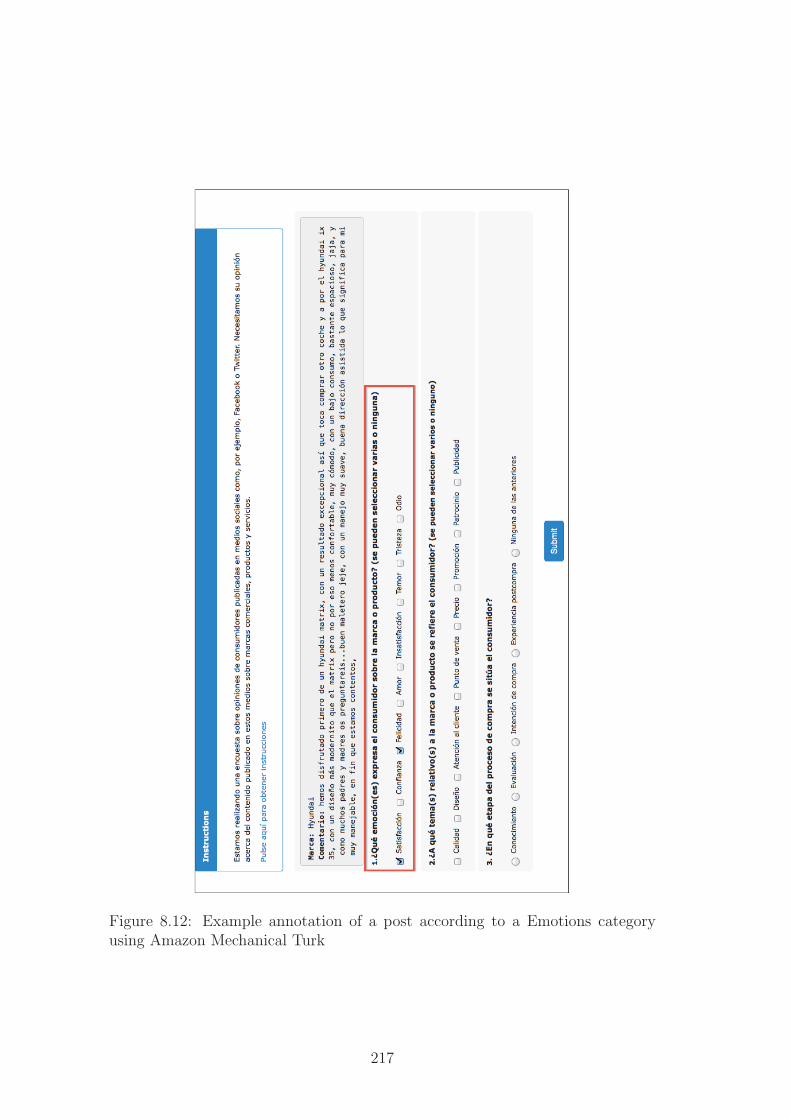
Figure 8.12: Example annotation of a post according to a Emotions categoryusing Amazon Mechanical Turk
217

8.4.2 Modelling Activity
The goal of this activity is to develop an automatic classifier for identifying emo-
tions within user-generated content. This activity consists in the ordered execu-
tion of the following tasks.
1. The Select Modelling Technique task consists in selecting an describing a
modelling technique for being applied for identifying emotions within user-
generated content.
2. The Generate Test Design task consists in generating a mechanism to test
the model for quality and validity.
3. The Build Model task consists in implementing a rule set against which the
posts will be matched in order to identify the emotion categories.
Next, each of these tasks are described.
8.4.2.1 Select Modelling Technique Task
The goal of this technique is to perform a classification of an arbitrary content
into zero or more emotion categories. For doing so, this technique relies on the
rule-based modelling technique described in Section 8.1.3.
Therefore the resulting classifier matches the textual content received against
a rule set, outputting a set of numeric values associated to each of the four
sentiment polarities, meaning a value greater than zero that the post is classified
in the positive category corresponding to a given polarity, and a value lower than
zero that the post is classified in the negative category for a given polarity.
Then, the numerical values are discretised to obtain the specific sentiment
categories in which the text has been classified, i.e. a positive value corresponds
to the positive emotion of a category and a negative value to the negative one
(see Table 2.4). If the value of a category is 0, the text is neutral with respect to
that category.
218

Domain Number of texts inthe training set
Number of texts inthe evaluation set
Foods 592 995
Automotive industry 86 2,657
Financial services 411 1,214
Drinks 284 2,106
Cosmetics 572 828
Sports 451 2,892
Insurance companies 334 1,050
Telecommunication services 460 2,601
Tourism 408 999
Table 8.5: Distribution of texts for the sentiment corpus for the training and testsets by domain
8.4.2.2 Generate Test Design Task
In the experiment performed in this thesis the annotated corpus was used to train
and evaluate the system. The training set used to create the rules contained a
sample of 80% of the texts annotated with a sentiment in the corpus (i.e. 13%
of the whole corpus), while the evaluation set contained a sample of 58% of the
corpus; both samples were made up of randomly-chosen texts. Table 8.5 shows the
number of texts collected for each domain, the number of brands that have been
monitored for each domain, and the number of texts that have been considered
in the training and evaluation sets.
Finally, the quality measures used for evaluating the classifier are the ones
described in the evaluation section (see Section 8.7.2.3).
8.4.2.3 Build Model Task
The goal of this task is to learn a classifier for analysing the sentiment of user-
generated content. For doing so, this task engineers a rule capable of recognising
fragments of text from which a consumer emotion can be derived, therefore clas-
sifying the social media posts which embed such fragments of text according to
the emotion detected.
This task has been mainly executed by a team of the Ontology Engineering
219

Group of the Universidad Politecnica de Madrid97, in which the author of this
thesis was not involved. However, the description of this task is included for self-
containment purposes. The result of the joint work regarding the identification of
Consumer Decision Journey stages in user-generated content has been published
by Aguado de Cea et al. [2014].
The classification rules were compiled by studying the gold standard, as well as
by reusing two existing linguistic resources: Badele3000 [Bernardos and Barrios,
2008] and Calıope [Aguado de Cea and Bernardos, 2007]. Such resources are
described next.
Badele3000. Badele3000 is a domain independent lexical-semantic database
with information about the 3,300 most frequent nouns in Spanish. The
theoretical linguistic foundation of this resource is the Meaning-Text The-
ory (MTT) [Mel’cuk, 1996], specially the concept of Lexical Function (LF),
which relates two lexical units (the base and a certain value of the LF for
that base) accounting for the paradigmatic relations and the syntagmatic
relations (or collocations98) between those lexical units.
For example, if the base is “rain”, the relation of intensification is expressed
by “heavy”, i.e. its magnified (intensified) form is Magn(rain) = heavy,
while the magnified value of “wind” is Magn(wind) = strong. These data
let us know that rain goes with “heavy” but wind goes with “strong” and
that these are typical collocations of the English language to express that
rain and wind are intense.
The database contains more than 20,000 linguistic collocations. Addition-
ally, lexical units are organised in a hierarchical structure in which each
lexical unit is classified according to a semantic label (SL) hierarchy, which
usually corresponds to the hyperonym or immediate generic term. A lexical
unit ‘inherits’ the values of the LF’s defined for the SL under which it is
classified.
Regarding those lexical units corresponding to sentiments, in Badele3000
97http://www.oeg-upm.net98A collocation is a partly or fully fixed sequence of words established through repeated use.
220
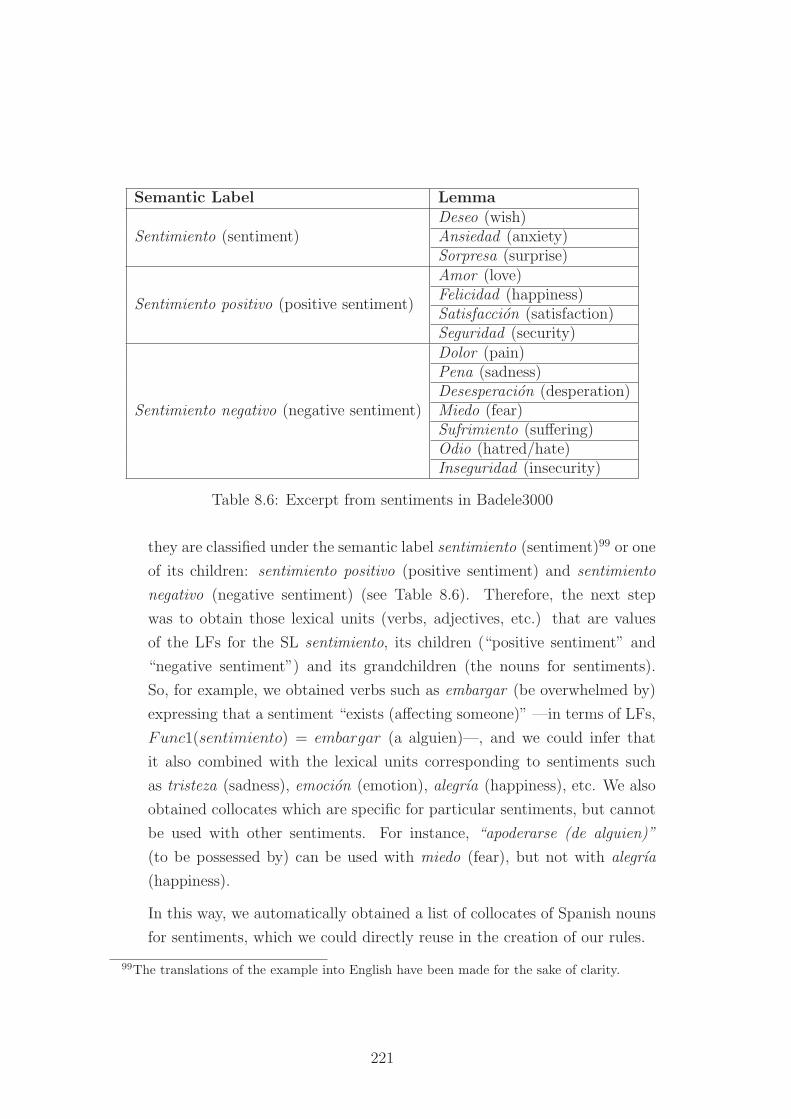
Semantic Label Lemma
Sentimiento (sentiment)Deseo (wish)Ansiedad (anxiety)Sorpresa (surprise)
Sentimiento positivo (positive sentiment)
Amor (love)Felicidad (happiness)Satisfaccion (satisfaction)Seguridad (security)
Sentimiento negativo (negative sentiment)
Dolor (pain)Pena (sadness)Desesperacion (desperation)Miedo (fear)Sufrimiento (suffering)Odio (hatred/hate)Inseguridad (insecurity)
Table 8.6: Excerpt from sentiments in Badele3000
they are classified under the semantic label sentimiento (sentiment)99 or one
of its children: sentimiento positivo (positive sentiment) and sentimiento
negativo (negative sentiment) (see Table 8.6). Therefore, the next step
was to obtain those lexical units (verbs, adjectives, etc.) that are values
of the LFs for the SL sentimiento, its children (“positive sentiment” and
“negative sentiment”) and its grandchildren (the nouns for sentiments).
So, for example, we obtained verbs such as embargar (be overwhelmed by)
expressing that a sentiment “exists (affecting someone)” —in terms of LFs,
Func1(sentimiento) = embargar (a alguien)—, and we could infer that
it also combined with the lexical units corresponding to sentiments such
as tristeza (sadness), emocion (emotion), alegrıa (happiness), etc. We also
obtained collocates which are specific for particular sentiments, but cannot
be used with other sentiments. For instance, “apoderarse (de alguien)”
(to be possessed by) can be used with miedo (fear), but not with alegrıa
(happiness).
In this way, we automatically obtained a list of collocates of Spanish nouns
for sentiments, which we could directly reuse in the creation of our rules.
99The translations of the example into English have been made for the sake of clarity.
221

Calıope. Calıope is a web application designed to help learning contextualised
terms in English and Spanish by, first, providing examples of their use in
context and, second, by showing the lexical-semantic relationships among
them. For these purposes, it manages two resources: a corpus for Spanish
and another one for English; as well as a glossary of terms for both lan-
guages. Among all Caliope’s functionalities, the ones that are noteworthy
for our work are the following:
• Addition of new texts to the corpus. This allowed us to include our
corpus in Calıope, what facilitated the retrieval of the vocabulary on
sentiments.
• Filtering of texts. This let us choose the texts we wanted to analyse.
• Frequency of words. This facility and the part-of-speech annotation
helped us to establish the most relevant words by grammatical cate-
gory. We used this result as one of the starting points for creating the
rules.
• Concordances of a term —i.e. occurrences of a term in the texts— and
co-occurrences of several terms (which are not necessarily adjacent).
These functionalities provided us with the contexts of the terms we
needed to examine in order to draw patterns/templates for the an-
tecedents of our rules.
The training set analysed to create the rules contained a randomly chosen
sample of 80% of the texts annotated with a sentiment in the corpus (i.e. 13%
of the gold standard). However, as explained before, the annotated corpus was
not the only source used to create the rules; they were also based on the set of
collocations of common sentiments obtained from Badele3000 and on the semantic
relations (reflected by the LF’s) existing between them. This information was very
valuable because it helped us to derive expressions in the antecedents of the rules
and the sentiment category in their corresponding consequents.
Table 8.7 shows some rules created for the Love-Hate (LH ) polarity. They
were written after having analysed the concordances of “odio” (hate/hatred),
found in the corpus via Caliope, and its collocations, retrieved from Badele3000
(see Table 8.8).
222

Meaning in Spanish Meaning in English Rulesmi/este odio a/pormarca
my/this hatred again-st/for brand
[D] odio#NC [SP] ENTITY → LH - 1
siento odio a/por marca I feel hatred againstbrand
sentir#V odio#NC [SP] ENTITY → LH - 1
(como/cada dıa) odio(mas) a (el/la/esta/...)marca
I feel an increasing/-growing hatred again-st/for brandWhat a hatred I feelagainst/for brand
odiar#V a#SP /1/ ENTITY → LH - 1odiar#V mas#RG a#SP /1/ ENTITY → LH - 2como odiar#V a#SP /1/ ENTITY → LH - 2
marca es (muy/tan/...)odiosa
brand is (very/so/...)hateful
ENTITY ser#V odioso#A → LH - 1ENTITY ser#V muy#RG odioso#A → LH - 2
Table 8.7: Examples of rules for classifying emotions
LexicalFunction
Semantic Relation reflected by the LF Value
FinFunc0 Dejar de existir (L) (to stop existing) Desaparecer (to vanish)IncepFunc0 Empezar a existir (L) (to start existing) Emanar (to arise)IncepFunc0 Empezar a existir (L) Nacer (to arise)Func1 Afectar a algo/alguien (L) (to affect sth/sb) Anidar (en algo/alguien (to nest)Func1 Afectar a algo/alguien (L) Palpitar (en alguien) (to beat)Func1 Afectar a algo/alguien (L) Latir (en alguien) (to beat)Func1 Afectar a algo/alguien (L) Embargar (a alguien) (to be overwhelmed
by)IncepPredMinus Disminuir (L) (to decrease) Disminuir (to decrease)IncepPredPlus Aumentar (L) (to increase) Aumentar (to increase)Manif Mostrar (L) (to show) Mostrar (to show)Oper1 Hacer (L) (to do) Sentir (to feel)Oper1 Hacer (L) Tener (to feel)Real1-M Hacer lo esperable (con L) (to do the ex-
pected)Ocultar (to conceal)
Real1-M Hacer lo esperable (con L) Disimular (to disguise)
Table 8.8: Collocations of “odio” in Badele3000
8.5 Technique for Detecting Place of Residence
The goal of this technique is to identify the place of residence of users, defining
“place of residence of a user” as the geographical location where a user usually
lives. To achieve this goal we have carried out the same activities as with the
previous technique, which are described next.
8.5.1 Data Understanding Activity
This activity consists in the ordered execution of the Collect Initial Data, Describe
Data and Explore Data tasks. Next we explain each of these tasks.
223

8.5.1.1 Collect Initial Data Task
We have collected a corpus of users extracted from Twitter whose place of resi-
dence was known beforehand. For each user, we have extracted the location and
description declared in his/her profile, his/her timeline (i.e. tweets and retweets),
as well as the list of followers and users followed by the user. Additionally, we
have extracted the locations, descriptions and timeline of each user included in
the list of followers and followed.
We have restricted the number of friends for each user to 20 (10 followers
plus 10 persons followed by the user to be characterised), since Twitter limits the
number of calls to its API. Additionally we have restricted the number of tweets
analysed to 20, for the same reason, including tweets authored by the user and
retweets.
8.5.1.2 Describe Data Task
The dataset used has a structure containing data about 1,080 users, the content
shared and published by them, and the existing relationships among them and
other users. The data format also relates each user with a normalised geographical
location that represents her/his place of residence, defining a gold standard. Such
location is defined at the level of city and related with its administrative region of
second level (e.g. county, province), the administrative region of first level (e.g.
state, autonomous community), and the corresponding country. Additionally, the
data format relates the contents the named entities of type location extracted
from them.
The data schema is shown in Figure 8.13. The classes and properties included
in the diagram have been already described in Chapter 5.
224

sioc:content (language tagged)
sioc:Postsioc:creator_of
* *dcterms:description
foaf:Agent
tzont:Region
*
*foaf:based_near
sioc:account_of
sgo:declaredLocation
sioc:UserAccount
* *
sioc:follows
* *
cd Data Format for the Place of Residence Identification Technique
skos:Concept
sioc:topic*
*
(location)
isocat:DC-4339 isocat:datcat
* *
Figure 8.13: Data format of the corpus used by the technique for detecting theplace of residence of social media users
8.5.1.3 Explore Data Task
The users in the evaluation set are distributed among 11 different countries (Ar-
gentina, Chile, Colombia, Spain, USA, Japan, Mexico, South Africa, Switzerland,
Uruguay and Venezuela). Such users share and publish content in different lan-
guages (mainly in Spanish and English).
8.5.2 Data Preparation Activity
During this activity, we have pre-processed the contents published by the users, as
well as their descriptions in their profiles, by applying the common tasks defined
in Section 8.1.2. Nevertheless, we have not cleansed posts referring to particular
brands during the Clean Data task, as we consider all the content relevant for
extracting locations from them.
8.5.3 Modelling Activity
The goal of this activity is to develop an automatic classifier for detecting the
place of residence of social media users. This activity consists in the ordered
execution of the following tasks:
1. The Select Modelling Technique task consists in selecting and describing a
modelling technique for being applied for creating the classifier.
225
2. The Generate Test Design task consists in generating a mechanism to test
the model for quality and validity.
Next, each of these tasks are described.
8.5.3.1 Select Modelling Technique Task
We have experimented with five different approaches for detecting the place of
residence of a given social media user. Such approaches are summarised next.
1. Use the metadata about locations of users included in the profiles of the
user in social networks.
2. Analyse the friendship networks of the users for inferring their place of
residence when it cannot be retrieved from location metadata.
3. Perform text mining of the descriptions written by users about themselves
in their profiles for inferring their place of residence when it cannot be
retrieved from location metadata.
4. Perform text mining of the content published and shared by social media
users for inferring their place of residence when it cannot be retrieved from
location and description metadata.
5. Combine the previous approach with the approach based on friendship net-
works into a content-based and network-based hybrid approach.
Next we explain every approach.
Approach based on metadata about locations of users. This approach cor-
responds to the one implemented by Mislove et al. [2011]. The approach
makes use of the location metadata in the user profile, as for example, the
location attribute returned by Twitter API when querying user details100.
Figure 8.14 shows the location attribute in an example Twitter user profile.
Users may express their location in different forms through this attribute,
such as geographical coordinates, or the name of a location (e.g. a city, a
100http://dev.twitter.com/docs/api/1.1/get/users/show
226

Figure 8.14: Example of user profile location metadata
country, a province, etc.). Therefore, a normalisation stage is required in
order to obtain a standard form for each location.
For normalising the location this approach makes use of a geocoding API.
Our implementation uses Google Maps web services. This approach invokes
a method of the geocoding API that analyses a location and returns a nor-
malised tuple composed by a set of components that define the location,
including latitude, longitude, locality, and country, among others. For ex-
ample, if the request “santiago” is sent to the web service, the response will
be a tuple containing “Chile” as the country and “Santiago” as the local-
ity, among other location components. The complete list of components is
listed in the API documentation101. Please note that this query does not
provide enough information for disambiguating locations, e.g. “santiago”
may refer to many geographical locations, including Santiago de Chile and
Santiago de Compostela (Spain). Therefore the precision of this approach
101http://developers.google.com/maps/documentation/geocoding
227

Figure 8.15: Example of an output of the Google Geocoding API
1 function ResidenceFromLocationData(user)2 begin3 return GeoCode(location(user))4 end
Listing 8.2: Approach based on metadata about locations of users
depends on how users describe their location when filling in their profiles.
For example, geographical coordinates will define locations accurately, while
combinations of city and country (e.g. “Guadalajara, Spain”) will enhance
disambiguation (although not completely). In addition, this approach does
not return a place of residence when users have not filled in the location
field contained in user’s profile form of the social network. The approaches
described next deal with these precision and coverage issues. Figure 8.15
shows an example output of Google Geocoding API, while Listing 8.2 for-
malises the step executed by this approach.
Approach based on friendship networks. This approach exploits the inher-
ent homophily of social networks [McPherson et al., 2001] for obtaining the
place of residence of users. Listing 8.3 summarises the steps executed by
228

1 function ResidenceFromFriends(u)2 begin3 l ⇐ ResidenceFromLocationData(u)4 if l = ∅ then5 L ⇐ ∅6 for each f in friends(u) do7 L ⇐ L ∪ {GeoCode(location(f))}8 end for9 l ⇐ MostFrequentLocation(L)
10 end if11 return l12 end
Listing 8.3: Approach based on friendship networks
this approach, which are described next.
1. Firstly, we execute the previous approach for obtaining the place of
residence of a given user. If a result is obtained, the process finishes.
If not, the steps described next are executed (line 3).
2. Secondly, the friends of the user in her online community are collected.
After that, the location of each friend is obtained by using the geocod-
ing API. The normalised locations obtained are appended to a list
(lines 6-8).
3. Finally, the list obtained in the previous step is filtered iteratively
selecting on each iteration the locations that contain the value with
the most frequency for a given location component, starting from the
country and finishing in the city, until there is only one location in the
set. First the locations whose country is the most frequent are selected,
then the locations whose first-order civil entity (e.g. a state in USA or
an autonomous community in Spain) is the most frequent, and so forth.
The location that remains in the list after completing the iterations is
selected as the place of residence of the user. This approach ensures
that the most frequent regions in the friendship network of the user
are selected (line 9). Figure 8.16 shows an example of this process.
229

Figure 8.16: Example execution of table location filtering process
Approach based in descriptions about users. This approach exploits the de-
scription published by users about themselves in their profiles for obtaining
their place of residence, as for example, the description attribute returned
by the Twitter API when querying a user profile. Listing 8.4 summarises
the steps executed by this approach, which are described next.
1. Firstly, we execute the first approach (approach based on metadata
about locations of users). If a result is obtained, the process finishes.
Otherwise, the steps described next are executed (line 3).
2. Secondly, we obtain the user self-description attribute. Such attribute
usually consists on a sentence that has to be processed for extracting
the geographical locations mentioned in the text (line 5). Figure 8.17
shows the self-description attribute in an example Twitter user profile.
3. After obtaining the description of the user, we perform an entity de-
tection and classification process, by using an entity recognition and
230

1 function ResidenceFromDescription(u)2 begin3 l ⇐ ResidenceFromLocationData(u)4 if l = ∅ then5 desc ⇐ description(u)6 E ⇐ NamedEntities(desc, language(desc))7 L ⇐ ∅8 for each entity in E do9 if isLocation(entity) then
10 L ⇐ L ∪ {GeoCode(entity)}11 end if12 end for13 l ⇐ MostFrequentLocation(L)14 end if15 return l16 end
Listing 8.4: Approach based in descriptions about users
identification component for the language detected by the Construct
Data Task for the user’s description (line 6). For doing so, we make
use of Freeling, which provides an entity recognition and classification
module for English, Spanish, Galician and Portuguese. Such module
also implements multi-word detection, which allows recognising loca-
tions named by multiple words (e.g. “United Kingdom”).
4. After that, we filter the named entities obtained in the previous step
taking only the entities that correspond to a location. Such entities are
sent one by one to the geocoding API for obtaining a set of normalised
locations (lines 8-12).
5. As several locations may be obtained in the previous step due to mul-
tiple named entities contained in the description, once the normalised
locations have been obtained, we select only one location by following
the same selection approach described in step 3 of the approach ex-
plained previously, returning one location as the place of residence of
the user (line 13).
231

Figure 8.17: Example of user profile description metadata
Approach based in content This approach consists in mining the contents
published (e.g. tweets) and shared (e.g. retweets) by users to obtain their
place of residence. As performed by Cheng et al. [2010] this approach
extracts the location named entities from the user-generated content. List-
ing 8.5 summarises the steps executed by this approach, which are described
next.
1. Firstly, we attempt to execute the previous approach to obtain a lo-
cation from user profile metadata (line 3). If a result is obtained, the
process finishes with a location. Otherwise, the process continues in
the following step.
2. If the previous steps do not return a location, we obtain the textual
contents published and shared by the user. We process each document
obtaining a list of normalised locations mentioned in the content shared
and produced by the user by applying the same entity recognition
technique as in the first approach (lines 6-13). Figure 8.18 shows an
example extraction of the locations contained in the content published
by a Twitter user.
232

1 function ResidenceFromtPosts(u)2 begin3 l ⇐ ResidenceFromDescription(u)4 if l = ∅ then5 L ⇐ ∅6 for each text in publications(u) do7 E ⇐ NamedEntities(text, language(text))8 for each ent in E do9 if isLocation(ent) then
10 L ⇐ L ∪ {GeoCode(ent)}11 end if12 end for13 end for14 l ⇐ MostFrequentLocation(L)15 end if16 return l17 end
Listing 8.5: Approach based in content
3. Finally, we select the place of residence of the user from the list of
locations obtained in the previous step, by applying the same location
selection criteria used for the previously described approaches (line
14).
Hybrid approach This approach combines the previous ones. Listing 8.6 sum-
marises the steps executed by this approach.
233

Figure 8.18: Example of location extraction from content
1 function ResidenceHybrid(u)2 begin3 l ⇐ ResidenceFromPosts(u)4 if l = ∅ then5 L ⇐ ∅6 for each f in friends(u) do7 L ⇐ L ∪ {ResidenceFromPosts(f)}8 end for9 l ⇐ MostFrequentLocation(L)
10 end if11 return l12 end
Listing 8.6: Hybrid approach
234

8.5.3.2 Generate Test Design Task
As the technique that we propose does not perform learning from data, the whole
dataset has been used for evaluation purposes.
8.6 Technique for Detecting Gender
The goal of this technique is to identify the gender of social media users. To
achieve this goal we have carried out the Data Understanding, Data Preparation,
and Modelling activities, which are described in the following sections.
It is important to remark that the research conducted for defining this tech-
nique (definition, experiments, evaluation, etc.) has been co-authored with mem-
bers of the Acceso Group102.
8.6.1 Data Understanding Activity
This activity consists in the ordered execution of the Collect Initial Data, Describe
Data and Explore Data tasks, which are explained next.
8.6.1.1 Collect Initial Data Task
We have collected a random sample consisting on authors who have written a
tweet in Spanish, as well as tweets that mention those authors between 29th May
2012 and 27th March 2013, by using the Twitter API. A subset of the users
collected has been manually annotated by hand with their corresponding gender
by a human annotator to create a gold standard.
Additionally this technique makes use of two lists of first names that have
been previously classified by gender (one list for male names, and one list for
female names). These lists have been extracted from a dataset published by the
Spanish National Institute of Statistics.
102http://www.acceso.com
235

sioc:content (language tagged)
sioc:Post
* *foaf:givenNamefoaf:gender
foaf:Person sioc:account_of
foaf:nick
sioc:UserAccount
* *
cd Data Format for the Gender Identification Technique
dcterms:references
Figure 8.19: Data format of the corpus used by the technique for detecting thegender of social media users
8.6.1.2 Describe Data Task
The dataset used has a structure containing users annotated with their first names
and gender, as well as contents that mention them. The data schema is shown
in Figure 8.19. The classes and properties included in the diagram have been
already described in Chapter 5.
8.6.1.3 Explore Data Task
The dataset of users and tweets contains 69,261 users, and their corresponding
tweets written in Spanish, from which 1,509 users have been annotated with their
gender in the gold standard. The gold standard includes 558 female users, 621
male users and 330 neutral users. Neutral users are those accounts that belong
to an organisation of another kind of non-human agent.
The lists of male and female names contain 18,697 and 19,817 first names,
respectively.
8.6.2 Data Preparation Activity
During this activity, we have pre-processed the contents included in the gold
standard by applying the common tasks defined in Section 8.1.2. Specifically, we
have performed language identification for filtering users that do not have tweets
written in Spanish, and we have performed content normalisation. We do not
have cleansed posts referring to particular brands during the Clean Data task, as
we consider all the content relevant for extracting mentions to users from them.
In addition, the lists of male and female names have been curated creating a
gender dictionary, so unisex names have been excluded for classification purposes,
236

given the ambiguity that they introduce. After the curation process (removing
the first names that appear in both lists) the male first names list is reduced to
18,391 entries and the female names list to 19,511. Some examples of removed
first names are “Pau”, “Loreto” and “Reyes”, as they are valid for both males
and females in Spain.
8.6.3 Modelling Activity
The goal of this activity is to develop an automatic classifier for detecting the
gender of social media users. This activity consists in the ordered execution of
the following tasks:
1. The Select Modelling Technique task consists in selecting and describing a
modelling technique for being applied for creating the classifier.
2. The Generate Test Design task consists in generating a mechanism to test
the model for quality and validity.
Next, each of these tasks are described.
8.6.3.1 Select Modelling Technique Task
We have experimented with two different approaches for detecting the gender of
a given social media user. Such approaches are summarised next.
1. Look for the names declared in users’ profiles within dictionaries that asso-
ciate first names with their corresponding genders.
2. Exploit the linguistic gender concord that occurs in the Spanish language
when a name is not declared in the user profile.
Next we describe each approach.
Approach based in metadata about users. This approach exploits publicly
available metadata associated with the user profile. Such metadata may
include the user name, as for example, the name and the screen name
237

Figure 8.20: Example of user profile name metadata
Twitter attributes. Figure 8.20 shows the name attribute in an example
Twitter user profile.
The approach makes use of the gender dictionary created in the Data Prepa-
ration Activity (see Section 8.6.2). Given a user account, its name metadata
is scanned within the dictionaries and, if a match is found, we propose the
gender associated to the dictionary where the first name has been found as
the gender of the user.
Regarding multilingualism, the gender dictionary is a language-dependent
resource. However, there are many resources in the Web readily available
for populating easily new dictionaries, such as the population censuses pub-
lished as open data by many countries.
Approach based in content. This approach exploits the information provided
by mentions to users. For example, in the following tweet
I’m going to visit to my uncle @Daureos to Florida,
the author is providing explicit information about the gender of the user
mentioned. We know that @Daureos is male because of the word “uncle”
238

written before the user identifier. The same happens in English with other
family relationships, such as mother or father.
We propose an approach for the Spanish language that performs a depen-
dency parsing of the text with the aim of determining the gender of the
terms related with the user mentioned. Therefore, for each tweet in which
the user is mentioned, we attempt to estimate the gender of the user. Note
that not all mentions to users provide information for estimating their gen-
ders (e.g. “via @user” and “/cc @user” at the end of the tweet). The
dependency parser used is TXALA [Atserias et al., 2005].
The steps executed by this technique are the following:
1. Firstly, we execute the technique based on user name metadata de-
scribed previously. If a gender is obtained, the process finishes.
2. If a gender is not identified in the previous step, we obtain all the posts
that mention the user.
3. For each post, we perform a dependency parsing. Figure 8.21 shows
the dependency tree obtained from a tweet that mentions a given user.
Once obtained the dependency tree, we assign a gender to the user for
the post analysed according to the following heuristics:
(a) If the gender of the term in the parent node of the branch where
the user is mentioned is male or female, we consider that the user
is male or female accordingly (e.g. “Mi tıo Daureos”).
(b) If some of the child nodes of the node corresponding to the user
mention corresponds to a term with a specific gender, we consider
that the gender of the user corresponds to the gender of such terms
(e.g. “Vio a Daureos enfermo y triste”);
(c) If there is a noun adjunct as the predicate of an attributive sen-
tence where the user is the subject, we assign the gender of the
noun adjunct as the gender of the user (e.g. “Daureos es traba-
jador”).
4. Finally, we select the gender that is associated the most to the post
analysed for the user being analysed.
239

func: especsynt: espec-msform: milemma: mitag: DP1CSS
func: sn-modsynt: w-msform: Calamontelemma: calamontetag: NP00SP0
func: obj-prepsynt: snform: cuñadolemma: cuñadotag: NCMS000
func: sp-modsynt: grup-spform: alemma: atag: SPS00
func: adj-modsynt: s-a-msform: nuevolemma: nuevotag: AQ0MS0
func: termsynt: F-termform: .lemma: .tag: Fp
func: sn-modsynt: snform: CM_de_El_Corte_Ingléslemma: cm_de_el_corte_ingléstag: NP00V00
func: topsynt: snform: Felicidadeslemma: felicidadestag: NP00SP0
Figure 8.21: Dependency tree obtained from a tweet that mentions to a user
8.6.3.2 Generate Test Design Task
As the technique that we propose does not perform learning from data, the whole
dataset has been used for evaluation purposes.
As described in Section 8.6.1.1 the whole dataset is used for measuring the
coverage of the technique (i.e. the proportion of users that can be annotated with
a gender), and a subset that has been manually annotated with gender is used
for measuring the precision and recall.
240

8.7 Evaluation
This section evaluates the techniques for the segmentation of consumers from
content presented in this chapter. Section 8.7.1 describes the metrics used for
evaluating the techniques, while Section 8.7.2 present the evaluations results.
8.7.1 Evaluation Metrics
For evaluating the techniques for segmentation of consumers from social media
content, we made use of a set of metrics commonly used in machine learning for
evaluating supervised classifiers. In this context:
• TP is the number of true positive decisions. It indicates the number of
instances that have been classified as belonging to a particular class, and
actually belong to such class.
• TN is the number of false positive decisions. It indicates the number of
instances that have not been classified as belonging to a particular class,
and actually do not belong to such class.
• FP is the number of false positive decisions. It indicates the number of
instances that have been classified as belonging to a particular class, and
actually do not belong to such class.
• FN is the number of false negative decisions. It indicates the number of
instances that have not been classified as belonging to a particular class,
and actually belong to such class.
Taking into account the TP , TN , FP , and FN indicators, the metrics used
for evaluating the performance of the technique for unique user identification are
described next.
241

8.7.1.1 Accuracy
The Accuracy metric [Kohavi and Provost, 1998] measures the percentage of
correct decisions. Equation 8.1 shows its definition.
RI =TP + TN
TP + FP + TN + FN(8.1)
The range of this metric is [0..1]. We consider satisfactory values for this
metric those that are over 0.85.
8.7.1.2 Recall
The Recall metric [Kowalski, 1997] (a.k.a. sensitivity or hit rate) is the true
positive rate. Equation 8.2 shows its definition.
The range of this metric is [0..1]. For the evaluations of this section, we
consider satisfactory values for this metric those that are over 0.30.
Recall =TP
TP + FN(8.2)
8.7.1.3 Precision
The Precision metric [Kowalski, 1997] is defined as the positive predictive value.
Equation 8.3 shows its definition.
Precision =TP
TP + FP(8.3)
The range of this metric is [0..1]. For the evaluations of this section, we
consider satisfactory values for this metric those that are over 0.65.
8.7.1.4 F-measure
The F-measure metric [Larsen and Aone, 1999] combines the precision and recall
metrics offering an overall vision of how the technique behaves. It is defined as
the harmonic mean of precision and recall. Equation 8.4 shows its definition.
F1 =2 · Precision ·Recall
Precision+Recall(8.4)
242

The range of this metric is [0..1]. For the evaluations of this section, we
consider satisfactory values for this metric those that are over 0.41, taking into
account the minimum Precision and Recall satisfactory values.
8.7.2 Evaluation Results
This section present the results of the evaluations performed to the techniques
described in this chapter. The section is structured as follows:
• Section 8.7.2.1 presents the evaluation results obtained for the technique
for detecting Consumer Decision Journey stages.
• Section 8.7.2.2 presents the evaluation results obtained for the technique
for detecting Marketing Mix attributes.
• Section 8.7.2.3 presents the evaluation results obtained for the technique
for detecting emotions.
• Section 8.7.2.4 presents the evaluation results obtained for the technique
for detecting the place of residence of social media users.
• Section 8.7.2.5 presents the evaluation results obtained for the technique
for detecting the gender of social media users.
8.7.2.1 Technique for Detecting Consumer Decision Journey Stages
We have evaluated our technique for detecting Consumer Decision Journey stages
from user-generated content. The overall results of the textual classification in
terms of precision are 0.74, while in terms of recall are 0.35, achieving an F-
measure of 0.48. Figures 8.22 and 8.23 show the results by category and language.
In general, the rules achieved satisfactory results in terms of precision, especially
in the awareness, evaluation, and purchase stages for English, and awareness for
Spanish. Results in terms of recall were lower than those achieved in precision, as
rules were designed very specific in order to minimise the number of false positives.
Generally, the stage where we obtained best results is awareness, specifically for
Spanish.
243

Figure 8.22: Accuracy of the Consumer Decision Journey classifier for English
We also offer the results for the classification along the different business
sectors (Figure 8.24) in order to evaluate the difficulties of the classification de-
pending on the domain. We found that banking and beverages were the business
sectors where we obtained the best results, with the greatest values of F-measure.
The distinction among the different stages of the Consumer Decision Journey
is not always clear, due to the ambiguity of short texts. Frequently, belonging to
one stage or another is strongly related to the type of product, and the differen-
tiation among stages can only be performed applying extra linguistic knowledge.
Sentences such as “I like this beer” and “I like this car” were frequently found
in the corpus. In the first case, it is very likely that the user has already tried
the product (postpurchase experience), since it would be strange for a customer
to state that he likes a drink (or some food) without actually tasting it. In the
second case, instead, the actual consumption of the product is less probable, and
the customer can like the car just because of its television advertisement or its
design, for example. These kinds of ambiguities are especially frequent between
244

Figure 8.23: Accuracy of the Consumer Decision Journey classifier for Spanish
evaluation and postpurchase experience, and the linguistic patterns are not able
to capture the differences between them since they are expressed through the
same linguistic expression.
A further classification of products depending on domain-dependent features
could be useful in order to discriminate between evaluation and postpurchase
experience in these types of ambiguous cases.
Finally, there are multiple geographic varieties for English and Spanish that
present lexical differences. This implies additional difficulties to pattern identifi-
cation, since lexical units differ from a variety to another and are especially hard
to detect. Further work in this line (i.e. improving the normalisation process by
transforming lexical units to a canonical form) could help to improve the recall
results.
245

Figure 8.24: Accuracy of the Consumer Decision Journey classifier by sector
8.7.2.2 Technique for Detecting Marketing Mix Attributes
We have also evaluated how the decision tree classifiers perform in the classifica-
tion of each short text depending on the Marketing Mix element (or elements)
expressed. We have used the 10-fold cross-validation approach for evaluating the
developed classifiers. We have obtained an overall precision of 0.75 and an overall
recall of 0.37, being the F-measure of 0.5. The results obtained in this task for
English and Spanish can be seen respectively in Figures 8.25 and 8.26.
As observed in the figures, the results are generally low (except for Advertise-
ment) in terms of recall, which range from 0.04 to 0.80 for Spanish and from 0.09
to 0.83 for English. It seems that there is a logical relation between the number
of texts of the positive class utilised to train the model and the corresponding
results in terms of recall and precision. For example, in Spanish the classifier
that was trained with a smaller number of texts, was the one for the positive
class of Customer Service, where we only had 85 short texts. The results of the
classification are 0.04 and 0.38 for recall and precision, respectively. In the same
246

Figure 8.25: Accuracy of the Marketing Mix classifier for English
line are the results for English; one of the Marketing Mix elements trained with
less texts of the positive class (238) is Point of Sale, therefore the results obtained
are also the lowest ones: a recall of 0.09 and a precision of 0.48. We can observe
the same situation in the models trained with a larger number of texts; both in
Spanish and English, the Advertisement classifier was trained with a lot of pos-
itive examples, and thus this class achieved very good results in terms of recall
as well as precision (0.80 and 0.83 for recall and 0.88 and 0.93 for precision, for
Spanish and English, respectively).
It is also interesting to see how some Marketing Mix elements are much more
difficult to identify than others. For example, we can observe that the element
Quality is very hard to classify, even increasing the number of texts used to train
the model. In Spanish the number of texts used as positive examples is 371
and we obtained 0.18 and 0.56 of recall and precision respectively. However, in
English, where the model was trained with a larger number of texts as positive
examples (1,046 texts), the results are in line with those obtained for Spanish:
247

Figure 8.26: Accuracy of the Marketing Mix classifier for Spanish
0.13 of recall and 0.61 of precision. These differences of difficulty among sectors
are due to the dispersion of the vocabulary used to talk about some Marketing
Mix elements. For example, we observed that customers could talk about Qual-
ity making reference to the comfort (for Automotive industry, for example), to
the security (in Banking, for instance) or to the taste (for Food or Beverages).
Therefore, the reference to Quality can be made through a great variety of top-
ics that are domain dependent and thus, the reference to this element is much
more varied than the reference to other Marketing Mix elements such as Price or
Advertisement. The linguistic cues are more disperse and thus the classifier finds
more difficulties to relate a word with a specific class.
Although the results specially in terms of recall should be improved, we con-
sider that as a first attempt to automatically classify and filter user-generated con-
tent from social media in terms of Marketing Mix elements, the results obtained
are very encouraging and very satisfactory for elements such as Advertisement.
Finally, as happened with the technique for identifying Consumer Decision
Journey stages, the language varieties affect to the precision results. For example,
248

the term “commercial” for American Spanish means “advertising spot”, while for
European Spanish means “sales person”. While the former meaning should be
associated to the Advertising category, the latter meaning should be associated
to the Point of Sale category.
8.7.2.3 Technique for Detecting Emotions
We have evaluated our system against a set of randomly chosen texts that cover
58% of the corpus, as described in Section 8.4.2.2. The overlap coefficient between
the training set and the evaluation set was 0.14, quite small, so we could trust
the results of the evaluation as very reliable.
Figure 8.27 shows the precision and recall obtained for each emotion of our
conceptual framework. We can see the number of texts classified under each
emotion both by our system and by the human annotator. The overall recall is
49.73% and the precision is 71.78%. If we used the F-measure as an indicator of
the best results, these would correspond to satisfaction and dissatisfaction. This
fact is not surprising, since the majority of the texts expressing sentiment in the
corpus and, therefore, in the training corpus belong to one of these two categories.
Figure 8.28 shows the precision and recall obtained for each domain and Fig-
ure 8.29 shows the precision and recall obtained for each type of media.
We have also compared our results to the ones provided by an existing com-
mercial tool for detecting polarity of opinions, owned by Havas Media Group.
Such system is also rule-based and the rules follow a similar approach, although
the antecedent only supports components made of lemma and part-of-speech and
the consequent only considers one category that captures the negative and the
positive opinions, instead of the four ones (reflecting eight sentiments) of our
work.
An important difference between the two experiments is the size of the corpora
used for evaluation: the corpus used for evaluating the polarity classifier contained
3,705 texts while ours contained 15,428 texts.
The polarity system has a recall of 20.82% (less than ours, 49.73) and a
precision of 84.85% (more than ours, 71.78). However, when we reduce our four
categories to one (putting together negative polarities on one side and positive
249

Figure 8.27: Accuracy of the emotions classifier
ones on the other) the results show a recall of 58.48% and a precision of 84.42%.
Thus, under such circumstances, we can affirm that we achieve a similar precision
to and a better recall than the previous system, and certainly it is based on a
more fine-grain classification.
250

Figure 8.28: Accuracy of the emotions classifier by sector
Figure 8.29: Accuracy of the emotions classifier by social media type
251

Approach AccuracyBased on metadata about locations of users 0.81Based on friendship networks 0.86Based on descriptions about users 0.81Content-based 0.81Hybrid 0.81
Table 8.9: Accuracy of the place of residence identification approaches
8.7.2.4 Technique for Detecting Place of Residence
We have evaluated the five different approaches implemented by this technique
against the evaluation data set described in Section 8.5.3.2. The evaluation results
are shown in 8.9. All the approaches achieve the same accuracy (0.81), with the
exception of the one based on friendship networks, which improves de accuracy
to 0.86, out performing the approaches described in the State of the Art that
achieve accuracies from 0.51 to 0.71.
Regarding the approaches that perform named entity recognition for detect-
ing the locations included in the description of user profiles, or in the content
published and shared by those users, we have evaluated this step by using the
training set published by the Concept Extraction Challenge of the #MSM2013
Workshop [Basave et al., 2013]. Such training set consists of a corpus of 2.815
micro-posts written in English. The precision obtained is 0.52, while the recall is
0.43 (F1 =0.47).
8.7.2.5 Technique for Detecting Gender
We have evaluated the coverage (i.e. proportion of users classified) of the two
gender recognition approaches described by this technique against the whole eval-
uation data set described in Section 8.6.3.2. The approach based on profile meta-
data has been able to classify 46,030 users (9,284 female users and 36,746 male
users), achieving a coverage of 66% of the corpus. By contrast, the approach
based on mentions to users has classified 46,396 users (9,386 female users and
37,010 male users), improving the coverage up to 67%. Table 8.10 compares the
coverage of both approaches.
In addition, we have checked the automatic classification with respect to the
252

Approach Female Male Not Identified
User Names 9,284 (13%) 36,746 (53%) 23,231 (34%)
Mentions to Users 9,386 (14%) 37,010 (53%) 22,864 (33%)
Coverage Gain +102 +264 (Total Gain = +1%)
Table 8.10: Coverage of the gender recognition approaches
Figure 8.30: Performance of the gender recognition approaches
gold standard, obtaining an overall accuracy of 0.9 for the approach based on
user names, and of 0.84 for the approach based on mentions to users. By gender,
for the approach based on user names, the precision obtained is 0.98 for male
users and 0.97 for female users, while the recall is 0.8 and 0.87, respectively. For
the approach based on mentions to users, the precision obtained is 0.8 for male
users and 0.79 for female users, while the recall is 0.85 and 0.95, respectively.
Therefore, the approach based on mentions to users achieves a smaller precision,
but increases the recall with respect to the approach that only makes use of user
names. Figure 8.30 compares the performance of the two approaches.
As explained in Section 8.6.2 we perform automatic language identification
during the Clean Data task for filtering users that do not write in Spanish. The
false positives introduced by the language identification component, whose accu-
racy is 0.9302, may cause the inclusion of authors in the evaluation corpus that
might not be Spanish speakers, penalising the method recall.
Table 8.11 shows the confusion matrix for the approach based on mentions
253

Predicted classActual class Male Female No genderMale 530 42 49Female 10 528 20No gender 130 97 103
Table 8.11: Confusion matrix with the results of the approach based on mentionsto users.
to users. Users manually annotated as “no gender” correspond to non-personal
Twitter accounts (e.g. a brand or a corporation), while those automatically
classified as “no gender” are the users for which the algorithm was not able
to identify a gender. Mainly, the confusions are produced between the male and
female classes and the residual class. As the table reflects, there is not a significant
number of confusions between male and female users (i.e. male users classified
as female and vice versa). Most of the errors correspond to male or female users
that could not been classified by the gender recognition technique.
It is difficult to make a direct comparison of our technique with the previous
works described in the State of the Art (Section 2.6.6), since our classifier has
been designed for the Spanish language and the other ones have been trained and
evaluated with a corpora of English speakers. If we ignore this fact, the technique
developed by Mislove et al. [2011] identifies a gender for the 64.2% of the users,
while ours achieves a coverage of 66.45%. Additionally, we have achieved less
accuracy than Burger et al. [2011], who achieved 0.92. However, the technique
proposed by Burger et al. [2011] requires more than 100,000 users in the training
data set (together with the tweets authored by them), while our technique does
not require training a classifier as it relies in linguistic knowledge, avoiding the
cost of corpus annotation by humans.
Regarding the distributions by gender, Mislove et al. [2011] identified a 71.8%
of male users for the U.S. population that use Twitter. In our case, we iden-
tified a 79.8% of male users confirming that Spanish speakers on Twitter are
also predominantly male within the period of the experiment (May 2012 - March
2013).
254
8.8 Validation of Hypotheses
The evaluation performed to our approach for identifying Consumer Decision
Journey stages in user-generated content validates Hypothesis 3, since our tech-
nique is able to classify texts along the different phases with an acceptable ac-
curacy with precision results similar to the works on identification of wishes.
Consequently our technique is able to approximate distributions of consumers
(i.e. the authors of the texts) in the exact moment of the Consumer Decision
Journey process.
The evaluation performed to our approach for detecting Marketing Mix at-
tributes in user-generated content validates Hypothesis 4, since our technique is
able to classify texts according to the Marketing Mix framework with an accept-
able accuracy, and consequently is able to approximate distributions of consumers
(i.e. the authors of the texts) that refer to the distinct Marketing Mix elements.
The evaluation performed to our approach for detecting emotions in user-
generated content validates Hypothesis 4, since our technique is able to identify
expressions of satisfaction, dissatisfaction, trust, fear, love, hate, happiness, and
sadness within user-generated content with an acceptable accuracy, and conse-
quently is able to approximate distributions of consumers (i.e. the authors of the
texts) that express the different kind of sentiments.
Regarding place of residence detection, the evaluation performed validates
Hypothesis 6, since the most accurate approach is the one based in friendship
networks. Therefore the homophily that characterises social networks can be
exploited for determining the place of residence of social media users. The results
obtained show that the social network is a valuable source of information for
obtaining the socio-demographic attributes of single users.
Finally, the evaluation results regarding gender detection show that the ap-
proach that exploits the gender concord existing in the contents that explicitly
mention social media users when a gender cannot be retrieved from user’s meta-
data improves the coverage of the gender identification technique. This validates
Hypothesis 7.
255

256

Chapter 9
CONCLUSIONS AND FUTURE
WORK
Social media has been in the centre of attention of advertising agencies as it has
come to form part of the media addressed by marketing activities. Advertising
agencies have been exploring possible ways to use this new media as a mechanism
of producing word-of-mouth. Therefore social media is being considered as a
platform in a viral marketing strategy. One of the expected benefits of this
thesis is to provide marketers and business experts with tools for understanding
the principal functions of social media from a marketing point of view. That is,
disentangle the effect social media have in consumer behaviour during the various
stages of the decision making process.
As the main conclusion, the techniques described in this thesis can be im-
plemented within applications that aim at observing consumers in social media
extracting socio-demographic and psychographic information from them.
We have defined an ontology network that structures the information pub-
lished in social media that is useful for marketing analysis purposes, and we have
characterised such media media by analysing the morphosyntactic characteristics
of the content published on them. Additionally, we have provided a technique
for uniquely identifies social media users using the fingerprint in their devices,
regardless the changes that occur frequently in these fingerprints. We also have
provided a collection of techniques for obtaining psychographic segmentations
257

of consumers in terms of their position in the purchase funnel, the marketing
attributes of the brands they refer to, and their sentiment about these brands.
Finally, we have described a set of techniques for identifying two sociodemo-
graphic attributes from social media users, i.e. their place of residence and their
gender.
Next, we detail the conclusions for each of the contributions of this thesis to
the State of the Art.
9.1 Social Media Data Model for Consumer An-
alytics
We have developed an ontology that models information that can be extracted
from social media about consumers. Such information can be directly retrieved
from social media data or inferred from users’ activity and opinions.
By combining and structuring the directly and indirectly retrieved data we are
able to store enriched consumer-related information in a graph-based database
for been analysed in different manners by marketing professionals.
As an example, through a CRM connection (e.g. implemented by a plugin
of a CRM system) this information could be prompted to standard business
applications and be accessible for daily business decisions.
9.2 Morphosyntactic Characterisation of Social
Media Contents
Natural language processing (NLP) techniques are a key piece for analysing the
content published in social media. Social media content presents the character-
istics of non-editorially controlled media, as opposite to the content published in
traditional media. In this context, social media communication has moved from
daily publications to real-time interactions. Thus, when applying NLP techniques
to the user-generated content published in social media, we find issues on text
quality that hinder the application of such techniques.
258

Moreover, if we analyse social media sources separately, we find that there are
differences on language styles, expressiveness degrees, and levels of formalism that
are conditioned by factors such as content length or publication pace. Namely,
text length varies form short sentences posted in Twitter to medium-size articles
published in blogs; very often the text published in social media contains mis-
spellings, is completely written in uppercase or lowercase letters, or is composed
of set phrases; to mention a few characteristics that make social media content
analysis challenging. Specifically we have demonstrated than the distribution of
part-of-speech categories varies across different social media types. Since part-of-
speech tagging is a previous step for many NLP techniques, the performance of
such techniques may vary according to the social media source from which the
user-generated content has been extracted.
9.3 Technique for Unique User Identification
Based on Evolving Device Fingerprint
Unique user identification is an essential activity in order to obtain accurate
results from Web Analytics, since many Web Analytics metrics depend on mea-
suring unique visitors. The most widespread technique for uniquely identifying
users is the one based on cookies. However, such technique is not completely
effective because cookies can be removed, disabled, or not supported.
Recently, a new technique for user identification has been proposed. Such
technique consists on capturing the fingerprint of the machine that the user uses
for navigating the Web. One drawback of this technique is that such fingerprint
changes over time, so that the registration of fingerprints must be accompanied
by a mechanism for detecting its temporal evolution. In this thesis, we have
described an algorithm that allows clustering fingerprints that correspond to the
same user, regardless of fingerprint evolution. The evaluation results demonstrate
the effectiveness of the algorithm, and improve previous results.
The algorithm proposed can be used instead of the technique based on cookies,
or as a complement to this technique for regenerating cookies when such cookies
are removed. If the algorithm is used as an alternative to the technique based on
259

cookies, every time an activity record is registered, the fingerprint obtained must
be compared to each cluster of browser fingerprints generated before, because of
the algorithm linear complexity. In contrast, if the algorithm is used as a mech-
anism for regenerating cookies, the fingerprint must be compared with existing
clusters only when the cookie is deleted, reducing significantly computational re-
sources needed for identifying users and augmenting, even more, the accuracy of
unique user identification. Moreover, this variant could be supplemented with
the use of Internet Explorer data persistence and web storage capabilities.
Our algorithm improves the accuracy of unique browser identification over
previous approaches, letting effectively counting unique visitors, thus measuring
the impact of digital advertisement campaigns better in environments where ex-
isting techniques fail (e.g. mobile devices or smart TVs which do not support
cookies). Therefore, the algorithm measures the audience of on-line campaigns ef-
fectively regardless the device and security restrictions, which enhances decision
support. Previous approaches were temporally constrained because of cookie
deletion or fingerprint attribute changes. Thus reporting periods were affected
by such temporal constraints. Our approach enables tracking user activity during
more time since it allows recovering from fingerprint changes (or cookie deletions
when combined with the user identification technique based on cookies). Thus,
website or advertisement campaign monitoring periods can be larger without
losing accuracy. In addition, advertisers will be benefited with more precise au-
dience measures, avoiding counting the same browser more than once. This will
impact positively on media planning optimisation allowing better budget distri-
bution over different online media, and enhancing performance metrics and user
profiling.
The algorithm can be executed as a batch process or in real-time as new
fingerprints arrive to the system. A real-time version of the algorithm should
require optimisations to reduce the number of comparisons between fingerprint
and cluster signatures, reducing processing time.
A disadvantage of the technique described in this document is the amount of
additional JavaScript code to be added to web pages in order to get some finger-
print attributes. Such scripting code could prevent certain advertising media of
adopting the technique. Nevertheless, importing external JavaScript definitions
260

reduces the code to be inserted in web pages to one line.
Finally, with respect to the ethical aspects of user tracking, Sison and J.
[2005] discuss issues relating to privacy on the on-line advertising domain. It is
important to remark, that the aim of this research is not invading user privacy,
but uniquely accounting the users that visit a given website. Thus, we are not
interested in personal data about users, but in accurate Web Analytics measures
at the aggregated level. Moreover, browser fingerprinting does not suppose a
threat for user privacy when appropriate anonymization techniques are applied,
for instance, transforming data applying cryptographic functions, such as SHA-1
[Eastlake and Jones, 2001], to fingerprint attribute values. Anyway, technologies
implementing our technique, and other similar ones, should follow policies such as
“Do Not Track” [Mayer et al., 2011], which enables users to opt out tracking by
websites they do not visit, including analytics services and advertising networks.
9.4 Techniques for Segmentation of Consumers
from Social Media Content
This section presents the conclusions regarding the techniques provided by this
thesis for segmenting consumers according to the contents they publish and share
in social media.
Future lines of work include experimenting with the detection of more demo-
graphic and psychographic user characteristics which are relevant to the market-
ing and communication domains, including: age, political orientation and inter-
ests, among others.
9.4.1 Technique for Detecting Consumer Decision Jour-
ney Stages
We have presented a novel technique for analysing user-generated texts in terms
of their belonging to one of the four stages of the Consumer Decision Journey.
Using a corpus made up of texts extracted from different social media sources and
pertaining to several business sectors, we manually identified specific linguistic
261

patterns and used them in a rule-based classifier to unambiguously distinguish
among texts related to the different stages. We achieved an overall precision of
0.78 and 0.65, and an overall recall of 0.34 and 0.39, for English and Spanish,
respectively.
To our knowledge, this is the first attempt to automatically obtain Consumer
Decision Journey business indicators from user-generated content using rule-based
classifiers. The automatic identification of these business indicators is very much
needed in order to drastically reduce time and efforts in their manual activities
by marketing analysts. Due to the novelty of this research area, much work
remains to be done, including its adaptation to other languages and the research
on possible methods to improve the overall recall. Lastly, we also plan to include
more business sectors in order to make the system more robust.
9.4.2 Technique for Detecting Marketing Mix Attributes
We have developed machine-learning classifiers that enable us to identify Mar-
keting Mix elements in user-generated texts. This allows a more accurate, fine-
grained consumer buzz analysis (i.e. not only establishes purchase stages but
identifies relevant, common topics of conversation among customers throughout
their shopping experiences) and, in consequence, enables marketers to take better-
informed business decisions. The system has been implemented training a set of
Decision Tree classifiers achieving an overall precision of 0.76 and 0.75, and an
overall recall of 0.44 and 0.31, for English and Spanish, respectively.
As happened with the Consumer Decision Journey classifier, to our knowledge,
this is the first attempt to automatically obtain Marketing Mix business indicators
from user-generated content using machine-learning classifiers, reducing earned
media analysis efforts to marketing analysts. Also, due to the novelty of this
research, much work remains to be done, like adapting the technique to other
languages, improving the recall, or learning texts from new business sectors.
9.4.3 Technique for Detecting Emotions
In this thesis, we have developed a rule-based technique that classifies Span-
ish texts from different social media channels according to four polarised cat-
262

egories (satisfaction-dissatisfaction, trust-fear, love-hate and happiness-sadness)
that capture the main sentiments expressed through these channels.
The results of the evaluation of the technique (49.73% recall and, 71.78%
precision) are quite satisfactory, considering the fine-grain classification. Never-
theless, refining and expanding the set or rules (consisting of more than 1200
rules at this moment) can improve the results. We have found a set of future
lines of work, which are described next.
Rules that are too specific match few texts, thus making it necessary to have
a huge set of rules in order to cover all the domains. However, this specificity
leads to a higher accuracy, i.e. when an antecedent matches (part of) a text, the
system would very likely classify it correctly.
In addition we have devised several ways to expand the set of rules by adding
rules based on the existing ones:
• Replacing words or lemmas with others that do not appear in the analysed
corpus. The ideal substitutes are the synonyms of the ones actually ex-
amined in the same context. For verbs, good replacement candidates are
those that are collocates of the same sentiment. Badele3000 can provide us
with this information. As we have seen, it can help us to retrieve domain-
independent collocations of common sentiments, along with the semantic
relation between the terms of those collocations. For example, since both
sentir (to feel) and tener (to have) are values of the LF Func1 for odio
(hatred) (see Table 8.8), rule (1) could be added, as it is equivalent to the
following rule (2).
tener#V odio#NC [SP] ENTITY → LH - 1 (1)
sentir#V odio#NC [SP] ENTITY → LH - 1 (2)
• Elaborating less restrictive rules, i.e. omitting some of the elements in the
antecedent. This generalisation would likely lead to a larger coverage. Nev-
ertheless, there is no guarantee that the resulting rules would not decrease
the accuracy of the system. A new evaluation should be carried out for
each new rule in order to know its impact. Accordingly, a trade-off be-
tween coverage and accuracy is sometimes necessary. For example, since
263
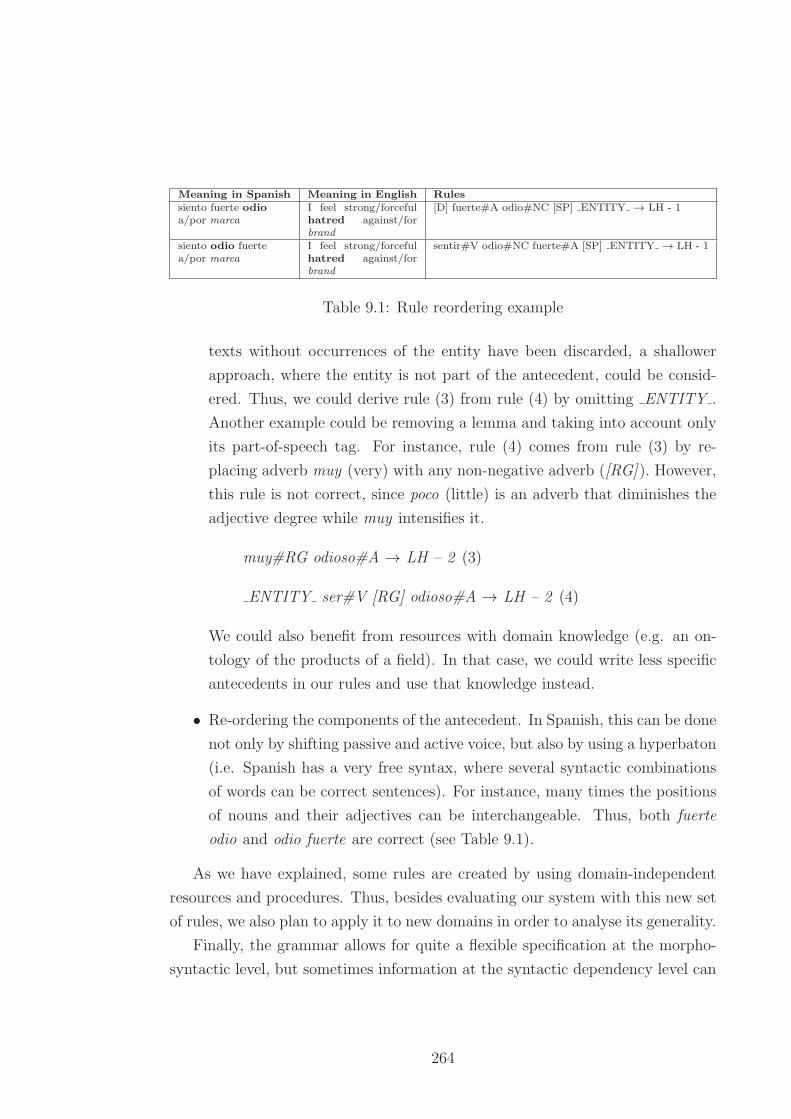
Meaning in Spanish Meaning in English Rulessiento fuerte odioa/por marca
I feel strong/forcefulhatred against/forbrand
[D] fuerte#A odio#NC [SP] ENTITY → LH - 1
siento odio fuertea/por marca
I feel strong/forcefulhatred against/forbrand
sentir#V odio#NC fuerte#A [SP] ENTITY → LH - 1
Table 9.1: Rule reordering example
texts without occurrences of the entity have been discarded, a shallower
approach, where the entity is not part of the antecedent, could be consid-
ered. Thus, we could derive rule (3) from rule (4) by omitting ENTITY .
Another example could be removing a lemma and taking into account only
its part-of-speech tag. For instance, rule (4) comes from rule (3) by re-
placing adverb muy (very) with any non-negative adverb ([RG]). However,
this rule is not correct, since poco (little) is an adverb that diminishes the
adjective degree while muy intensifies it.
muy#RG odioso#A → LH – 2 (3)
ENTITY ser#V [RG] odioso#A → LH – 2 (4)
We could also benefit from resources with domain knowledge (e.g. an on-
tology of the products of a field). In that case, we could write less specific
antecedents in our rules and use that knowledge instead.
• Re-ordering the components of the antecedent. In Spanish, this can be done
not only by shifting passive and active voice, but also by using a hyperbaton
(i.e. Spanish has a very free syntax, where several syntactic combinations
of words can be correct sentences). For instance, many times the positions
of nouns and their adjectives can be interchangeable. Thus, both fuerte
odio and odio fuerte are correct (see Table 9.1).
As we have explained, some rules are created by using domain-independent
resources and procedures. Thus, besides evaluating our system with this new set
of rules, we also plan to apply it to new domains in order to analyse its generality.
Finally, the grammar allows for quite a flexible specification at the morpho-
syntactic level, but sometimes information at the syntactic dependency level can
264

be useful too. For instance, knowing the scope of a negation could help to deter-
mine the units to be computed by the classifier.
9.4.4 Technique for Identifying the Place of Residence of
Social Media Users
The evaluation results obtained for the technique for identifying the place of
residence of social media users show that the approaches that make use of the
user’s community achieve better performance than the ones based on the analysis
of the content published and shared by the user. While the major part of the
community of a user shares the place of residence (because of the homophily
principle in social networks), the mentions to locations included in the content
published by the users are not related necessarily with their place of residence.
9.4.5 Technique for Identifying the gender of Social Media
Users
We have achieved very satisfactory results for gender identification by just making
use of user profile metadata, since the precision obtained is high and the technique
used is very simple with respect to computational complexity, which leads to a
straightforward set up in a production environment.
The approach based on mentions to users increases the recall in the cases
where the technique based in metadata about users is not able to identify the
gender, because for the Spanish language there exists grammatical agreement
with respect to gender between nouns and other part-of-speech categories (e.g.
adjectives and pronouns).
This technique can be extended in the future with the use of facial analysis
techniques, like the one proposed by Bekios-Calfa et al. [2014], as many users
publish their photograph in their social media profiles.
9.4.6 Normalisation of User-Generated Content
The text classifiers described in this thesis make use of an approach for user-
generated content normalisation that relies on existing web resources collectively
265

developed, finding that such resources, useful for many NLP tasks, are also valid
for the task of micropost normalisation.
With respect to the future lines of work, we plan to adapt the normaliser
to new languages by the incorporation of the corresponding dictionaries and im-
proving the existing lexicons by the use of more available resources, such as the
anchor texts from intra wiki links.
Finally, we plan to improve the normalisation of typos consisting in multiword
expressions, as different words should be transformed into just one (e.g. the
Spanish expression “a cerca de” should be transformed into “acerca de”), as
well as cases where joined words should be split (e.g. “realmadrid” should be
transformed into “real madrid”) by using existing word breaking techniques, such
as the one described by Wang et al. [2011].
9.4.7 Evaluation of Scalability
Because of its scale, brands’ earned media mentions extracted from social media
channels and gathered by marketing and communications agencies can be con-
sidered “Big Data”, as they are characterised by its huge volume of data, high
velocity of production, and high heterogeneity [O’Leary, 2013].
Media agencies like GroupM103 or Havas Media Group extract more that 1,200
million posts a year from its social media monitoring tools, including mentions
to its monitored brands and their competitors. This represents a volume of more
than 1.5 TB of raw data mainly consisting of text, associated content and authors’
metadata. Such volume grows very significantly when is processed, augmented
with different classifications, and integrated and indexed within databases.
The high velocity in which data is produced is a challenge, as data needs to
be processed faster than content is produced, at a near real-time pace, even if the
content is batch-processed.
In addition, variety along several dimensions (e.g. content quality, multilin-
guality, multiplicity of formats, diversity of technologies and techniques to be
integrated) has conditioned the infrastructure developed to evaluate the scalabil-
ity of the work presented in this paper.
103http://www.groupm.com
266

We have performed a preliminary test of the scalability of the software com-
ponents by integrating them within a Big Data processing platform. However,
a more rigorous validation of the scalability of the techniques presented in this
work in a Big Data scenario is still pending.
Specifically, we have integrated the techniques for consumer segmentation pre-
sented in this thesis into a Big Data infrastructure. Such infrastructure is based
in Hadoop-related104 technologies, namely, Flume105 for real-time consumption of
posts, Hive and MapReduce for batch processing and data aggregation, HDFS for
temporal data storage, and HBase for storing the linguistic resources queried by
our classifiers. Once the data are processed, they are indexed in a Solr106 cloud
environment, and aggregation results are uploaded to relational databases with
OLAP capabilities. Processes have been developed using the Scala107 program-
ming language.
Measures of the time required for the multi-classification of each piece of
text show that it takes an average of 0.46 seconds per post (note that length of
test varies across different sources). Therefore, we found it very useful in order
to automatically tag the data stream continuously extracted and analysed by
marketing companies.
104http://hadoop.apache.org105http://flume.apache.org106http://lucene.apache.org/solr107http://www.scala-lang.org
267

268

REFERENCES
Aguado de Cea, G., Barrios, M., Bernardos, S., Campanella, I., Montiel-Ponsoda,
E., Munoz-Garcıa, O., and Rodrıguez, V. (2014). Analisis de sentimientos en
un corpus de redes sociales. In Proceedings of the 31st International Conference
of the Spanish Association of Applied Linguistics, AESLA’14, pages 18–20, San
Cristobal de la Laguna, Tenerife, Spain.
Aguado de Cea, G. and Bernardos, S. (2007). Calıope: herramienta para ges-
tionar un corpus y un glosario de terminos informaticos. In Proceedings of the
6th Annual Conference of the European Association of Languages for Specific
Purposes, AELFE’07, pages 292–299, Lisbon, Portugal.
Alegria, I., Aranberri, N., Fresno, V., Gamallo, P., Padro, L., San Vicente, I.,
Turmo, J., and Zubiaga, A. (2013). Introduccion a la tarea compartida tweet-
norm 2013: Normalizacion lexica de tuits en espanol. In Alegria, I., Aranberri,
N., Fresno, V., Gamallo, P., Padro, L., San Vicente, I., Turmo, J., and Zu-
biaga, A., editors, Proceedings of the tweet normalisation workshop co-located
with 29th conference of the Spanish Society for Natural Language Processing,
SEPLN’13, pages 1–9, Madrid, Spain.
Alvestrand, H. T. (1995). RFC 1766 – Tags for the identification of languages.
https://www.ietf.org/rfc/rfc1766.txt.
Arnold, M. (1960). Emotion and personality: psychological aspects. Emotion and
Personality. Columbia University Press.
Asur, S. and Huberman, B. A. (2010). Predicting the future with social media.
In Proceedings of the 2010 IEEE/WIC/ACM International Conference on Web
269

Intelligence and Intelligent Agent Technology - Volume 1, WI-IAT’10, pages
492–499, Washington DC, USA. IEEE Computer Society.
Atserias, J., Comelles, E., and Mayor, A. (2005). TXALA: un analizador libre de
dependencias para el castellano. Procesamiento del Lenguaje Natural, 35:455–
456.
Backstrom, L., Kleinberg, J., Kumar, R., and Novak, J. (2008). Spatial variation
in search engine queries. In Proceedings of the 17th international World Wide
Web Conference, WWW’08, pages 357–366, Beijing, China. ACM.
Backus, J. W., Bauer, F. L., Green, J., Katz, C., McCarthy, J., Perlis, A. J.,
Rutishauser, H., Samelson, K., Vauquois, B., Wegstein, J. H., vanWijngaarden,
A., and Woodger, M. (1963). Revised report on the algorithm language ALGOL
60. Communications of the ACM, 6(1):1–17.
Basave, A. E. C., Varga, A., Rowe, M., Stankovic, M., and Dadzie, A.-S. (2013).
Making sense of microposts (#msm2013) concept extraction challenge. In
Proceedings of the Concept Extraction Challenge at the Workshop on ’Mak-
ing Sense of Microposts’ co-located with the 22nd International World Wide
Web Conference, WWW’13, pages 1–15, Rio de Janeiro, Brazil.
Bekios-Calfa, J., Buenaposada, J. M., and Baumela, L. (2014). Robust gender
recognition by exploiting facial attributes dependencies. Pattern Recognition
Letters, 36:228–234.
Bernardos, S. and Barrios, M. (2008). Data model for a lexical resource based on
lexical functions. Research in Computing Science, 27:9–22.
Berners-Lee, T. (1994). RFC 1738 – Uniform Resource Locators (URL). https:
//www.ietf.org/rfc/rfc1738.txt.
Berners-Lee, T., Fielding, R. T., and Masinter, L. (2005). RFC 3986 - Uni-
form Resource Identifier (URI): generic syntax. https://www.ietf.org/rfc/
rfc3986.txt.
270

Boda, K., Foldes, A., Gulyas, G., and Imre, S. (2012). User tracking on the web
via cross-browser fingerprinting. Information Security Technology for Applica-
tions, 7161:31–46.
Borden, N. H. (1964). The concept of the marketing mix. Journal of Advertising
Research, 4(2):2–7.
Box, G. E. P. and Jenkins, G. (1990). Time series analysis, forecasting and
control. Holden-Day, Incorporated.
Breslin, J. G., Decker, S., Harth, A., and Bojars, U. (2006). SIOC: an approach
to connect Web-based communities. International Journal of Web Based Com-
munities, 2(2):133–142.
Brooke, J., Tofiloski, M., and Taboada, M. (2009). Cross-linguistic sentiment
analysis: from English to Spanish. In Proceedings of the 7th International
Conference on Recent Advances in NLP, RANLP’09, Borovets, Bulgaria.
Buitelaar, P., Arcan, M., Iglesias, C. A., Sanchez-Rada, J. F., and Strappar-
ava, C. (2013). Linguistic linked data for sentiment analysis. In Chiarcos, C.,
Cimiano, P., Declerck, T., and McCrae, J. P., editors, Proceedings of the 2nd
Workshop on Linked Data in Linguistics: Representing and Linking Lexicons,
Terminologies and Other Language Data. Collocated with the Conference on
Generative Approaches to the Lexicon, LDL’13, pages 1–8, Pisa, Italy. Associ-
ation for Computational Linguistics.
Burby, J. and Brown, A. (2007). Web Analytics definitions. http:
//www.digitalanalyticsassociation.org/Files/PDF_standards/
WebAnalyticsDefinitionsVol1.pdf.
Burger, J. D., Henderson, J., Kim, G., and Zarrella, G. (2011). Discriminating
gender on Twitter. In Proceedings of the Conference on Empirical Methods in
Natural Language Processing, EMNLP’11, pages 1301–1309, Edinburgh, United
Kingdom. Association for Computational Linguistics.
Cambria, E., Schuller, B., Xia, Y., and Havasi, C. (2013). New avenues in opinion
mining and sentiment analysis. Intelligent Systems, IEEE, 28(2):15–21.
271

Cambria, E. and White, B. (2014). Jumping NLP curves: a review of natural
language processing research. Computational Intelligence Magazine, IEEE,
9(2):48–57.
Carroll, J. J., Bizer, C., Hayes, P., and Stickler, P. (2005). Named graphs, prove-
nance and trust. In Proceedings of the 14th International Conference on World
Wide Web, WWW’05, pages 613–622, Chiba, Japan. ACM.
Cavnar, W. B. and Trenkle, J. M. (1994). N-gram-based text categorization.
In Proceedings of the Third Annual Symposium on Document Analysis and
Information Retrieval, SDAIR’94, pages 161–175, Las Vegas, USA.
Chan, W. S. (2003). Stock price reaction to news and no-news: Drift and reversal
after headlines. Journal of Financial Economics, 70:223–260.
Chang, H., Lee, D., Eltaher, M., and Lee, J. (2012). @phillies tweeting from
philly? predicting twitter user locations with spatial word usage. In Proceedings
of the 2012 IEEE/ACM International Conference on Advances in Social Net-
works Analysis and Mining, ASONAM’12, pages 111–118, Istambul, Turkey.
Chaumartin, F.-R. (2007). Upar7: A knowledge-based system for headline senti-
ment tagging. In Proceedings of the 4th International Workshop on Semantic
Evaluations, SemEval’07, pages 422–425, Prague, Czech Republic. Association
for Computational Linguistics.
Cheng, Z., Caverlee, J., and Lee, K. (2010). You are where you tweet: a
content-based approach to geo-locating twitter users. In Proceedings of the
19th ACM International Conference on Information and Knowledge Manage-
ment, CIKM’10, pages 759–768, Toronto, Canada. ACM.
Chetviorkin, I. I., Braslavski, P. I., and Loukachevitch, N. V. (2011). Rule based
approach to sentiment analysis. In Proceedings of the Sentiment Analysis Track
at the Russian Information Retrieval Evaluation Seminar, ROMIP’11.
Clore, G. L., Ortony, A., and Foss, M. A. (1987). The psychological foundations of
the affective lexicon. Journal of Personality and Social Psychology, 53(4):751–
755.
272

Codina, J. and Atserias, J. (2012). What is the text of a tweet? In Proceedings of
@NLP can u tag #user generated content?! via lrec-conf.org, LREC’12, pages
29–33, Istanbul, Turkey. ELRA.
Cohen, J. (1960). A coefficient of agreement for nominal scales. Educational and
Psychological Measurement, 20(1):37–46.
Corcoran, S. (2009). Defining earned, owned and paid media.
http://blogs.forrester.com/interactive_marketing/2009/12/
defining-earned-owned-and-paid-media.html.
Cortes, C. and Vapnik, V. (1995). Support-vector networks. Machine Learning,
20(3):273–297.
Coursey, K., Mihalcea, R., and Moen, W. (2009). Using encyclopedic knowledge
for automatic topic identification. In Proceedings of the Thirteenth Confer-
ence on Computational Natural Language Learning, CoNLL’09, pages 210–218,
Boulder, Colorado, USA. Association for Computational Linguistics.
Court, D., Elzinga, D., Mulder, S., and Vetvik, O. J. (2009). The consumer
decision journey. McKinsey Quarterly, 3:1–11.
Cunningham, H., Maynard, D., Bontcheva, K., Tablan, V., Aswani, N., Roberts,
I., Gorrell, G., Funk, A., Roberts, A., Damljanovic, D., Heitz, T., Greenwood,
M. A., Saggion, H., Petrak, J., Li, Y., and Peters, W. (2011). Text Processing
with GATE (Version 6). The University of Sheffield, Department of Computer
Science.
De Bruyn, A. and Lilien, G. (2008). A multi-stage model of word-of-mouth influ-
ence through viral marketing. International Journal of Research in Marketing,
25(3):151–163.
Deane, J., Loren, P., and Terry, R. (2011). Behavioural targeting in online ad-
vertising using web surf history analysis and contextual segmentation. Inter-
national Journal of Electronic Business, 9(3):271–291.
Dellarocas, C. (2003). The digitization of word of mouth: Promise and challenges
of online feedback mechanisms. Managegement Science, 49(10):1407–1424.
273
Ding, X. and Liu, B. (2007). The utility of linguistic rules in opinion mining.
In Proceedings of the 30th Annual International ACM SIGIR Conference, SI-
GIR’07, pages 811–812, Amsterdam, The Netherlands. ACM.
Divol, R., Edelman, D., and Sarrazin, H. (2012). Demystifying social media.
McKinsey Quarterly, 12(2):66–77.
Dodig-Crnkovic, G. (2002). Scientific methods in Computer Science. In Proceed-
ings of the Conference for the Promotion of Research in IT at New Universities
and at University Colleges in Sweden, Skovde, Sweden.
Droms, R. (1997). RFC 2131 – Dynamic Host Configuration Protocol. https:
//www.ietf.org/rfc/rfc2131.txt.
Eastlake, D. and Jones, P. (2001). RFC 3174 – US Secure Hash Algorithm 1
(SHA1). https://tools.ietf.org/html/rfc3174.
Eckersley, P. (2010). How unique is your Web browser? In Atallah, M. and
Hopper, N., editors, Privacy Enhancing Technologies, volume 6205 of Lecture
Notes in Computer Science, pages 1–18. Springer Berlin Heidelberg, Berlin,
Heidelberg.
ECMA (2011). Standard ECMA-262. ECMAScript language specification. http:
//www.ecma-international.org/ecma-262/5.1/.
Edelman, D. (2010). Branding in the Digital Age: You’re Spending Your Money
in All the Wrong Places. Harvard Business Review.
Egan, J. (1975). Signal detection theory and ROC-analysis. Academic Press series
in cognition and perception. Academic Press.
Egevang, K. (1994). RFC 1631 – The IP Network Address Translator (NAT).
https://www.ietf.org/rfc/rfc1631.txt.
Ekman, P. (1994). Moods, emotions, and traits. In Ekman, P. and Davidson, R.,
editors, The Nature of Emotion: Fundamental Questions, SAS Series, pages
56–58. Oxford University Press.
274

Ekman, P. (2005). Emotion in the Human Face. Series in Affective Science.
Oxford University Press.
Esuli, A. and Sebastiani, F. (2006). SENTIWORDNET: A publicly available
lexical resource for opinion mining. In Proceedings of the 5th Conference on
Language Resources and Evaluation, LREC’06, pages 417–422, Genoa, Italy.
Fielding, R. T. (2000). Architectural Styles and the Design of Network-based Soft-
ware Architectures. PhD thesis, University of California, Irvine. AAI9980887.
Fielding, R. T. and Reschke, J. (2014a). RFC 7230 – Hypertext Transfer Protocol
(HTTP/1.1): Message Syntax and Routing. https://tools.ietf.org/html/
rfc7230.
Fielding, R. T. and Reschke, J. (2014b). RFC 7231 – Hypertext Transfer Pro-
tocol (HTTP/1.1): Semantics and Content. https://tools.ietf.org/html/
rfc7231.
Fleiss, J. L. (1973). The equivalence of weighted kappa and the intraclass cor-
relation coefficient as measures of reliability. Educational and Psychological
Measurement, 33:613–619.
Franzen, G. and Goessens, C. (1999). Brands & advertising: how advertising
effectiveness influences brand equity. Admap.
Freed, N. and Borenstein, N. (1996). RFC 2045 - Multipurpose Internet Mail
Extensions (MIME) Part One. https://www.ietf.org/rfc/rfc2045.txt.
Fung, G. P. C., Yu, J. X., and Lam, W. (2003). Stock prediction: Integrating
text mining approach using real-time news. In Proceedings of 2003 IEEE Inter-
national Conference on Computational Intelligence for Financial Engineering,
CIFER’03, pages 395–402, Hong Kong, China.
Gabrilovich, E. and Markovitch, S. (2006). Overcoming the brittleness bottle-
neck using wikipedia: Enhancing text categorisation with encyclopaedic knowl-
edge. In Proceedings of the 21st National Conference on Artificial Intelligence,
volume 2 of AAAI’06, pages 1301–1306, Boston, Massachusetts, USA. AAAI
Press.
275

Gabrilovich, E. and Markovitch, S. (2007). Computing semantic relatedness using
Wikipedia-based explicit semantic analysis. In Proceedings of the 20th Interna-
tional Joint Conference on Artificial Intelligence, IJCAI’07, pages 1606–1611,
Hyderabad, India. Morgan Kaufmann Publishers Inc.
Gamallo, P., Garcia, M., and Pichel, J. R. (2013). A method to lexical normali-
sation of tweets. In Alegria, I., Aranberri, N., Fresno, V., Gamallo, P., Padro,
L., San Vicente, I., Turmo, J., and Zubiaga, A., editors, Proceedings of the
Tweet Normalization Workshop co-located with 29th Conference of the Span-
ish Society for Natural Language Processing, SEPLN’13, pages 44–48, Madrid,
Spain.
Gangemi, A., Presutti, V., and Reforgiato Recupero, D. (2014). Frame-based
detection of opinion holders and topics: A model and a tool. Computational
Intelligence Magazine, IEEE, 9(1):20–30.
Garcıa Moya, L. (2008). Un etiquetador morfologico para el espanol de Cuba.
Master’s thesis, Universidad de Oriente. Facultad de Matematica y Com-
putacion, Santiago de Cuba, Cuba.
Gayo-Avello, D. (2011). Don’t turn social media into another ’literary digest’
poll. Communications of the ACM, 54(10):121–128.
Gendron, M. and Feldman Barrett, L. (2009). Reconstructing the past: A century
of ideas about emotion in psychology. Emotion Review, 1(4):316–339.
Goldberg, A. B., Fillmore, N., Andrzejewski, D., Xu, Z., Gibson, B., and Zhu, X.
(2009). May all your wishes come true: A study of wishes and how to recog-
nize them. In Proceedings of Human Language Technologies: The 2009 Annual
Conference of the North American Chapter of the Association for Computa-
tional Linguistics, NAACL’09, pages 263–271, Boulder, Colorado. Association
for Computational Linguistics.
Gomez-Perez, A., Fernandez-Lopez, M., and Corcho, O. (2004). Ontological Engi-
neering: with examples from the areas of Knowledge Management, e-Commerce
and the Semantic Web. First Edition. Advanced Information and Knowledge
Processing. Springer.
276

Graves, M., Constabaris, A., and Brickley, D. (2007). FOAF: connecting people
on the Semantic Web. Cataloging & Classification Quarterly, 43:191–202.
Gruhl, D., Guha, R., Kumar, R., Novak, J., and Tomkins, A. (2005). The pre-
dictive power of online chatter. In Proceedings of the 11th ACM SIGKDD
International Conference on Knowledge Discovery in Data Mining, KDD’05,
pages 78–87, Chicago, Illinois, USA. ACM.
Gupta, P. and Harris, J. (2010). How e-WOM recommendations influence prod-
uct consideration and quality of choice: a motivation to process information
perspective. Journal of Business Research, 63(9–10):1041–1049.
Hall, M., Frank, E., Holmes, G., Pfahringer, B., Reutemann, P., and Witten,
I. H. (2009). The WEKA data mining software: an update. ACM SIGKDD
Explorations Newsletter, 11(1):10–18.
Han, X., Wei, W., Miao, C., Mei, J., and Song, H. (2014). Context-aware personal
information retrieval from multiple social networks. Computational Intelligence
Magazine, IEEE, 9(2):18–28.
Harding, W., Reed, A., and Gray, R. (2001). Cookies and web bugs: What they
are and how they work together. Information Systems Management, 18:17–24.
Hatzivassiloglou, V. and McKeown, K. R. (1997). Predicting the semantic orien-
tation of adjectives. In Proceedings of the 8th Conference on European Chapter
of the Association for Computational Linguistics, EACL’97, pages 174–181,
Madrid, Spain. Association for Computational Linguistics.
Hennig-Thurau, T., Malthouse, E. C., Friege, C., Gensler, S., Lobschat, L., Ran-
gaswamy, A., and Skiera, B. (2010). The impact of new media on customer
relationships. Journal of Service Research, 13(3):311–330.
Hovi, E., Markman, V., Martell, C., and Uthus, D. (2013). Analyzing microtext.
In Proceedings of the 2013 AAAI Spring Symposia, AAAI’13, page vii, Palo
Alto, California, USA. Association for the Advancement of Artificial Intelli-
gence.
277

Hu, X. and Cercone, N. (2004). A data Warehouse/OLAP framework for web us-
age mining and business intelligence reporting. International Journal of Com-
putational Intelligence Systems, 19:585–606.
IEEE (1990). IEEE standard flossary of software engineering terminology. IEEE
Standard 610.12-1990, Standards Coordinating Committee of the Computer
Society of the IEEE.
IEEE (1995a). IEEE guide for software quality assurance planning. IEEE Stan-
dard 730.1-1995, Software Engineering Standards Committee of of the IEEE
Computer Society.
IEEE (1995b). IEEE standard for developing software life cycle processes. IEEE
Standard 1074-1995, IEEE Computer Society.
IEEE (1997). IEEE standard for developing software life cycle processes. IEEE
Standard 1074-1997, IEEE Computer Society.
Jaccard, P. (1901). Etude comparative de la distribution florale dans une portion
des Alpes et des Jura. Bulletin del la Societe Vaudoise des Sciences Naturelles,
37:547–579.
Joshi, M., Das, D., Gimpel, K., and Smith, N. A. (2010). Movie reviews and
revenues: An experiment in text regression. In Human Language Technologies:
The 2010 Annual Conference of the North American Chapter of the Association
for Computational Linguistics, HLT’10, pages 293–296, Los Angeles, California,
USA. Association for Computational Linguistics.
Jurafsky, D. and Martin, J. H. (2009). Speech and Language Processing: An
Introduction to Natural Language Processing, Computational Linguistics, and
Speech Recognition. Prentice Hall.
Katz, P., Singleton, M., and Wicentowski, R. (2007). SWAT-MP: The SemEval-
2007 Systems for Task 5 and Task 14. In Proceedings of the 4th Interna-
tional Workshop on Semantic Evaluations, SemEval’07, pages 308–313, Prague,
Czech Republic. Association for Computational Linguistics.
278

Kaufmann, M. and Jugal, K. (2010). Syntactic normalization of twitter messages.
In Proceedings of the International Conference on Natural Language Processing,
ICON’10, pages 2–8, Kharagpur, India.
Kaushik, A. (2007). Web Analytics: an hour a day. John Wiley & Sons, Incor-
porated.
Kaushik, A. (2009). Web Analytics 2.0: the art of online accountability and
science of customer centricity. Wiley.
Kemps-Snijders, M., Windhouwer, M., Wittenburg, P., and Wright, S. E. (2008).
ISOcat: corralling data categories in the wild. In Calzolari, N., Choukri, K.,
Maegaard, B., Mariani, J., Odijk, J., Piperidis, S., and Tapias, D., editors,
Proceedings of the 6th International Conference on Language Resources and
Evaluation, LREC’08, pages 887–891, Marrakech, Morocco. European Lan-
guage Resources Association (ELRA).
Kimball, R., Reeves, L., Thornthwaite, W., Ross, M., and Thornwaite, W. (1998).
The Data Warehouse Lifecycle Toolkit: Expert Methods for Designing, Devel-
oping and Deploying Data Warehouses. John Wiley & Sons, Inc., New York,
NY, USA, 1st edition.
Kimball, R. and Ross, M. (2002). The Data Warehouse Toolkit: The Complete
Guide to Dimensional Modelling. John Wiley & Sons, Inc., New York, USA,
2nd edition.
Kleinginna, P. R. and Kleinginna, A. M. (1981). A categorized list of emotion def-
initions, with suggestions for a consensual definition. Motivation and Emotion,
5(4):345–379.
Kohavi, R. and Provost, F. (1998). Glossary of terms. Machine Learning,
30(2/3):271–274.
Kothari, C. (2004). Research Methodology: Methods and Techniques. New Age
International Publishers Limited, second edition.
Kowalski, G. (1997). Information Retrieval Systems. Theory and Implementation.
Kluwer Academic Publishers.
279

Kozareva, Z., Navarro, B., Vazquez, S., and Montoyo, A. (2007). UA-ZBSA:
A headline emotion classification through Web information. In Proceedings of
the 4th International Workshop on Semantic Evaluations, SemEval’07, pages
334–337, Prague, Czech Republic. Association for Computational Linguistics.
Kozinets, R. V., de Valck, K., Wojnicki, A. C., and Wilner, S. J. (2010). Net-
worked narratives: Understanding word-of-mouth marketing in online commu-
nities. Journal of Marketing, 74(2):71–89.
Larsen, B. and Aone, C. (1999). Fast and effective text mining using linear-time
document clustering. In Proceedings of the 5th ACM SIGKDD international
conference on Knowledge discovery and data mining, KDD’99, pages 16–22,
San Diego, California, USA.
le Cessie, S. and van Houwelingen, J. (1992). Ridge estimators in logistic regres-
sion. Applied Statistics, 41(1):191–201.
Leech, G. and Wilson, A. (1996). EAGLES. Recommendations for the
morphosyntactic annotation of corpora. http://www.ilc.cnr.it/EAGLES/
annotate/annotate.html.
Levenshtein, V. I. (1966). Binary codes capable of correcting deletions, insertions,
and reversals. Soviet Physics Doklady, 10(8):707–710.
Lewis, E. (1903). Advertising department: Catch-line and argument. The Book-
Keeper, 15:124–128.
Li, P., Dong, X. L., Maurino, A., and Srivastava, D. (2011). Linking temporal
records. Proceedings of the VLDB Endowment,, 4(11):956–967.
Liu, B. (2010). Sentiment analysis and subjectivity. In Indurkhya, N. and Dam-
erau, F. J., editors, Handbook of Natural Language Processing, Second Edition,
pages 1–38. CRC Press, Taylor and Francis Group, Boca Raton, USA.
Liu, B. (2012). Sentiment Analysis and Opinion Mining. Morgan & Claypool.
Maldonado, S. (2009). Analıtica Web: medir para triunfar. ESIC Editorial,
Pozuelo de Alarcon, Madrid.
280

Mayer, J., Narayanan, A., and Stamm, S. (2011). Do Not Track: a Uni-
versal third-party Web tracking opt out. https://tools.ietf.org/html/
draft-mayer-do-not-track-00.
McCarthy, E. J. and Brogowicz, A. A. (1981). Basic marketing: a managerial
approach. Irwin Series in Marketing. R.D. Irwin.
McPherson, M., Smith-Lovin, L., and Cook, J. M. (2001). Birds of a feather:
Homophily in social networks. Annual Review of Sociology, 27(1):415–444.
Mel’cuk, I. (1996). Lexical functions: A tool for the description of lexical relations
in a lexicon. In Wanner, L., editor, Lexical functions in lexicography and natural
language processing, Studies in language companion series, pages 37–102. John
Benjamins, Amsterdam, Philadelphia, USA.
Mihalcea, R. (2007). Using Wikipedia for automatic word sense disambiguation.
In Sidner, C. L., Schultz, T., Stone, M., and Zhai, C., editors, Proceedings of
the North American Chapter of the Association for Computational Linguistics,
NAACL-HLT’07, pages 196–203, Rochester, NY, USA. The Association for
Computational Linguistics.
Miles, A., Matthews, B., Wilson, M., and Brickley, D. (2005). SKOS core: simple
knowledge organisation for the Web. In Proceedings of the 2005 International
Conference on Dublin Core and Metadata Applications: Vocabularies in Prac-
tice, DCMI’05, pages 1:1–1:9, Madrid, Spain. Dublin Core Metadata Initiative.
Mishne, G. and Glance, N. (2006). Predicting movie sales from blogger senti-
ment. In Proceedings of the AAAI Symposium on Computational Approaches
to Analysing Weblogs (), AAAI-CAAW’06, pages 155–158.
Mislove, A., Lehmann, S., Ahn, Y.-Y., Onnela, J.-P., and Rosenquist, J. N.
(2011). Understanding the demographics of Twitter users. In Proceedings of the
5th International AAAI Conference on Weblogs and Social Media, ICWSM’11,
pages 554–557, Barcelona, Spain.
Mockapetris, P. (1987). RFC 1035 – Domain Names – Implementation and Spec-
ification. https://www.ietf.org/rfc/rfc1035.txt.
281

Mullen, T. and Collier, N. (2004). Sentiment analysis using support vector ma-
chines with diverse information sources. In Proceedings of Conference on Em-
pirical Methods in Natural Language Processing, EMNLP’04, pages 412–418.
Ng, S. and Hill, S. R. (2009). The impact of negative word-of-mouth in Web
2.0 on brand equity. In Proceedings of the 2009 ANZMAC Annual Conference,
ANZMAC’09, Melbourne, Australia. Monash University.
Nielsen (2012a). Global trust in advertising and brand mes-
sages. http://www.nielsen.com/us/en/insights/reports/2013/
global-trust-in-advertising-and-brand-messages.html.
Nielsen (2012b). State of the media – the social media re-
port. http://www.nielsen.com/us/en/insights/reports/2012/
state-of-the-media-the-social-media-report-2012.html.
Noble, S., Cooperstein, D. M., Kemp, M. B., and Munchbach, C.
(2010). It’s time to bury the marketing funnel – an empowered
report. https://www.forrester.com/Its+Time+To+Bury+The+Marketing+
Funnel/fulltext/-/E-res57495.
Nottingham, M. and Sayre, R. (2005). RFC 4287 – The Atom Syndication For-
mat. https://tools.ietf.org/html/rfc4287.
Ntoulas, A., Najork, M., Manasse, M., and Fetterly, D. (2006). Detecting spam
web pages through content analysis. In Proceedings of the 15th International
Conference on World Wide Web, WWW’06, pages 83–92, Edinburgh, Scotland,
UK. ACM.
O’Leary, D. (2013). Artificial intelligence and big data. Intelligent Systems,
IEEE, 28(2):96–99.
Oliver, R. (1989). Processing of the satisfaction response in consumption: A sug-
gested framework and research propositions. Journal of Consumer Satisfaction,
Dissatisfaction and Complaining Behaviour, 2(1):1–16.
OMG (2011). OMG Unified Modelling Language (OMG UML), Superstructure.
http://www.omg.org/spec/UML/2.4.1/Superstructure/PDF/.
282

Ortony, A., Clore, G., and Collins, A. (1990). The Cognitive Structure of Emo-
tions. Cambridge University Press.
Padro, L. and Stanilovsky, E. (2012). FreeLing 3.0: towards wider multilin-
guality. In Proceedings of the Language Resources and Evaluation Conference,
LREC’12, pages 2473–2479, Istanbul, Turkey. ELRA.
Page, L., Brin, S., Motwani, R., and Winograd, T. (1999). The PageRank cita-
tion ranking: Bringing order to the Web. Technical Report 1999-66, Stanford
InfoLab.
Pang, B. and Lee, L. (2008). Opinion mining and sentiment analysis. Foundations
and Trends. Information Retrieval, 2(1-2):1–135.
Phillips, D. M. and Baumgartner, H. (2002). The role of consumption emotions
in the satisfaction response. Journal of Consumer Psychology, 12(3):243–252.
Plutchik, R. (1989). Emotion: Theory, Research, and Experience. Acad. Press.
Pookulangara, S. and Koesler, K. (2011). Cultural influence on consumers’ usage
of social networks and its’ impact on online purchase intentions. Journal of
Retailing and Consumer Services, 18(4):348–354.
Postel, J. (1981). RFC 791 – Internet Protocol - DARPA Internet Program,
Protocol Specification. https://www.rfc-editor.org/rfc/rfc791.txt.
Prabowo, R. and Thelwall, M. (2009). Sentiment analysis: a combined approach.
Journal of Informetrics, 3(2):143–157.
Quinlan, R. (1993). C4.5: Programs for Machine Learning. Morgan Kaufmann
Publishers, San Mateo, CA.
Ramanand, J., Bhavsar, K., and Pedanekar, N. (2010). Wishful thinking: Find-
ing suggestions and ’buy’ wishes from product reviews. In Proceedings of the
NAACL HLT 2010 Workshop on Computational Approaches to Analysis and
Generation of Emotion in Text, CAAGET’10, pages 54–61, Los Angeles, Cali-
fornia, USA. Association for Computational Linguistics.
283
Rand, W. M. (1971). Objective criteria for the evaluation of clustering methods.
Journal of the American Statistical Association, 66(336):846–850.
Rao, D., Yarowsky, D., Shreevats, A., and Gupta, M. (2010). Classifying latent
user attributes in Twitter. In Proceedings of the 2nd International Workshop on
Search and Mining User-Generated Contents, SMUC’10, pages 37–44, Toronto,
Canada. ACM.
Reese, W. (2008). Nginx: the high-performance web server and reverse proxy.
Linux Journal.
Rentoumi, V., Petrakis, S., Klenner, M., Vouros, G. A., and Karkaletsis, V.
(2010). United we stand: Improving sentiment analysis by joining machine
learning and rule-based methods. In Calzolari, N., Choukri, K., Maegaard,
B., Mariani, J., Odijk, J., Piperidis, S., Rosner, M., and Tapias, D., editors,
Proceedings of the 7th International Conference on Language Resources and
Evaluation, LREC’10), pages 1089–1094, Valletta, Malta. European Language
Resources Association (ELRA).
Richins, M. L. (1997). Measuring emotions in the consumption experience. Jour-
nal of Consumer Research, 24(2):127–146.
Rosch, E. (1978). Principles of categorization. In Rosch, E. and Lloyd, B., editors,
Cognition and Categorization, pages 27–48. John Wiley & Sons Inc.
Sadikov, E., Parameswaran, A. G., and Venetis, P. (2009). Blogs as predictors of
movie success. In Proceedings of the Third International ICWSM Conference,
ICWSM’09, pages 304–307.
Sanchez-Rada, J. F. and Iglesias, C. A. (2013). Onyx: describing emotions on the
Web of data. In Proceedings of the First International Workshop on Emotion
and Sentiment in Social and Expressive Media: Approaches and Perspectives
from AI, volume 1096 of ESSEM’13, pages 71–82, Torino, Italy. AI*IA, Italian
Association for Artificial Intelligence, CEUR-WS.
284

Santorini, B. (1991). Part-Of-Speech tagging guidelines for the Penn Treebank
project (3rd revision, 2nd printing). Technical report, Department of Linguis-
tics, University of Pennsylvania.
Schindler, R. and Bickart, B. (2005). Published word of mouth: referable,
consumer-generated information on the internet. Online Consumer Psychol-
ogy: Understanding and Influencing Consumer Behaviour in the Virtual World,
pages 35–61.
Schmid, H. (1994). Probabilistic part-of-speech tagging using decision trees. In
Proceedings of the International Conference on New Methods in Language Pro-
cessing, NeMLaP’94, Manchester, UK.
Shannon, C. E. (1948). A mathematical theory of communication. Bell System
Technical Journal, 27:379–423 and 623–656.
Shannon, C. E. and Warren, W. (1949). The mathematical theory of communi-
cation. University of Illinois Press.
Sharda, R. and Delen, D. (2006). Predicting box-office success of motion pictures
with neural networks. Expert Systems Applications, 30(2):243–254.
Shaver, P., Schwartz, J., Kirson, D., and O’Connor, C. (1987). Emotion knowl-
edge: further exploration of a prototype approach. Journal of Personality and
Social Psychology, 52(6):1061–1086.
Shearer, C. (2000). The CRISP-DM model: The new blueprint for data mining.
Journal of Data Warehousing, 5(4):13–22.
Shinavier, J. (2010). Real-time #SemanticWeb in <= 140 chars. In Proceedings
of the WWW2010 Workshop on Linked Data on the Web, WWW’10, Raleigh,
North Carolina, USA.
Sidorov, G., Miranda-Jimenez, S., Viveros-Jimenez, F., Gelbukh, A., Castro-
Sanchez, N., Velasquez, F., Dıaz-Rangel, I., Suarez-Guerra, S., Trevino, A.,
and Gordon, J. (2013). Empirical study of machine learning based approach
for opinion mining in tweets. In Proceedings of the 11th Mexican International
285
Conference on Advances in Artificial Intelligence - Volume Part I, MICAI’12,
pages 1–14, San Luis Potosí, Mexico. Springer-Verlag.
Sison, A. and J., F. (2005). Ethical aspects of e-commerce: data subjects and
content. International Journal of Internet Marketing and Advertising, 3:5–18.
Sommerville, I. (2007). Software Engineering. International Computer Science
Series. Addison-Wesley, eighth edition.
Sproat, R., Black, A. W., Chen, S., Kumar, S., Ostendorf, M., and Richards, C.
(2001). Normalization of non-standard words. Computer Speech & Language,
15(3):287–333.
Sterne, J. (2010). Social Media Metrics: How to Measure and Optimize Your
Marketing Investment. John Wiley & Sons.
Stone, P. J., Dunphy, D. C., Smith, M. S., and Ogilvie, D. M. (1966). The General
Inquirer: A Computer Approach to Content Analysis. M.I.T. Press.
Strapparava, C. and Mihalcea, R. (2007). SemEval-2007 Task 14: Affective Text.
In Proceedings of the 4th International Workshop on Semantic Evaluations,
SemEval’07, pages 70–74, Prague, Czech Republic. Association for Computa-
tional Linguistics.
Suarez-Figueroa, M. C., Gomez-Perez, A., and Fernandez-Lopez, M. (2012).
The NeOn methodology for ontology engineering. In Suarez-Figueroa, M. C.,
Gomez-Perez, A., Motta, E., and Gangemi, A., editors, Ontology Engineering
in a Networked World, chapter 2, pages 9–34. Springer.
Subramanyam, R. (2011). The relationship between social media buzz
and TV ratings. http://www.nielsen.com/us/en/insights/news/2011/
the-relationship-between-social-media-buzz-and-tv-ratings.html.
Taboada, M., Brooke, J., Tofiloski, M., Voll, K., and Stede, M. (2011). Lexicon-
based methods for sentiment analysis. Computational Linguistics, 37(2):267–
307.
286

Tetlock, P. C., Saar-Tsechansky, M., and Macskassy, S. (2008). More than words:
Quantifying language to measure firms’ fundamentals. Journal of Finance,
63(3):1437–1467.
Thayer, R. (1989). The Biopsychology of Mood and Arousal. Oxford University
Press, New York, NY.
Turney, P. D. (2002). Thumbs up or thumbs down?: Semantic orientation applied
to unsupervised classification of reviews. In Proceedings of the 40th Annual
Meeting on Association for Computational Linguistics, ACL’02, pages 417–424,
Philadelphia, Pennsylvania, USA. Association for Computational Linguistics.
Valitutti, A., Strapparava, C., and Stock, O. (2004). Developing affective lexical
resources. PsychNology Journal, 2(1):61–83.
van Bruggen, G. H., Antia, K. D., Jap, S. D., Reinartz, W. J., and Pallas, F.
(2010). Managing marketing channel multiplicity. Journal of Service Research
(JSR), 13(3):331–340.
Vaughn, R. (1986). How advertising works: A planning model revisited. Journal
of Advertising Research, 26:57–66.
Vilares, D., Alonso, M., and Gomez-Rodrıguez, C. (2013). Clasificacion de po-
laridad en textos con opiniones en espanol mediante analisis sintactico de de-
pendencias. Procesamiento del Lenguaje Natural, 50(0).
Vazquez, S., Munoz-Garcıa, O., Campanella, I., Poch, M., Fisas, B., Bel, N., and
Andreu, G. (2014). A classification of user-generated content into consumer
decision journey stages. Neural Networks, 56:68–81.
Wang, K., Thraser, C., and Hsu, P. B.-J. (2011). Web Scale NLP: a case study
on URL word breaking. In Proceedings of the 20th international conference on
World Wide Web, WWW’11, pages 357–366, Hyderabad, India. ACM.
Wang, X., Yu, C., and Wei, Y. (2012). Social media peer communication and
impacts on purchase intentions: A consumer socialization framework. Journal
of interactive marketing: a quarterly publication from the Direct Marketing
Educational Foundation, 26(4):198–209.
287

Weber, L. (2007). Marketing to the social Web: how digital customer communities
build your business. Wiley.
Westbrook, R. A. and Oliver, R. L. (1991). The dimensionality of consumption
emotion patterns and consumer satisfaction. Journal of Consumer Research,
18(1):84–91.
Westerski, A., Iglesias, C. A., and Tapia, F. (2011). Linked opinions: describing
sentiments on the structured Web of Data. In Proceedings of the 4th Interna-
tional Workshop on Social Data on the Web, SDoW’11, Bonn, Germany.
Wiebe, J., Wilson, T., and Cardie, C. (2005). Annotating expressions of opinions
and emotions in language. Language Resources and Evaluation, 39(2-3):165–
210.
Wu, X. and He, Z. (2011). Identifying wish sentence in product reviews. Journal
of Computational Information Systems, 7:1607–1613.
Yergeau, F. (2003). RFC 3629 – UTF-8, a transformation format of ISO 10646.
https://tools.ietf.org/html/rfc3629.
Zhang, W. and Skiena, S. (2009). Improving movie gross prediction through
news analysis. In Proceedings of the 2009 IEEE/WIC/ACM International Joint
Conference on Web Intelligence and Intelligent Agent Technology - Volume 01,
WI-IAT’09, pages 301–304, Washington, DC, USA. IEEE Computer Society.
Zhao, Y. and Karypis, G. (2001). Criterion functions for document clustering:
experiments and analysis. Technical report, Department of Computer Science,
University of Minnesota.
288