methods for aggregation and communication of life cycle...
TRANSCRIPT

Methods for aggregation and communication of life cycle inventory data within the framework of eco-efficiency analysis A case study at Akzo Nobel Master of Science Thesis in the Master Degree Programme, Industrial Ecology TOBIAS BORÉN Department of Energy and Environment Division of Environmental Systems Analysis CHALMERS UNIVERSITY OF TECHNOLOGY Göteborg, Sweden, 2008 ESA-Report No. 2008:4, ISSN 1404-8167

Abstract In meeting the needs of a large and growing population with increasing affluence, industry puts a significant stress on the environment. Thus there are demands on the corporate world to decouple economic activity from environmental impact, i.e. to become more eco-efficient. Eco-efficiency analysis (EEA) is a tool that implements the concept of eco-efficiency into the daily operations of a business by integrating Life Cycle Costing (LCC) and Life Cycle Analysis (LCA). These tools help decision makers in making environmentally and economically motivated choices. However, LCA:s can generate life cycle inventory lists of complex environmental data which decision makers often have limited time or knowledge to interpret. Also the economic and environmental indicators need to be combined in a way so as to facilitate sound eco-efficiency comparisons in decision making. Therefore the purpose of this thesis was to investigate methods for aggregation and communication of life cycle inventory data within the framework of eco-efficiency analysis, i.e. weighting methods for aggregation of LCA inventory data, and methods for integration of LCA and LCC data. Seven different weighting methods, and different ways of integrating LCC and LCA data, were applied in an eco-efficiency analysis of a waste water treatment plant at Akzo Nobel Site Stenungsund. In this case study the present process conditions are scrutinized and compared to different scenarios representing other process settings. Furthermore, two established principles for weighting were used to develop a set of weighting indexes adapted to the environmental targets and preferences of the authorities in Stenungsund municipality. The results from the case study indicate that from an eco-efficiency perspective it is not motivated to change the present process conditions. It also shows that different weighting methods generate different results concerning what is the most environmentally benign process setting. This is because different weighting methods are based on different preferences towards nature and society. However, the study also identifies possibilities for case and site specific weighting, i.e. weighting which is adapted to the environmental and institutional context of the study. This proves the weighting to be meaningful in adding information, and providing adequate and easy-to-interpret indicators, to assist in decision processes. The most appropriate way to aggregate LCA and LCC data will depend on the context of the study. What is to be communicated and who is to take part of the information are important aspects. The LCA and LCC data can be kept separate in a two-dimensional index, and be presented in a graph, or they can be combined into a one-dimensional eco-efficiency index by taking the ratio of the two. The study indicates that in general interpretation of a one-dimensional index requires more knowledge of the concept of eco-efficiency. This can be a problem when applied in decision making. Simpler to grasp is a two-dimensional graph which communicates the absolute and/or relative effectiveness of different alternatives. A one-dimensional index can however complement a two-dimensional index in also communicating the efficiency in terms of a benefit over costs incurred to generate that benefit. Moreover, depending on which interpretation key that is used, the effects of choices at the micro level on the macro level eco-efficiency will vary. For the global community to become more eco-efficient all actors in society need to take responsibility for becoming more eco-efficient in their actions. For corporations this means that it could be wise to measure the eco-efficiency at the corporate level. The measure should then be in the form of a one-dimensional index with e.g. value added on the nominator and environmental impact on the denominator.

Acknowledgements This thesis is the final part of my engineering studies. The thesis has been carried out at the department of Environmental Systems Analysis at Chalmers University of Technology and at Akzo Nobel. First of all, I would like to thank my examiner Bengt Steen, who also acted as my supervisor and contributed with valuable input. At Akzo Nobel I would like to thank Sara Tollin, Klas Hallberg, Johan Widheden and Knut Andrén for their input and help with practical issues. I would also like to thank Mattias Kindstrand for providing the information needed for the study.
Table of Contents
1 INTRODUCTION ........................................................................................................1
1.1 BACKGROUND .........................................................................................................1 1.2 PURPOSE..................................................................................................................2 1.3 SCOPE......................................................................................................................2 1.4 METHOD..................................................................................................................2 1.5 DELIMITATIONS .......................................................................................................2
2 ECO-EFFICIENCY......................................................................................................3
2.1 THE CONCEPT ..........................................................................................................3 2.2 WHY ECO-EFFICIENCY?............................................................................................3 2.3 MEASURING ECO-EFFICIENCY ...................................................................................4
2.3.1 Weighting............................................................................................................5 2.3.2 Two-dimensional eco-efficiency index .................................................................8 2.3.3 One-dimensional index........................................................................................9
3 AKZO NOBEL CASE STUDY ..................................................................................10 3.1 AKZO NOBEL .........................................................................................................10 3.2 ECO-EFFICIENCY ANALYSIS OF GLYCOL WASTE WATER TREATMENT PROCESS ..........10
3.2.1 Background.......................................................................................................10 3.2.2 Goal and Scope Definition ................................................................................12 3.2.3 Results...............................................................................................................14 3.2.4 Sensitivity Analysis............................................................................................19 3.2.5 Conclusions and Recommendations...................................................................21
4 DISCUSSION..............................................................................................................23
5 CONCLUSIONS .........................................................................................................35
APPENDICES I Eco-efficiency analysis methodology II Environmental Themes Stenungsund – methodology report III BASF eco-efficiency interpretation key IV Inventory profile for the glycol waste water treatment service

1
1 Introduction
1.1 Background Humans have many different needs, including not only basic needs such as food security, but also needs of status and self-realization. The human being inflicts a strain on the environment when the benefits of satisfying these needs outweigh the predicted negative consequences. Through production systems business organisations can supply services satisfying the needs of humans. Schumacher wrote in 1973 about at that time almost conventionally idea that “the problem of production” had been solved, and argued that this is a misconception, based on a skewed view on finite natural capital as income. He also claimed that this misconception holds us on an unsustainable path in which the industrial system consumes the very basis of its subsistence. Meadows et al (1972) made a similar assessment and stated that if the industrial system stays on a business-as-usual path, the carrying capacity of the earth will be exceeded within this century. However, they also concluded that there are means to change into a sustainable path. In relation to this the World Commission on Environment and Development (WCED) was asked by the General Assembly of the United Nations, to produce a “Global agenda for change” (WCED 1987). The work resulted in the Brundtland report “Our Common Future” in which sustainable development is defined as “development that meets the needs of the present without compromising the ability of future generations to meet their own needs”. Sustainable development is commonly perceived as comprising three dimensions of sustainability; economic growth, ecological balance and social progress. For a business organisation to promote sustainable development it needs to integrate considerations of all these dimensions into its activities. In embracing the economic and ecological aspects of sustainable development eco-efficiency is generally defined as creating more value with less environmental impact. Eco-Efficiency Analysis (EEA) is a tool for implementing eco-efficiency into the operational functions of business. It includes Life Cycle Costing (LCC) and Life Cycle Assessment (LCA), which are tools for performing an economic and environmental assessment of a system from a life cycle (cradle to grave) perspective. LCA:s generates environmental profiles which might consist of vast amounts of data denoting different environmental interventions and aspects of a product, process or service. For purposes of easy communication and interpretation these environmental interventions can be aggregated into a one dimensional index through a process called weighting. There has been a development of several methods for weighting of different environmental loads. It has been shown in case studies that different weighting methods will give different results (e.g. Baumann and Rydberg, 1994). Hence, for being able to adequately interpret the index a weighting method generates one need to have an understanding of what the methods for environmental impact assessment are based on (Rydh et al, 2002). Furthermore, the use of LCA, and thus also EEA:s, can only be justified by its use in decision making (Hertwich & Hammitt, 2001-1). Behavioural sciences have identified that the behaviour of an individual is very much affected by the way a decision is presented. There are a number of ways in which an eco-efficiency result can be presented to decision makers.

2
1.2 Purpose The aim with this thesis is to investigate and evaluate how economic data and different types of environmental data are aggregated into an eco-efficiency index. Questions at issue are:
- When is it appropriate to aggregate different kinds of environmental data into a single number (weighting)?
- What methods are there for weighting, and which are used in industry? - What are the preferences and principles that the different weighting methods are based
upon? - Who is making the evaluation in the different weighting methods? - Do the different weighting methods give different results? - How is a trade off made between environment and economy in EEA? - Will the most eco-efficient alternative at the product/process level also be the most
eco-efficient alternative at the macro level? - How can an aggregated eco-efficiency result best be presented in decision making
processes? - Can an eco-efficiency methodology for value related and environmentally connected
trade offs be developed for integration into the operations of an organisation? How can these trade-offs be communicated for acceptance?
A case study is performed at Akzo NOBEL to put eco-efficiency methodology into practice, and to demonstrate how choice of weighting method and choice of eco-efficiency interpretation key affects the final result. The aim of the case study is to identify the most eco-efficient utilization of a waste water treatment process.
1.3 Scope The results of the case study are intended to be used in a decision-making situation considering optimal utilization of the waste water treatment process.
1.4 Method Information gathering was conducted in order to gain a theoretical understanding of the concepts and tools related to eco-efficiency. This was done through literature research, internet sources and personal communication with employees at Akzo Nobel and representatives of Stenungsund municipality. An EEA was then applied on a case study at Akzo Nobel in Stenungsund, and a set of weighting indexes was developed to the specific context of this study. An account on the derivation of these weighting indexes is found in Appendix II, and a detailed description of EEA methodology is presented in Appendix I.
1.5 Delimitations There are many methods for aggregating an inventory list of different environmental interventions into a one-dimensional index. This thesis covers only a handful of these. Often a production system give rise to a wide array of different environmental interventions, however, the focus of this study is emissions of COD to water, and emissions of typical combustion products, CO2, NOx, VOC and SO2 into air. Case specific weighting indexes could be established for these loads as well as for N and P emissions to water. Two different kinds of eco-efficiency indexes are used. Alternative methods to measure environmental impacts in relation to financial data have not been taken into considerations.

3
2 Eco-efficiency This chapter introduces the eco-efficiency concept and explains how one can measure the eco-efficiency performance of a product, process or service. It also explains how eco-efficiency can be integrated into strategic decision making and helps a corporation to become more profitable.
2.1 The concept Eco-efficiency was first defined by Schaltegger and Sturm in 1989 as to create more value with less environmental impact. Today there are many different definitions of eco-efficiency, but they all relate environmental impact to the value created, and the concept is generally understood as “the minimization of the ecological impact of overall systems while keeping economic factors in mind” (Saling et al, 2002). Hence the concept encompasses two of the three corner stones of sustainable development (Rydh et al, 2002). Even though the concept was defined in 1989 it was not made known until in 1993 after the 1992 Rio summit, as the World Business Council on Sustainable Development (WBCSD) defined eco-efficiency as a management philosophy, which encourages businesses to decouple value creation from environmental impact. Eco-efficiency can hence be seen as a strategic concept which enables business to strengthen its competitive position while developing new and more sustainable solutions through eco-innovation (Akzo Nobel, 2006).
2.2 Why Eco-efficiency? There are obvious ethical and moral reasons to strive for eco-efficiency, as a decoupling of economic activity from environmental impact will favour all moral and non-moral objects. But how can eco-efficiency implementation be justified from a business perspective? In the Swedish Companies Act it is stated that the primary objective for a corporation is to generate as much profit as possible for its shareholder’s, if nothing else is stated in the articles of association (Westerlund, 2001). Westerlund (2001) mentions several reasons for why the law has been formulated this way, but the primary reason is to attract capital to corporations. But there are no provisions in the law about the time perspective, and this raises the question about whether the corporation should strive for profit maximization in the short term or in the long term? The advantage with a short time perspective is that the shareholders quickly will see economic benefits of their investments. The advantage with the long term perspective is that it promotes the corporation’s sustainability, which will be beneficial to the shareholder’s in the long term. And as environmental awareness increases, the criteria for business success will change and broaden. Environmental standards have greatly advanced (e.g. REACH), nature becomes economy as costs for insurances, raw materials, energy and emissions increase, and the demand for green products has increased and will continue to do so in the future. This reshapes the competitive environment for business organisations, which will have to prepare for the future in order to secure their long term success. This also justifies the long term approach to sustainable and safe profit maximization, by integrating environmental concerns into strategic decision making. Environmental management systems such as ISO14001 and EMAS can be useful to increase the environmental awareness and structure the environmental work within an organisation.

4
However, whereas they have proved to be effective in harnessing low hanging fruits, they can be ineffective in integrating environmental concerns into business decision making (Hallberg 2007). EEA can be more effective with regard to this, and there are many different situations in which it can be useful to determine the eco-efficiency of a product or service (Figure 2).
Figure 1. Different applications for which EEA might be useful. Source: Sustainable Development, 2007.
In these situations EEA:s can provide for competitive advantages through e.g. (Sustainable Development, 2007):
Forming a basis for better and more conclusive decision making Guiding more efficient work Being informative about future conditions Offering a foundation for marketing activities related to sustainability issues
By integrating concerns about the environment in strategic decision making and so becoming more eco-efficient an organisation can become more profitable through promoting top line growth, capital efficiency and operational efficiency (Hallberg, 2007).
Top line growth – more eco-efficient products and services will be more attractive as they can lower the costs, increase profitability and/or improve the environmental performance for the costumers.
Capital efficiency – more eco-efficient investments will lower the capital costs and/or be more environmentally benign
Operational efficiency – running an activity more eco-efficient can mean lower costs and/or less waste of natural resources, i.e. it will promote resource efficiency.
Hence an eco-efficient corporation will create more value while lowering the impact on natural capital. Being eco-efficient can also be seen as a future investment, as it is likely that external cost will be internalised to a greater extent in the future. Therefore, integrating the eco-efficiency concept in decision making can be a means of profit maximization, and a help in securing the long term success of a corporation.
2.3 Measuring eco-efficiency Eco-efficiency analysis (EEA) is the tool that implements the concept of eco-efficiency into the daily operations of a business by integrating and quantifying the environmental and financial impacts of a system (EEA methodology is further elaborated in Appendix II). The
5
financial impact can be determined in different ways depending on the objective of the study, but it is common place to assess it through life cycle costing (LCC) or total cost accounting, while the environmental dimension frequently is assessed with a Life Cycle Assessment (LCA). The LCA generates a list of different environmental loads, which can be sorted into a limited number of environmental impact categories and assigned category equivalents which express the intervention’s potential contribution to the impact category relative some intervention (e.g. CO2 equivalents for the impact category “Global Warming”). This results in a list of different environmental impact potentials, e.g. acidification potential, eutrophication potential, human toxicity potential and global warming potential. The various environmental loads and impact potentials can then be combined with the cost side individually, but this can generate a confusing set of partial results. To avoid this and to simplify communication the different environmental loads can be aggregated into a one-dimensional index through weighting. This environmental index can then be combined with the financial score, either into a two-dimensional index or a one-dimensional index.
2.3.1 Weighting The weighting step of an eco-efficiency analysis transforms and aggregates environmental inventory data, which can be a large amount of different parameters, to a single index, expressing the total load on the environment exerted by a system (Rydh et al 2002). The purpose is to facilitate easy interpretation and environmental communication in decision making processes (Finnveden 1996). The usefulness of performing a weighting depends however very much on the intended application. Reasons for carry out a weighting are:
That the intended receiver of the information is incapable of handling multi-dimensional environmental information. One major reason for this is the complexity of environmental problems, but other reasons can be lack of knowledge or lack of time, etc. An example is in product development when the designer is expected to do the LCA him- or herself. Another example is in decision making when many people are to take part of information, and a quick decision is expected (Hallberg, 2007).
That there is a need for identification of which environmental threats or damages that are critical from a systems perspective (Finnveden 1996).
That the results of different environmental loads point in different directions when comparing alternative systems. In these cases an evaluation of these results takes place anyway.
There is however a number of issues related to the use of weighting methods which have to be considered when performing a weighting:
o The weighting process is based on trade-offs between different environmental impacts, and hence is the most subjective part of a LCA or an EEA. Different weighting methods can give different and sometimes contradictory results (Finnveden, 1996). Because of the large differences in the results generated by different weighting methods, the choice of weighting method is a valuation in itself (Finnveden & Zetterberg, 1997).
o Globally there are regional variations in institutional settings, market profiles (reflecting consumer values), expert opinions and environmental imperatives (Schmidt

6
& Sullivan, 2002; Kolk, 2000). This makes it virtually impossible for a globally agreed upon weighting method considering the inherent subjectivity of weighting.
o No weighting method covers all environmental interventions and hence a weighting method can be incompatible with an inventory (Finnveden 1996).
o Inadequate quality and amount of data can give a misleading picture of reality. The indexes used for the environmental impact assessment is often of a general nature, and thus account is seldom taken to sensitivities in local, regional or global environments or temporal aspects of interventions (Bengtsson 2000, Rydh et al 2002). Some methods are valid only for fixed time horizons and specific geographical areas. However, with some methods substance specific indexes can be modified, and new indexes can be developed, which corresponds to the system boundaries of the study in a more adequate way.
o There is, according to ISO 14 042, no scientific foundation for weighting, why public disclosure of a comparison of two products based on weighting is not allowed (Rydh et al 2002).
Weighing principles There is a wide range of qualitative and quantitative methods for weighting of environmental loads. The focus here is on the quantitative methods, which can be classified in different ways. When establishing weighting indexes it has to be decided upon what kind of environmental changes that are bad or good. For this a reference has to be established, and here a first distinction can be made between different weighting methods. Most weighting methods either choose environmental goals, total loads in a specific region or the present state of the environment as a reference. A second distinction can be made on the basis of where, and consequently on what, the evaluation is made in the cause-effect network, linking specific pollutants to environmental problems. Some methods evaluate the actual environmental interventions. Environmental Themes oriented methods model and evaluate potential environmental burdens at the midpoint level in the cause-effect network (Hertwich & Hammit, 2001). The purpose is to get as close as possible to actual damages, while keeping uncertainty low and to be scientific as far as possible, by first performing a characterisation which relates environmental interventions to specific themes (midpoint effects, e.g. acidification, global warming and eutrophication). Damage oriented methods aims at reflecting actual damages by modelling and evaluating potential impacts at the end point or damage level in the cause effect network. A third distinction can be made on the basis of how the environmental impacts are evaluated, i.e. how deviations from the reference are weighted. For this there are three principles which are mainly used; panel methods, monetarisation methods and distance-to-target methods. Panel Methods When applying the panel method a group of people are asked about their opinions of different environmental impacts (Finnveden, 1996). Different groups of people can be used, e.g. experts, authorities, the public, students. The expressed opinions are then used for evaluating different impacts and for establishing weighting indexes.

7
Monetarisation methods Monetarisation methods assign monetary values to different items. There are several methods for deriving the value of an item depending on whose preferences to reflect. There is a distinction between monetarisation methods which are based on willingness-to-pay and those which are not. Methods based on willingness-to-pay expresses the amount of money somebody is willing to pay in order to avoid something. These amounts can be derived from market prices (individuals’ revealed preferences), interviews (individual’s expressed preferences) or political and governmental decisions (society’s willingness-to-pay). When a group of people are asked to establish the values, the method is also a panel method. Monetarisation methods which are not based on willingness-to-pay are often based on an estimation of a cost to do something, e.g. the cost for remediation of a damage. Distance-to-target methods A distance-to-target method relates the weighting factors to some target. There are different equations and targets that can be used for this. Common targets are political goals and environmentally critical loads. Weighting methods used in industry Many different weighting methods are used in industry. A few of them are presented in table 2 on page 8. As discussed in the previous section weighting methods can differ on several dimensions. The main differences can be assigned to which reference for evaluation that is chosen, where in the cause-effect chain the evaluation is made, which principle is applied for the evaluation and whose preferences the evaluation is based upon. Another important aspect is the spatial extension of the weighting method, i.e. for which geographic region the weighting method is compatible with. Also important to remember is that none of the valuations methods in table 2 considers any concentration gradients of interventions, but rather contributions to a whole, which is on the national, multinational or global level.

8
Table 2. Different quantitative weighting methods used in industry. Method Country of
origin Spatial Extension
Environmental goal or reference
Impact indicator in cause effect network which is evaluated (what is evaluated)
Weighting Principle used for evaluating impact indicator (how is it evaluated)
Preferences used for valuation (who is evaluating)
EPS Sweden Global Present state of environment
End point effects
Monetary method (willingness-to-pay to avoid a problem)
Individual’s preferences (OECD citizen’s willingness-to-pay)
BASF Germany Germany, USA, Japan, Great Britain, Morocco or Europe
National or European emissions
Midpoint effects (Environmental Themes oriented method)
Panel method (students/public)
Individual’s preferences
Eco-Indicator 99
Netherlands Europe Present state of environment
Damage (Damage oriented method)
Integrated distance-to-target Panel method (interest group decides the target)
Individual’s preferences
Ecopoints/ Ecological Scarcity
Switzerland Switzerland, Netherlands, Sweden or Norway
National emissions or critical loads
Environmental interventions
Distance-to-target method (critical loads)
Individual’s preferences (experts)
EDIP (Environmental Design of Industrial Products)
Denmark Global and national
Present state of environment
Midpoint effects Environmental Themes
Mix of distance-to-target principle (political targets for emissions), market-resource relation (resources), probability functions (work env.).
Society’s preferences
Environmental Themes
Netherlands
Switzerland, Netherlands, Norway, Sweden or Stenungsund municipality
National loads or policy targets
Midpoint effects Environmental Themes
Distance-to-target method, and in some versions also panel method
Society’s preferences when political targets used
Impact 2002 Switzerland Western Europe
Total load in Europe
Midpoint and damage
Characterisation methods relating midpoint impacts to damage categories
Experts’ opinions
References: Karlsson 1999, Brent & Hietkamp 2003, Hertwich & Hammit 2001, Baumann & Rydberg 1994, Baumann & Tillman 2004
2.3.2 Two-dimensional eco-efficiency index A two-dimensional eco-efficiency index can be presented in a graph, with the one axis indicating the environmental performance and the other axis indicating the economic performance. This can be done in different ways, an obvious alternative being plotting the absolute or normalised results in a conventional scientific graph (figure 2 left). In that case the eco-efficiency criteria have to be decided by the decision maker. Another possibility is a portfolio such as the eco-efficiency portfolio by BASF (figure 2 right, Saling et al, 2002). Here the results of the LCA and LCC are first normalized with an external reference, to integrate the significance of the environmental and economic results, and then plotted in a portfolio in such a way that the middle of the portfolio is the centre of all alternatives considered. The scaling of the axes is inverted, and hence the upper right corner indicates high

9
eco-efficiency whereas the lower left corner indicates low eco-efficiency. In fact, the larger the distance is to the diagonal from top left to bottom right, the distance being positive over the diagonal, the more eco-efficient is an alternative. Consequently, all alternatives lying on this diagonal have the same eco-efficiency according to the BASF eco-efficiency method (See Appendix III for an elaboration of the BASF eco-efficiency interpretation key).
Figure 2. Two different ways of presenting the financial and environmental performances of two alternatives. The BASF graph also communicates which alternative is the most eco-efficient.
2.3.3 One-dimensional index The WBCSD has made a framework for measuring eco-efficiency, which suggests that an eco-efficiency index may be based on the ratio between a system’s value and environmental influence. The costs of a system can be seen as an expression of the system’s value in that it reflects the willingness to pay (WTP) for the system’s function. Hence, the LCA and LCC results can be aggregated into a one-dimensional eco-efficiency index through taking the ratio of the two:
A higher ratio indicates higher eco-efficiency, or higher environmental productivity. An alternative is to present the eco-efficiency performance as suggested in the “Interpretation keys for environmental product declarations” by Steen et al (2004):
Here, the LCA inventory is aggregated with the EPS (Environmental Priority Strategies in product development) weighting system and expressed in environmental load units, ELUs, which is a monetary unit, and hence the eco-efficiency index is communicated as a percentage value. This implies that the higher the index is, the more eco-efficient, or the less environmental intense, is a system. If the index is negative the environmental damage caused by a system exceeds the created value. If the index is more than a 100 %, a net environmental benefit is added by the system.
LCC LCA (1 - ) * 100%
LCA LCC
A
B
0
1
2
0 1 2
LCC
LCA
A
B
0
1
2012
LCC
LCA

10
3 Akzo Nobel Case Study This chapter describes the case study which was carried out at Akzo Nobel. It includes a brief description of Akzo Nobel and its strategy for environmental work in the context of corporate social responsibility. The industrial processes which the actual case deals with are then described in more detail. Included is also a step by step account of the EEA.
3.1 Akzo Nobel Akzo Nobel is a multinational corporation providing customers with human and animal health care products and chemicals and coatings services (Akzo Nobel 2007). It is a decentralised business unit organisation, with headquarters in the Netherlands and 13 business units with operating subsidiaries spread all over the world. It has activities in more than 80 countries and employ around 61 500 people. It is a Global 500 Fortune Company and is listed on the Euronext Amsterdam and NASDAQ stock exchanges, as well as the Dow Jones Sustainability Index and the FTSE4Good Index. Consolidated revenues for 2006 totalled EUR 13.7 billion. Akzo Nobel’s business strategy is to create above-average economic value over the business cycle. It strives to be respected in societies in which they operate, and to attract talented and ambitious people which are proud to work. Akzo Nobel has for several years been improving their CSR performance (Akzo Nobel, 2006b). This is reflected in their rating as chemical industry leader on the 2007 Dow Jones Sustainability Index. At the core of Akzo Nobel’s CSR agenda is the identification of opportunities in the value chain and the understanding of market needs for sustainable products. Thus a market-focused eco-efficiency approach has been adopted, which has created customer value in sustainable advantageous products in terms of environmental and economic benefits. The eco-efficiency approach is to be fully integrated into all major business decision. At the heart of this work is the sub business unit Sustainable Development, with its base in Göteborg, Sweden. The Sustainable Development Group work as internal consultants and assist the entire Akzo Nobel organization regarding environmental sustainability aspects of products and services (Sustainable Development, 2007). They are responsible for the practical implementation of eco-efficiency throughout the organisation of Akzo Nobel, and perform eco-efficiency analysis and provide support in decision making.
3.2 Eco-efficiency analysis of glycol waste water treatment process An EEA of a glycol waste water treatment process was carried out to put EEA methodology into practice. The EEA was carried according to the methodology presented in Appendix I.
3.2.1 Background Functional Chemicals is an Akzo Nobel business unit with head office in Stenungsund, Sweden. Key products are various chemicals used in a wide range of products such as toothpaste, deodorants, cosmetics, bakery goods, ice creams and flame retardants. In Stenungsund Functional Chemicals has its production of ethylene amines at Site Stenungsund. Site Stenungsund Akzo Nobel At Site Stenungsund there are two production units; an ethylene amine plant and a surfactants plant (MKB, 2004). The ethylene amine plant consists of an ethylene oxide/glycol plant and an amine plant (see figure 3). The focus of this case study is the ethylene oxide/glycol plant. The ethylene oxide that is produced is used as a raw material in the production of amines at

11
the amine plant, or as an input in processes outside Site Stenungsund. The produced glycol is either sold or used in the production of surfactants at the site or sold to customers outside the industrial area. Within the site there is also a furnace for production of steam. The yearly production operating time is 8400 hours. The Ethylene Oxide/Glycol Plant Ethylene oxide is formed when ethylene exothermally reacts with oxygen (MKB, 2004): C2H4 + ½ O2 C2H4O + heat Water and carbon dioxide are also formed ½ C2H4 + 1½ O2 CO2 + H20 Glycol is then formed from water and ethylene according to C2H4 + H20 C2H4(OH)2 (MEG, monoethyleneglycol) 2C2H4 + H20 C2H4(OH)2O (DEG, diethyleneglycol) Excess water is produced and a water stream containing glycol is transferred to the glycol plant (Figure 3). A portion of the produced ethylene oxide can not be used as raw material in other production due to low quality and is therefore also sent to the glycol plant where it is processed. This process creates a second water stream containing glycol. The two glycol water streams are sent to a distillation system where the glycol is separated from the water through distillation. The distillation process requires energy input in the form of steam and electricity. The cleaner the waste water is to be, the more input of energy will be required.
Figure 3. The ethylene amine plant at Site Stenungsund, which also is the operational environment of the glycol plant. Only flows relevant for this study are shown.
The Environmental Issue There is an environmental dilemma when different types of environmental impacts are weighted against each other. Ethylene glycol is a chemical oxygen demanding (COD)
EO-Plant
Glycol Plant
EO Storage & Use
Bad EO
Glycol Water
Glycol Storage & Use
Water
Steam
Water
Oxygen
Ethylene
CO2
Glycol Water
Distillation System Basin
Steam
Water to ocean
Steam
Steam Production
Amine plant
Water
EO

12
substance which can cause oxygen deficiency when released to adjacent water recipients. The magnitude of its impact depends on the conditions of the water recipient, but can have disastrous effects on the indigenous flora and fauna. The amount of glycol released to the water can however be regulated with the distillation process described above. This process requires steam, in this case produced from crack gas (a mix of natural gas and hydrogen gas), and electricity. The gas combustion emits carbon dioxide, nitrogen oxides, sulphur oxides and carbon monoxide which contribute to global warming, acidification, eutrophication and ground level ozone creation. The environmental load from electricity consumption depends on how the electricity is produced. Generally it includes hazardous waste, emissions of greenhouse gases and gases contributing to ground level ozone creation, eutrophication and acidification, as well as consumption of non-renewable resources.
3.2.2 Goal and Scope Definition Objective This is a change-oriented eco-efficiency study, it analyses the environmental and economic consequences of changing the reflux to different magnitudes than the one used today. The question to answer is: from an eco-efficiency perspective, what is the optimum cleaning level of the glycol water? The study is part of the broader CSR work at Akzo Nobel, and the result is to be used for communication with environmental authorities. The aim of the study is also that it works as a learning process, i.e. adds environmental knowledge and awareness to the organisation. Moreover is the purpose of the EEA to investigate how choice of weighting method affects the final result. The analysis was initiated by Akzo Nobel Functional Chemicals and is carried out by the author of this report at Sustainable Development Akzo Nobel. Except from the initiator of this study, other interested parties can be the environmental authorities at Stenungsund and at Västra Götaland administrative county, as well as the citizens of the Stenungsund municipality. The function The function of the system is treatment of glycol waste water. The functional unit Indicators are expressed in unit per functional unit. In this study the functional unit has been chosen to be a yearly waste treatment of 107763600 kg of glycol water. System Boundaries This EEA focuses on the specific glycol water treatment plant in Stenungsund, the lifecycle of which is shown in figure 4.

13
Figure 4. Lifecycle of the glycol water treatment plant
All phases except the use phase are identical for all alternative scenarios (see below for alternative scenarios), and are therefore cut off from the analysis. The EEA is hence based on a comparative gate to gate analysis, rather then a complete cradle to grave LCA. The human capital requirements are also identical for all scenarios and are not taken into consideration. Figure 4 depicts the technical context, i.e. the operational environment, of the use phase of the glycol waste water treatment plant. The system depicted in figure 5 constitutes the foreground system. It will be called the distillation system and is the major part of the glycol plant. It is also in this system that changes can be made which will affect the eco-efficiency performance of the glycol waste water treatment installation.
Figure 5. Flowchart of distillation system. This is also the foreground system of the eco-efficiency study.
Extraction and production of raw materials and constituent parts
Energy Emissions
Waste/Scrap
Manufacture of plant
Transport
Use of plant
Transport
Disposal of plant
Transport
Emissions Waste/Scrap
Emissions
Emissions Waste/Scrap
Energy
Energy
Energy
Material
Operational environment in figure X
Steam to EO-plant
Glycol water Flux In 1, GW1
Water to EO-plant Water to basin
HS1
HS2
Glycol Water Flux In 2, GW2
GWd
GWahe
Reflux
Glycol 45 %
Electricity Pump
Electricity Pump
Steam leaving Column
Heat Ex2
Heat Ex1

14
Alternative Scenarios The environmental load of the use phase of the glycol waste water treatment system is related to the emissions of glycol (COD) to the adjacent waters and the environmental burden associated with the energy requirements of the system. The amount of COD emitted to the ocean is a function of the reflux. Also the energy requirement of the system is a function of this reflux, and hence the total environmental burden of the system can be expressed as a function of the reflux of water to the distillation column. Any setting of the reflux within the allowed interval 1000 kg/h < reflux < 3000 kg/h can be denoted as an alternative scenario (lower or higher refluxes result in major instability of the distillation system). The current setting of the reflux is 1500 kg/h. Impact categories and weighting methods For the life cycle impact assessment step impact categories and weighting methods has to be chosen. For the weighting step all weighting methods listed in table 3 of this report were considered, however, the eco-indicator’99 and impact 2002+ methods were omitted since they lack weighting indexes for COD and hence are incompatible with the inventory of this study. COD indexes for the impact 2002+ method are under development (Charles et al, 2003). Case and site specific indexes were developed for this study based on the principles of the Environmental Themes method. Appendix II gives an in depth account of the development of these indexes. Data requirements The required data for the eco-efficiency calculations have been gathered through contacts with employees at Akzo Nobel. Site specific LCA data from 2005 is used on production and combustion of crack gas. The crack gas is supplied by Borealis. Vattenfall supplies electricity to Site Stenungsund, and hence LCA data on Vattenfall’s electricity mix is applied. This data is from 1996 but the composition and environmental load of the Vattenfall electricity supply has not changed significantly. Equivalencies for characterisation in the life cycle impact assessment step are taken from Guinée (2002). Limitations Scenarios are average steady state representations of the distillation system. In reality the fluxes are not constant but are sensitive to the operation levels in the EO-plant.
3.2.3 Results Life cycle inventory The aggregated steam demand of the three heat exchangers, Pheat, increases only slightly, and linearly, with an increase in reflux, mreflux, according to: Pheat (mreflux) = 0,0032 * mreflux + 112 [kW] Increased reflux to the distillation column also requires more electricity power, for pumping the water around: Ppump2 = 0,000236 * msteamcolumn + 12,62 [kW] Hence, the added environmental cost of cleaner sewage water is the environmental cost of this extra electricity and the environmental cost of a small amount of extra steam use.

15
The water leaving the glycol plant has a glycol content of approximately 7 – 55 wppm depending on reflux. It enters the industrial sewage leading to a basin for partial breakdown of organic compounds, where there is a decrease of the glycol content of the sewage water before being released to the ocean. The amount of breakdown of glycol in the basin is approximately 30%. Thanks to the glycol waste water system approximately 4 kton COD emissions is avoided. The most significant environmental interventions of different reflux scenarios are summarized in figures 6 and in table 3 (the complete inventory profile for the glycol waste water treatment system can be found in Appendix IV). Table 3. The magnitude of the most important environmental interventions of different reflux scenarios
Reflux TOC [kg/F.U.]
COD [kg/F.U.]
CO2 [kg/F.U.] NOx [kg/F.U.]
CO [kg/F.U.]
Energy consumed by distillation system [TJ/F.U.]
1000 404 (+287) 1347 (+958) 5006 (-2390) 65 (-32) 8 (-3) 3,91 (-0,5) 1500 117 (0) 389 (0) 7396 (0) 97 (0) 11 (0) 3,96 (0) 2000 68 (-49) 228 (-161) 9787 (+2391) 128 (+31) 15 (+4) 4,01 (+0,05) 2500 48 (-69) 161 (-228) 12178 (+4782) 160 (+63) 19 (+8) 4,06 (+0,10) 3000 37 (-80) 124 (-265) 14568 (+7172) 192 (+95) 22 (+11) 4,11 (+0,15)
COD (kg O2)
0
200
400
600
800
1000
1200
1400
1000 1500 2000 2500 3000
reflux [kg/h]
CO
D e
mis
sion
s [k
g O
2/F.
U. ]
Energy
0,00
1,00
2,00
3,00
4,00
5,00
1000 1500 2000 2500 3000
Reflux [kg/h]
[ TJ/
F.U
. ]
Figure 6. Emissions of COD to water and energy consumed b the distillation system, as functions of the reflux to the distillation column.
With increasing reflux the emission of COD decreases exponentially while the magnitude of the other interventions increases linearly. This reflects that additional cleaning of the glycol water requires more input of steam and electricity in a linear way. Life cycle impact assessment The environmental interventions identified in the inventory analysis were classified into six different impact categories, and then characterised and weighted. Characterisation The results of the characterisation is presented in figure 7.

16
90
95
100
105
110
115
120
125
130
1000 1500 2000 2500 3000
Reflux
Norm
alis
ed C
hara
cter
isat
ion
Inde
x
AP, GWP, POCP,HTTP, ResourcesEP
Figure 7. Normalised (reference reflux is 1500 kg/h) characterisation indexes as a function of reflux. Characterisation indicators from CML (2002) were used.
The eutrophication potential decreases exponentially with increasing reflux, while all other impact category potentials increase linearly in an almost identical manner, and can hence be represented by a common curve. Emission of COD is classified as contributing to eutrophication since the most detrimental aspect of eutrophication is oxygen depletion. Weighting The environmental burden of different reflux scenarios were weighted with seven different weighting methods; the EPS, the BASF, the EDIP, the ECO, and the Environmental Themes -short, -long and -Stenungsund methods. The relative importance given to COD, CO2, NOx, CO and oil in different weighting methods are shown in table 4 where weight factors for these interventions are presented.
Table 4. Weighting factors for COD, CO2, NOx, NMVOC and Oil according to six different weighting method as the ratio of the weighting factor for the specific substance over the weighting factor for COD.
Method Substance
EPS EDIP ECO ET-short ET-long ET-Stenungsund
COD 1 1* 1 1 1 1 CO2 107 0,01 0,007 0,03 0,1 0,01 NOx 2109 0,9 1,6 9,9 11,5 16 NMVOC 2,7 8,1 23,6 12,5 Oil 1089 3,8 0,3 0,1 0,2
*Glycol is approximated to ethanol since weighting index for COD and glycol is missing. Glycol and ethanol has the same amount of carbon atoms.
From table 4 it can be understood that relative to each other the EPS and EDIP method put substantial weight on resource use, whereas the ET methods put a lot of weight on emissions to air and water and moderate weight on resource use. The BASF method is not included in this comparison since its weighting indexes changes with each study. Since a continuous approach was used for modelling different scenarios all possible reflux settings were weighted. The environmental optimum points are presented in table 5.

17
Table 5. Environmentally optimum refluxes according to the five weighting methods.
EPS BASF EDIP ECO ET-short ET-long ET-Stenungsund Environmentally Optimum Refluxes [kg/h]
1000 1950 1000 2350 1400 1200 1600
The different weighting methods generate different results concerning which alternative that is more environmental benign. The difference in results is associated with the relative weights put on dissimilar interventions or impact categories, as shown in table 4. The contribution of COD emissions, electricity production and steam production to the total environmental load according to six different weighting methods is depicted in figure 8.
95,0% 89,3%79,9%
92,3% 96% 92,6%
5,0% 10,5%12,0%
6,3% 3,1% 4,9%0,0004% 0,1%
8,0% 1,3% 0,6% 2,4%
EPS EDIP ECO ET-short ET-long ET-Stenungsund
COD emissionsElectricity productionSteam production
Figure 8. Contribution to the total environmental load of COD emissions, electricity production and steam production. Reflux is 1500 kg/h. Most of the total environmental load is due to the steam production, mainly through the use of natural gas and oil and emissions of combustion gases. The relative differences in environmental load between the different reflux scenarios are mainly related to differences in steam demand. Life Cycle Costs The added cost with increasing reflux (table 6) is the cost of increased electricity for the pumps and gas consumption for steam production. Table 6. Changes in total cost with changes in reflux from the reference scenario.
Reflux Additional cost 1000 -1,24 % 1500 (reference) 0 2000 +1,24 % 2500 +2,48 % 3000 +3,72 % 85 % of the additional cost is associated with the fuel for increased steam production. Integrated assessment and evaluation The eco-efficiency performance will be presented in a two-dimensional fashion in two different ways; a conventional scientific graph and the BASF eco-efficiency portfolio.

18
In figure 9 the environmental impact and total costs are presented in a conventional scientific graph. The environmental impact has been assessed with the ET-Stenungsund weighting indexes. The different alternatives have then been normalised towards the “1500 kg/h” alternative. The scaling of the axes reflect that the difference between all alternative scenarios is marginal. The graph gives a good overview of the environmental and financial performance of products, and shows that in this case the “1500 kg/h” is the better alternative in both dimensions.
1000 kg/h
1500 kg/h2000 kg/h
2500 kg/h
3000 kg/h
0,99
1
1,01
1,02
1,03
1,04
1,05
1,06
0,98 0,99 1 1,01 1,02 1,03 1,04 1,05
Total costs (norm.)
Envi
ronm
enta
l im
pact
(nor
m.)
Figure 9. Environmental impact according to ET-Stenungsund and total costs. For the BASF method two different sets of alternative reflux scenarios were used; one with five alternatives (figure 10 left), and one with only two alternatives (figure 10 right).
1000 kg/h
1500 kg/h2000 kg/h
2500 kg/h
3000 kg/h
0,94
1,00
1,060,941,001,06
Total Costs (norm.)
Envi
ronm
enta
l Im
pact
(nor
m.)
1500 kg/h2000 kg/h
0,94
1,00
1,060,941,001,06
Total Costs (norm.)
Envi
ronm
enta
l Im
pact
(nor
m.)
Figure 10. BASF eco-efficiency portfolios.
The 1500 kg/h and 2000 kg/h are the most eco-efficient refluxes to operate on. However, the relative environmental performance differs between these two refluxes depending on which set of alternatives that has been used. This is because in the BASF environmental weighting the maximum value of all alternatives in each impact category is used to calculate the relevance factor, and hence also the final weight factor for that impact category. Therefore the relative weight assigned to different impact categories for one alternative will depend on the other alternatives (see table 7).

19
Table 7. Weighted relationship between emissions to air and emissions to water with BASF environmental weighting for alternative “1500 kg/h”.
Ratio “Weighted Impact Water/Weighted Impact Air” with five alternatives
0,16
Ratio “Weighted Impact Water/Weighted Impact Air” with two alternatives
0,25
The 1-LCA/LCC equation was used for one-dimensional index representation of the eco-efficiency performance of the glycol waste water treatment system. According to this equation the eco-efficiency of the system decreases with any increase in reflux (figure 11).
-192,00%
-191,50%
-191,00%
-190,50%
-190,00%1000 1500 2000 2500 3000
Reflux [kg/h]
1-ED
C/L
CC
[%]
Figure 11. A plot of the EPS eco-efficiency index versus the reflux.
However, it is also clear that according to this approach the difference in eco-efficiency between different alternative refluxes is marginal. It also suggest that the system is quite in-eco-efficient, which can be confusing considering the large quantities of COD emissions which are avoided. This is discussed in the next chapter (Discussion).
3.2.4 Sensitivity Analysis A sensitivity analysis was carried out in order to generate a sound recommendation concerning the reflux setting. Variations in three parameters were considered as possibly having a significant impact on the final result; extent of microbial breakdown of glycol in the basin, fuel choice for steam generation and heat transfer efficiency. Also a motivated adjustment to the BASF weighting methodology was made to see how this would change the final eco-efficiency result. Microbial breakdown of glycol in basin In the base scenario a breakdown of 30% of the incoming COD was used. The 95% confidence interval of the average inflow and outflow of glycol were used as an estimate to calculate a worst and best scenario. Because of a large standard deviation the best scenario implied approximately a 50% breakdown of glycol whereas the worse scenario implied no breakdown of glycol. The effects of these variations on the environmental optimum reflux setting are small according to the different weighting methods, which can be seen in table 8.

20
Table 8. Environmental optimum points at different rates of breakdown of glycol
EPS BASF EDIP ECO ET-short ET-long ET-Stenungsund 0 % 1000
(0) 2150 (+150)
1000 (0)
2650 (+300)
1550 (+150)
1250 (+50)
1750 (+150)
50 % 1000 (0)
1800 (-200)
1000 (0)
2100 (-250)
1300 (-100)
1150 (-50)
1500 (-100)
Fuel choice - biogas and hydrogen gas as alternative fuels to crack gas Increased emissions into air might not be a valid argument against increased cleaning of COD as authorities can require use of other fuels, as long as the costs of such fuels are reasonable (Michanek & Zetterberg, 2004). Bio-fuels, and perhaps also hydrogen gas in the future, might be considered alternative fuels to natural gas. Thus a sensitivity analysis was carried out in order to map the influence of fuel choice on the final results. In an ideal biogas production process only renewable energy is used and hence the biogas would be a carbon neutral energy source. In the same way, if renewable energy sources are used for producing the hydrogen it also is a carbon neutral fuel. If neglecting other environmental impacts from production of hydrogen gas and biogas, the environmental load from combustion of these fuels will mainly be associated with emissions of NOx, VOC, CO, PM, SO2, N2O for biomass and emissions of thermal NOx for hydrogen gas. The most environmental benign refluxes when using these fuels for steam production are shown in table 9. The NOx emission factor for the furnace today was used as a proxy for future combustion of hydrogen gas, while emission data for biomass combustion was taken from the Swedish environmental protection agency (Naturvårdsverket, 2005). Table 9. Environmental optimum points when using different fuels for steam production EPS BASF EDIP ECO ET-short ET-long ET-Stenungsund Biomass 1000
(0) 2700 (+700)
1500 (+500)
3000 (+650)
2000 (+600)
1800 (+600)
2150 (+550)
Hydrogen gas 1000 (0)
2900 (+900)
1550 (+550)
3000 (+650)
2100 (+700)
2000 (+800)
2050 (+450)
Other environmental interventions which were not covered here are related to the use of biomass, such as emissions of heavy metals and land use. Therefore a switch to biomass as a fuel for steam production will not motivate further cleaning. It would however save some emissions of greenhouse gases, but likely this would be to the cost of a larger environmental load on the local community. On the other hand, if hydrogen gas is used, it seems to be environmentally motivated with further cleaning. Heat transfer efficiency A simulation was performed to map the steam power demand of the heat exchangers at different refluxes. It showed that with an increase in reflux there is a marginal increase in power demand. Even though the increase is only marginal, it is important since it generates an environmental load which is larger than that generated by the increase in electricity power demand. The rate of change of the heat power demand is however uncertain and very close to zero. If the power demand would be constant the increase in environmental load with an increase in reflux would be limited to the environmental load from electricity production. Thus a weighting of this environmental load and the COD emissions was performed at different refluxes and compared on the margin (table 10).

21
Table 10. Environmentally optimum reflux when heat power demand is constant. ET-Stenungsund is not applied here as it does not yet cover the main environmental interventions related to the Swedish electricity mix.
EPS BASF EDIP ECO ET-short ET-long Environmentally Optimum Refluxes [kg/h] 1000
(0) 3000
(+1050) 1700
(+700) 3000
(+650) 3000
(+1600) 2700
+(1500) The result indicate that from an environmental point of view it is better to increase the cleaning significantly, if not as much as possible. BASF weighting An important aspect of the BASF weighting process is that small normalised environmental interventions (denoted relevance factors) are magnified with a square factor relative larger relevancies, i.e. if the normalised value of theme A is nine times the normalised value of theme B, the final weighting factor of theme A is only three times the weighting factor of theme B (if they have the same social weight factor) (See Appendix III). Using terminology of epistemology; the BASF method makes a relational claim when taking the square root on the relevance factor. A relational claim requires technical validity, i.e. it should “combine scientific data and models and preference values in a way that is appropriate, logically correct, coherent, and in agreement with the intentions of” the study (Hertwich & Hammit, 2001). There are reasons to believe that large physical or chemical changes on the margin are more detrimental to the environment than small marginal changes, i.e. the speed of environmental alteration has a large influence of the seriousness of an environmental intervention. The BASF method implies the opposite. To see how the square root of the product of the relevance and social factors affected the final result, the BASF method was applied without the square root. The results, shown in figure 11, indicate that the relative eco-efficiency performance of the alternatives will change. The alternative “1000 kg/h” now becomes second most eco-efficient. However, the changes are still marginal, and further investigation in other case studies is necessary to judge the importance of the application of the square root.
1000 kg/h
1500 kg/h2000 kg/h
2500 kg/h
3000 kg/h
0,94
1,00
1,060,941,001,06
Total Costs (norm.)
Envi
ronm
enta
l Im
pact
(nor
m.)
1000 kg/h
1500 kg/h2000 kg/h
2500 kg/h
3000 kg/h
0,94
1,00
1,060,941,001,06
Total Costs (norm.)
Envi
ronm
enta
l Im
pact
(nor
m.)
Figure 12. BASF eco-efficiency portfolio with (left) and without (right) square root of relevance and social weight factors.
3.2.5 Conclusions and Recommendations The glycol waste water is treated with low environmental impact and low variable costs since almost all heat used in the process can be used elsewhere in value adding processes. Hence the glycol plant is a very eco-efficient system; it has high environmental cost effectiveness and significantly increases the environmental productivity of its operational environment. The potential environmental benefits and cost reductions of changing the reflux are very small.

22
Furthermore, different weighting methods generated diverging results concerning the most environmentally benign reflux. The sensitivity analysis also showed that changes in a few uncertain parameters generate great variations in the relative environmental performance of different reflux scenarios. It also showed that an increased cleaning of the glycol waste water is only environmentally motivated when the steam production is fuelled by such a clean fuel as hydrogen gas, or if there would be no difference in heat power demand at different refluxes. Therefore the recommendation is to further investigate the actual heat power demand at different refluxes, and meanwhile continue to operate at the current reflux setting of 1500 kg/h, or at a setting where the risk for system failure is the lowest.

23
4 Discussion The corporate world plays an important part in the global community’s strive for sustainability. The essence of eco-efficiency is to increase the value of a function while reducing the environmental impact of the product, service or process delivering the function. The eco-efficiency concept and eco-efficiency analysis are therefore excellent tools for environmental conscious corporations to adopt and integrate into their business functions to make their business more sustainable. However, the question of how to measure and communicate the eco-efficiency in a way which is understandable and relevant is still an issue which demands further investigation. In relation to this, within the framework of eco-efficiency, several questions were posed in the purpose statement of this thesis. Below these questions are discussed one by one.
When is it appropriate to conduct a weighting?
According to Sturm et al (2004) it is important that an eco-efficiency indicator applies to four characteristics; understandability, relevance, reliability, and comparability. If the economic score can be combined with a single environmental index it would ease the understandability and comparability of the eco-efficiency indicator. The weighting step of an eco-efficiency analysis is necessary to aggregate the environmental inventory data to a single indication of the total environmental load exerted by a system. This facilitates effective communication of the results of eco-efficiency comparisons. There are several established weighting systems which provide for reliability. If the weighting method also is adapted to a specific case or site the environmental index, and consequently also the eco-efficiency index, becomes more reliable. The weighting is sometimes also necessary for identification of environmental hot spots in the value chain, and can therefore constitute an important part in the work of making business more eco-efficiency. However, whether life cycle inventory data really need to be aggregated depends on the inventory profile. In some cases the result of an inventory or a characterisation are easy to interpret, and hence in such cases it might not be necessary or motivated to perform a weighting.
What methods are there for weighting, and which are used by industry?
There are many different weighting methods which are used by industry (see table 2 for examples). The reason is that environmental problems are characterized by complexity (complex cause effect chains surrounded by uncertainties) and subjectivity (an environmental problem is only a problem to the extent someone experience it as such). To illustrate the subjectivity; test you with the following questions (Wandén, 1993, in Baumann, 2004 & Finnveden, 1996): On your view of nature: Is nature robust or is it fragile? Is nature in constant flux, or is it evolving towards a climax? Are also animals, plants and /or ecosystems moral objects? To what extent are we able to predict environmental impacts? What is the importance of the natural systems in relation to the economic systems? On your view of humans: Are humans cultural beings or natural beings? Do humans have large freedom of action or do they have limited possibilities and freedom to act? Are future people moral objects and if so, how important are they?

24
On your view of society: Does growth favour the environment, or does it harm the environment? Should society be organised in a market economy, in a decentralised small-scale economy or in a planned economy? Depending on the principles chosen for weighting different methods will have different answers to these questions, and there will not be a globally agreed upon weighting method. So for reliability it is important that the practitioner understands what kind of information a weighting adds to the eco-efficiency study, i.e. he/she needs to know what preferences and principles the weighting methods are based on.
What are the preferences and principles that the different methods are based upon?
An account of how weighting indexes can be developed was given in section 2.3.1. Depending on which principles and preferences weighting methods are based on, they will reflect different ethical views as well as different views on nature and society (Finnveden, 1996). This is usually not explicitly stated when a weighting is conducted, but implicitly they are present. Hence, when applying a certain valuation method a value statement is also implicitly done, and, to quote Finnveden (1996) “the differences in the results will remain difficult to understand and explain as long as the ideological standpoints are taken implicitly”. For an elaboration and examples see Finnveden (1996). Also important to understand is that the generic weighting methods will not consider any local concentration gradients of interventions but rather contributions to a whole, which often is on the national, multinational or global level. Bengtsson (2000) writes that “the weighting needs to fit in the framework of LCA, which in it self is based on a number of assumptions about damages and values, and how these among other things are commensurable, separable, complementary and of a linear relational nature”. These assumptions provide for linear trade offs between local and global effects, and consideration is therefore also not taken to the distribution of environmental effects across populations. Hence there are usually no site-specific considerations involved in the weighting, nor any concerns taken to local threshold effects. This can be problematic especially when a waste management system is to be valued from an eco-efficiency point of view. However, in some cases it could be argued that it is reasonable to assume that levels of interventions risking causing severe environmental threshold effects or threats to non-tradable environmental values are regulated by local or national authorities (e.g. miljöbalken).
Who is making the evaluation in the different methods?
The evaluation of different kind of environmental impacts is done when weighting indexes are established. Hence, the decision maker is not doing the evaluation himself. But at case- and site specific adaptation of weighting indexes a choice can be made concerning who to make the evaluation, and the values of relevant stakeholders can then be included. Another aspect of case-specific weighting is that the difference between using weighting methods (adapted to the specific case) and drawing conclusions (which will influence the decision) may not be so obvious since applying weighting methods is more or less a way of systematizing the process of drawing conclusions (Finnveden, 1996). So if decision makers are involved in the development of weighting indexes the subjective aspect of weighting is transferred to the actual decision makers.

25
Do the different methods give different results?
The different weighting methods generate different results. This is because they are based on different preferences and priorities, e.g. society’s priorities through political systems or captured through panels or priorities of nature expressed by critical loads (Baumann & Tillmann, 2004, Finnveden, 1996). Thus it is not possible to say that one of them is the most correct one. The LCA practitioner has to choose the method which is most adequate when considering the decision situation the result is to be applied in. This information should be given by the goal and scope definition of the study. A good idea can also be to apply several different weighting methods and see whether they point in the same direction or not. In doing so the weighting process encompasses preferences of many more and becomes more value full. According to Bengtsson (2000) the aim of the weighting should not be to cover all preferences and values, but rather as many as possible. However, the weighting methods need to be compatible with the inventory; in cases where emissions contribute significantly to different environmental threats or damages of significance, it is imperative to choose a weighting system with valuation weighting indexes for all these emissions. How is a trade off made between environment and economy when calculating eco-efficiency?
Quick and easy-to-interpret eco-efficiency communication requires aggregation of inventory data. A trade off between environment and economy might then be necessary. This does not attribute to a win-win situation, in case the decision will be easy, but to a situation where one alternative has a better environmental performance but is more costly than the other alternative(s). A situation like this is depicted in figure 11. A decision then has to be made regarding which aspect is the more important, economy or environment. If economy is more important, the brown alternative would be preferred, and if environmental performance is the more important criteria the yellow alternative would be chosen (the scaling of the axes is inverted).
Figure 13. A situation where a trade off has to be made between environment and economy.
In the BASF eco-efficiency method the trade off between environment and economy is made through a normalisation step which translates the environmental units and the cost unit to a uniform unit, and expresses the relevance of the magnitudes of the environmental and financial impacts. The relevance of the environmental load and the costs can then be compared, by taking the ratio of the two. This ratio is then used to calculate a second set of weighted environmental and cost scores. If the environmental dimension turns out more important than the economic dimension, the alternatives will move from point 1 to point 2, and the yellow alternative will now be the more eco-efficient alternative. In the new diagram
2
2
1
1

26
the environmental and economic dimensions are then treated as equally important, meaning that the alternative with the lowest sum when adding the cost score and the environmental score is preferred. In a sense this trade off process leaves out subjective elements, and the trade off will depend solely on the magnitude of the environmental and financial impacts. This means that for each study there will be a different trade off between environment and economy. One alternative could be to add a societal factor to the weighing between environment and economy in the BASF eco-efficiency tool. The societal factor would denote a standpoint towards weak and strong sustainability. Huppes & Ishikawa (2007) mentions however that the weight assigned to the environmental score relative the economic score needs to be agreed upon by all members of society, in order to reach a Pareto like frontier eco-efficiency at the macro level for that specific weight. At the moment this is not feasible however, and a business can take its own standpoint. Is the most eco-efficient alternative at the product/process level also the most eco-efficient alternative at the macro level The point of departure is the sustainability equation which gives a notion of the total impact on nature caused by human activities: I=i*m*u*P, where I = impact
i = impact per material or energy flow m = material or energy flow per service u = service per capita P = population
i*m is also called the technology factor. The unit of measurement of the technology factor is impact per service, or environmental impact per value. Eco-efficiency can therefore be seen as a measure of the technology factor. In order to reach sustainability this factor needs to be minimized as the u and P entities are increasing. Hence eco-efficiency at the macro level is to minimize the technology factor of the sustainability equation, with other words eco-efficiency is to decouple economic activity and environmental impact. Or to use Huppe’s and Ishikawa’s words, eco-efficiency is to decrease the environmental intensity of businesses, since from a business perspective focus is on production. What eco-efficiency is at the product or process level can be seen to be communicated through the interpretation key used in decision making within an organisation, and which is used to measure the eco-efficiency of different alternatives. In this thesis two interpretation keys have been used; the 1-LCA/LCC ratio and the BASF eco-efficiency portfolio. The 1-LCA/LCC ratio is a measure of the environmental intensity of the system under study, as the LCC score denotes the value of the service. A higher score with this index indicates higher eco-efficiency, and if all micro activities achieves a higher score the eco-efficiency at the macro level will also increase. This is easy to grasp if one thinks of all actors in the global economy as having a fixed budget. If e.g. everybody consumes more expensive products with the same or smaller environmental impact (i.e. all micro economic activities are more eco-efficient), and when all micro activities are added up, also the total load on the environment will have decreased but the total value or service delivered will be the same, i.e. the macro eco-efficiency has improved.

27
With the BASF tool it is not as easy to understand the effects on the macro level eco-efficiency of choices regarding eco-efficiency at the micro level, since a more cost-effective alternative can be prioritized over an alternative with lower environmental impact, and vice versa, and since the dynamics in the real market can be hard to predict. Also, the value of a product is related to the service which the product delivers, which in turn is reflected in the product’s function, rather than in the product’s cost. A more cost-efficient alternative of a product or process promotes advances in productivity. There is not an unequivocally answer to how advances in productivity are used at the firm level. In a perfect free market advances in productivity would lead to more units of a service/customer benefit to the same costs, hence decreasing the price of the service. More people can then buy the service. This might conform with reality to some extent in emerging markets where companies pursue larger market shares. However, in a mature market firms might be more protective of their established shares, as a decrease in price would challenge the stability of the market. Advances in productivity would then make it possible for a company to increase the profit margins. The dynamics in the macro economic system will then be hard to predict. However, it should be stressed that advances in productivity will not promote sustainable development as long as there is not a just distribution of the benefits of these advances. For sake of the discussion regarding how decisions made based on the BASF eco-efficiency index will affect the eco-efficiency at the firm level, productivity gains are assumed to be used as they would be used in a perfect free market. Arrows a, b, c and d in figure X denotes different measures, e.g. arrow a denotes a decision to change from the blue alternative to the yellow alternative. Here the alternatives represent different products or processes (they could also represent different positions in time for a company).
Figure 14. The coloured circles denotes different alternatives of a product or process delivering the same function/service. The smaller graphs shows the direction of the effects on the macro level of measures a-d, in the context of a perfect free market.. Abbreviations: EI = environmental impact, EP = environmental productivity = the inverse of the technology factor of the sustainability equation, I = total impact factor in the sustainability equation. Through measure a the cost efficiency does not change, but the environmental efficiency improves, i.e. the same service is produced with lower environmental impact, i.e. the technology factor (i*m) of the sustainability equation decreases but the service per capita factor (u) is the same. Hence there is a decoupling of the environmental impact and economic
a
d
c
b
Produce more with same
a - decoupling b
c - decoupling
d
Produce same with less
Produce more with more
Produce more with much more
EP
EP
EP
EP
EI
Cost I
I
I
I

28
activity, i.e. there is an eco-efficiency improvement at both the micro and the macro level; “the same amount of service is produced with lower environmental impact”. By measure b the environmental impact per service does not change, but the service of the product or process is delivered with a smaller cost. Therefore the technology factor of the sustainability equation does not change but it increases the service per capita entity of the sustainability equation. Hence the eco-efficiency at the macro level does not change, but the total load on the environment increases; “more service is produced with more environmental impact”. By measure c the service is delivered with lower environmental impact and lower financial impact, i.e. a win-win situation. However, more service will be produced, but as the environmental performance and financial performance improves by the same factor along the diagonal from lower left corner to upper right corner, the total impact on the environment will be the same. At the macro level we thus have a decoupling of economic activity and environmental impact as “more service is produced with the same environmental load”. By measure d the service is delivered with a lower financial impact but with higher environmental load. This means that more services can be produced, and for each unit of service produced the environmental load is larger than before. With other words, both the technology factor and the service per capita factor of the sustainability equation increases; “more service is produced with much more environmental load” Hence, measure a and c demonstrates measures which will lead to better eco-efficiency at the macro level, i.e. a decoupling of economic activity and environmental impact. Measures b and d demonstrates economic productivity advances, but achieve no decoupling of economic activity and environmental impact. Still measure b is considered to demonstrate an increase in eco-efficiency by the BASF eco-efficiency index, and measure d is indifferent from an BASF eco-efficiency portfolio perspective. This can be justified by that cost-efficiency is an important criteria, if not the most important criteria, in decision making. Including these criteria in environmental decision support tools might be a prerequisite for successfully bringing environmental criteria into strategic decision making. Moreover, as the more eco-efficient alternatives lies at the largest distance from the diagonal from top left corner to lower right corner are the more eco-efficient alternatives, the basis for decision is in a way similar to the criteria for Kaldor-Hicks efficiency, with the two actors being the environmental sphere and the economic sphere. The more eco-efficient alternatives lie on the combined pareto frontier and potential pareto frontier. Kaldor-Hicks efficiency does also assume that the actor which gains from a decision has a theoretical possibility to compensate the actor who loses. But, in this case, can environmental capital be compensated with economic capital? According to the BASF eco-efficiency interpretation tool: Yes. This suggests a position of weak sustainability. However, eco-efficiency is a business approach, developed from the definition of sustainable development. The sustainable development position, as defined in the Brundland report, is ultimately an anthropocentric one. Therefore it is not surprising that also the methodologies developed for measuring eco-efficiency will reflect this viewpoint. Moreover, to my opinion, one should keep in mind that when using the BASF eco-efficiency index, eco-efficiency gains at the product or process level does not guarantee eco-efficiency gains at the organisational level. Therefore a recommendation is to also calculate eco-

29
efficiency at the organisational level, e.g. with an “Economic Value Added”/LCA ratio, to enhance the credibility of the eco-efficiency work, and to show that gain in productivity is not the only criteria. Then it would also be possible to benchmark internal progress over time, or to benchmark towards competitors. This can be a way of communicating responsibility, which is important as it in the end comes down to that all actors in society need to take responsibility for decoupling economic activity from environmental load, if this also is to be achieved at the macro-level. Furthermore, one should keep in mind that the sustainability equation tells us that improved eco-efficiency will not be enough by it self to decrease the total environmental load on nature (I), as economic growth (the u*P factor in the sustainability equation) might eat away the eco-efficiency improvements. Considering the current pace of economic growth in China and India and the degradation of nature’s services we have managed so far, this is worrisome. E.g. according to some assessments we already live on or over the limit of the carrying capacity of earth (e.g. see the Millennium Ecosystem Assessment). It also points towards the importance of integrating the third pillar of sustainable development; social aspects, into a decision making process concerning the sustainability of different alternative systems. With the “BASF socio-eco-efficiency method” all three dimensions are integrated in a three-dimensional graph. If the eco-efficiency gains are not used to increase equity we will continue to degrade nature, and in the end a shift of paradigm might be needed.
How can an aggregated eco-efficiency result best be presented in decision making processes?
A one-dimensional index based on a LCA and LCC ratio can only offer relative comparisons; no absolute figures regarding the environmental and economic performance of products can be read from a one-dimensional index. However, it does communicate the relative efficiency of different systems. But efficiency does not tell us anything about the effectiveness of the alternative systems compared, which can pose difficulties when trying to interpret a one-dimensional eco-efficiency index. This will be illustrated with the 1-EDC/LCC eco-efficiency index. A high LCC implies that the product or system also can have a high EDC and still be eco-efficient. In fact, along the line EDC = k*LCC the eco-efficiency is the same, see figure 13.
Figure 15. Eco-efficiency with the 1-EDC/LCC equation.
EDC=ka*LCC
EE index = 1- EDC/LCC EDC = k*LCC EE index = 1 – k k > 1 EDC > LCC EE index < 0 k < 1 EDC < LCC EE index > 0 ka > kb EEa < EEb ka < kd EEa > EEd ka = kc EEa = EEc
EDC
LCC
a
c b
b
d

30
This can be confusing as it suggests that an alternative with larger costs also can exploit more natural resources and still be as eco-efficient as an alternative with lower costs and lower environmental impact (see a and c in figure 13). The general conception of eco-efficiency is creating more value with less. Lyrstedt (2005) mentioned that this approach could be justified by that all economic activity has a negative impact on the environment, and that a decrease in manufacturing costs will lead to an increase in operational income, which in turn can generate a rebound effect when invested somewhere else. However, he also argued that using the 1-EDC/LCC index could be seen as critique for using efficient products. The problem lies in the definition of value; the value of an alternative is indicated by its costs. In relation to this Lyrstedt suggested a system enlargement and a concept of added value. The glycol waste water plant does not exist in isolation, but as part of a larger system. When the reflux is increased from the reference scenario the environmental damage cost as well as the life cycle cost increases according to the EPS weighting method. This generates an extra cost for society in the increased externalities and an extra operating cost for the company, which can be seen as added value to the reference scenario. The LCC variable (which denotes the value of a system) of the 1-EDC/LCC index then increases, which implies an increased value, and hence also the eco-efficiency of the reference scenario increases (from point d to point b in figure 15). In this way also the relative effectiveness of different alternatives can be assessed, which facilitates a sounder eco-efficiency assessment. With a two-dimensional graph the effectiveness of different alternatives is communicated. In a conventional graph the relative position of different alternatives is communicated and absolute values are also indicated. Hence both the efficiency and effectiveness of different alternatives can be identified. The BASF definition on eco-efficiency is, however, not equivalent with the general definition of efficiency, which is the relation between a benefit and the costs incurred to generate that benefit (Rudenauer et al, 2005). Instead, as stated by Rudenauer et al (2005), the BASF eco-efficiency portfolio communicates the effectiveness of different alternatives, expressed as the sum of the relative and normalized environmental burden and cost. The smaller the sum, the more effective is the alternative. Hence, the value is considered to be in the function delivered by the system, rather than being reflected by cost of the system. Eco-efficiency, and effectiveness, is then to deliver this function at the lowest use of resources as possible; resources being both economic and natural capital (the environmental burden indicator serves as an indication of the use of natural capital). Consequently, the longer the distance from the diagonal, the lower the resource use, and the more eco-efficient an alternative is considered to be. The most appropriate way to present the result of an eco-efficiency analysis will depend on the context of the study. What is to be communicated and who is to take part of the information are important aspects. If for example the purpose of a study is to assess the eco-efficiency of different measures to reduce carbon dioxide emissions, it is appropriate to plot the different measures in a two dimensional graph with absolute values on the axes to communicate both the absolute and relative effectiveness of the measures. A one-dimensional index could then complement the picture in also communicating the efficiency in terms of output over input. On the other hand, when doing eco-efficiency comparisons across different sectors it can be fruitful to use a one-dimensional eco-efficiency index to communicate e.g. the relative environmental productivity or environmental intensity of the different sectors. Another advantage with a one-dimensional eco-efficiency index is that it can be used to plot the eco-efficiency of a system as a function of some parameter, and be presented in a conventional scientific graph, which is simple to grasp. The same could be done with a two-

31
dimensional index, but then the resulting plot would be a curve in three dimensions which might be harder to interpret. In general interpretation of a one-dimensional index requires more knowledge of the concept of eco-efficiency. However, it should be kept in mind that if all actors in society strive to lower its environmental intensity, as expressed by a one dimensional index, a decoupling of value creation and environmental impact will be realized. Such a one dimensional index can therefore be appropriate for an organisation to measure and benchmark. It can be argued that all economic activity has a negative environmental influence. But it could also be argued that the purpose of a waste management system is to decrease the environmental damage cost an economic activity inflicts on society. Hence, when doing eco-efficiency assessments of waste management systems the starting point could be that the environment is to be improved, or to use Huppe’s and Ishikawa’s (2007) terminology, environmental improvement is prime. What is to be communicated is then the environmental improvement cost (cost per unit of environmental improvement) or the environmental cost-effectiveness (environmental improvement per unit of cost), the two being each others inverse. However, for this to be communicated quantitatively it also requires that the environmental improvement can be measured with some yardstick. The value of the waste management system could then be related to the avoided environmental damage, rather than the costs of building and operating the system (expressed as the willingness-to-pay to avoid the COD emissions). The value is then expressed in terms of environmental utility, which is directly related to the function of the system. The avoided COD emissions can be valued with the weighting methods and matched against the weighted damage inflicted on the environment by the system. In fact this value is lower than it would be in reality, since none of the weighting methods considers any concentration gradients and hence omit eventual threshold effects. However, a comparison can still give an idea of how efficient the waste treatment system is. Table 11 lists figures expressing the net environmental benefit according to the different weighting methods. Table 11. Net environmental benefit according to different weighting methods at reflux 1500 kg/h.
EPS EDIP ECO ET-short ET-long ET-Stenungsund
Net environmental benefit (normalised with weighted environmental damage)
-95 % 1 646 % 101 033 % 16 916 % 7 245 % 30 586 %
The EPS weighting method suggests that there would be a net environmental benefit if emitting the glycol directly to the ocean prior to treatment, while all other methods clearly suggest the opposite. From en environmental and eco-efficiency standpoint the waste water treatment system is valued as most efficient by the ECO method. The above reasoning could be used to develop a one-dimensional and two-dimensional eco-efficiency index for waste management systems, which can be combined to ease interpretation. If the net environmental benefit (Ai-Ei) is normalised with a standard factor, Enorm
-1, where Enorm for example is Emax of all Ei, the resulting score can be plotted against the cost score in a conventional graph. The normalised net environmental benefit can then be divided with the cost score, to generate a one-dimensional eco-efficiency index which communicates the environmental cost effectiveness of a system (as defined by Huppes and Ishikawa):

32
A high index represents high eco-efficiency. The index facilitates comparisons across different types of waste management systems, as long as the same standard factor is used for evaluating all systems. The normalised net environmental benefit (the value of the system) can also be interpreted as the environmental efficiency of the system. All weighting methods mentioned in this report are based on the assumption that all environmental impacts can be subject to trade-offs (Steen 2007). However, in society some values are considered to be virtually non-tradable. Also there might be environmental threshold effects. For these reasons there are restrictions and laws regulating environmental interventions. COD emissions are regulated by a critical limit which Akzo is not allowed to exceed, in order to protect non-tradable environmental values. The glycol waste water management system could thus be considered as avoiding damage to these values. This avoided environmental damage cost should be larger than the environmental damage cost generated by the operation of the waste management system. Otherwise it could seem irrational to have a treatment plant in place. However, since none of the weighting methods consider any concentration gradients they can not account for eventual threshold effects. Hence the weighted avoided environmental damage might be to low, and in some cases even lower than the actual damage incurred on the environment by the waste system (as with the EPS weighting method above). The glycol waste water system does not exist in isolation, but as part of a large economic system. This should be kept in mind. It is in fact the macro system that needs to become more eco-efficient.
Can an eco-efficiency methodology for value related and environmentally connected trade offs be developed for integration into the operations of an organisation at the local level? How can these trade-offs be communicated for acceptance?
This question mainly relates to whether a set of applicable weighting indexes can be developed and adapted to the context of an organizational function, and hence mainly the ET-Stenungsund method will be discussed here. The ET-Stenungsund weighting indexes were developed and adapted to the institutional context of the glycol waste water treatment plant; where operation permits are issued by local authorities to protect environmental values and to make sure that environmental critical limits are not exceeded, and where emissions to water are weighted against emissions to air. Site and case specific weighting indexes could be established easy and quick, for a limited amount of environmental interventions, thanks to the initiative of the Stenungsund municipality to gather information concerning environmental intervention levels. This may not be the case in other situations. Also the inventory might look quite differently and a compatible set of weighting indexes might be hard to establish. But if industry and governments collaborate on these issues a comprehensive database with environmental intervention data might be established in the future. There are in fact already several governmental initiatives taken with the purpose of gathering regional and national emission data (RUS, 2007). If a set of weighting indexes is not adequate with regard to the purpose of the study there are possibilities to develop new indexes. Different weighting methods are based on different principles and methods for deriving weighting indexes. These principles and methods
Ci * Enorm EEwms =
(Ai-Ei)

33
determine how flexible a weighting method is in adapting weighting indexes to case- and site specific contexts. The Environmental Themes oriented methods give some freedom in the choice of themes and in the way the weight factors are determined (Baumann & Rydberg, 1994). This opens up possibilities for case- and site-specific adaptation of weighting factors, as done in the ET-Stenungsund method. The principles of the ECO method can also be applied quite readily and choice of reference flow is not restricted to environmental critical limits but can also be policy targets. New weighting indexes in the EPS method can also be calculated and adapted to specific circumstances. The EPS default weighting index for COD is very low and reflects a global average concerning eutrophication. An index developed from a site-specific evaluation of the local effects of COD discharge would have been more appropriate for this case study. Such index could be established by determining what the average citizen in the adjacent municipality is willing to pay for a water recipient with good recreational possibilities. This would however not be as easy as applying official secondary data on regional emissions and policy targets, as was done in the Swedish ET methods. For companies it is imperative that they are well informed about how their activities actually effect the environment. When authorities establish operational permits they base these on BAT (best available technology) as well as considerations of local environmental background conditions (Michenek & Zetterberg, 2004). The BAT should in turn be based on holistic environmental considerations. Firms apply environmental system analyses for optimizing the environmental performance of systems or specific processes in an environmentally holistic way. The information generated by these analyses should be used in discussions with authorities about emission limits/permits. For an environmental assessment of waste stream treatment technologies, and if valuation is a necessary step for simplifying a decision process, it seems rational and appropriate to apply a weighting scheme based on the purpose of the system studied, i.e. avoiding emissions above critical limits established by authorities. The ET-short and ET-Stenungsund methods are based on targets in Swedish environmental legislation, and are thus motivated choices of weighting methods for this study and similar cases (Kindstrand, Andren, 2007). The ET-short indexes used in this case are however quite old (from 1993) and should, if possible, be updated for use in other case studies. There are other weighting methods (Tellus and DESC) which are based on the costs of controlling and reducing impacts down to target levels determined by environmental authorities (Baumann, 2004). These could also be appropriate choices. A large part of the environmental load inflicted by the glycol waste water treatment process is restricted to a local or regional geographic area. This facilitates site-specific valuation. In a normal LCA, however, many unit processes are usually included, and they are commonly spread over the globe. This complicates the weighting processes even further, as the environmental background conditions as well as the institutional settings might differ considerably between different geographic locations. A good choice then can be either to cover the values of as many citizens affected as possible, or to cover the values of the company which in turn might reflect the preferences of important stakeholders. Reduction of COD, CO2 and VOC are e.g. high on the environmental agenda of Akzo Nobel, which has targeted a 30 % reduction goal by 2010 (Akzo Nobel, 2007). Thus if a weighting scheme which reflects these concerns is used, also the values of the organisation will be included in the weighting. In fact a weighting method could quite readily be adapted to an organisation and its environmental targets. Furthermore, as already discussed, an organisation can also decide what trade offs to make between environment and economy. Taking also into mind that there are many different sets

34
of environmental weighting indexes already established, based on different views on nature and society, there are possibilities for an organisation to make explicit and value related trade offs between different environmental loads, as well as between environment and economy, when performing eco-efficiency analysis.

35
5 Conclusions The purpose of the case study was to investigate how the eco-efficiency of a glycol waste water treatment system changes at varying process conditions. The results indicate that the studied system is very eco-efficient, and the potential environmental benefits and cost reductions from deviating from the present process conditions are very small. Also different weighting methods generated diverging results concerning the most environmentally benign process setting. Therefore the recommendation is to operate at the present process conditions. The study indicates that there are significant differences between different weighting methods concerning how they weigh different environmental interventions. This is because they reflect different preferences towards society and nature. It is of great relevance to understand these preferences in order to apply a weighting method not only compatible with the environmental inventory profile of an EEA but also compatible with the objective of an EEA. E.g. the EPS method reflects individuals expressed and stated perceptions of the global average environmental damage cost of an alternative, whereas methods based on political targets (e.g. the ET-method) are more explicitly focused on compliance with the law. The later is more compatible with a study with the objective to serve as basic data in concession matters concerning emission and operation permits. The application of the Environmental Themes Stenungsund weighting method shows that there is potential for weighting indexes to readily be adapted to the environmental and institutional context of a study. For this purpose the ET method is flexible in the sense that one can choose impact categories and principle for the subjective judgement, e.g. panels, critical loads, political targets etc, and which geographic region to apply these principles on. This proves the weighting to be meaningful in adding information, and providing adequate and easy-to-interpret indicators, to assist in decision processes. It can also be a way to engage relevant stakeholders in the decision process, and to facilitate easy-to-interpret eco-efficiency indicators to be developed. The most appropriate way to present the result of an eco-efficiency analysis will, however, depend on the context of the study. What is to be communicated and who is to take part of the information are important aspects. However, in general interpretation of a one-dimensional index requires more knowledge of the concept of eco-efficiency. Therefore it is probably wise to apply a two-dimensional graph with absolute or normalised values on the axes, which can communicate both the absolute and relative effectiveness of different alternatives. A one-dimensional index could then work as a complement in also communicating the efficiency in terms of a benefit over costs incurred to generate that benefit. Finally, when doing eco-efficiency measurements it is of great relevance to understand the relationship between the value of the system and the environmental impact which the system causes. The value of a waste management system could be related to the net environmental service it produces. Environmental improvement can then be said to be the primary objective, and eco-efficiency to achieve more net environmental service to a smaller cost. However it is also important to remember that a waste management system is part of a larger economic system, and that all economic activity causes an environmental impact. At the corporate and macro level eco-efficiency is to decouple economic activity from environmental impact.

36
References Publications: Akzo Nobel (2006a) Akzo Nobel eco-efficiency review. Akzo Nobel (2006b) Akzo Nobel Corporate Social Responsibility Report. Akzo Nobel (2006c) Utspädningsberäkning för utsläpp från Akzo Nobels fabrik i Stenungsund till Askeröfjorden. Beräkning för ett konservativt ämne. Akzo Nobel (2007) Available at: http://www.akzonobel.com/com/ (Accessed: 23 May 2007) BASF (2005) BASF Eco-efficiency analysis – methodology seminar. Seminar notes, Sustainable Development Group, Akzo Nobel Baumann, H. & Rydberg, T. (1994) Life cycle assessment. A comparison of three methods for impact analysis and evaluation. Technical Environmental Planning and Chemical Environmental Science, Chalmers University of Technology, Göteborg, Sweden. Baumann, H. & Tillman, A-M. (2004) The Hitch Hiker’s Guide to LCA. Studentlitteratur, Lund. Bengtsson, M. (2000) Environmental Valuation and Life Cycle Assessment. CPM-Report 2000:1, CPM, Centre for Environmental Assessment of Product and Material Systems, Chalmers University of Technology, Chalmers Reproservice, Göteborg Bengtsson, S. & Sjöborg, L. (2004) Environmental costs and environmental impacts in a chemical industry. M. Sc. Thesis, Chalmers University of Technology, Göteborg, Sweden Brent, A. C. & Hietkamp (2003), S. Comparative Evaluation of Life Cycle Impact Assessment Methods with a South African Case Study. International Journal of LCA 8(1) pp 27-38. Charles R., Humbert S., Jolliet O., Margni M., Payet, J., Rebitzer, G. & Rosenbaum, R. (2003) IMPACT “==”+: A New Life Cycle Impact Assessment Methodology. International Journal of LCA, 8(6) pp 324-330. Dow Jones Sustainability Index (2007) Available at: http://www.sustainability-indexes.com/07_htmle/indexes/djsiworld_supersectorleaders_07.html (Accessed 1 December 2007) Finnveden, G. (1996) Valuation Methods within the Framework of Life Cycle Assessment. IVL Rapport B1231. Institutet för Vatten- och Luftvårdsforskning. Swedish Environmental Research Institute, Stockholm. Guinée, J. B. (Ed.) (2002) Handbook on Life Cycle Assessment. Operational Guide to the ISO Standards. Kluwer Academic Publishers, Dordrecht, the Netherlands. Hertwich E. G. & Hammit J. K. (2001a) Decision-Analytic Framework for Impact Assessment. Part 1: LCA and Decision Analysis. International Journal of LCA, 6(1) pp 5-12.

37
Hertwich E. G. & Hammit J. K. (2001b) Decision-Analytic Framework for Impact Assessment. Part 2: Midpoints, Endpoints, and Criteria for Method Development. International Journal of LCA, 6(5) pp 265-272. ISO 14043 (2000) Life cycle assessment – Life cycle interpretation Huppes, G. & Ishikawa, M. (2007) Quantified Eco-Efficiency. An Introduction with Applications. Springer, ISBN: 978-1-4020-5398-6 Jacksson, A.R.W & Jacksson, J.M. (2000) Environmental Science. The Natural Environment and Human Impact. Pearson Education Limited, Harlow, England. ISBN 0 582 41445 8. Karlsson, H. (1999) An overview of different quantitative valuation/weighting methods for LCA. IVF Research Publication 99809. Institutet för verkstadsteknisk forskning, Göteborg. ISSN 0349-0653. Karlsson, S (1997) Man And Materials Flows. Towards sustainable materials management. The Baltic University Programme, Uppsala University. ISBN 91-7005-126-7 Kolk, A. (2000) Economics of Environmental Management. Pearson Education Limited, Harlow, England. ISBN 0 273 64238 3. Lyrstedt, F. (2005) Measuring Eco-efficiency by a LCC/LCA Ratio; An Evaluation of its applicability, A case study at ABB. M. Sc. Thesis, Chalmers University of Technology, Göteborg, Sweden Meadows… (1972) Limits to Growth. Michanek, G. and Zetterberg, C. (2004) Den Svenska Miljörätten. Iustus Förlag AB, Uppsala, Sweden. ISBN 91-7678-512-2 MKB, 2004, Miljökonsekvensbeskrivning. Akzo Nobel Sustainable Development Naturvårdsverket (2005) Förbränningsanläggningar för energiproduktion inklusive rökgaskondensering. Branschfakta, utgåva 2. Swedish Environmental Protection Agency. Naturvårdsverket (2007) Available at http://www.naturvardsverket.se/ (Accessed: 17 July 2007) Rudenauer et al (2005) Integrated Environmental and Economic Assessment of Products and Processes. Journal of Industrial Ecology. Volume 9 RUS (2007) Regionalt UppföljningsSystem för nationella miljömål. Available at http://www.rus.lst.se/ (Accessed: 15 August 2007) Rydberg, T. (1993) Effektkategorimetoden, in Baumann, H., Ekvall, T., Eriksson, E., Kullman, M., Rydberg, T., Ryding, S.-O., Steen, B. och Svensson, G.: Miljömässiga skillnader mellan återvinning/återanvändning och förbränning/deponering, Reforsk Fou Nr 79, Stiftelsen Reforsk, Malmö, 1993.

38
Rydh, C J. Lindahl, M and Tingström J. (2002) Livscykelanalys- en metod för miljöbedömning av produkter och tjänster, ISBN 91-44-02447-9. Studentlitteratur, Lund. Saling, P. Kicherer, A. Dittrich-Krämer, B. Wittlinger, R. Zombik, W. Schmidt, I. Schrott, W and Schmidt, S. (2002) Eco-efficiency Analysis by BASF: The Method, International Journal of LCA 7(4), pp 203-218. Schmidt, W-P. & Sullivan, J. (2002) Weighting in Life Cycle Assessments in a Global Context. International Journal of LCA, 7(1) pp 5-10. Schumacher, E.F. (1973) Small is beautiful. Vintage Books, Random House UK Ltd, London. ISBN 0 09 922561 1. Skantze, G. (2005) Measuring Eco-efficiency by a LCC/LCA Ratio; An Evaluation of the applicability in Environmental Decision-Making Situations, A case study at Akzo Nobel. M. Sc. Thesis, Chalmers University of Technology, Göteborg, Sweden Steen, B. (1999) A systematic approach to environmental priority strategies in product development (EPS). Version 2000-Models and data of the default method. CPM report 1999:5, Centre for Environmental Assessment of Products and material systems, Chalmers University of Technology, Göteborg, Sweden Stenungsund (2007a) Available at http://www.stenungsund.se/ (Accessed: 17 July 2007) Stenungsund (2007b) Official environmental statistics kindly provided by the environmental department at Stenungsund municipality. Stenungsund (2007c) Environmental visions and goals of Stenungsund municipality. Kindly provided by the environmental department at Stenungsund municipality. Sturm, A. Müller, K. and Upasena, S. (2004) A manual for the preparers and users of eco-efficiency indicators, United nations conference on trade and development Sustainable Development (2007) Available at: http://www.sd.akzonobel-te.com/ (Accessed 23 May 2007) WCED, (1987) Our Common Future. World Commission on Environment and Development, Clays Ltd, Bungay, Suffolk. Westerlund, J. (2001) Shareholders Wealth Gratification in the Swedish Limited Liability Company – A Discussion and Analysis from a Legal, Economical and Ethical Point of View Regarding the Purpose of the Company to Increase the Wealth of its Shareholders. Master thesis at the Institution of Economics, Linköping’s University, Sweden. Personal communication: Andrén, K. (2007) Health Safety & Environment Manager at Akzo Nobel Business Unit Functional Chemicals

39
Hallberg, K. (2007) Manager Sustainable Development Akzo Nobel Rydberg, T. (2007) Environmental consultant IVL Steen, B (2007) Professor at Environmental System Analysis, Chalmers University of Technology

Appendix I

i
Eco-efficiency analysis methodology Eco-Efficiency Analysis (EEA) is a tool which helps managers to implement the eco-efficiency concept and to make strategic decisions (Akzo Nobel, 2006). EEA assesses the ecological impact and cost structure of competing products, processes or services delivering the same function. There is no standardized procedure for carrying out an EEA, but there is on-going work on this matter (Steen, 2007). The general procedure for carrying out an EEA is presented in figure 1. The goal and scope definition is the phase in which the initial choices which determine the working plan of the entire EEA are made. The cost structure is commonly assessed through life cycle costing or total cost accounting, while the ecological assessment frequently is carried out with the procedures of a Life Cycle Assessment (LCA). ISO standards on LCA methodology have been prepared for harmonisation of LCA procedure and for credibility reasons. The grey shaded steps in figure 1 are equivalent to those in the LCA standards. To facilitate interpretation and communication, the results of the economic and ecological assessments can be integrated and presented in different forms, depending on method chosen and level of aggregation.
Figure 1. General procedures for eco-efficiency analysis. Modified from Rudenauer et al 2005
Goal and Scope Definition The goal definition states the purpose of the study and the intended use of the results. The goal can for example be to assess the optimal packaging of one litre of fluid, from an environmental and financial point of view, to get basic data for decision making of strategic investments. EEA is a function orientated method, its focus is on all processes required to produce a function. Therefore the scope definition needs to include a description of the function and product (which delivers the value) to be studied. A functional unit is a measure of the systems performance and function which satisfies a need. Also included in the scope definition is a definition of geographical, temporal and technical (against nature and other products lifecycles) system boundaries, which defines which processes to include in the EEA. Finally the scope definition should include a statement of which flows to quantify in the inventory, and demands on the quality of data. The goal and scope definition can be seen as a process regulation step, which makes sure that the function
Definition of goal and scope of the study
ECOLOGY ECONOMY
Life Cycle Impact Assessment
- Classification - Characterisati
on - Weighting
(aggregation)
Life Cycle Costing
Integrated assessment and evaluation
I n t e r p r e t a t i o n
Purpose of EEA: Strategic planning Product development Policy creation Environmental
labelling Marketing Other
Life Cycle Inventory
Aggregation

ii
and system boundaries of the system under study are identical in the economic and environmental assessment.
Life Cycle Costing (LCC) The focus of life-cycle costing is adapted according to the goal and scope of the study (Rudenauer et al, 2005). The LCC is actor-specific, i.e. all costs for a certain actor that are associated with a given alternative over the whole period of ownership or stewardship are taken into account. The actor to focus the LCC around is given by the goal and scope definition. Often the actor is the purchaser of a product and the purpose of the LCC result is to communicate how future costs of the product will affect the economy of the purchaser (Bengtsson & Sjöborg, 2004). The costs that are included in the LCC can be allocated to four main phases of a products life cycle; Engineering & development, Production & implementation, Use and End of life cycle (figure 2).
Figure 2. Schematic model of the different phases where costs are studied for an LCC. (Source Bengtsson & Sjöborg, 2004).
Since all costs are measured in monetary units, the inventory results of all unit processes can easily be added up to one figure indicating the total costs of the life cycle. External costs are not covered by the LCC (unless internalized through environmental regulations, e.g. an emission fee) (Rudenauer et al, 2005). By definition external costs are borne by society, and reflect environmental aspects of the system under study. These aspects are covered by the LCA.
Life Cycle Inventory (LCI) The life cycle inventory step involves quantification of inflows and outflows of material and energy over the defined system boundaries of the lifecycle. Thus it include flows related to raw material extraction, processing of raw materials, manufacturing, use, maintenance, recycling/reuse, waste management and transportation (figure 3). Each process requires material and/or energy inflow and produces different kinds of emissions and waste.
Engineering & development
Production & implementation
Use End of life
LCC

iii
Figure 3. Example of activities which can be included in a lifecycle. Source: Rydh et al 2002.
The quantified flows can be sorted into data categories, e.g. energy use, resource use, emissions to air, water and land, and waste. Examples of flows and related data categories are coal (resource use), carbon dioxide (emission to air), nitrogen dioxide (emission to air), Zink (resource use, emission to water or land) and radioactive waste (waste).
Life Cycle Impact Assessment (LCIA) The vast amount of data produced by the LCI, and the complexity of the cause effect chains of different environmental interventions, make it hard to identify which data that is important from an environmental point of view (Rydh et al, 2002). For interpretation and communication purposes, methods have been designed to aggregate the LCI data to fewer digits, representing either different impact categories (characterization) or the total environmental load of the system (weighting). The aggregation process applies different evaluation methods, to relate the environmental impacts of different data categories to each other. In this way the environmental hot spots of the life cycle can more readily be brought out. The LCIA is based on an assessment of the potential environmental load, i.e. the possible influence on the environment of the analysed activities. The LCIA encompasses three parts; classification, characterization and weighting (see figure 4).
Lifecycle of product or
process
Extraction of raw materials
Recycling/Reuse
Manufacturing
Transports
Processing raw materials
Waste management
Maintenance
Use
Material Energy
Emissions to air Emissions to water Solid waste Other emissions
Inflow Outflow

iv
Figure 4. Phases included in Life Cycle Impact Assessment. Modified from Ryding et al. (2003).
Classification In the classification phase inventory data is sorted into environmental effect categories (also called environmental impact categories, environmental threats or environmental themes). The classification is based on scientific cause-effect relations, and hence one substance can be assigned to more than one environmental effect category. Examples of environmental effect categories are eutrophication, acidification, global warming, ozone depletion and photochemical oxidant creation.
Characterization In the characterization process inventory data is multiplied with a characterization factor (e.g. equivalences, see figure 4) which is specific for each data and environmental effect category. In this way, for each category, the potential environmental impact of all substances in the category is summed up, and represented by one index. This facilitates identification of which emissions that have significant impacts on the environment. Impact categories that are generally considered in EEAs and which are widely accepted in LCA methodology are global warming potential, acidification potential, eutrophication potential, photochemical ozone creation potential, human toxicity potential and resource depletion potential.
Weighting In the weighting process the inventory data is aggregated into a single indication or statement of the total strain put on the environment. This makes it possible to assess the relative contribution of different environmental interventions or impact categories, to the total strain. There are different methods for weighting which are based on different criteria. Examples of criteria are political targets, ecological critical limits and willingness to pay (WTP) to avoid a problem. As for today there are no commonly accepted methods for a consequent and exact association of inventory data with specific potential environmental impacts. This is, according
Energy Generation
Industry Production
SO2
NH3
COD
CO2
NOx
CH4
Inventory Classification Characterisation Weighting Acidification
Eutrophication
Global Warming
SO2
NOx
NH3
NOx
COD
CO2
CH4
Acidification Potential
Eutrophication Potential
NH3
Global Warming Potential
∑
e.g. H+ eqv
e.g. N eqv
Equivalencies
e.g. CO2 eqv
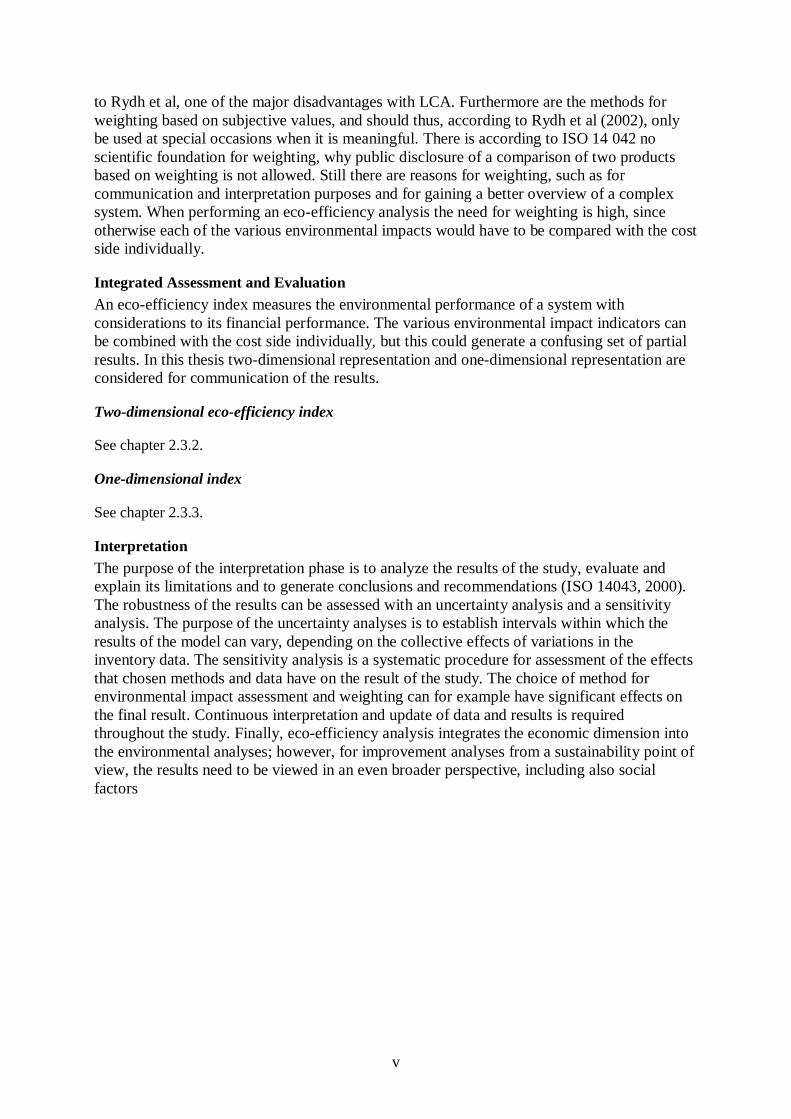
v
to Rydh et al, one of the major disadvantages with LCA. Furthermore are the methods for weighting based on subjective values, and should thus, according to Rydh et al (2002), only be used at special occasions when it is meaningful. There is according to ISO 14 042 no scientific foundation for weighting, why public disclosure of a comparison of two products based on weighting is not allowed. Still there are reasons for weighting, such as for communication and interpretation purposes and for gaining a better overview of a complex system. When performing an eco-efficiency analysis the need for weighting is high, since otherwise each of the various environmental impacts would have to be compared with the cost side individually.
Integrated Assessment and Evaluation An eco-efficiency index measures the environmental performance of a system with considerations to its financial performance. The various environmental impact indicators can be combined with the cost side individually, but this could generate a confusing set of partial results. In this thesis two-dimensional representation and one-dimensional representation are considered for communication of the results.
Two-dimensional eco-efficiency index
See chapter 2.3.2.
One-dimensional index
See chapter 2.3.3.
Interpretation The purpose of the interpretation phase is to analyze the results of the study, evaluate and explain its limitations and to generate conclusions and recommendations (ISO 14043, 2000). The robustness of the results can be assessed with an uncertainty analysis and a sensitivity analysis. The purpose of the uncertainty analyses is to establish intervals within which the results of the model can vary, depending on the collective effects of variations in the inventory data. The sensitivity analysis is a systematic procedure for assessment of the effects that chosen methods and data have on the result of the study. The choice of method for environmental impact assessment and weighting can for example have significant effects on the final result. Continuous interpretation and update of data and results is required throughout the study. Finally, eco-efficiency analysis integrates the economic dimension into the environmental analyses; however, for improvement analyses from a sustainability point of view, the results need to be viewed in an even broader perspective, including also social factors

Appendix II

i
Environmental Themes Stenungsund methodology report In eco-efficiency studies it has been recognized that generic weighting methods are not always adequate in relation to the context and purpose of a study. If e.g. a study is related to locally set emission standards and if a weighting method is to add meaningful information to the study it needs to be adapted to the environmental imperatives of the local community. Environmental Themes Stenungsund is a weighting method which can assist in decision processes, as an adequate and meaningful yardstick, for assessing which technology choices are most environmentally benign and contribute most to reaching the environmental targets established by local authorities in Stenungsund. Hopefully such a method can be a help in identifying what measures that are socially optimum, and in bringing consensus in discussions between industry and local authorities concerning such matters.
The Stenungsund Municipality The municipality of Stenungsund is situated on the west coast of Sweden in the county of Västra Götaland and approximately 50 km north of the city of Göteborg. It was founded in 1952, with a population of 4700 people and an area of 254 km2 (Stenungsund, 2007a). Since then the population of the municipality has grown significantly to 23000 people and is today one of the fastest growing in Sweden. Two important drivers for this growth are the beautiful natural surroundings and the petrochemical industry situated in Stenungsund.
The Natural Surroundings Stenungsund municipality is home to an archipelago in the west and forests and lakes in the east, which provide for great recreational opportunities and add to the aesthetic value of the community.
The Petrochemical Industry Stenungsund municipality is with its petrochemical industry distinct from an industrial viewpoint. The petrochemical industry provides a very good foundation for many small and middle sized companies. These companies have established and specialised them selves in order to deliver services to the big petrochemical companies. The big companies in Stenungsund are Vattenfall, AGA, Borealis, Hydro Polymers, Perstorp Oxo and Akzo Nobel. They are situated close to each other since most of them are directly or indirectly interdependent (figure 1).
Figure 1. The petrochemical industry situated in Stenungsund. (Source: www.stenungsund.se)
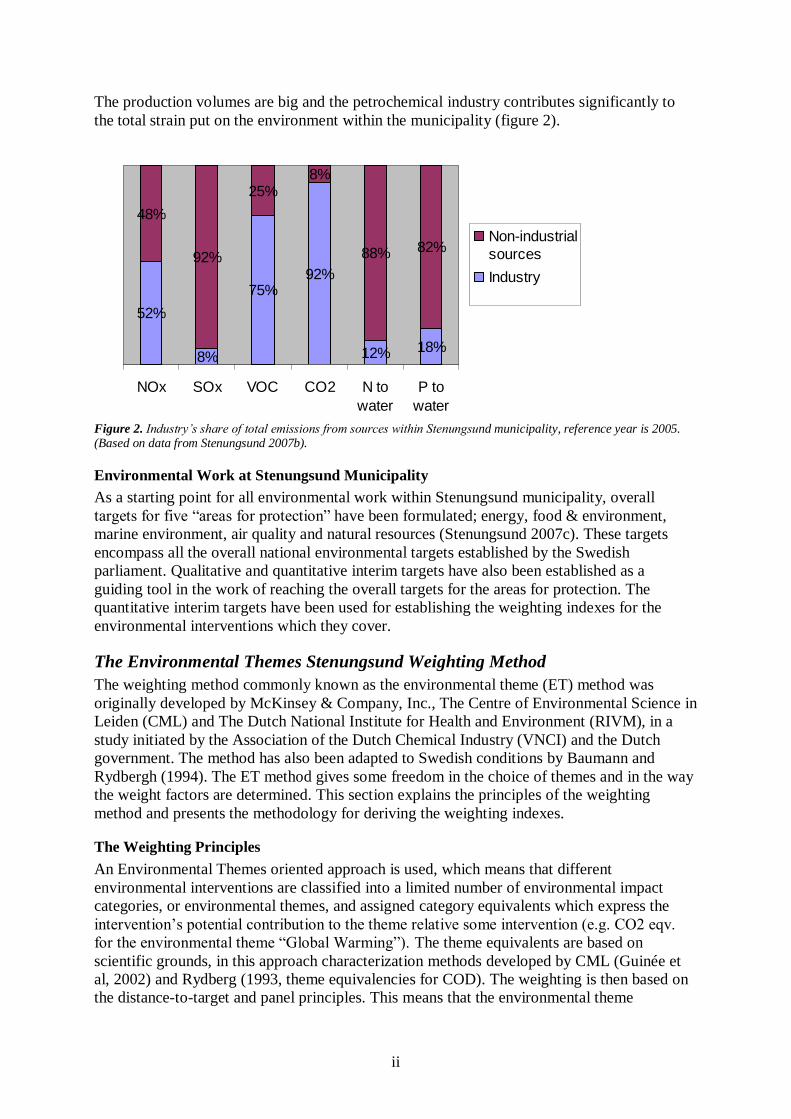
ii
The production volumes are big and the petrochemical industry contributes significantly to the total strain put on the environment within the municipality (figure 2).
52%
8%
75%92%
12% 18%
48%
92%
25%8%
88% 82%
NOx SOx VOC CO2 N towater
P towater
Non-industrialsourcesIndustry
Figure 2. Industry’s share of total emissions from sources within Stenungsund municipality, reference year is 2005. (Based on data from Stenungsund 2007b).
Environmental Work at Stenungsund Municipality As a starting point for all environmental work within Stenungsund municipality, overall targets for five “areas for protection” have been formulated; energy, food & environment, marine environment, air quality and natural resources (Stenungsund 2007c). These targets encompass all the overall national environmental targets established by the Swedish parliament. Qualitative and quantitative interim targets have also been established as a guiding tool in the work of reaching the overall targets for the areas for protection. The quantitative interim targets have been used for establishing the weighting indexes for the environmental interventions which they cover.
The Environmental Themes Stenungsund Weighting Method The weighting method commonly known as the environmental theme (ET) method was originally developed by McKinsey & Company, Inc., The Centre of Environmental Science in Leiden (CML) and The Dutch National Institute for Health and Environment (RIVM), in a study initiated by the Association of the Dutch Chemical Industry (VNCI) and the Dutch government. The method has also been adapted to Swedish conditions by Baumann and Rydbergh (1994). The ET method gives some freedom in the choice of themes and in the way the weight factors are determined. This section explains the principles of the weighting method and presents the methodology for deriving the weighting indexes.
The Weighting Principles An Environmental Themes oriented approach is used, which means that different environmental interventions are classified into a limited number of environmental impact categories, or environmental themes, and assigned category equivalents which express the intervention’s potential contribution to the theme relative some intervention (e.g. CO2 eqv. for the environmental theme “Global Warming”). The theme equivalents are based on scientific grounds, in this approach characterization methods developed by CML (Guinée et al, 2002) and Rydberg (1993, theme equivalencies for COD). The weighting is then based on the distance-to-target and panel principles. This means that the environmental theme

iii
potentials are normalised against an external reference flow, and assigned weight factors expressing the relative importance of the themes, involving subjective judgement. Through the normalisation step the significance of a system’s contribution to a theme is expressed, and in case of comparative assessments the relative reduction of the distance to the reference flow level is communicated. It also converts the system’s different theme potential contributions into a dimensionless form, and facilitates the subsequent aggregation across all themes. The rationale for assigning theme weight factors are that the characteristics of the themes’ influence on the environment, as well as the costs of reaching the theme targets, and the time span until the target has to be reached, may differ between different themes. In the Dutch and Swedish study, the reference flows were national total contributions to the themes chosen. In the Dutch study ad hoc weight factors were derived in a Delphi-like process, whereas in the Swedish study weight factors were set as the ratio between the total load within the environmental theme and the Swedish 1995 political target load for the same theme. The special features of the ET-Stenungsund method are:
The reference flows are environmental quality targets for the themes, established by environmental authorities in the Stenungsund municipality. Political targets are chosen since they are considered to be value-full in the sense that they reflect the preferences of society, here the Stenungsund community. The more important an environmental threat is considered to be by society, the more ambitious the target is for that specific threat.
The environmental authorities in Stenungsund were asked to give weights denoting the relative importance of the themes. In this way the subjective part of the weighting, i.e. the weight factors, reflects the preferences and environmental imperatives of the authorities.
A classification of the weighting method is presented in table 1. Table 1. Classification label for ET-Stenungsund
Method Country of origin
Spatial Extension
Environmental goal or reference
Impact indicator in cause effect network which is evaluated (what is evaluated)
Weighting Principle used for evaluating impact indicator (how is it evaluated)
Preferences used for valuation (who is evaluating)
Environmental Themes Stenungsund
Sweden Stenungsund municipality
Environmental policy targets
Midpoint effects
Distance-to-target and panel method
Society’s preferences, and environmental authorities’ preferences (as experts)
The way the principles are implemented mathematically is presented in detail in the next section.

iv
Weighting Methodology The total environmental load index, TEI, of a system is given by:
where: Wi = a weight factor expressing the relative severity of theme i according to the preferences
of the environmental authorities in Stenungsund (if Wi is set to 1 for all i, all targets are equally important)
p = all environmental themes 1,2…p for which the target levels have not yet been achieved TFi = theme fraction, i.e. system specific interventions sorted into theme i, and divided by the
target contribution to the same theme within Stenungsund municipality during one year (reference flow), given by:
where: Loadj= the magnitude and unit of measurement of intervention j n = all interventions caused by the system from a lifecycle perspective Eqvji = the theme i characterisation factor for intervention j, describing the environmental
influence of an intervention. Loadk,target = the target load of intervention k Eqvki =equivalency of intervention k contributing to theme i N = all interventions from sources within Stenungsund municipality during one year. Combining equations (1) and (2) give:
The total environmental load index of a system is also given by:
where WIj is the intervention j specific weighting index. Combining equations (3) and (4) give:
TEI = = ∑ Loadj
j
n Wi * Eqvji i
p
∑ Loadk,target * Eqvki N
k
∑ ∑ Wi * i
p ∑ j
Loadj * Eqvji
∑ Loadk,target * Eqvki N
k
n
TEI = ∑ Wi * TFi p i
(1)
TFi =
∑ j
Loadj * Eqvji
∑ Loadk,target * Eqvki N
k
(2)
TEI = ∑ Loadj * WIj j
n
(4)
n
(3)

v
There is a singularity if a theme target is set to no anthropogenic impact, i.e. if Loadk,target = 0 for all interventions contributing to a specific theme this would imply an infinite valuation weighting index for all interventions contributing to these themes. For these themes a maximum value could be assigned. Emission data and target loads were obtained for NOx, SOx, VOC and CO2 emissions to air, and N, P and COD emissions to water, for the baseline year 2005. The environmental themes were chosen so as to cover all impacts of these interventions, including climate change, acidification, eutrophication, photochemical oxidant creation and human toxicity. Figure 3 depicts the weighting procedure and denotes the areas for protection for which interim targets have been used for calculating the theme specific target loads, by which the theme potentials are divided, and subsequently multiplied with a weight factor.
Figure 3. Weighting procedure of ET-Stenungsund. Ti is the reference flow.
WIj = Wi * Eqvji i
p
∑ Loadk,target * Eqvki N
k
∑ (5)
NOx
SOx
VOC
CO2
Ptot
Ntot
Classification Eutrophication
NOx
Ptot
Ntot
Acidification
NOx
SOx
Photochemical Oxidant Creation
Human Toxicity
SOx
Global Warming
CO2
NOx
SOx
VOC
Emissions to Air
Emissions to Water VOC
Eutrophication Potential
Characterisation
Acidification Potential
Global Warming Potential
Human Toxicity Potential
Photochemical Oxidant Creation Potential
PO43- eqv
SO2 eqv
Ethylene eqv
CO2 eqv
1,4 dichlorobenzene eqv
Marine Environment
Air Quality
Natural Resources
TEI
Natural Resources
Air Quality
Marine Environment
Natural Resources
Air Quality
Air Quality
System Inventory profile
* WEP
/ TAP
/ TEP
+
* WAP
Weighting Influence on
/ TPOCP * WPOCP
* WGWP
/ TGWP
/ THTP
* WHTP

vi
Table 2 gives an account for each theme concerning the targets, the actual contribution to the themes from sources within Stenungsund municipality, and the weight factors conveying the preferences of the Stenungsund municipality. Table 2. Environmental themes, actual contributions from sources within Stenungsund municipality, political targets, ratio of these, and weighting factors. Baseline year is 2005.
Theme
Influence on Actual contribution from sources within Stenungsund 2005
Policy target set for year 2010
Contribution 2005/policy target
Weight factor
Eutrophication 2,65 * 105 kg PO43- eq 2,24 * 105 kg PO4
3- eq 1,18 1 Acidification 8,95 * 105 kg SO2 eq 7,15 * 105 kg SO2 eq 1,25 1 Photochemical oxidant creation
2,40 * 106 kg Ethylene eq
1,56 * 106 kg Ethylene eq
1,53 1
Global warming 1,05 * 109 kg CO2 eq 7,80 * 108 kg CO2 eq 1,35 1 Human Toxicity 1,61 * 106 kg 1,4-
dichlorobenzene eq 1,05 * 106 kg 1,4-dichlorobenzene eq
1,53 1
Weighting Indexes Environmental intervention weighting indexes are presented in table 3 together with theme equivalency factors for each intervention. Table 3. Environmental intervention weighting indexes for the ET-Stenungsund method.
Environmental Intervention Environmental Theme Equivalencies Weighting Index GWP100 AP POCP EP HTP Emissions To Air [kg] Carbon dioxide, CO2 1 0,13 Sulfur dioxide, SO2 1 0,048 0,096 152 Volatile organic compounds, VOC 1 0,64 125 Nitrogen oxides to air, NOx 0,7 0,13 0,06 162 Emissions To Water [kg] Total nitrogen to sea, Ntot 0,42 188 Fosfor, Ptot 3,06 1369 COD 2,2875 0,022 10
Discussion The ET-S weighting method is based on targets and preferences established by governmental bodies, partly because it is assumed that decisions taken by democratically elected governments will represent the views of society. However, this way of deriving weighting indexes might be considered inappropriate by persons holding a less positive view of representative democracy. Finnveden (1996) mentions how people subscribing to a platonic view of society might suggest that weighting indexes rather should be derived from the opinions of experts. In a sense both views are integrated in the ET-S method since the environmental authorities can be viewed as environmental experts, in that they at least possess more environmental knowledge than the common man. A critique towards the ET-short and ET-Stenungsund methods could be that they in a sense are taking a short time perspective since they are based on public environmental policy targets which are defined for shorter time periods such as 5-10 years (Baumann & Tillman, 2004). However, the Swedish public environmental policy targets of today are formulated so as to facilitate a sustainable development (Michanek & Zetterberg, 2004)). The definition of

vii
sustainable development includes concerns about future generations and thus takes a long time perspective. Hence it could be argued that a method based on such targets implicitly takes a long time perspective (Finnveden, 1996). Furthermore, if the ET-short method should be updated and adapted to these targets it could provide a valuable tool for weighting of different environmental loads, when applied in a Swedish context. This might in turn simplify communication with Swedish environmental authorities. Indexes for only a few environmental interventions were established to cover oxygen depleting substances and the most significant environmental loads from steam production (see case study). Hence this set of weighting indexes can prove useful when there is an environmental trade off situation in which emissions to air are weighted against emissions to water. However, in the future more weighting indexes can be established which will make the ET-S method compatible with many more case studies. Also a weighting method based on the same principles can be adapted to an administrative county, e.g. Västra Götaland.

Appendix III

i
BASF eco-efficiency interpretation key This appendix is based on the article ”Eco-Efficiency. Combining Life Cycle Assessment and Life Cycle Costs via Normalization”, in The International Journal of Life Cycle Assessment, vol 12, No 7, November 2007, written by Kircherer et al, and personal experience of BASF’s eco-efficiency tool. The BASF eco-efficiency method calculates an eco-efficiency interpretation key for two or more alternatives delivering the same customer benefit/function. It aggregates the environmental and financial inventories of the different alternatives into points in a two-dimensional diagram. The axes in the diagram are inverted so that the alternative that has the lowest sum of environmental and financial performance is found closer to the upper right corner. This alternative is termed the most eco-efficient alternative. The environmental inventory is aggregated into a one-dimensional index through a weighting process. In this process the environmental interventions of the alternatives are first classified into different impact categories, and assigned a characterization score which determines the interventions contribution to the impact category relative some other interventions. The impact categories are:
Primary energy Resource depletion Global warming Acidification Photochemical ozone depletion Stratospheric ozone depletion Water emissions Waste Land use Toxicity Risk
For each impact category all alternatives’ score are normalised towards the alternative with the worst performance. The scores of the different impact categories are then multiplied with a weighting factor and added up. The sum of all weighting factors is 1. Consequently the highest possible total environmental score is 1. The total environmental score of each alternative is then normalised towards the average of all environmental scores. The resulting score is the preliminary environmental position (E0) for the final diagram. The weighting factors are calculated through taking the square root of the product of a scientific factor and a societal factor which are specific for each impact category: The scientific factor is derived through relevance factors which are calculated through normalizing the impact category score of the alternative with the highest score with the total load within a specific region. The scientific score is derived by normalizing the relevance factor of each impact category towards the sum of all relevance factors. The societal factors express the severity of each impact category relative the other impact categories as perceived by a group of people.
Weighting factor = scientific factor * societal factor

ii
The cost scores of all alternatives are normalised towards the average of all cost scores. The resulting score is the preliminary cost position (C0) for the final diagram. Cost relevance factors are computed by dividing the cost scores with the gross domestic product of the same region that was used to calculate the environmental relevance factors. The environmental and cost scores are then combined in the BASF eco-efficiency interpretation key through the environment to cost relation (ETCR) for a complete project. This ETCR is calculated by taking the square root of the ratio of the average of all environmental relevance factors and the average of all cost relevance factor. The final position (E, C) in the eco-efficiency diagram is then derived from the preliminary position (E0, C0), and the ETCR through the following equations: E = 1 + (E0-1) * ETCR C = 1 + (C0-1) / ETCR

Appendix IV

i
Inventory profile for the glycol waste water treatment service The inventory profile (table 1) gives a complete account on the environmental interventions (flows passing between the technical and ecological sphere) that can be allocated to the distillation system when it is operating at a reflux of 1500 kg/h, and when environmental loads from production of machinery, construction work and employee travels related to the distillation system has been cut off (since their contribution to the total environmental load is marginal). Some of the flows related to electricity consumption are not considered in the eco-efficiency analysis since the contribution of these to the total environmental load is marginal. The functional unit (F.U.) is 107 763 600 kg wastewater and year. Table 1. Complete Inventory Profile of the distillation system Inventory analysis results. Results are given per functional unit = 107763600 kg wastewater and year (totals may not agree because of rounding) Reflux= 1000 kg/h 1500 kg/h 2000 kg/h 2500 kg/h 3000 kg/h Unit Gross Energy Consumption of Glycol Plant (energy in energy carriers delivered to, and consumed by, the distillation system) Steam 3483895 3531577 3579260 3626942 3674624 MJ Electricity 423411 426980 430548 434116 437685 MJ Totals 3907307 3958557 4009808 4061058 4112308 MJ Gross Primary Energy Consumption (energy delivered and energy required for fuel production and delivery) Natural Gas 1461475 1481476 1501477 1521477 1541478 MJ Crude Oil 1557438 1578749 1600060 1621371 1642682 MJ Coal 5380 5446 5513 5579 5645 MJ Hydro Energy 350927 354532 358138 361743 365349 MJ Nuclear Energy 1028969 1039391 1049812 1060234 1070655 MJ Biomass 5202 5269 5336 5403 5469 MJ Wood 4,7 4,7 4,8 4,8 4,9 MJ Wind 346 350 354 358 362 MJ Totals 4409742 4465218 4520694 4576170 4631646 MJ Resource Use (non renewable primary energy expressed as mass included) Natural Gas 27009 27379 27749 28118 28488 kg Crude Oil 37082 37589 38097 38604 39111 kg Coal 198 200 203 205 208 kg Uranium ore 123 124 125 126 128 kg Uranium in ore (0,07% Swedish average) 0,86 0,87 0,88 0,89 0,89 kg

ii
Biomass 260 263 267 270 273 kg Wood 0,23 0,24 0,24 0,24 0,24 kg Bauxite 4 4 4 4 4 kg Aluminium (~40% average in Bauxite) 1,6 1,6 1,6 1,6 1,7 kg Sodium Chloride 1,8 1,8 1,8 1,9 1,9 kg Copper ore 210 212 214 216 218 kg Copper in ore (5%) 10,5 10,6 10,7 10,8 10,9 kg Iron ore 13,8 13,9 14,1 14,3 14,5 kg Iron in ore (~70% in Magnetite and Hematite) 9,6 9,8 9,9 10,0 10,1 kg Lead ore 2,19 2,21 2,23 2,25 2,28 kg Lead in ore (~87% in Galena, lead sulphide - PbS) 1,9 1,9 1,9 2,0 2,0 kg Area 61 62 63 63 64 m2 Water 0,1 0,1 0,1 0,1 0,1 m3 Emissions to Air CO2 252078 255527 258976 262425 265874 kg NOx 386 392 397 402 408 kg CO 143 145 147 149 151 kg CH4 28 28 28 29 29 kg HC 168 170 172 175 177 kg HCl 0,03 0,03 0,03 0,03 0,04 kg Particles 6 6 6 6 6 kg SO2 59 60 61 62 63 kg N2O 0,009 0,009 0,009 0,009 0,009 kg Emissions to Water Glycol (MEG) 891 258 151 106 82 kg Glycol as COD 1150 332 194 137 106 kg O2 Glycol as TOC 345 100 58 41 32 kg C COD (excluding glycol) 1,5 1,6 1,6 1,6 1,6 kg O2 Ntot 33 33 33 33 34 kg Suspended solids 0,56 0,57 0,58 0,59 0,59 kg Phenol 0,019 0,019 0,019 0,019 0,020 kg Oil 0,68 0,69 0,70 0,71 0,72 kg Metals 0,046 0,046 0,047 0,048 0,048 kg

iii
HC 0,106 0,107 0,108 0,110 0,111 kg Dissolved organics 0,19 0,19 0,20 0,20 0,20 kg Dissolved Solids 1,53 1,55 1,57 1,60 1,62 kg Acid as H+ 0,31 0,32 0,32 0,33 0,33 kg Waste Highly radioactive waste 4,5 4,5 4,6 4,6 4,7 kg Medium radioactive waste 0,001 0,001 0,001 0,001 0,001 m3 Low radioactive waste 0,003 0,003 0,003 0,003 0,003 kg Mixed industrial waste 2,2 2,2 2,3 2,3 2,3 kg Mineral waste 24 25 25 25 26 kg Slags and ash 5 5 5 5 5 kg Construction waste 6,7 6,8 6,9 7,0 7,0 kg Chemical waste 2,6 2,7 2,7 2,7 2,8 kg Other Waste 8892 8983 9074 9165 9256 kg