methods for evaluating shear strength … · methods for evaluating shear strength of plastic...
TRANSCRIPT
UNITED STATES DEPARTMENT OF AGRICULTURE . FOREST SERVICE . FOREST PRODUCTS LABORATORY . MADISON WIS
METHODS FOR EVALUATING SHEAR STRENGTH OF PLASTIC LAMINATES REINFORCED WITH UNWOVEN GLASS FIBERS
MAY 1964
FPL-033
This Report Is One of a Series Issued in Cooperation with the
PLASTICS FOR FLIGHT VEHICLES of the Departments of the AIR FORCE, NAVY, AND COMMERCE
MIL-HDBK-17 WORKING GROUP ON
The Forest Service of the U. S. Department of Agriculture is dedicated to the principle of multiple use management of the Nation's forest resources for sustained yields of wood. water, forage, wildlife, and recreation. Through forestry research, cooperation with the States and private forest owners, and management of the National Forests and National Grass- lands, it strives--as directed by Congress--to provide increasingly greater service to a growing Nation.
METHODS FOR EVALUATING SHEAR STRENGTH
OF PLASTIC LAMINATES REINFORCED 1
WITH UNWOVEN GLASS FIBERS
By
KARL ROMSTAD, Engineer
Forest Products Laboratory, Forest Service U.S. Department of Agriculture
2
----
Abstract
Several methods were employed to evaluate the shear strength of plastic laminate panels 1/8 inch in thickness and reinforced with unwoven glass fibers. Shear values at 0° to the fibers obtained by the Johnson shear and block-shear methods showed relatively good agreement. Shear strength values at 0" to the fibers obtained from axial tests on notched specimens were found to depend upon the shear length between notches and the type of lateral restraint. Values obtained from short-span beam tests were affected by combined failures, depending on the shear span-depth ratio and the method of loading.
Shear strength values at 90° to the fibers by the block-shear method were about two-thirds of values obtained by the Johnson shear method and by compression tests of double-notched specimens with 1/8 inch between notches.
Because of the stress concentrations that develop in each of these test methods, it is felt that none of the methods discussed here give shear strength values as high as would occur in pure shear.
1 This Note is another progress report in the series (MIL-HDBK-17, Item 60-1) prepared and
distributed by the Forest Products Laboratory under Navy Bureau of Naval Weapons Order 19-64-8004 WEPS and U.S. Air Force Contract 33(657)63-358. Results here reported are preliminary and may be revised as additional data become available.
2 Maintained at Madison, Wis., in cooperation with the University of Wisconsin.
FPL-033
Introduction
For over 20 years, shear properties of reinforcedplastics have been evaluated with test methods similar to those described in ASTM Standards ( 2 ) ARTC Methods ( 1 ), and Federal Test Method Standard No. 406 ( 10 ). To date, however, no single method has obtained wide acceptance. Investigators continue to revise these methods and seek new methods of obtaining the principal shear properties for the improvement of quality control and design data. N. Fried ( 8 ) lists seven methods for filament-wound plastics, and M. J. Rhude wrote a comprehensive thesis on many of the shear tests used on wood. In spite of all the discussion, shear properties coupled with the correct associated shear planes need to be clarified so that uniform evaluation methods, resulting in comparable data, are obtained.
3
4
The true shearing strength along any given plane is only obtained by develop- ing shear stresses in the plane of rupturewithout the addition of tensile or com- pressive stresses. When the shear stress on an element in this plane is accom- panied by a direct stress, the fracture may be a result of the combined stresses and give an apparent shear strength value lower than the true shearing strength. However, the difficulty of obtaining pure shear during test is widely recognized, and most of the commonly used shear tests are somewhat affected by combined stress action.
Because of the similar fibrous structures of orthotropic laminates, wood, and plywood, the Forest Products Laboratory has in the past used both the Johnson shear ( 4 ) and the block-shear ( 17 , 18 ) methods to evaluate the shear strength of plastic laminates. These methods have yielded relatively reproducible data when care was taken to insure uniform testing procedures and when the plane of failure was clearly defined.
4 Several variations of block-shear test methods are described by Rhude, who
illustrates the extent to which investigations have been made to determine suit- able methods of obtaining shear strengths of orthotropic materials similar to wood. C. B. Norris ( 13 ) showed that excellent agreement betweenvalues was ob- tained by the block-shear method and by the panel-shear method.
A theoretical method of obtaining shear strength at any angle to the warp is given in Forest Products Laboratory Report 1803 ( 14 ). The report compared the
3 Underlined numbers in parentheses refer to Literature Cited at the end of this report.
4 Rhude, M. J. A survey of methods for making shear tests of wood. M.S. thesis in Civil Engi-
neering, University of Wisconsin. 1950.
FPL-033 -2-
theoretical values with some experimental values found with the Johnson shear method for some glass-fabric laminates. Very little agreement was obtained between the calculated theoretical and experimental data obtained at the various angles.
K. H. Boller of the Forest Products Laboratory, in work for the Navy, investigated the effect of the gap length betweenthe rigidily clamped support and center sections of the Johnson shear tool on a glass-fabric-reinforced laminate. He found a decrease in computed shear strength with increase in the gap length. At short gap lengths, failures were forced into a plane perpendicular to the lami- nations; as the gap length was increased, failure occurred more nearly at 45°, with failure appearing to occur between the adjacent laminations.
Recent work in the reinforced plastics industry has made wide use of the axial test of a notched shear specimen presented in ARTC No. 11 ( 1 ) as a measure of interlaminar and secondary bond strength of flat laminate panels. Two methods are presented in ARTC No. 11, one uses a clamp to provide lateral support and reduce bending stresses and the other uses none. Values obtained on clamped specimens are, of course, higher than for unclamped specimens that bend freely at the notches thus allowing significant bending and peeling stresses in addition to shear. Clamping reduces the strains caused by the moment and tearing forces, and higher average shear stresses are obtained.
With the increase in the production and use of filament-wound plastics, the short-span beam test has been a convenient method of determining interlaminar shear strength. However, there are very few data in the literature that define the span and other variables present in the beam test toward standardization of this test so that uniform results are assured.
One of the difficulties presented by both the beam test and the axial tension test is that neither has been adapted to provide data on shear strength at 90° to the fiber length where tensile strength is low. There is evidence ( 12 ) to indicate that this plane of shear may be weaker than the interlaminar plane of shear found when the shearing force is parallel to the fibers. One of the advantages of the Johnson “punch-type” shear method ( 1 , 2 , 10 ), and the block-shear method ( 13 , 17 , 18 ) is that the specimen may be so constructed and loaded that shear strength values at 90" to the fiber length may be obtained.
There are some data available for filament-wound plastics, as the ASTM-Navy Symposium ( 8 ) indicated. However, very few data are available on flat laminates of unwoven glass filaments. It is the purpose of this investigation to evaluate the
FPL-033 -3-
axial test presented by ARTC No. 11 and the short-span beam test used on filament-wound specimens; to try to correlate values obtained by these methods with the shear strengthvalues obtained by the Johnson “punch-type” shear method and the block-shear method; and to recommend or develop procedures that closely indicate the true shear strength of the material under different tempera- ture conditions andproduce consistent and reliable agreement between methods.
Variables to be studied in axial loading include: (a) (b) Clamped and unclamped specimens (c) (d)
Various lengths of shear area in a 1-inch-wide specimen
Fiber length oriented at 90° to specimen length Different amounts of unrestrained length between grips
In flexural loading determine the effect of: (a)
(c)
Varying spans under midpoint loading (b) Varying spans under two-point loading
Various loading conditions on a 3-inch span
Many of the present methods used in evaluating shear properties of plastic laminates do not specifically designate the direction of the shear force or the shear plane in which rupture occurs with respect to the principal planes of the laminate. In orthotropic materials such as glass-reinforced plastic laminates there are several shear planes and each shear property determined from a me- chanical test should be associated with its respective plane. Since the shear prop- erties may be different in any plane, the investigator should specifically desig- nate the plane he is evaluating.
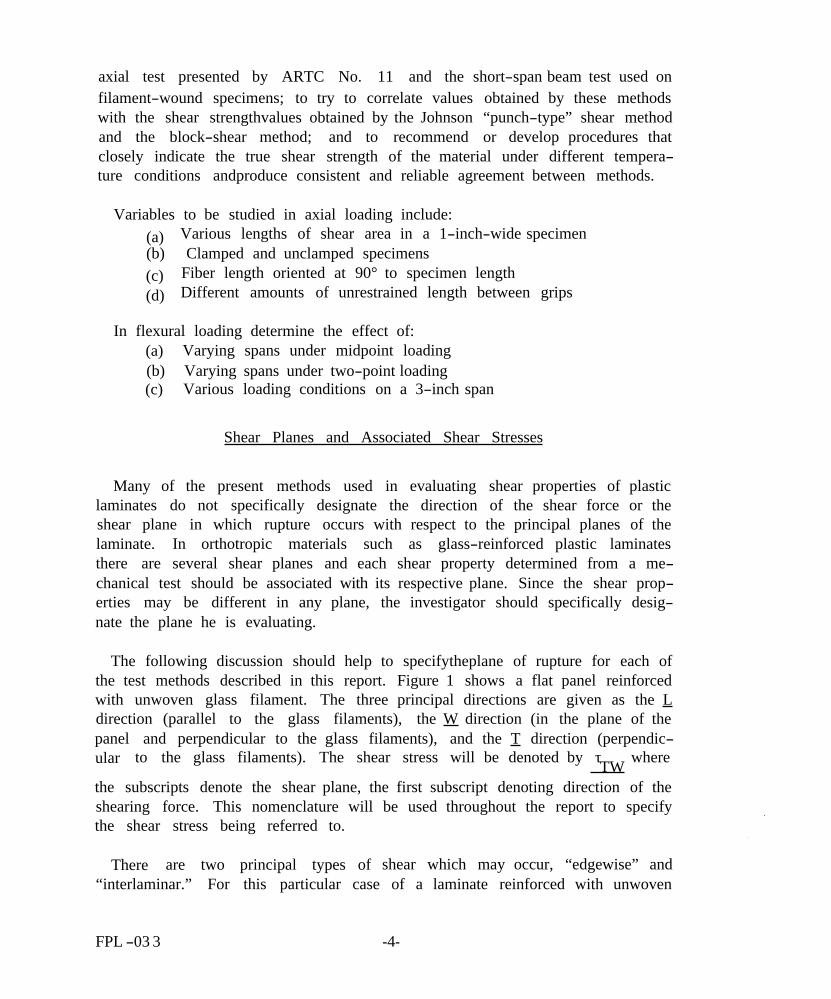
The following discussion should help to specifytheplane of rupture for each of the test methods described in this report. Figure 1 shows a flat panel reinforced with unwoven glass filament. The three principal directions are given as the L direction (parallel to the glass filaments), the W direction (in the plane of the panel and perpendicular to the glass filaments), and the T direction (perpendic- ular to the glass filaments). The shear stress will be denoted by τ where
the subscripts denote the shear plane, the first subscript denoting direction of the shearing force. This nomenclature will be used throughout the report to specify the shear stress being referred to.
TW
There are two principal types of shear which may occur, “edgewise” and “interlaminar.” For this particular case of a laminate reinforced with unwoven
FPL -0 3 3 -4-
Shear Planes and Associated Shear Stresses
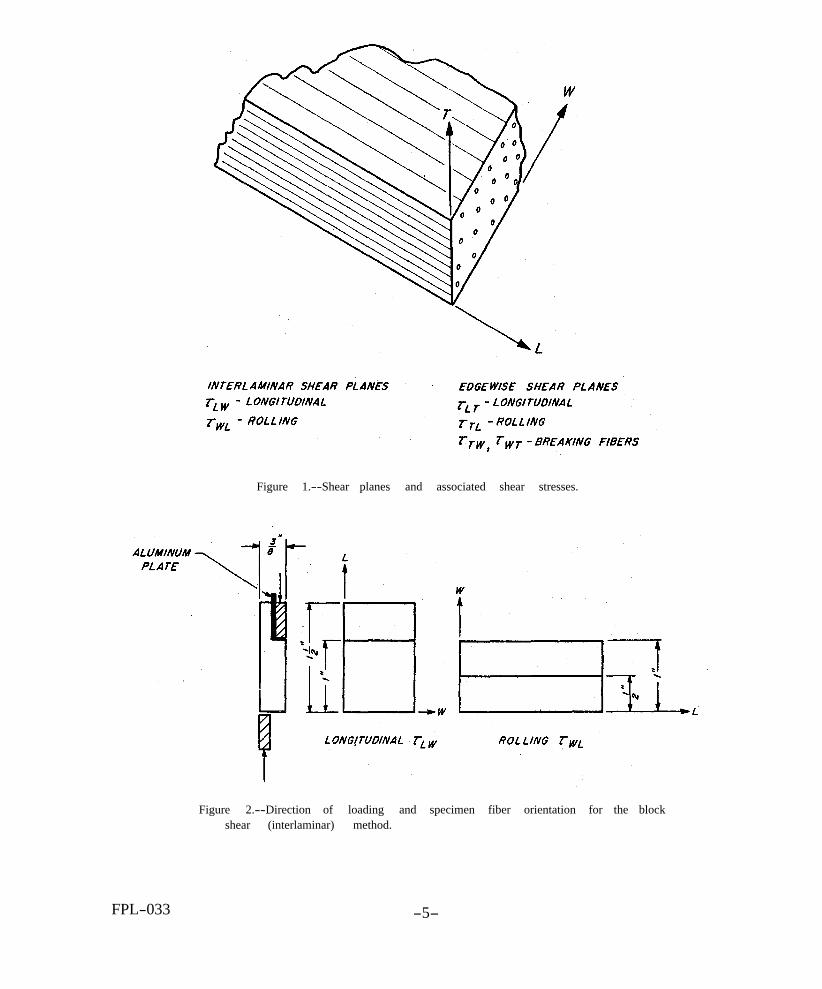
Figure 1.--Shear planes and associated shear stresses.
Figure 2.--Direction of loading and specimen fiber orientation for the block shear (interlaminar) method.
FPL-033 -5-
glass fibers, edgewise shear will be referred to when the plane of failure is perpendicular to the plane of the panel. Interlaminar shear refers to failure when it occurs within the plane of the panel. For a panel with unwoven glass fibers, three types of shearing action may occur. “Longitudinal” shear refers to the sliding of the fibers parallel to one another through the resin matrix and occurs as τ (interlaminar), and τ (edgewise). “Rolling” shear occurs when there
is the tendency to roll fibers over one another in the plane of shear and is desig- nated as τ (edgewise), “Breaking fibers” shear re- TL fers to a shear plane in which the fibers are cut perpendicular to their length be- fore failure will occur and appear as τ
ET LW
(interlaminar), and τ WL
(edgewise), and τ (edgewise). TW WT
Description of Material
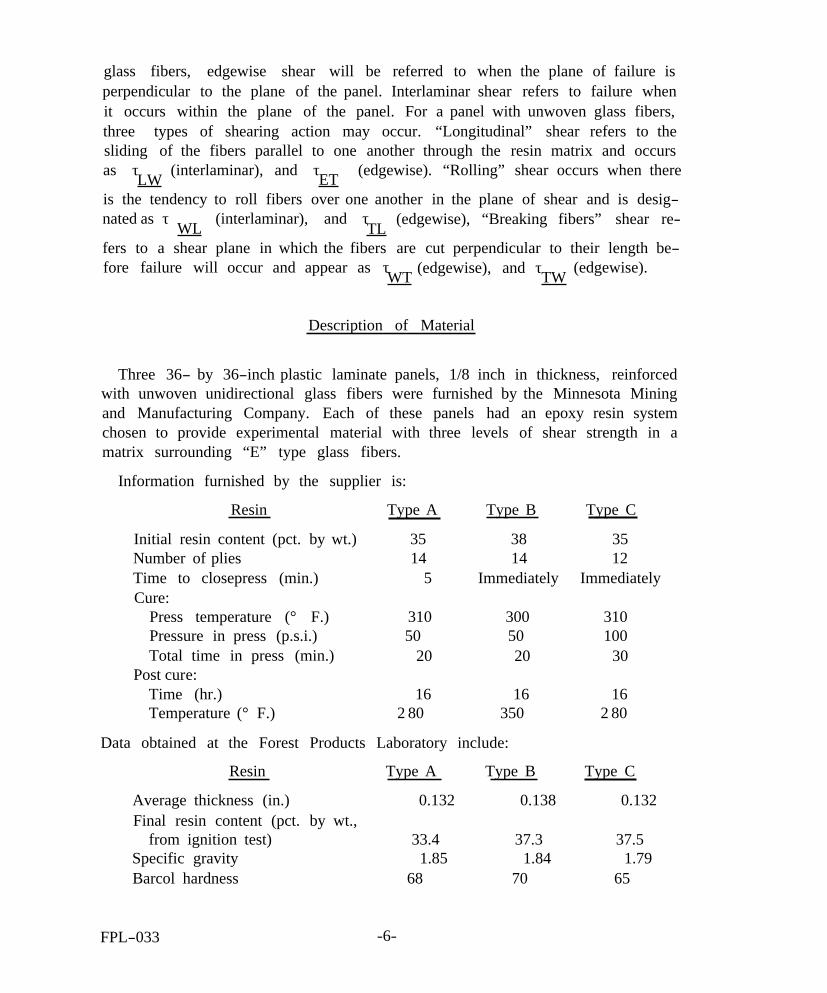
Three 36- by 36-inch plastic laminate panels, 1/8 inch in thickness, reinforced with unwoven unidirectional glass fibers were furnished by the Minnesota Mining and Manufacturing Company. Each of these panels had an epoxy resin system chosen to provide experimental material with three levels of shear strength in a matrix surrounding “E” type glass fibers.
Information furnished by the supplier is:
Resin Type A Type B Type C
Initial resin content (pct. by wt.) 35 38 35 Number of plies 14 14 12 Time to closepress (min.) 5 Immediately Immediately Cure:
Press temperature (° F.) 310 300 310
Total time in press (min.) 20 20 30
Time (hr.) 16 16 16 Temperature (° F.) 2 80 350 2 80
Pressure in press (p.s.i.) 50 50 100
Post cure:
Data obtained at the Forest Products Laboratory include:
Resin Type A Type B Type C
Average thickness (in.) 0.132 0.138 0.132 Final resin content (pct. by wt.,
Specific gravity 1.85 1.84 1.79 Barcol hardness 68 70 65
from ignition test) 33.4 37.3 37.5
FPL-033 -6-

Test specimens were rough cut from each of the panels using a table saw with a l/8-inch-thick carborundum wheel. Five replicate specimens were prepared for each evaluation. The specimens were stored for at least 2 weeks at 74° F. and 50 percent relative humidity. Specimens were removed from storage in groups of five and tested immediately at room temperature conditions.
Block Shear Method
The interlaminar shear specimens used in this method of test were made of three thicknesses of laminate glued together, as shown in figure 2. The speci- mens are of the same general type for determining the shear strength of glue joints' in blocks of wood, as shown in figure 3. The bearing edges of the speci- mens were carefully ground to insure flat and parallel loading surfaces. A thin piece of aluminum (0.01 inch) was placed vertically between the loading head and the specimen (fig. 2) to provide an offset from the notched corner to insure that the loading bar touched the specimen outside the small fillet at the ground notch and then was bearing on a flat loading surface. During the test the movable head of a mechanical testing machine was driven at about 0.01 inch per minute. Each of the three materials was tested in longitudinal shear at 0° to the fibers with failure in the LW plane, and types A and C were also tested in rolling shear at 90" to the fibers with failure occurring in the WL plane.
Johnson Shear Method
The apparatus and test methods for the Johnson shear tests are similar to those described in Method 1041 of Federal Test Standard No. 406 ( 10 ) and Method V of ARTC No. 11 ( 1 ).
A sketch of each specimen configuration is shown in figure 4. To obtain edge- wise longitudinal shear values ( τ ), four 3-inch-long strips, 1/4 inch wide,
were cut from the 1/8-inch panels and laid side by side in the shear tool to form a specimen approximately 1/2 inch in effective width and 1/4 inch thick. Edge- wise rolling shear values ( τ ) were obtained from specimens 1/2 inch wide and
3 inches long cut perpendicular to the fiber length. Edgewise breaking fibers shear was obtained from two specimens 1/2 inch wide (laid side by side) and
3 inches long cut parallel to the fiber length.
LT
TL
FPL-033 -7-
Testing
( τ ) WT
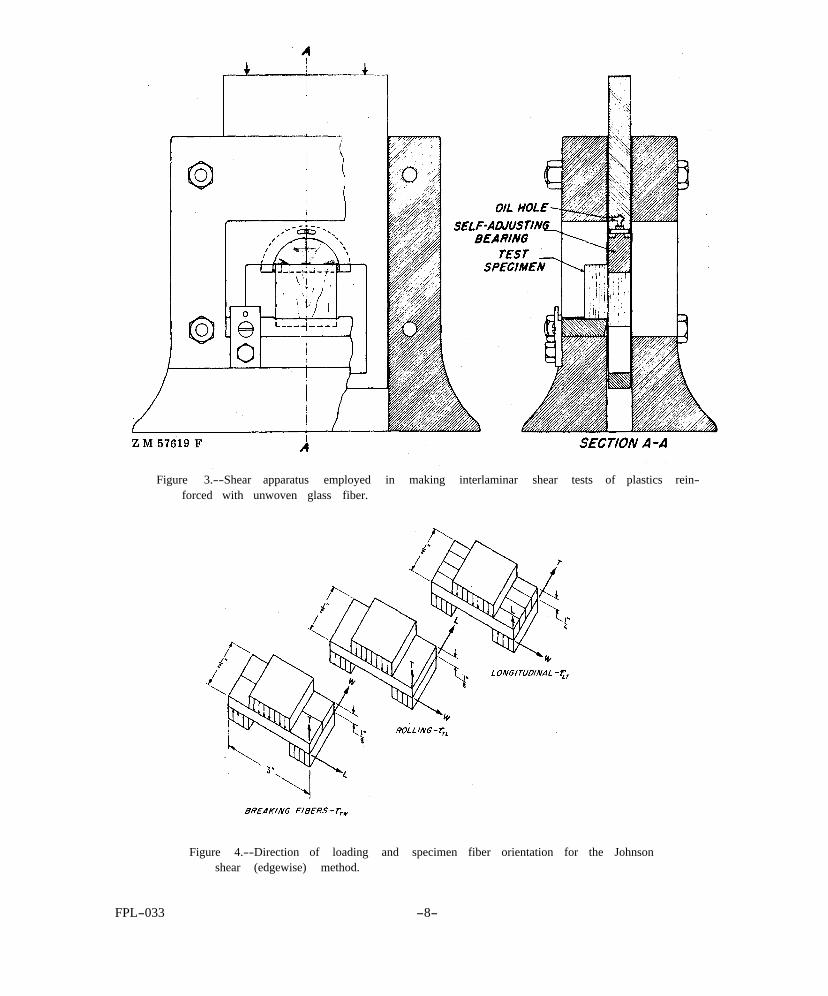
Figure 3.--Shear apparatus employed in making interlaminar shear tests of plastics rein- forced with unwoven glass fiber.
Figure 4.--Direction of loading and specimen fiber orientation for the Johnson shear (edgewise) method.
FPL-033 -8-
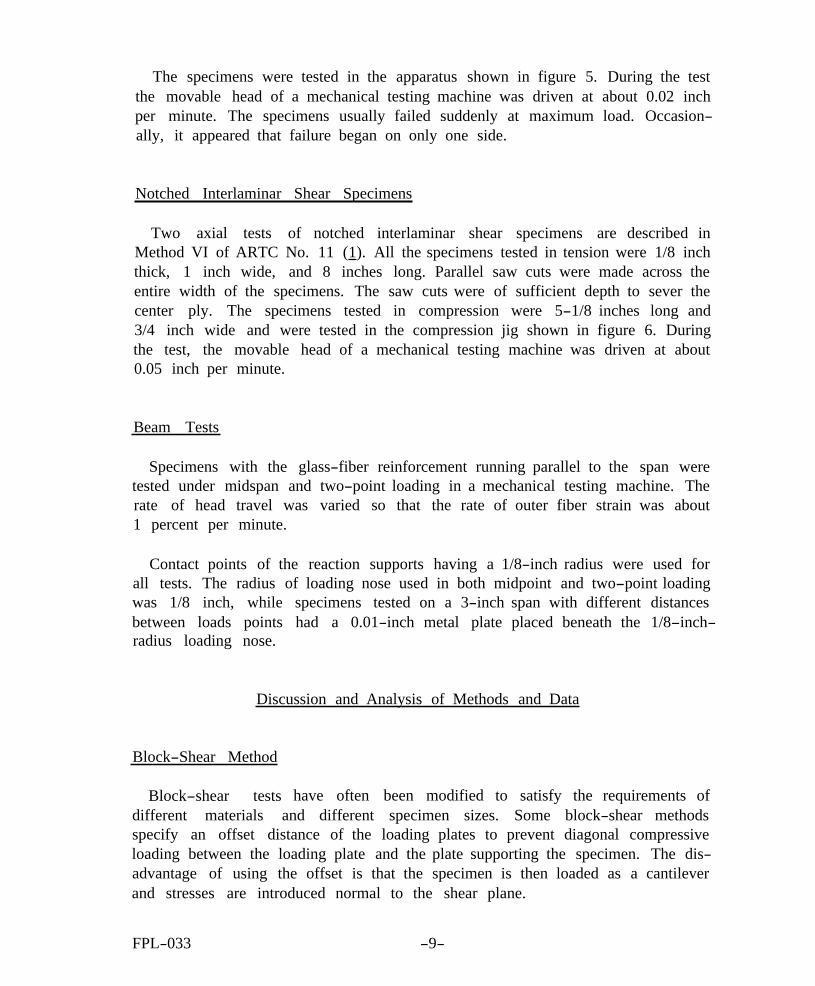
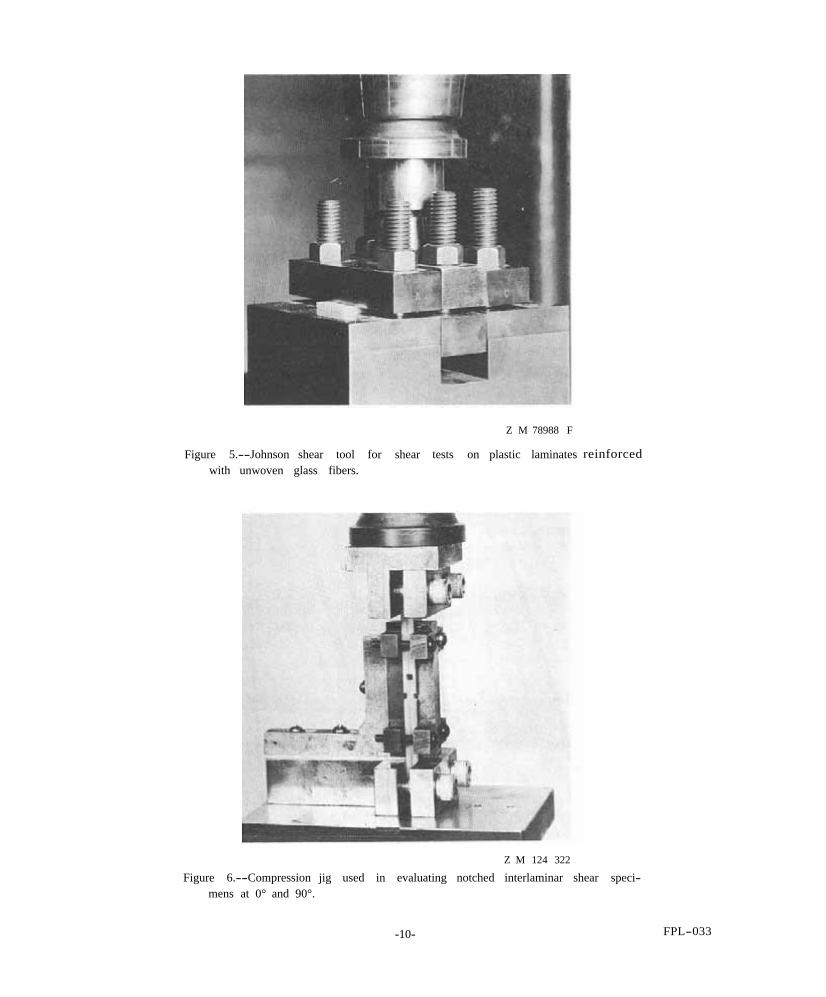
The specimens were tested in the apparatus shown in figure 5. During the test the movable head of a mechanical testing machine was driven at about 0.02 inch per minute. The specimens usually failed suddenly at maximum load. Occasion- ally, it appeared that failure began on only one side.
Notched Interlaminar Shear Specimens
Two axial tests of notched interlaminar shear specimens are described in Method VI of ARTC No. 11 ( 1 ). All the specimens tested in tension were 1/8 inch thick, 1 inch wide, and 8 inches long. Parallel saw cuts were made across the entire width of the specimens. The saw cuts were of sufficient depth to sever the center ply. The specimens tested in compression were 5-1/8 inches long and 3/4 inch wide and were tested in the compression jig shown in figure 6. During the test, the movable head of a mechanical testing machine was driven at about 0.05 inch per minute.
Beam Tests
Specimens with the glass-fiber reinforcement running parallel to the span were tested under midspan and two-point loading in a mechanical testing machine. The rate of head travel was varied so that the rate of outer fiber strain was about 1 percent per minute.
Contact points of the reaction supports having a 1/8-inch radius were used for all tests. The radius of loading nose used in both midpoint and two-point loading was 1/8 inch, while specimens tested on a 3-inch span with different distances between loads points had a 0.01-inch metal plate placed beneath the 1/8-inch- radius loading nose.
Discussion and Analysis of Methods and Data
Block-Shear Method
Block-shear tests have often been modified to satisfy the requirements of different materials and different specimen sizes. Some block-shear methods specify an offset distance of the loading plates to prevent diagonal compressive loading between the loading plate and the plate supporting the specimen. The dis- advantage of using the offset is that the specimen is then loaded as a cantilever and stresses are introduced normal to the shear plane.
FPL-033 -9-
Z M 78988 F
Figure 5.--Johnson shear tool for shear tests on plastic laminates with unwoven glass fibers.
reinforced
Z M 124 322
Figure 6.--Compression jig used in evaluating notched interlaminar shear speci- mens at 0° and 90°.
-10- FPL-033
Because the panels evaluated in this study were only 1/8 inch thick, it was necessary to glue three pieces together and place a thin aluminum plate verti- cally between the loading head and the specimen. As the material is weak in ten- sion perpendicular to the fibers, it was desirable to keep this offset distance at a minimum. It is also known that high stress concentrations occur at the notch in the test specimen.
Specimens can be so prepared and cut that both longitudinal and rolling interlaminar shear values can be obtained. One of the principal disadvantages of the method is the bulky apparatus required for such small specimens and the re- sulting difficulty of testing at elevated temperatures.
In general, failures occurred between adjacent laminations in the desired plane. Some of the specimens tested at 90° to the fibers appeared to fail at an angle to the laminations, but strength values from these specimens were about the same as those recorded for specimens in which failure was in the desired plane. The results of the block-shear tests are shown in table 1. Results also indicate that for A and C laminates the strength values of rolling shear ( τ
in the interlaminar plane are about 70 percent of values of longitudinal shear WL )
) in the same plane. ( τ LW
Johnson Shear Method
Although it is impossible to produce a transverse shear stress unaccompanied by tension or compression, it is of interest to obtain knowledge of transverse shear strengths because of the occurrence of shear stresses in mem- bers subjected to bending and as a comparison with shear strengths obtained by other methods of test.
The Johnson shear method is essentially a very short-span beam test employ- ing clamped ends and a clamped central portion to eliminate deflection and re- sulting tensile and compressive stresses. Thin gaps exist between clamped por- tions, and transverse shear failures are forced into these gaps.
K. H. Boller, in Forest Products Laboratory work for the Navy, investigated the effect of the length of this gap by varying the gap length from 0.003 inch to 1/8 inch on a glass-fabric-reinforced laminate. He calculated shear strength values as high as 20,000 p.s.i. (pounds persquare inch) at short gap lengths, and then the values dropped to about 7,000 p.s.i. when the gap length was 1/8 inch. In his investigation the specimens were tested perpendicular to the plane of the laminations with the warp running parallel to the length of the specimens. This
-11- FPL-033
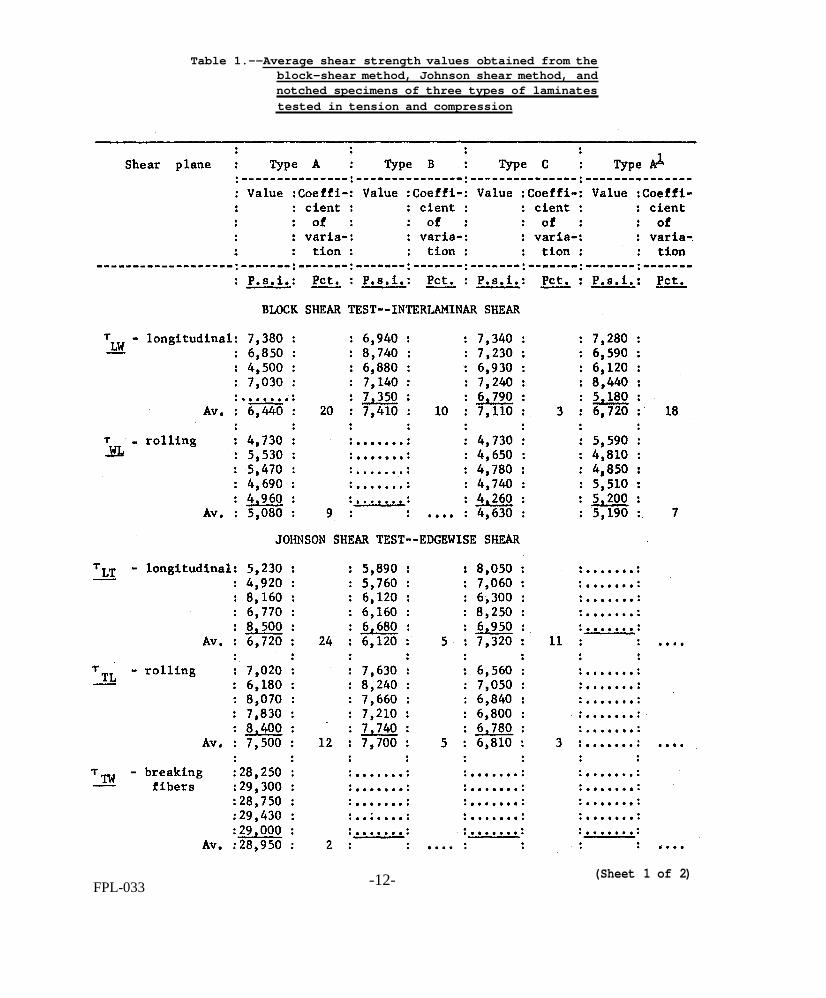
Table 1.--Average shear strength values obtained from the block-shear method, Johnson shear method, and notched specimens of three types of laminates tested in tension and compression
(Sheet 1 of 2) -12- FPL-033
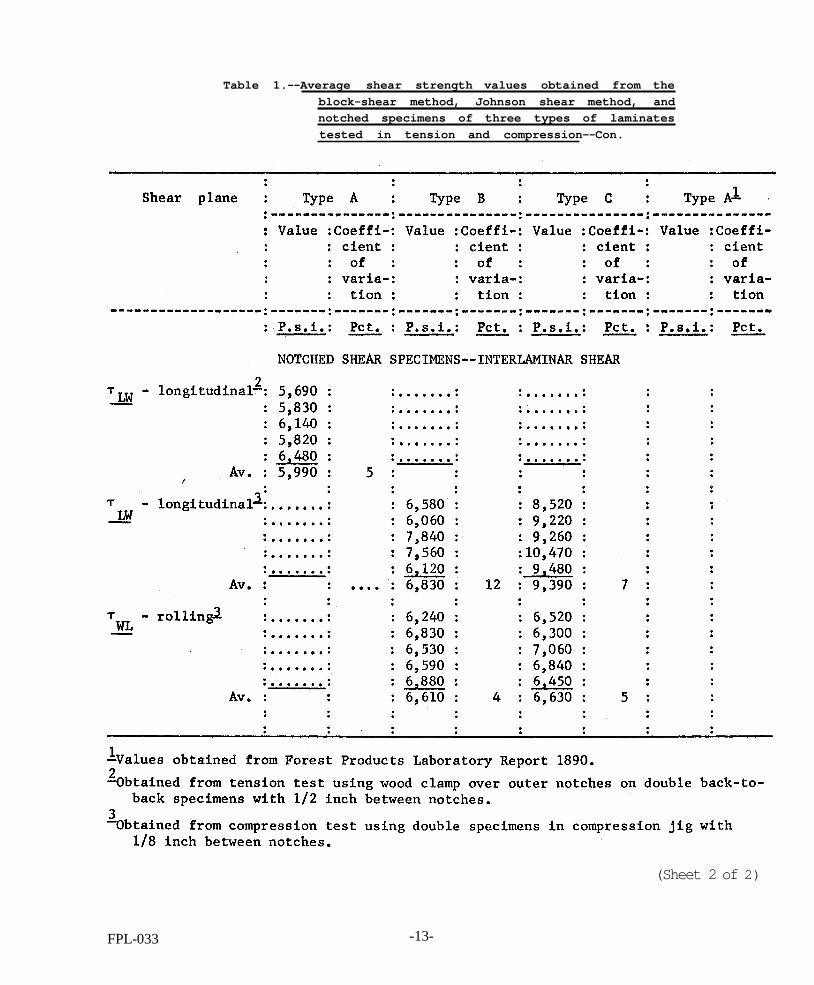
Table 1.--Average shear strength values obtained from the block-shear method, Johnson shear method, and notched specimens of three types of laminates tested in tension and compression--Con.
(Sheet 2 of 2)
FPL-033 -13-
type of loading condition results in transverse shear failures which must cut the glass fibers prior to failure; this direction of shear is much stronger than inter- laminar shear where failure occurs in the plane of the laminations. When the gap length was 1/8 inch, more bending moment was induced and the failures appeared to be in interlaminar shear at about 45° the laminations of the glass fabric,
The above discussion indicates that stress distributions and calculated shear stresses found from the Johnson shear tool vary depending on the gap length and the fiber orientation. When fibers of fabric bridge the gap between the clamped portions, the calculated values of shear strength will always depend on the gap length, It is possible that the Johnson shear method can be much more accurately applied to plastic laminates reinforced with unwoven unidirectional glass fibers. Here the specimens may be so cut and placed in the tool that failures occur in the desired plane with no fibers bridging the gaps. This method can be used to obtain edgewise longitudinal and rolling shear values.
Table 1 gives the values of shear strength found using the Johnson shear tool. Values of edgewise longitudinal shear strength ( τ ) determined by the Johnson
shear test were comparable to values of interlaminar longitudinal shear strength ) determined by the block shear test for Type A and Type C laminates.
Values of τ or Type B laminate were about 85 percent of τ Values of LT edgewise rolling shear ( τ ) found from the Johnson shear tool were about
LT
( τ LW
LW
TL 50 percent higher than interlaminar rolling shear ( τ ) values obtained from the WL block-shear method. Values of edgewise breaking-fibers shear ( τ ) were about
TW four times larger than other shear values from the Johnson shear test.
Notched Interlaminar Shear Specimens
As an approximation, it may be helpful to analyze the specimen test without lateral support as a lap joint tested in tension. A qualitative investigation of the stress distribution in a lap joint using properties approximating those of the resin was used to find both shear stress and normal stress distribution across the lap. Figures 7 A, 7 B, and 7 C represent the shear specimen, the lap joint, and the loading on the lap, and illustrate that if the cross-hatched section of the shear specimen is considered essentially ineffective in carrying the load, then the specimen would be analogous to a lap joint.
FPL-033 -14-
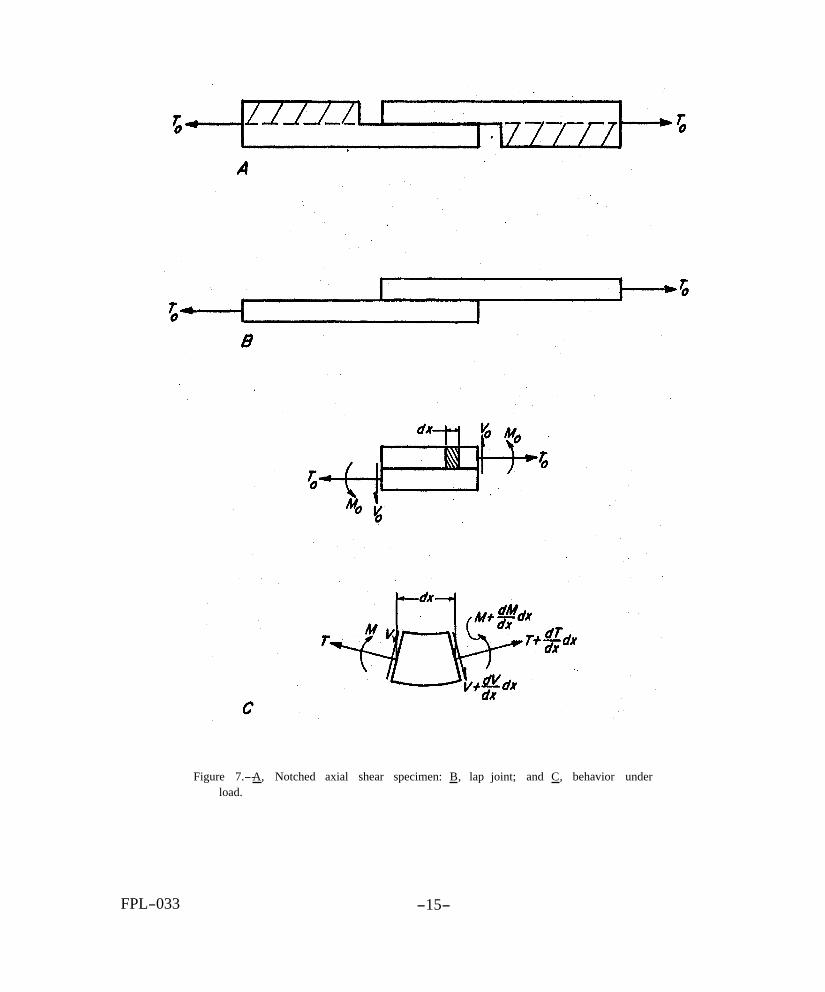
Figure 7.-- A , Notched axial shear specimen: B , lap joint; and C , behavior under load.
FPL-033 -15-
Unrestrained Length Between Grips-- τ .--Because no data could be found
to verify using a specific distance between grips, it was decided to experiment with four different lengths. Lengths of 2, 4, 6, and 10 inches were tried, and the results are presented in table 2. This resulted in distances between the spherical seats of 33, 35, 37, and41 inches. While at first there appeared to be an increase of about 30 percent in average shear strength stress with increase in distance from 2 to 6 inches between grips, it was not felt to be a significant factor since the longest specimens tested (10 inches between grips) had an average strength lower than the other specimens. In all the subsequent tests, a distance between grips of 6 inches was maintained.
LW
Various Lengths of Shear Area-- τ .--Goland and Reissner ( 11 ) present LW formulas for the shear stress and normal stress distribution across the adhe- sive of a lap joint loaded in tension. They also present, an equation relating the maximum shear stress to the average shear stress across the lap. It can be shown that the limit of this ratio approaches 1 as the length of overlap approaches 0. Figure 8 shows curves of theoretical shear stress distribution across one-half the lap for various lengths of overlaps for assumed adhesive mechanical proper- ties similar to those which may exist in a notched tension shear specimen of epoxy type A laminate. These curves demonstratethat higher stresses than aver- age occur at the ends of moderate-lengthlaps. Results presented in Forest Prod- ucts Laboratory Report 1850 ( 6 ) on the effect of length of overlap show that aver- age shear stresses in a lap at failure are higher at short overlaps even when the specimen is free to bend.
Figure 9 shows the theoretical normal stress distribution across one-half the lap for a given loadusing an overlap length of 1/2 inch. The predicted normal stress distribution shows very low stresses over most of the lap but rising to a sharp maximum at the ends. This distribution occurs only in the elastic range of the adhesive and significantly different stress distributions may occur when the adhesive is in the plastic range. However, if these formulas could be used to in- dicate possible stress distribution over the shear area of a, notched interlaminar shear specimen, it can be reasoned that normal stresses certainly affect lap be- havior when loaded in tension, and shear stress distribution is much more uni- form the shorter the shear length.
Specimens were tested with four different shear lengths, 1/8, 1/4, 1/2, and 1 inch. There is a corresponding increase in computed average shear stress with decrease in shear length. Table 2 presents the results of these tests, while fig- ure 10 gives these results and shear strength values obtained by the other shear
FPL-033 -16-
Table 2.--Effect of changing shear length between notches and length of specimens between grips on computed shear strengths of notched axial shear specimens in tension made of type A laminate
Figure 8.--Shear stress distribution over one-half the shear length using lap joint theory developed by Goland and Reissner on different shear lengths.
FPL-033 -17-
Figure 9.--Theoretical normal stress distribution over one-half the shear length using lap joint theory developed by Goland and Reissner on a 1/2-inch shear length.
FPL-033 -18-
Figure 10.--Computed average shear stress plotted against shear length between notches and compared with values received from other shear tests on epoxy type A laminates.
FPL-033 -19-
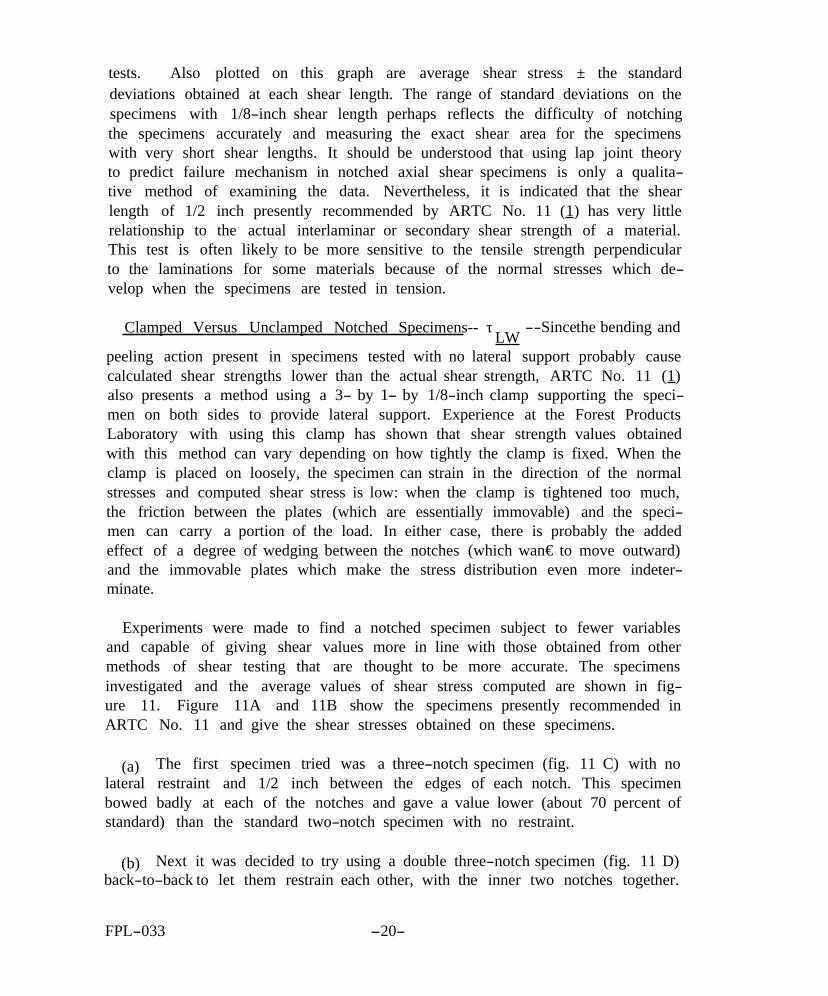
tests. Also plotted on this graph are average shear stress ± the standard deviations obtained at each shear length. The range of standard deviations on the specimens with 1/8-inch shear length perhaps reflects the difficulty of notching the specimens accurately and measuring the exact shear area for the specimens with very short shear lengths. It should be understood that using lap joint theory to predict failure mechanism in notched axial shear specimens is only a qualita- tive method of examining the data. Nevertheless, it is indicated that the shear length of 1/2 inch presently recommended by ARTC No. 11 ( 1 ) has very little relationship to the actual interlaminar or secondary shear strength of a material. This test is often likely to be more sensitive to the tensile strength perpendicular to the laminations for some materials because of the normal stresses which de- velop when the specimens are tested in tension.
Clamped Versus Unclamped Notched Specimens-- τ --Since the bending and
peeling action present in specimens tested with no lateral support probably cause calculated shear strengths lower than the actual shear strength, ARTC No. 11 ( 1 ) also presents a method using a 3- by 1- by 1/8-inch clamp supporting the speci- men on both sides to provide lateral support. Experience at the Forest Products Laboratory with using this clamp has shown that shear strength values obtained with this method can vary depending on how tightly the clamp is fixed. When the clamp is placed on loosely, the specimen can strain in the direction of the normal stresses and computed shear stress is low: when the clamp is tightened too much, the friction between the plates (which are essentially immovable) and the speci- men can carry a portion of the load. In either case, there is probably the added effect of a degree of wedging between the notches (which wan€ to move outward) and the immovable plates which make the stress distribution even more indeter- minate.
LW
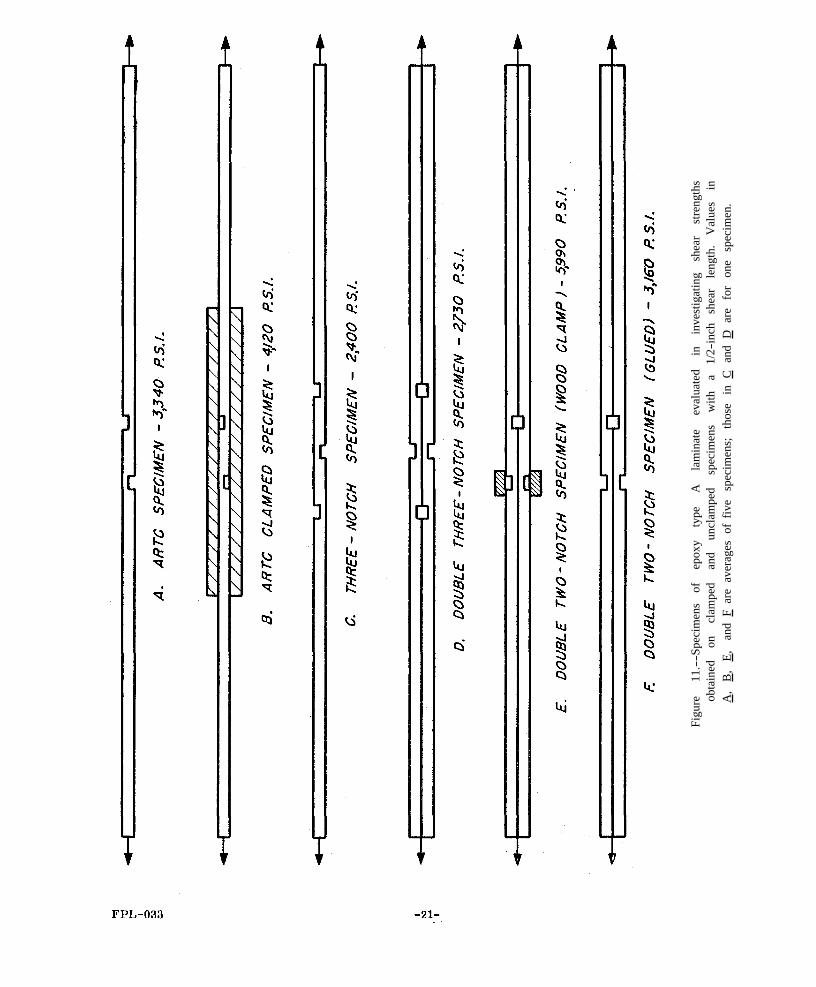
Experiments were made to find a notched specimen subject to fewer variables and capable of giving shear values more in line with those obtained from other methods of shear testing that are thought to be more accurate. The specimens investigated and the average values of shear stress computed are shown in fig- ure 11. Figure 11A and 11B show the specimens presently recommended in ARTC No. 11 and give the shear stresses obtained on these specimens.
(a) The first specimen tried was a three-notch specimen (fig. 11 C) with no lateral restraint and 1/2 inch between the edges of each notch. This specimen bowed badly at each of the notches and gave a value lower (about 70 percent of standard) than the standard two-notch specimen with no restraint.
(b) Next it was decided to try using a double three-notch specimen (fig. 11 D) back-to-back to let them restrain each other, with the inner two notches together.
FPL-033 -20-
Figu
re
11.-
-Spe
cim
ens
of
epox
y ty
pe
A
lam
inat
e ev
alua
ted
in
inve
stig
atin
g sh
ear
stre
ngth
s ob
tain
ed
on
clam
ped
and
uncl
ampe
d sp
ecim
ens
with
a
1/2-
inch
sh
ear
leng
th.
Val
ues
in
A ,
B ,
E ,
and
F ar
e av
erag
es o
f fiv
e sp
ecim
ens;
th
ose
in C
an
d D
are
fo
r on
e sp
ecim
en.

The shear value obtained was slightly higher than that for the single three-notch specimen; however, this specimen still bowed badly at the outer notch.
(c) Since a double three-notch specimen bowed badly only at the outer notches, it was decided to try a double two-notch specimen (fig. 11 E) which also had a wood clamp placed over the outer notches to restrain the bowing in this direction. Observation of this specimen during test showed that it remained essentially straight and gave shear strength values of about 6,000 p.s.i., much more in agreement with values obtained from Johnson and block shear tests.
(d) Another method of obtaining a notched specimen that would remain straight during test was to glue together the double two-notch specimen (fig. 11 F). The specimens did remain straight during test, but the computed shear strength values were approximately the same as a single two-notch specimen with no lateral restraint. This is probably caused by the normal stress shown in fig- ure 10, which is allowed to develop when no restraint is applied to the double specimen at the notches.
These results would indicate that using two two-notch specimens back-to-back, with some type of restraint placed over the outer notches, would give a value of shear strength superior to that obtained by the present methods of testing notched specimens.
Notched Rolling Shear Specimens-- τ .--Because of the extremely high glass WL
filament strength in tension and compression, shear failures always occur before direct tensile or compressive failures when a 1/2-inch-shear length is used on specimens tested at 0° to the shear length. However, the tensile and compressive properties of unidirectional laminates perpendicular to the fibers are extremely low and primarily dependent upon resin properties and fiber-to-resin adhesion. A report ( 12 ) on the interlaminar properties of five plastic laminates gave values of tensile and compressive strength of epoxy type A resin with unidirectional filaments as 3,590 and 21,600 p.s.i., respectively, and the interlaminar shear
as 5,190 p.s.i. from the block-shear test. strength at 90° to the fibers, τ
Because of the extremely weak tensile strength perpendicular to the fibers, a shear length of 0.043 inch or less would be required before a shear failure would result on a notched shear specimen tested at 90° to the fibers.
WL
The first experimental specimen tried was a composite tension specimen. A standard 8- by 1-inch specimen was cut, but with the fibers at 90° to the length. Two similar specimens, but with the fibers at 0° to the length, were then glued to the outside of the first specimen. The specimencomposite was then notched with a 1/4-inch shear length, as shown in figure 12A, and tested in tension. It was
FPL-033 -22-
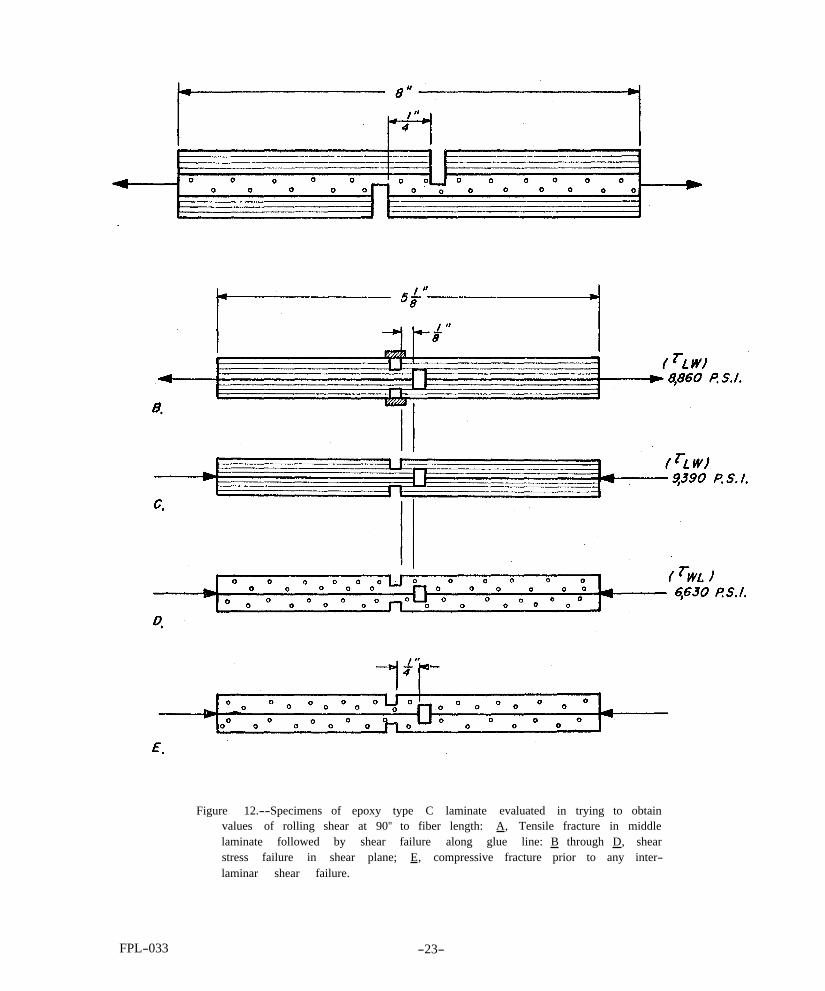
Figure 12.--Specimens of epoxy type C laminate evaluated in trying to obtain values of rolling shear at 90" to fiber length: A , Tensile fracture in middle laminate followed by shear failure along glue line: B through D , shear stress failure in shear plane; E , compressive fracture prior to any inter- laminar shear failure.
FPL-033 -23-

planned that the outside laminates would carry the tensile load on the specimen because of their higher strength and modulus of elasticity until an interlaminar shear failure would occur between notches. However, the middle laminate failed initially in tension at one notch, and this was followed by a failure in the bond between facing layer and specimen.
Since the compressive strength perpendicular to the fibers is approximately four times the shear strength, it appears likely that a compression notched shear specimen with a shear area less than four times the compression area may give good results. A comparative set of tests at 0° to the fibers was run to see if the tension and compression tests gave similar values of shear strength on similar specimens. The specimens shown in figures 12 B and 12 C were tested with the fibers at 0° to the specimen length with a 1/8-inch shear length. The tension specimens were tested with the wood clamp previously used, while the compres- sion specimens were run in the compression jig of figure 6. These specimens gave high strength values corresponding to previous single notched specimens with a 1/8-inch shear length (table 2). The agreement between the two is rel- atively good, with the compression test giving a value 6 percent higher. The speci- mens with the fibers at 90° to the specimen length were then tested in compres- sion and gave a value (6,630 p.s.i.) of interlaminar rolling shear ( τ ) very
near the value (6,810 p.s.i.) of edgewise rolling shear ( τ ) given by the WL
TL
Johnson shear tool. Interlaminar rolling shear values ( τ ) by the block-shear WL
test were lower (4,630 p.s.i.) than obtained by the other two methods.
A similar set of specimens, except with 1/4-inch shear length between the notches, failed in compression at one of the notches prior to any interlaminar shear failure.
Short-Span Beam Method
At the present time, some groups ( 8 , 15 ) testing plastic laminates by the NOL ring test ( 7 ) are cutting short specimens from the rings and testing them in flex- ure to evaluate the interlaminar shear strength of the material. If the span is short enough, the specimen will fail in shear prior to any outer fiber failure be- cause of the extremely high tensile and compressive strength compared with the interlaminar shear strength.
Studies ( 5 , 9 , 16 ) of shear stress distribution by strain-gage and photoelastic techniques on beams subjected to concentrated loads have shown that the actual distribution near the load points is much different than that predicted by the
FPL-033 -24-
conventional theory. These studies were on beams in the elastic range and show that actual shear stresses are much higher than those predicted and the maximum is near the surface at the load point or support. Theory ( 16 ) predicts peak shear stress near a reaction as infinite, while experiments ( 5 ) on wood beams show
. The usual parabolic distribution predicts peak shear 2V peak shear stress as A 3V V 2A A stress as while the average vertical shear stress is , where V is the shear
load and A is the area at a given cross section. Frocht ( 9 ) used photoelastic techniques on beams similar to those used in this study and he generalizes that near concentrated loads the peak shear stress may be four times greater than parabolic distribution predicts and that shear stress at the neutral surface is considerably smaller than expected.
Another factor that affects shear strength values obtained from short-span flexure tests is the occurrence of combined stress failures. If the failure is due to combined stresses, the resulting apparent horizontal shear strength will be too low. If the beam span is extremely short so that shear stress failures should oc- cur in the neutral plane, another variable may be of importance. On very short spans, the deflection and resulting tensile and compressive stresses are rela- tively low and the reaction supports and loading points may exert enough normal pressure on the surface of the specimen so that the development of horizontal shear failures is restricted. The test maytherefore become similar to a Johnson shear test where shear stresses are calculatedusing the average shear stress.
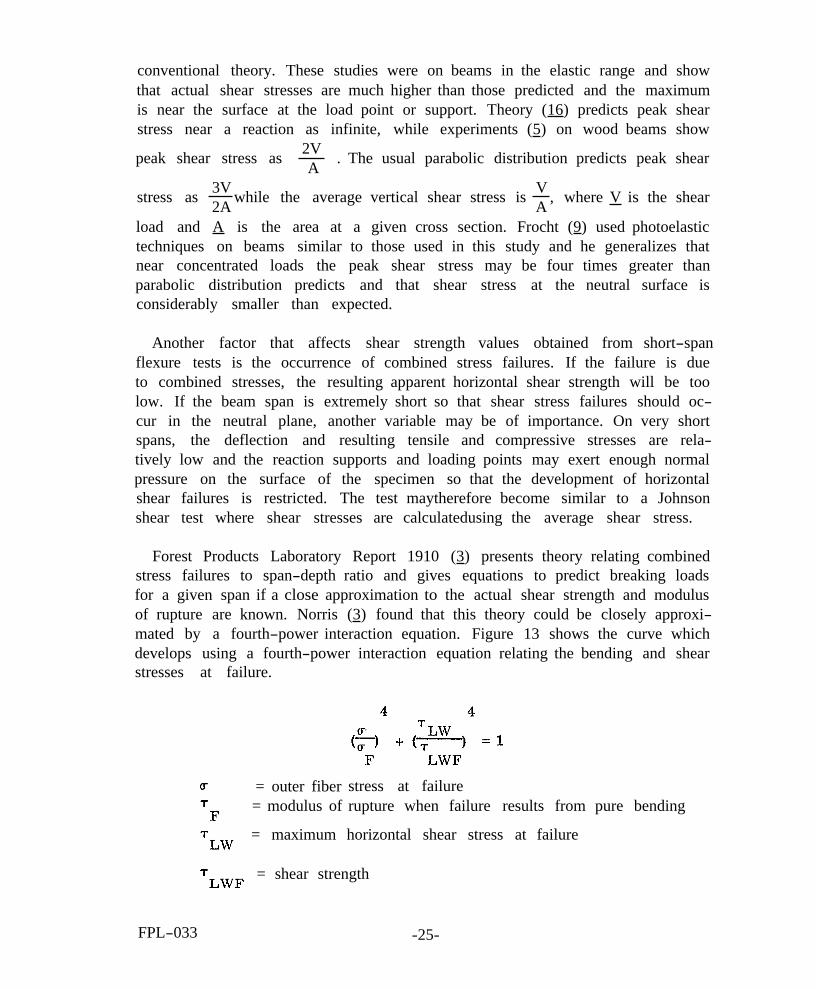
Forest Products Laboratory Report 1910 ( 3 ) presents theory relating combined stress failures to span-depth ratio and gives equations to predict breaking loads for a given span if a close approximation to the actual shear strength and modulus of rupture are known. Norris ( 3 ) found that this theory could be closely approxi- mated by a fourth-power interaction equation. Figure 13 shows the curve which develops using a fourth-power interaction equation relating the bending and shear stresses at failure.
= outer fiber = modulus of
stress at failure rupture when failure results from pure bending
= shear strength
= maximum horizontal shear stress at failure
FPL-033 -25-
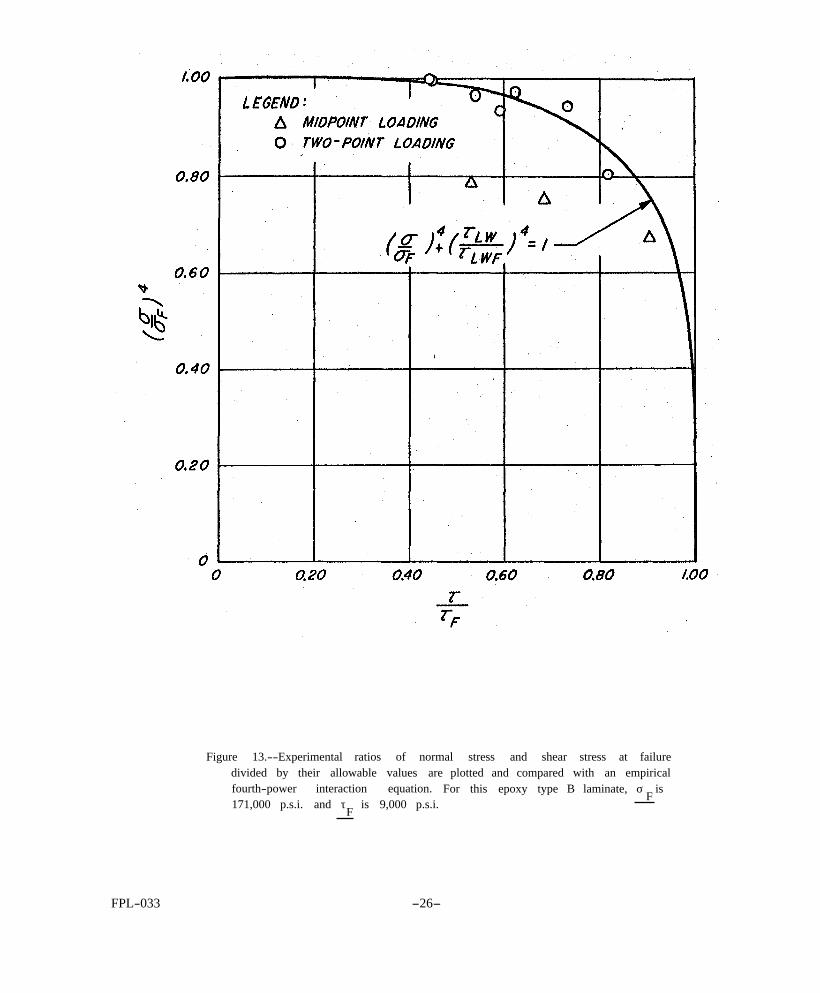
Figure 13.--Experimental ratios of normal stress and shear stress at failure divided by their allowable values are plotted and compared with an empirical fourth-power interaction equation. For this epoxy type B laminate, σ is 171,000 p.s.i. and τ
F is 9,000 p.s.i.
F
FPL-033 -26-
Also plotted on this graph are experimentally determined points calculated by assuming an outer fiber strength or modulus of rupture of 171,000 p.8.i. The shear strength value ( τ ) of 9,000 p.s.i. was obtained by arithmetically aver- LW
determined from the equation LWF aging the values of τ
F
The outer fiber strength of 171,000 p.s.i. was obtained from a flexure test using a specimen span-depth ratio of 24 under midpoint loading with a 0.01-inch metal plate beneath the loading nose.
The experimental data fit the curve quite closely except for two groups of specimens loaded at the midpoint. It appeared that normal compressive stresses inflicted by the loading nose initiated failure prior to interlaminar shear or outer fiber failures on these specimens. Each experimentalpoint is the average of five specimens.
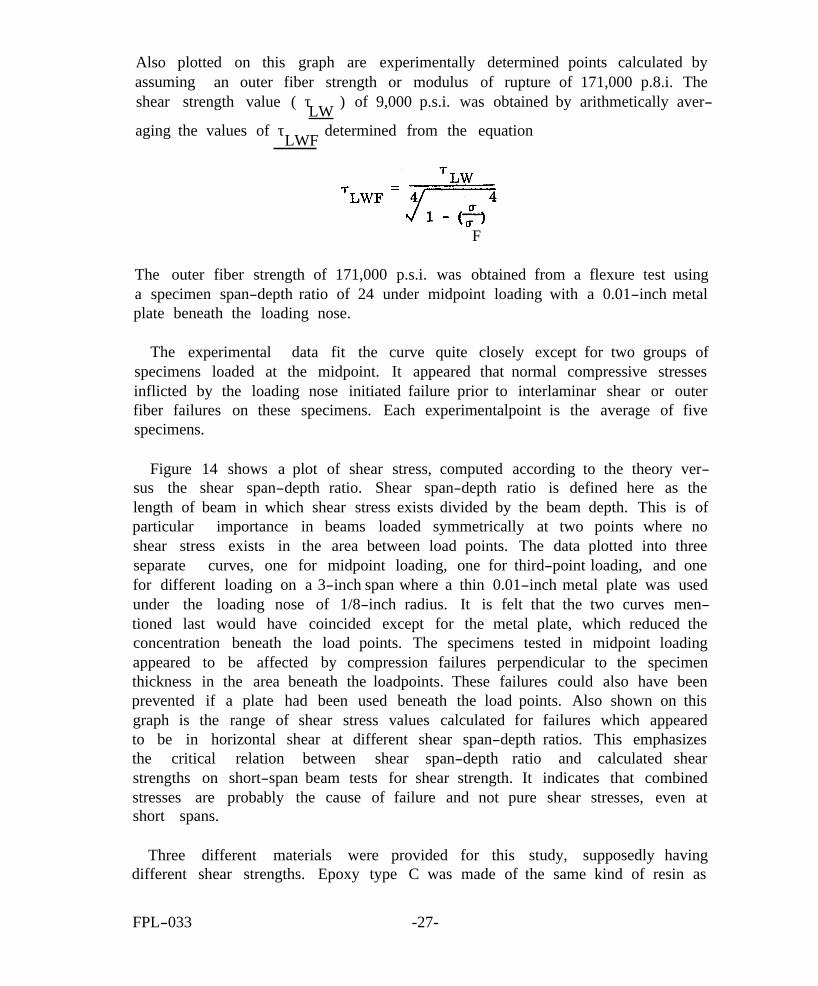
Figure 14 shows a plot of shear stress, computed according to the theory ver- sus the shear span-depth ratio. Shear span-depth ratio is defined here as the length of beam in which shear stress exists divided by the beam depth. This is of particular importance in beams loaded symmetrically at two points where no shear stress exists in the area between load points. The data plotted into three separate curves, one for midpoint loading, one for third-point loading, and one for different loading on a 3-inch span where a thin 0.01-inch metal plate was used under the loading nose of 1/8-inch radius. It is felt that the two curves men- tioned last would have coincided except for the metal plate, which reduced the concentration beneath the load points. The specimens tested in midpoint loading appeared to be affected by compression failures perpendicular to the specimen thickness in the area beneath the loadpoints. These failures could also have been prevented if a plate had been used beneath the load points. Also shown on this graph is the range of shear stress values calculated for failures which appeared to be in horizontal shear at different shear span-depth ratios. This emphasizes the critical relation between shear span-depth ratio and calculated shear strengths on short-span beam tests for shear strength. It indicates that combined stresses are probably the cause of failure and not pure shear stresses, even at short spans.
Three different materials were provided for this study, supposedly having different shear strengths. Epoxy type C was made of the same kind of resin as
FPL-033 -27-
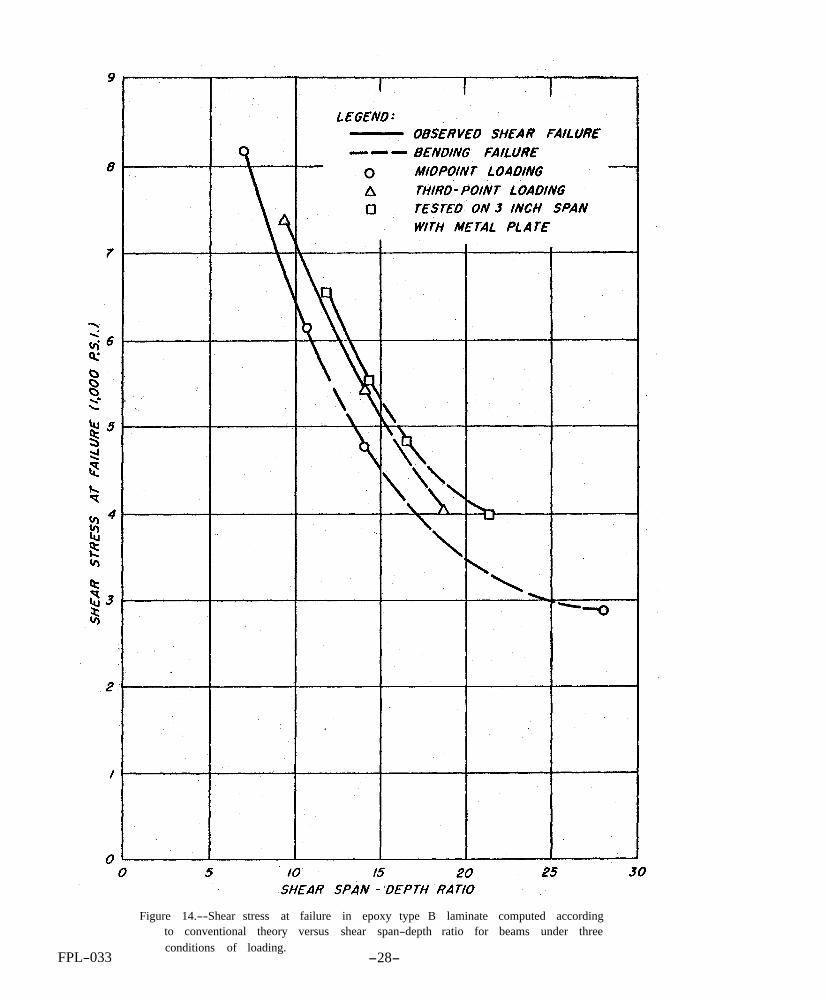
Figure 14.--Shear stress at failure in epoxy type B laminate computed according to conventional theory versus shear span-depth ratio for beams under three
FPL-033 conditions of loading.
-28-

epoxy type A but was made up differently to improve the interlaminar shear strength. However, examination of tables 3 and 4 showed that the type C had a lower calculated shear strength as short spans where shear failures occurred. Epoxy C was then run through a similar series of tests with a 0.01-inch-thick metal plate placed beneath the load points. The new values of shear strength were then higher than those calculated for the other two laminates at short spans where shear failures occurred, A study of the compressive properties perpen- dicular to the laminate thickness would probably be necessary to explain the be- havior of these laminates at very short spans.
Comparing the values of shear stress obtained from the block-shear method, Johnson shear method, and axial shear tests with values obtained from the beam tests indicate that the conventional parabolic distribution of shear stress in a beam gives the most realistic values of shear strength from the short-beam test. While the shear stress distribution in a beam is very complex in the elastic range it is still unknown what happens when plastic deformation occurs and possibly the stress distribution becomes more uniform.
Summary and Conclusions
The two principal shear test methods evaluated in this study were the notched axial tension and compression test and the short-span beamtest. Values of shear strength were also obtained by the block-shear method and the Johnson shear method to use as a comparison with the two methods evaluated in this study. The principal results and conclusions are as follows:
Block-Shear and Johnson Shear Methods
(1)
shear ( τ
7,410 p.s.i. for the three laminates evaluated.
Values of interlaminar longitudinal shear ( τ ) and edgewise longitudinal
) by these methods showed good agreement and ranged from 6,120 to LW
LT
(2) Values of interlaminar rolling shear ( τ ) by the block-shear method WL
were about two-thirds of the edgewise rolling shear ( τ
by the Johnson shear method from the two laminates evaluated.
) strengths obtained TL
FPL-033 -29-
Table 3.--Stresses at failure on beam tests for various shear span-depth ratios
FPL-033 -30-
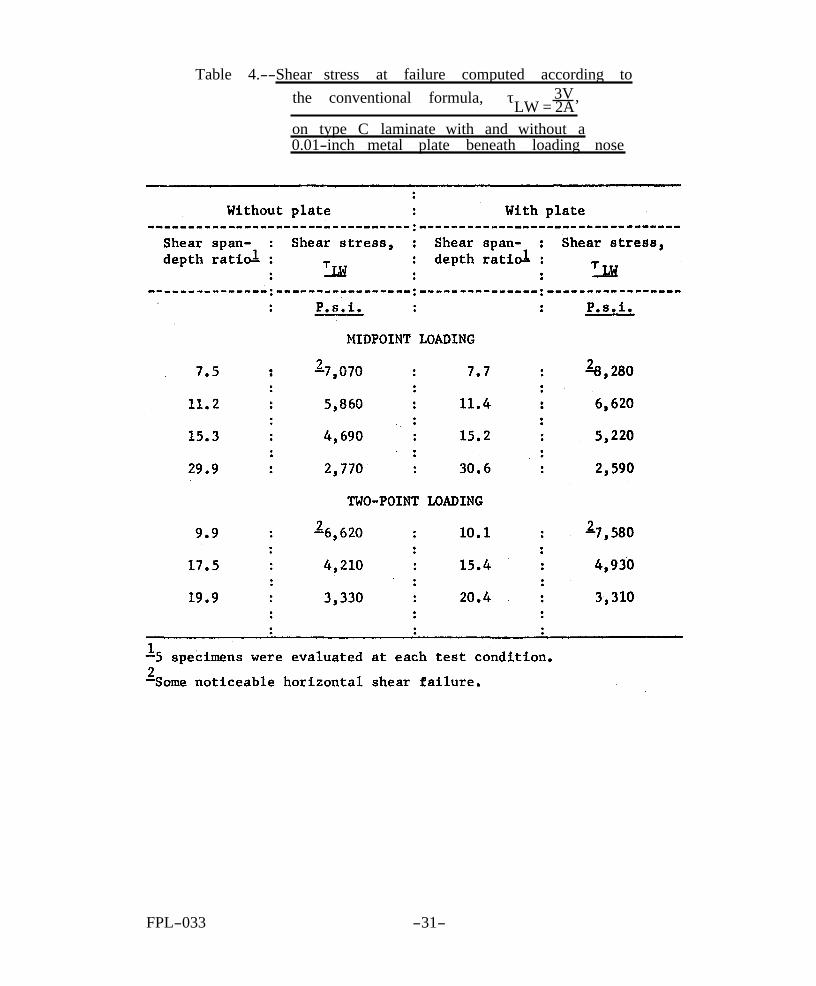
Table 4.--Shear stress at failure computed according to 3V
LW = 2A the conventional formula, τ
on type C laminate with and without a 0.01-inch metal plate beneath loading nose
FPL-033 -31-
,

(3) Interlaminar rolling shear ( τ ) strengths were only about 70 percent WL of interlaminar longitudinal shear ( τ ) strengths by the block-shear method
LW while edgewise rolling shear ( τ ) strengths
TL edgewise longitudinal shear ( ) strengths by
LT
were substantially the same as
the Johnson shear method.
Notched Interlaminar Shear Specimens
(1) Notched shear specimens tested in tension with no lateral restraint give shear strength values strongly influenced by the length between notches. Zero shear length theoretically will give a pure shear stress distribution and experi- mental tests on specimens with a 1/8-inch shear length gave shear strength values in excess of 8,000 p.s.i. while specimens with a 1-inch shear length gave shear strength values as low as 1,500 p.s.i. At longer shear lengths the failures are also influenced by large normal tensile stresses which develop at the ex- treme end on the shear area. With very small shear lengths the standard devia- tion becomes large, probably because of the difficulty of notching the specimens accurately and measuring the exact shear area. Any effect of weaknesses in the shear plane will also have a large influence on computed shear strengths when very small shear lengths are used.
(2) A double back-to-back specimen with a small woodclamp placed over the outer notches was used to help overcome the large normal tension stresses which develop at the notches. The effect of the notch length on shear strength calcula- tions is less when the clamp is used, with a 1/2-inch shear length giving 6,850 p.s.i. and a 1/8-inch shear length giving 8,860 p.s.i. on epoxy type C lami- nate. It appears that 1/4-inch shear length would give values very close to those obtained with the Johnson shear method (7,320 p.s.i.) and the block-shear method (7,110 p.s.i.).
(3) Rolling shear failures ( τ ) can be obtained on notched specimens tested
in compression and laterally supported throughout. The shear length must be designed so that a direct compression failure does not occur at the notch prior to the shear failure. Specimens of C laminate were tested back-to-back in the compression jig shown in figure 6 and failed at 6,630 p.s.i., which agrees closely with the value of 6,810 p.s.i. obtained by the Johnson shear method; specimens of B laminate failed at 6,610 p.s.i., whichcompares with the value of 7,700 p.s.i. obtained by the Johnson shear method.
WL
FPL-033 -32-
Short-Span Beam Test
(1) Theoretical and experimental studies of shear stress distribution in
beams predict values of peak stress from the average stress, to infinity.
However, the shear strength values obtained at failure in this study which agree most nearly with those obtained by other methods of shear testing are calculated
V A’
3V 2A’
from the conventional theory,
(2) It was found that a fourth-power interaction equation, which approximates the theory of Bechtel and Norris ( 3 ) on combined stress failures, appeared to describe the failures which occurred in this study rather well. This was espe- cially true for beams loaded symmetrically at two points, which present a more uniform load to the specimen than midspan loading with smaller normal compres- sive stresses developing beneath the load points. According to this equation, true horizontal shear failures never occurred alone and this equation would predict that type B laminate has a shear strength of approximately 9,000 p.s.i.
While three laminates of supposedly different shear strengths were used in this evaluation, it appeared that the differences between laminates were too subtle to be picked up by the different tests. None of the tests evaluated has a uniform shear distribution, and all are affected by combined stresses. It is felt the best shear strength data to be obtained from the methods used here would re- quire the following specimens and procedures:
Longitudinal shear
1. Axial test in tension or compression of double back-to- back specimens with 1/8 inch between the notches and a small clamp placed over the outer notches.
2. Short-span beam tests at shear span-depth ratios of 8, 10, 12, 14, and 16 on specimens loaded symmetrically at two points with a thin metal plate beneath the loading nose. Data from these tests must be solved by means of the interaction formula to obtain shear strength per se.
3. Johnson shear and block-shear methods as used in this study.
FPL-033 -33-
Rolling shear
1. Axial test in compression of double b a c k- t o - b a c k specimens with 1/8 inch between notches and laterally supported throughout the length,
2. The Johnson shear test as used in this study.
Literature Cited
FPL-033 -34-

FPL-033 -35- 1.2-36
PUBLICATION LISTS ISSUED BY THE
FOREST PRODUCTS LABORATORY
The following lists of publications deal with investigative projects of the Forest Products Laboratory or relate to special interest groups and are avail- able upon request:
Architects, Builders, Engineers, and Retail Lumbermen
Box, Crate, and Packaging Data
Growth, Structure, and Identification of Wood
Logging, Milling, and Utilization of Timber Products
Chemistry of Wood Mechanical Properties of Timber
Drying of Wood
Fire Protection
Fungus and Insect Defects in Forest Products
Furniture Manufacturers, Woodworkers, and Teachers of Woodshop Practice
Glue and Plywood
Structural Sandwich, Plastic Laminates, and Wood-Base Components
Thermal Properties of Wood
Wood Fiber Products
Wood Finishing Subjects
Wood Preservation
Note: Since Forest Products Laboratory publications are so varied in subject matter, no single catalog of titles is issued. Instead, a listing is made for each area of Laboratory research. Twice a year, December 31 and June 30, a list is compiled showing new reports for the previous 6 months. This is the only item sent regularly to the Laboratory’s mailing roster, and it serves to keep current the various subject matter listings. Names may be added to the mailing roster upon request.
FOR
ES
T S
ER
VIC
E R
EG
ION
AL
EX
PE
RIM
EN
T S
TATI
ON
S
AN
D F
OR
ES
T P
RO
DU
CTS
LA
BO
RA
TOR
Y
PRO
GR
AM L
OC
ATIO
NS
HEA
DQ
UAR
TER
S O
F R
EGIO
NAL
FO
RES
T EX
PER
IMEN
T ST
ATIO
NS
FOR
EST
PRO
DU
CTS
LA
BOR
ATO
RY
WAS
HIN
GTO
N
- BE
LTSV
ILLE
Fore
st S
ervi
ce r
egio
nal
expe
rimen
t st
atio
ns a
nd F
ores
t P
rodu
cts
Laba
tory