methods for evaluating work-related musculoskeletal neck
TRANSCRIPT

arbete och hälsa vetenskaplig skriftserieISBN 91–7045–463–9 ISSN 0346–7821 http://www.niwl.se/ah/ah.htm
1998:6
Methods for evaluating work-relatedmusculoskeletal neck and upper-extremitydisorders in epidemiological studiesAllan Toomingas
National Institute for Working Life
Karolinska InstituteDepartment of Public Health SciencesDivision of Occupational Health
National Institute for Working LifeDepartment for Work and Health
Göteborg UniversitySection of Occupational Medicine
KONGL C
AR
OL
INSK
A MEDICO CHIRUR
GISK
A IN
STITUTET
*

ARBETE OCH HÄLSARedaktör: Anders KjellbergRedaktionskommitté: Anders Colmsjöoch Ewa Wigaeus Hjelm
© Arbetslivsinstitutet & författarna 1998Arbetslivsinstitutet,171 84 Solna, Sverige
ISBN 91–7045–463–9ISSN 0346-7821http://www.niwl.se/ah/ah.htmTryckt hos CM Gruppen
National Institute for Working LifeThe National Institute for Working Life is Sweden'scenter for research and development on labour market,working life and work environment. Diffusion of infor-mation, training and teaching, local development andinternational collaboration are other important issues forthe Institute.The R&D competence will be found in the followingareas: Labour market and labour legislation, workorganization and production technology, psychosocialworking conditions, occupational medicine, allergy,effects on the nervous system, ergonomics, workenvironment technology and musculoskeletal disorders,chemical hazards and toxicology.A total of about 470 people work at the Institute, around370 with research and development. The Institute’s staffincludes 32 professors and in total 122 persons with apostdoctoral degree.The National Institute for Working Life has a largeinternational collaboration in R&D, including a numberof projects within the EC Framework Programme forResearch and Technology Development.
List of papers
This thesis is based on the following papers, which will be referred to by theirRoman numerals.
I Toomingas A, Hagberg M, Jorulf L, Nilsson T, Burström L, Kihlberg S.Outcome of the abduction external rotation test among manual and officeworkers. Am J Ind Med 1991; 19:215-27.
II Toomingas A, Nilsson T, Hagberg M, Lundström R. Prospective aspects ofthe abduction external rotation test among male industrial and office workers.Submitted
III Toomingas A, Németh G, Alfredsson L, Stockholm MUSIC I Study Group.Self-administered examination versus conventional medical examination ofthe musculoskeletal system in the neck, shoulders and upper limbs. J ClinEpidemiol 1995; 48:1473-83.
IV Toomingas A, Theorell T, Michélsen H, Nordemar R, Stockholm MUSIC IStudy Group. Associations between self-rated psychosocial work conditionsand musculoskeletal symptoms and signs. Scand J Work Environ Health1997;23:130-9.
V Toomingas A. Characteristics of pain drawings in the neck-shoulder regionamong working population. Submitted.
VI Toomingas A, Alfredsson L, Kilbom Å. Possible bias from rating behaviorwhen subjects rate both exposure and outcome. Scand J Work Environ Health1997;23:370-7.

Abbreviations used in this thesis
AER test abduction external rotation testCIR cumulated incidence ratioCR10 scale category ratio 10 scaleCV coefficient of variationκ kappa coefficientMSD musculoskeletal disordersPPV positive predictive valuePPT pressure pain thresholdPR prevalence ratior correlation coefficientROC receiver operating curveROM range of movementRPE rated perceived exertionTOS thoracic outlet syndromeVAS visual analogue scaleWRMSD work-related musculoskeletal disorders
2-PD test two-point discrimination test95%ci 95% confidence interval

Contents1. Introduction 1
1.1 The scope of this thesis and the structure of this introductory chapter 1
1.2 Occurrence of the disorders 1
1.3 More knowledge needed about assessment of disorders 2
1.4 Some aspects of terminology and methodology 2
1.5 Relations between exposure, disorders and other effects 31.5.1 Model of exposure-effect relations 31.5.2 Chain of effects 5
1.6 Affected structures, risk factors, pathomechanisms, symptoms,signs and diagnoses 61.6.1 Skeletal bones and joints 61.6.2 Muscles 61.6.3 Tendons and tendonsheaths 71.6.4 Peripheral nerves 81.6.5 Other relevant diseases and unspecific disorders 8
1.7 Location of work-related neck and upper-extremity disorders 91.7.1 Disorders associated with physical exposure 91.7.2 Disorders associated with psychosocial exposure 9
1.8 Quality aspects of assessments 101.8.1 Reliability 101.8.2 Validity 101.8.3 Rating bias 12
1.9 Assessment of musculoskeletal disorders 141.9.1 Medical history 141.9.2 Symptoms and discomfort 141.9.3 Characterisation of symptoms or discomfort 151.9.4 Symptom magnitude 161.9.5 Symptom recording methods 171.9.6 Pain drawings 171.9.7 Signs 181.9.8 Self-administered examination of signs 201.9.9 “Diagnoses” and syndromes 21
1.10 The starting points for the studies in this thesis 21
2. Aims and hypotheses 23
3. Subjects and methods 24
3.1 Subjects and main outlines 24
3.2 Methods 243.2.1 Symptom recording 243.2.2 Medical examination 253.2.3 Syndromes 283.2.4 Physical exposure 29
3.3 Outcome of the AER test (Study I) 29
3.4 Prospective aspects of the AER test (Study II) 29
3.5 Self-administered examination of signs (Study III) 29
3.6 Psychosocial conditions and disorder characteristics (Study IV) 32
3.7 Pain drawing (Study V) 32
3.8 Rating bias (Study VI) 33
3.9 Statistical methods 34

4. Results 35
4.1 Outcome and prospective aspects of the AER test (Studies I and II) 35
4.2 Self-administered examination of signs (Study III) 37
4.3 Psychosocial conditions and disorder characteristics (Study IV) 37
4.4 Pain drawing (Study V) 38
4.5 Rating bias (Study VI) 41
5. Discussion 42
5.1 Signs of nerve compression 425.1.1 Possible mechanisms 425.1.2 Relations to work and other risk factors 435.1.3 Evaluation of the AER test and its usability 44
5.2 Self-administered examination of signs 455.2.1 Poor validity of self-administered examination 455.2.2 The usability of self-administered examination 465.2.3 Possible improvements of validity 47
5.3 Psychosocial conditions and disorder characteristics 475.3.1 Support for the hypotheses 475.3.2 Implications 48
5.4 Pain drawing 485.4.1 Pain drawing distribution 485.4.2 Size of the pain drawing area 505.4.3 Other pain drawing characteristics 505.4.4 Evaluation of pain drawings 50
5.5 Rating bias 515.5.1 No high and low rating bias 515.5.2 Sources of rating bias 515.5.3 Bias from negative affectivity and other emotional loading 525.5.4 Bias from differential misclassification 525.5.5 Rating bias in subgroups 52
5.6 General comments 535.6.1 The central role of symptoms 535.6.2 The role of self-reports and principles for optimal assessmentprocedures 535.6.3 Evaluation of assessment methods 545.6.4 Possibilities of early effects 55
5.7 Sources of error and limitations 555.7.1 Measurement errors 555.7.2 Sampling and data loss errors 565.7.3 Limits to generalisability 575.7.4 Specific sources of error or limitations 57
6. Conclusions and summarising statements of this thesis 59
7. New aspects in this thesis 60
8. Summary 61
9. Sammanfattning (summary in Swedish) 62
10. Acknowledgements 63
11. References 64
1
1. Introduction
1.1 The scope of this thesis and the structure of this introductory chapter
This thesis applies primarily to epidemiological studies of work-related musculoskeletaldisorders (WRMSD) in the neck and upper extremities. Much applies however also toepidemiological studies of non-work related disorders, to health surveillance and to studiesof other regions of the body.
The methods studied in this thesis are mainly those assessing the disorder state by gaininginformation from individual subjects. Registers or sources of aggregated health informationare not studied in this thesis, nor are disorders primarily due to accidents, systemic diseases,cancer or other tumours.
The over all structure of this introductory chapter is described below, also indicating thespecific relevance of the sections for the different studies I-VI in this thesis.
Section1.2-3 -the relevance of the topics of this thesis1.4 -some aspects of terminology and definitions1.5 -an over all model of relations between exposure, disorders and other effects1.6 -structures that mainly becomes affected; risk factors, pathomechanisms,
symptoms, signs and diagnoses, with specific emphasis on the neck/ shouldermuscles and the brachial plexus (Studies I, II, IV and V)
1.7 -the location of these disorders, with specific emphasis on disorders related topsychosocial conditions (Study IV)
1.8 -quality aspects that are important in assessing disorders, with specificemphasis on rating bias (Study VI)
1.9 -methods in assessments of these disorders; their quality and usability withspecific emphasis on self-administered physical examination and paindrawings (Studies III and V).
1.2 Occurrence of the disorders
Musculoskeletal disorders (MSD) have long been a major cause of suffering in manyindustrialised countries. Besides the low-back region, the neck and upper extremities are themost affected regions. In a nation-wide Swedish survey among working population in 1995about 28% reported weekly pain in the neck, 27% in the shoulders or arms and 13% in thewrists or hands [194]. About 20-25% of all expenditure for medical care, sick-leave andsickness pensions in the Nordic countries in 1991 was related to conditions of themusculoskeletal system, whereof 20-80% were work-related (re-calculations from [75]).About half of these were located to the neck or upper extremities, accounting for 15% of allsick-leave days and 18% of all sickness pensions in Sweden in 1994 (re-calculations from[193]).
A large part of all reported occupational disorders in the Nordic countries 1990-92 hadmusculoskeletal diagnoses associated with ergonomic factors - Norway 15%, Denmark andFinland 40% and Sweden 70% [19]. About 2/3 of such reports in Sweden concerned theneck and upper extremities [150]. Similar high proportions of musculoskeletal neck and
2
upper-extremity occupational injuries and disorders are reported e.g. from USA (30% of allnonfatal injuries and disorders) [23]. Knowledge of the prognosis of many of these disordersis limited, but is poor in many cases, in spite of exposure elimination and medical attendance[9, 31]. All these factors taken together have resulted in high costs both for the sufferer, theemployers and the community [11]. Rough estimations show that the total expenditure forWRMSD in the neck and upper extremities is about 0.5-2% of the gross national products inthe different Nordic countries (re-calculations from [75, 146]).
1.3 More knowledge needed about assessment of disorders
Considerable scientific resources have been allocated to the study of possible causal factorsfor WRMSD [72]. Still, the knowledge about possible early effects and the progression andpersistence of WRMSD is scanty. Mechanisms explaining the relations between stressfulpsychosocial exposure and WRMSD are also mainly unknown.
Within the science of epidemiology much attention has been paid to the characterisationof critical exposures and the development of valid methods of exposure measurement [68-70, 103, 136, 237-241]. Knowledge is insufficient, however, about what structures andtissues are affected in many WRMSD, and how this could be assessed with reliable, validand feasible methods. Reliable and valid assessment methods, especially self-administered,suitable for epidemiological studies of the neck and upper extremities should therefore befurther elaborated.
1.4 Some aspects on terminology and methodology
“Work-related” in this thesis refers to disorders studied in working populations, in contrastto patient groups, children, elderly or retired people or subjects with systemic and otherserious diseases. “Work related” should also be understood as “exposure factors at work andthe performance of work are contributing factors beside many other factors to thedevelopment, to the aggravation or to the persistence of disorders”. This is in contrast to“occupational diseases” where there is a direct cause-and-effect relationship between ahazard and the disease, e.g. loud noise and hearing loss [231].
“Disorder” in this thesis means “a derangement or abnormality of function; a morbidphysical or mental state” [39]. “Disease” is defined as “any deviation from or interruption ofthe normal structure or function of any part, organ, or system (or combination thereof) of thebody that is manifested by a characteristic set of symptoms and signs …” [39]. “Disorder” isthus a more vague condition, whereas a “disease” mostly has structural changes andobservable manifestations [69, 70].
In the science of epidemiology, disorders are studied typically in a general population oroccupational or other specific groups. The aim is most often to gain knowledge about thecharacteristics of the disorder or its relations to different exposures or other conditions inthese groups. The methods available for such studies must therefore be suitable forapplication to many subjects of whom many (most) are healthy. The methods need to be, inaddition to reliable and valid, safe, non-threatening, easy and non-expensive to administerand to record. Main methods for assessment of disorders in epidemiological settings aretherefore restricted to the use of health registers, self-administered questionnaires andsometimes also personal interviews or medical examinations. This is in contrast to clinicalevaluation of single patients or to studies where small patient groups and healthy volunteers
3
are examined. In clinical settings data are assessed using a wide range of more or lessinvasive methods besides the traditional medical interview and examination. The demandson reliability of the assessment methods are higher in clinical evaluations of single patients.Defects in reliability in epidemiological studies can be handled by averaging data frommany subjects in the study group.
Central to all such evaluation or studies is the definition of the disorder or disease. Inclinical settings the “diagnosis” is used to define the pathological condition and the affectedanatomical structures, e.g. arthrosis of the cervical spine, rupture of the supraspinous tendon.Clinical diagnostics are the result of a mental and iterative process, not governed by simplestatistical or formal rules, but more of a pattern-matching process [181]. This process isadapted to each individual patient and it goes on until the diagnosis is reasonably secure.There is an established consensus for the definitions and taxonomy of diagnoses [232].
“Diagnostics” in epidemiological studies based on non-clinical cases, on the other hand,follow pre-determined rules and all subjects are treated similarly. Due to this and the limitedsources of information, diagnoses are seldom acquired. Proxies to diagnoses have to suffice.Such proxies could be “symptom diagnoses” based on symptoms alone, or “syndromes”1
based on combinations of information e.g. on both symptoms and signs. Decision rules andcriteria should be defined for these proxies [69, 143, 222]. This is not only necessary forreporting and comparability between studies, but also for the quality of the assessment. It isimportant to evaluate the usability and validity of these proxies.
The naming of the disorders and diseases should reflect their known character, origin, andlocation. As the knowledge about many musculoskeletal disorders is vague, many namesrefer only to the specific symptom and location, e.g. cervicalgia. One such commoncombination of symptoms and signs in the neck and upper-shoulder region is pain, stiffnessand tenderness on palpation (without rizopathia or serious aggravation in movements in theneck). This syndrome has been given many names, “tension neck”, “cervicobrachialsyndrome”, “myofascial syndrome” etc. [109, 220, 222]. In this thesis the name“neck/shoulder pain syndrome” will be used.
1.5 Relations between exposure, disorders and other effects
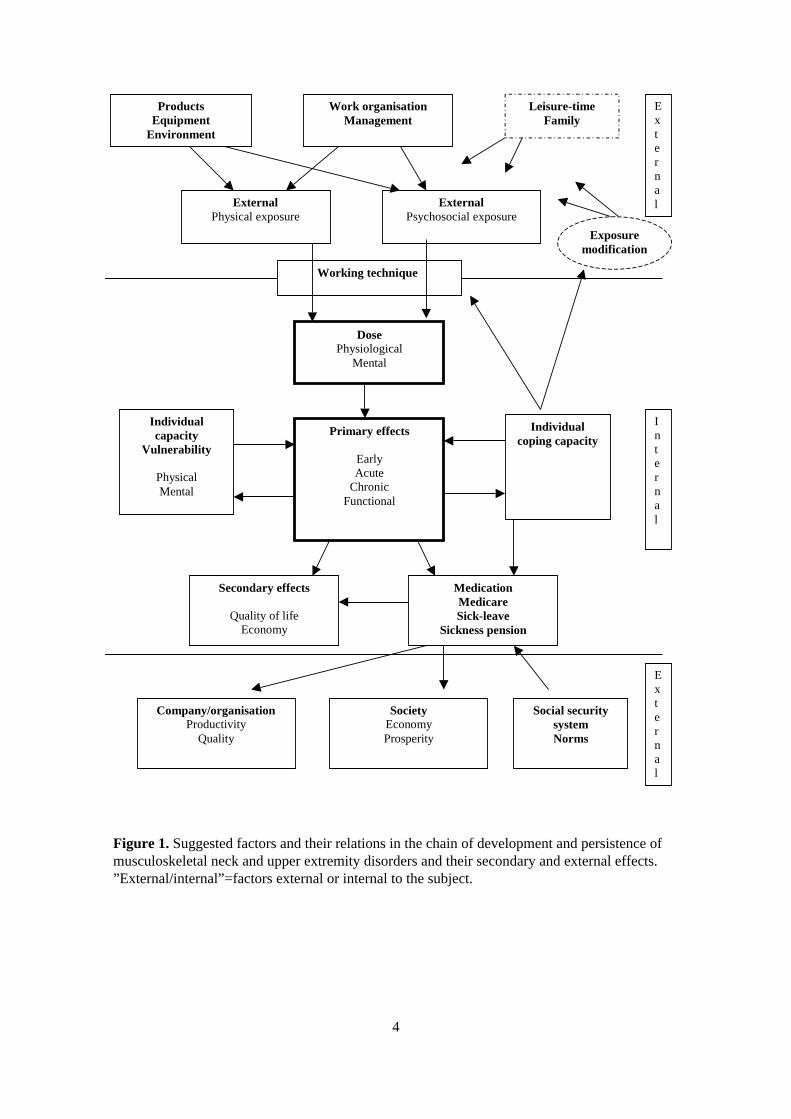
1.5.1 Model of exposure-effect relationsRisk factors and their possible relations in the development and persistence of WRMSD inthe neck and upper extremities can be described as follows (Figure 1). The production ofgoods or services with the equipment used, the prevailing environmental and socialconditions together with the organisation of work, constitutes the individual externalexposure. This can roughly be divided into physical/mechanical and psychosocial exposures.This external exposure will not only act as a dose on specific organs and tissues, but alsomentally. In this process the external exposure is modified by the individual workingtechnique and coping processes. Working techniques may be characterised by individualchoice of order of tasks, speed, forces, movements, etc. (within the limits of the ”freedom”given by the work). Unnecessarily high muscle activity (tension) and lack of muscularpausing when given the possibility could be regarded as aspects of working technique.Depending on the nature of the exposure and on whether it exceeds the individual capacityor vulnerability, this dose can cause early/intermediate, acute or chronic effects.
1 “Syndrome – a collection of symptoms and signs which tend to occur together and form a characteristicpattern but which may not necessarily be always due to the same pathologic cause” [219].
4
Figure 1. Suggested factors and their relations in the chain of development and persistence ofmusculoskeletal neck and upper extremity disorders and their secondary and external effects.”External/internal”=factors external or internal to the subject.
- 1 -ProductsEquipment
Environment
Work organisationManagement
Leisure-timeFamily
ExternalPhysical exposure
ExternalPsychosocial exposure
External
Working technique
DosePhysiological
Mental
Individualcapacity
Vulnerability
PhysicalMental
Individualcoping capacity
Primary effects
EarlyAcute
ChronicFunctional
MedicationMedicareSick-leave
Sickness pension
Secondary effects
Quality of lifeEconomy
Company/organisationProductivity
Quality
SocietyEconomyProsperity
Internal
External
Social securitysystemNorms
Exposuremodification
5
The early/intermediate effects may be postulated as self-limiting or transient, e.g. (minor)changes in mental and/or physiological homeostasis. These could be perceived as, e.g.strain, discomfort, fatigue, tremor or (muscular) tension.
More prominent effects may be either acute (self-limiting or transient) or chronic withself-perpetuating, generalising or persisting damage processes to homeostasis and the tissuestructures. Such acute or chronic effects may be perceived by the subject as pain or othersymptoms and, often but not always, by external observers as signs in medical or laboratoryexaminations or as deficiencies of functional capacity. Serious pain and obstruction of thefunctional capacity can necessitate sick-leave and sickness pension. Sick-leave can be seenas a means for exposure elimination or a therapeutical and pain-coping measure. The use ofsick-leave and sickness pension depends on the demands of the occupation. It also dependson laws, regulations, norms, and economic incentives in the community. Other copingmeasures are different symptom relieving activities, such as medication or medicalconsultation and care. Actions to remove or diminish or otherwise modify the unhealthyexposure or to improve the individual capacity or working technique are examples ofadaptive coping activities. Effects on quality of life and economy are common secondaryeffects for the subject. Other secondary effects are seen on quality and productivity atcompany/ organisational level, economy and prosperity at community level.
1.5.2 Chain of effectsIn a hypothetical cause-effect relation, as indicated in Figure 1, musculoskeletal disordersare seen as effects or outcomes of exposure in work life, in interaction with other exposuresand individual capacity and coping abilities. These effects are manifold. They can be seen atindividual or external levels and at different time intervals. The effects are coupled in acause-effect cascade over time, i.e. one effect is the cause of the next [4]. The followingexample can illustrate this. Repetitive and forceful wrist movements causes increasedpressure inside the carpal tunnel which in turn increases the intra-neural pressure of themedian nerve, which causes a decrease in intra-neural blood supply, which causes cell-membrane instability, causing defective axonal transport and signal propagation and alsoelectrolyte destabilisation, which cause oedema that cause further increase in intra-neuralpressure, and so on… [34, 123, 164, 180, 201]. The defective axonal signal propagationcauses (is perceived by the subject as) symptoms of numbness and tingling in the fingers;(can be observed as) positive nerve compression provocation signs, and (can be measuredas) a decrease in median nerve conduction velocity over the wrist region. These symptomscan be regarded as “acute” reversible effects. Sustained high intra-neural pressure can causechronic effects, such as a decreased function in 2-point discrimination (2-PD) ability andtrophic changes in the thenar muscles with permanent damage, which can be observed asmuscle weakness and thenar atrophy. The symptoms and dysfunction may cause decreasedproductivity and quality at work and a need for exposure elimination (sick-leave or exposuremodification) and perhaps also medical care (surgery).

6
1.6 Affected structures, risk factors, pathomechanisms, symptoms, signs, and diagnoses
Primarily affected organs and structures in the neck and upper extremities can be dividedinto skeletal bones, joints with capsule, muscles, tendons and tendon sheaths, and peripheralnerves.
1.6.1 Skeletal bones and jointsNon-traumatic work-related disorders affecting the skeletal bones or joints in the neck andupper extremities are rare. Cysts and vacuoles in the palmar bones, degeneration of thelunate bone and arthrosis of the acromioclavicular joint have been reported from exposure tomanual handling of heavy loads or forceful exertion and vibration/percussion [61, 72, 195].
Pathomechanisms The condition “arthrosis”, including its spinal counterpart –“spondylosis”, can be considered as a degenerative phenomenon with a decrease in articularcartilage or intervertebral disc thickness. The mechanisms are unclear, but high compressivejoint forces e.g. from transmitted impulses from hand-held tools and/or due to forcefulgripping or handling of heavy loads have been suggested [61].
Symptoms Mainly ache and pain on loading of the joint.Signs Restriction of active and passive joint movement, tenderness and pain at loading.Diagnosis “Arthrosis” or “spondylosis” is mainly based on X-ray findings.
1.6.2 MusclesThe neck and upper extremity muscles are active, not only on joint movements and exertionof forces, but also to counteract the force of gravity on the body segments and stabilisinge.g. the shoulder and wrist joints during work [77, 82, 186, 187]. Neck muscles are alsoactive during precision work, mentally demanding tasks or psychologically stressfulsituations [40, 45, 122, 125, 218, 226, 243].
Pain in the neck and shoulder area with tenderness over the descending part of thetrapezius or other adjoining muscles is more common among women than men and isdescribed in association with repetitive work, lack of pausing, static load and constrainedhead and arm postures [72, 73, 104, 163, 210].
Pathomechanisms The supraspinous muscle is vulnerable as it is partly located in acompartment. High intramuscular pressure which obliterates the blood support is foundalready on light abduction or flexion of the shoulder joint [90, 95]. One study reported tightsurrounding fascias and high intramuscular pressures at low loading, also in the trapeziusmuscles among patients with trapezius symptoms. This disappeared after pressure-releasingsurgery [74].
The pathomechanisms involved in the development of most work-related disorders in themuscles are unclear, however. Several, not necessarily mutually exclusive, models andhypotheses have been put forward. One is about “muscle overload and energy crisis”. It issuggested that prolonged static contractions of the trapezius muscle will result in anoverload of the type-I muscle fibres with increased fatigue [71, 76, 113, 114, 118, 119].Damage to type-I fibres could also be explained by a muscle activation pattern where themotor units are activated in the same order on increasing force demands, resulting inprolonged periods without breaks for specific units (the “Cinderella” theory) [86].

7
A“mechanical-chemical damage” model is suggested where muscle fibres are damagedfrom eccentric muscle contractions, perhaps due to unhealthy working technique with animbalance between agonist/antagonist muscles [43, 58]. Calcium ions and free radicals maycause tissue damage as they are produced in injured or re-perfused hypoxic muscles [3, 88,105].
The “gamma motor neurone” model describes how muscle tensions can be spread tolarger muscle areas, both ipsi- and contralaterally. This process can be triggered by noxiousstimuli, e.g. ischaemia or muscle damage that stimulates the muscle afferents. This rise inmuscle activity leads to further production of metabolites and a further stimulation of themuscle afferents in a self-perpetuating process [38, 91].
Noxious stimulation due to tissue damage and/or inflammatory reactions can trigger asuccessive release of different neuro-hormones and peptides that starts a pain andinflammatory augmenting circle. This results in primary peripheral and secondary spinalhyperalgesia including enlargements of receptive fields and sensitisation not only to noxiousstimuli but also to non-noxious stimuli, such as cold and touch [124, 156 for overviews].
Symptoms Ache, feelings of stiffness, weakness and fatigue together with pain onmuscular contraction.
Signs Local tenderness, stiffness, pain on muscular contraction or passive distension.Nodules that trigger radiating discomfort or that are localised tender points.
Diagnoses Local “myopathies” or more regional “myofascial syndromes” are found.Many cases are “unspecific” where no diagnosis is possible other than symptom-relating e.g.“cervicalgia”, “brachialgia”. Other relevant diagnoses should be ruled out.
1.6.3 Tendons and tendonsheathsAffections of tendons and their sheaths are common in the shoulder, elbow and wristregions. There is strong evidence, including experimental, for work-relatedness regardingrotator cuff tendinitis where repetitive manual work, working postures with elevated orabducted arms and static load are risk factors. Risk factors for wrist tendinitis are forcefuland repetitive gripping or extreme joint postures [11, 67, 72, 104, 191].
Pathomechanisms Friction and traumatisation due to repetitive movements of the tendonpast edges or narrow spaces is one main mechanism explaining inflammatory reactionsleading to tendinitis. Others are microruptures in the tendon or its insertion in the bone dueto forceful stretching of the tendon. There are special anatomical locations, with vulnerableblood supply and degeneration of the tendon tissues, that predispose to such reactions, suchas the supraspinous tendon.
Symptoms Ache and pain on stretching of the tendon.Signs Tenderness at the affected tendon. Pain on resisted muscular contraction or passive
stretching of the tendon are common findings. Sometimes there are local thickenings on thetendon which makes the tendon stuck in narrow passages, such as the supraspinous tendonpassing under the acromion (painful arc) or wrist/finger extensor tendons passing intosheaths (tendinitis stenosans). “Tenosynovitis” may be followed by crepitations onmovement.
Diagnosis “Tendinitis”, “peritendinitis”, “myotendinitis” or “tenosynovitis” dependingon the affected structures. Most common are rotator cuff tendinits, epicondylitis, and deQurvain´s tendinitis. Common diagnostic criteria are - adequate symptoms and signs of localtenderness, pain on resisted muscular contraction or passive tendon stretching.

8
1.6.4 Peripheral nervesCompression or other mechanical traumatisations are, apart from toxic and vibration-induced neuropathies, the main causes of work-related disorders of the peripheral nervoussystem. Best documented is the carpal tunnel syndrome affecting the median nerve. Extremewrist postures and repetitive motions or forceful gripping are risk factors [11, 72, 104].Another is compression of the brachial plexus, often called “thoracic outlet syndrome”(TOS). Cervical ribs or other anomalies in the neck/shoulder region and neck traumaincrease the risk of such compression. A few cross-sectional studies indicate that manualwork or repetitive arm-movements are risk factors [73, 202]. Work with hand-held vibratingtools has been associated with compression of the median nerve in the carpal tunnel [233].Few studies are found concerning association between such work and compression of thebrachial plexus [96].
Pathomechanisms See section 1.5.2 (example).Symptoms Pain, numbness and tingling sensations in the specific areas of the distribution
of the compressed nerve. In severe cases weakness of muscles. Subjects with compression ofthe brachial plexus may have widespread symptoms, both in the neck/shoulder regions andmost typically, in the ulnar distribution of the forearm and hand [174]. The pain is more dulland diffuse on compression of predominantly motor nerves, e.g. the posterior interosseusnerve. Symptoms are often provoked by specific circumstances, e.g. carpal tunnel syndromeduring sleep, compression of brachial plexus when working with elevated arms [123, 161].
Signs In severe cases there is decreased muscular strength and wasting of affectedmuscles. Tinell´s sign, decreased 2-PD capacity and sensitivity to touch and vibrations maybe found. Diminished tendon reflexes are rare.
In early phases, such as among a working population, signs may only be observedthrough specific compressive provocation tests. The Abduction External Rotation (AER) testhas been used for provoking compression of the brachial plexus [153, 173, 182]. The use ofthe AER test has mainly been reported from different patient groups. Few studies havereported the outcome of this test among the working population or specific exposure groups[202]. No studies report prospective aspects of the AER test. Of specific interest would beprognostic factors for the incidence of new brachial plexus compression, as measured withthe AER test and the prognosis of a positive test.
Diagnosis Diagnostic criteria for most of the compressive disorders have been debated.The carpal tunnel diagnosis relies mainly on median nerve distribution of symptoms and apositive nerve conduction test. No valid nerve conduction test has been found for evaluationof compression of the brachial plexus. The diagnosis of TOS relies therefore on symptomsand signs, mainly in the AER test [123, 161]. Other relevant diseases should be ruled out.
Nerve compression diseases are not always easy to diagnose. Peripheral nerveentrapment, radiculopathy and TOS were three of the five most frequently overlookeddiagnoses among chronic pain patients referred to a pain clinic [81].
1.6.5 Other relevant diseases and unspecific disordersSymptoms described above can, however, also emanate from other pathological processes.Well-known are myocardial ischaemia or other diseases affecting the peritoneum, pleurae orpericardium that can be referred to the arm or shoulder region due to their support from thephrenic nerve (C3-C5).

9
On the other hand, there are situations when symptoms emanating from structures in theneck and upper extremities are referred to other regions in the body. Examples are headacheor vertigo due to disorders of the cervical spine and muscles or compression of the brachialplexus. Affections of deep structures in the neck/shoulder region can be referred to thefrontal or posterior thorax and upper extremities [100].
Symptoms and signs can also be manifestations of obvious trauma, e.g. whiplash injury,but also of systemic diseases or other medical conditions. Well-known are aches in the jointsdue to rheumatoid arthritis, psoriasis or other collagenosis. Widespread ache and pain issuffered by patients with fibromyalgia. Carpal tunnel disease is seen among diabetes patientsand during pregnancy. Ache and pain from the muscles are sometimes found among patientswith hypothyreosis, tumours in the hypophysis or other malignancies. Polyneuropathy, e.g.due to alcohol or other toxic exposure, can cause numbness in the hands. Common is alsoache and pain during or after infections, viral, bacterial or others, e.g. Borrelia burgdorferi.Examination and evaluation of neck and upper-extremity disorders should always have thesealternatives in mind.
It should finally be mentioned that in many cases of pain or other symptoms from theneck and upper extremities there are no, vague or contradictory signs at examination.Sometimes the symptomatology is also vague or contradictory, and they add to the manyunspecific cases where a definite diagnosis is not possible. These cases are numerous andare given different names – “cervicobrachial disorder”, “neck myalgia”, “cumulative traumadisorder” etc. Future studies will hopefully bring more light to this field so that these casescan be better understood and properly diagnosed. This could facilitate rehabilitation andprevention.
1.7 Location of work-related neck and upper-extremity disorders
1.7.1 Disorders associated with physical exposureThe specific locations of acute or chronic WRMSD are mainly restricted to the specificmusculoskeletal structures primarily affected by the (unhealthy) working postures,movements, and physical loads. These main locations have been described above in section1.6. It was also described in section 1.6.2 how muscle stiffness can spread both ipsi- andcontralaterally and how local pain can spread to other structures and locations, enlarging thepainful region and prolonging the pain.
The locations of the affected structures, the symptoms and the findings on physicalexamination, often but not always coincide. The phenomenon of “referred pain” makessymptoms more diffuse, widespread, and distal [117]. Referred pain from injury toperipheral nerve cords, stimulating the nervi nervorum, can be referred both distally andproximally, e.g. in carpal tunnel syndrome [211]. Compression of peripheral nerves makessymptoms typically more distal.
1.7.2 Disorders associated with psychosocial exposureThe location of affected structures, symptoms and signs associated with mental load and(unhealthy) psychosocial conditions is less documented. Primarily, the causal relations areunclear. Hypotheses emanate from theoretical postulations, laboratory studies andobservations of psychosomatic disorders. Pain and disorders secondary to frequent or long-lasting muscular tensions or static contractions without pause, as a reaction to mentallystressful exposure and not due to a external physical load, constitute a common theory [48,

10
205, 216, 223, 227]. The theory is however not yet developed enough to specify where thesetensions and pains would be located in the body. One of the pioneers of psychosomatics,Wilhelm Reich, described in 1933 a "muscular armour" with a segmental distribution oftensed muscles in the face, neck, trunk and pelvis as a reaction to deep frustrations [169].Symptoms among workers with psychosocial problems are reported to be restricted mainlyto the neck and shoulder regions [229]. Elevated electromyographic activity has beenrecorded from the neck, trapezius and erector spinae muscles during stress provocationamong patients with pain syndromes in the cervical or back regions, respectively [54, 55,189, 190, 243]. Elevated muscle activity has also been reported from the trapezius musclesduring experimentally-induced mentally demanding tasks [45, 122, 217, 226, 230]. Thetheory of stress-induced muscular tension and/or lack of ability to relax as a mediator of theeffects of poor psychosocial work conditions predicts the findings of muscular pain andtenderness among subjects working in such conditions. Symptoms and signs from joints,tendons or compressed nerves are not primarily consistent with this theory, as affections inthese structures are thought to be associated mainly with high, long-lasting or repetitivephysical load [11, 72, 104].
No reports were found of studies addressing associations between psychosocial workconditions and specific locations and characteristics of MSD.
1.8 Quality aspects of assessments
All data in epidemiological studies about disorders are only estimations and approximationsof hypothetical “true” states of disorders among the subjects. There are many sources oferror in these estimations.
1.8.1 ReliabilityRandom variations in time and between subjects and within subjects are common to allmeasurements of disorders due to the nature of biological processes and other sources ofvariation during the measurements. The degree of freedom from random errors in theestimations is expressed as the “reliability”. Reliability is measured as stability over time -“test-retest” or “intra-observer” reliability - and as the combined stability over time andbetween measuring instruments, e.g. observers, - “inter-observer” reliability. Calculationsare made using different measures of association, e.g. correlation or kappa coefficients (κ)[52, 112].
Lack of reliability in measurements of disorders introduces uncertainty regarding theestimate and an attenuating bias to risk estimates. This uncertainty makes the results of allfurther analyses uncertain and less powerful. It is therefore important to minimise randomerrors. One method is to make average estimations based on repeated measurements. Othermethods are to increase the quality of measurements, e.g. more precise questionformulations in questionnaires or standardisation of medical examination procedures.
1.8.2 ValidityThe degree of freedom from systematic errors in estimation of the true disorder state isexpressed as the “validity” of the measurement. Sources of systematic errors could be e.g.selective drop-outs from the study group, frequently misunderstood questions in aquestionnaire or non-proper medical examination techniques.
Systematic errors can introduce unpredictable bias to the results. Such bias willmisinform and lead to erroneous conclusions. Systematic errors should therefore be avoided
11
as much as possible. Good reliability is a prerequisite. One approach is to get “as close” tothe conceptually “true” condition as possible, e.g. acquire data from the insurance companyregisters about sick-leave instead of using a questionnaire where recall bias could besystematic (forgetting). Other examples are to use standardised medical examinationprocedures and to do repeated “calibrations” of the examiner (-s) against a “standardexaminer” or a peer group, reaching consensus about methods and criteria. It is alsoimportant to avoid selective sampling or drop-out errors. For example, if healthy subjects areless prone and disordered subjects more prone to enter a study there will be anoverestimation of the prevalence of disorders. If disordered subjects have left the companyor are not available for examination (on sick-leave due to the disorder!) then there will be anunderestimation of the prevalence of the disorder (healthy-worker effect) [151, 178].
The ability of an assessment method to identify “true” cases of the disorder is called the“sensitivity” and the ability to identify all non-cases is called the “specificity”. Further, theproportion of the estimated cases that are “true” cases is called the “positive predictivevalue” (PPV).
The validity of the estimations can be calculated using different measures of associationbetween the estimate and the “true” value or its proximate (“golden standard”), e.g.correlation or κ coefficients (criterion or prospective validity). If there is no “goldenstandard”, the estimate can be compared to other phenomena that are closely related to thedisorder (construct validity). The validity of a test with a dichotomous outcome is optimallyexpressed as its likelihood ratio (sensitivity/1-specificity). The corresponding measureconcerning continuous tests is the Receiver Operating Curve (ROC) (sensitivity plottedagainst 1-specificity) [6].
Errors in assessment can be systematic also in another perspective in risk-analyticalstudies. If errors in assessment of the disorder differ systematically between subjects whoare exposed versus those who are not exposed to the risk-indicator, there will be an“exposure-dependent misclassification of disease” [151, 178]. This will introduce bias to themeasures of association between exposure and disorders (over- or underestimation). Thus ifexposed subjects tend to overestimate the disorders more than non-exposed subjects, thenthere will be an overestimation of the true association between exposure and effect. Freedomfrom exposure-dependent misclassification is therefore important in analytical studies.
If, in analytical studies, there is no bias in assessment of disorders associated with theconsidered exposure, then the effects on the relative risk estimates because ofmisclassification of disorders could be described as follows. Low sensitivity will notinfluence the relative risk estimate in cohort studies measuring prevalence or cumulativeincidence. If the comparison is based on incidence rates, there may be a certain dilutingeffect, which is negligible unless the incidence of the sign is high [151, p 31]. Whenestimating odds ratios, for instance in case-control studies, such misclassification introducesbias towards the null value, which might be considerable if the incidence or prevalence ofthe sign is high [178, 87]. Low specificity, on the other hand, will have a considerablediluting effect on the relative risk estimates in all circumstances. This underestimation willbe marked if the prevalence of the disorder is low [20, 151].
Applied to section 1.4 above, about diagnoses and “proxies”, this means that the generallymost important quality of such (“proxy”) diagnoses is high specificity. Signs, diagnoses and“proxy” diagnoses should not be aggregated so that cases and non-cases are lumpedtogether. A crucial complicating factor is, however, that the underlying pathologicalcondition and disease is often unclear. There is thus seldom a “golden standard” to rely on.This is also true for signs and tests of function.
12
1.8.3 Rating biasQuantitative data about exposure factors and disorders in epidemiological studies are oftenacquired by subjective judgements or ratings. In the science of psychometrics the ratedphenomena are called "stimuli" and the resulting judgements or ratings are here called"ratings"2. "Stimuli" in the context of epidemiology could include exposure factors, potentialconfounders (physical, psychosocial etc.), and outcome phenomena such as number of sick-leave days, pain intensity, etc. "Ratings" would be the overt judgements or ratings of thesephenomena as a result of a perceptual and cognitive process which by its nature must bedescribed as subjective. Such judgements or ratings could be given as verbal expressions, asfree numerations or as values in rating scales.
The relation between stimulus and rating magnitudes has been described by S.S. Stevensand G. Ekman as a power function [46, 196]:
R=b+a∗Sn
where S=stimulus magnitude ; R=rated magnitude; n=exponent; a, b =constants
Such stimulus-rating functions have been empirically stated for many stimulus modalities[44, 197]. There are, however, many sources of error and biases, random or systematic, insubjective judgements and ratings [162]. One of the sources of systematic bias is individualdifferences in the use of rating scales and the use of numeric values. Such differences inrating behaviour are well described in psychometrics, mainly concerning the range andstandard deviation of numerics in ratings [16, 47, 66, 93, 203]. The spread of ratings usedby each subject affects the exponent in the power function mentioned above, with a higherspread resulting in a higher exponent.
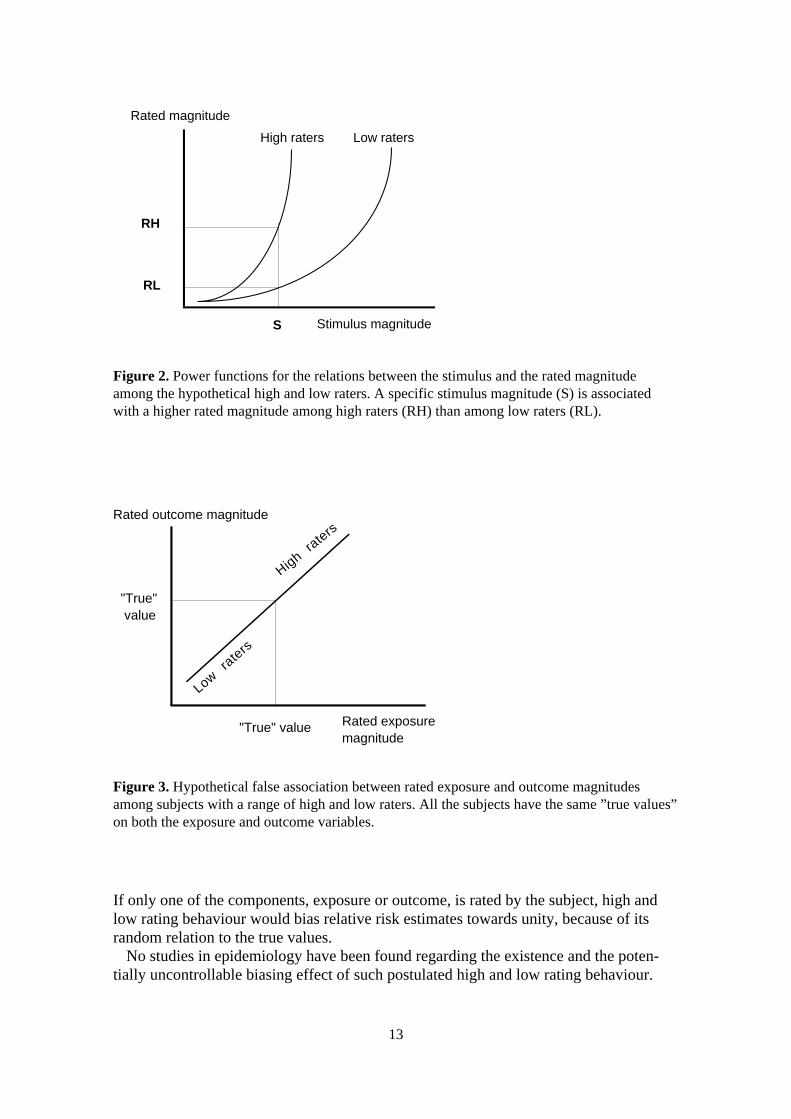
Individual differences in the average value of the numerics used in rating procedures arehowever less studied. Such differences in rating behaviour could be described as a stabletrait, a general tendency, to use high or low numerics when rating different phenomena, oras "over-" or "under-estimators" if the ratings concern phenomena with true values. Highraters would have a higher exponent in the algorithm above (Figure 2). Applied toepidemiological studies, high-raters would rate both exposure and outcome as higher thanlow-raters and vice versa, even when there are no differences in exposure or outcome. If in ahypothetical study there is a range of such rating behaviour among the subjects, and bothexposure and outcome are rated by the same person (usually the subject of study), thiswould introduce an association between the exposure and outcome ratings (Figure 3). Thisassociation would, however, solely be an effect of rating behaviour, an artefact that wouldintroduce bias to the results. Estimates of relative risk would be overestimated, in typicalcases where both exposure and outcome measures are scaled in the same direction.Differences in the spread of ratings among subjects can likewise introduce similar bias torelative risk estimates.
2 The proper term is "response". This term has, however, another definition as an effect-measure in traditionalepidemiology, why it is avoided here in order not to cause confusion.
13
If only one of the components, exposure or outcome, is rated by the subject, high andlow rating behaviour would bias relative risk estimates towards unity, because of itsrandom relation to the true values.
No studies in epidemiology have been found regarding the existence and the poten-tially uncontrollable biasing effect of such postulated high and low rating behaviour.
Figure 2. Power functions for the relations between the stimulus and the rated magnitudeamong the hypothetical high and low raters. A specific stimulus magnitude (S) is associatedwith a higher rated magnitude among high raters (RH) than among low raters (RL).
Figure 3. Hypothetical false association between rated exposure and outcome magnitudesamong subjects with a range of high and low raters. All the subjects have the same ”true values”on both the exposure and outcome variables.
RH
RL
High raters Low raters
S Stimulus magnitude
Rated magnitude
Rated exposure magnitude
Rated outcome magnitude
"True" value
"True" value
High raters
Low rate
rs

14
1.9 Assessment of musculoskeletal disorders
Data on disorders in epidemiological studies are mainly of the following types:-medical history-symptoms, discomfort and related data-signs on medical examination-“diagnoses”, syndromes-other effects (function, sick-leave, life quality etc.–not further commented in this thesis).
1.9.1 Medical historyMedical history about past trauma, diseases, surgery, medication, sick-leave etc. constitutesimportant information for the understanding of the current disorder. Prior sickness is oftenthe most important risk factor. Relapses are common. Retrospective information from thesubjects is affected by recall bias and other memory problems, such as the “telescopingeffect” (phenomena are recalled as being more recent) [212 p 398]. Register data to comparewith are sometimes available, e.g. from the company health care unit and local insuranceoffices.
The reliability and validity of medical history data diverge. The test-retest reliability ofinterview and questionnaire data has been reported to be good or excellent for well-definedpast chronic or serious diseases or continuous medication, e.g. myocardial infarction (κ>0.8;at prevalence of disorder=4%) and fair for less-defined medical conditions or intermittentmedication, e.g. chest pain (κ<0.6; prev.=9%) [101]. Memory problems (under-reporting)can be expected to decrease the sensitivity (=0.3-0.9) of information about, e.g. hospitaladmission, fractures, chronic illness or medication. Specificity (=0.9-1.) and PPV (=0.4-1.)are mainly high. Marked differences in validity have not, with a few exceptions, been foundbetween gender, age groups, educational levels or social classes. There are varying reportsabout the effect of recall time on validity [78, 99, 152].
Test-retest reliability for questionnaire-based information among active workers aboutprevious (ever) rotator cuff or carpal tunnel syndrome, tendinitis, sprain and arthritis were“good-excellent” (κ=0.6-0.9; prev:=5-20%) [56]. The sensitivity for past (three years) backpain with sciatica was 0.74 and lumbago 0.60 in a study of 2200 male machine operators,carpenters and office workers. A tendency to exposure-dependent misclassification wasfound, with lowest sensitivity among office workers [172].
Test-retest reliability of retrospective data about sick-leave due to musculoskeletaldisorders is reported as high among population samples (κ=0.7-0.9; prev=15%). The validityvalues were also high (κ=0.8; sensitivity >0.8; specificity >0.9) and no exposure dependentmisclassification was found [1, 22, 57].
1.9.2 Symptoms and discomfortCentral to the evaluation of musculoskeletal disorders are the symptoms. Symptoms aredefined as “any subjective evidence of disease or of a patients condition, i.e. such evidenceas perceived by the patient…” [39]. Symptoms are by definition subjective phenomenawithin the suffering subject. As information about symptoms depends on the perceptions andcommunications of the patient, it can be affected by factors that influence such processes,e.g. memory, fears, motivation, language etc. This can introduce both dependent andindependent misclassification of the data in an epidemiological study. One method tominimise such bias is to ask for specific information of symptoms i.e. “where, when and

15
how?”, e.g. “numbness in the right hand fifth finger within 1 minute when working withhands above shoulder level” (indicates compression of the brachial plexus).
The symptom that has been given most attention in scientific studies is “pain”. There aremany studies and much literature about the assessment of pain, chronic pain, and low-backpain [13, 212 for overviews]. There is less literature about other symptoms than pain andother locations than the low-back region.
The term “discomfort” is frequently used as an “umbrella” term for different unpleasantsensations and symptoms [24 for review]. Phenomena such as “pain”, “tenderness” and“fatigue” are often included which makes the delimitation between “discomfort” and“symptoms” very vague.
The reliability of symptom data seems to be good, according to the few studies available.Test-retest reliability was good-excellent for questionnaire-based data (“NordicQuestionnaire”) on symptoms from the neck and upper extremities among active workers(κ=0.6-0.9; prev.=10-30%) [56]. No association to reliability was noted with gender, age,educational level, seniority, or exposure to repetitive work. Other test-retest studies of the“Nordic Questionnaire” have reported a range of non-identical answers varying between 0-26% between different body regions [37, 110].
Ratings of experimental provocation of neck- and arm-discomfort are fairly stable over 2weeks (Borg CR10 scale r>0.70) [221]. Test-retest (3 weeks) reliability of VAS-rated neckand upper-extremity discomfort at work was studied among industrial workers [56].Reliability was good if subjects were asked to rate worst discomfort during the previous 30days, but poor if they rated current discomfort.
Validity of symptom data has been studied from different aspects. Questionnaire datahave been compared with interview data. A study of a questionnaire-based diagnoses forepisodic tension headache among population samples reported low sensitivity (0.4) but highspecificity (≈1) compared to medical interview symptoms recorded by a physician(prev.=66%) [166]. Questionnaire data about epicondylitis or tenosynovitis/peritendinitsduring the previous year among meat processing factory workers were compared withoccupational health care records. The sensitivity was 0.5-0.6, specificity about 1 and thePPV about 0.5 (calculated from published data; prev=5%) [111].
Validity of symptom data has also been studied against signs on medical examination.The sensitivity of the Nordic Questionnaire to identify subjects with signs on medicalexamination (prev.=25-75%) varied between 0.4-0.8, and the specificity was mainly above0.9 in a study of neck and upper-extremity disorders among female workers with manyoccupations [155]. Pain on palpation or provocation of muscles and tendons in theneck/shoulder and forearm was positively associated with a pain-index based onquestionnaire data from the same regions [127]. One other study of elderly people reportedκ-values around 0.6 for interview-based data regarding pain and restrictions of jointmovements compared to findings in a medical examination [36].
1.9.3 Characterisation of symptoms or discomfortInformation about type or quality of the symptom, e.g. ache, pain, stiffness, tightness,tingling, numbness etc, is often necessary for understanding and for diagnostics. Thereliability of such data specifying the type or quality of symptoms varies however and isinconsistent between different regions of the body [56]. This indicates that assessment ofsymptom data should be aggregated concerning symptom type or quality. One of the mostused pain assessing instruments, however, the McGill Pain Questionnaire, is based

16
on appraisal of 87 words describing the type and affective connotations of the pain [141,142].
Symptom data about musculoskeletal disorders should be assessed separating differ-ent body regions. Regarding the neck and upper extremity regions, data are usuallyseparated for (left-right) neck, shoulder, upper back, shoulder joint, upper arm, elbow,forearm, wrist, hand, and fingers. To specify and define the partitions of the differentregions, questionnaires are often supplied with a body map showing the delimitation ofthe regions. One common questionnaire is the ”Nordic Questionnaire” (Figure 4) [110].Others use slightly different definitions and body maps [29, 127, 133, 199].
1.9.4 Symptom magnitudeQuantification is done in epidemiology e.g. when studying dose-response relations. Amore intense or long-lasting pain is assumed to be related to a higher magnitude ofeffect. Symptom magnitude can be assessed using data about:
- intensity of symptoms- duration or other temporal aspects of symptoms- use of analgesics, medical consultations, sick-leave due to symptoms- consequences of the symptoms for work life, leisure time, social activities, sleep.
Figure 4. Body regions for symptom recordings in study IV (left) and studies I and II (right).
17
Intensity has been assessed with different rating scales. Most used are category scales, suchas the Borg scales [14, 15]. An often-used ratio scale is the Visual Analogue Scale (VAS)[188]. Intensity can be rated as “current”, “worst during the last 6 months” “average duringlast week” etc. [242].Duration of symptoms (since onset) can be assessed simply as days, weeks, years etc. Otheraspects are continuous or intermittent symptoms. Three to six months has been suggested ascriterion for “chronic” pain [69, 143].
Pain that prompts use of analgesics is probably more severe than pain that does not. Thesame reasoning could be applied to pain and medical consultations, treatment or sick-leave.The number of sick-leave days and doses of analgesics can be used for quantification. Suchpain-relieving behaviour is however also dependent on the coping manner of the subject andother factors such as the social security system.
Finally, severity can be assessed as the consequences of the symptoms. Pain that disturbsthe sleep can be quantified as number of nights with disturbances. Other consequences areinterference with work capacity, productivity, and quality. Interference with leisure timeactivities, family, sexual and social life are other common phenomena that are related to theseverity of the symptoms.
1.9.5 Symptom recording methodsSymptoms, discomfort and medical history are most often recorded in self-administeredquestionnaires. Interviews, e.g. traditional medical interviews or telephone interviews, arealso used, but are more resource-consuming. Diaries and pain loggers are other methods thatare intended to increase data quality as the recordings are made intermittently during theday. Applications of psychometric knowledge have been fruitful and there are guidelines forthe design of good questionnaires and interview guides [49, 126, 137, 198].
1.9.6 Pain drawingsPain drawings have frequently been used clinically for communication and documentation ofpain, ache and other symptoms and as tools for diagnostics, therapeutical decision-makingand prognostics [2, 138, 157, 179]. The stability and reliability of evaluation of differentpain drawing characteristics are generally high [130, 132, 214]. Their validity has beenstudied in relation to symptoms, signs, laboratory findings and diagnoses [5, 25, 213, 246].
The essence of pain drawings is the communication of the spatial distribution ofsymptoms, projected on the body surface. The congruence of the distribution with well-defined anatomical regions (“organic”,”anatomic”) in contrast to more atypical, diffuse orexaggerated distributions (“non-organic”, “idiopathic”, “psychogenic”) are characteristicsthat have been studied [2, 5, 63, 165, 214]. Studies have mainly focused either onneurogenic (sciatica) or “non-organic” pain in the low-back region. Less attention has beenpaid to other pain drawing characteristics or the distribution of nociceptive pain in otherbody regions such as the musculoskeletal system in the neck and upper extremities [98, 131,184].
As mentioned earlier, different possible mechanisms enlarge the painful region fromnoxious stimulation or otherwise affect the location. Intense or long-lasting focal pain couldthus hypothetically be generalised to larger areas and to both sides of the body. Paindrawings could be one method to study such phenomena of symptom location anddistribution.

18
Besides areas covered by the markings in pain drawings, few other attempts have beenreported regarding quantification and “objectification” of pain drawing characteristics. Theuse of “objective” and quantitative measures in the characterisation of pain drawings couldbe one step in the endeavours to make more reliable and valid use of information about thephenomenon of pain.
Finally, most studies of pain drawings have reported its qualities in clinical settingsamong patients suffering from pain. The merits and usefulness should be evaluated also foruse in occupational health work and in epidemiological studies of specific occupationalexposure groups or the general population.
1.9.7 SignsSigns are generally considered to be more “objective” than symptoms. Most medicalexamination tests have more or less subjective components, however. This subjectivity istwo-fold. Primarily the execution and evaluation of examination manoeuvres are dependenton the skills, perceptions and evaluations of the examiner. Secondly, the completion andoutcome of most examination items depend on the co-operation, perceptions and evaluationsof the examined subject. The difference between symptoms and signs is sometimes small,e.g. palpation of tenderness. Tenderness is a symptom that is dependent on a specificprovocation, in this case mechanical pressure on the tissues. The main difference betweentenderness as a symptom and as a sign concerns who delivers this pressure. Similarconditions concern other examination items that work by provoking pain or assess thesensitivity for weak stimuli. There are methods to minimise the subjectivity of the examiner,e.g. use of a goniometer or an algometer. Other ways are to standardise the examinationprocedures and training of the examiners. There are many guide-books for medicalexamination of the muskuloskeletal system [83, 139].
A medical examination as part of an epidemiological study of musculoskeletal disordersmay include the following types of examination items:
-inspection-assessment of range of movement-provocation of pain at stretching of muscles and tendons.-provocation of pain at muscular contraction-assessment of muscular strength-provocation of tenderness at palpation-provocation of nerve compression or other nerve stress tests-other tests e.g. tremor, sensitivity (touch, vibrations, 2-PD).
Inspection. The main items are evaluation of stature and difficulties during movements,such as in walking or making gross manoeuvres. The posture of the neck and shoulderasymmetry is often registered. Atrophy of muscles may indicate serious disease. Grossdeformities e.g. a callus after a fracture of the clavicle or a wrist ganglion can help explaincompression of nearby nerves. The inter-examiner reliability of inspection of muscleatrophy and other signs in the neck and upper extremities has been studied and found to below among neck patients (κ=0.3-0.5; prev.=5-30%) [235] and among the workingpopulation (κ=0.3; prev.=10%) [8].
Range of movement. Range of joint movement (ROM) is most often measured in degrees ofan angular rotation around an axis. Definitions of terminology, neutral position and axis ofmovement together with normative data about ROM are published e.g. by AmericanAcademy of Orthopaedic Surgeons [64]. ROM is measured during both maximum active

19
(unassisted) and passive (assisted by examiner) joint movement. Naked eye assessment ofROM is most often estimated as “normal” or “reduced”.
Naked eye estimations has been reported as both unreliable and invalid in some studies[79, 121, 145]. Other studies of the inter-examiner reliability of active neck ROM amongneck patients found it to be fair-good (κ=0.4-0.6; prev.=5-20%) [235] and good amongworking population (κ=0.6; prev.=4%) [8]. The use of goniometers markedly increasesreliability and validity if they are used in a standardised manner (test-retest r>0.90). Thereare no significant differences in measurement quality of different goniometers, only in theirapplication [59 for overview]. The inter-examiner reliability (wrist-ROM CV=6-10%) issomewhat lower than the intra-examiner reliability (5-8%). Passive ROM is less reliablethan active, due to differences in application of stretching forces to the tissues. There arealso differences between joints. Joints with many axes of motion, e.g. the wrist, are moredifficult to measure reliably and validly than single-axis joints, e.g. the elbow.
Tests of ROM can also be included in tests of upper-extremity function. Well-known isplacing the hand on the neck as a test of shoulder abduction and external rotation. There areexamples of further refinements of such tests suitable for epidemiological studies offunctional ability of the upper extremities [28].
Provocation of pain on muscular contraction or passive stretching of tendons. Stretching ofinflamed muscles, tendons or tendon insertions is painful. Stretching can be passive throughthe examiner´s pull or active through contraction of the affected muscle. A positive test ismost often indicative of “tendinitis” or “myotendinitis”.
Muscle strength. Decreased muscle strength compared to the normal age and gender valuescan be a secondary phenomenon due to acute pain or muscular waste due to long-lastingpain. It may also be decreased due to deficient neuromuscular control, caused by e.g.compression of the efferent nerve. It can finally be an indication of a serious muscledisorder, which is rather uncommon.
Muscle strength in the neck and upper-extremity regions is mainly assessed in the deltoid(C5-C7) and rotator cuff muscles including the biceps (C4-C6), the forearm flexors andextensors (C5-C8), grip or pinch strength, and the finger abductors/adductors (C8). Themaximum strength is usually assessed through application of manual resistance and issubjectively evaluated as “normal” or “decreased”, often using the other side of the body forcomparison. Special rating scales are available for more detailed quantification of musclestrength [62, 170]. The reliability of evaluation of manual strength testing of shoulder, armand hand muscles was found fair to good among neck patients (κ=0.4-0.6; prev.=5-30%)[235]. Except for grip (or pinch) strength, there are no convenient muscle strengthmeasuring instruments for epidemiological use. The reliability of grip strength instrumentsis good [7].
Tenderness. Tenderness is a main sign of inflammation or other painful affections of themusculoskeletal system. Its main advantage is that it gives direct information about thelocation of the painful structure, thereby guiding to pinpoint which structure is disordered.Palpation, superficial or deep, or percussion of tenderness is therefore perhaps the mostuniversally used examination method for many structures - bones, joints, muscles, tendonsand nerves.

20
Unfortunately the literature shows that palpation of tenderness has varying reliability.Inter-examiner reliability among neck patients ranged between poor-good (κ=0.2-0.6;prev.=10-20%) in different locations [235] and fair among the working population (κ=0.5,prev.=5%). Algometers, with which applied pressure can be controlled, have been used forthe assessment of the pressure pain thresholds, a measure of tenderness. Reported reliabilityis good [168].
Provocation of compression of nerves. Compression of peripheral nerves is in early stagesoften intermittent and restricted to provoking situations. Nerve compression tests aredesigned to provoke similar compressions in a controlled manner. The nerve roots arecompressed with the “neck compression test” [192], the brachial plexus with the AbductionExternal Rotation (AER) test [173], and the median nerve at the wrist with Phalen´s test.Inter-examiner reliability of the neck compression test was fair-excellent (κ=0.4-0.8),specificity 0.9-1. and sensitivity 0.4-0.6 using a combination of neurological andradiological signs as criteria for “true” root compression (prev.=58%) among neck patients[236]. The validity of the Phalen´s and other nerve compression tests has been questioned[33]. One study of the inter-examiner reliability of the AER test found it to be good amongthe working population (κ=0.6; prev.=10%) [8].
Other tests. Tests of the function of the peripheral nerves include tests of sensitivity to pain,to light touch and to vibrations. A study among neck-patients found fair-good inter-examinerreliability (κ=0.4-0.6; prev.=10-40%) [235].
Many other tests are available for assessment of early or late aspects of musculoskeletaldisorders. One example is measurements of tremor as an indication of fatigue [60].
1.9.8 Self-administered examination of signsData collection in epidemiological studies of musculoskeletal disorders is often resourceconsuming. Data regarding symptoms are therefore most often collected using self-administered questionnaires instead of medical histories or other personal interviews. Dataregarding signs are collected mainly by traditional medical examination. This is time- andresource consuming as each subject has to be seen personally.
By analogy with self-administered questionnaires for symptoms, signs might also beassessed through self-administered examinations. If the subjects observe themselvesaccording to an examination protocol, resources may be saved in epidemiological studies.
Self-administered examinations have been used in clinical medicine, e.g. for signs amongpatients with rheumatoid arthritis [134]. There are examples where an approach somewhatsimilar has been used in epidemiological studies, with questions such as “Can you -washyour hair completely (even behind); - lift a full bottle (1 l) with your arm outstretched?”[159]. Data from these kinds of questions can however not be used for “diagnoses”regarding affections of the musculoskeletal system. More specific data are needed, e.g. signsof tenderness at a specific point observed with a specific examination method.
Few epidemiological studies have used specific self-administered examinationprocedures. In one however, the outcome of a mailed, self-administered examinationprotocol, regarding 4 different rheumatological signs of hand dysfunction, compared quitefairly to the findings in a subsequent medical examination [41, 167]. The authors concludedthat the test was able to identify subjects with hand impairment and could be

21
used as a screening instrument, as only subjects positive in the self-administered testneeded clinical investigation in epidemiological studies of hand disability.
No self-administered methods suitable for examination of the neck and upper extremi-ties are however reported. Such methods should therefore be developed and evaluated.
1.9.9 ”Diagnoses” and syndromesAs was shown in section 1.4, proxies and syndromes are used in diagnostics in epidemi-ological settings. Decision rules and criteria are developed e.g. for neck/shoulder andcarpal tunnel ”diagnostics” [135, 222].
Figure 5 illustrates the principal model for ”diagnostics” applied in this thesis. Co-existing symptoms and signs, each fulfilling separate criteria, constitute the main crite-ria for positive syndromes. Other data, e.g. medical histories, laboratory tests, nerveconduction measurements are also used. Note that criteria for syndromes could includeruling out other ”diagnoses” or syndromes. For example the more specific ”cervicalsyndrome” rules out the more vague ”neck/shoulder pain syndrome”. Conditions that donot fulfil the criteria for any syndrome will end up as a ”unspecific disorder” or as asymptom ”diagnosis”, e.g. cervicalgia.
Medical history Symptoms Signs Other data
Criteria
Syndrome Unspecific disorderSymptom ”diagnosis”
Figure 5. Model for ”diagnostic” procedures in the epidemiological studies in this thesis.
1.10 The starting points for the studies in this thesis
As mentioned above, self-administered assessment of symptoms and signs could saveresources in epidemiological studies. Pain drawing is such a method to record the loca-tion of symptoms and self-administered examination a method to record signs. Methodsfor such examination of signs and high resolution pain drawing in the neck and upper-extremities were however not previously available. Development and evaluation of suchmethods was therefore started. Ratings of exposure and effect variables is another self-administered method used in epidemiological studies. The postulated, and above men-tioned, high and low rating behaviour could introduce serious bias in risk estimatesbased on such ratings. This phenomenon was not previously addressed in research andtherefore became one of the topics in the studies constituting this thesis.
Work related disorders have primarily been attributed to load factors on the muscle-tendon systems, but also to compression of the peripheral nerves in the neck and upperextremities. Compression of the brachial plexus was not much studied in the workingpopulation. The diagnosis of this compression is based mainly on symptoms and

22
medical examination, where the AER test has been used, but mainly in patient groups. Theapplication of this test to epidemiological studies of the working population with possiblemild compression disorders should therefore be tested.
Psychosocial working conditions have been recognised as important risk factors formusculoskeletal disorders. The causal relations are unclear. The validity of the muscle-tension theory as a mediator of these relations could be tested by studying the locations andcharacter of symptoms and signs associated with such conditions.

23
2. Aims and hypotheses
The over all aim of this thesis was to develop, evaluate and characterise some assessmentmethods used within epidemiological studies of work-related musculoskeletal disorders inthe neck and upper extremities.
The specific aims and hypotheses were:
1 to study associations between work-related exposure factors and the outcome of theabduction external rotation (AER) test (Studies I and II)
2 to study the incidence and prognosis of signs in the AER test and also prognostic factorsof and for such signs (Study II)
3 to evaluate self-administered examination of signs in the musculoskeletal system in theneck and upper extremities (Study III)
4 to study the association between self-rated psychosocial work conditions and thecharacteristics and location of musculoskeletal symptoms, signs and syndromes (StudyIV)
Hypotheses were formulated proposing that: symptoms, signs and syndromes associatedwith stressful psychosocial work conditions are located to central body regions ratherthan to peripheral regions and that the findings in medical examinations are signs ofmuscular (soft-tissue) tenderness rather than signs of affections of nerves, joints,muscular insertions or tendons.
5 to study pain drawing characteristics among the general working population withsymptoms, signs and syndromes in the neck and shoulder regions, how markings aredistributed and how this can be assessed (Study V)
Hypotheses were formulated proposing that: pain drawings among subjects withsymptoms of long duration, high intensity, or that are severe would have more separateloci, larger areas and more bilateral and left-right symmetrical distributions.
6 to study whether there is a range of high and low rating behaviour among subjects inepidemiological studies of musculoskeletal disorders and whether there are effects onrelative risk estimates when such rating behaviour is stratified for (if both exposure andoutcome are rated by the same subject) (Study VI).

24
3. Subjects and methods
3.1 Subjects and main outlines
Totally 1083 subjects, 431 women and 652 men, participated in one or two of the six studiesin this thesis. All belonged to one of three separate epidemiological study groups of activeworkers. Their total age span was 20-64 years.
Study groups I and II were part of a study about health effects of exposure to vibratinghand-held tools (EPIVIB study). The 186 participants in study I were all men: all available71 steel-platers at a paper- and pulp-mill machinery factory (mean age 32 years), all 70assemblers at a truck factory (25 years), and 45 randomly selected office workers at the firstfactory (37 years). All except the office workers were currently exposed to vibrating hand-held tools, mainly grinders, hammers, nut runners, and screwdrivers. All the participants instudy II were men from the paper- and pulp-mill machinery factory. Of the 241 subjects, 151were examined at the baseline in 1987 (mean age 35 years) and 229 at the follow up in 1992(40 years), whereof 139 on both occasions. The most common occupations wereconstruction engineer or other office worker, steel plater, turner, assembler. Medianseniority was about 7 years. About 40% were exposed to vibrating hand held tools, whereof65% grinders and 25% hammers.
The study groups in studies III and IV formed part of a methodological project, the majoraim of which was to develop and evaluate different methods measuring exposure and effectsin epidemiological studies of WRMSD (MUSIC I study). Two specific occupational groupswere included, 83 male furniture movers (median age 35 years) and 89 female medicalsecretaries (41 years), together with 96 male (41 years) and 90 female (43 years) samplesfrom the population aged 20-64 in Stockholm county. Eight of these totally 358 subjects didnot participate in study III for technical reasons.Subjects in studies V and VI were part of a follow-up examination of a cohort from 1970(REBUS-93 study). Totally 484 subjects were examined (all in the age range 40-59 years),252 women (mean age 48 years) and 232 men (49 years). The most common occupationsamong women were nursing, day-care and office work and among men office,manufacturing or technical work.
All studies were approved by the local ethical committees.
3.2 Methods
3.2.1 Symptom recordingData about symptoms from the musculoskeletal system were collected from all subjects, butwere not reported in study III. Studies I, II, and IV used modified versions of the NordicQuestionnaire [110]. "Symptoms" were defined as continuous ache, pain on movement orloading of muscles and joints, or other sensations of discomfort, such as numbness ortingling. Subjects were asked to separately report "current" symptoms and those experienced"ever during the past 12 months" (study IV). Symptoms were separately recorded from theneck, shoulders, elbows-forearms, wrists-hands, thoracic back, lumbar back, hips-thighs,knees or ankles-feet (Figure 4). Studies I and II also recorded day- or night-time numbnessin the hands.
Studies V and VI recorded symptoms through a structured medical interview, with similardefinitions of symptoms as above.

25
3.2.2 Medical examinationAll subjects were medically examined following similar strict examination protocols, but theresults are not used in study VI. The examinations in studies I and II were performed by thesame physician (except those of the assemblers). Subjects in studies III and IV wereexamined by one of eight physicians and in study V by one of two physicians orphysiotherapists. The examiner in all studies was blinded to exposure conditions andsymptoms.
To enhance the reliability and validity of the examination, special training in examinationmethods and evaluation was given during practical seminars (with an experiencedorthopaedic surgeon as a tutor in studies III-IV). Videorecordings and photographs wereused to define standard examination methods, with check-ups during the study progress.
Data on inter-examiner reliability of the medical examination in studies III and IV wasfair-good for tests of tenderness, range of joint motion, pain at resisted muscular contractionand nerve compression (κ=0.5-0.6). Inspection had poorer results (κ=0.3) and tests of neuro-motor functions gave very low or uncertain values due to few positive findings.
The totally 43 medical examination items reported in studies I-V are described togetherwith definitions of positive signs in Table 1. The items covered the most common aspects ofconventional medical examinations of this kind: inspection = sign of deviation in jointalignment, muscular waste etc (items 1, 41); restricted range of motion = sign ofmalfunction mainly of the joints (items 2, 3, 8-10, 37, 39); pain on resisted muscle-contraction or forced joint motion = signs mainly of “tendinitis” (items 4, 11-13, 21, 27,35); tenderness = local pressure pain (items 5, 6, 14-16, 20, 22, 24, 34, 36, 38, 40, 42); testsof sensitivity = malfunction of peripheral nerve function (items 31-33, 43); provocation ofnerve compression or other stress (item 7, 17-19, 23, 28-30); restriction of range of fingerflexion = sign of inflammatory disease (item 26); joint laxity = sign of hypermobile joint(item 25).

26
Table 1 Descriptions and definitions of positive signs in items of the medical examination in studies I-V.(ext.=extension; flex.=flexion; lat.=lateral; max.=maximal; N=Newton; rot.=rotation; vol.=voluntary)
No. Item Study Description Positive sign
1 Shoulder asymmetry II,III Inspection of shoulder area Either shoulder higher ormuscle hypo/hypertrophy
2 Neck rotation range III-V Max. vol. rot. <60o
3 Neck flex./extension range III-V Max. vol. flex. and ext. Either <45o
4 Neck contraction pain I Active shoulder elevation, neck Either contractionflex. and ext. against resistance painful
5 Neck tenderness I,III-V Palpation interspinally and Distinct tendernessparavertebrally of C2-C7 either site
6 Trapezius tenderness I,III-V Palpation of trapezius muscle Distinct tendernessdescending parts
7 Neck compression test I,II,IV,V Lat. flex. + rot. of neck + Pain, numbness or tinglingaxial compression in upper extremity
8 Shoulder abduction range III,IV Max. vol. abduction <180o
9 Shoulder external rot. range III,IV Max. vol. external rotation <60o
10 Shoulder internal rot. range IV Max. vol. internal rotation <80o
11 Shoulder abduction I,III-V Active abduction 0-90o Contraction painfulpain against resistance
12 Shoulder external I,III-V Active external rot.(0o abduction, Contraction painfulrotation pain 90o elbow flex.) against resistance
13 Shoulder internal I,IV,V Active internal rot.(0o abduction, Contraction painfulrotation pain 90o elbow flex.) against resistance
14 Rotator cuff tenderness I,III-V Palpation of whole rotator cuff Distinct tenderness15 Tender point at III Push finger with 15N on belly Much more tender than
supraspinous muscle of supraspinous muscle 15 N push on belly ofquadriceps femoris,extensor digitorum,tibialis anterior
16 Tender point at III Push finger 15 N on origin As No. 15trapezius muscle origin of trapezius muscle on Th2-3
17 Abduction, external I-V Bilateral abduction 90o+ ext. Numbness, tingling,rotation test (AER test) rot. 90o+elbow flex. 90o+ sharp pain in upper
fist clench/release during extremities (+neck/1 minute (study III-V) 3 min (I;II) shoulders in I)
18 Upper extr. nerve stretch II (Supine) Head contralat. rot. +flex. + Pain, numbness orshoulder ext. + arm axial traction tingling in upper extremity
19 Supraclavicular compression II Push with thumb caudally in Pain, numbness or tinglingsupraclavicular fossa in upper extremity
20 Lat. humeral epicondyle IV Palpation of forearm extensor in- Distinct tendernesstenderness sertions on lat. humeral epicondyle
21 Wrist extension pain III,IV Active wrist extension against Contraction painfulresistance
22 Frohse´s arc local tenderness IV Palpation of Frohse´s arc Only local tenderness23 Frohse´s arc radiating pain IV Palpation of Frohse´s arc Deep forearm pain24 Wrist tenderness IV Palpation of wrist joint, Distinct tenderness
extensor and flexor tendons either site25 Wrist joint laxity IV Forced maximal right hand: Either of:
-thumb abduction thumb parallel to forearm-extension finger parallel to forearm
26 Finger flexion deficit III Clench fists Fingers don´t reach palm27 Finkelstein´s test IV Forced wrist ulnar flex. Distinct radial wrist pain28 Phalen´s test I-IV Forced wrist flexion 90o Numbness, tingling or
during 1 minute pain in digits I-IV

27
Table 1 (continued)
No. Item Study Description Positive sign
29 Tinell´s sign, elbow II Tap with fingers 2-3 times Pain, numbness or tingling over median epicondyle in digit V
30 Tinell´s sign, wrist II,IV Tap with 2 fingers 3 times Pain, numbness or tinglingover carpal tunnel in digits I-IV
31 Sensitivity, median nerve II,III Gentle strokes with finger Sensitivity to touchon tip of digits I-IV clearly decreased
32 Sensitivity, ulnar nerve II,III Gentle strokes with finger Sensitivity to touchon tip of digit V clearly decreased
33 Sensitivity to vibrations II Tuning fork on MCP-joints II-V Sensitivity clearly decreased34 Erector spine tenderness IV Palpation of erector spine Distinct tenderness
muscles Th1-L535 Springing test IV Manual sagittal push on each Distinct pain
vertebrae Th1-L536 Interspinal tenderness IV Palpation interspinally of L1-S1 Distinct tenderness37 Spine lateral flexion range IV Max. vol. lat. flex. of spine with Distance of fingertip
fingertips sliding down the leg slide <17 cm38 Hip tenderness IV Palpation of femoral trochanter Distinct tenderness
major and piriformis muscle either site39 Hip rotation range IV Max. prone forced internal and Either internal rot.<35o
external rotation of the hip joint or external rot. <45o
40 Knee tenderness IV Palpation of patella tendon and Distinct tendernessedges, femoral-tibial joint, lat. and either sitemedial insertion of hamstrings
41 Hallux valgus IV Inspection of toe I Valgus deviation >15o
42 Foot tenderness IV Palpation of Achilles tendon, Distinct tendernessplantar fascia, metatarso- either sitephallangeal joint I
43 Sensitivity leg/foot IV Gentle strokes with finger on Sensitivity to touchpatella, lat. ankle, lat. edge of foot, clearly decreasedmetatarsal II-III and toe I either site
The AER test was carried out as described by Roos - 90o abduction and external rotationand elbow flexion (“hold up position” – Figure 6) together with simultaneous intermittentclosing and relaxing of the hands during 3 minutes (1 minute in studies III-V) [174]. Criteriafor positive neurological signs in the AER test were: pain, tingling or numbness in the neckor upper extremities. Vascular (cyanosis) and other signs (tiredness, stiffness) were recordedseparately, but are not reported here.
In study IV signs in some items were combined to form composite items, e.g. "spinemuscle tenderness" (tenderness in the extensor muscles in the neck, back or the descendingtrapezius), "joint tenderness" (tenderness in muscular insertions, tendons or joints in theupper or lower extremities or the back), "nerve compression" (nerve stress or compression inthe spine or upper extremities) (see Study IV for definitions).
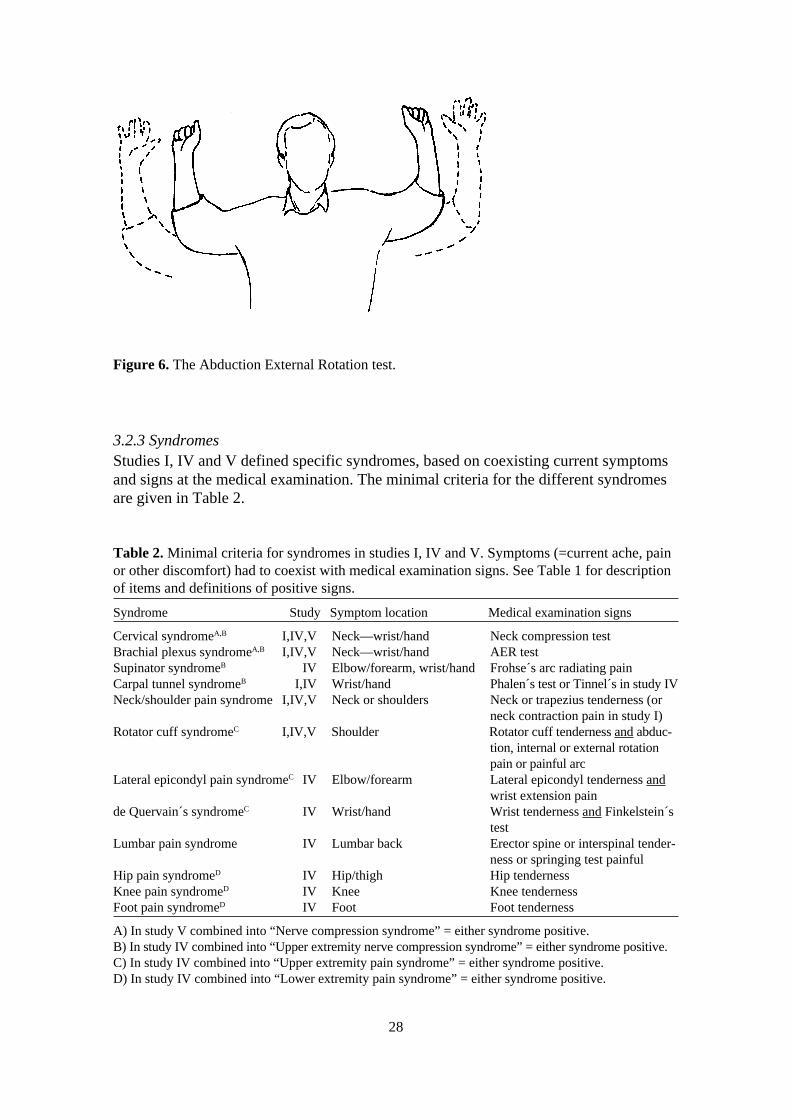
28
Table 2. Minimal criteria for syndromes in studies I, IV and V. Symptoms (=current ache, painor other discomfort) had to coexist with medical examination signs. See Table 1 for descriptionof items and definitions of positive signs.
Syndrome Study Symptom location Medical examination signs
Cervical syndromeA,B I,IV,V Neck—wrist/hand Neck compression testBrachial plexus syndromeA,B I,IV,V Neck—wrist/hand AER testSupinator syndromeB IV Elbow/forearm, wrist/hand Frohse´s arc radiating painCarpal tunnel syndromeB I,IV Wrist/hand Phalen´s test or Tinnel´s in study IVNeck/shoulder pain syndrome I,IV,V Neck or shoulders Neck or trapezius tenderness (or
neck contraction pain in study I)Rotator cuff syndromeC I,IV,V Shoulder Rotator cuff tenderness and abduc-
tion, internal or external rotationpain or painful arc
Lateral epicondyl pain syndromeC IV Elbow/forearm Lateral epicondyl tenderness andwrist extension pain
de Quervain´s syndromeC IV Wrist/hand Wrist tenderness and Finkelstein´stest
Lumbar pain syndrome IV Lumbar back Erector spine or interspinal tender-ness or springing test painful
Hip pain syndromeD IV Hip/thigh Hip tendernessKnee pain syndromeD IV Knee Knee tendernessFoot pain syndromeD IV Foot Foot tenderness
A) In study V combined into “Nerve compression syndrome” = either syndrome positive.B) In study IV combined into “Upper extremity nerve compression syndrome” = either syndrome positive.C) In study IV combined into “Upper extremity pain syndrome” = either syndrome positive.D) In study IV combined into “Lower extremity pain syndrome” = either syndrome positive.
Figure 6. The Abduction External Rotation test.
3.2.3 SyndromesStudies I, IV and V defined specific syndromes, based on coexisting current symptomsand signs at the medical examination. The minimal criteria for the different syndromesare given in Table 2.
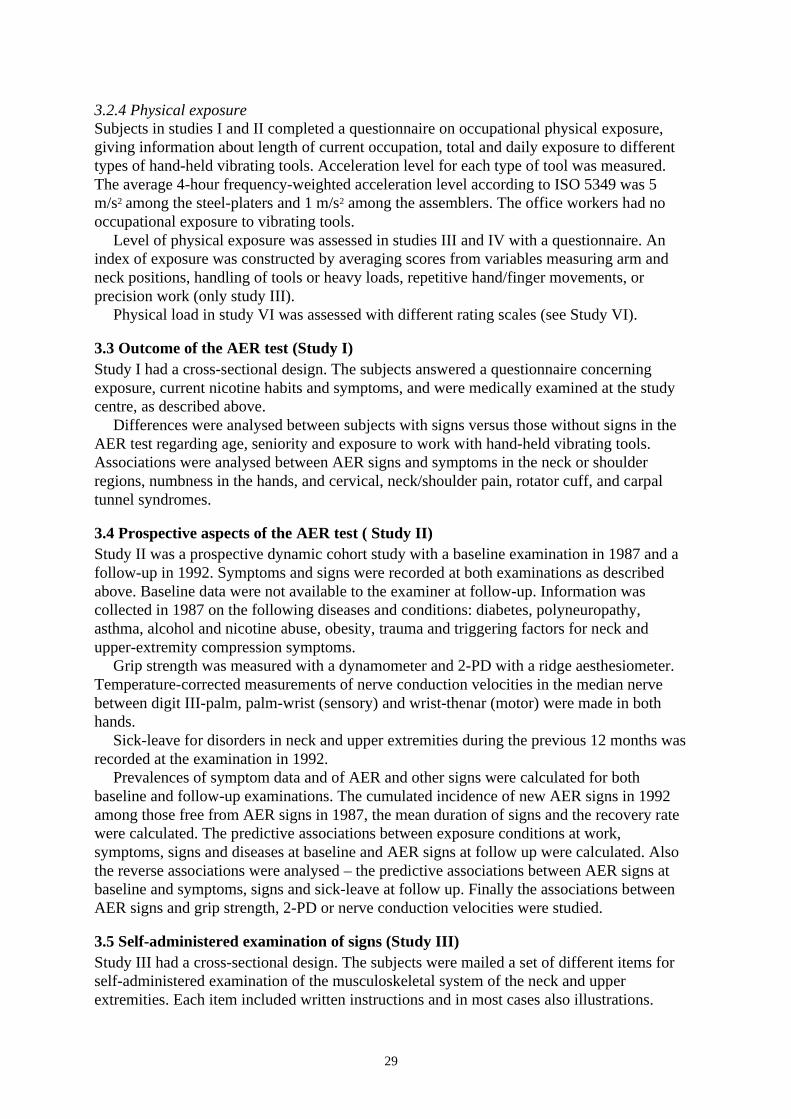
29
3.2.4 Physical exposureSubjects in studies I and II completed a questionnaire on occupational physical exposure,giving information about length of current occupation, total and daily exposure to differenttypes of hand-held vibrating tools. Acceleration level for each type of tool was measured.The average 4-hour frequency-weighted acceleration level according to ISO 5349 was 5m/s2 among the steel-platers and 1 m/s2 among the assemblers. The office workers had nooccupational exposure to vibrating tools.
Level of physical exposure was assessed in studies III and IV with a questionnaire. Anindex of exposure was constructed by averaging scores from variables measuring arm andneck positions, handling of tools or heavy loads, repetitive hand/finger movements, orprecision work (only study III).
Physical load in study VI was assessed with different rating scales (see Study VI).
3.3 Outcome of the AER test (Study I)Study I had a cross-sectional design. The subjects answered a questionnaire concerningexposure, current nicotine habits and symptoms, and were medically examined at the studycentre, as described above.
Differences were analysed between subjects with signs versus those without signs in theAER test regarding age, seniority and exposure to work with hand-held vibrating tools.Associations were analysed between AER signs and symptoms in the neck or shoulderregions, numbness in the hands, and cervical, neck/shoulder pain, rotator cuff, and carpaltunnel syndromes.
3.4 Prospective aspects of the AER test ( Study II)Study II was a prospective dynamic cohort study with a baseline examination in 1987 and afollow-up in 1992. Symptoms and signs were recorded at both examinations as describedabove. Baseline data were not available to the examiner at follow-up. Information wascollected in 1987 on the following diseases and conditions: diabetes, polyneuropathy,asthma, alcohol and nicotine abuse, obesity, trauma and triggering factors for neck andupper-extremity compression symptoms.
Grip strength was measured with a dynamometer and 2-PD with a ridge aesthesiometer.Temperature-corrected measurements of nerve conduction velocities in the median nervebetween digit III-palm, palm-wrist (sensory) and wrist-thenar (motor) were made in bothhands.
Sick-leave for disorders in neck and upper extremities during the previous 12 months wasrecorded at the examination in 1992.
Prevalences of symptom data and of AER and other signs were calculated for bothbaseline and follow-up examinations. The cumulated incidence of new AER signs in 1992among those free from AER signs in 1987, the mean duration of signs and the recovery ratewere calculated. The predictive associations between exposure conditions at work,symptoms, signs and diseases at baseline and AER signs at follow up were calculated. Alsothe reverse associations were analysed – the predictive associations between AER signs atbaseline and symptoms, signs and sick-leave at follow up. Finally the associations betweenAER signs and grip strength, 2-PD or nerve conduction velocities were studied.
3.5 Self-administered examination of signs (Study III)Study III had a cross-sectional design. The subjects were mailed a set of different items forself-administered examination of the musculoskeletal system of the neck and upperextremities. Each item included written instructions and in most cases also illustrations.

30
The subjects were instructed to record the results as marks on the illustrations, e.g. indi-cating points of tenderness or range of motion (Figure 7). Each item had the alterna-tives: “cannot decide” and “cannot perform the test”. Both left and right sides wereexamined. Items and definitions of positive findings are described in Table 3.
Figure 7. Two items from the self-administered examination in study III. Top: palpation oftenderness in the neck and shoulders. Bottom: range of movement on abduction of the arms.
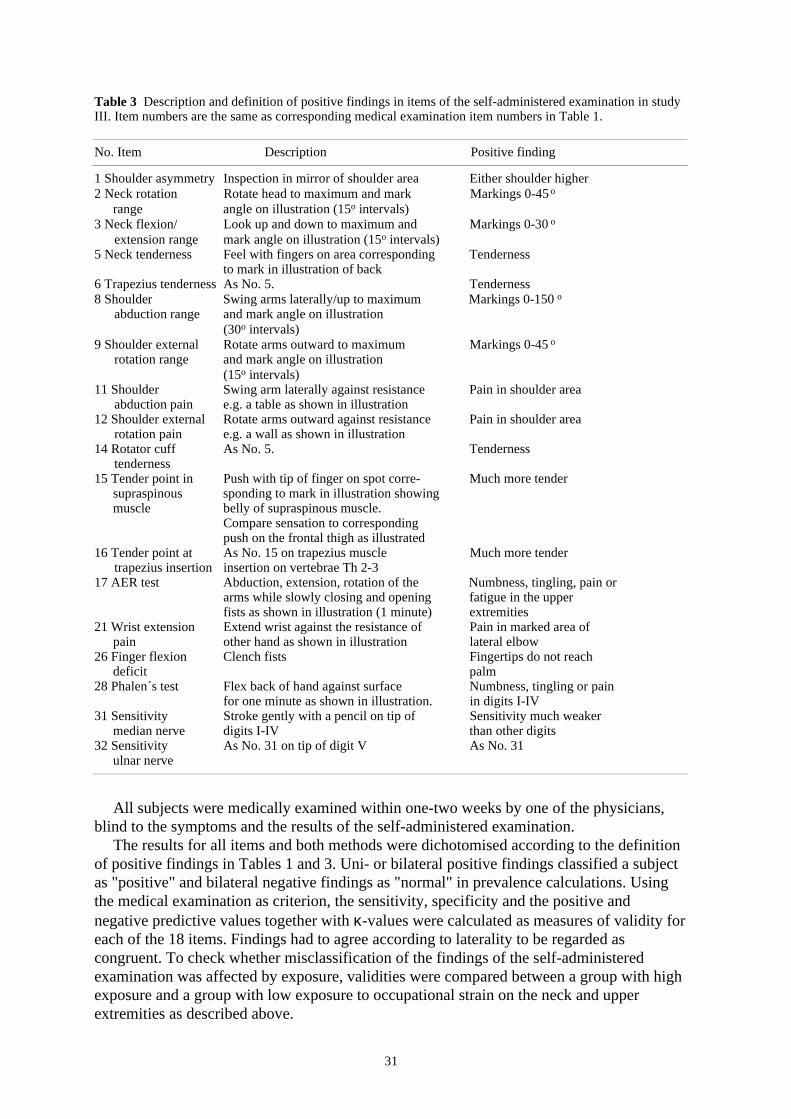
31
Table 3 Description and definition of positive findings in items of the self-administered examination in studyIII. Item numbers are the same as corresponding medical examination item numbers in Table 1.
No. Item Description Positive finding
1 Shoulder asymmetry Inspection in mirror of shoulder area Either shoulder higher2 Neck rotation Rotate head to maximum and mark Markings 0-45 o
range angle on illustration (15o intervals)3 Neck flexion/ Look up and down to maximum and Markings 0-30 o
extension range mark angle on illustration (15o intervals)5 Neck tenderness Feel with fingers on area corresponding Tenderness
to mark in illustration of back6 Trapezius tenderness As No. 5. Tenderness8 Shoulder Swing arms laterally/up to maximum Markings 0-150 o
abduction range and mark angle on illustration(30o intervals)
9 Shoulder external Rotate arms outward to maximum Markings 0-45 o
rotation range and mark angle on illustration(15o intervals)
11 Shoulder Swing arm laterally against resistance Pain in shoulder areaabduction pain e.g. a table as shown in illustration
12 Shoulder external Rotate arms outward against resistance Pain in shoulder arearotation pain e.g. a wall as shown in illustration
14 Rotator cuff As No. 5. Tendernesstenderness
15 Tender point in Push with tip of finger on spot corre- Much more tendersupraspinous sponding to mark in illustration showingmuscle belly of supraspinous muscle.
Compare sensation to correspondingpush on the frontal thigh as illustrated
16 Tender point at As No. 15 on trapezius muscle Much more tendertrapezius insertion insertion on vertebrae Th 2-3
17 AER test Abduction, extension, rotation of the Numbness, tingling, pain orarms while slowly closing and opening fatigue in the upperfists as shown in illustration (1 minute) extremities
21 Wrist extension Extend wrist against the resistance of Pain in marked area ofpain other hand as shown in illustration lateral elbow
26 Finger flexion Clench fists Fingertips do not reachdeficit palm
28 Phalen´s test Flex back of hand against surface Numbness, tingling or painfor one minute as shown in illustration. in digits I-IV
31 Sensitivity Stroke gently with a pencil on tip of Sensitivity much weaker median nerve digits I-IV than other digits
32 Sensitivity As No. 31 on tip of digit V As No. 31ulnar nerve
All subjects were medically examined within one-two weeks by one of the physicians,blind to the symptoms and the results of the self-administered examination.
The results for all items and both methods were dichotomised according to the definitionof positive findings in Tables 1 and 3. Uni- or bilateral positive findings classified a subjectas "positive" and bilateral negative findings as "normal" in prevalence calculations. Usingthe medical examination as criterion, the sensitivity, specificity and the positive andnegative predictive values together with κ-values were calculated as measures of validity foreach of the 18 items. Findings had to agree according to laterality to be regarded ascongruent. To check whether misclassification of the findings of the self-administeredexamination was affected by exposure, validities were compared between a group with highexposure and a group with low exposure to occupational strain on the neck and upperextremities as described above.

32
3.6 Psychosocial conditions and disorder characteristics (Study IV)
Study IV had a cross-sectional design. The subjects rated the following psychosocial workconditions at their current work: "psychological demands", "decision latitude" and "socialsupport". "Job strain" was defined as the ratio between "psychological demands" and"decision latitude". Subjects were categorised for each one of the four psychosocial indicesinto a "low", "medium" or "high" exposure group by cut-off points approximately at the 30-33:rd and 67-70:th percentiles respectively.
Symptom data from the previous year, medical examination signs, and syndromescovering all body regions, as described above, were used as effect variables. A few medicalexamination items less likely to be associated with occupational exposure were included as acheck of the validity of the results ("shoulder asymmetry", "wrist joint laxity", "hip rotationrange" and "hallux valgus").
Associations were analysed between psychosocial conditions and each effect variablecontrolling for physical load, gender and age. To demonstrate possible linear dose-effectrelations, comparisons were made between the high exposure group with the low group andthe medium group with the low group respectively. To underline pronounced associationsbetween the psychosocial conditions and effects, specific criteria were established(prevalence of effect variable ≥10% and prevalence ratio ≥1.5 and 95%ci ≥ 1.0 and a dose-effect relation).
3.7 Pain drawing (Study V)
Study V had a cross-sectional design. Those 125 subjects (83 women and 42 men, meanages=49 years) who reported symptoms in the neck, shoulders or upper back regions at themedical interview were asked to make a pain drawing of the distribution of their symptomson a body map (Figure 8). The distribution of the pain drawing markings was coded tocomputer files using a transparent grid of 878 pixels. The number of markings on each pixelwas summarised over subjects and plotted topographically. The individual left and right sideand total pain drawing areas were summarised. The degree of lateralisation was defined asthe ratio of the smallest/largest of the two areas, ranging from 1.0 (=evenly bilateral) to 0.0(=fully unilateral). Finally, the central-peripheral distribution was calculated as the meandistance from the central line. The congruence with dermatomes C2-C5 and Th2-Th3 wasjudged using a transparent dermatome map. The separate pain drawing loci were counted.Symmetry regarding left-right distribution and continuation to the arms was judged visually.
Information was obtained about the year of onset of symptoms, total number of days withsymptoms or sick-leave, medication and medical care during the past year due to thesymptoms. Intensity of ongoing symptoms was rated using a CR10 scale. Subjects withintensive, chronic or severe symptoms were identified (se notes in Study V/Table 1 forcriteria). Signs from the neck and shoulder regions were registered during a medicalexamination (Table 1) and the syndromes “nerve compression”, “neck/shoulder pain”, and“rotator cuff” were defined (Table 2). Both the medical interview and examination weredone before the pain drawing.
Associations between pain drawing characteristics and symptom intensity, chronicity andseverity and also signs and syndromes were analysed. Differences in pain drawingcharacteristics between genders, age-groups (40-49 versus 50-59) and high- and loweducational level were analysed. Inter-relations between pain drawing characteristics werecalculated.
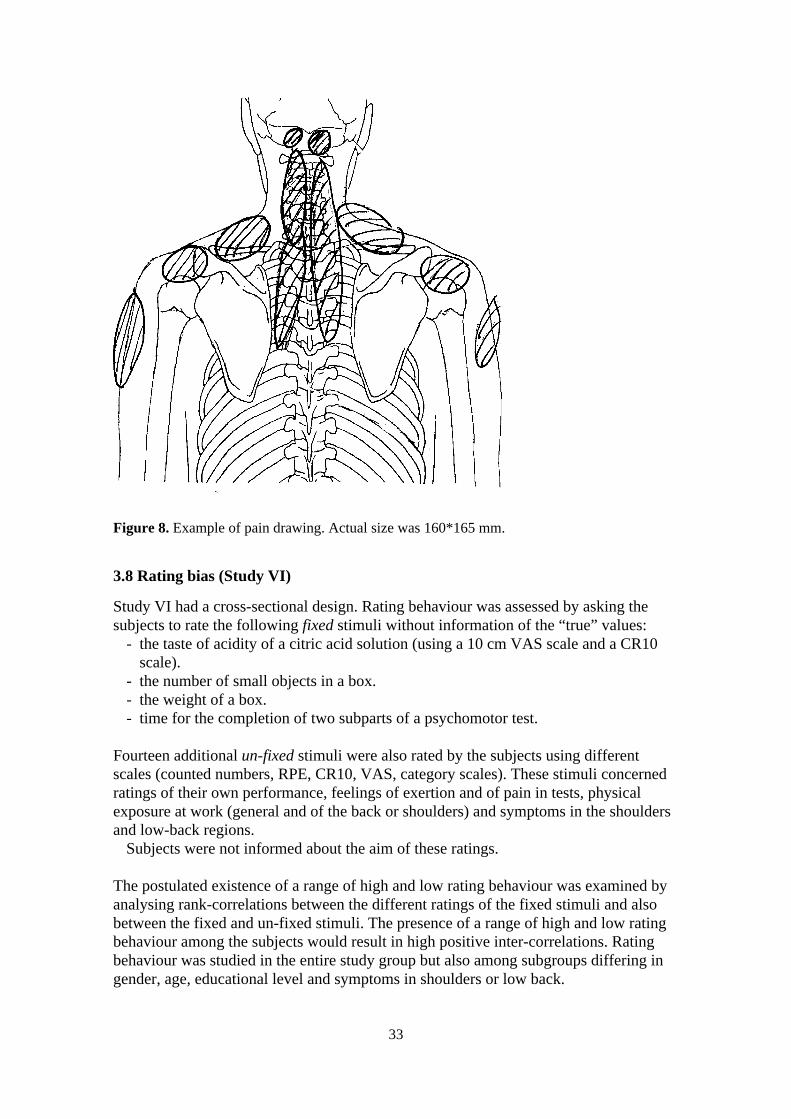
33
3.8 Rating bias (Study VI)
Study VI had a cross-sectional design. Rating behaviour was assessed by asking thesubjects to rate the following fixed stimuli without information of the “true” values:
- the taste of acidity of a citric acid solution (using a 10 cm VAS scale and a CR10scale).
- the number of small objects in a box.- the weight of a box.- time for the completion of two subparts of a psychomotor test.
Fourteen additional un-fixed stimuli were also rated by the subjects using differentscales (counted numbers, RPE, CR10, VAS, category scales). These stimuli concernedratings of their own performance, feelings of exertion and of pain in tests, physicalexposure at work (general and of the back or shoulders) and symptoms in the shouldersand low-back regions.
Subjects were not informed about the aim of these ratings.
The postulated existence of a range of high and low rating behaviour was examined byanalysing rank-correlations between the different ratings of the fixed stimuli and alsobetween the fixed and un-fixed stimuli. The presence of a range of high and low ratingbehaviour among the subjects would result in high positive inter-correlations. Ratingbehaviour was studied in the entire study group but also among subgroups differing ingender, age, educational level and symptoms in shoulders or low back.
Figure 8. Example of pain drawing. Actual size was 160*165 mm.

34
Subjects were categorised as "low", "medium" or "high" raters by cut-off pointsapproximately at the 33:rd and 67:th percentile of the average relative rank of ratings of thefour fixed stimuli. The potential effects of rating behaviour on relative risk estimates wasanalysed by comparing crude relative risk estimates with estimates based on stratificationfor rating behaviour.
3.9 Statistical methods
Most of the reported associations were positive. "Association" in the text is therefore usedfor "positive association". Un-adjusted or adjusted prevalence ratios (PR) and cumulatedincidence rates (CIR) have been calculated as measures of association for discontinuousvariables in studies II-V. Study I used the Chi2 test. Stratification in adjusted analyses wasmade according to the method described by Mantel-Haenszel [129]. Confidence intervalswere test-based [144]. Correlation coefficients have been calculated as measures ofassociations between continuous variables in study V (product-moment) and VI (rank).
A multiple logistic regression analysis was undertaken in studies I and II using the AERtest outcome as dependent variable.
Tests of differences between continuous variables used Students t-test in studies I and II.All confidence intervals were calculated at the 95% level (95% ci). Reported p-values
were two-tailed.
35
4. Results
4.1 Outcome and prospective aspects of the AER test (Studies I and II)
Prevalences of positive AER signs varied between 31% among the platers, 16% amongwhite-collar workers and 6% among assemblers in 1987 (Study I). The cumulated incidenceof AER signs between 1987-92 was estimated to 1.7/100 person-years, the recovery rate to9.4/100 case-years, and the mean duration of AER signs to 17.7 years. The majority, 70% ofthe subjects, never showed any AER signs.
There was an expected high association between AER signs in 1987 and 1992 (PR= 6.295% ci=3.3-12.). Numbness in the hands, positive signs during provocation of nervecompression or other stress tests of the upper extremity nerves, a decreased sensitivity tovibrations or to touch on the finger-tips, or asymmetric height of the shoulders in 1987 werealso strongly associated with both prevalent and incident AER signs 5 years later (Table 4).
Seniority in current work was clearly associated with prospective AER signs. Exposure towork with vibrating hand-held tools was higher among subjects with AER signs and wasassociated with both prevalent and incident AER signs 5 years later (Table 4) (Study I/TableIII).
No substantial associations were noted regarding nicotine or alcohol abuse. Amongmedical conditions recorded in 1987, asthma, but not obesity or polyneuropathy wereassociated with prevalent AER signs in 19923. Previous trauma to the neck or shoulderregions, but not to the arms or hands, was associated with AER signs. Reports of triggeringfactors for neck or upper-extremity compression symptoms were strongly associated withAER signs (Table 4).
The multiple regression analyses confirmed the results from the bivariate analyses.Constitutional factors, previous trauma, medical and exposure conditions were independentrisk factors for prevalent AER signs (Study I/p 220; Study II/Table III).
AER signs in 1987 were associated with a higher frequency of symptoms in the shouldersand arms both prevalent and incident 5 years later. Strong associations were also seen withprevalent and incident numbness in the hands (Study II/Table IV). Positive AER signs in1987 predicted sick-leave due to disorders in the neck and upper extremities in 1992(PR=1.7-10.0 in different regions).
The sensory nerve conduction velocity in the median nerve on both hands was lower, i.e.indicating a decreased function, among subjects with signs at the 1992 AER test (StudyII/Tables V-VI). A small decrease in the sensory nerve conduction velocity between thepalm and the wrist in the right hand was seen during 1987-1992 among subjects whobecame AER-positive during that period. A decrease was also recorded among subjects withpersisting signs on both occasions. Those who lost the signs from 1987 or did not react withsigns either in 1987 or in 1992 had less substantial changes.
Grip strength in 1992 was about 5% lower among those with a 1992 AER sign thanamong those without. The 2-PD values from 1992 was higher, i.e. more pathological, amongthose with an AER sign in 1992 than among those without.
3 Only two subjects had diabetes, which was therefore excluded from further analysis.

36
Table 4 Symptoms, signs and conditions in 1987 predictive of AER signs 5 years later. Prevalence ratios (PR)and cumulated incidence ratios (CIR) with 95% confidence intervals (95% ci) and positive predictive values(PPV) for signs during the AER test in 1992 between subjects with specific symptoms, signs or conditions in1987 compared to those without. PR among all subjects (Prevalent; N=137) and CIR among subgroup ofsubjects without signs at 1987 AER test (Incident; N =105). n=number of subjects with specified symptom,sign or condition 1987.
Prevalent AER-signs 1992 Incident AER-signs 1987-92n PR 95% ci PPV n CIR 95% ci PPV
Symptoms 1987Neck-scapula 23 2.72 1.33-5.52 0.39 15 1.93 0.42-8.81 0.13Shoulders-upper arm 19 1.88 0.83-4.25 0.32 8 0 - -Elbow-forearm 20 2.80 1.34-5.85 0.40 10 0 - -Wrist-hand-fingers 23 3.58 1.77-7.22 0.43 12 1.06 0.14-7.99 0.08Sum neck-upper extr. 55 3.05 1.48-6.29 0.31 35 1.15 0.29-4.56 0.09Numbness in hands 39 5.65 2.91-11.0 0.46 22 7.55 2.44-23.3 0.27
Signs 1987Neck compression test 5 3.44 1.24-9.56 0.60 1 0 - -Upper extr. nerve stretch test 5 3.44 1.24-9.56 0.60 3 4.25 0.68-26.6 0.33Supraclavicular compression 7 3.38 1.37-8.35 0.57 1 0 - -Tinell´s test-elbow/ulnaris 9 4.28 2.00-9.09 0.67 3 4.25 0.68-26.6 0.33Tinell´s test-wrist/medianus 18 4.85 2.57-9.15 0.61 6 8.25 2.71-25.1 0.50Phalen´s test 17 2.12 0.95-4.74 0.35 10 2.71 0.64-11.6 0.20Either nerve compression test 31 4.66 2.46-8.83 0.48 13 3.54 1.02-12.3 0.23Sensitivity test of fingers 11 3.44 1.59-7.45 0.55 5 2.50 0.36-17.2 0.20Vibration test of fingers 4 4.34 1.60-11.7 0.75 1 13.0 2.79-60.6 -Shoulder asymmetry 15 1.94 0.82-4.60 0.33 11 2.44 0.57-10.5 0.18
Conditions 1987Age≥36 years 66 1.47 0.73-2.95 0.23 45 1.07 0.30-3.77 0.09Blue-collar work 80 1.49 0.70-3.17 0.22 61 2.52 0.59-10.8 0.11Seniority at work1 67 2.80 1.32-5.91 0.28 49 9.14 1.77-47.2 0.16Daily vibration exposure2 71 2.03 0.97-4.23 0.25 52 3.43 0.83-14.2 0.13Vibration exposure≥6 years 63 2.94 1.38-6.25 0.29 45 2.62 0.73-9.44 0.13High vibration dose3 57 2.84 1.54-5.25 0.28 26 6.08 1.89-19.5 0.23
Nicotine use 75 1.32 0.65-2.69 0.21 55 1.82 0.49-6.75 0.11Alcohol abuse4 10 1.03 0.28-3.79 0.20 8 1.47 0.20-10.7 0.13Obesity5 10 0.53 0.09-3.17 - 8 0 - -Asthma 10 3.02 1.31-6.99 0.50 4 0 - -Polyneuropathy 9 1.16 0.32-4.24 0.22 5 0 - -
Trauma to neck/shoulders 4 2.77 0.80-9.66 0.50 0 - - -Trauma to arms/hands 22 0.68 0.23-2.00 0.14 17 0.65 0.09-4.69 -Trigger factors6 7 4.42 1.98-9.89 0.71 1 0 -
1) Current work>7 years2) Work with vibrating hand-held tools >15 minutes/day3) Cumulated acceleration dose during lifetime above 75:th percentile ( >27 774 hours* m/s2)4) Pathological CDT-RIA, S-Alat and γ-GT5) Body mass index (weight kg/length m2)≥ 286) Pain, numbness or paraesthesia in neck or upper extremities at work above shoulder level, specific sleeping
position, carrying of heavy objects etc.
37
4.2 Self-administered examination of signs (Study III)
The prevalences of positive findings in the self-administered examination varied between 2and 47% among the different items (Study III/Table 2). The highest values were noted onitems measuring tenderness and on the AER test. The corresponding prevalences in themedical examination varied between 1 and 20% with a similar distribution among the items.Ratios between prevalences from the self-administered examination and the medical variedbetween 1.2 and 14 (median 3.5) with 13 of 18 confidence intervals above 1.0.
The sensitivity values of the items in the self-administered test varied between zero andhigh (Study III/Table 3). The highest values (0.55-1.0) were noted for items of tenderness,finger flexion deficit, and the AER test. The specificity values were moderate to high (0.63-0.99), being lowest for tests of tenderness and for the AER test. The positive predictivevalues varied from 0 to 0.36 and the negative from 0.92 to 1.0. Finally, κ varied from 0 to0.50 being highest for tenderness and finger flexion deficit.
Results from the comparison of the high-exposure group with the low-exposure groupshowed a similar pattern. The item-specific differences in validity values between the twogroups were mostly small and all 95% confidence intervals included zero, except in 3 cases.
On average 23% of the subjects failed to mark a positive or a negative finding on thedifferent items. This included 15% who returned blank examination sets, 4% no answers onspecific items, 3% answers "Cannot decide" and 1% "Cannot perform the test". The highestfrequencies of missing data were noted on tender points (Nos. 15 and 16). The results of themedical examination did not, however, differ substantially in a systematic way between this"missing data" group and the others. Ratios between prevalences ("missing data"group/others) of positive findings at the medical examination varied between 0.0 and 5.8among the different items (median 1.2). The proportion of subjects with high occupationalphysical exposure was about the same in the "missing data" group and the others. Ratiosvaried from 1.1-1.4 (median 1.3).
4.3 Psychosocial conditions and disorder characteristics (Study IV)
The variation in self-rated psychosocial exposure was high, judging from the standarddeviations in the total group and means and ranges in the high-, medium- and low-exposuregroups. Females, the low age group and those with high physical load tended to report moreunfavourable psychosocial work conditions.
The most common symptoms were found from the neck, shoulder and lumbar backregions. Pronounced associations with the psychosocial variables were seen regarding theneck, back and hip regions (Figure 9)(Study IV/Table 2). Somewhat weaker associationswere seen between social support and symptoms from many body regions except shoulders,which showed no substantial association with any of the exposure variables. The index"decision latitude" had very few associations with any of the effect variables.
The most frequent and pronounced associations to signs were noted from the neck,shoulder, arm and back regions (Figure 9)(Study IV/Table 3). All pronounced associationswere to signs of tenderness, mainly in muscles (soft tissues). Scattered associations, howevermostly not fulfilling the criteria for pronounced association, were also seen. Among thesummary variables, only "spine muscle tenderness" showed pronounced associations,mainly with psychological demands and job strain. No substantial
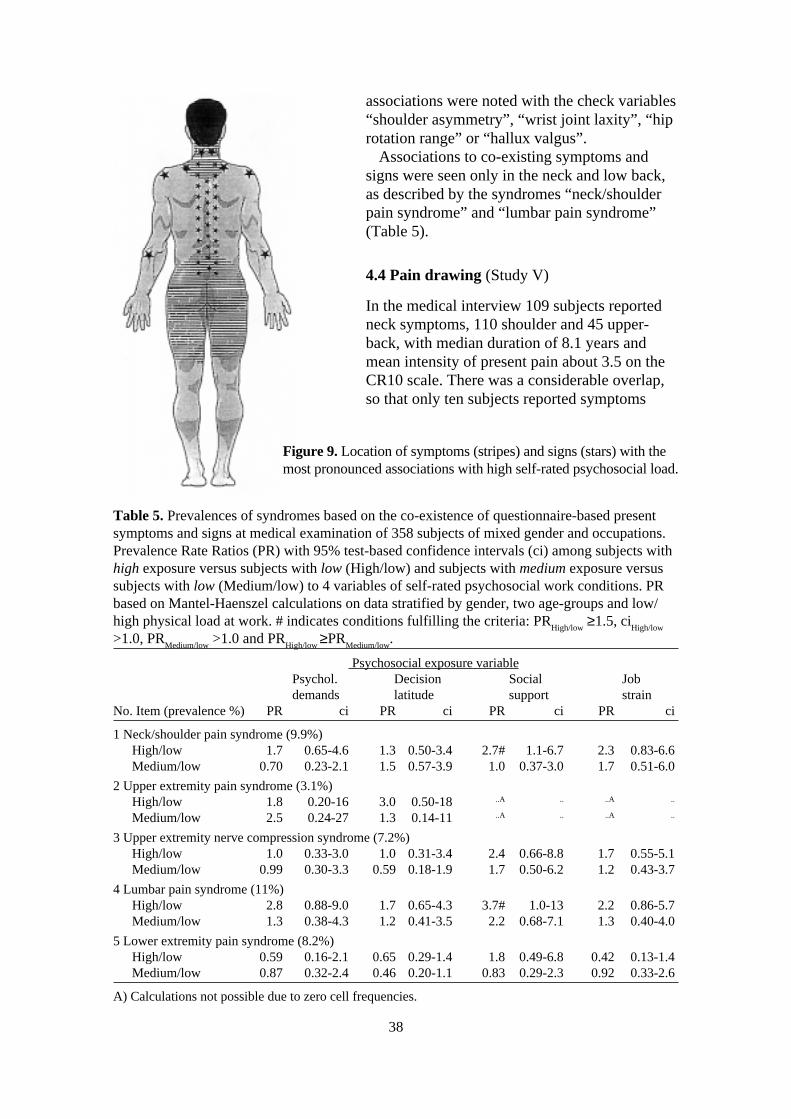
38
associations were noted with the check variables“shoulder asymmetry”, “wrist joint laxity”, “hiprotation range” or “hallux valgus”.
Associations to co-existing symptoms andsigns were seen only in the neck and low back,as described by the syndromes “neck/shoulderpain syndrome” and “lumbar pain syndrome”(Table 5).
4.4 Pain drawing (Study V)
In the medical interview 109 subjects reportedneck symptoms, 110 shoulder and 45 upper-back, with median duration of 8.1 years andmean intensity of present pain about 3.5 on theCR10 scale. There was a considerable overlap,so that only ten subjects reported symptoms
Table 5. Prevalences of syndromes based on the co-existence of questionnaire-based presentsymptoms and signs at medical examination of 358 subjects of mixed gender and occupations.Prevalence Rate Ratios (PR) with 95% test-based confidence intervals (ci) among subjects withhigh exposure versus subjects with low (High/low) and subjects with medium exposure versussubjects with low (Medium/low) to 4 variables of self-rated psychosocial work conditions. PRbased on Mantel-Haenszel calculations on data stratified by gender, two age-groups and low/high physical load at work. # indicates conditions fulfilling the criteria: PR
High/low ≥1.5, ci
High/low
>1.0, PRMedium/low
>1.0 and PRHigh/low
≥PRMedium/low
.
Psychosocial exposure variablePsychol. Decision Social Jobdemands latitude support strain
No. Item (prevalence %) PR ci PR ci PR ci PR ci
1 Neck/shoulder pain syndrome (9.9%)High/low 1.7 0.65-4.6 1.3 0.50-3.4 2.7# 1.1-6.7 2.3 0.83-6.6Medium/low 0.70 0.23-2.1 1.5 0.57-3.9 1.0 0.37-3.0 1.7 0.51-6.0
2 Upper extremity pain syndrome (3.1%)High/low 1.8 0.20-16 3.0 0.50-18 ..A .. ..A ..
Medium/low 2.5 0.24-27 1.3 0.14-11 ..A .. ..A ..
3 Upper extremity nerve compression syndrome (7.2%)High/low 1.0 0.33-3.0 1.0 0.31-3.4 2.4 0.66-8.8 1.7 0.55-5.1Medium/low 0.99 0.30-3.3 0.59 0.18-1.9 1.7 0.50-6.2 1.2 0.43-3.7
4 Lumbar pain syndrome (11%)High/low 2.8 0.88-9.0 1.7 0.65-4.3 3.7# 1.0-13 2.2 0.86-5.7Medium/low 1.3 0.38-4.3 1.2 0.41-3.5 2.2 0.68-7.1 1.3 0.40-4.0
5 Lower extremity pain syndrome (8.2%)High/low 0.59 0.16-2.1 0.65 0.29-1.4 1.8 0.49-6.8 0.42 0.13-1.4Medium/low 0.87 0.32-2.4 0.46 0.20-1.1 0.83 0.29-2.3 0.92 0.33-2.6
A) Calculations not possible due to zero cell frequencies.
Figure 9. Location of symptoms (stripes) and signs (stars) with themost pronounced associations with high self-rated psychosocial load.

39
solely from the neck, eleven solely from the shoulders and none from the upper-back.The distributions of the markings in pain drawings among subjects reporting symptomsfrom either region were consequently similar to that of the total group (Figure 10). Dis-tributions among subjects reporting solely either neck or shoulder symptoms were how-ever unique (Figure 11a-b).
On average two separate loci were marked on the pain drawings (range 1-10), cover-ing a total area of 96 pixels (range=8-332), and corresponding to approximately 3.5% ofthe total rear body surface area or about the area of both palms (StudyV/Table 1). The
Figure 10. Topographical diagram of aggregated pain drawings. Darker shades indicates higherfrequency of markings. Subjects with symptoms in the neck, shoulders or upper back. n=125.

40
average right side area was 50 pixels and left side 46 pixels. A difference of up to 4pixels (1 cm2) between right and left sides was seen in 25 drawings and 32 were fullyunilateral (16 each side). The mean distance from the central axis was about 6 pixels(=distance from spine to inferior angle of scapula). Half of the pain drawings werejudged to be symmetrical. Somewhat fewer were congruent with dermatomes, mainlythe C3 and C4, (43 left and 44 right). Even fewer indicated symptom continuation toarm-hand regions (13 left and 16 right). Women made pain drawings with more separateloci than men did (2.5 versus 1.7; 95%ci of difference=0.17-1.34), larger areas (106versus 77 pixels; 95%ci=3.70-53.3) and more bilateral (ratio=0.59 versus 0.42;95%ci=0.02-0.31), central (distance=5.9 versus 6.7 pixels; 95%ci=-1.89-0.27) and sym-metric distribution (55 versus 38%; 95%ci=0-36). No significant differences were asso-ciated with age or educational level.
No substantial or systematic associations could be seen between the pain drawingcharacteristics and reports of different symptom qualities – ache, pain, tenderness orstiffness.
Subjects with chronic symptoms made pain drawings with more separate loci andlarger areas, and those with severe symptoms made pain drawings with larger areas thansubjects with symptoms of shorter duration or less severity (Study V/Table 1). Therewas a tendency for subjects reporting more intense ache or pain in either region to makepain drawings with more separate symptom locations or larger areas. These associationsdiffered between the body regions. Intense neck symptoms were associated with moreseparate symptom locations of bilateral distribution. Intense shoulder symptoms wereassociated with larger unilateral distributed areas far from central axis and with continu-
Figure 11. Topographical diagram of aggregated pain drawings. Darker shading indicates high-er frequency of markings. A) Subjects with symptoms solely in the neck. n=10. B) Subjectswith symptoms solely in the shoulders. n=11.
A B

41
ation into the arms, and intense upper-back symptoms with small areas close to central axis.Subjects who were found to be tender in the neck and trapezius regions at the medical
examination made pain drawings with larger areas, more separate loci and more bilateral,central and symmetrical distribution (Study V/Table 2). Associations with other signs wereless pronounced.
The associations between syndromes and pain drawing characteristics were weak.Subjects with the “neck/shoulder pain syndrome” (n=65) tended to make more centrallylocated pain drawings with less indications of pain radiation to upper extremities. Subjectswith the “rotator cuff syndrome” (n=13), on the other hand, tended to make moreasymmetrical and peripherally distributed pain drawings. No clear patterns were seen amongsubjects with “nerve compression syndrome” (n=32).
The inter-correlations between the different continuous pain drawing variables were lowor modest. The maximum was noted between number of separate loci and the ratio ofsmallest/largest body side area (rxy=0.42). There was also, as expected, a positive associationbetween the categorical variable “symmetry” and the ratio of smallest/largest areas(PR=14.).
4.5 Rating bias (Study VI)
Inter-individual variation and range of ratings showed good distributions allowing studies ofhigh and low rating behaviour (Study VI/Table 1). Most variables followed a normaldistribution curve.
Correlations among the ratings of fixed stimuli were all close to zero and both positiveand negative (Study VI/Table 2). Correlations between ratings of fixed stimuli and un-fixedstimuli, exposure and outcome variables, respectively, were also mostly close to zero andboth positive and negative. Correlations between ratings using the same scale were also low(VAS, RPE and CR10 respectively). The correlation between the VAS and CR10 ratings ofacidity was high (r=0.84) as was the correlation between the 30 and 60 seconds timeestimations (r=0.70). No curve-linear relations were observed in plots of variable pairs.
Correlations between the ratings of fixed or un-fixed stimuli within each subgroup(gender, age, education, case-status) were also close to zero. No systematic differences wereobserved in the mean ratings of fixed or un-fixed stimuli between the different subgroups.Gender was connected to the most substantial specific differences. Mean ratings of fixedstimuli by gender (females/males) were: acidity 41.6/42.7 mm (diff=-1.08; 95% ci=-7.78 to5.62); count 81.4/69.4 pieces (diff=12.1; 95% ci=-0.88 to 25.0); weight 4.73/5.28 kg (diff=-0.55; 95% ci=-1.26 to 0.15); time 51.5/44.7 sec (diff=6.79; 95% ci=1.68 to 11.9).
Prevalence ratios for intensive symptoms and the selected exposures differed betweengenders. The stratified PR-values were therefore calculated separately for males and females(Study VI/Table 3). No substantial effects of adjustment for high, medium and low ratingbehaviour were noted among either group, even when other cut-off points on the symptom-scale were used for case-definition.

42
5. Discussion
The aim of this thesis was to develop, evaluate and characterise assessment methods usedwithin epidemiological studies of WRMSD in the neck and upper extremities. Specialattention was paid to self-administered methods, relations to psychosocial risk factors andsigns of nerve compression. Different occupational groups and general population samplesparticipated in the studies. Both cross-sectional and prospective study-designs were used.The quality of symptom assessments, medical examinations and “diagnostics” wereenhanced via special training procedures, strict protocols and predetermined criteria.
It was found that self-administered examination of signs is generally not valid with thepossible exception for examination of tenderness. It was also found that poor validity of self-ratings in epidemiological studies is probably not caused by high and low rating behaviouramong the subjects. Muscular and soft tissue tenderness and symptoms in central bodyregions were found to be associated with self rated unfavourable psychosocial conditions.Further, tenderness in the neck and trapezius muscle, and intense, chronic or severesymptoms, were associated with large painful areas as shown in self-administered paindrawings of the neck and shoulder regions. Finally, it was found that compression of thebrachial plexus, seen as signs at the AER test, was reversible and related to many factors,constitutional, disease, trauma, and work exposure.
5.1 Signs of nerve compression
This thesis found an annual incidence of new neurological AER signs of approximately2/100 person-years among mixed industrial and office workers. Further, the recovery ratewas estimated to about 9/100 case-years and the mean duration of neurological AER signs toabout 18 years. Compression of the brachial plexus is thus a long-lasting, but notirreversible, disease as judged by the AER test. This thesis has also shown that subjects withAER signs are at greater risk of suffering neck- and upper-extremity disorders with futuresick leave.
5.1.1 Possible mechanismsThe major pathogenic mechanism causing traumatisation of the brachial plexus is localmechanical compression of the neuronal bundle between skeletal or otherwise tight tissues,e.g. between the clavicle and first rib or between the scalene muscles [182]. Potentiallycompressive anomalies, such as fibrous bands or cervical ribs, in these regions are over-represented among patients suffering from compression neuropathies but are also seenamong a general population [94, 173]. Mechanical traction/stretching during jointmovements, e.g. in the case of tethered nerve bundles can have harmful effects on theperipheral nerves similar to compression [97]. Friction between the neuronal bundle andsurrounding tissues during tendon or joint movements is another possible cause. Single necktraumata, mainly due to car or work-related accidents, iterative traumata due to repetitiveneck and upper extremity movements or awkward working postures and persisting traumatadue to anatomical (mal-) formations are possible trauma sources.
As shown in section 1.5.2, these traumatisations are believed to cause intraneuralischaemia and oedema with further compression and successive dysfunction. Throughinterference with the forward and retrograde axonal transport mechanism, a local

43
compression can cause dysfunction along the whole length of the nerve, both proximally anddistally.
The theory of “double or multiple crush” postulates that traumatisation of a peripheralnerve, e.g. due to compression, makes the nerve axon more vulnerable to furthercompression along its total distribution from the spine to the peripheral endpoint [34, 128,215]. There are several narrow spaces where axons passing the brachial plexus can becompressed (naming the compressed part of the nerve):
-the intervertebral foramina (spinal roots and dorsal root ganglia)-anomalies in the neck - cervical rib, fibrous bands (brachial plexus)-the scalene muscles (brachial plexus)-the costo clavicular space (brachial plexus)-the minor pectoral muscle (brachial plexus)-sulcus ulnaris and cubital tunnel (ulnar nerve)-supinator muscle (deep branch of radial nerve)-pronator teres muscle (median nerve)-carpal tunnel (median nerve)-Guyon´s canal (ulnar nerve).
This theory applied to the upper extremities could thus explain the associations found in thisthesis between signs of nerve compression in the brachial plexus and signs of nervecompression in the intervertebral foramina in the cervical spine, the cubital tunnel in theelbows, and the carpal tunnel at the wrists. These associations were found both for prevalentand incident signs from both baseline and follow-up examinations in studies I and II. Suchmultiple compressions have been described among patients suffering from TOS [244].
Further support was found in this thesis for the “double or multiple crush” theory in thatsubjects with AER signs had lower nerve conduction velocities in the hand regions, mainlythe wrists. Moreover, subjects with persisting or new AER signs in 1992 compared to 1987tended to have an approximately 10% decrease in velocity in the right wrist. Those who losttheir AER signs during this period showed a slight normalisation and those with no signsshowed the least change in conduction velocities. Previous studies of patients suffering fromcompression of the brachial plexus have found similar impaired nerve conduction findingsin severe cases [158].
Upper-extremity nerve compression can lead to a rise in the perception thresholds of thevibration and skin-touch receptors in the hands. Further, long-lasting or severe compressioncan reduce the muscle strength and the innervation density in the fingers [154]. Thesephenomena were confirmed in this thesis, as the AER signs were strongly associated withnumbness in the hands and with decreased sensitivity to touch and vibration of the fingers.A slight decrease in grip strength and 2-PD discriminating capacity in the fingers was alsonoted among subjects with AER signs.
5.1.2 Relations to work and other risk factorsBoth work-related factors and those related to constitution, disease and trauma were foundto be risk factors for AER signs in this thesis.
Study II revealed seniority at work, but not age, as the most prominent risk factor forincident AER signs. Exposure to work conditions where hand-held vibrating tools are usedwas associated with AER signs in both the cross-sectional and the prospective studies. Suchexposure has been found to be associated with impaired nerve conduction in the brachialplexus [96]. The association between work with hand-held vibrating tools and neurologicalAER signs is not straightforward, however. Traumatisation is possible through vibrations or

44
jerks, power grips, unhealthy working postures or movements associated with such work[102].
Psychosocial work conditions were not found to be associated with AER signs or anyother sign of nerve compression or affection in the neck or upper extremities. This is inaccordance with the hypotheses in study IV.
Associations with other possible causes or triggers of compression of the brachial plexuswere verified in this study, such as working or sleeping with arms cranial to shoulder level,shoulder asymmetry, and trauma to the neck (as opposed to trauma to the arms or hands)[182]. Neck trauma, such as whiplash injury, is associated with fibrosis of the scalenemuscles, which is a possible cause of brachial plexus compression [183]. Associations withobesity, polyneuropathy, or alcohol abuse were not, however, verified in this study [128,149]. Asthma was found to be a strong risk factor for prevalent AER-signs. This has notpreviously been reported. A plausible causative connection is the fact that the scalene andminor pectoral muscles are accessory respiratory muscles. Extensive use of these musclesdue to breathing difficulties, as in asthma, might make them hypertrophied and thus causecompression of the brachial plexus. Another explanation might be a hyper-inflated thoraxcage associated with asthma. This could hypothetically narrow the costoclavicular space andthus cause brachial plexus compression.
More studies are indicated on compression of the brachial plexus with special attention topossible interactions between individual predisposition (e.g. constitution, trauma, disease)and harmful occupational exposure (e.g. postures and movements in the neck and upperextremities and manual handling). There may be specific combinations that should beprevented.
5.1.3 Evaluation of the AER test and its usabilityAssuming the earlier mentioned multiple causality of nerve injury and the validity of the“double and multiple crush” theory, it can be concluded that evaluation of nerve injuryanywhere in the neck and upper extremities should include the brachial plexus. The AERtest is a recommended test of compression of the brachial plexus [153, 171]. With noinformation in this thesis about true brachial plexus compression among the subjects, verylittle can be concluded about the validity of the AER test as a test of brachial compressiondisease. There were only indirect indications that the AER test provokes compression of thebrachial plexus – its associations with biologically plausible risk factors and with symptomsand signs indicative of neck and upper-extremity nerve traumatisation. The multipleassociations with signs of other upper-extremity nerve compressions indicate that the test isunspecific as regards the location of the compression. However, assuming the validity of the“double and multiple crush” theory, no test of nerve compression can be specific regardingthe location. Finally, the outcome of the AER test predicts future disorders in the neck andupper extremities. Almost every other subject with an AER sign at baseline examination hadnew symptoms or signs in the neck or upper extremities five years later.
The AER test is easy to perform. Modifications have been suggested, such as shorteningits duration from 3 minutes to 1 minute, manual pressure in the supra-clavicular fossa duringthe test, omitting elbow flexion or hand gripping [153, Study III, IV]. Other suggestionsconcern using different methods for recording upper-extremity nerve dysfunction, e.g.electrodiagnostic measurements, vibration- or skin-sensitivity thresholds, during orimmediately after AER testing [27, 153]. Documentation on the reliability and validity ofthe AER test or its modifications is however sparse. Inter-examiner reliability of a 1-minuteversion of the test was found to be good in one study (κ=0.62) [8]. Future studies shouldaddress these methodological issues. The validity of the “double and multiple” crush theory
45
and its implications to the prevention, evaluation and rehabilitation of neck- and upperextremity nerve entrapment diseases should also be further studied.
The AER test is not suited for self-administered examination, according to the results ofstudy III. Self-administered examination over-estimated the prevalence of signs about 3.5times with a fair sensitivity and specificity (0.7) but very poor PPV and κ (=0.14). Also thePhalen´s and other tests of nerve function had poor validity in the self-administeredexamination. No substantial or specific characteristics patterns in the pain drawings in studyV were noted among subjects with signs of nerve compression in the neck or during theAER test.
To summarise, the AER test is a supplementary tool in epidemiology and occupationalhealth settings for evaluating work-related neck and upper-extremity nerve compressiondisorders, and has the possibility to be further improved.
5.2 Self-administered examination of signs
5.2.1 Poor validity of self-administered examinationIn this thesis a self-administered examination test of signs in the neck and upper extremitieswas developed and evaluated. Except for self-administered hand tests, few other such testsfor epidemiological use have been described [41].
The prevalences of positive outcomes were much higher in the self-administeredexamination than in the medical examination. The low PPV in our study imply that only fewof the positive findings in the self-administered examination were confirmed in the medicalexamination. On the other hand, the majority of the negative findings were confirmed in themedical examination. Conversely, only a moderate proportion of the signs in the medicalexamination was registered in the self-administered test.
The agreements above that of chance, as measured by κ, were mostly "slight" (0-0.20)[112]. Only one item, “finger flexion deficit” reached "moderate" κ (=0.50). It is noteworthythat items requiring only inspection or judgement of motion range showed low validity.Items judging tenderness had somewhat better validity. This could possibly be explained bythe fact that during assessment of tenderness the physician, too, has to rely on the responsefrom the subject.
In the earlier-mentioned study of self-administered examination of hand function, thesensitivity can be calculated from data given in the article to 0.69, specificity to 0.97,positive and negative predictive values to 0.91 and the κ to 0.62. The item "finger flexiondeficit" in the present thesis resembles one of the three items in that study and had similarvalidity values.
The findings in this thesis can be compared to those of studies where two examinersexamine the same subject. As mentioned earlier, the agreement between the examiningphysicians in this study was clearly higher than that reported here regarding assessment oftenderness and joint function (κ=0.5-0.6). Only inspection had poor values (κ=0.3). A studyof a physician and a physiotherapist examining the same neck patients found κ=0.24 forpalpation of tenderness in the neck and κ=0.42-0.44 in the shoulders [235]. This can becompared with κ=0.34 (neck) and κ=0.27 (trapezius) in this thesis. Different tests ofsensitivity and range of joint movement yielded κ around 0.5 compared to 0-0.2 in thisthesis.
Professionals such as physicians or physiotherapists are more familiar with theexamination methods, and have wider frames of reference and more congruent criteria ofnormality. In studies of agreement using clinical patients and/or with limitations to certainregions of the body, there also is the possibility that the experts are more observant of
46
relevant aspects than here, where a selection from the working population is examined andwhere one of the examiners (the physician) has to examine the whole body without focusingon any suspected region or disorder and is blind to possible symptoms. As was shownearlier, validity studies using patients tend to overestimate the sensitivity values. Otherpossible reasons for the poor validity of the self-administered examination could be e.g. thelack of control over prior conditions and over the execution of the examinations The inter-examiner reliability of the medical examination was not perfect either, as was shown above.Each of the above mentioned factors could contribute to the lack of agreement between thetwo examination methods.
5.2.2 The usability of self-administered examinationThe overestimation of the prevalences of signs renders the present version of self-administered examination unsuitable as a replacement for a medical examination indescriptive epidemiological studies. The mostly moderate values of specificity andsensitivity imply that the present version cannot replace a medical examination foridentifying cases with signs in analytical studies. Finally, the modest sensitivity values makethe present version unsuitable for use in clinical applications as too many patients with signswould be missed.
A potential use of self-administered examination is as a screening method in analyticalepidemiological studies of the relation between exposure and signs of musculoskeletaltenderness. Tenderness is a common and important sign of MSD and is included in manydiagnostic criteria, e.g. “tendinitis” or “neck/shoulder pain syndrome”. The validity valuesof items measuring tenderness in the present version of the test were mostly acceptable. Itwas shown in section 1.8.2 that low sensitivity does not introduce serious bias to riskestimates in analytical studies, as long as the prevalence of the sign is not high. Highspecificity is needed in order to avoid bias, however. The classification of disorders, e.g."neck/shoulder pain syndrome", would thus proceed in two steps. Primarily all subjectswould complete a self-administered test of tenderness of the neck and descending trapeziusmuscles. Secondly, only those subjects reporting positive findings would need furtherexamination by professionals for definite diagnostic appraisal. Used in this manner theprocess of identification of cases resembles the method called "serial testing" in clinicalepidemiology [53]. The moderate specificity of the self-administered tests of tendernesscould thus be perfected in the subsequent professional examination of the screened subjects.The modest sensitivity of the present items of tenderness could be an obstacle to their use asa screening method in situations where the incidence or prevalence of the signs is high. Noserious exposure-related bias was observed in this study, indicating that the misclassificationwas not exposure-dependent.
The following example illustrates the reduction in the need for professional examinationresources if self-administered examination of tenderness is used as a screening tool. If thetrue prevalence of tenderness is 15% (e.g. tenderness in the neck or shoulders) and thesensitivity and specificity of the self-administered examination is 0.80 (comparable to thevalues found in this thesis), then the number of subjects needed to be examined for finalappraisal of the presence of the sign would be reduced by about 70%. Signs with lowerprevalences will show even higher reductions. Further improvements in validity, mainly thepositive predictive value, of the screening test will also further reduce the need forprofessional examinations.
47
5.2.3 Possible improvements of validityThe results suggest methods of improving the validity of self-administered examination suchas this. There should be fewer items in a test protocol. Separate items covering a specificphenomenon could be combined into an index. Only those who exceed a criterion value onthe index would then proceed to final professional examination. The definitions of positivefindings should be more clear, unambiguous and easy to follow. This would perhaps lowerthe number of missing data and increase the validity. The design of a self-administeredexamination should also stress its explicitness and simplicity in order to secure compliance.
5.3 Psychosocial conditions and disorder characteristics
5.3.1 Support for the hypothesesThe results from this part of the thesis supported the hypotheses about location and characterof MSD associated with poor psychosocial working conditions. The most pronounced andconsistent associations were found between high mental demands or low social support andco-existing symptoms and signs of muscular (soft-tissue) tenderness in the central bodyregions (neck and low back), most clearly described by the "neck/shoulder pain" and"lumbar pain" syndromes. The findings from earlier studies were confirmed regardingassociations with symptoms from the neck and back regions [84, 92, 116, 120, 148, 223,228]. Theorell and co-workers also found associations between demand-control-supportvariables and symptoms from the back, neck or shoulder regions but not from the otherjoints [205]. The results in this thesis disagree with the conclusions from some other studiesdeclaring "a general musculoskeletal sensitivity to mental stress" [116, 148].
In congruence with the hypotheses, few associations were noted in the more peripheralregions of the body, i.e. the upper or lower extremities. The exception is the pronouncedassociation with local tenderness at Frohse´s arc. Frohse´s arc was palpated as a test ofcompression of the radial nerve. This test affects, besides the radial nerve, also the wrist andfinger extensors and the supinator muscle. Local tenderness was quite frequent and ispossibly a sign of muscle (soft-tissue) tenderness. Symptoms from the arms were associatedwith poor psychosocial work conditions among production workers but not office workers inone of the few other studies covering the arm region [229]. No correction was howevermade for physical load in that cross-sectional study. Psychogenic muscle tensions, recordedby electromyography, have also been reported from flexors in passive forearms duringexperimentally induced stress [200]. Studies regarding the legs or feet have reporteddiverging associations [10, 229].
The sum of all nerve-tests showed no pronounced association with psychosocialvariables, which is in accordance with the hypotheses. No other studies have been foundreporting results from tests of nerve affections in connection with psychosocial factors,except one reporting positive associations with sciatica [148].
The findings of associations with tenderness in several locations could tentatively beexplained by decreased pain thresholds among the subjects. A study of a randomisedsubgroup of these subjects, on the contrary, showed higher pain thresholds among subjectsreporting high mental demands [207].
This thesis, in addition to a few other studies, reports associations between self-reportedpsychosocial work conditions and - not only symptoms but also - signs from themusculoskeletal system [116]. Studying signs makes effects of possible negative affectivityor exposure-dependent bias in the disorder-assessment less probable than studyingsymptoms only. Bias from high and low rating behaviour was in this thesis found to be a
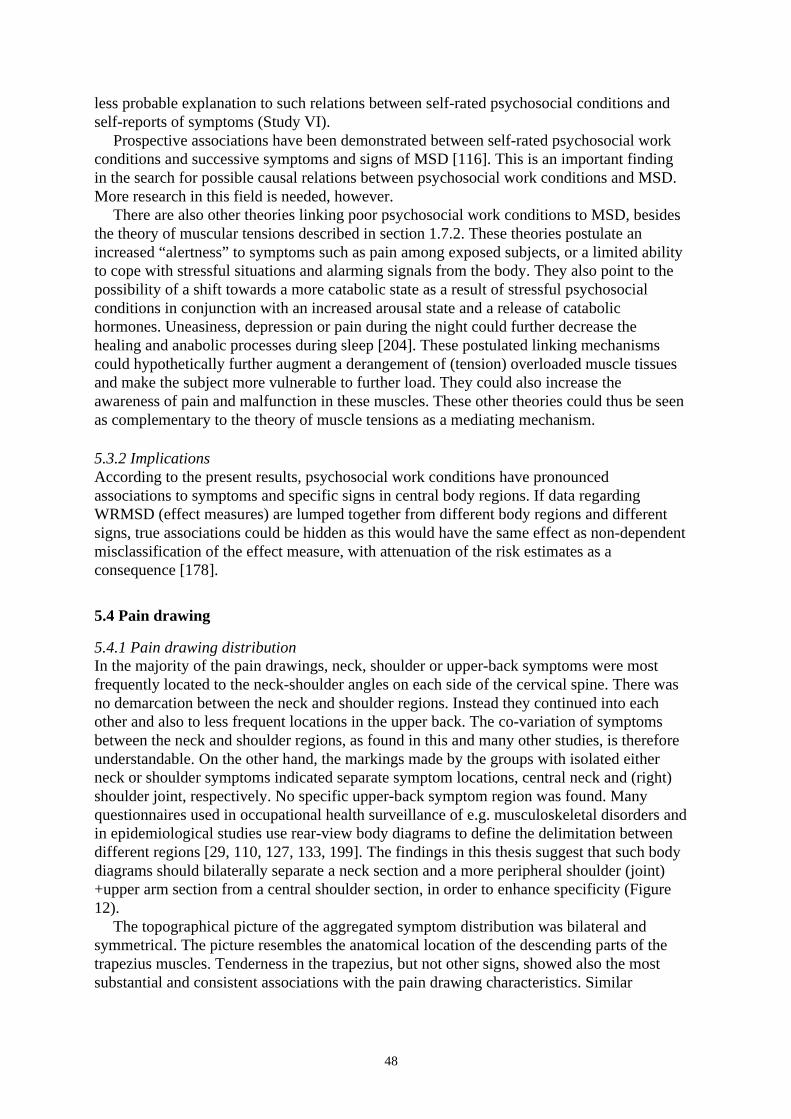
48
less probable explanation to such relations between self-rated psychosocial conditions andself-reports of symptoms (Study VI).
Prospective associations have been demonstrated between self-rated psychosocial workconditions and successive symptoms and signs of MSD [116]. This is an important findingin the search for possible causal relations between psychosocial work conditions and MSD.More research in this field is needed, however.
There are also other theories linking poor psychosocial work conditions to MSD, besidesthe theory of muscular tensions described in section 1.7.2. These theories postulate anincreased “alertness” to symptoms such as pain among exposed subjects, or a limited abilityto cope with stressful situations and alarming signals from the body. They also point to thepossibility of a shift towards a more catabolic state as a result of stressful psychosocialconditions in conjunction with an increased arousal state and a release of catabolichormones. Uneasiness, depression or pain during the night could further decrease thehealing and anabolic processes during sleep [204]. These postulated linking mechanismscould hypothetically further augment a derangement of (tension) overloaded muscle tissuesand make the subject more vulnerable to further load. They could also increase theawareness of pain and malfunction in these muscles. These other theories could thus be seenas complementary to the theory of muscle tensions as a mediating mechanism.
5.3.2 ImplicationsAccording to the present results, psychosocial work conditions have pronouncedassociations to symptoms and specific signs in central body regions. If data regardingWRMSD (effect measures) are lumped together from different body regions and differentsigns, true associations could be hidden as this would have the same effect as non-dependentmisclassification of the effect measure, with attenuation of the risk estimates as aconsequence [178].
5.4 Pain drawing
5.4.1 Pain drawing distributionIn the majority of the pain drawings, neck, shoulder or upper-back symptoms were mostfrequently located to the neck-shoulder angles on each side of the cervical spine. There wasno demarcation between the neck and shoulder regions. Instead they continued into eachother and also to less frequent locations in the upper back. The co-variation of symptomsbetween the neck and shoulder regions, as found in this and many other studies, is thereforeunderstandable. On the other hand, the markings made by the groups with isolated eitherneck or shoulder symptoms indicated separate symptom locations, central neck and (right)shoulder joint, respectively. No specific upper-back symptom region was found. Manyquestionnaires used in occupational health surveillance of e.g. musculoskeletal disorders andin epidemiological studies use rear-view body diagrams to define the delimitation betweendifferent regions [29, 110, 127, 133, 199]. The findings in this thesis suggest that such bodydiagrams should bilaterally separate a neck section and a more peripheral shoulder (joint)+upper arm section from a central shoulder section, in order to enhance specificity (Figure12).
The topographical picture of the aggregated symptom distribution was bilateral andsymmetrical. The picture resembles the anatomical location of the descending parts of thetrapezius muscles. Tenderness in the trapezius, but not other signs, showed also the mostsubstantial and consistent associations with the pain drawing characteristics. Similar
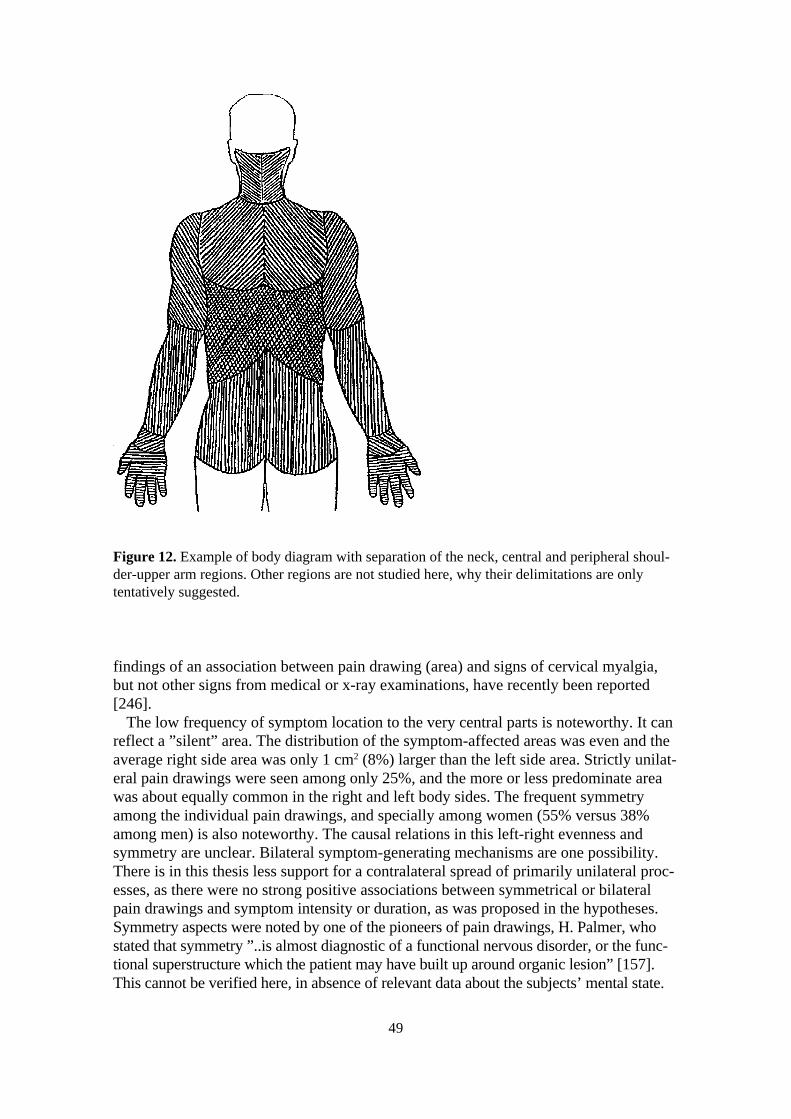
52
findings of an association between pain drawing (area) and signs of cervical myalgia,but not other signs from medical or x-ray examinations, have recently been reported[246].
The low frequency of symptom location to the very central parts is noteworthy. It canreflect a ”silent” area. The distribution of the symptom-affected areas was even and theaverage right side area was only 1 cm2 (8%) larger than the left side area. Strictly unilat-eral pain drawings were seen among only 25%, and the more or less predominate areawas about equally common in the right and left body sides. The frequent symmetryamong the individual pain drawings, and specially among women (55% versus 38%among men) is also noteworthy. The causal relations in this left-right evenness andsymmetry are unclear. Bilateral symptom-generating mechanisms are one possibility.There is in this thesis less support for a contralateral spread of primarily unilateral proc-esses, as there were no strong positive associations between symmetrical or bilateralpain drawings and symptom intensity or duration, as was proposed in the hypotheses.Symmetry aspects were noted by one of the pioneers of pain drawings, H. Palmer, whostated that symmetry ”..is almost diagnostic of a functional nervous disorder, or the func-tional superstructure which the patient may have built up around organic lesion” [157].This cannot be verified here, in absence of relevant data about the subjects’ mental state.
Figure 12. Example of body diagram with separation of the neck, central and peripheral shoul-der-upper arm regions. Other regions are not studied here, why their delimitations are onlytentatively suggested.
49
50
5.4.2 Size of the pain drawing areaThe area covered by the pain drawings and the number of separate loci were associated withchronic, severe and (but less strongly) with intense symptoms and with signs of tendernessin the neck and shoulder region on medical examination. Associations between pain drawingarea and symptom duration, intensity and severity have been reported [106, 209, 246]. Thissupports the hypothesis of a spreading of intensive or long-lasting nociceptive pain, at leastipsilateraly. There are also other possible explanations, such as referred nociceptive pain,radiating neurogenic pain, and pain from deeply located structures, e.g. periost andligaments [50, 100]. It is also noteworthy that women drew larger pain areas than men did.Large pain drawing areas have been reported to be associated with “idiopathic” low-backpain [2]. Whether this also relates to the neck-shoulder region has yet to be studied.
5.4.3 Other pain drawing characteristicsThe other pain drawing characteristics, uni/bilateral or central/peripheral distribution, hadless substantial or consistent associations to the symptoms or signs studied. Pain drawingsresembling the distribution of the dermatomes showed no clear association to nerve-compression signs and syndromes. As the distal parts of the upper extremities, crucial fordermatomal diagnostics, were not included in the pain drawing, no conclusions about thevalidity of this characteristic can be drawn. The proximal distributions of the C2-Th3dermatomes differ substantially between different published dermatome charts, indicatinglarge individual or methodological variations [51, 83, 140].
5.4.4 Evaluation of pain drawingsSeveral previous studies have reported quantification of pain drawing characteristics, mainlythe size of the area [106, 132, 209, 246]. However, most studies of the area aspect usedmuch lower resolution in the quantification of the area, typically 45 pixels for the wholebody front and rear views, compared to 878 pixels in this study (restricted to the rear upperhalf of the body excluding the arms). Low resolution leads to overestimation of the true area[21]. Studies of other characteristics, such as number of separate pain loci, lateralisation,central/peripheral or symmetrical distribution, are few [131, 208]. No reports have beenfound about the spatial distribution of aggregated pain drawings, like the topographicalfigures in this study. Furthermore, most previously studied groups were patients with moreor less chronic pain from the low-back region. The present study reports pain-drawingresults from the neck-shoulder region among the general working population, and includespossible subgroup, e.g. gender, differences. The use of pain drawings not only inoccupational health work but also in epidemiological studies is suggested. The use ofcomputer-based scanning techniques would simplify such high-resolution data entry, as usedin this study. It would also be possible to further elaborate the software that handles thisinput for final calculations of the pain drawing characteristics, such as area and spatialdistribution. Even left-right symmetry could be quantified. This would augment thereliability of the quantification of pain drawing characteristics.
One of the aims in this thesis was to develop and use different methods to characteriseand quantify pain drawings. The mostly weak interrelations between the variables usedindicate that they give unique information about the pain drawings. Symmetry was, asexpected, highly associated with bilateral distribution (high ratio smallest/largest area).Among characteristics used in this study, the total area and number of separate loci showedmost pronounced and consistent associations with symptoms and signs. The usefulness ofthe pain-drawing characteristics studied identifying subjects with different possible
51
diagnoses (here studied as the “neck/shoulder pain”, “rotator cuff”, or “nerve compression”syndromes) was limited. The lack of information about clinical diagnoses and the non-inclusion of the arms and hands in the pain drawings made the conclusions of such specificpain drawing “patterns” not definite in this study. Pain drawings among subjects withsolitary distinct diagnoses, including nociceptive, neurogenic and referred pain, but alsoamong those with “non-organic” pain affecting the neck and upper extremities shouldtherefore be analysed with the present methods or modifications thereof. Further, the resultsshould also be replicated in studies including younger subjects and disorders of more recentor acute onset in order to enhance the generalisability. Pain drawings associated withmalignancies, acute trauma or other serious (non-work related) disorders have not beenstudied here.
5.5 Rating bias
5.5.1 No high and low rating biasIn study VI concerning bias from high and low rating behaviour in epidemiological studies,different sensorial modalities and cognitive demands were chosen for the rating tasks -estimation of taste, weight, quantity, time lapse, exertion, pain and frequency. Differentrating methods were also chosen - free ratings and Likert, RPE, CR10 and VAS scales. Nosigns of a range of high and low rating behaviour were found among the subjects. Lowcorrelations were also seen between ratings where the same type of rating scales were used.This further supports the absence of high and low rating behaviour. This is a welcome resultas the consequences of the reverse would have been cumbersome. The presence of suchrating behaviour would have implied that relative risk estimates from epidemiologicalstudies where both exposure and outcome measures were based on subjective ratings by thesame subject could be uncontrollably biased, typically being overestimated. Specialadjusting procedures would have to be considered in such cases. One such would be tomeasure and adjust for individual high or low rating behaviour, using the same methods asin this study. Another would be to design the rating scales balancing the effects of suchrating behaviour. An alternative would be to refrain from using risk estimates based onsubjective ratings of both exposure and outcomes4.
5.5.2 Sources of rating biasMany other rating behaviours and personality traits, reported to bias ratings or judgements,have been studied in the science of psychometrics, e.g. "response set or style", "socialdesirability", "self-deceptors", "halo effects", and "yeasayers and naysaysers" [30, 32, 85,89]. Biases in rating behaviour can be divided into those associated with the content of therated item ("response set") and those without association to the content ("response style")[175]. Examples of the former are e.g. "social desirability" or "negative or positiveaffectivity" (see below) and of the latter "extreme response bias". Except for range or spreadof numerics used in ratings [16, 47, 65, 66, 93, 203], few consistent "response style" biaseshave been demonstrated [65, 175]. The hypothetical "high and low rating behaviour" couldbe considered as a "response style" and therefore our negative results are consistent withthese previous findings. It has been stated that the more ambiguous the rating or judging taskis, the more probable is the introduction of different rating bias [162, 175]. The rating-tasksin our study varied in ambiguity. Some tasks were quite self-evident and easy, like rating of 4 There are, however, also other reasons not to rely solely on subjective ratings of both exposure and effects
[108].

52
number of curl ups or dumbbell lifts, but other were more ambiguous and difficult, likeratings of acidity or pain. No systematic associations were, however, noted regardingambiguity of the rating task and rating behaviour.
5.5.3 Bias from negative affectivity and other emotional loadingThe hypothesis about bias from high and low rating behaviour resembles the findingsassociated with "negative affectivity". Negative affectivity has been defined as “a mood-dispositional dimension that reflects pervasive individual differences in the experience ofnegative emotion and self-concept” [224]. Many studies have shown that different perceivedstressors are associated with perceived symptoms, distress and health [35, 42, 160, 185,245]. Negative affectivity has been shown to correlate to both the perceived stressors and tothe strain [147, 177, 225]. A bias (overestimation) from negative affectivity to measures ofassociation between stressful exposure and different outcomes has been argued, but alsodisputed [17, 18, 26, 177]. Similar biasing effects have been associated with "positiveaffectivity", i.e. “an ability to cope unusually well with stressful situations and to have asense of coherence or dispositional optimism” [177].
Possible effects of negative or positive affectivity were not included or controlled for inour study. The rated stimuli in our study are not to be considered as stressful or emotionallyloaded. All stimuli, with the exception of the pain ratings, can be considered as "neutral"stimuli, without affective or emotional connotations. Ratings of pain in the PPT test showedonly minimal correlations with ratings of present pain in the shoulders or low back,indicating that these ratings were not substantially affected by some common factor such asnegative or positive affectivity. Thresholds for pain, but not for pure sensation, have in otherstudies, however, been found to be sensitive to personal characteristics, e.g. "self-deceptiveness" [89].
5.5.4 Bias from differential misclassificationThe postulated bias from high and low rating behaviour resembles the effects of differentialmisclassification. Both have the same consequence of uncontrollable bias in relative riskestimates [151]. Both sources of bias are due to an artefact of irrelevant associationsbetween the exposure and outcome measures.
5.5.5 Rating bias in subgroupsGender differences have been demonstrated regarding mean values in use of Likert scales, invalidity of ratings of energy demands at present work or in giving numeric values to verbalexpressions, like "very often" [65, 80, 234]. Differences in rating behaviour between age andsocio-economic groups have earlier been described and could hypothetically have beenexpected in this study due to differences in educational level and supposed familiarity withjudgements, evaluations and numbers [65]. Likewise differences between subjects sufferingfrom pain and those free from pain (cases versus non-cases) could hypothetically have beenexpected due to a possible higher "arousal level" or "alertness" for stimuli. Subdividing thesubjects did not however reveal any subgroup characterised by systematically higher orlower ratings or a range in such rating behaviour. The results so far do therefore not supportthe idea that observed differences in validity of ratings among different subgroups inepidemiological studies are explained by differences in high and low rating behaviour.
53
5.6 General comments
5.6.1 The central role of symptomsA state of pain or other symptoms together with malfunctioning in work or leisure timeactivities, are perhaps the most common manifestations of many MSD. Symptoms inflictsomatic and mental pain and agony. Symptoms are the main phenomenon that urges thesubject to take action, e.g. seek medical care, apply for sick-leave, modify work exposure orpersonal capacity. Symptoms have great negative impact on the wellbeing of the subject andindirectly, also on the economy and efficacy of the company and the community. Symptomdata are therefore central in studies of MSD, both descriptive and analytical.
Etiological and clinical studies, on the other hand, often use diagnoses as effect measures.Many diagnoses have symptoms as one of their main criteria, however, e.g. carpal tunneldisease. If only symptom data is available in such studies, and as long as this estimationabout the “true” disease state is unbiased, the influence of this inprecise diagnostics can bepredicted (=underestimation of “true” associations in analytical studies – see section 1.8.2).If the specificity of the symptom data is insufficient, symptom data could be used as ascreening instrument. Other more precise but more resource-consuming methods, e.g.medical examination, could then be applied to the symptomatic subjects to further increasethe specificity of the combined assessment process. The optimal combinations of differentassessment methods, parameters and criteria for positive “diagnoses” are however unknown.More research in this field is therefore indicated.
Methods for symptom assessment could be further elaborated. Computer basedquestionnaires for self-administered presentation and entry of data is one possibility. Thequestions could be arranged in a tree-structure where the answer on one question decideswhat questions should follow. This could make the assessment procedure more specific andalso avoid unnecessary questions which makes the questionnaire lengthy and otherwisedecreases motivation and accuracy.
In many cases of MSD there are no manifestations in known observable signs, onlysymptoms. It should however be noted, that the present methods of sign-findings are crudein epidemiological studies. The methods are most often non-invasive and rely on what canbe observed “externally” with the eyes, hands, knowledge, and experience of the examiner.It is not far-fetched to suppose that there are diseases with signs that we are not (yet?) ableto observe.
5.6.2 The role of self-reports and principles for optimal assessment proceduresSelf-reports of sick-leave and other medical history data and of symptoms have fair – good(test-retest) reliability, as shown in the introductory sections (κ=0.6-0.9). Validity, on theother hand, diverges, using previous records or examination of signs as “true” values.Specificity is mainly good (>0.9) but sensitivity is typically poorer (0.4-0.8). Self-reporteddata, e.g. symptoms, can be influenced by different non-disease related factors in thesubject, e.g. perception, cognition, motivation, and coping ability. Exposure-dependentmisclassification is a feared complication. This has perhaps been the major hindrance to solereliance on symptoms as effect data in etiological studies of MSD. Other more independentinformation about the disorder is therefore necessary for valid conclusions about causalrelations. Such data could be signs at medical examination, (laboratory) tests, observationsor tests of functional status etc. Most of these assessment methods are resource-consuming,however, and therefore not suitable for epidemiological studies where data are collectedsolely for the purpose of the study. This fact was the starting point for the study of self-administered examination of signs in this thesis. Unfortunately the results showed that self-administered examination of signs is non-valid, if the results of a traditional medical

54
examination are used as a criterion for “true” signs. Self rated health or work ability has, onthe other hand, been reported to have good prognostic validity in other studies [12, 87]. Thedevelopment of self-administered or otherwise resource-saving but valid methods suitablefor epidemiological studies or health surveillance should continue.
Similar problems exist regarding assessment of critical exposure. Self-reports are used inorder to save resources. Such self-reports have often questionable validity and both disorder-dependent and non-dependent misclassification is a problem [238, 240]. The combination ofself-reported exposure and effect data in risk estimations is prone to bias for several possiblereasons [107, 177]. One would be high and low rating behaviour. The results from studies inthis thesis did not support this source of bias, however.
There is no simple solution to this resource - validity conflict in the choice of assessmentmethods in epidemiological research. A suggestion for assessment of disorders in etiologicaland analytical studies of MSD in populations or occupational groups could however be asfollows. Data about the disorder state could be combined from different data sources, bothself-reported and external. One obvious source is self-reported symptom data. To these dataother self-reported information could be added that do not depend primarily on theperceptions and evaluations of bodily signals such as pain. Disorder-specific derangement offunctional abilities or decreased productivity and quality, sleep disturbance due to pain etcare examples. An external source of information could be medical examination signs, testsor other clinical data. As suggested above, such clinical data could be assessed in subgroupsof subjects, screened or otherwise selected. Another external source could be registers atcompany or local health care units or health insurance institutions (visits, diagnoses, sick-leave etc.). These are all data at individual level. Aggregated data could be added, such asprevalence or incidence of relevant medical or related conditions in the occupational groupof interest. Productivity and quality data could also be used. National or company surveydata are useful.
The same combination of different data sources and levels - individual (self-reported andexternal) and aggregated - is also useful in assessment of exposure data. Exposure and effectdata at the same level may then be combined in risk calculations. Exposure, effect and riskestimates on different levels should agree. If not, the discrepancies should be carefullyanalysed. Discrepancies could also be of interest, e.g. sub-groups of symptomatic subjectswithout signs or critical exposure could point at increased vulnerability or lack of copingability. The combination of effect data at different levels can minimise the negative effectsof the weakness of each individual method and benefit from their specific qualities [108].
A guiding principle for the choice of specific assessment methods, or combinationsthereof, is high sensitivity of the procedure for ruling out and high specificity for ruling in aspecific disease (see section 1.8.2).
5.6.3 Evaluation of assessment methodsA couple of remarks are in order concerning the evaluation of assessment methods as suchdata were presented in the introductory section. Evaluation studies based on patient groupswill tend to overestimate the sensitivity of the method and studies based on non-disorderedsubjects selected from healthy volunteers will overestimate the specificity of the method[20]. This means that methods evaluated on clinical patient groups are expected to besomewhat less sensitive when applied to epidemiological studies of working populations.Evaluation of assessment methods should therefore be based on samples of subjects similarto the population where the methods are expected to be used.
Turning to methods evaluated on clinical patient groups, the positive predictive value ispositively affected by the prevalence of the disorder. This means that the positive predictive
55
value of a test evaluated on a clinical patient group will be lower when applied in anepidemiological study of the working population, where the prevalence of the disorder islower. The κ-value is also influenced by the prevalence of the disorder, being highest forprevalences around 50% and decreasing for more frequent or less frequent disorders. Forthese reasons quality measures of assessment methods should be standardised and reportedat the same prevalence value, e.g. 10% or as likelihood ratios [20].
To facilitate comparisons in this thesis prevalences and composition of study groups arereported in addition to validity values of assessment methods.
It was shown in section 1.8.2 that high specificity in the estimation of disorder isimportant in risk-analytical studies of non-frequent disorders. In health surveillance and indescriptive epidemiological studies of prevalence or incidence of disorders, both sensitivityand specificity are important for preventing bias to results. In clinical settings, but also inepidemiology, high sensitivity (of a negative test) is specially important when ruling out adisorder and high specificity (of a positive test) when ruling in a disorder [6]. There are thusdifferent (opposing) requirements on the tests when making distinctions between competingdiagnoses. The disorder that is ruled in, e.g. “neck/shoulder pain syndrome” should beassessed with high specificity and disorders that are to be ruled out, e.g. “cervicalrizopathia” should be assessed with high sensitivity.
5.6.4 Possibilities of early effectsThe detection of “early effects” is of specific interest to preventive work. Early effects couldmake the subject or the authority in charge of health and wellbeing among personnelobservant of a potential health hazard before it becomes manifest. Preventive action couldbe taken, e.g. exposure modification, change in working technique, increase of individualcapacity. Reliable and valid measures of early effects, subjective or observable, could be avaluable tool in active work place health surveillance [176]. There is however generally verylittle knowledge about the progression of WRMSD from early/intermediate effects to achronic and perhaps disabling state with sickness pension. There is also little knowledgeabout possible early warning symptoms or signs of such disorders and how this could beassessed. More research in this field is therefore indicated.
5.7 Sources of error and limitations
5.7.1 Measurement errorsSymptom data. All studies, except III, reported symptom data. Studies I, II, and IV assessedsymptoms with questionnaires similar to the Nordic Questionnaire. The reliability andvalidity of this instrument have been reported as good, but not perfect (see section 1.9.2). Itdoes not substantially differ between regions of the body [110, 155]. Studies V and VIrecorded symptoms through a strictly structured medical interview. There are no data aboutits reliability or validity. Medical interviews are, however, sometimes used as “goldenstandards” for validity studies of questionnaires.Signs. All studies, except VI, reported signs from medical examinations according tomethods described in section 3.2.2. Examinations in studies I-II and III-V used similarquality assurance methods, protocols and criteria for positive signs. The reliability ofexaminations in studies III and IV was studied and found to be mainly fair-good, asdescribed in the methods section. It did not substantially differ between examinationcategories, except inspection that had poor reliability. Reliability of the AER test wasreported to be good in the only study found to address this issue (κ=0.6). The reliability (and

56
validity) of the AER test as a tool in the diagnostics of compression of the brachial plexusshould be further studied.
There were thus no indications that bias was selective regarding body regions orstructures. The main results of study IV were therefore probably not affected by differencesin quality of data from different regions of the body, neither symptom or signs of differenttypes.
The medical examinations of the subjects in studies I and II were performed by the sameexaminer, except the assemblers in study I. Remaining differences in the examinationprocedures and criteria for positive signs could at least partly explain the low prevalence ofAER signs among the assemblers compared to the others.
Other assessment methods. The reliability of the self-administered examination procedure instudy III was not investigated and no other studies are reported. It could however bepostulated that all subjects were “novices” in using these methods, and for this reason thereliability of their examinations could be questioned. The validity was poor, according to theresults of study III. Due to low prevalences of positive findings in many items, the pointestimates of sensitivity and positive predictive values must be regarded as highly uncertain,as shown by the wide confidence intervals.
Internal consistency and test-retest reliability were shown to be fairly good regarding theindices "mental demands" and "social suport", but not "decision latitute" in study IV, whichcan partly explain the consistent lack of associations with the latter index [206]. The subjectsin study IV were chosen from different occupations in order to obtain variation in bothphysical and psychosocial exposure; furniture movers, secretaries, and population samples.Analyses stratifying for subgroup showed the same main pattern as the results above,indicating that subject-category did not act as a serious confounder.
The reliability of the pain drawing process and the coding was not studied. As mentionedearlier, previous studies have reported good stability and also reliable coding/evaluation ofpain drawing areas. The reliability of the quantitative measures in study V relies on thereliability of the coding of the distribution of the pain drawings, which probably was similarto that in other mentioned studies where transparent grids and matrices were used. Thereliability of the visual judgements (e.g. symmetry) is, however, less known.
Study VI does not provide data about the reliability of the ratings. It is, however, unlikelythat lack of reliability could attenuate hypothetically substantial intercorrelations to thoseobserved very low, both positive and negative, intercorrelations in that study. The (expected)findings of the relatively high correlations when the same stimulus situation was rated twice(acidity with CR10 and VAS scales; time of 30 and 60 seconds tests) further supported this.The spread in ratings between subjects was sufficient to examine the correlations betweenthe rated variables. There was no evidence of non-linearity in the associations among thevariables. Thus neither of these factors can explain the findings of the low intercorrelations.Non-parametric statistics (Spearman-Brown correlation coefficients) were used in this studyas some of the rating scales only were on ordinal level. Corresponding Pearson correlationcoefficients did not, however, differ much from the present results.
5.7.2 Sampling and data loss errorsStudy group I+II. Inclusion of subjects to the cross-sectional study I was without dropouts.Bias was possible however as potential subjects who might be on sick-pension or had leftthe company or profession due to disorders related to compression of the brachial plexuswere not entered to the study. Such a “healthy worker” effect could lead to anunderestimation of the prevalence and incidence of the studied symptoms and signs.

57
Fourteen subjects were lost to follow-up in study II, mostly because the subject had leftthe company. Prevalences of AER signs at baseline examination did not significantly differbetween this and the study group.
Study group III+IV. Totally 507 subjects were approached and 358 participated (71%). Nosubstantial differences in health status were found between the study group and a subgroupof 34 subjects from the dropouts (telephone interview and health register notes).
The volume of missing data in study III, mainly because of dropouts, was substantial butnot selective regarding the results of the medical examination or occupational physicalexposure. Reasons for this high rate of dropouts could be the large number of items in themailed test protocol (totally 31) with addition of other mailed questionnaires. High rate ofmissing data or dropouts limit the usefulness of a self-administered examination as thisthreatens the validity and the power of the study.
Study group V+VI. The participation rate at follow-up was 62% of the eligible subjectsfrom the baseline examination in 1970. About 60% of the lost-to-follow-up group wereinterviewed by phone. There were no significant differences in neck symptoms at baselineor neck and upper extremity disorders during the past year between the study group and thelost-to-follow up group.
Some of the rating variables in study VI were only rated by the last 175 subjects calledfor examination. Nothing indicates that this restriction of data had any relation to possiblehigh and low rating behaviour.
5.7.3 Limits to generalisabilityAll subjects in this thesis came from different occupational groups or population samples.The subjects represented the most common physical and psychosocial work exposureconditions among the general working population.
One limitation to the generalisability of the results was the absence of female subjects instudies about the AER test. Disorders due to compression of the brachial plexus are reportedto be more common among women [115]. Few women were, however, available in thetypically male occupations in studies I and II. Compression of the brachial plexus and theusability of the AER test should therefore be further studied with priority to female subjectsand occupations.
Another limitation was the restriction of age range (40-59 years) among subjects in thestudies of pain drawings and rating behaviour. The study of rating behaviour was alsolimited to neutral and non-affective stimuli. There are still possibilities of specific ratingbehaviours related to emotionally loaded stimuli.
5.7.4 Specific sources of error or limitationsSteady state in study II. The cumulative annual incidence, the recovery rate and the meanduration of AER signs in study II, were calculated assuming a steady-state condition and notransient cases in the study group. The prevalences in the whole group of 137 subjects did,however, change from 32 to 26, indicating a slight disruption of the assumed steady state.Using the mean prevalence value from the two examinations=29/137 yields a “corrected”cumulative incidence of about 2.2/100 person-years, a recovery rate of about 8.2/100 case-years, and a mean duration of approximately 12 years. It is, however, not known whetherthere were transient cases, with durations shorter than the five years between the twoexaminations. The calculated mean duration of the AER sign, 12-17 years, suggests thatthere was no substantial number of such cases. The calculated cumulative incidence and the

58
recovery rate must in any case be regarded as minimum estimations and the calculated meanduration as a maximum estimation.
Multiple comparisons in study IV. As 164 separate comparisons were made between theexposure and effect variables it could be argued that the results of study IV in this thesiscould be explained by chance associations alone, an effect of "multiple comparisons". Noadjustments of the level of significance were made, as confidence intervals were calculatedand as such methods have been criticised [178]. However, the criteria for "pronouncedassociation" have a similar conservative effect as e.g adjustment of the significance level.The main arguments against chance as an explanation for the results are that they arebiologically plausible, had a consistent pattern and were tested against a priori hypotheses[178]. The included "check" medical examination items, which were supposedly less likelyto be associated with the exposure variables, showed no such "chance" associations.
Cause-effect relations. It is not possible to draw definite conclusions from this thesis aboutpossible cause-effect relations between individual characteristics, injuries, diseases, andexposure factors at work and AER signs of nerve compression in the brachial plexus. Thenumber of incident cases was too low for any detailed analysis. A case-control study wouldbe more efficient. Neither is it possible to draw any definite conclusions about true brachialplexus entrapment as no objectification of such processes was carried out.
No definite cause-effect relations can be inferred about psychosocial conditions at workand MSD, partly due to the cross-sectional design of study IV in this thesis and partly due tothe absence of objectification of the psychosocial conditions. The findings in the study needverification in order to make interpretation of the results more definite.

59
6. Conclusions and summarising statements of this thesis- The following rough estimations were made about neurological AER signs among male
industrial and office workers in this study: cumulative incidence approximately 2/100person-years; mean duration approximately 12-18 years; recovery rate approximately 8-9/100 case-years.
- Factors related to working conditions, constitution, disease, and neck trauma wereassociated with neurological AER signs.
- Neurological AER signs predicted future neck and upper-extremity symptoms and signs ofnerve compression.
- Prevention, evaluation and management of neck- and upper-extremity nerve compressiondisorders, focal or multiple, should address all potential foci of traumatisation, includingthe brachial plexus. The AER test is a supplementary tool in such work, both inepidemiology and in occupational health settings.
- The results in this thesis support the “double or multiple crush” theory of nervecompression injury.
- The self-administered examination method used in this thesis was not valid and thereforenot suitable to replace a traditional medical examination for identifying subjects withpositive signs of disorders in the musculoskeletal system of the neck and upperextremities in epidemiological studies.
- Self-administered examination of tenderness can be used as a screening method inanalytical studies of relations between exposure and signs of musculoskeletal disorders.
- Perceived high psychological demands, high job strain or low social support werestatistically associated with both symptoms and signs from the musculoskeletal system.
- Such associations were most pronounced with symptoms and signs from central bodyregions, i.e. neck and low back, compared to more peripheral regions such as arms orlegs.
- The associations were more pronounced with signs of muscular (soft tissue) tendernesscompared to signs of affections of nerves, joints, tendons or muscular insertions.
- Studies of associations between psychosocial work conditions and musculoskeletaldisorders should separate effect measures of different signs and different body regions inorder to avoid attenuation of the risk estimates.
- Pain drawings of neck, shoulder and upper-back symptoms among middle-aged generalworking population were most usually located to the neck-shoulder angle with asymmetrical left-right distribution.
- Women reported larger, more central, bilateral and symmetrical symptom areas than men.- The number of separate symptom loci, their total area, left-right distribution and symmetry
were characteristics associated with symptom chronicity and severity or signs oftenderness in the neck-trapezius region.
- There was no support for the existence of a range of high and low rating behaviour amongmiddle-aged subjects who rate neutral and non-affective stimuli, such as time, weight,number and physical exposure, but also pain and other symptoms.
- There is therefore no support for the idea of a bias to relative risk estimates from suchrating behaviour in studies where subjects rate both exposure and outcome variables ofthis kind.
60
7. New aspects in this thesis
As far as could be found in the published literature, mainly the following research issues,methods used and results have not been reported earlier.
- Estimation of cumulative incidence and prognostic factors of neurological signs of brachialplexus compression during the AER test (Study II).
- The finding of asthma as a possible risk factor for brachial plexus compression (Study II).
- Highlighting the implications of the “double and multiple crush” theory of nervecompression for prevention, evaluation and rehabilitation of neck and upper extremitydisorders (Study II).
- The development and evaluation of a protocol of self-administered examination of signs inthe neck and upper extremities (Study III).
- The study of the relation of self-reported psychosocial working conditions to specificlocations and characteristics of musculoskeletal disorders (Study IV).
- The registration of a wide range of specific signs of MSD in studying psychosocial workconditions (Study IV).
- The use of high resolution pain drawings in the neck and shoulder regions among theworking population with further attempts to quantify its characteristics (Study V).
- The topographical presentation of aggregated pain drawing results (Study V).
- The postulation and evaluation of high and low rating behaviour and its possible biasingeffect to risk estimates (Study VI).

61
8. Summary
Toomingas A. Methods for evaluating work-related musculoskeletal neck and upper-extremity disorders inepidemiological studies. Thesis at Karolinska Institute, Stockholm. National Institute for Working Life, Arbeteoch Hälsa 1998:6.
The aim of this thesis was to develop, evaluate and characterise assessment methods usedwithin epidemiological studies of work-related musculoskeletal disorders in the neck andupper extremities. Special attention was paid to self-administered methods, relations topsychosocial risk factors and signs of nerve compression.
Work-related musculoskeletal disorders in the neck and upper extremities are commonand costly in many respects. Knowledge about the progression of these disorders and theircausality, especially in relation to psychosocial conditions, is insufficient. Methods, mainlyself-administered, for their assessment in epidemiological studies are limited.
Main affected structures, common disorders and their symptoms and signs, differentassessment methods and their qualifications were discussed in this thesis. The existence of ahigh and low rating behaviour was proposed. If both exposure and outcome are rated by thesubjects in an epidemiological study, such a rating behaviour could introduce uncontrollablebias to the risk-estimates, most commonly an over-estimation. No such rating behaviour wasfound, however, and no effects on risk estimates could be demonstrated.
A self-administered physical examination protocol was developed and evaluated againsttraditional medical examination. The validity was poor, however. A self-administered paindrawing method was developed and studied among working population with symptoms inthe neck and shoulder regions. The average outline showed two palm-sized areas in theneck-shoulder angles, with a symmetrical distribution between the right and left sides. Long-lasting or severe disorders and signs of tenderness were associated with large areas andmultiple loci. Gender differences were noted.
The brachial plexus can be compressed in several locations in the neck and shoulderregion. The diagnosis of this compression is mainly based on symptoms and medicalexamination, where the Abduction External Rotation test has been used. Prospective aspectsand the outcome of the test were studied among male industrial and office workers. Theresults gave support to multi-causality and to the “double or multiple crush” theory of nervecompression. Evaluation of neck and upper extremity nerve compression diseases shouldtherefore attend to all probable locations of such compression, even when a specific locationis in focus.
Psychosocial working conditions have been recognised as important risk factors formusculoskeletal disorders. This thesis gave support to the hypothesis that high psychosocialload has specific associations with symptoms and signs of muscular (soft tissue) tendernessfrom central body regions - the neck and back. Studies of these relations should thereforedistinguish between different clinical signs and different body regions in order to avoidattenuation of risk estimates.
Suggestions were discussed for further development of reliable and valid methods forassessment of these disorders feasible for epidemiological studies and in health surveillance.

62
9. Sammanfattning (summary in Swedish)
Toomingas A. Methods for evaluating work-related musculoskeletal neck and upper-extremity disorders inepidemiological studies. Doktorsavhandling vid Karolinska institutet, Stockholm. Arbetslivsinstitutet, Arbeteoch Hälsa 1998:6.
Syftet med denna avhandling var att utveckla, utvärdera samt karakterisera epidemiologiskametoder att mäta arbetsrelaterad sjuklighet i nacke och övre extremiteter. Specielluppmärksamhet ägnades åt självadministrerade metoder, relationen till psykosocialariskfaktorer samt tecken på nervkompression.
Arbetsrelaterade åkommor i nacke och övre extremiteter är vanliga och kostsamma urmånga aspekter. Kunskaperna om sjukdomsutveckling och bakomliggandeorsakssammanhang, speciellt i relation till psykosocial belastning, är otillräckliga. Metoder,speciellt självadministrerade, för att registrera dessa åkommor i epidemiologiska studier ärbegränsade.
Vanligen drabbade strukturer och åkommor, deras symptom och undersökningsfynd,olika registreringsmetoder och deras kvaliteter redovisades i avhandlingen. Förekomst avhög- resp. lågskattarbeteende föreslogs. Om både exponering och sjuklighet skattas avstudiepersonerna i en epidemiologisk studie, kan ett sådant skattningsbeteende införa enokontrollerbar förvrängning av riskestimat, vanligtvis en överskattning. Något sådantskattningsbeteende kunde emellertid ej påvisas hos studiepersoner i denna avhandling, ochingen effekt på riskestimat kunde demonstreras.
Ett självadministrerat kroppsundersöknings protokoll utvecklades och utvärderadesgentemot traditionell läkarundersökning. Överensstämmelsen var emellertid dålig. En själv-administrerad smärtritningsmetod utvecklades och utprovades bland yrkesarbetare medbesvär i nacke eller skuldror. Den genomsnittliga bilden visade två handflatestora områden inack-skuldervinklarna med en symmetrisk vänster- och högersidig utbredning. Långvarigaeller grava besvär samt tecken på ömhet var kopplade till stor markerad yta med flera focus.Köns-skillnader noterades.
Plexus brachialis kan bli utsatt för kompression på flera ställen i nacke och skulderregionen. Diagnostik av sådan kompression bygger främst på symptom och fynd vidkroppsundersökning där “Abduction External Rotation” testet har använts. Utfall och testetsprognostiska faktorer samt värde studerades bland manliga industri- och kontorsarbetare.Resultaten pekade på en multifaktoriell bakgrund och gav stöd åt “double and multiplecrush” teorin om nervkompression. Vid bedömning av nervkompression i nacke och övreextremiteter bör man därför beakta samtliga möjliga lägen för inklämning, även om bara ettvisst är i fokus.
Psykosociala arbetsförhållanden har uppmärksammats som viktiga riskfaktorer försjuklighet i rörelseorganen. Denna avhandlings resultat gav stöd åt hypotesen att högpsykosocial belastning har koppling till symptom och till ömhet i muskler (mjukdelar)specifikt i kroppens centrala delar – nacken och ryggen. Studier av sådana samband bördärför särkilja mellan kroppsregioner och olika typer av fynd vid kroppsundersökning för attundvika utspädningseffekter av riskestimat.
Förslag diskuterades till fortsatt utveckling av tillförlitliga mätmetoder lämpliga föranvändning i epidemiologiska studier och vid hälso-övervakning.

63
10. Acknowledgements
Studies I and II were carried out at Sunds Defibrator Company, Volvo Truck Corporation(study I) and the Department of Occupational Medicine at Sundsvall Hospital, Sweden.Studies III-VI were carried out at the National Institute for Working Life (former NationalInstitute of Occupational Health). Studies III-IV were also carried out at the KarolinskaInstitute and Hospital - Departments of: Clinical Neuroscience - Division of StressResearch; Environmental Medicine; Occupational Medicine; Orthopaedics; Rehabilitationand Physical Medicine; Rheumatology, and at the National Institute of Psychosocial Factorsand Health, all in Solna, Sweden.The co-operation of the organisations and persons involved is gratefully acknowledged.
The studies were financially supported by the Swedish Council for Work Life Research, theStockholm County Council and the Folksam Insurance Company.
I would like to thank everyone contributing to the studies presented here:-Professor Mats Hagberg; University of Gothenburg, Institute of Medicine, Section of
Occupational Medicine - my main supervisor, co-author and former head, coordinator ofthe EPIVIB and MUSIC-I studies
-Assistant professor Lars Alfredsson; Institute of Environmental Medicine, Division ofEpidemiology at the Karolinska Institute - my supervisor and co-author
-Assistant professor Gunnar Németh; Karolinska Hospital, Department of Orthopaedics - mysupervisor and co-author
-Professor Töres Theorell; National Institute of Psychosocial Factors and Health, theDivision of Stress Research at Karolinska Institute - my supervisor and co-author
-Professor Birgitta Kolmodin-Hedman; Karolinska Institute, Department of Public HealthSciences, Division of Occupational Health - my academic home
-Lage Burström, MSc Eng; National Institute for Working Life, Department of TechnicalHygiene - my co-author
-Lars Jorulf, MD; Volvo Truck Corporation, Department of Occupational Health - my co-author
-Steve Kihlberg, DrSc Eng; formerly at the National Institute for Working Life - my co-author and computer adviser
-Professor Åsa Kilbom, National Institute for Working Life, Department of Work andHealth – my co-author and coordinator of the REBUS-93 study
-Max Köster, epidemiologist; formerly at the National Institute for Working Life - forcomputing assistance
-Ronnie Lundström, Dr.Med.Sc.; National Institute for Working Life, Department ofTechnical Hygiene - my co-author
-Hans Michélsen, PhD; Karolinska Hospital, Department of Occupational Medicine - my co-author
-Tohr Nilsson, MD; Sundsvall Hospital, Department of Occupational Medicine - my co-author and fellow in PhD endavours
-Rolf Nordemar, MD; Karolinska Hospital, Department of Rehabilitation and PhysicalMedicine - my co-author
-all other co-workers in the former MUSIC I and REBUS-93 study groups-all other helpful colleagues at the National Institute for Working Life-all very helpful members of the library staff at the National Institute for Working Life.

64
11. References
1. Agius RM, Lloyd MH, Campell S, Hutchison P, Seaton A, Soutar CA. Questionnaire for theidentification of back pain for epidemiological purpuses. Occup Environ Med 1994;51:756-760.
2. Almay BGL. Diagnosis of chronic pain syndromes. Nord J Psych 1989;43:15-23.
3. Armstrong RB. initial events in exercise-induced muscular injury. Med Sci Sports Exerc 1990;22:429-435.
4. Armstrong TJ, Buckle P, Fine L, et al. A conceptual model for work-related neck and upper-limbmusculoskeletal disorders. Scand J Work Environ Health 1993;19:73-84.
5. Arner M, Kopylov P, Holmberg J. Pain drawing as an investigative tool in hand surgery. Scand J PlastReconstr Hand Surg 1992;26:271-274.
6. Baron JA. Quantitative aspects of medicine. Uppsala: Uppsala University Library, 1993.
7. Bear-Lehman J, Abreu BC. Evaluating the hand: Issues in reliability and validity. Phys Ther1989;69:1025-1033.
8. Bellander T, Nisell R, Toomingas A, Stockholm MUSIC I Study Group. Läkarundersökning avrörelseorganen hos befolkningsurval: Reproducerbarhet av status och konsekvenser för framtidaepidemiologiska studier (Medical examination of the musculoskeletal system. Reproducibility of thesigns and consequenses for future epidemilogic studies). In: Hagberg M, Hogstedt C, ed.Stockholmsundersökningen 1. Utvärdering av metoder för att mäta hälsa och exponeringar iepidemiologiska studier av rörelseorganens sjukdomar (The Stockholm MUSIC Study 1. Evaluation ofmethods to measure health and exposure in epidemiological studies of musculoskeletal disorders).Stockholm: MUSIC Books, Yrkesmedicinska kliniken, Karolinska sjukhuset, 1993: 216-236.
9. Berg M, Sandén Å, Torell G, Järvholm B. Persistence of musculoskeletal symptoms: a longitudinal study.Ergonomics 1988;31:1281-1285.
10. Bergenudd H, Nilsson B, Lindgärde F. Knee pain in middle age and its relationship to occupational workload and psychosocial factors. Clin Orthop 1989;No.245:210-215.
11. Bernard BP, ed. Musculoskeletal disorders and workplace factors. A critical review of epidemiologicevidence for work-related musculoskeletal disorders of the neck, upper extremity, and low back.Cincinnati: National Institute for Occupational Safety and Health, 1997.
12. Bjorner JB, Söndergaard Kristensen T, Orth-Gomér K, Tibblin G, Sullivan M, Westerholm P. Self ratedhealth - a useful concept in research, prevention and clinical medicine. Stockholm:Forskningsrådsnämnden, 1996.
13. Boivie J, Hansson P, Lindblom U. Touch, temperature, and pain in health and disease. Mechanisms andassessments. Seattle: IASP Press, 1994 Progress in Pain Research and Management; vol 3.
14. Borg G. Perceived exertion as an indicator of somatic stress. Scand J Rehabil Med 1970;2-3:92-98.
15. Borg G. A category scale with ratio properties for intermodal and interindividual comparisons. In:Geissler H-G, Petzold P, ed. Psychophysical judgement and the process of perception. Berlin: VEBDeutscher Verlag der Wissenschaften, 1982: 25-34.
16. Borg G, Borg E. Psychophysical judgements of size and their use to test rating behaviour. Department ofPsychology. University of Stockholm, 1990 (Report No.717).
17. Brief AP, Atieh JM. Studying job stress: are we making mountains out of molehills? J Occup Behav1987;8:115-126.
18. Brief AP, Burke MJ, George JM, Robinson BS, Webster J. Should negative affectivity remain anunmeasured variable in the study of job stress? J Appl Psychol 1988;73:193-198.
19. Broberg E. Anmälda arbetssjukdomar i Norden 1990-1992 (Reported occupational diseases in the Nordiccountries 1990-1992 - With english summaries and legends). The Nordic Council of Ministers, 1996(TemaNord 1996:545).
65
20. Browner W, Newman T, Cummings S. Designing a new study. III. Diagnostic tests. In: Hulley S,Cummings S, ed. Designing clinical research: An epidemiologic approach. Baltimore, Maryland:Williams & Wilkins, 1988: 87-97.
21. Bryner P. Extent measurement in localised low-back pain: a comparison of four methods. Pain1994;59:281-285.
22. Burdorf A, Post W, Bruggeling T. Reliability of a questionnaire on sickness absence with specificattention to absence due to back pain and respiratory complaints. Occup Environ Med 1996;53:58-62.
23. Bureau of Labour Statistics. Safety and health statistics. 1998 (Internet - http://stats.bls.gov/ news.release/osh2.t05.htm).
24. Cameron JA. The assessment of work-related-body-part discomfort. A review of recent literature andproposed tool for use in assessing work-related body-part discomfort in applied environments. In: BittnerAC, Champney PC, ed. Advances in Industrial Ergonomics and Safety VII. London: Taylor&Francis,1995: 173-180.
25. Chan CW, Goldman S, Ilstrup DM, Kunselman AR, O'neill PI. The pain drawing and Waddell'snonorganic physical signs in chronic low-back pain. Spine 1993;18:1717-1722.
26. Chen PY, Spector PE. Negative affectivity as the underlying cause of correlations between stressors andstrain. J Appl Psychol 1991;76:398-407.
27. Chodoroff G, Lee DW, Honet JC. Dynamic approach in the diagnosis of thoracic outlet syndrome usingsomatosensory evoked responses. Arch Phys Med Rehab 1985;66:3-6.
28. Constant CR, Murley AHG. A clinical method of functional assessment of the shoulder. Clin Orthop1987;-:160-4.
29. Corlett EN, Bishop RP. A technique for assessing postural discomfort. Ergonomics 1976;19:175-182.
30. Couch A, Kenistin K. Yeasayers and naysayers: agreeing response set as a personality variable. J AbnormSoc Psychol 1960;60:151-174.
31. Croft P, Pope D, Silman A. The clinical course of shoulder pain: prospective cohort study in primarycare. Br Med J 1996;313:601-602.
32. Cronbach LJ. Further evidence on response sets and test design. Educ Psychol Meas 1950;10:3-31.
33. deKrom MC, Knipshild PG, Kester AD, Spaans F. Efficacy of provocative tests for diagnosis of carpaltunnel syndrome. The Lancet 1990;335:393-395.
34. Dellon AL, Mackinnon SE. Chronic nerve compression models for the double crush hypothesis. AnnPlast Surg 1991;26:259-264.
35. DeLongis A, Coyne JC, Dakof G, Folkman S, Lazarus RS. Relationship of daily hassles, uplifts, andmajor life events to health status. Health Psychol 1982;1:119-136.
36. Derriennic F, Iwatsubo Y, Monfort C, Cassou B. Evolution of osteoarticular disorders as a function ofpast heavy physical work factors. longitudinal analysis of 627 retired subjects living in the Paris area. BrJ Ind Med 1993;50:851-860.
37. Dickinson CE, Campion K, Foster AF, Newman SJ, O´Rourke AMT, Tho a, P.G. Questionnairedevelopment: an examination of the Nordic musculuskeletal questionnaire. Appl Ergonomics1992;23:197-201.
38. Djupsjöbacka M. Regulation of the y-muscle-spindle system by chemosensitive muscle afferents and jointafferents. A conceivable mechanism behind onset and spread of muscle tension. Thesis University ofUmeå, Sweden, 1994.
39. Dorland´s. Medical dictionary. Philadelphia: W.B. Saunders Co., 1988.
40. Eason RG, White CT. Muscular tension, effort, and tracking difficulty: studies of parameters which affecttension level and performance efficiency. Perc Mot Skills 1961;12:331-372.
41. Eberhardt K, Recht L, Wollheim F, Lithman T, Pettersson H, Schersten B. Detection of suspectedinflammatory joint disease with a new simple self-administered hand test. Br J Rheum 1988;27:457-461.
42. Eckenrode J. Impact of chronic and acute stressors on daily reports of mood. J Person Soc Psychol1984;46:907-918.
66
43. Edwards RHT. Hypotheses of peripheral and central mechanisms underlying occupational muscle painand injury. Eur J Appl Physiol 1988;57:275-281.
44. Eisler H. Subjective scale of force for a large muscle group. J Exp Psychol 1962;64:253-257.
45. Ekberg K, Eklund J, Tuvesson M-A, Odenrick P, Ericson M, Örtengren R. Psychic stress and muscleactivity during data entry at visual display units. Work Stress 1995;9:475-490.
46. Ekman G. Weber's law and related functions. J Psychol 1959;47:343-352.
47. Ekman G, Hosman B, Lindman R, Ljungberg L, Åkesson CA. Interindividual differences in scaling. PercMot Skills 1968;26:815-823.
48. Elert J, Rantapää-Dahlqvist S, Almay B, Eisemann M. Muscle endurance, muscle tension and personalitytraits in patients with muscle or joint pain - a pilot study. J Rheumatol 1993;20:1550-1556.
49. Feinstein AR. Clinimetrics. New Haven: Yale University Press, 1987.
50. Feinstein B, Langton JNK, Jameson RM, Schiller F. Experiments on pain referred from deep somatictissues. J Bone Joint Surg 1954;36A:981-997.
51. Ferner H, Staubesand J. Atlas der Anatomie des Menschen (Sobotta-Becher). Munchen:Urban&Schwarzenberg, 1973; vol 3.
52. Fleiss J. Statistical methods for rates and proportions. (2nd ed.) New York: John Wiley & Sons,1981:212-236. .
53. Fletcher R, Fletcher S, Wagner E. Clinical epidemiology: The essentials. (2:nd ed.) Baltimore, Maryland:Williams & Wilkins, 1988.
54. Flor H, Birbaumer N, Schugens MM, Lutzenberger W. Symptom-specific psychophysiological responsesin chronic pain patients. Psychophysiol 1992;29:452-460.
55. Flor H, Turk DC, Birbaumer N. Assessment of stress-related psychophysiological reactions in chronicback pain patients. J Consult Clin Psychol 1985;53:354-364.
56. Franzblau A, Salerno DF, Armstron TJ, Werner RA. Test-retest reliability of an upper-extremitydiscomfort questionnaire in an industrial population. Scand J Work Environ Health 1997;23:299-307.
57. Fredriksson K, Toomingas A, Torgén M, Bildt Thorbjörnsson C, Kilbom Å. A methodological study ofself-reported retrospectively collected data on sick-leave related to musculoskeletal diseases. Submitted.
58. Fridén J, Sjöström M, Ekblom B. A morphological study on delayed muscle soreness. Experientia1981;37:506-507.
59. Gajdosik RL, Bohannon RW. Clinical measurements of range of motion. Phys Ther 1987;67:1867-1872.
60. Galinsky TL, Rosa RR, Wheeler DD. Assessing muscular fatigue with a portable tremor measurementsystem suitable for field use. Behav Res Meth Instrum Comput 1990;22:507-516.
61. Gemne G, Saraste H. Bone and joint pathology in workers using hand-held vibrating tools. Scand J WorkEnviron Health 1987;13:290-300.
62. Gerber C. Integrated scoring system for the functional assessment of the shoulder. In: Matsen, Hawkings,ed. The shoulder. Rosemont Illinois: American Academy of Orthopaedic Surgeons, 1993: 531-550.
63. Gil KM, Phillips G, Abrams MR, Williams DA. Pain drawings and sickle cell disease pain. Clin J Pain1990;6:105-109.
64. Greene WB, Heckman JD, ed. The clinical measurement of joint motion. Rosemont, Illinois: AmericanAcademy of Orthopaedic Surgeons, 1994.
65. Greenleaf EA. Improving rating scale measures by detecting and correcting bias components in someresponse styles. J Mark Res 1992;29:176-188.
66. Greenleaf EA. Measuring extreme response style. Public Opin Q 1992;56:328-351.
67. Hagberg M. Work load and fatigue in repetetive arm elevations. Ergonomics 1981;24:543-555.
68. Hagberg M. Exposure variables in ergonomic epidemiology. Am J Ind Med 1992;21:91-100.
69. Hagberg M. Exposure considerations when evaluating musculoskeletal diagnoses. In: Mital A, KruegerH, Kumar S, Menozzi M, Fernandez J, ed. Advances in Occupational Ergonomics and Safety I. Zurich:International Society for Occupational Ergonomics and Safety, 1996: 411-415.

67
70. Hagberg M, Christiani D, Courtney TK, Halperin W, Leamon TB, Smith TJ. Conceptual and definitionalissues in occupational injury epidemiology. Am J Ind Med 1997;32:106-115.
71. Hagberg M, Kvarnström S. Muscular endurance and electromyographic fatigue in myofascial shoulderpain. Arch Phys Med Rehab 1984;65:522-525.
72. Hagberg M, Silverstein B, Wells R, et al., ed. Work related musculoskeletal disorders (WMSDs): areference book for prevention. 1:st ed. London: Taylor & Francis, 1995.
73. Hagberg M, Wegman DH. Prevalence rates and odds ratios of shoulder-neck diseases in differentoccupational groups. Br J Ind Med 1987;44:602-610.
74. Hagert C-G, Christenson JT. Hyperpressure in the trapezius muscle associated with fibrosis. Acta OrthopScand 1990;61:263-265.
75. Hansen SM, Jensen PL. Arbeidsmiljö og samfundsekonomi i Norden (Working environment and nationaleconomies in the Nordic countries). The Nordic Council of Ministers, 1993 (Report No.556).
76. Hansson G-Å, Strömberg U, Larsson B, Ohlsson K, Balogh I, Moritz U. Electromyographic fatigue inneck/shoulder muscles and endurance in women with repetitive work. Ergonomics 1992;35:1341-1352.
77. Happee R. Goal-directed arm movements: I analysis of emg records in shoulder and elbow muscles. JElectromyogr Kinesiol 1992;2:165-178.
78. Harlow SD, Linet MS. Agreement between questionnaire data and medical records. Evidence foraccuracy of recall. Am J Epidemiol 1989;129:233-248.
79. Hellebrandt FA, Duvall EN, Moore ML. The measurement of joint motion. Part III Reliability ofgoniometry. Phys Ther Rev 1949;29:302-307.
80. Hellström B. How often is often and how much is much? Gender, age and educational differences ininterpretation of verbal interval-scales. Department of Psychology, University of Stockholm, 1995(Master thesis in environmental psychology (in Swedish)).
81. Hendler NH, Kozikowski JG. Overlooked physical diagnoses in chronic pain patients involved inlitigation. Psychosomatics 1993;34:494-501.
82. Herberts P, Kadefors R, Högfors C, Sigholm G. Shoulder pain and heavy manual labor. Clin Orthop1984;191:166-178.
83. Hoppenfeld S. Physical examination of the spine and extremities. Norwalk, Connecticut: Appleton-Century-Crofts, 1976.
84. Houtman ILD, Bongers PM, Smulders PGW, Kompier MAJ. Psychosocial stressors at work andmusculoskeletal problems. Scand J Work Environ Health 1994;20:139-145.
85. Hui CH, Triandis HC. The instability of response sets. Public Opin Q 1985;49:253-260.
86. Hägg G. Static load and occupational myalgia: a new explanation modell. In: Anderson P, Hobart D,Danoff J, ed. Electromyographical kinesiology. Amsterdam: Elsevier, 1991: 141-144.
87. Ilmarinen J, Tuomi K, Klockars M. Changes in the work ability of active employees over an 11-yearperiod. Scand J Work Environ Health 1997;23 Suppl 3:49-57.
88. Jackson MJ, Jones DA, Edwards RHT. Experimental skeletal muscle damage: the nature of the calciumactivated degenerative processes. Eur J Clin Invest 1984;14:369-374.
89. Jamner LD, Schwartz GE. Self-deception predicts self-report and endurance of pain. Psychosom Med1986;48:211-223.
90. Jensen BR, Jörgensen K, Huijing PA, Sjögaard G. Soft tissue architecture and intramuscular pressure inthe shoulder region. Eur J Morphol 1995;33:205-220.
91. Johansson H, Sojka P. Pathophysiological mechanisms involved in genesis and spread of musculartension in occupational muscle pain and in chronic musculoskeletal pain syndromes: A hypothesis. MedHypotheses 1991;35:196-203.
92. Johansson JÅ. Psychosocial factors at work and their relation to musculoskeletal symptoms. ThesisDepartment of Psychology, University of Gothenburg, 1994.
93. Jones FN, Marcus MJ. The subject effect in judgement of subjective magnitude. J Exp Psychol1961;61:40-44.

68
94. Juvonen T, Satta J, Laitala P, Luukkonen K, Nissinen J. Anomalies at the thoracic outlet are frequent inthe general population. Am J Surg 1995;170:33-37.
95. Järvholm U. On Shoulder Muscle Load. An experimental study od muscle pressures, EMG and bloodflow. Thesis Department of Orthopaedics, University of Gothenburg, 1990.
96. Ka'kosy T. Tunnel syndromes of the upper extremities in workers using hand-operated vibrating tools.Med Lav 1994;85:474-480.
97. Katoaka Y. Pathogenesis of thoracic outlet syndrome: Diagnosis with neurography of the brachial plexus.J Jap Orthop Assoc 1994;68:357-366.
98. Katz JN, Stirrat CR, Larson MG, Fossel AH, Eaton HM, Liang MH. A self-administered hand symptomdiagram for the diagnosis and epidemiologic study of carpal tunnel syndrome. J Rheumatol1990;17:1495-1498.
99. Kehoe R, Wu S-Y, Leske MC, Chylack LT. Comparing self-reported and pshysican-reported medicalhistory. Am J Epidemiol 1994;139:813-818.
100. Kellgren JH. On the distribution of pain arising from deep somatic structures of segmental pain areas.Clin Sci 1939;4:35-46.
101. Kelly JP, Rosenberg L, Kaufman DW, Shapiro S. Reliability of personal interview data in a hospitalbased case-control study. Am J Epidemiol 1990;131:79-90.
102. Kihlberg S, Hagberg M. Hand-arm symptoms related to impact and nonimpact hand-held power tools. IntArch Occup Environ Health 1997;69:282-288.
103. Kilbom Å. Assessment of physical exposure in relation to work-related musculoskeletal disorders - whatinformation can be obtained from systematic observations? Scand J Work Environ Health 1994;20:30-45.
104. Kilbom Å. Repetetive work of the upper extremity: Part II - The scientific basis (knowledge base) for theguide. Int J Ind Ergon 1994;14:59-86.
105. Korthuis RJ, Granger DN. ischemaia-reperfusion injury: Role of oxygen-derived free radicals. In: TaylorAE, Matalon S, Ward PA, ed. Physiology of oxygen radicals. 1986: 217-249.
106. Krause SJ, Tait RC, Margolis RB. Pain duration, intensity and duration in patients with chronic pain. JPain Symptom Manage 1989;4:67-71.
107. Kristensen TS. The demand-control-suport model: methodological challenges for future research. StressMed 1995;11:17-26.
108. Kristensen TS. Job stress and cardiovascular disease: a theoretical critical review. J Occup Health Psych1996;1:246-260.
109. Krusen EM, Krusen UL. Cervical syndrome especially the tension-neck problem: clinical study of 800cases. Arch Phys Med Rehabil 1955;518-523.
110. Kuorinka I, Jonsson B, Kilbom Å, et al. Standardised Nordic questionnaires for the analysis ofmusculoskeletal symptoms. Appl Ergonomics 1987;18:233-237.
111. Kurppa K, Viikari-Juntura E, Kuosma E, Riihimäki H, Huuskonen M, Moneta G. Reliability ofretrospective questionnaire data on one-year occurence of epicondylitis or tenosynovitis/peritendinitis.39:e Nordiska Arbetsmiljömötet. Aulanko, Finland: Institute of Occupational Health, Finland, 1990: 99.
112. Landis J, Koch G. The measurement of observer agreement for categorical data. Biometrics 1977;33:159-174.
113. Larsson B, Libelius R, Ohlsson K. Trapezius muscle changes unrelated to static work load. Acta OrthopScand 1992;63:203-206.
114. Larsson S-E, Bengtsson A, Bodegård L, Henriksson KG, Larsson J. Muscle changes in work-relatedchronic myalgia. Acta Orthop Scand 1988;59:552-556.
115. Leffert RD. Thoracic outlet syndromes. Hand Clinics 1992;8:285-297.
116. Leino P, Hänninen V. Psychosocial factors at work in relation to back and limb disorders. Scand J WorkEnviron Health 1995;21:134-142.
117. Lindblom U, Németh G. Smärttyper med eftersatt differentialdiagnostik (Pain characters with neglecteddifferential diagnostics - In Swedish). Läkartidningen 1992;89:1392-99.

69
118. Lindman R, Hagberg M, Bengtsson A, Henriksson K, Thornell L-E. Capillary structure andmitochondrial volume density in the trapezius muscle of chronic trapezius myalgia, fibromyalgia andhealthy subjects. J Musc Pain 1995;3:6-22.
119. Lindman R, Hagberg M, Ängqvist K-A, Söderlund K, Hultman E, Thornell L-E. Changes in musclemorphology in chronic trapezius myalgia. Scand J Work Environ Health 1991;17:347-355.
120. Linton SJ. Risk factors for neck and back pain in a working population in Sweden. Work Stress1990;4:41-49.
121. Low JL. The reliability of joint measurement. Physiotherapy 1976;62:227-229.
122. Lundberg U, Kadefors R, Melin B, et al. Psychophysiological stress and EMG activity of the trapeziusmuscle. Int J Beh Med 1994;4:354-370.
123. Lundborg G. Nerve injury and repair. (1:st ed.) New York: Churchill Livingstone, 1988.
124. Lundeberg T. Pain physiology and principles of treatment. Scand J Rehabil Med 1995;Suppl. 32:13-42.
125. Lundervold AJS. Electromyographic investigations of position and manner of working in typewriting.Thesis Pharmacological Institute, University of Oslo, 1951.
126. Lyberg L, Biemer P, Collins M, et al., ed. Survey measurement and process quality. New York: JohnWiley & Sons, 1997.
127. Läubli T, Thomas C, Hinnen U, et al. Are questionnaire surveys a valid instrument to assassmusculoskeletal disorders? Designing for everyone. 11:th congress of the International ErgonomistAssociation. Paris: , 1991: 254-256.
128. Mackinnon SE. Double and multiple "crush" syndromes. Hand Clinics 1992;8:369-390.
129. Mantel N, Haenszel W. Statistical aspects of analysis of data from retrospective studies of disease. J NatCancer Inst 1959;22:719-748.
130. Margolis RB, Chibnall JT, Tait RC. Test-retest reliability of the pain drawing instrument. Pain1988;33:49-51.
131. Margolis RB, Krause SJ, Tait RC. Lateralization of chronic pain. Pain 1985;23:289-293.
132. Margolis RB, Tait RC, Krause SJ. A rating system for use with patient pain drawings. Pain 1986;24:57-65.
133. Marley RJ, Kumar N. An improved musculoskeletal discomfort assessment tool. In: Aghazadeh F, ed.Advances in Industrial Ergonomics and Safety VI. Taylor & Francis, 1994: 45-52.
134. Mason J, Andersson J, Meenan R, Haralson K, Lewis-Stevens D, Kaine J. The rapid assessment ofdisease activity in rheumatology (RADAR) questionnaire. Validity and sensitivity to change of a patientself-report measure of joint count and clinical status. Arthr Rheum 1992;35:156-162.
135. Matte TD, Baker EL, Honchar PA. The selection and definition of target work-related conditions forsurveillance under SENSOR. Am J Public Health 1989;79(suppl):21-25.
136. McAtamney L, Corlett EN. RULA: a survey method for the investigation of work -related upper limbdisorders. Appl Ergonomics 1993;24:91-99.
137. McDowell I, Newell C. Measuring health: A guide to rating scales and questionnaires. Oxford: OxfordUniversity Press, 1987.
138. McNeill TW, Sinkora G, Leavitt F. Psychologic classification of low-back pain patients: a prognostictool. Spine 1986;11:955-959.
139. McRae R. Clinical orthopaedic examination. (4:th ed.) New York: Churchill Livingstone, 1997.
140. Medical Research Council. Aids to the examination of the peripheral nervous system. Her Majesty'sStationery office, 1976 (Memorandum No. 45).
141. Melzack R. The McGill Pain Questionnaire: Major properties and scoring methods. Pain 1975;1:277-299.
142. Melzack R. The short form McGill Pain Questionnaire. Pain 1987;30:191-197.
143. Merskey H, Bogduk N, ed. Classification of chronic pain. Description of chronic pain syndromes anddefinitions of pain terms. 2nd ed. Seattle: IASP Press, 1994.
144. Miettinen OS. Estimability and estimation in case-referent studies. Am J Epidemiol 1976;103:226-235.

70
145. Moore ML. The measurement of joint motion: Part I Introductory review of the litterature. Phys Ther Rev1949;29:195-205.
146. Morch M, ed. Yearbook of Nordic statistics 1996. Copenhagen: Nordic Council of Ministers, 1996.
147. Moyle P. The role of negative affectivity in the stress process; tests of alternative models. J Org Behav1995;16:647-668.
148. Mäkelä M. Common musculoskeletal syndromes. Prevalence, risk indicators and disability in Finland.Thesis Department of Public Health Science, University of Helsinki, 1993.
149. Nathan PA, Keniston RC, Myers LD, Meadows KD. Obesity as a risk factor for slowing of sensoryconduction of the median nerve in industry. J Occup Med 1992;34:379-383.
150. National Board of Occupational Safety and Health, Statistics Sweden. Occupational Diseases andoccupational accidents 1995 (In Swedish with English summary and legends). 1997
151. Norell SE. A short course in epidemiology. (1 ed.) New York: Raven Press, 1992.
152. Norrish A, North D, Kirkman P, Jackson R. Validity of self-reported hospital admission in a prospectivestudy. Am J Epidemiol 1994;140:938-942.
153. Novak CB, Mackinnon SE, Patterson GA. Evaluation of patients with thoracic outlet syndrome. J HandSurg 1993;18A:292-299.
154. Novak CB, Mackinnon SE, Patterson GA. Thoracic Outlet Compromise. In: Peimer CA, ed. Surgery ofthe upper extremity. New York: McGraw-Hill, 1996: 1465-1482.
155. Ohlsson K, Attewell RG, Johnsson B, Ahlm A, Skerfving S. An assessment of neck and upper extremitydisorders by questionnaire and clinical examination. Ergonomics 1994;37:891-897.
156. Olgart L. Genombrott inom smärtforskningen (Breakthrough in pain research). Läkartidningen 1997;94(in Swedish):4461-4466.
157. Palmer H. A description of a technique whereby functional pain may be diagnosed from organic pain. N ZMed J 1949;48:187-213.
158. Passero P, Paradiso C, Giannini F, Cioni R, Burgalassi L, Battistini N. Diagnosis of thoracic outletsyndrome. Acta Neurol Scand 1994;90:179-185.
159. Patte D. Directions for the use of the index severity for painful and/or chronically disabled shoulders.First open congress of the Erupean Society of Surgery of the Shoulder and the Elbow. Paris: 1987: 36-41.
160. Pearlin LI, Lieberman MA, Menaghan EG, Mullan JT. The stress process. J Health Soc Behav1981;22:337-356.
161. Pec´ina MM, Krmpotic´-Nemanic´ J, Markiewitz AD. Tunnel syndromes. Peripheral nerve compressionsyndromes. (2:nd ed.) New York: CRC, 1997.
162. Poulton EC. Biases in quantitative judgements. Appl Ergonomics 1982;13:31-42.
163. Rafusson V, Steingrimsdottir OA, Olafsson MH, Sveinsdottir T. Muskuloskeletala besvär blandislänningar (Musculoskeletal disorders among Icelanders). Nord Med 1989;104 (in Swedish):1070.
164. Rainer GW, Mayer J, Sadler TR, Dirks D. Effect of graded compression on nerve conduction velocity.Arch Surg 1973;107:719-721.
165. Ransford AO, Cairns D, Mooney V. The pain drawing as an aid to the psychologic evaluation of patientswith low -back pain. Spine 1976;1:127-134.
166. Rasmussen BK, Jensen R, Olesen J. Questionnaire versus clinical interview in the diagnosis of headache.Headache 1991;290-295.
167. Recht L, Lithman T, Rasmussen J, Mathiesen F. A test to detect hand dysfunction. Practitioner1988;232:1236-1239.
168. Reeves JL, Jaeger B, Graff-Radford SB. Reliability of the pressure algometer as a measure of myofascialtrigger point sensitivity. Pain 1986;24:313-321.
169. Reich W. Character analysis. (3:rd ed.) London: Lowe & Brydone, 1948.
170. Research Committee ASES. A standardized method for the assessment of shoulder function. J ShoulderElbow Surg 1994;3:347-352.

71
171. Ribbe EB, Lindgren SHS, Norgren LEH. Clinical diagnosis of thoracic outlet syndrome - evaluation ofpatients with cervicobrachial symptoms. Manual Medicine 1986;2:82-85.
172. Riihimäki H, Videman T, Tola S. Reliability of retrospective questionnaire data on the history of lowback pain. 7:th International Symposium on Epidemiology in Occupational Health. Tokyo: 1989: 97.
173. Roos D. Congenital anomalies associated with thoracic outlet syndrome. Anatomy, symptoms, diagnosisand treatment. Am J Surg 1976;132:771-778.
174. Roos DB. Pathophysiology of congenital anomalies in thoracic outlet syndrome. Acta Chir Belg1980;5:353-361.
175. Rorer LG. The great response-style myth. Psychol Bull 1965;63:129-156.
176. Rosecrance JC, Cook TM, Zimmerman CL. Active surveillance for the control of cumulative traumadisorders: A working model in the newspaper industry. JOSPT 1994;19:267-276.
177. Roskies E, Louis-Guerin C, Fournier C. Coping with job insecurity: How does personality make adifference? J Org Behav 1993;14:617-630.
178. Rothman KJ. Modern epidemiology. (1:st ed.) Boston: Little, Brown and Company, 1986:358.
179. Ryden O, Lindal E, Uden A, Hansson B. Differentiation of back pain patients using a pain questionnaire.Scand J Rehabil Med 1985;17:155-161.
180. Rydevik B, Lundborg G, Bagge U. Effects of graded compression on intraneural blood flow. J Hand Surg1981;6:3-12.
181. Sackett DL, Haynes RB, Tugwell P. Clinical epidemiology. Boston: Little, Brown and Company, 1985.
182. Sanders RJ, Haug CE. Thoracic outlet syndrome A common sequela of neck injuries. Philadelphia:Lippincott Co., 1991:341.
183. Sanders RJ, Jackson CG, Banchero N, Pearce WH. Scalene muscle abnormalities in traumatic thoracicoutlet syndrome. Am J Surg 1990;159:231-236.
184. Sandmark H, Nisell R. Measurement of pain among electricians with neck dysfunction. Scand J RehabilMed 1994;26:203-209.
185. Schroeder DH, Costa PTJ. Influence of life event stress on physical illness: Substantive effects ormethodological flaws? J Person Soc Psychol 1984;46:853-863.
186. Schuldt K. On neck muscle activity and load reduction in sitting postures. Scand J Rehabil Med1988;Supplement No.19:9-49.
187. Schuldt K, Harms-Ringdahl K. Activity levels during isometric test contractions of neck and shouldermuscles. Scand J Rehabil Med 1988;20:117-127.
188. Scott J, Huskisson EC. Graphic representation of pain. Pain 1976;2:175-184.
189. Shagass C, Malmo RB. Psychodynamic themes and localized muscular tension during psychotherapy.Psychosom Med 1954;16:295-314.
190. Shipman WG, Oken D, Balshan Goldstein I, Grinker RR, Heath HA. Study in psychophysiology ofmuscle tension. II Personality factors. Arch Gen Psychiatry 1964;11:330-345.
191. Silverstein BA. The prevalence of upper extremity cumulative trauma disorders in industry. ThesisUniversity of Michigan, 1985.
192. Spurling RG, Scoville WB. Lateral rupture of the cervical intervertebral discs. Surg Gynecol Obstetr1944;78:350-358.
193. Statistics Sweden. Statistical yearbook of Sweden. Stockholm: 1997.
194. Statistics Sweden, National Board of Occupational Safety and Health. The working environment 1995.1997 (Report No. AM 68 SM 9601).
195. Stenlund B, Goldie I, Hagberg M, Hogstedt C, Marions O. Radiographic osteoarthrosis in theacromioclavicular joint resulting from manual work or exposure to vibration. Br J Ind Med 1992;49:588-593.
196. Stevens SS. On the psychophysical law. Psychol Rev 1957;64:153-181.
197. Stevens SS, Galanter EH. Ratio scales and category scales for a dozen perceptual continua. J ExpPsychol 1957;54:377-411.

72
198. Streiner DL, Norman GR. Health measurement scales A practical guide to their development and use.(2:nd ed.) Oxford: Oxford University Press, 1995.
199. Stuart-Buttle C. A discomfort survey in a poultry-processing plant. Appl Ergonomics 1994;25:47-52.
200. Svebak S, Braathen ET, Sejersted OM, Bowim B, Fauske S, Laberg J. Electromyographic activation andproportion of fast versus slow twitch muscle fibers: A genetic disposition for psychogenic muscletension? Int J Psychophysiol 1993;15:43-49.
201. Szabo RM, Chidgey LK. Stress carpal tunnel pressures in patients with carpal tunnel syndrome andnormal patients. J Hand Surg 1989;14A:624-627.
202. Sällström J, Schmidt H. Cervicobrachial disorders in certain occupations, with special reference tocompression in the thoracic outlet. Am J Ind Med 1984;6:45-52.
203. Teghtsoonian R. The study of individuals in psychophysical measurement. In: Ljunggren G, Dornic S, ed.Psychophysics in Action. Berlin/Heidelberg: Springer Verlag, 1989: 95-102.
204. Theorell T. Possible mechanisms behind the relationship between the demand-control-support model anddisorders in the locomotor system. In: Moon SD, Sauter S, ed. Beyond biomechanics - psychosocialaspects of musculoskeletal disorders in office work. Taylor & Francis, 1996: 65-73.
205. Theorell T, Harms-Ringdahl K, Ahlberg-Hultén G, Westin B. Psychosocial job factors and symptomsfrom the locomotor system-a multicausal analysis. Scand J Rehabil Med 1991;23:165-173.
206. Theorell T, Michélsen H, Nordemar R, Stockholm MUSIC 1 Study Group. Validitetsprövningar avpsykosociala indexbildningar (Validity of the psychosocial indexes). In: Hagberg M, Hogstedt C, ed.Stockholmsundersökningen 1. Utvärdering av metoder för att mäta hälsa och exponeringar iepidemiologiska studier av rörelseorganens sjukdomar. (The Stockholm 1 study. Evaluation of methods tomeasure health and exposure in epidemiologic studies.). Stockholm: MUSIC Books, 1993: 163-177.
207. Theorell T, Nordemar R, Michélsen H, Stockholm MUSIC I Study Group. Pain thresholds duringstandardized psychological stress in relation to perceived psychosocial work situation. J Psychosom Res1993;37:299-305.
208. Toomey TC, Gover VF, Jones BN. Spatial distribution of pain: a descriptive characteristic of chronicpain. Pain 1983;17:289-300.
209. Toomey TC, Mann JD, Abashian S, Thompson-Pope S. Relationship of pain drawing scores to ratings ofpain description and function. Clin J Pain 1991;7:269-274.
210. Toomingas A, Németh G, Hagberg M. Besvärsförekomst, kliniska fynd samt diagnoser i nacke, skuldroroch axlar i Stockholmsundersökningen 1 (Prevalence of symptoms, signs and diagnoses in the StockholmStudy 1). In: Hagberg M, Hogstedt C, ed. Stockholmsundersökningen 1. Data från entvärsnittsundersökning av ergonomisk och psykosocial exponering samt sjuklighet och funktion irörelseorganen (The Stockholm Study 1. Data from a cross-sectional study of ergonomical andpsychosocial exposure and disorders and function in the musculoskeletal system). Stockholm: MUSICBooks, 1991: 175-196.
211. Torebjörk HE, Ochoa JL, Schady W. Referred pain from intraneural stimulation of muscle fascicles in themedian nerve. Pain 1984;18:145-156.
212. Turk DC, Melzack R, ed. Handbook of pain assessment. New York: The Guilford Press, 1992:491.
213. Uden A, Landin LA. Pain drawing and myelography in sciatic pain. Clin Orthop 1987;216:124-130.
214. Uden A, Åström M, Bergenudd H. Pain drawings in chronic back pain. Spine 1988;13:389-392.
215. Upton ARM, McComas AJ. The double crush in nerve-entrapment syndromes. The Lancet 1973;359-362.
216. Ursin H, Endresen I, Svebak S. Muscle pain and coping with working life in Norway: a review. WorkStress 1993;7:247-258.
217. Wærsted M, Bjørklund RA, Westgaard RH. The effect of motivation on shoulder-muscle tension inattention-demanding tasks. Ergonomics 1994;37:363-376.
218. Waersted M, Eken T, Westgaard RH. Psychogenic motor unit activity: A possible muscle injurymechanism studied in a healthy subject. J Musc Pain 1993;1:185-190.
219. Walton J, Beeson PB, Bodley Scott R, ed. The Oxford companion to medicine. Oxford: Oxforduniversity press, 1986.

73
220. Valtonen E. The tension neck syndrome, its etiology, clinical features and results of physical treatment.Ann Med Int Fenn 1968;57:139-142.
221. van der Grinten MP. Test-retest reliability of a practical method for measuring body part discomfort.Designing for everyone. 11:th congress International Ergonomist Association. Paris: 1991: 54-56.
222. Waris P, Kourinka I, Kurppa K, et al. Epidemiologic screening of occupational neck and upper limbdisorders. Scand J Work Environ Health 1979;5:25-38.
223. Vasseljen O. Work-related shoulder and neck pain with reference to muscle activity, individual factors,and psychosocial exposures. Thesis The Norwegian Institute of Technology, Division of Organizationand Work Science, University of Trondheim, 1995.
224. Watson D, Clark LA. Negative Affectivity: The disposition to experience aversive emotional states.Psychol Bull 1984;96:465-490.
225. Watson D, Pennebaker JW. Health complaints, stress, and distress: Exploring the central role of negativeaffectivity. Psychol Rev 1989;96:234-254.
226. Weber A, Fussler C, O´Hanlon JF, Gierer R, Grandjean E. Psychophysiological effects of repetitive tasks.Ergonomics 1980;23:1033-1046.
227. Veiersted KB. Stereotyped light manual work, individual factors and trapezius myalgia. ThesisDepartment Group for Community Medicine, University of Oslo, 1995.
228. Veiersted KB, Westgaard RH. Subjectively assessed occupational and individual parameters as riskfactors for trapezius myalgia. Int J Ind Ergon 1994;13:235-245.
229. Westgaard RH, Jensen C, Hansen K. Individual and work-related risk factors associated with symptomsof musculoskeletal complaints. Int Arch Occup Environ Health 1993;64:405-413.
230. Westgard RH, Jensen C, Nilsen K. Muscle coordination and choice-reaction time test as indicators ofoccupational muscle load and shoulder-neck complaints. Eur J Appl Physiol 1993;67:106-114.
231. WHO. Identification and control of work related diseases. World Health Organization, 1985 (TechnicalReport Series no. 714).
232. WHO. ICD-10 International statistical classification of diseases and related health problems. (10:th ed.)Geneva: World Health Organisation, 1992; vol 1.
233. Wieslander G, Norbäck D, Göthe C-J, Juhlin L. Carpal tunnel syndrome (CTS) and exposure to vibration,repetetive wrist movements, and heavy manual work: a case referent study. Br J Ind Med 1989;46:43-47.
234. Wigaeus Hjelm E, Winkel J, Nygård C-H, Wiktorin C, Karlqvist L, Stockholm MUSIC 1 Study Group.Can cardiovascular load in ergonomic epidemiology be estimated by self-report? J Occup Env Med1995;37:1210-1217.
235. Viikari-Juntura E. Interexaminer reliability of observations in physical examinations of the neck. PhysTher 1987;67:1526-1532.
236. Viikari-Juntura E, Porras M, Laasonen EM. Validity of clinical tests in the diagnosis of root compressionin cervical disc disease. Spine 1989;14:253-257.
237. Viikari-Juntura E, Rauas S, Martikainen R, et al. Validity of self-reported physical work load inepidemiologic studies on musculoskeletal disorders. Scand J Work Environ Health 1996;22:251-259.
238. Wiktorin C, Karlqvist L, Winkel J, Stockholm MUSIC I Study Group. Validity of self-reported exposuresto work postures and manual materials handling. Scand J Work Environ Health 1993;19:208-214.
239. Wiktorin C, Selin K, Ekenvall L, Kilbom Å, Alfredsson L. Evaluation of perceived and self-reportedmanual forces exerted in occupational materials handling. Appl Ergonomics 1996;27:231-239.
240. Wiktorin C, Wigaeus Hjelm E, Winkel J, Köster M, Stockholm MUSIC I Study Group. Reproducibilityof a questionnaire for assessment of physical load during work and leisure time. J Occup Env Med1996;38:190-201.
241. Winkel J, Mathiassen SE. Assessment of physical work load in epidemiologic studies: concepts, issuesand operational considerations. Ergonomics 1994;37:979-988.
242. von Korff M, Ormel J, Keefe F, Dworkin S. Grading the severity of chronic pain. Pain 1992;50:133-149.
243. von Ludwig J. Psychoanalytisch-psychophysiologische Untersuchungen bei Patienten mit funktionellenCervikalsyndrom. Ztg Psychosom Med 1978;24:101-115.

74
244. Wood VE, Biondi J, Linda L. Double-crush nerve compression in thoracic-outlet syndrome. J Bone JointSurg 1990;72A:85-87.
245. Zarski JJ. Hassles and health: A replication. Health Psychol 1984;3:243-251.246. Öhlund C, Eek C, Palmblad S, Areskoug B, Nachemson A. Quantified pain drawing in subacute low back
pain. Spine 1996;21:1021-1031.