methods of analysis by the u.s. geological survey national
TRANSCRIPT

Methods of Analysis by the U.S. Geological Survey National Water �Quality Laboratory—Determination of Gasoline Oxygenates, Selected �Degradates, and BTEX in Water by Heated Purge and Trap/Gas�Chromatography/Mass Spectrometry
______________________________________________________________________
Water-Resources Investigations Report 03–4079
U.S. Department of the Interior�U.S. Geological Survey

Methods of Analysis by the U.S. Geological Survey National Water �Quality Laboratory—Determination of Gasoline Oxygenates, Selected �Degradates, and BTEX in Water by Heated Purge and Trap/Gas�Chromatography/Mass Spectrometry
By Donna L. Rose and Mark W. Sandstrom______________________________________________________________________
U.S. Geological SurveyWater-Resources Investigations Report 03–4079
U.S. Geological Survey Method O-4024-03Laboratory Method (Schedules) 4024 and 4025
Denver, Colorado2003

U.S. DEPARTMENT OF THE INTERIORGale A. Norton, Secretary
U.S. GEOLOGICAL SURVEYCharles G. Groat, Director
The use of trade, product, or firm names in this report is for descriptive purposes only and does not imply endorsement by the U.S. Government._____________________________________________________________________________For additional information write to: Copies of this report can be purchased from:
U.S. Geological Survey U.S. Geological SurveyChief, National Water Quality Laboratory Branch of Information ServicesBox 25046, Mail Stop 407 Box 25286Federal Center Federal CenterDenver, CO 80225-0046 Denver, CO 80225-0286

CONTENTSAbstract .............................................................................................................................................................. 1Introduction ......................................................................................................................................................... 1
Purpose and scope ......................................................................................................................................... 2Acknowledgments ......................................................................................................................................... 2
Analytical method ............................................................................................................................................... 21. Scope and application............................................................................................................................... 22. Summary of method ................................................................................................................................. 43. Interferences ............................................................................................................................................. 44. Instrumentation......................................................................................................................................... 55. Apparatus and equipment ......................................................................................................................... 56. Reagents ................................................................................................................................................... 57. Standard solutions .................................................................................................................................... 68. Sample collection, blank collection, preservation, and storage ............................................................... 89. Instrument performance ........................................................................................................................... 10
10. Calibration ................................................................................................................................................ 1111. Quality control ......................................................................................................................................... 1212. Procedure for sample analysis.................................................................................................................. 1613. Identification and quantitation ................................................................................................................. 1614. Reporting of results ................................................................................................................................. 1715. Calculation of method detection limits and the laboratory reporting levels............................................ 1916. Method development ............................................................................................................................... 1917. Sample preservation and recommended holding time............................................................................. 21
Summary and conclusions.................................................................................................................................... 26References cited ................................................................................................................................................... 30
FIGURES1–4. Graphs showing:1. Typical set blank chromatogram for determining gasoline oxygenates, selected degradates, �
and BTEX in water samples..................................................................................................................... 132. Typical continuing calibration verification standard chromatogram for determining gasoline �
oxygenates and selected degradates in water samples at 1 to 10 micrograms per liter ............................ 143. Example of a total ion chromatogram, mass chromatogram, and mass spectrum for tert-butyl �
alcohol (tBA) that passed all identification criteria, at a concentration of 5 micrograms �per liter in a ground-water sample ............................................................................................................ 17
4. Example of a total ion chromatogram, mass chromatogram, and mass spectrum for �tert-butyl methyl ether that failed identification criteria at an estimated concentration of �0.01 microgram per liter in a ground-water sample ................................................................................. 18
5. Boxplot showing recovery of gasoline oxygenates, oxygenate degradates, and BTEX in �volatile-grade blank water, ground-water, and surface-water spikes, ranging in concentration from �0.5 to 50 micrograms per liter.................................................................................................................. 23
6. Boxplot showing recovery of gasoline oxygenates, oxygenate degradates, and BTEX from �the holding-time study for day 0 to day 46 at pH 2 and pH 7 ................................................................. 28
Contents iii

TABLES1. Purgeable volatile organic compounds tested for bias and precision in this method .............................. 32. Purge and trap capillary-column gas chromatography/mass spectrometry �
operating conditions ................................................................................................................................. 63. Suggested concentrations for working calibration standard solution, calibration ranges, �
and working spike solution ..................................................................................................................... 84. Gas chromatograph/mass spectrometer evaluation using p-bromofluorobenzene .................................. 105. Quantitation ions and secondary and tertiary ions for volatile organic compounds listed�
in order of chromatographic retention time ............................................................................................. 116. Suggested analytical sequence with a calibration curve or with continuing calibration.......................... 127. Short-term method detection limits and interim reporting levels ............................................................ 208. Bias and precision at 65 degrees Celsius for selected volatile organic compounds in �
volatile-grade blank-water, ground-water, and surface-water samples for seven replicates, �each spiked at two concentrations ranging from 0.5 to 50 micrograms per liter..................................... 22
9. Results of a 2.0-microgram-per-liter (or greater) preservation study in surface-water�samples from Boulder Creek, Colorado, pH 7......................................................................................... 24
10. Results of a 2.0-microgram-per-liter (or greater) preservation study in volatile-grade�blank water, pH 2 ..................................................................................................................................... 25
11. Calculated holding times from preservation study in volatile-grade blank water, pH 2 ......................... 2612. Calculated holding times from preservation study in volatile-grade blank water, pH 7 ......................... 2713. Results of the Mann–Whitney statistical test for pH 2 and pH 7 ............................................................ 29
iv Contents

CONVERSION FACTORS AND ABBREVIATED WATER-QUALITY UNITS
Degrees Celsius (�C) may be converted to degrees Fahrenheit (�F) by using the following equation:
�F = (1.8 � �C) + 32.
The following water-quality terms also are used in this report:��
microgram per milliliter (µg/mL)��
milliliter per minute (mL/min)
Multiply By To obtain
Length
centimeter (cm) 3.94 x 10⁻¹ inchmicrometer (�m) 3.94 x 10⁻⁵ inch millimeter (mm) 3.94 x 10⁻² inch
meter (m) 3.281 foot
Volume
liter (L) 2.64 x 10⁻¹ gallon microliter (�L) 2.64 x 10⁻⁷ gallon milliliter (mL) 2.64 x 10⁻⁴ gallon
Mass
milligram (mg) 3.53 x 10⁻⁵ ounce, avoirdupois
Pressure
kilopascal (kPa) 1.45 x 10⁻¹ pounds per square inch
Concentration, in water
milligrams per liter (mg/L) 1 part per million (ppm)micrograms per liter (�g/L) 1 part per billion (ppb)nanograms per liter (ng/L) 1 part per trillion (ppt)
Contents v

ABBREVIATIONS AND ACRONYMS
ASR Analytical Services Request form�
BFB p-bromofluorobenzene�BLK set blank�BTEX benzene, toluene, ethylbenzene, and xylenes�CAL calibration standard�CAS Chemical Abstracts Service�CCV continuing calibration verification standard�COB carryover blank�DIPE diisopropyl ether�ETBE ethyl tert-butyl ether�eV electron volt�GC gas chromatograph�GC/MS gas chromatography/mass spectrometry�ID inside diameter�IRL interim reporting level�ISTD internal standard�LRL laboratory reporting level�LT–MDL long-term method detection level�MDL method detection limit�MS mass spectrometer�MSD mass selective detector�MTBE methyl tert-butyl ether�m/z mass-to-charge ratio�na not applicable�NAWQA National Water-Quality Assessment Program�
nd not determined�NIST National Institute of Standards and Technology�NWIS National Water Information System�
NWQL National Water Quality Laboratory�RRL raised reporting level�RSD relative standard deviation�RT retention time�s second�SURRIS surrogate standard/internal standard solution�TAME tert-amyl methyl ether�tBA tert-butyl alcohol�tAA tert-amyl alcohol�UHP ultrahigh purity�USEPA U.S. Environmental Protection Agency�USGS U.S. Geological Survey�VBW volatile-grade blank water�VOC volatile organic compound�
vi Contents

GLOSSARY
Analyte—The substance being determined in an analysis.
Analytical sequence—A batch of samples and corresponding quality-control (QC) samples analyzed together. QC samples include continuing calibration verification standards (CCVs), set spikes, set blanks, and laboratory reporting level (LRL) spikes. Typically a sequence represents 19 samples, 4 CCVs, 1 set spike, 3 blanks, and �2 LRL spikes.
Bias—Systematic error inherent in a method or caused by some artifact or idiosyncrasy of the measurement �system. The error can be positive (indicating contamination) or negative (indicating loss of analyte �concentration) (Taylor, 1987).
Laboratory reporting level (LRL)—The minimum concentration level for a substance not identified, measured, or confirmed with at least 99-percent confidence by an analytical method. A substance not identified, measured, or confirmed by an analytical method will be reported as <LRL. Under normal circumstances, the LRL for the �substance is two times the LT–MDL concentration for the method.
Long-term method detection level (LT–MDL)—The minimum concentration of a substance that can be identified, measured, and reported with 99-percent confidence that the analyte concentration is greater than zero. The �LT–MDL is determined from replicate analyses of a known sample in a clean or volatile blank water (VBW) matrix containing analyte. The LT–MDL includes bias introduced by multiple instruments, multiple �analysts, and multiple calibrations over an extended time.
Method detection limit (MDL)—The minimum concentration of a substance that can be identified, measured, and reported with 99-percent confidence that the analyte concentration is greater than zero. The MDL is determined by analyzing a sample in a clean or VBW matrix containing analyte.
Precision—The degree of mutual agreement characteristic of independent measurements as the result of repeated application of the process under specified conditions (Taylor, 1987).
Contents vii

Methods of Analysis by the U.S. Geological Survey National Water Quality Laboratory—Determination of Gasoline Oxygenates, Selected Degradates, and BTEX in Water by Heated Purge and Trap/Gas Chromatography/Mass Spectrometry
By Donna L. Rose and Mark W. Sandstrom
oxygenate degradates, and 0.005 to 0.036 µg/L for
AbstractA method for determination of the alkyl ethers used as gasoline oxygenates [ethyl tert-butyl ether (ETBE), methyl tert-butyl ether (MTBE), diisopropyl ether (DIPE), and tert-amyl methyl ether (TAME)], some of their main degradates [acetone, methyl acetate, tert-butyl alcohol (tBA), and tert-amyl alcohol (tAA)], and BTEX (benzene, toluene, ethylbenzene, and xylenes) at low concentrations (<5 micrograms per liter) in water samples was developed. The compounds are determined using heated extraction to improve purging of polar compounds in a standard gas chromatography/mass spectrometry (GC/MS) method for volatile compounds. Volatile compounds in this method are extracted (purged) from the sample by bubbling helium through a 25-mL (milliliter) sample heated at about 65°C. Volatile compounds are trapped on a sorbent and then thermally desorbed into a GC/MS system for identification and quantitation. The calibration range for this method is 0.1 to 200 µg/L (micrograms per liter). Mean gasoline oxygenate recoveries from volatile-grade blank-water samples analyzed at concentrations from 0.5 to 5.0 µg/L were 95 to 105 percent, with relative standard deviations (RSDs) from 1.9 to 3.2 percent. Mean oxygenate degradate recoveries ranged from 88 to 107 percent, with RSDs of 3.2 to 7.4 percent, at concentrations from 1 to 50 µg/L. Mean BTEX recoveries ranged from 91 to 107 percent, with RSDs of 1.1 to 6.6 percent, at concentrations from 0.5 to 10 µg/L . The method detection limits range from 0.035 to 0.052 µg/L for the gasoline oxygenates, 0.216 to 0.62 µg/L for the
BTEX. Calculated holding times using American Society for Testing and Materials (ASTM) procedure D 4841-88 indicate that all of the analytes are stable for a minimum of 40 days at pH 2 and pH 7, except for methyl acetate, which is only stable for 7 days at pH 2.
INTRODUCTION
Oxygenated gasoline is designed to increase combustion efficiency or enhance octane rating, thereby reducing carbon monoxide emissions from motor vehicles. The oxygen content of gasoline is increased by addition of fuel oxygenates. The main fuel oxygenates used in the United States are methyl tert-butyl ether (MTBE) and ethanol. Other oxygenates in use, or that potentially might be used, include ethyl tert-butyl ether (ETBE), dissopropyl ether (DIPE), and tert-amyl methyl ether (TAME). The widespread use of oxygenated gasoline, combined with the high water solubility of the oxygenates, has resulted in point and nonpoint source releases of oxygenates to the environment (National Science and Technology Council, 1997; Squillace and others, 1999). In the environment these oxygenates can transform to degradates, which have different fates and susceptibilities to degradation.
To study the fate of the gasoline oxygenates, it is important to determine the degradates as well as the parent compounds. The alkyl ether oxygenates are more difficult to remove from water by purging than other gasoline components, as indicated by their lower
Introduction 1

Henry's Law (H) constants. The alcohol degradates of these alkyl ethers, tert-butyl alcohol (tBA) and tert-amyl alcohol (tAA), are even more difficult to remove, as indicated by H constants about 3 orders of magnitude lower than the alkyl ethers (National Science and Technology Council, 1997). Various analytical methods for oxygenates, including purge and trap (Connor and others, 1998), heated purge and trap (Lee and others, 1998), direct aqueous on-column injection (Church and others, 1997), and solid-phase microextraction (Achten and Puttmann, 2000; Cassada and others, 2000) recently have been reported. The direct aqueous on-column injection and the solid-phase microextraction methods provide detection levels suitable for monitoring the oxygenates and degradates at low (<5 µg/L) concentrations, although both require instrument modifications and equipment, such as moisture-control traps, and are not widely used.
A suitable analytical method is needed for the determination of gasoline oxygenates and degradates at low concentrations in surface- and ground-water samples to evaluate fate and movement of these compounds in the environment. To address this need, the U.S. Geological Survey developed a method for determining the gasoline oxygenates, especially the alcohol degradates, based on a simple modification to a widely used method for determining volatile compounds in water, namely, purge and trap gas chromatography/mass spectrometry (GC/MS).
Purpose and Scope
The purpose of this report is to describe an analytical method for the determination of gasoline oxygenates, selected degradates, and BTEX. Equipment, instrument performance, sample collection, preservation, and method development are described.
Acknowledgments
The past authors and researchers who contributed to the development of purge and trap methods at the National Water Quality Laboratory deserve recognition for their contribution to the development of this method and report: Brooke F. Connor, Donna L. Rose, Mary Noriega, Lucinda K. Murtagh, and Sonja R. Abney contributed to the original purge and trap method� O-4127-96 on which the present method is based.
Connor deserves special recognition as senior author (Connor and others, 1998) because much of the organization and relevant sections of the 1998 report are included in this report. Ground-water and surface-water samples were provided by E. Furlong and �J. Collins. David Bender, Brooke Connor, and �Peter Rogerson provided technical review. Jon Raese edited the manuscript, and Barbara Kemp prepared the report for publication.
ANALYTICAL METHOD
Organic Compounds and Parameter Codes: Volatile organic compounds, whole water, gas chromatography/mass spectrometry, heated purge and trap, O–4024–03 (see table 1)
1. Scope and Application
This method is suitable for the determination of gasoline oxygenates, selected degradates, and BTEX (benzene, toluene, ethylbenzene, and xylenes) at low concentrations in whole-water samples. The method is applicable to analytes that can be efficiently removed from the water matrix by heating and purging with helium.
The analytes chosen for this method were identified as high priority by the National Water-Quality Assessment (NAWQA) Program on the basis of scientific literature and selected sample analysis. The main fuel oxygenates used in the United States are methyl tert-butyl ether (MTBE) and ethanol. These oxygenates can transform to degradates in the environment. The main degradate of MTBE is tert-butyl alcohol (tBA). The BTEX (benzene, toluene, ethylbenzene, and xylenes) compounds also were included in this method, because they are representative of fuel contamination. Grady and Casey (2001, p. 42) mention that MTBE generally is not found with other gasoline-related compounds in drinking-water sources. However, when a sample is taken near a point-source release, BTEX compounds often are detected with MTBE. As the plume moves farther from the source, the MTBE plume may migrate farther than the BTEX plume (Landmeyer and others, 1998; Schirmer and others, 1998; Lawyui and Fingas, 1997; Kram and Lory, 1998; Weaver and others, 1996).
The linear calibration range for this method is 0.1 to 200 micrograms per liter (µg/L). (Refer to table 3 in
2 DETERMINATION OF GASOLINE OXYGENATES, SELECTED DEGRADATES, AND BTEX �IN WATER BY HEATED PURGE AND TRAP/GC/MS�

er;
e
)
ed
section 7.4 for the range for each compound.) Samples containing concentrations higher than the calibration range need to be diluted. Reported concentrations less than the lowest calibration standard will be qualified with an “E” remark code, which indicates the sample concentration is estimated (Childress and others, 1999; Connor and others, 1998).
This method is similar to the one reported by Connor and others (1998), which describes the method for analyzing low-concentration VOCs in water with ambient purge and trap GC/MS. There are two main differences: (1) samples analyzed using the method described by Connor and others (1998) are purged at ambient temperatures and (2) preserved to pH 2 with a
solution of 1:1 hydrochloric acid and water. Samples analyzed using the method described in this report (1) are purged at 65°C and (2) are not acid preserved. Acid preservation for this method is an option, as indicated by the results of a holding-time study at pH 2 and 7, for all of the analytes except methyl acetate. If microbial activity at a sample site is a concern, then acid preservation is needed for samples suspected of containing BTEX compounds. However, acid preservation might result in possible losses of methyl acetate. (Refer to section 17 for holding-time study.)
Ethanol and methanol (the latter a degradation product of gasoline oxygenates) were considered and excluded from this purge and trap method. Methanol is
Table 1. Purgeable volatile organic compounds tested for bias and precision in this method
[Compounds numbered 1 through 13 refer to the compounds tested for this method, and are similarly numbered in subsequenttables. Schedule, National Water Quality Laboratory schedule number; CASRN, Chemical Abstracts Service Registry NumbNWIS, National Water Information System]
Compound (abbreviation) CASRN NWIS code
Schedule 4024
method code
(unacidified)
Schedul4025
methodcode
(acidified1 Acetone 67-64-1 81552 C D 2 tert-Amyl alcohol (tAA) 75-85-4 77073 A B 3 tert-Amyl methyl ether (TAME) 994-05-8 50005 C D 4 Benzene (BEN) 71-43-2 34030 not analyzed F 5 tert-Butyl alcohol (tBA) 75-65-0 77035 A B 6 tert-Butyl ethyl ether (ETBE) 637-92-3 50004 C D 7 tert-Butyl methyl ether (MTBE) 1634-04-4 78032 E F 8 Diisopropyl ether (DIPE) 108-20-3 81577 C D 9 Ethylbenzene (ET BEN) 100-41-4 34371 not analyzed F
10 Methyl acetate (MeAc) 79-20-9 77032 A B1 11 Toluene (TOL) 108-88-3 34010 not analyzed F 12
meta- and para-Xylene (m&p-XYL)2
(meta-) 108-38-3 (para-) 106-42-3
85795
not analyzed F
13 ortho-Xylene (o-XYL) (ortho-) 95-47-6 77135 not analyzed F Surrogate standards
p-Bromofluorobenzene (BFB) 460-00-4 99834 D E 1,2-Dichloroethane-d4 (12DCA-d4) 17060-07-0 99832 D E Isobutyl alcohol-d6 (iBA-d6) 72182-69-5 62835 A B Toluene d8 (Tol-d8) 2037-26-5 99833 D E
1,2-Dichlorobenzene-d4 (12DCB-d4) optional surrogate
2199-69-1 not available not reported not report
1Methyl acetate is reported as a permanent E (estimated) compound owing to degradation in acidic conditions (see tables 10 and 11).
2meta- and para-Xylene cannot be resolved on the chromatographic column and are reported as an isomeric pair.
Analytical Method 3
used as a solvent for preparing calibration standards. Ethanol purges poorly from the water matrix, even with heating, and elutes as a broad peak on the gas chromatographic column. Headspace solid-phase microextraction with gas chromatography (Zuba and others, 2002) or headspace with gas chromatography (Correa and Pedroso, 1997) are more suitable techniques for analyzing ethanol and methanol.
2. Summary of Method
Volatile organic compounds (VOCs) are purged from the sample matrix by simultaneously bubbling helium through a 25-milliliter (mL) aqueous sample and heating at 65°C. The compounds are trapped in a tube containing suitable sorbent materials and then thermally desorbed into a capillary gas chromatographic column interfaced to a mass spectrometer system. Selected compounds are identified by using strict identification criteria, which include analyzing standard reference materials and comparing retention times and relative ratios of the mass spectra. Compounds are quantitated using internal standard procedures. Quantitation that is extrapolated less than the lowest calibration standard is qualified as “estimated” to signify the lower confidence in the extrapolated concentration. Compounds are not quantitated if they do not strictly adhere to identification criteria. Compounds identified with concentrations within the calibration range are reported without qualification, unless quality control or holding times are compromised.
3. Interferences
3.1 Blanks—Samples can be contaminated during collection or analysis. Strict quality control is required to maintain cleanliness at the sampling site and in the laboratory. Several types of laboratory blanks are used in this method to identify sources of contamination, including the test blanks, set blanks, and carryover blanks (section 11.2). Field supplied blanks include trip blanks, equipment blanks, field blanks, and source solution blanks (section 8.2). Multiple types of blanks are required because VOCs can enter samples in many different ways. Possible sources include exhaust fumes from vehicles, industrial stack emissions, outgassing of solvents from carpets and upholstery inside the sampling vehicles, copier
machines, paint, and cleaning solutions. Sampling equipment used at contaminated sites might contain residual contaminants if not cleaned properly. Equipment blanks are intended to provide quality control on this possible source of contamination. During sample preparation and analysis in the laboratory, samples can be contaminated by common extraction solvents like toluene and acetone that are present in the laboratory atmosphere. Reporting and implications of blank detections are discussed in section 14.
3.2 Carryover contamination—Care must be taken to ensure that the results reported are true environmental detections, because this method reports any appropriately detected compound. Carryover contamination can confuse interpretation when a clean sample is analyzed after a contaminated sample. Samples that contain high concentrations of VOCs, greater than 20 µg/L, can contaminate the next analysis at detectable concentrations because of residual VOCs in the trap, purge vessel, or transfer lines, which were not eliminated during the routine bake procedure. Samples suspected of being contaminated by carryover will be reanalyzed. If it is known that a given sample contains high concentrations of VOCs, the field-sampling personnel should note this finding on the Analytical Service Request (ASR) form. In the laboratory, analysts should separate contaminated samples from clean samples. Knowledge of carryover characteristics by instrument and by compound is necessary if this method is to be used with confidence.
3.3 Hydrogen sulfide—Hydrogen sulfide will interfere with the response of the mass spectrometer. It also can damage columns, traps, multipliers, and quadrupoles. If field personnel detect any odor of hydrogen sulfide (rotten eggs), they should note this clearly on the ASR to forewarn the analyst.
3.4 Foamy samples—Foamy samples, especially surface water, can interfere with the analysis by raising the baseline, decreasing instrument response, and shifting peak retention times, thereby producing unreliable data. For these reasons, all surface-water samples are checked for foaming prior to analysis. If the sample is excessively foamy, it is diluted until no foam is produced.
4 DETERMINATION OF GASOLINE OXYGENATES, SELECTED DEGRADATES, AND BTEX �IN WATER BY HEATED PURGE AND TRAP/GC/MS�

3.5 Precautions—Special care needs to be taken to eliminate all potential organic contaminants from the volatiles laboratory. Only clothing that has not been exposed to solvent vapors is worn. The analytical laboratory for volatiles needs to be far from other laboratories where extractions using organic solvents are conducted. To reduce the possibility of contaminating samples, laboratory solvents, with the exception of methanol, are stored outside the VOC laboratory. Moreover, VOC stock solutions are not stored near samples.
4. Instrumentation
The instruments and the settings used are listed in table 2.
This method was developed with a Tekmar Model LSC 3000 concentrator, a Varian Archon autosampler, a Hewlett Packard Model 6890 gas chromatograph (GC), and a Hewlett Packard Model 5973 mass selective detector (MSD). The concentrator is equipped with a pocket sample heater capable of heating 25 mL of sample. The Varian Archon autosampler is equipped to hold 40-mL VOC vials and transfer 25 mL to the purge vessel. The autosampler also is capable of chilling samples at 4ºC. The gas chromatograph is set up in the pulsed split mode, 110.3 kPa (16 lb/in2) from 0 to 2 minutes with constant flow at 1 mL/min. The mass spectrometer is set up in the electron impact mode, scanning from 45 to 300 m/z for the first several minutes, until the carbon dioxide peak elutes. After the carbon dioxide peak elutes, the instrument scans from 41 to 300 m/z. Instrument configurations are listed in table 2.
5. Apparatus and Equipment
5.1 Syringes5.1.1 Glass barrel—50-mL syringe with
Luer-lock tip.5.1.2 Microliter—gas tight, ranging from 1
to 200 µL for standard solution and laboratory matrix spike preparation.
5.2 Glassware5.2.1 Volumetric flasks—10, 50, 100, or 250
mL, baked at 105ºC for at least 15 minutes.5.3 Vials
5.3.1 Amber vials—1 to 2 mL, to store working standard solutions, capped with a Teflon-faced silicon septa hole cap.
5.3.2 VOC vials—40-mL amber glass vials, Eagle-Picher or equivalent, precleaned, with Teflon-lined septum hole cap.
5.4 Volatile blank water equipment5.4.1 Erlenmeyer flask—4-L, Pyrex,
Erlenmeyer flask for boiling volatile blank water.5.4.2 Boiling stones—stored in 105ºC oven
until use.5.4.3 Hot plate—for boiling volatile blank
water.5.4.4 Separatory funnel with Teflon
stopcock—4-L funnels for storing and dispensing volatile blank water.
5.4.5 Stainless steel purge line—1.59 x 10⁻¹ cm (1/16-in.) outer diameter, fitted with a stainless steel frit for purging volatile blank water continuously.
5.5 Ultrahigh purity (UHP) grade nitrogen gas—99.999+ percent.
5.6 Oven—capable of heating to 105°C.5.7 Freezer—for storing standard solutions at�
–10ºC or lower.5.8 Refrigerator—for storing samples at �
4ºC ± 2ºC.
6. Reagents
6.1 Water, volatile-grade blank-water (VBW) deionized or distilled in glass, boiled for 1 hour, cooled and purged continuously with UHP nitrogen, for a minimum of 1 hour. VBW is prepared daily, using the 4-L flask and separatory funnel listed in section 5.4. This water is used for laboratory standards, spikes, blanks, instrument rinse water, and trip blanks.
6.2 Water, commercially prepared, VOC grade, EM Science or equivalent. Commercial blank water is purged with UHP nitrogen for 2 hours to remove trace volatiles before recapping and shipping. This grade of water is used for equipment rinsing, source solution blanks, and field equipment blanks.
6.3 Methanol-distilled in glass, purge and trap grade, Burdick and Jackson or equivalent. The quality of the methanol is verified periodically, prior to standards preparation, by injecting 200 µL into 50 mL of VBW and analyzing the VBW.
Analytical Method 5

6.4 Hydrochloric acid (HCl) solution, NWQL quality-controlled. A 1:1 solution of concentrated HCl–VBW water (1:1 by volume), stored in a 30-mL Teflon dropper bottle, is used for sample preservation for laboratory method 4025. This solution is obtained from the NWQL.
7. Standard Solutions
Concentrated methanol solutions of the compounds of interest are used to prepare working standard solutions by spiking the appropriate quantities of the working solutions into VBW. All standard
solutions are stored in a freezer at –10ºC or colder in �1-mL amber vials with minimum headspace. All standard solutions are stored separately from the samples.
7.1 Mass spectrometer performance evaluation standard solution. p-Bromofluorobenzene (BFB), Supelco, or equivalent. A 25-�g/mL solution is prepared in methanol. Alternatively, mass spectrometer performance may be evaluated from the surrogate standard/internal standard solution (section 7.2), which includes BFB in the solution.
7.2 Surrogate standard/internal standard solution (SURRIS). Fluorobenzene (internal standard), 1,2-dichloroethane-d4 (surrogate), toluene-d8 (surrogate),
Table 2. Purge and trap capillary-column gas chromatography/mass spectrometry operating conditions
[GC/MS, gas chromatography/mass spectrometry; ºC, degrees Celsius; mL/min, milliliters per minute; kPa, kilopascal; lb/in2, pounds per square inch; cm, centimeter; m, meter; mm, millimeter; ID, inside diameter; µm, micrometer; eV, electron volt; m/z, mass-to-charge ratio; scan/s, scan per second; USEPA, U.S. Environmental Protection Agency]
Purge and trap configurations (Tekmar Model LSC 3000 Concentrator) Prepurge time............................................................Preheat time.............................................................. Purge sample temperature.........................................Purge cycle................................................................Dry purge cycle.........................................................Carrier gas.................................................................Desorb preheat temperature...................................... Desorb temperature...................................................Bake cycle.................................................................Transfer line temperature to GC inlet....................... Six-port valve temperature........................................Purge pressure...........................................................Trap...........................................................................
2 minutes 5 minutes 65ºC 11 minutes 2 minutes Helium, 40-mL/min flow at 22ºC 245ºC 250ºC for 3 minutes 12 minutes at 260ºC 110ºC 110ºC 138 kPa (20 lb/in2) Supelco, VOCARB 3000, 25-cm x 0.27-cm ID. From the purge inlet, the trap contains 10 cm Carbopak B 60/80 mesh, 6 cm Carboxen 1000 60/80 mesh, and 1 cm Carboxen 1001 60/80 mesh.
Gas chromatograph configurations (Hewlett Packard Model 6890) Column..................................................................... Carrier gas................................................................ Oven program...........................................................
Restek ® Rtx-624 fused silica (Crossbond® 6 percent cyanopropylphenyl, 94 percent dimethyl polysiloxane) 60-m x 0.25-mm ID, 1.4-µm film thickness, or equivalent Helium, 1-mL/min flow at 22ºC, with a 10:1 split Initial temperature 35ºC, hold for 8 minutes, 8ºC per minute to 200ºC, hold for 9 minutes
Mass spectrometer configurations (Hewlett Packard Model 5973) Ionization mode........................................................ Scan range................................................................ Scan rate................................................................... Source temperature.................................................. Bromofluorobenzene criteria....................................
Electron impact, 70 eV 45 to 300 m/z, 41 to 300 after CO2 elutes 1 scan/s 240ºC Meets USEPA specifications, defined in EPA Method 524.2 (Munch, 1995)
6 DETERMINATION OF GASOLINE OXYGENATES, SELECTED DEGRADATES, AND BTEX �IN WATER BY HEATED PURGE AND TRAP/GC/MS�

p-bromofluorobenzene (surrogate), Supelco, and isobutyl alcohol-d6 (surrogate), CDN Isotopes or equivalent. An intermediate solution at 10,000 µg/mL is prepared in methanol for fluorobenzene, �1,2-dichloroethane-d4, toluene-d8, and p-bromofluoro-benzene from neat standards. An intermediate solution of isobutyl alcohol-d6 at 10,000 µg/mL is prepared in methanol from a neat standard. A working standard is prepared in methanol at a concentration of 250 µg/mL for isobutyl alcohol-d6 and 25 µg/mL for fluoro-benzene, 1,2-dichloroethane-d4, toluene-d8, and p-bromofluorobenzene. Adding 1 µL of this solution to each 25-mL sample will result in a concentration of �10 µg/L for isobutyl alcohol-d6, and 1 µg/L for fluorobenzene, 1,2-dichloroethane-d4, toluene-d8, and p-bromofluorobenzene. An optional surrogate for this method is 1,2-dichlorobenzene-d4; prepare it in the same manner as p-bromofluorobenzene.
7.3 Stock and intermediate calibration solutions and continuing calibration verification standards (CCVs). Concentrated stock solutions of individual compounds are combined to prepare intermediate calibration solutions. The composition and number of separate intermediate calibration solutions are determined by shelf-life limitations, compound class, or commercially available mixes. These intermediate calibration solutions are combined to create a working calibration standard solution containing all compounds of interest. Stock and intermediate calibration solutions in methanol or methanol/water mixes are prepared or purchased.
7.4 Working calibration standard solutions. A working calibration standard solution is prepared in purge-and-trap grade methanol at concentrations listed in table 3. The working calibration standard solution is kept concentrated enough so that only a small quantity of the solution is required to obtain even the most concentrated working calibration standard in VBW. The total quantity of methanol added is less than �200 µL per 50 mL of VBW to prevent solvent or water, or both, from interfering with early eluting compounds. Calibration standards are prepared by adding appropriate microliter quantities of working calibration standard solutions to VBW in 50-mL syringes.
7.5 Continuing calibration verification standard (CCV). CCVs are prepared from the same working standard solution as the calibration standards. CCV concentrations at 1.0 µg/L are needed for the alkyl ethers and BTEX, and at 10.0 µg/L for the alcohols and acetone. Alternatively, the CCV concentration might
be varied during the analysis to collect quality-control information at different concentrations.
7.6 Spike stock solutions and intermediate spike solutions for set spikes, third-party check standards, field spikes, and laboratory reporting level (LRL) check standards. Concentrated stock solutions are combined to prepare intermediate spike solutions. These intermediate spike solutions, containing all compounds of interest, are combined to create solutions appropriate for preparing set spikes, field spikes, and LRLs. Alternatively, a working solution may be purchased commercially, containing all compounds of interest at appropriate concentrations in a single solution.
The spike stock solutions must be prepared from different lots and preferably from a different vendor than the intermediate calibration solutions (section 7.3) because the validity of calibration is verified against this second source.
7.7 Working spike solution. A working spike solution is prepared in purge-and-trap grade methanol at concentrations listed in table 3. This solution is used to prepare the set spike (section 11.4) and the laboratory reporting level (LRL) check standard (section 11.5). Appropriate microliter quantities of the working spike solution are added to VBW to prepare the set spike and the LRL check standard.
7.8 Third-party check standard. The working spike solution, prepared from different lot numbers than the calibration standards, can serve as a check of the calibration standard validity. This type of standard is referred to as the “third-party check.” For this method, the set spike (section 11.4) serves the dual purpose of assessing method bias and precision, as well as checking calibration standard validity. Appropriate microliter quantities of the third-party check standard are spiked into VBW.
7.9 Laboratory reporting level (LRL) check standard. A low-concentration check standard is prepared by adding 2.5 �L using a 10-�L gas-tight syringe of the set spike solution per 50 mL of VBW.
7.10 Volatile organic compound (VOC) solution holding times. VOC solutions in methanol sealed in glass ampules may be stable for about 1 year. Once opened, the solutions are transferred to 1.8-mL amber hole-cap screw vials with Teflon liners. Depending on the contents, solutions in 1.8-mL vials may remain stable for months after opening. Fresh working calibration standard solutions are prepared once every
Analytical Method 7

�
4 to 12 weeks from intermediate spike solutions as determined by CCVs, set spikes, or third-party check standards, or more frequently if the calculated concentrations do not meet the criteria in paragraphs 11.3 or 11.4.1.
8. Sample Collection, Blank Collection,�Preservation, and Storage
8.1 Sample collectionSampling for VOCs requires special precautions
because samples easily can become contaminated from many potential sources if the protocol is not followed. Refer to the National Field Manual (Wilde and others,
1999), section 5.6.1.A for the current USGS protocol for sampling VOCs. Samples for VOC analysis are collected in triplicate (ground-water samples) or quadruplicate (surface-water samples) in clean 40-mL borosilicate amber vials (VOC vials) with Teflon-faced silicone septa. Multiple vials are required because each sample may be subjected to multiple analyses (dilutions and reanalyses owing to quality-control failures and carryover problems), each of which consumes one entire vial. Surface-water samples require one additional vial more than ground water because one vial is used to test for foam before purging. The vials are filled to overflowing and capped immediately. Air is not allowed to pass through the
Table 3. Suggested concentrations for working calibration standard solution, calibration ranges, and working spike solution
[CAS, Chemical Abstracts Service; std., standard; �g/mL, micrograms per milliliter; �g/L, micrograms per liter]
Compound CAS number
Concentration of working calibration
std. solution (µg/mL)
Concentration range using
working calibration std.
(µg/L)
Concentration of working
spike solution (µg/mL)1
1 Acetone 67-64-1 50 1 to 200 40 2 tert-Amyl alcohol (tAA) 75-85-4 50 1 to 200 40 3 tert-Amyl methyl ether (TAME) 994-05-8 5 0.1 to 20 4.0 4 Benzene 71-43-2 5 0.1 to 20 1.0 5 tert-Butyl alcohol (tBA) 75-65-0 50 1 to 200 40 6 tert-Butyl ethyl ether (ETBE) 637-92-3 5 0.1 to 20 4.0 7 tert-Butyl methyl ether (MTBE) 1634-04-4 5 0.1 to 20 4.0 8 Diisopropyl ether (DIPE) 108-20-3 5 0.1 to 20 4.0 9 Ethylbenzene 100-41-4 5 0.1 to 20 1.0
10 Methyl acetate (MeAc) 79-20-9 10 0.2 to 40 8.0 11 Toluene (methyl benzene) 108-88-3 5 0.1 to 20 1.0 12
meta- and para-Xylene (Dimethyl benzene)
(meta-) 108-38-3 (para-)106-42-3
10 0.2 to 40 2.4
13 ortho-Xylene (Dimethyl benzene) (ortho-) 95-47-6 5 0.1 to 20 1.2 Internal standard Fluorobenzene 462-06-6 25 1.0 1.0 Surrogate standards p-Bromofluorobenzene (BFB) 460-00-4 25 1.0 1.0 1,2-Dichloroethane-d4 (12DCA-d4) 17060-07-0 25 1.0 1.0 Isobutyl alcohol-d6 (iBA-d6) 72182-69-5 250 10.0 10.0 Toluene d8 (Tol-d8) 2037-26-5 25 1.0 1.0 1,2-Dichlorobenzene-d4 (12DCB-d4)
optional surrogate 2199-69-1 25 1.0 1.0
1This solution will be prepared by an alternate vendor or obtained from a separate lot than that used for calibration standards. This solution will be used to prepare the set spike, the laboratory reporting level check standard, and field spikes.
8 DETERMINATION OF GASOLINE OXYGENATES, SELECTED DEGRADATES, AND BTEX �IN WATER BY HEATED PURGE AND TRAP/GC/MS�

sample or to become trapped inside the vial. Headspace present inside the vial can result in losses of VOCs, especially the more volatile compounds (Pankow, 1986).
8.1.1 Sample preservation—Acid preservation is not recommended for this method because of the potential formation of tBA from moderate concentrations of MTBE (O'Reilly and others, 2001; Diaz and Drogos, 2002). However, data presented in this report (see section 17) indicate that preserving with a 1:1 solution of hydrochloric acid and water, chilling to 4ºC, and analyzing within 14 days of sampling are options for all of the compounds in this method, except for methyl acetate. Acid preservation would be required if the sampling site was known to contain bacteria adapted to the degradation of BTEX compounds.
If acid preservation is necessary, VOCs are preserved with a 1:1 solution of hydrochloric acid (HCl), described in section 6.4, until pH 2 is achieved. Only NWQL quality-controlled hydrochloric acid:water solution (1:1 by volume) is used for sample preservation. Preservation studies have shown that HCl quality degrades with age and when stored in inappropriate containers. HCl is stored in the dark at cool temperatures for no longer than 3 months in Teflon squeeze bottles. The acid is dispensed from a Teflon squeeze bottle equipped with a dropper to a full VOC vial. Many water samples require several drops of the 1:1 HCl solution to achieve pH 2. To test how much HCl is required, an extra water sample is collected in a spare 40-mL VOC vial, and 1:1 HCl is added dropwise until pH 2 is achieved. This extra sample is discarded in an appropriate container, and the replicate VOC samples are collected and preserved using the determined number of drops of HCl. If samples are acidified, then field blanks and laboratory matrix spikes are acidified in a similar manner. The trip blank is not acidified. No more than six drops of HCl are added to unbuffered samples, such as blanks, because less HCl will be required to lower the pH of an unbuffered sample. Moreover, excess acidity will damage the laboratory instruments.
8.1.2 Shipping—The samples are stored at 4ºC ± 2ºC, and enough ice is packed in each shipping container to ensure that the samples remain chilled throughout transit but not frozen. Dry ice is not used for shipping volatiles because samples packed on dry ice might freeze. The VOC vials are wrapped in bubble
wrap to prevent breakage in transit. Foam-packing peanuts are not used.
8.1.3 Labeling—The cap of the VOC vial is not wrapped with tape because solvents in the glue can outgas and contaminate the sample with toluene, acetone, 2-butanone, and other common solvents. Tape also interferes with the autosampler's ability to pick up sample vials, causing instrument failure. Labels that are supplied with the vials at the time of purchase are used, and labels are marked with a ball-point pen. The label is affixed to the glass portion only, not near the cap. The ink should be dry before placing the label on the vial. Other labels and inks might contaminate samples. Refer to NWQL Technical Memorandum 96.01 for more information (U.S. Geological Survey National Water Quality Laboratory Technical Memorandum No. 96.01, 1996).
8.2 Field blanks8.2.1 Field equipment blanks—A field
equipment blank is prepared when applicable (Wilde and others, 1999). A field equipment blank goes through the same procedures as the environmental samples. VOC-grade water (section 6), available at NWQL, is used for field equipment blanks. The sampling equipment is not rinsed with any solvents, except for methanol. Other more volatile solvents, such as hexane, acetone, and isopropyl alcohol, might contaminate the samples and result in interferences. The field equipment blanks are useful for determining if the field equipment used to collect samples is a source of contamination. Field equipment blanks should be preserved in the same manner as the samples. If the samples are preserved with hydrochloric acid, then the field equipment blanks also should be acidified (see section 8.1.1).
8.2.2 Trip blanks—Trip blanks accompany the samples throughout the sampling and shipping period. Trip blanks are used for determining if sources of contamination are caused by transportation. Trip blanks are purchased from the NWQL. Trip blanks are prepared with VBW and shipped to the field personnel before sampling. Trip blanks are not opened until they are returned to the laboratory for analysis.
8.2.3 Source solution blank—A source solution blank is prepared from the same VOC-grade water used for rinsing equipment prior to obtaining the field equipment blank. The VOC-grade water is poured directly into two or three VOC vials; it is not passed through any field equipment. Results of this blank indicate the quality of the VOC-grade water to
Analytical Method 9

differentiate between contaminants present in the water itself as opposed to contaminants present in the equipment. If the samples are preserved with hydrochloric acid, then the source solution blank also should be acidified (section 8.1.1).
8.3 Matrix spikes8.3.1 Laboratory matrix spike—Field
personnel must send three extra vials of an environmental sample for laboratory spiking, depending on the quality-control requirements of the project. Lab code 8140 and lab schedule 4024 are requested when submitting samples to the NWQL for laboratory matrix spikes. The environmental sample will be spiked upon receipt at the laboratory and held for a minimum of 5 to 7 days before analysis in order to mimic the average holding time at the NWQL.
8.3.2 Field matrix spike—Quality-control requirements or field personnel, or both, may determine that spiking an environmental sample in the field is desirable. The NWQL must be contacted in advance, and a field spike solution will be provided. Only lab schedule 4024 is requested, and the ASR indicates that the sample has been spiked in the field.
8.4 Sample receipt and storageThe laboratory stores samples for VOC analysis in
the dark at 4°C and analyzes them within 14 days of collection. Samples need to be shipped from the field to the NWQL immediately to allow sufficient time at the NWQL for analysis. Samples received within 4 days of sampling will be analyzed within 10 days of receipt in the order of arrival, unless special arrangements are made. Tables 9 through 12 at the end of this report list results of holding-time tests for VOCs up to 46 days.
9. Instrument Performance
9.1 Mass spectrometer performance evaluation. Prior to analyzing the samples, the instrument performance needs to be evaluated against the p-bromofluorobenzene (BFB) criteria listed in table 4 by analyzing a set blank containing the SURRIS solution (section 7.2), or by analyzing a direct injection of a MS performance evaluation standard solution. Mass spectral peak-abundance averaging and background correction may be used to obtain a BFB spectrum for evaluation. If the mass spectrum for BFB fails to meet
the criteria specified in table 4, the mass spectrometer is retuned or cleaned, and BFB is reanalyzed until the criteria are met. After determining that the initial BFB criteria are met, the criteria are evaluated every 8 hours in subsequent samples or quality-control samples. The subsequent BFB criteria are determined in the same manner as the first determination.
9.2 Gas chromatograph performance evaluation. The gas chromatograph performance is indicated by peak shape and by the variation of the selected compound response relative to response factors obtained by using a new capillary column and freshly prepared calibration standards. An example of the separation and peak shape is shown in a total ion chromatogram of a set blank (fig. 1, section 11.2) and a CCV standard (fig. 2, section 11.3). If peak shape deteriorates or if response factors fail to meet the calibration criteria (sections 10 and 11.3), either the injection port liner is changed or part of the inlet end of the capillary column is removed to bring the gas chromatograph into compliance. The LRL check standard is used to judge whether the instrument is sensitive enough to qualitatively identify compounds but is not used to accept or reject gas chromatographic performance.
Table 4. Gas chromatograph/mass spectrometer evaluation using p-bromofluorobenzene
[m/z, mass-to-charge ratio]
Mass-to- charge
ratio
Ion abundance criteria, from Munch (1995)
50 15 to 40 percent of m/z 95
75 30 to 80 percent of m/z 95
95 Base peak, 100 percent relative abundance
96 5 to 9 percent of m/z 95
173 Less than 2 percent of m/z 174
174 Greater than 50 percent of m/z 95
175 5 to 9 percent of m/z 174
176 Greater than 95 percent but less than 101 percent of m/z 174
177 5 to 9 percent of m/z 176
10 DETERMINATION OF GASOLINE OXYGENATES, SELECTED DEGRADATES, AND BTEX �IN WATER BY HEATED PURGE AND TRAP/GC/MS�
.
10. Calibration
10.1 Initial calibration curve—Four to eight calibration standards defining the expected concentration range are required for each quantitated compound. Calibration standards are prepared in VBW to arrive at individual compound concentrations ranging from 0.1 to 200 µg/L. The suggested calibration range for each VOC is listed in table 3.
10.2 Calculating the response factor—The response factor (RF) for each selected compound and surrogate compound is calculated using equation 1:
whereCi = concentration of the internal standard�
solution, in micrograms per liter;Ac = GC peak area of the quantitation ion for the �
selected compound or surrogate standard;Cc = concentration of the selected compound or�
surrogate standard, in micrograms per�liter; and
Ai = GC peak area of the quantitation ion for the�internal standard.
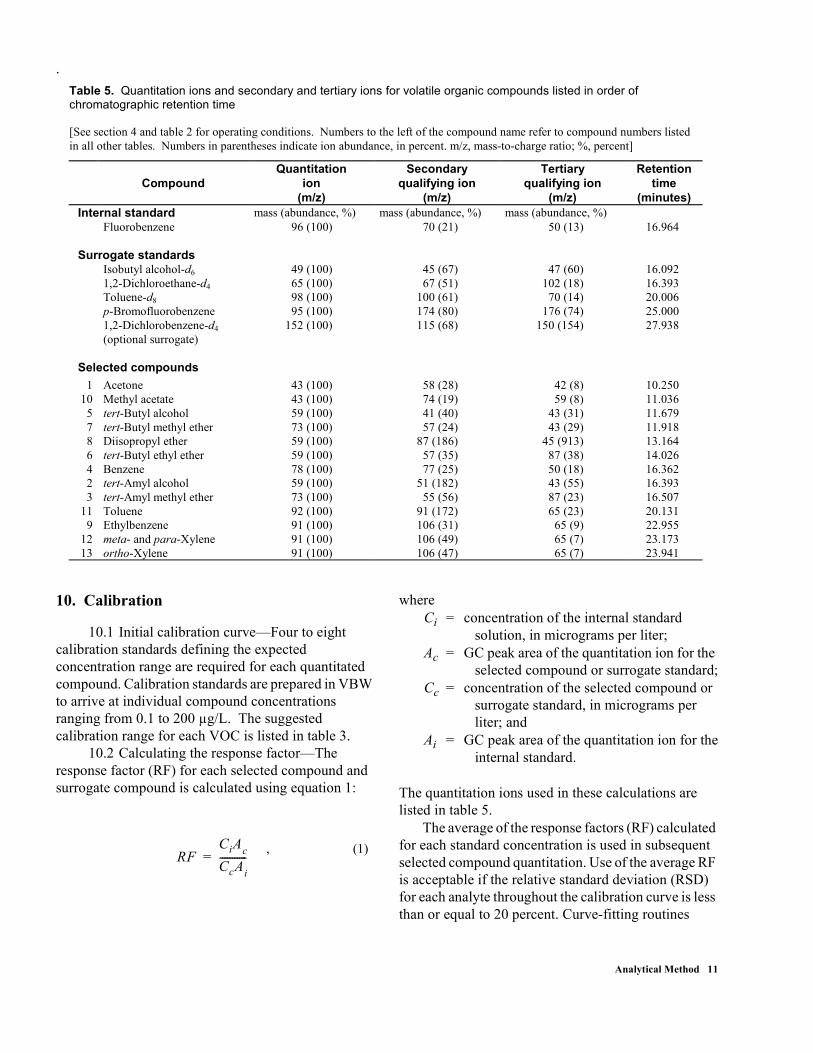
The quantitation ions used in these calculations are listed in table 5.
The average of the response factors (RF) calculated for each standard concentration is used in subsequent selected compound quantitation. Use of the average RF is acceptable if the relative standard deviation (RSD) for each analyte throughout the calibration curve is less than or equal to 20 percent. Curve-fitting routines
Table 5. Quantitation ions and secondary and tertiary ions for volatile organic compounds listed in order of chromatographic retention time [See section 4 and table 2 for operating conditions. Numbers to the left of the compound name refer to compound numbers listed in all other tables. Numbers in parentheses indicate ion abundance, in percent. m/z, mass-to-charge ratio; %, percent]
Compound Quantitation
ion (m/z)
Secondary qualifying ion
(m/z)
Tertiary qualifying ion
(m/z)
Retention time
(minutes) Internal standard mass (abundance, %) mass (abundance, %) mass (abundance, %) Fluorobenzene 96 (100) 70 (21) 50 (13) 16.964 Surrogate standards Isobutyl alcohol-d6 49 (100) 45 (67) 47 (60) 16.092 1,2-Dichloroethane-d4 65 (100) 67 (51) 102 (18) 16.393 Toluene-d8 98 (100) 100 (61) 70 (14) 20.006 p-Bromofluorobenzene 95 (100) 174 (80) 176 (74) 25.000 1,2-Dichlorobenzene-d4
(optional surrogate) 152 (100) 115 (68) 150 (154) 27.938
Selected compounds
1 Acetone 43 (100) 58 (28) 42 (8) 10.250 10 Methyl acetate 43 (100) 74 (19) 59 (8) 11.036
5 tert-Butyl alcohol 59 (100) 41 (40) 43 (31) 11.679 7 tert-Butyl methyl ether 73 (100) 57 (24) 43 (29) 11.918 8 Diisopropyl ether 59 (100) 87 (186) 45 (913) 13.164 6 tert-Butyl ethyl ether 59 (100) 57 (35) 87 (38) 14.026 4 Benzene 78 (100) 77 (25) 50 (18) 16.362 2 tert-Amyl alcohol 59 (100) 51 (182) 43 (55) 16.393 3 tert-Amyl methyl ether 73 (100) 55 (56) 87 (23) 16.507
11 Toluene 92 (100) 91 (172) 65 (23) 20.131 9 Ethylbenzene 91 (100) 106 (31) 65 (9) 22.955
12 meta- and para-Xylene 91 (100) 106 (49) 65 (7) 23.173 13 ortho-Xylene 91 (100) 106 (47) 65 (7) 23.941
RFCiAcCcAi-----------= , (1)
Analytical Method 11
provided by the instrument manufacturer, and summarized in a similar NWQL method report (Sandstrom and others, 2001), can be used to obtain a calibration curve for each compound. The standards are checked for accuracy by requantitating the calibration standards used to create the calibration curve against the new calibration curve. Observed concentrations should be within ±20 percent of the expected concentrations. Points may be deleted if there is laboratory blank interference, saturation of the detector, water interference, or failure to meet identification criteria.
10.3 Acceptance criteria for initial calibration curve. The range of the calibration curve should be limited by its ability to produce reliable data. If a calibration standard compound is not within ±20 percent of the expected value or if the RSD is greater than 20 percent, then the range is shortened, maintenance is performed, or fresh working-standard solutions are prepared.
11. Quality Control
The following discussion represents the minimum quality-control practices established for this method.
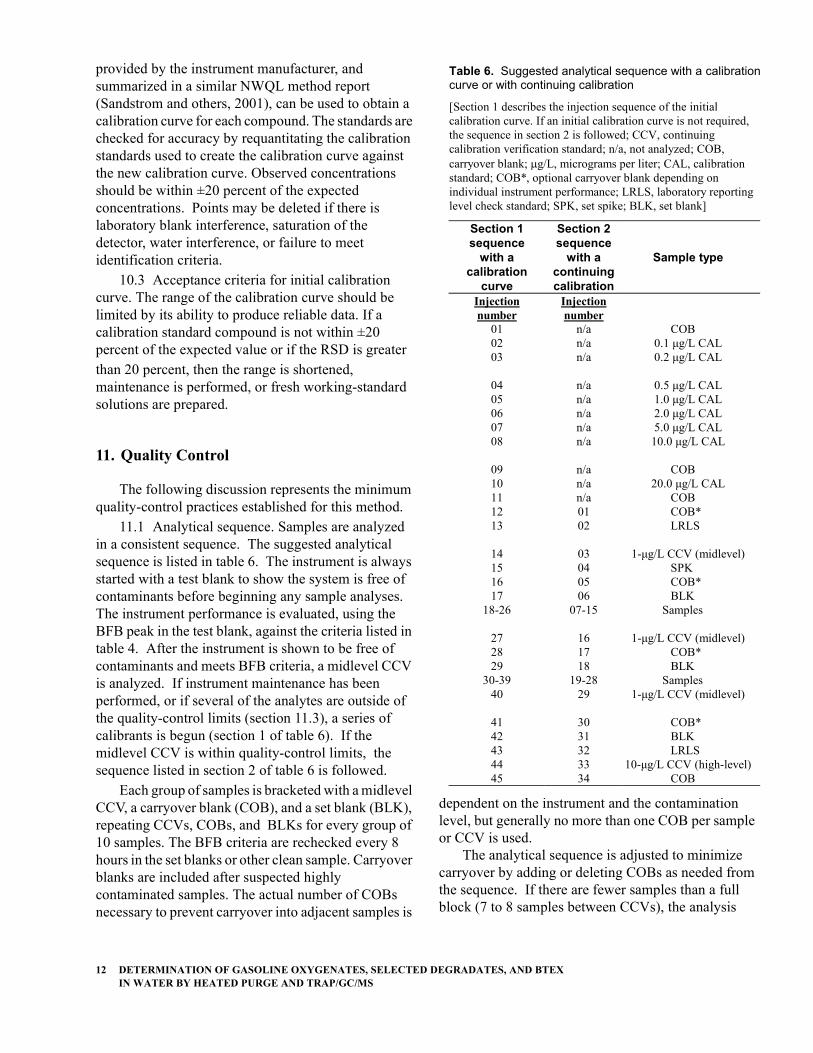
11.1 Analytical sequence. Samples are analyzed in a consistent sequence. The suggested analytical sequence is listed in table 6. The instrument is always started with a test blank to show the system is free of contaminants before beginning any sample analyses. The instrument performance is evaluated, using the BFB peak in the test blank, against the criteria listed in table 4. After the instrument is shown to be free of contaminants and meets BFB criteria, a midlevel CCV is analyzed. If instrument maintenance has been performed, or if several of the analytes are outside of the quality-control limits (section 11.3), a series of calibrants is begun (section 1 of table 6). If the midlevel CCV is within quality-control limits, the sequence listed in section 2 of table 6 is followed.
Each group of samples is bracketed with a midlevel CCV, a carryover blank (COB), and a set blank (BLK), repeating CCVs, COBs, and BLKs for every group of 10 samples. The BFB criteria are rechecked every 8 hours in the set blanks or other clean sample. Carryover blanks are included after suspected highly contaminated samples. The actual number of COBs necessary to prevent carryover into adjacent samples is
dependent on the instrument and the contamination level, but generally no more than one COB per sample or CCV is used.
The analytical sequence is adjusted to minimize carryover by adding or deleting COBs as needed from the sequence. If there are fewer samples than a full block (7 to 8 samples between CCVs), the analysis
Table 6. Suggested analytical sequence with a calibration curve or with continuing calibration
[Section 1 describes the injection sequence of the initial calibration curve. If an initial calibration curve is not required, the sequence in section 2 is followed; CCV, continuing calibration verification standard; n/a, not analyzed; COB, carryover blank; �g/L, micrograms per liter; CAL, calibration standard; COB*, optional carryover blank depending on individual instrument performance; LRLS, laboratory reporting level check standard; SPK, set spike; BLK, set blank]
Section 1 sequence
with a calibration
curve
Section 2 sequence
with a continuing calibration
Sample type
Injection number
Injection number
01 n/a COB 02 n/a 0.1 µg/L CAL 03 n/a 0.2 µg/L CAL
04 n/a 0.5 µg/L CAL 05 n/a 1.0 µg/L CAL 06 n/a 2.0 µg/L CAL 07 n/a 5.0 µg/L CAL 08 n/a 10.0 µg/L CAL
09 n/a COB 10 n/a 20.0 µg/L CAL 11 n/a COB 12 01 COB* 13 02 LRLS
14 03 1-µg/L CCV (midlevel) 15 04 SPK 16 05 COB* 17 06 BLK
18-26 07-15 Samples
27 16 1-µg/L CCV (midlevel) 28 17 COB* 29 18 BLK
30-39 19-28 Samples 40 29 1-µg/L CCV (midlevel)
41 30 COB* 42 31 BLK 43 32 LRLS 44 33 10-µg/L CCV (high-level) 45 34 COB
12 DETERMINATION OF GASOLINE OXYGENATES, SELECTED DEGRADATES, AND BTEX �IN WATER BY HEATED PURGE AND TRAP/GC/MS�

must still be bracketed with a CCV, a COB (if necessary), and a set blank. The analytical sequence is ended with a LRLS, a high-level CCV, and a COB.
11.2 Laboratory blanks. This method defines three types of laboratory blanks: (1) test blank, (2) set blank (BLK), and (3) carryover blank (COB). Figure 1 shows an example of a chromatogram from a typical set blank. The six largest peaks shown are the internal standard and five surrogates. The baseline rises at about 6 minutes because of water purged from the sample eluting off the gas chromatographic column.
11.2.1 Test blank—Prior to beginning an analytical sequence, a test blank is analyzed to ensure the instrument is operating properly. The data from this blank are used to verify that the instrument can be loaded and sample analysis started without sacrificing samples because of unacceptable background or instrument problems. Its purpose is to assess gross contamination in analysis.
11.2.2 Set blank—Samples are bracketed by set blanks (BLKs) throughout the sequence (see �table 6). The purpose of the set blank is to measure and
1
2
3
4
5
6
Water
0
0.2
0.4
0.6
0.8
1.0
1.2
1.4
0 5 10 15 20 25 30 35
RETENTION TIME, IN MINUTES
AB
UN
DA
NC
EO
FIO
NC
OU
NT
S,x
106
EXPLANATION
Peak identification from left to right: (1) isobutyl alcohol-d6 (surrogate), (2) 1,2-dichloroethane-d4 (surrogate), (3) fluorobenzene (internal standard), (4) toluene-d8 (surrogate), (5) p-bromofluorobenzene (surrogate), (6) 1,2-dichlorobenzene-d4 (optional surrogate).
Figure 1. Typical set blank chromatogram for determining gasoline oxygenates, selected degradates, and BTEX in water samples.
Analytical Method 13

record background concentrations of VOCs introduced in the laboratory by sample preparation and analysis. VBW is used to prepare set blanks. Corrective actions for detections in bracketing BLKs are described in section 14. BLKs are designed to measure system or laboratory contamination but not sample or standard contamination caused by carryover.
11.2.3 Carryover blanks—Carryover is dependent on the instrument and operating conditions. For a Varian Archon purge and trap autosampler with an LSC 3000 concentrator, a COB is necessary after the highest standard in each calibration curve. The
analytical sequence (table 6) describes where the COBs should be analyzed, but does not mandate how many are required to control carryover from one sample or standard to another. Additional COBs may be included in the analytical sequence to protect from spiked or highly contaminated samples. There are no acceptance criteria for COBs themselves. COBs are designed to prevent carryover into quality-control or environ-mental samples. A sufficient number of COBs are included to ensure that carryover is limited to the COBs and not to subsequent samples.
1
2
3
4
5
6
7
8
9
10
11
12
13
14
Water
0
0.2
0.4
0.6
0.8
1.0
1.2
0 5 10 15 20 25 30 35
RETENTION TIME, IN MINUTES
AB
UN
DA
NC
EO
FIO
NC
OU
NT
S,x
106
EXPLANATION
Peak identification from left to right: (1) acetone, (2) methyl acetate, (3) tert-butyl alcohol, (4) tert-butyl methyl ether, (5) diisopropyl ether, (6) tert-butyl ethyl ether, (7) isobutyl alcohol-d6, (8) 2,2-dichloroethane-d4, (9) tert-amyl alcohol, (10) tert-amyl methyl ether, (11) fluorobenzene, (12) toluene-d8, (13) p-bromofluorobenzene, and (14) 1,2-dichlorobenzene-d4 (optional surrogate).
NOTE: BTEX compounds are shown in this chromatogram.
Figure 2. Typical continuing calibration verification standard chromatogram for determining gasoline oxygenates and selected degradates in water samples at 1 to 10 micrograms per liter.
14 DETERMINATION OF GASOLINE OXYGENATES, SELECTED DEGRADATES, AND BTEX �IN WATER BY HEATED PURGE AND TRAP/GC/MS�

11.3 Continuing calibration verification (CCV) standard. A CCV is analyzed prior to analyzing samples. To confirm that calibration is consistent, additional CCVs are analyzed no later than every thirteenth injection, based on a maximum analytical time of 1 hour. See table 6 for placement of CCV standards. Figure 2 shows a chromatogram of a CCV.
11.3.1 Determining acceptance criteria for CCVs—Initial criteria (before a minimum of 30 CCVs is collected per instrument) for the CCVs are ± 30 percent of the expected amount for all compounds. After 30 CCVs are collected on an instrument, ±3 �F-pseudosigma of the median are calculated to create statistical control limits, if applicable. These limits are updated at least every 12 months or upon method modification.
11.3.2 Corrective action for failed CCVs—If a CCV fails acceptance criteria, fresh standards are prepared, the trap is changed, or the instrument is cleaned. Samples bracketed by a failed CCV must be reanalyzed if the compound is detected in the sample.However, if reanalysis is not practical because sample holding times will be missed, or an additional sample is not available, the associated sample compounds are qualified with an estimated remark code (E).
11.4 Set spike. The set spike is prepared from a source independent of the calibration standards, so it also serves as a third-party check of the calibration standards. The set spike is equivalent to the USEPA definition of the laboratory fortified blank. The set spike is used to assess overall method performance in a clean matrix. Section 7.7 describes preparation instructions, and table 3 lists appropriate concentration levels.
11.4.1 Acceptance criteria for set spike—The set spike is analyzed once per analytical sequence (table 6). The percentage recovery for each compound is calculated and reported. If the calculated result for a particular analyte is not within ±3 �F-pseudosigma of the median of at least 30 or more previous set spikes, or ±30 percent of the expected concentration when 30 set spikes are not available, then the set spike failed for that analyte. A fresh working spike solution (section 7.7) is prepared or new working calibration standard solutions are prepared (section 7.4), or the instrument is serviced. Samples associated with a failed set spike analyte are reanalyzed if appropriate. If reanalysis is not practical because sample-holding times will be missed, or additional sample is not available, the associated sample
compounds are qualified with an estimated remark code (E), or a fresh spike solution is prepared, and a replacement spike is included somewhere in the analytical sequence. The replacement spike is followed with a COB to avoid carryover, if necessary.
11.5 Laboratory reporting level check standard. The LRL check standard is used to determine if instrument sensitivity is sufficient to meet all identification criteria. Results for the LRL check standard are reported with the same qualification criteria as samples, so that compounds that fail to meet minimum identification criteria are reported as not detected, even though the analyst knows the compound is present in the solution. Positive results are reported in micrograms per liter. There are no acceptance criteria for recovery of the LRL check standard, although analysts might interpret a failing LRL check standard to indicate instrument failure and choose to reanalyze samples after maintenance. Keep in mind, however, that accumulated LRL check standard results are used to update the calculated method detection limits.
11.6 Internal standard areas. The area of the quantitation ion of the internal standard (ISTD) fluorobenzene in the first daily CCV (or average calibration standard ISTD areas) is compared to the ISTD areas in the samples. The ISTD areas of the samples should be within ±50 percent of the ISTD areas of the daily CCV (Munch, 1995, p. 17). Samples with unacceptable internal standards after instrument maintenance are reanalyzed by replacing ISTD solutions or by correcting the source of the error.
11.7 Surrogate recovery. For each sample, spike, and blank, the percentage recovery for each surrogate compound is calculated. The percentage recovery for each surrogate should be within ±3 F-pseudosigma of the median of at least 30 set blanks and set spikes, or 70 to 130 percent is used for the limits if statistical data are not available. The surrogate control limits are updated every 12 months or upon major instrument repair. Samples are reanalyzed if all four sample surrogate recoveries are outside of the control limits. If the surrogates fail a second time, the sample matrix might be the cause; therefore, the sample data are reported with the failed surrogate recovery concentration. If reanalysis is not possible, the data are reported and associated method compounds are qualified with an estimated remark code (E) or the LRL is raised. The internal standard and the surrogates go through the same sample preparation in this method; therefore, it is
Analytical Method 15

possible that the internal standard areas and surrogate areas may all be low, but within acceptable recovery limits owing to a leak in the system. In this case it would be beneficial to monitor the absolute areas of the surrogates, as well as the internal standard.
12. Procedure for Sample Analysis
Samples need to be analyzed within 14 days of collection to comply with USEPA-sampling requirements. Samples are analyzed in the order they are received at the NWQL, unless other arrangements have been made. Preservation studies and techniques using this method show that the VOCs in this method are stable for much longer periods (section 17).
12.1 Field and trip blanks. Any known trip or field blank is placed after an instrument blank if possible to avoid carryover effects.
12.2 Surface-water samples. All surface-water samples are checked for foam. About 5 mL is removed from one of the extra vials, recapped, and the sample is shaken to see if any foam is produced. If foam is produced, then the sample is diluted according to how much foam is produced, and how long the foam persists. Usually a 1:2 or a 1:4 dilution is needed. Reporting limits are raised for all compounds, according to the dilution factor.
12.3 Highly contaminated samples. If samples are suspected of being highly contaminated with VOCs, a diluted sample first is analyzed, or the samples are followed by COBs, or the samples are placed near the end of the analytical sequence, or all of the preceding. Samples suspected of containing carryover VOCs are reanalyzed. Samples containing suspected carryover detections, but quantitating at less than the LRL, are reported as “less than the LRL.”
12.4 Analytical sequence. The analytical sequence is listed in table 6.
13. Identification and Quantitation
13.1 Qualitative identification. Initially a selected compound is identified by comparing the GC retention time (RT) of the compound to the RT of the standard solution. The RT of the sample needs to be within ± 0.1 minute of the reference standard RT for the compound in question.
The mass spectrum for each selected compound is verified by comparing the mass spectrum with a
reference spectrum obtained from standards analyzed on the GC/MS system. For the compound to be considered detected, all qualification ions (table 5) must be present in the expected ratios. Given the current (2003) software, NWQL analysts have determined that a minimum of 500 area counts must be present to qualify a compound's presence for all qualification ions. This minimum area would likely change with different quantitation and integration conditions. The total ion chromatogram and the extracted ion peaks must be Gaussian in shape summed over a minimum width of 10 scans. The peak areas of none of the qualification ions may be less than three times the instrument noise. It is often beneficial to compare the extracted ion profiles of important ions (or suspected interfering ions) to determine whether they maximize at the expected retention time with intensities consistent with the reference mass spectrum. Computerized fit criteria or match factors are valuable interpretation aids but are not to be used exclusively. Figure 3 shows an example of a VOC passing the identification criteria, and figure 4 shows an example of a VOC not passing identification criteria.
13.2 Quantitation. If a compound has passed the aforementioned qualitative identification criteria, the concentration in the sample is calculated using the average response factor in equation 2. If a curve-fitting routine was used for quantitation, refer to Sandstrom and others (2001) for the calculations.
whereC = concentration of the selected compound or
surrogate standard in the sample, in micrograms per liter;
Ci = concentration of the corresponding internal standard, in micrograms per liter;
Ac = area of the quantitation ion for the selected compound or surrogate standard identified;
RF = response factor (equation 1; section 10.2) for each selected compound or surrogate standard; and
Ai = area of the quantitation ion for the internal standard solution.
CCiAcRFAi-------------= , (2)
16 DETERMINATION OF GASOLINE OXYGENATES, SELECTED DEGRADATES, AND BTEX �IN WATER BY HEATED PURGE AND TRAP/GC/MS�

Percent recovery of the surrogate standard is calculated using equation 3:
where Percent recovery = percent recovery of the surrogate
standard;Ci = concentration of the corresponding
internal standard, in micrograms per liter;
Ac = area of the quantitation ion for the surrogate standard;
RF = response factor (equation 1; section 10.2) for the surrogate standard;
Ai = area of the quantitation ion for the internal standard; and
Cs = concentration of the surrogate standard added to the sample, in micrograms per liter.
14. Reporting of Results
This method is designed for environmental samples when it is important to prevent the censoring of VOC detections at low concentrations. Because this is an “information-rich” (GC/MS) method, any positively identified compound may be reported, but the concentration uncertainty increases as the concentration is extrapolated further from the lowest calibration standard (Childress and others, 1999).
The basic rules for data reporting follow.14.1 Not detected. If no peak is present or a
compound fails the qualification criteria, the concentration is reported as “less than LRL (<LRL).”
x 106
x 104
x 103 A
BU
ND
AN
CE
OF
ION
CO
UN
TS
,x10
4
40 60 80 100 120 140 160 180 200
40 60 80 100 120 140 160 180 200
0 5 10 15 20 25 30 35
Total ion chromatogram
Mass spectrum
Mass Chromatograms
Reference spectrum for tert-Butyl alcohol
tBA
tBA
MTBE
4143
4143
59
59
Ion 59.00
Ion 41.00
Ion 43.00
2.5
2.0
1.5
1.0
0.5
0
1.8
2.1
2.4
1.5
1.2
0.6
0.9
0.3
0
2.0
1.0
0
3.0
1.2
0.8
0.4
0
1.60
0
11.20 11.60 12.00
11.20 11.60 12.00
11.20 11.60 12.00
AB
UN
DA
NC
EO
FIO
NC
OU
NT
S
Figure 3. Example of total ion chromatogram, mass chromatogram, and mass spectrum for tert-butyl alcohol (tBA) that passed all identification criteria, at a concentration of 5 micrograms per liter in a ground-water sample. Ion ratios and retention times are listed in table 5.
, (3)CiAc
RFAiCs------------------- 100� Percent recovery =
Analytical Method 17

14.2 Detected in the sample, but not in the blanks. If the qualification criteria are met and the quantity detected and measured is greater than the lowest calibration standard, the concentration is reported. Data less than the lowest calibration standard are reported with the estimated remark code (E).
14.3 Detected in the sample and in at least one bracketing blank. If the sample result is within ten times any bracketing blank result, the analyst may either report the result as “<LRL,” report the result as “<RRL” (raised laboratory reporting level) if the sample result is greater than the LRL, reanalyze the sample, or determine with supporting data that the environmental measurement is not the result of background contamination.
14.4 Dilutions, interferences, and raised laboratory reporting levels. If a selected compound is present at a concentration greater than the highest calibration standard, the sample is diluted so that the
predicted concentration will be within the range of the current calibration curve. The LRLs of the affected compounds are raised according to the dilution factor. If a compound is known to be present at a high concentration, the sample may be diluted prior to the first analysis so that all results will be reported with RRLs. This practice minimizes instrument contamination. Complex sample matrices also can cause interferences, resulting in a raised LRL. A LRL can be raised when it is difficult to determine the presence of a compound because of the coelution.
14.5 Interpreting sample results on the basis of laboratory reporting level check standard results. LRL check standards are analyzed with every analytical sequence. The LRL check standards are designed to assess daily instrument performance at the LRL. The ability to detect a spiked compound present in the LRL check standard is an important indicator of daily instrument performance. The LRLs for sample results
x 105
x 103
x 103
AB
UN
DA
NC
EO
FIO
NC
OU
NT
S
AB
UN
DA
NC
EO
FIO
NC
OU
NT
S,x
103
40 60 80 100 120 140 160 180 200 220
40 60 80 100 120 140 160 180 200 220
Total ion chromatogram
Mass spectrum
Mass Chromatograms
Reference spectrum for tert-Butyl methyl ether
43 57 73
Ion 73.00
Ion 57.00
Ion 43.00
1.6
1.8
1.2
0.8
0.4
0
6
7
8
9
5
4
2
3
1
0
800
400
0
600
200
0
0
11.60 12.00 12.40
11.60 12.00 12.40
11.60 12.00 12.40
0 5 10 15 20 25 30 35
43 57 73
400
0
600
200
Figure 4. Example of total ion chromatogram, mass chromatogram, and mass spectrum for tert-butyl methyl ether that failed identification criteria at an estimated concentration of 0.01 microgram per liter in a ground-water sample. Masses 57 and 43 fail identification criteria because the peak shape is non-Gaussian, and the peak height is less than three times the noise level. The ratio of mass 57 to mass 73 and mass 43 to mass 73 failed. The retention times for masses 57 and 43 are shifted slightly to the right. Ion ratios and retention times are listed in table 5.
18 DETERMINATION OF GASOLINE OXYGENATES, SELECTED DEGRADATES, AND BTEX �IN WATER BY HEATED PURGE AND TRAP/GC/MS�

are not adjusted by the analysts when analysis of the daily LRL check standard yields nondetected compounds, although the samples may be reanalyzed (section 11.5). The reason this LRL is not adjusted by analysts is twofold: first, the LRL is a calculated concentration with a normal distribution of calculated concentrations under most circumstances. At this concentration, there is a slight (less than 1 percent) chance that any compound might fail to be detected. Second, analysts will not adjust LRLs because there are no statistical data to support the concentration that the LRL should be raised to in any given sample matrix, or under any particular circumstances. If an analyte failsidentification criteria repeatedly, then instrument maintenance may be indicated, or the LT–MDL may need to be recalculated.
15. Calculation of Method Detection �Limits and the Laboratory Reporting�Levels
15.1 Short-term method detection limits. Short-term method detection limits (MDLs) are determined from a minimum of seven-replicate low-level spikes analyzed over a minimum of 3 days using the USEPA protocol (U.S. Environmental Protection Agency, 2002, p. 635–638). The MDL is referred to as a short-term MDL in this report to distinguish it from the LT–MDL (Childress and others, 1999). Short-term MDLs are calculated using equation 4.
MDL = S x t(n-1, 1-� = 0.99) , (4)
whereS = standard deviation of replicate analyses, in
micrograms per liter;n = number of replicate analyses; t = Student's t-value for the 99-percent
confidence level with n-1 degrees of freedom; and
�� = level of significance.
For seven replicates and a 99-percent confidence level, the value of t is 3.143. The Student's t-value defines a 1-percent chance of false positives (falsely stating presence when the compound is not present). The MDL then is defined as the minimum concentration of a substance that can be identified, measured, and reported with 99-percent confidence that the compound concentration is greater than zero
(U.S. Environmental Protection Agency, 2002). This short-term MDL is used to confirm an appropriate concentration for the standards used for the collection of long-term MDL (LT–MDL) data. Short-term MDLs are listed in table 7.
15.2 Long-term method detection levels. The LT–MDL is derived from at least 30 standards prepared at concentrations determined in the short-term MDL study described in section 15.1. The LT–MDL accounts for more analytical variation owing to multiple operators, instruments, and calibrations with a tendency to be higher in concentration than the USEPA short-term MDLs. The key to accurately determine the LT–MDL is to include 30 or more standards in the calculation (Childress and others, 1999).
All data from these standards must be retained. The LT–MDL has not been assessed for the method described in this report. When sufficient (30 or more) replicate LRL spikes are analyzed, the LT–MDL will be calculated using equation 5:
LT–MDL = S x t(n-1, 1��=0.99) , (5)
whereS = standard deviation of replicate analyses, in
micrograms per liter;n = number of replicate analyses (at least 30); t = Student's t-value for the 99-percent
confidence level with n-1 degrees of freedom; and
� = level of significance.
For 30 replicates and a 99-percent confidence level, the value of t is 2.457.
15.3 Determination of laboratory reporting level. The LRL is defined as two times the LT–MDL. If sufficient information on the method is not available to calculate the LT–MDL, then the interim reporting level (IRL), defined as two times the short-term MDL, is used.
16. Method Development
16.1 Determination of initial method-operating conditions—A pocket heater assembly kit was purchased from Tekmar and installed on a Tekmar 3000 concentrator. Standards were obtained and prepared for the compounds listed in table 1. The
Analytical Method 19

20D
ET
ER
MIN
AT
ION
OF G
ASO
LIN
E O
XY
GE
NA
TE
S, SEL
EC
TE
D D
EG
RA
DA
TE
S, AN
D B
TE
X �
IN W
AT
ER
BY
HE
AT
ED
PUR
GE
AN
D T
RA
P/GC
/MS
Table 7. Short-term method detection limits and interim reporting levels1
[conc., concentration; RSD, relative standard deviation; MDL, method detection limit; IRL, interim reporting level; �g/L, micrograms per liter]
Compounds Number of spikes
Fortifica-tion level
(µg/L)
Mean conc. (µg/L)
Standard deviation
(µg/L)
Mean recovery(percent)
RSD (percent)
MDL (µg/L)
IRL (µg/L)3
1 Acetone 16 2.00 1.609 0.240 80.5 14.9 0.6245 1.2 2 tert-Amyl alcohol 16 2.00 1.863 .083 93.1 4.4 .2155 .43 3 tert-Amyl methyl ether 16 .20 .182 .0135 91.0 7.4 .0350 .07 4 Benzene 16 .05 .048 .0026 96.7 5.4 .0067 .014 5 tert-Butyl alcohol 16 2.00 2.604 .192 2 130.2 7.4 .4993 1.0 6 tert-Butyl ethyl ether 16 .20 .181 .020 90.2 11.1 .0524 .1 7 tert-Butyl methyl ether 16 .20 .182 .0146 90.7 8.1 .0381 .08 8 Diisopropyl ether 16 .20 .169 .016 84.2 9.4 .0413 .08 9 Ethylbenzene 16 .05 .041 .0061 82.0 14.8 .0158 .032
10 Methyl acetate 14 .40 .419 .082 104.7 19.4 .2160 .43 11 Toluene 16 .05 .042 .0020 84.4 4.7 .0052 .01 12 meta- and para-Xylene 16 .12 .086 .0137 71.4 16.0 .0357 .07 13 ortho-Xylene 16 .06 .049 .0076 83.3 15.3 .0197 .039
1Data collected from 6/14/02 to 8/4/02. 2The standard used to determine MDLs was recovered high for this compound. 3Significant figure rules applied—decade of standard deviation.

Analytical Method 21
retention times and mass spectra were determined for each compound. Purge temperature was balanced against purge time and desorb time to minimize water carried over to the instrument and to maximize response of highly soluble analytes. This resulted in an optimized purge temperature of 65°C along with a purge time of 11 minutes and a desorb time of 3 minutes.
An isotopically labelled alcohol (isobutyl�alcohol-d6) was used as a surrogate to monitor the purge and trap method. In one sample set, the loss of this surrogate, but not other surrogates, indicated a problem with the purge heater that negatively affected the alcohols but not other compounds. As a result, the sample set was reanalyzed. This new surrogate should prove useful in monitoring performance of the oxygenated degradates in the heated purge system, because it appears these degradates are sensitive to changes in purge conditions.
16.2 Bias and precision. Bias and precision estimates for this method were evaluated by analyzing seven spiked replicates in VBW, surface-water, and ground-water samples at concentrations ranging from 0.5 to 5 µg/L and 5 to 50 µg/L (table 8). The surface- water samples were collected from Lone Tree Creek on March 5, 2002, in Greeley, Colo., and Evergreen Lake on July 31, 2002, in Evergreen, Colo. The ground-water sample was collected from a private well on �July 31, 2002, in Evergreen, Colo. The water was collected in 1-L amber bottles and stored in the VOC refrigerator. Then, 50 mL of the water was spiked and transferred to a 40-mL VOC vial and analyzed. Replicate spikes were analyzed in the same analytical sequence. All three sample matrices for each concentration were spiked and analyzed randomly. A sample of the unspiked matrix water was analyzed to determine if detectable VOCs were present.
Mean recoveries at 65°C in VBW samples analyzed at concentrations from 0.5 to 5.0 µg/L for the gasoline oxygenates were 95 to 105 percent, with RSDs from 1.9 to 3.2 percent. Mean oxygenate degradate recoveries in VBW ranged from 88 to 107 percent, with RSDs of 3.2 to 7.4 percent, at concentrations from 1 to 50 µg/L. Mean VBW recoveries for BTEX ranged from 91 to 107 percent, with RSDs of 1.1 to 6.6 percent, at concentrations from 0.5 to 10 µg/L.
16.3 Matrix and concentration effects. Samples from different matrices were analyzed in one analytical sequence for each concentration. The high
concentration spikes for all matrices were analyzed in one sequence and the low concentration spikes in another sequence. There were no differences in recovery for the compounds in the different matrices (fig. 5). Mean recoveries at 65ºC in surface-water samples for the oxygenates ranged from 96 to 107 percent, with RSDs from 2.0 to 3.1 percent. Oxygenate degradates in surface-water samples ranged from 87 to 105 percent, with RSDs of 4.8 to 10.4 percent. Mean BTEX recoveries in surface-water samples ranged from 92 to 107 percent, with RSDs of 1.2 to 8.0 percent. Mean recoveries at 65ºC in ground-water samples for the gasoline oxygenates ranged from 97 to 106 percent, with RSDs of 0.7 to 2.7 percent. Mean recoveries in ground-water samples for the oxygenate degradates ranged from 93 to 108 percent, with RSDs of 2.7 to 8.3 percent. Mean recoveries in ground-water samples for BTEX ranged from 95 to 109 percent, with RSDs of 1.0 to 7.4 percent. Figure 5 shows the results in all sample matrices.
17. Sample Preparation and�Recommended Holding Time
17.1 Holding-time experimental design. The recommended holding time of analytes in surface water at 4ºC with pH 7, and in volatile-grade blank water at 4ºC, adjusted to pH 2, was estimated by modifying a standard practice (ASTM Procedure D-4841-88) for estimating holding time for constituents in water samples (American Society for Testing and Materials, 2001). USEPA method 524.2 (Munch, 1995, p. 14) recommends a 14-day holding time for VOCs, preserved with a 1:1 solution of hydrochloric acid and water, and chilled at 4ºC for the compounds listed in the method, including MTBE and the BTEX compounds. Hydrolysis of MTBE in acid-preserved samples can lead to the formation of tert-butyl alcohol (tBA) (O'Reilly and others, 2001; Diaz and Drogos, 2002), so acid preservation is not recommended for this reason. O'Reilly and others (2001) estimated that a �10,000-µg/L solution of MTBE, preserved at pH 2 with hydrochloric acid, would produce 20 µg/L of tBA in 24 hours at 25ºC. Even though the samples for analysis are chilled immediately to 4ºC, substantially slowing the conversion rate of MTBE to tBA, there is a concern with acid preservation that purging the sample at 65ºC could result in the conversion of MTBE to tBA. To test this theory, the holding-time study was conducted at pH 7 and pH 2.

22 DETERMINATION OF GASOLINE OXYGENATES, SELECTED DEGRADATES, AND BTEX �IN WATER BY HEATED PURGE AND TRAP/GC/MS�
Table 8. Bias and precision at 65 degrees Celsius for selected volatile organic compounds in volatile-grade blank-water, ground-water, and surface-water samples for seven replicates, each spiked at two concentrations ranging from 0.5 to 50 micrograms per liter, listed in the order shown in figure 5.
[�g/L, micrograms per liter; RSD, relative standard deviation; BTEX, benzene, toluene, ethylbenzene, and xylene]
Volatile-grade blank water1 Surface water2 Ground water3
Compound (abbreviation)
Compoundtype
Amount spiked (µg/L)
Averagerecovery (percent)
RSD (percent)
Averagerecovery(percent)
RSD (percent)
Averagerecovery(percent)
RSD (percent)
Acetone 5.0 100 3.6 97 4.8 104 2.8
Oxygenate degradate 50.0 95 7.4 97 7.4 98 8.3
Methyl acetate (MeAc) 1.0 88 7.3 87 10.4 93 7.8
Oxygenate degradate 10.0 99 4.6 101 6.1 103 3.5
tert-Butyl alcohol (tBA) 5.0 100 7.4 103 6.1 99 7.1
Oxygenate degradate 50.0 107 4.7 105 6.5 108 4.8
tert-Butyl methyl ether (MTBE) .5 100 2.9 102 2.4 100 1.9
Gasoline oxygenate 5.0 103 2.6 105 2.0 104 .7
Diisopropyl ether (DIPE) .5 97 2.3 99 2.3 97 2.3
Gasoline oxygenate 5.0 102 2.9 104 3.1 104 1.9
tert-Butyl ethyl ether (ETBE) .5 101 3.2 102 3.1 99 2.7
Gasoline oxygenate 5.0 105 2.2 107 2.7 106 1.8
tert-Amyl alcohol (tAA) 5.0 96 4.9 99 5.2 96 2.7
Oxygenate degradate 50.0 100 3.2 98 6.1 101 2.9
tert-Amyl methyl ether (TAME) .5 102 1.9 102 2.3 102 1.2
Gasoline oxygenate 5.0 95 2.2 96 3.0 97 1.4
Benzene .5 101 1.2 101 1.5 102 1.0
BTEX 5.0 100 3.1 102 3.4 103 3.6
Toluene .5 98 1.1 98 1.4 99 1.4
BTEX 5.0 105 3.0 107 3.5 109 3.3
Ethylbenzene (ET BEN) .5 103 2.1 104 1.8 104 2.0
BTEX 5.0 95 3.4 97 4.1 98 4.0
meta- and para-Xylene (m&p-XYL) 1.0 107 2.0 107 1.2 108 1.1
BTEX 10.0 91 6.6 92 8.0 95 7.4
ortho-Xylene (o-XYL) .5 101 2.9 102 2.6 101 2.3
BTEX
5.0 100 3.3 102 4.0 104 3.5
Surrogates
p-Bromofluorobenzene 1 95 1.3 95 1.5 95 1.7 1 105 1.7 104 2.7 106 1.8 1,2-Dichloroethane-d4 1 99 1.7 99 1.7 100 2.5 1 97 4.1 97 5.1 99 5.5 Isobutyl alcohol-d6 10 101 5.0 103 6.1 100 7.3 10 102 5.3 99 8.2 103 2.8 Toluene-d8 1 101 1.4 100 1.0 101 .5 1 100 1.8 100 2.2 101 2.6
1Volatile-grade blank water was obtained by boiling deionized water for 1 hour and purging with UHP nitrogen gas for a minimum of 1 hour; pH was 5.52. 2The surface-water sample for the low-level spikes was obtained from Lone Tree Creek in Greeley, Colo., sampled 3/5/02 at 10:50 a.m.; pH was 7.99. Surface-water sample for high-level spikes was obtained from Evergreen Lake in Evergreen, Colo., sampled 7/31/02; pH was 6.35. 3The ground-water sample was obtained from a private well in Evergreen, Colo., sampled 7/31/02; pH was 8.52.

Analytical Method 23
70
75
80
85
90
95
100
105
110
115
120
PE
RC
EN
TR
EC
OV
ER
Y
ANALYTES SPIKED IN MATRICES
Ace
tone
:VB
WA
ceto
ne:S
WA
ceto
ne:G
W
MeA
c:V
BW
MeA
c:S
WM
eAc:
GW
tBA
:VB
WtB
A:S
WtB
A:G
W
MT
BE
:VB
WM
TB
E:S
WM
TB
E:G
W
DIP
E:V
BW
DIP
E:S
WD
IPE
:GW
ET
BE
:VB
WE
TB
E:S
WE
TB
E:G
W
tAA
:VB
WtA
A:S
WtA
A:G
W
TA
ME
:VB
WT
AM
E:S
WT
AM
E:G
W
Ben
zene
:VB
WB
enze
ne:S
WB
enze
ne:G
W
Tol
uene
:VB
WT
olue
ne:S
WT
olue
ne:G
W
ET
BE
N:V
BW
ET
BE
N:S
WE
TB
EN
:GW
m&
p-X
YL:
VB
Wm
&p-
XY
L:S
Wm
&p-
XY
L:G
W
o-X
YL:
VB
Wo-
XY
L:S
Wo-
XY
L:G
W
Largest value within 1.5 interquartile rangesabove the 75th percentile
75th percentile
50th percentile
25th percentile
Smallest value within 1.5 interquartile rangesbelow the 75th percentile
Data values outside range
VBW
SW
GW
EXPLANATION
Figure 5. Recovery of gasoline oxygenates, oxygenate degradates, and BTEX in volatile-grade blank water (VBW), ground-water (GW), and surface-water (SW) spikes, ranging in concentration from 0.5 to 50 micrograms per liter. (See table 8.)

24 DETERMINATION OF GASOLINE OXYGENATES, SELECTED DEGRADATES, AND BTEX �IN WATER BY HEATED PURGE AND TRAP/GC/MS�
Reagent water was adjusted to pH 2 with a 1:1 solution of hydrochloric acid and water. Five replicate samples were fortified at concentrations ranging from 2 to 20 µg/L, transferred to 40-mL VOC vials, and stored at 4ºC. Most ground-water and surface-water samples have a pH between 6 and 7. Because the volatile-grade blank water had a pH of 4.5, surface water from Boulder Creek, Colo., was chosen for the pH 7 experiment. Adjusting the reagent water to pH 7 would have required adding a base to the reagent water, possibly introducing interferents. The pH of the Boulder Creek surface water was 7.33. Only 1 L was available for this experiment so only four fortified replicates were prepared for each interval, transferred to 40-mL VOC vials, and stored at 4ºC.
17.2 Holding-time data analysis. Nine replicate samples (four at pH 7, five at pH 2) were analyzed on days 0, 15, 28, and 46 (tables 9 and 10). All samples were analyzed with new calibration curves prepared on days 0, 15, 28, and 46.
17.3 Holding-time experiment results. The results of the holding-time experiment indicate that all of the analytes are stable for 40 days or longer, at pH 2 and 7, with the exception of methyl actetate, which is stable for 7 days at pH 2 according to the ASTM holding-time calculation (tables 11 and 12). Tables 9 and 10 list average recovery for each holding-time period.
Table 9. Results of a 2.0-microgram-per-liter (or greater) preservation study in surface-water samples from Boulder Creek, Colorado, pH 7
[conc., concentration; �g/L, microgram per liter; RSD, relative standard deviation; <, less than. Recovery calculations represent the mean of four replicate spikes relative to day 0]
Day 01 Day 151 Day 281 Day 461
Compound
Unspiked sample conc. (µg/L)
(µg/L) Averagerelative
recovery (percent)
Averagerelative
recovery(percent)
Average relative
recovery (percent)
Percent RSD2
1 Acetone <1.2 17.41 89 77 107 13.4 2 tert-Amyl alcohol <0.43 18.59 96 97 107 6.1 3 tert-Amyl methyl ether <0.07 1.987 98 108 101 4.5 4 Benzene <0.014 1.999 94 94 99 3.3 5 tert-Butyl alcohol <1.0 27.88 101 92 105 7.0 6 tert-Butyl ethyl ether <0.1 2.043 111 115 108 5.4 7 tert-Butyl methyl ether <0.08 2.001 113 108 107 4.8 8 Diisopropyl ether <0.08 2.016 107 106 101 3.2 9 Ethylbenzene <0.032 2.023 97 93 93 3.7
10 Methyl acetate <0.43 3.914 114 89 112 15.5 11 Toluene <0.01 1.975 98 98 98 1.6 12 meta- and para-Xylene <0.07 4.022 84 88 91 7.1 13 ortho-Xylene <0.039 2.035 99 101 99 1.9
Surrogates p-Bromofluorobenzene 0.952 .991 104 103 102 2.0 1,2-Dichloroethane-d4 1.008 .988 92 95 100 3.7 Isobutyl alcohol-d6 9.371 9.734 90 86 100 9.0 Toluene-d8 0.959 .995 95 99 101 2.6
1All samples were analyzed with new calibration curves prepared on days 0, 15, 28, and 46. 2Represents the percent RSD of these 16 replicate spikes.

Analytical Method 25
17.4 Effect of pH. The fortified samples were grouped and compared by using the nonparametric Mann-Whitney test to examine the null hypothesis that the median recoveries at pH 7 were equal to the median recoveries at pH 2. The median recoveries for acetone, tert-amyl alcohol, and tert-butyl alcohol are signifi-cantly higher (two-sided p-value <0.05; Mann–Whitney test) (fig. 6) at pH 2, whereas the median recovery for methyl acetate is significantly lower at �pH 2. There were no significant effects of pH for the other analytes. The median recoveries for all of the analytes at pH 7 ranged from 88.3 to 112.6 percent, and the median recoveries for all of the analytes at pH 2 ranged from 78.7 to 112.0 percent. The median recoveries at pH 7 were within 1 percent of the median recoveries at pH 2, except for acetone, tert-amyl alcohol, tert-butyl alcohol, and methyl acetate (see table 13).
These results showing higher recovery of acetone, tAA, and tBA at pH 2 compared to pH 7 do not appear to be the result of degradation of oxygenates, for example, the formation of tBA from MTBE, because there are no corresponding changes in the oxygenate concentrations. Recoveries of acetone, tAA, and tBA might be higher at pH 2 because of more efficient purging at pH 2 compared to pH 7.
17.5 Recommended preservation for gasoline oxygenates, degradates, and laboratory schedule. �Sample preservation by adjusting the pH to 2 is not recommended because of the potential formation of tBA from MTBE. The holding-time study results indicate the compounds were stable for >46 days at pH 7 for the gasoline oxygenates and their degradation products. A 14-day holding time will be used by the NWQL to stay consistent with USEPA methodology. Laboratory Schedule 4024 is used when submitting unpreserved samples to the NWQL. Table 1 lists analytes for Laboratory Schedule 4024.
Table 10. Results of a 2.0-microgram-per-liter (or greater) preservation study in volatile-grade blank water, pH 2
[conc., concentration; �g/L, microgram per liter; RSD, relative standard deviation; <, less than. Recovery calculations represent the mean of four replicate spikes relative to day 0]
Day 01 Day 151 Day 281 Day 461
Compound
Unspiked sample conc. (µg/L)
(µg/L) Averagerelative
recovery (percent)
Averagerelative
recovery(percent)
Average relative
recovery (percent)
Percent RSD2
1 Acetone <1.2 19.756 89 77 97 10.6 2 tert-Amyl alcohol <0.43 20.85 98 104 100 3.1 3 tert-Amyl methyl ether <0.07 2.004 97 105 100 3.3 4 Benzene <0.014 1.991 95 92 98 3.4 5 tert-Butyl alcohol <1.0 31.318 106 103 99 3.7 6 tert-Butyl ethyl ether <0.1 2.070 111 112 108 4.6 7 tert-Butyl methyl ether <0.08 2.033 114 108 106 4.8 8 Diisopropyl ether <0.08 2.029 108 103 102 3.3 9 Ethylbenzene <0.032 2.013 99 92 95 3.6
10 Methyl acetate <0.43 4.023 102 75 52 25.6 11 Toluene <0.01 1.978 100 96 98 2.1 12 meta- and para-Xylene <0.07 4.012 85 88 93 6.4 13 ortho-Xylene <0.039 2.035 100 98 97 1.8
Surrogates p-Bromofluorobenzene 0.940 1.002 104 100 100 2.1 1,2-Dichloroethane-d4 0.997 0.982 94 93 103 4.2 Isobutyl alcohol-d6 9.136 11.228 94 94 92 4.6 Toluene-d8 0.964 0.995 94 96 100 2.7
1All samples were analyzed with new calibration curves prepared on days 0, 15, 28, and 46. 2Represents the percent RSD of these 16 replicate spikes.

26 DETERMINATION OF GASOLINE OXYGENATES, SELECTED DEGRADATES, AND BTEX �IN WATER BY HEATED PURGE AND TRAP/GC/MS�
17.6 Recommended preservation for gasoline oxygenates, degradates, BTEX, and laboratory schedule. Samples known to contain bacteria adapted to degrading fuels should be preserved to pH 2 if analysis of BTEX compounds is desired and methyl acetate is not a concern. Laboratory Schedule 4025 is used when submitting acid-preserved samples to the NWQL. Methyl acetate is reported with an estimated remark with acid preservation because this compound can degrade during storage in acidic conditions. Table 1 lists analytes for Laboratory Schedule 4025.
SUMMARY AND CONCLUSIONS
A method was developed to analyze water samples for gasoline oxygenates, their degradates, and BTEX (benzene, toluene, ethylbenzene, and xylenes) compounds using heated purge and trap gas
chromatography/mass spectrometry. The analytes in this method are extracted from the sample by bubbling helium through a 25-milliliter sample, which is heated to 65ºC. The analytes are trapped on a sorbent and then thermally desorbed into the gas chromatograph/mass spectrometer. Method detection limits ranged from 0.005 to 0.62 µg/L.
This method is suitable for analysis of gasoline oxygenates, their degradates, and BTEX in surface-water and ground-water samples. Sample preservation at pH 2 is not recommended for this method because of potential formation of tert-butyl alcohol from tert-butyl methyl ether. However, data from the holding-time study indicate that samples may be acid preserved to pH 2 with hydrochloric acid if analysis for methyl acetate is not required. All of the analytes are stable at pH 7 for at least 46 days.
Table 11. Calculated holding times from preservation study in volatile-grade blank water, pH 2
[Holding times less than 14 days shown in boldface. Reagent-water samples were adjusted to pH 2.0 and fortified at concentrations ranging from 2.0 to 29.9 micrograms per liter. Five replicate samples were analyzed on days 0, 15, 28, and 46; %, percent; d, tolerable range of deviation from initial concentration (in percent recovery); conc., concentration; std. dev., standard deviation; Intercept, intercept of linear fit to holding-time results; Slope, slope of linear fit to holding-time results; Calculated holding time, estimated holding time (days) from least-squares regression (using a straight-line model); >46, calculated holding time greater than longest time of experiment]
Day 0 Day 0
Compound Calculated number of
replicates1,2 average conc.
(% recovery)
std.dev. (%)
Slope1 Intercept1
(%)
Tolerable
range of deviation
d 1 (%)
Calcu-lated
holding time1
(days) 1 Acetone 2 98.9 2.3 -0.116 92.2 7.8 >46 2 tert-Amyl alcohol 1 103.4 1.7 0.041 103.9 6.6 >46 3 tert-Amyl methyl ether 2 99.9 1.0 0.046 99.7 7.5 >46 4 Benzene 1 99.4 0.6 -0.054 96.9 2.6 48 5 tert-Butyl alcohol 3 104.1 2.5 -0.042 108.0 11.2 >46 6 tert-Butyl ethyl ether 1 103.2 0.4 0.170 107.8 2.7 >46 7 tert-Butyl methyl ether 1 101.3 0.6 0.087 106.8 5.0 >46 8 Diisopropyl ether 1 100.9 0.9 -0.001 104.7 4.3 >46 9 Ethylbenzene 1 100.7 0.9 -0.137 100.2 6.9 >46
10 Methyl acetate 2 100.2 2.9 -1.133 108.1 8.2 7 11 Toluene 2 98.8 0.4 -0.061 98.5 8.2 >46 12 meta- and para-Xylene 5 100.2 1.0 -0.109 94.3 16.0 >46 13 ortho-Xylene 1 101.8 1.2 -0.066 102.1 4.7 >46 1
See American Society for Testing and Materials (2001) for formulas. 2The analyte variability used in the formula was calculated from the high and low concentration volatile-grade blank-water spikes combined (table 8).

Table 12. Calculated holding times from preservation study in volatile-grade blank water, pH 7
[Surface-water samples from Boulder Creek were fortified at concentrations ranging from 2.0 to 29.9 micrograms per liter. Four replicate samples were analyzed on days 0, 15, 28, and 46; %, percent; d, tolerable range of deviation from initial concentration (in percent recovery); conc., concentration; std. dev., standard deviation; Intercept, intercept of linear fit to holding-time results; Slope, slope of linear fit to holding-time results; Calculated holding time, estimated holding time (days) from least-squares regression (using a straight-line model); >46, calculated holding time greater than longest time of experiment]
Day 0 Day 0
Compound Calculated number of
replicates1, 2 average
conc. (% recovery)
std.dev. (%)
Slope1 Intercept1
(%)
Tolerable range of deviation
d 1 (%)
Calcu-lated
holding time1 (days)
1 Acetone 2 87.0 2.7 0.006 79.4 8.0 >46 2 tert-Amyl alcohol 1 93.0 2.0 0.128 89.9 6.8 >46 3 tert-Amyl methyl ether 2 99.3 1.2 0.107 99.3 7.7 >46 4 Benzene 1 99.9 1.4 -0.043 97.0 2.6 >46 5 tert-Butyl alcohol 3 93.3 2.3 0.019 91.8 11.5 >46 6 tert-Butyl ethyl ether 1 102.1 1.3 0.217 106.5 2.8 >46 7 tert-Butyl methyl ether 1 100.0 1.5 0.114 104.7 5.2 >46 8 Diisopropyl ether 1 100.8 0.8 0.028 104.1 4.5 >46 9 Ethylbenzene 1 101.1 1.3 -0.175 100.5 7.1 40
10 Methyl acetate 2 97.8 2.0 0.033 99.4 8.5 >46 11 Toluene 2 98.8 1.0 -0.053 98.4 8.4 >46 12 meta- and para-Xylene 5 100.5 1.2 -0.175 94.7 16.4 >46 13 ortho-Xylene 1 101.8 1.6 -0.002 101.7 4.9 >46
1See American Standard for Testing and Materials (2001) for formulas.
2The analyte variability used in the formula was calculated from the high and low concentration volatile-grade blank-
water spikes combined (table 8).
Summary and Conclusions 27

Largest value within 1.5 interquartileranges above the 75th percentile
75th percentile
50th percentile
25th percentile
Smallest value within 1.5 interquartileranges below the 75th percentile
Data values outside range
Number of replicates
EXPLANATION
(16)
PE
RC
EN
TR
EC
OV
ER
Y
pH2 pH7
pH2 pH7
40
40
60
80
100
120
40
60
80
100
120
40
60
80
100
120
40
60
80
100
120
40
60
80
100
120
40
60
80
100
120
60
80
100
120
140
(20) (16) (20) (16)Acetonep=0.0071
tert-Amyl methyl ether
tert-Butyl alcoholp<0.0001
tert-Butyl ethyl ether
tert-Butyl methyl ether
tert-Amyl alcoholp<0.0001
Benzene
Ethyl benzene
Toluene
Diisopropyl ether
Methyl acetatep=0.0449
meta- & para- Xylenes
ortho- Xylene
Figure 6. Recovery of gasoline oxygenates, oxygenate degradates, and BTEX from the holding-time study for day 0 to day 46 at pH 2 and pH 7. (See tables 9, 10, and 13.)
28 DETERMINATION OF GASOLINE OXYGENATES, SELECTED DEGRADATES, AND BTEX �IN WATER BY HEATED PURGE AND TRAP/GC/MS�

Table 13. Results of the Mann–Whitney statistical test for pH 2 and pH 7
[P-value, probability of Mann–Whitney test of equal medians; <, less than; boldface for P-value indicates medians are significantly (p<0.05) different]
Compound
pH 2 median
recovery (percent)1
pH 2 F-pseudosigma
(percent)1
pH 7 median
recovery (percent)2
pH 7 F-pseudosigma
(percent)2 P-value
1 Acetone 92.98 12.13 78.73 13.61 0.0071 2 tert-Amyl alcohol 104.65 3.03 91.65 5.70 <0.0001 3 tert-Amyl methyl ether 100.20 2.23 100.28 6.00 0.7990 4 Benzene 96.15 3.87 95.25 3.91 0.7143 5 tert-Butyl alcohol 107.08 2.71 93.69 5.44 <0.0001 6 tert-Butyl ethyl ether 112.63 3.67 112.03 6.12 0.5774 7 tert-Butyl methyl ether 108.53 5.36 107.70 5.16 0.3237 8 Diisopropyl ether 104.00 3.40 104.88 4.86 0.9873 9 Ethylbenzene 98.20 3.86 97.55 4.36 0.6907
10 Methyl acetate 88.30 24.78 97.51 15.36 0.0449 11 Toluene 97.70 1.83 97.10 1.86 0.8485 12 meta- and para-Xylene 91.00 7.13 90.21 6.97 0.5666 13 ortho-Xylene 101.43 2.00 101.48 1.20 0.4837 1Median percent recovery and F-pseudosigma calculated from days 0, 15, 28, and 46, a total of 20 replicate spikes.
2Median percent recovery and F-pseudosigma calculated from days 0, 15, 28, and 46, a total of 16 replicate spikes.
Summary and Conclusions 29

REFERENCES CITED
Achten, C., and Puttmann, W., 2000, Determination of methyl tert-butyl ether in surface water by use of solid-phase microextraction: Environmental Science & Technology, v. 34, no. 7, p. 1359–1364.
American Society for Testing and Materials, 2001, Standard practice for estimation of holding time for water samples containing organic and inorganic constituents, in Annual book of ASTM standards, Section 11, Water: West Conshohocken, Pa., v. 11.01, D4841–88.
Cassada, D.A., Zhang, Y., Snow, D.D., and Spalding, R.F., 2000, Trace analysis of ethanol, MTBE, and related oxygenate compounds in water using solid-phase microextraction and gas chromatography/mass spectrometry: Analytical Chemistry, v. 72, no. 19, p. 4654–4658.
Church, C.D., Isabelle, L.M., Pankow, J.F., Rose, D.L., and Tratnyek, P.G., 1997, Method for determination of methyl tert-butyl ether and its degradation products in water: Environmental Science & Technology, v. 31, no. 12, �p. 3723–3726.
Childress, C.J.O., Foreman, W.T., Connor, B.F., and Maloney, T.J., 1999, New reporting procedures based on long-term method detection levels and some considerations for interpretations of water-quality data provided by the U.S. Geological Survey National Water Quality Laboratory: U.S. Geological Survey Open-File Report 99-193, 19 p.
Connor, B.F., Rose, D.L., Noriega, M.C., Murtagh, L.K., and Abney, S.R., 1998, Methods of analysis by the U.S. Geological Survey National Water Quality Laboratory: Determination of 86 volatile organic compounds in water by gas chromatography/mass spectrometry, including detections less than reporting limits: U.S. Geological Survey Open-File Report 97-829, 78 p.
Correa, C.L., and Pedroso, R.C., 1997, Headspace gas chromatography with capillary column for urine alcohol determination: Journal of Chromatography B: Biomedical Sciences and Applications, v. 704, nos. 1 and 2, p. 365–368.
Diaz, A.F., and Drogos, D.L., 2002, Stability of methyl tert-butyl ether, tert-amyl methyl ether, and ethyl tert-butyl ether in acidic media, in Oxygenates in gasoline: Environmental aspects: Diaz, A.F., and Drogos, D.L, eds., American Chemical Society Symposium Series 799, chap. 10, Washington, D.C., p. 138–151.
Grady, S.J., and Casey, G.D., 2001, Occurrence and distribution of methyl tert-butyl ether and other volatile organic compounds in drinking water in the Northeast and Mid-Atlantic regions of the United States, 1993–1998: U.S. Geological Survey Water-Resources Investigations Report 00-4228, 123 p.
Kram, M., and Lory, E., 1998, Use of SCAPs suite of tools to rapidly delineate a large MTBE plume, in Bell, R.S., Powers, M.H., and Larson, T., eds., Symposium on the Application of Geophysics to Environmental and Engineering Problems, March 22–26, 1998 [Proceedings]: Chicago, Ill., �p. 85–99.
Landmeyer, J.E., Chapelle, F.H., Bradley, P.M., Pankow, J.F., Church, C.D., and Tratnyek, P.G., 1998, Fate of MTBE relative to benzene in a gasoline-containing aquifer (1993–98): Ground Water Monitoring & Remediation, v. 18, no. 4, p. 93–102.
Lawyui, R., and Fingas, M., 1997, Environmental impact of methyl tert-butyl ether (MTBE), in The Fourteenth Technical Seminar on Chemical Spills [Proceedings]: Ottawa, Canada, Environment Canada, p. 121–141.
Lee, C.W., and Weisel, C.P., 1998, Determination of methyl tert-butyl ether and tert-butyl alcohol in human urine by high-temperature purge-and-trap gas chromatography–mass spectrometry: Journal of Analytical Toxicology, v. 22, no. 1, p. 1–5.
Munch, J.W., 1995, Method 524.2—Measurement of purgeable organic compounds in water by capillary column gas chromatography/mass spectrometry, Revision 4.1: Cincinnati, Ohio, Environmental Monitoring Systems Laboratory, U.S. Environmental Protection Agency, 48 p.
National Science and Technology Council, 1997, Interagency assessment of oxygenated fuels: Washington, D.C., Office of Science and Technology Policy, Executive Office of the President.
O'Reilly, K.T., Moir, M.E., Taylor, C.D., Smith, C.A., and Hyman, M.R., 2001, Hydrolysis of tert-butyl methyl ether (MTBE) in dilute aqueous acid: Environmental Science & Technology, v. 35, no. 19, p. 3954–3961.
Pankow, J.F., 1986, Magnitude of artifacts caused by bubbles and headspace in the determination of volatile compounds in water: Analytical Chemistry, v. 58, p. 1822–1826.
30 DETERMINATION OF GASOLINE OXYGENATES, SELECTED DEGRADATES, AND BTEX �IN WATER BY HEATED PURGE AND TRAP/GC/MS�

Sandstrom, M.W., Stroppel, M.E., Foreman, W.T., and Schroeder, M.P., 2001, Methods of analysis by the U.S. Geological Survey, National Water Quality Laboratory—Determination of moderate-use pesticides and selected degradates in water by �C-18 solid-phase extraction and capillary-column gas chromatography/mass spectrometry with selected-ion monitoring: U.S. Geological Survey Water-Resources Investigations Report 01-4098, 70 p.
Schirmer, Mario, Barker, J.F., and Butler, B.J., 1998, Natural attenuation in the Borden Aquifer, Ontario, Canada: Ground Water Monitoring & Remediation, Spring 1998, p. 113–122.
Squillace, P.J., Moran, M.J., Lapham, W.W., Price, C.V., Clawges, R.M., and Zogorski, J.S., 1999, Volatile organic compounds in untreated ambient groundwater of the United States, 1985–1995: Environmental Science & Technology, v. 33, �no. 23, p. 4176–4187.
Taylor, J.K., 1987, Quality assurance of chemical measurements: Chelsea, Mich., Lewis Publishers, 328 p.
U.S. Environmental Protection Agency, 2002, Guidelines establishing test procedures for the analysis of pollutants (Part 136, Appendix B. Definition and procedure for the determination of the method detection limit–Revision 1.11): U.S. Code of Federal Regulations, Title 40, revised as of July 1, 2002, p. 635–638.
U.S. Geological Survey, 1996, Guidelines for labeling 40-mL volatiles sample vials: National Water Quality Laboratory Technical Memorandum �No. 96.01, accessed February 24, 2003, at URL �http://nwql.usgs.gov/Public/tech-memos/nwql.96-01.html.
Weaver, J.W., Haas, J.E., and Wilson, J.T., 1996, Analysis of the gasoline spill at East Patchogue, New York, in American Society of Civil Engineers Conference on Non-Aqueous Phase Liquids in the Subsurface Environment—Assessment and Remediation [Proceedings]: Washington, D.C., American Society of Civil Engineers, p. 707–719.
Wilde, F.D., Radtke, D.B., Gibs, Jacob, and Iwatsubo, R.T., 1999, Preparations for water sampling, in National field manual for the collection of water-quality data: U.S. Geological Survey Techniques of Water-Resources Investigations, book 9, chap. A1, accessed March 12, 2003, at �http://pubs.water.usgs.gov/twri9A1.
Zuba, D., Parczewski, A., and Reichenbacher, M., 2002, Optimization of solid-phase microextraction conditions for gas chromatographic determination of ethanol and other volatile compounds in blood: Journal of Chromatography B: Biomedical Sciences and Applications, v. 773, no. 1, p. 75–82.
References Cited 31