methods of organizing data
DESCRIPTION
Methods of Organizing Data. Prepared by: Josefina V. Almeda Professor and College Secretary School of Statistics University of the Philippines, Diliman August 2009. Quantitative Classification of Data * use quantitative classification if the observed values of the - PowerPoint PPT PresentationTRANSCRIPT
Training Course on Basic Statistics for Research
August 24-28, 2009
STATISTICAL RESEARCH AND TRAINING CENTERJ and S Building, 104 Kalayaan Avenue, Diliman, Quezon City
Methods of Organizing Data
Prepared by:Josefina V. AlmedaProfessor and College SecretarySchool of StatisticsUniversity of the Philippines, DilimanAugust 2009
2
Statistical Research and Training Center Training Course on Basic Statistics for ResearchAugust 24 - 28, 2009
Quantitative Classification of Data
* use quantitative classification if the observed values of the data are either a result of count or measurement
* organize this type of data in tabular form in the form of a frequency distribution table.
Frequency distribution is a summarized table wherein theclasses are either distinct values or intervals with a frequencycount.
3
Statistical Research and Training Center Training Course on Basic Statistics for ResearchAugust 24 - 28, 2009
Forms of the Frequency Distribution
Single value grouping* is a frequency count of observed values wherein classes are
distinct values
* range of values is short and with many unique values occurring more than once
Grouping by class intervals* is a frequency count of observed values wherein the classes
are intervals.
4
Statistical Research and Training Center Training Course on Basic Statistics for ResearchAugust 24 - 28, 2009
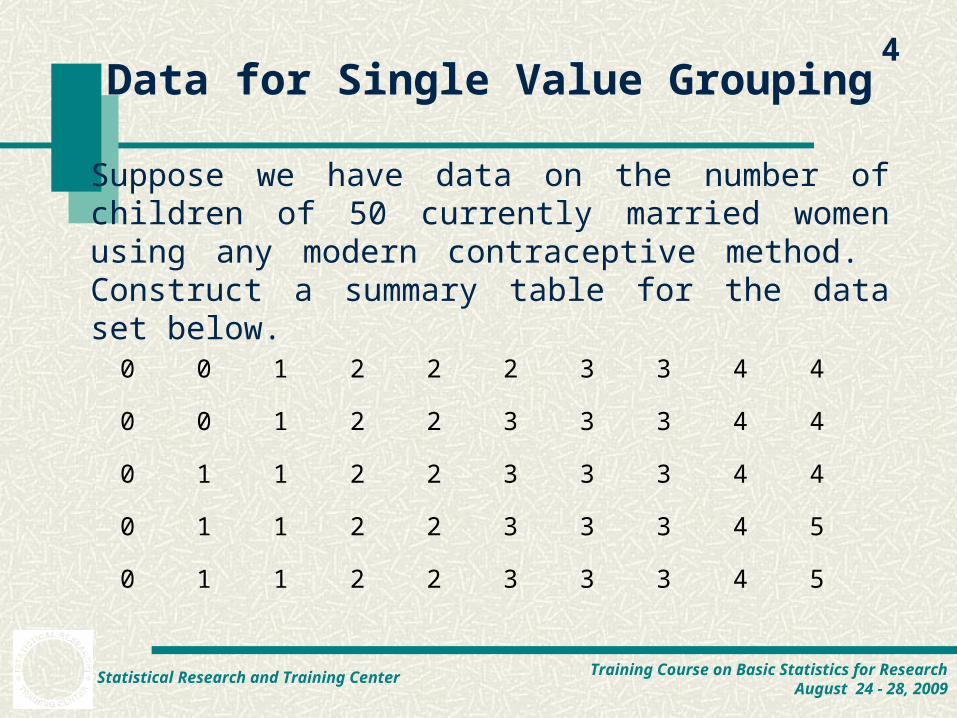
Data for Single Value Grouping
Suppose we have data on the number of children of 50 currently married women using any modern contraceptive method. Construct a summary table for the data set below.
0 0 1 2 2 2 3 3 4 4
0 0 1 2 2 3 3 3 4 4
0 1 1 2 2 3 3 3 4 4
0 1 1 2 2 3 3 3 4 5
0 1 1 2 2 3 3 3 4 5
5
Statistical Research and Training Center Training Course on Basic Statistics for ResearchAugust 24 - 28, 2009
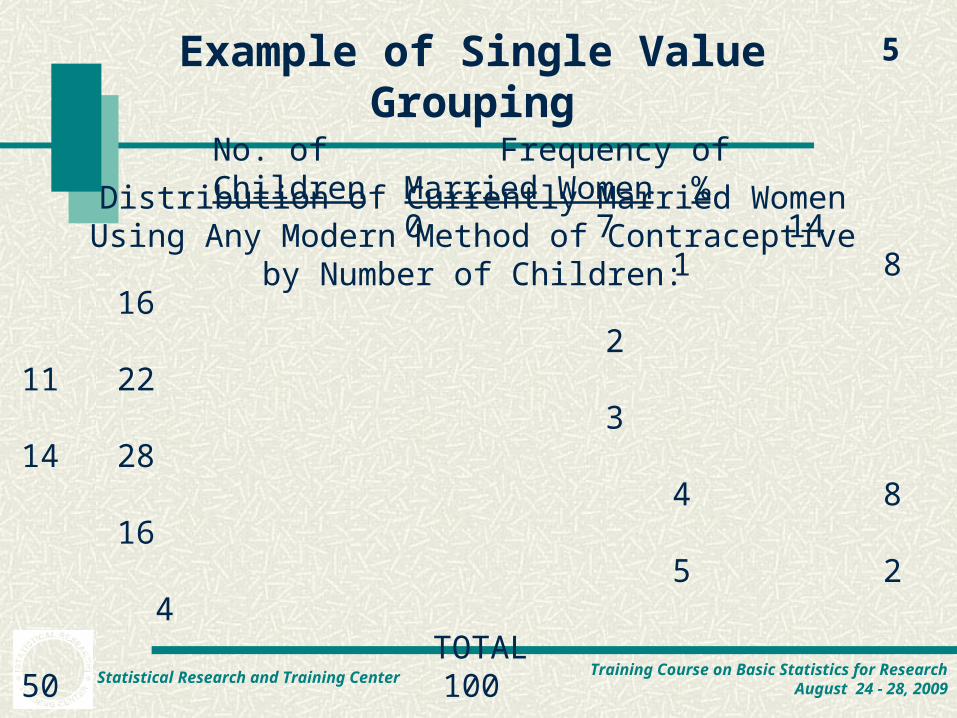
Example of Single Value Grouping
Distribution of Currently Married Women Using Any Modern Method of Contraceptive by Number of Children:
No. of Frequency of Children Married Women % 0 7 14
1 8 16 2 11 22 3 14 28
4 8 16 5 2 4
TOTAL 50 100
6
Statistical Research and Training Center Training Course on Basic Statistics for ResearchAugust 24 - 28, 2009
Definition of Terms Used in a Frequency Distribution Table
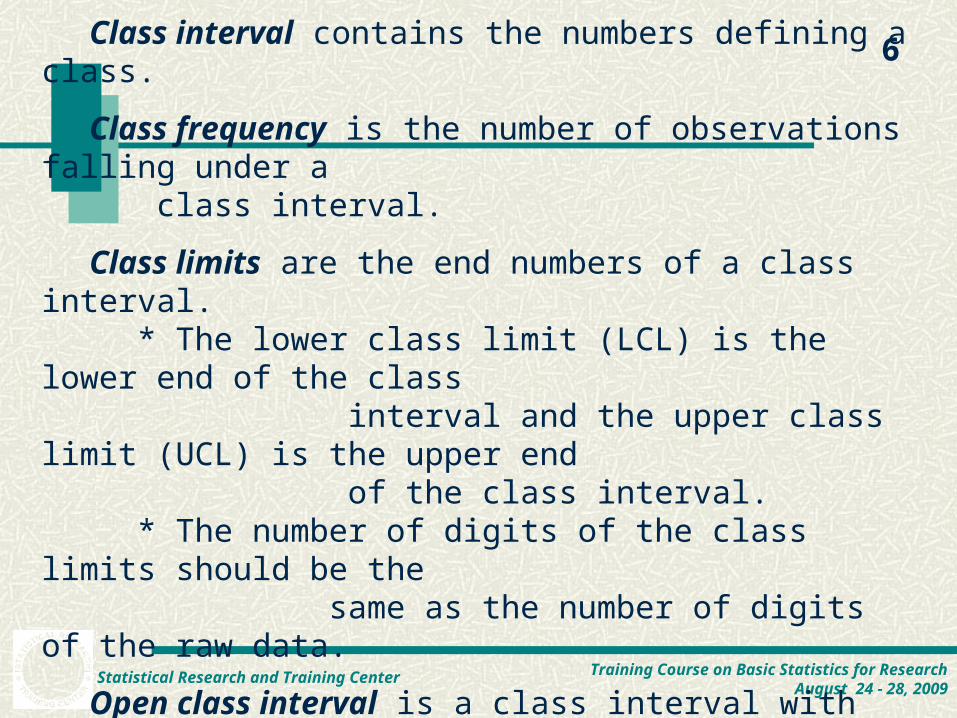
Class interval contains the numbers defining a class.
Class frequency is the number of observations falling under a class interval.
Class limits are the end numbers of a class interval.* The lower class limit (LCL) is the lower end of the class
interval and the upper class limit (UCL) is the upper end of the class interval.
* The number of digits of the class limits should be the same as the number of digits of the raw data.
Open class interval is a class interval with either no lower class limit or upper class limit.
7
Statistical Research and Training Center Training Course on Basic Statistics for ResearchAugust 24 - 28, 2009
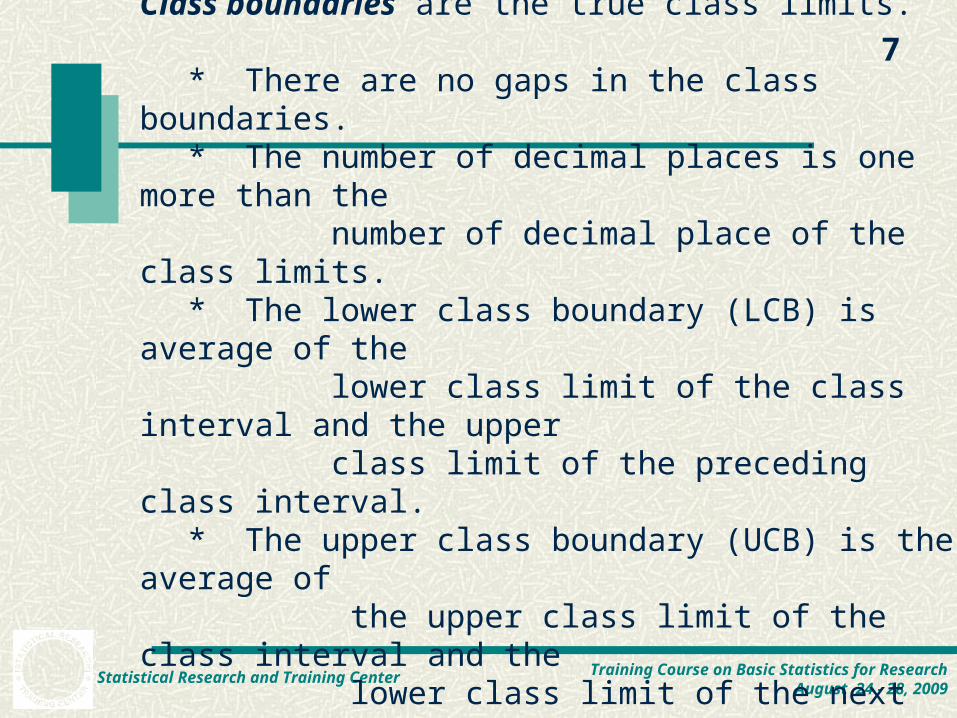
Class boundaries are the true class limits.
* There are no gaps in the class boundaries.* The number of decimal places is one more than the
number of decimal place of the class limits.* The lower class boundary (LCB) is average of the
lower class limit of the class interval and the upper class limit of the preceding class interval.
* The upper class boundary (UCB) is the average of the upper class limit of the class interval and the lower class limit of the next class interval.
8
Statistical Research and Training Center Training Course on Basic Statistics for ResearchAugust 24 - 28, 2009
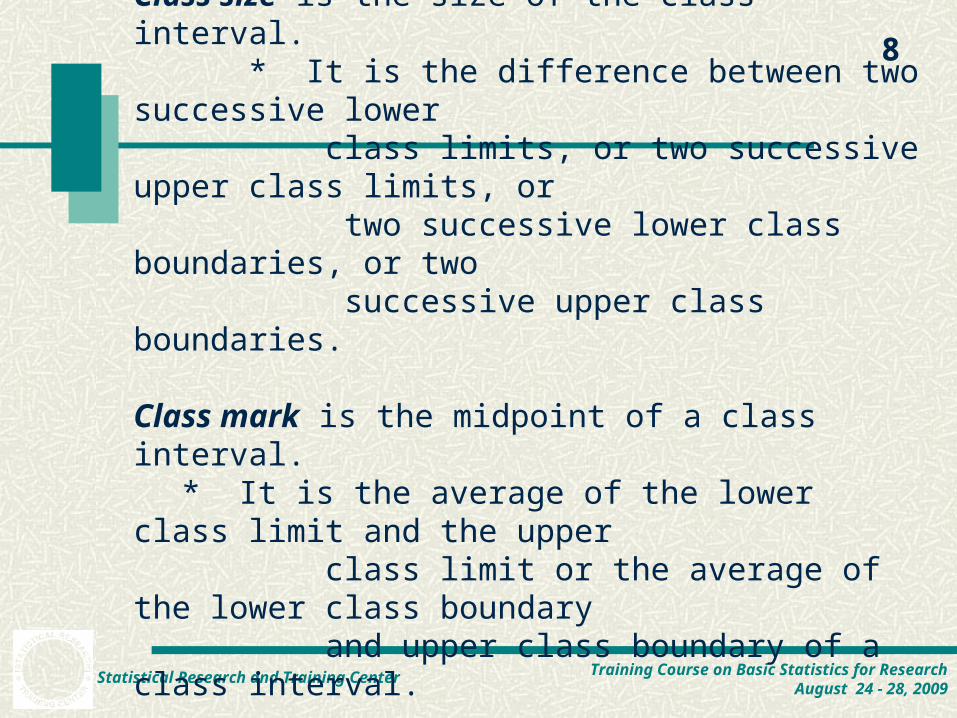
Class size is the size of the class interval. * It is the difference between two successive lower class limits, or two successive upper class limits, or two successive lower class boundaries, or two successive upper class boundaries.
Class mark is the midpoint of a class interval.* It is the average of the lower class limit and the upper
class limit or the average of the lower class boundary and upper class boundary of a class interval.
Modal class is the class interval having the highest frequency.
9
Statistical Research and Training Center Training Course on Basic Statistics for ResearchAugust 24 - 28, 2009
Steps in Constructing a Frequency Distribution Table
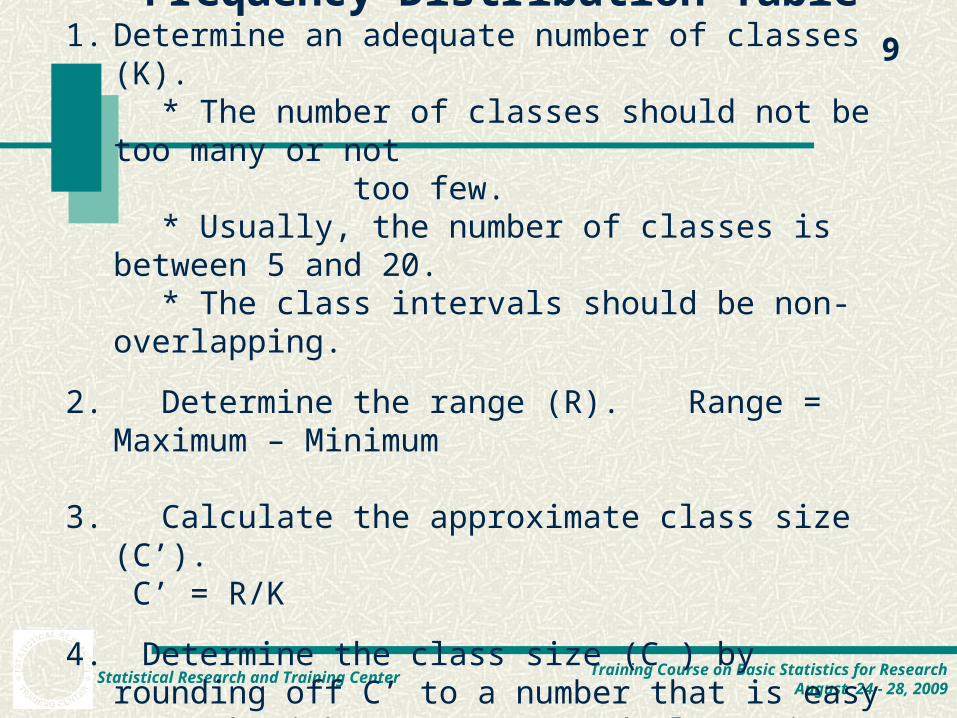
1. Determine an adequate number of classes (K).* The number of classes should not be too many or not
too few.* Usually, the number of classes is between 5 and 20.* The class intervals should be non-overlapping.
2. Determine the range (R). Range = Maximum – Minimum
3. Calculate the approximate class size (C’). C’ = R/K
4. Determine the class size (C ) by rounding off C’ to a number that is easy to work with. We recommend class sizes of multiples of 5, 10, 15, 20, etc.
10
Statistical Research and Training Center Training Course on Basic Statistics for ResearchAugust 24 - 28, 2009
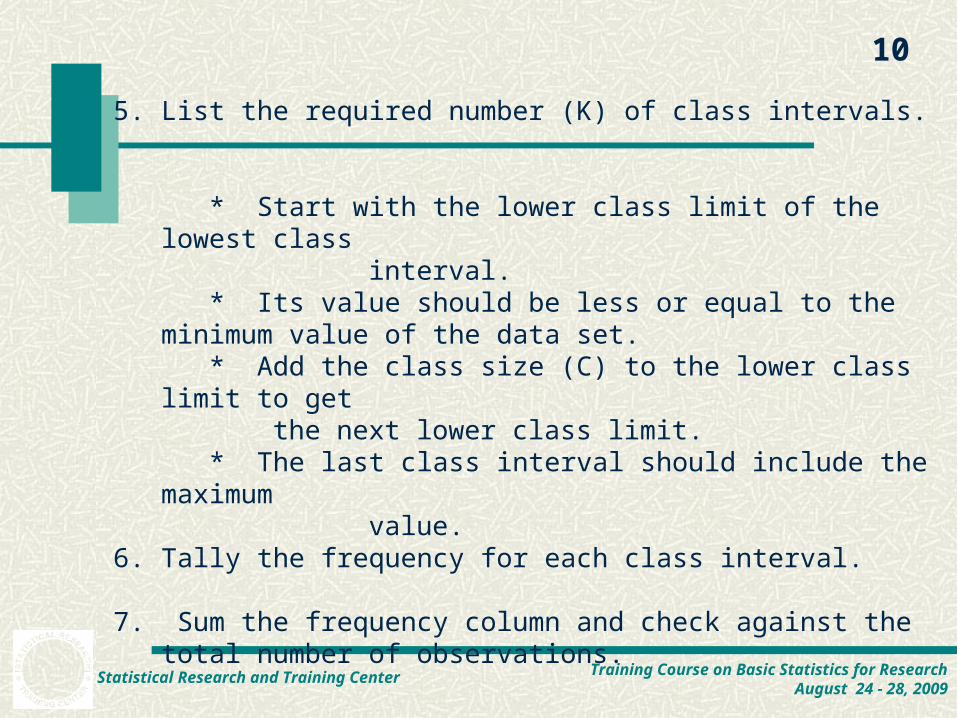
5. List the required number (K) of class intervals.
* Start with the lower class limit of the lowest class interval.
* Its value should be less or equal to the minimum value of the data set. * Add the class size (C) to the lower class limit to get
the next lower class limit.* The last class interval should include the maximum
value. 6. Tally the frequency for each class interval.
7. Sum the frequency column and check against the total number of observations.
11
Statistical Research and Training Center Training Course on Basic Statistics for ResearchAugust 24 - 28, 2009
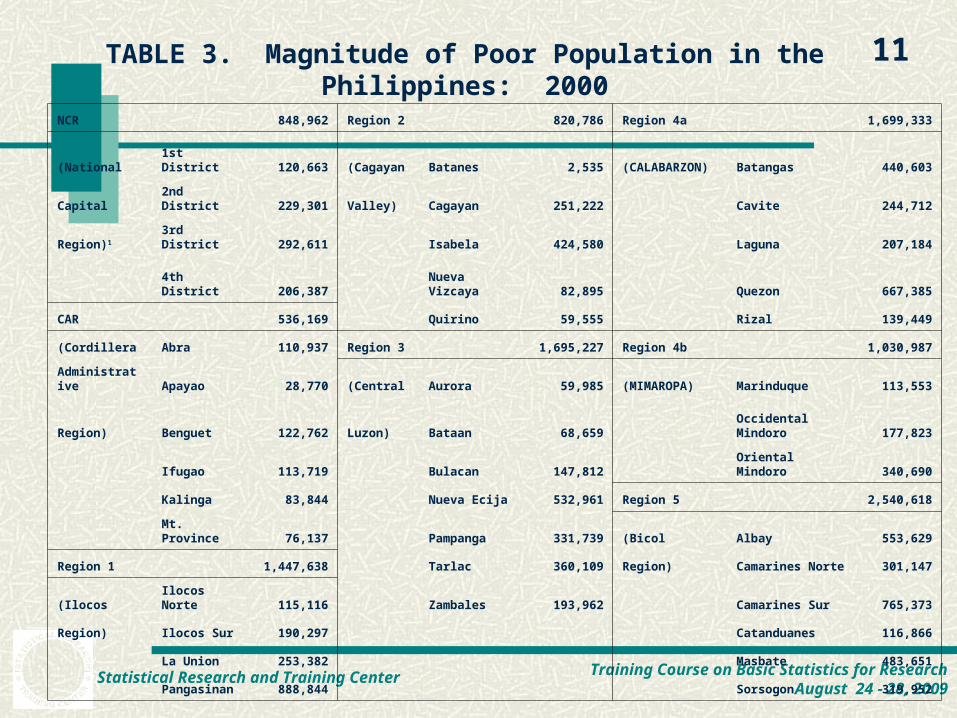
TABLE 3. Magnitude of Poor Population in the Philippines: 2000
NCR 848,962 Region 2 820,786 Region 4a 1,699,333
(National 1st District 120,663 (Cagayan Batanes 2,535 (CALABARZON) Batangas 440,603
Capital 2nd District 229,301 Valley) Cagayan 251,222 Cavite 244,712
Region)1 3rd District 292,611 Isabela 424,580 Laguna 207,184
4th District 206,387 Nueva Vizcaya 82,895 Quezon 667,385
CAR 536,169 Quirino 59,555 Rizal 139,449
(Cordillera Abra 110,937 Region 3 1,695,227 Region 4b 1,030,987
Administrative Apayao 28,770 (Central Aurora 59,985 (MIMAROPA) Marinduque 113,553
Region) Benguet 122,762 Luzon) Bataan 68,659 Occidental Mindoro 177,823
Ifugao 113,719 Bulacan 147,812 Oriental Mindoro 340,690
Kalinga 83,844 Nueva Ecija 532,961 Region 5 2,540,618
Mt. Province 76,137 Pampanga 331,739 (Bicol Albay 553,629
Region 1 1,447,638 Tarlac 360,109 Region) Camarines Norte 301,147
(Ilocos Ilocos Norte 115,116 Zambales 193,962 Camarines Sur 765,373
Region) Ilocos Sur 190,297 Catanduanes 116,866
La Union 253,382 Masbate 483,651
Pangasinan 888,844 Sorsogon 319,952
12
Statistical Research and Training Center Training Course on Basic Statistics for ResearchAugust 24 - 28, 2009
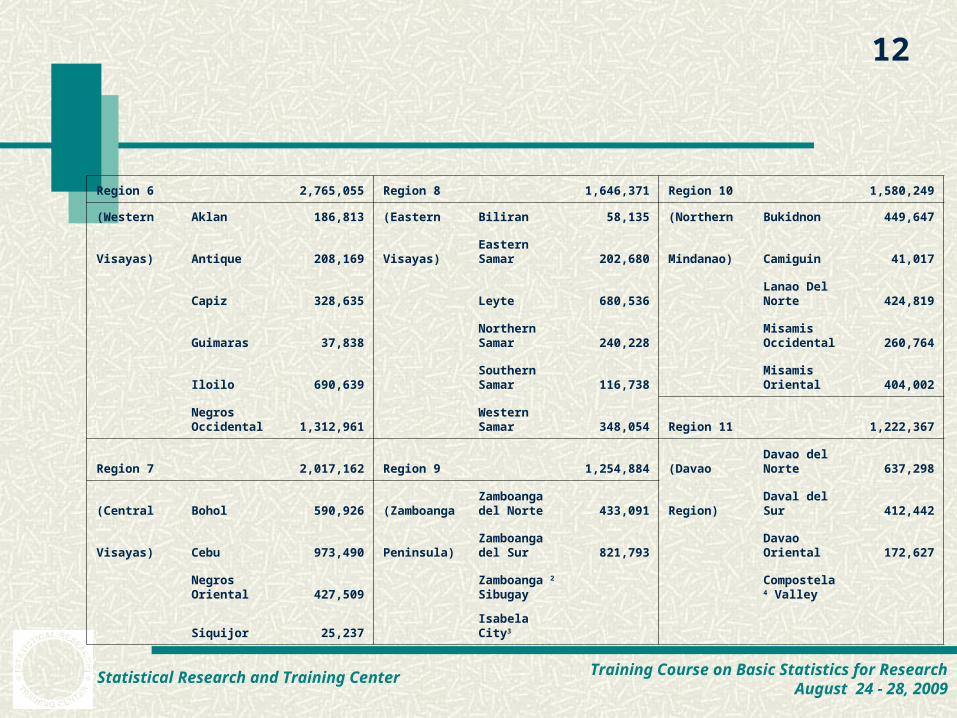
Region 6 2,765,055 Region 8 1,646,371 Region 10 1,580,249
(Western Aklan 186,813 (Eastern Biliran 58,135 (Northern Bukidnon 449,647
Visayas) Antique 208,169 Visayas)Eastern Samar 202,680 Mindanao) Camiguin 41,017
Capiz 328,635 Leyte 680,536 Lanao Del Norte 424,819
Guimaras 37,838Northern Samar 240,228
Misamis Occidental 260,764
Iloilo 690,639 Southern Samar 116,738
Misamis Oriental 404,002
Negros Occidental 1,312,961
Western Samar 348,054 Region 11 1,222,367
Region 7 2,017,162 Region 9 1,254,884 (DavaoDavao del Norte 637,298
(Central Bohol 590,926 (ZamboangaZamboanga del Norte 433,091 Region) Daval del Sur 412,442
Visayas) Cebu 973,490 Peninsula)Zamboanga del Sur 821,793
Davao Oriental 172,627
Negros Oriental 427,509
Zamboanga 2 Sibugay
Compostela 4 Valley
Siquijor 25,237 Isabela City3
13
Statistical Research and Training Center Training Course on Basic Statistics for ResearchAugust 24 - 28, 2009
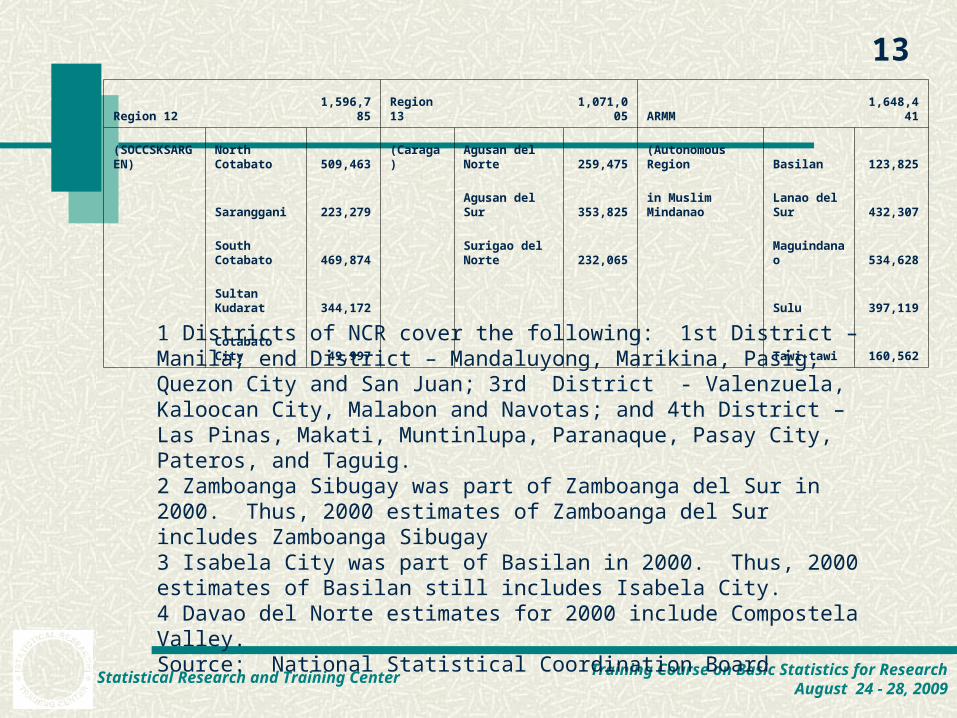
Region 12 1,596,785 Region 13 1,071,005 ARMM 1,648,441
(SOCCSKSARGEN) North Cotabato 509,463 (Caraga) Agusan del Norte 259,475
(Autonomous Region Basilan 123,825
Saranggani 223,279 Agusan del Sur 353,825in Muslim Mindanao
Lanao del Sur 432,307
South Cotabato 469,874 Surigao del Norte 232,065 Maguindanao 534,628
Sultan Kudarat 344,172 Sulu 397,119
Cotabato City 49,997 Tawi-tawi 160,562
1 Districts of NCR cover the following: 1st District – Manila; end District – Mandaluyong, Marikina, Pasig, Quezon City and San Juan; 3rd District - Valenzuela, Kaloocan City, Malabon and Navotas; and 4th District – Las Pinas, Makati, Muntinlupa, Paranaque, Pasay City, Pateros, and Taguig.2 Zamboanga Sibugay was part of Zamboanga del Sur in 2000. Thus, 2000 estimates of Zamboanga del Sur includes Zamboanga Sibugay3 Isabela City was part of Basilan in 2000. Thus, 2000 estimates of Basilan still includes Isabela City.4 Davao del Norte estimates for 2000 include Compostela Valley.Source: National Statistical Coordination Board
14
Statistical Research and Training Center Training Course on Basic Statistics for ResearchAugust 24 - 28, 2009
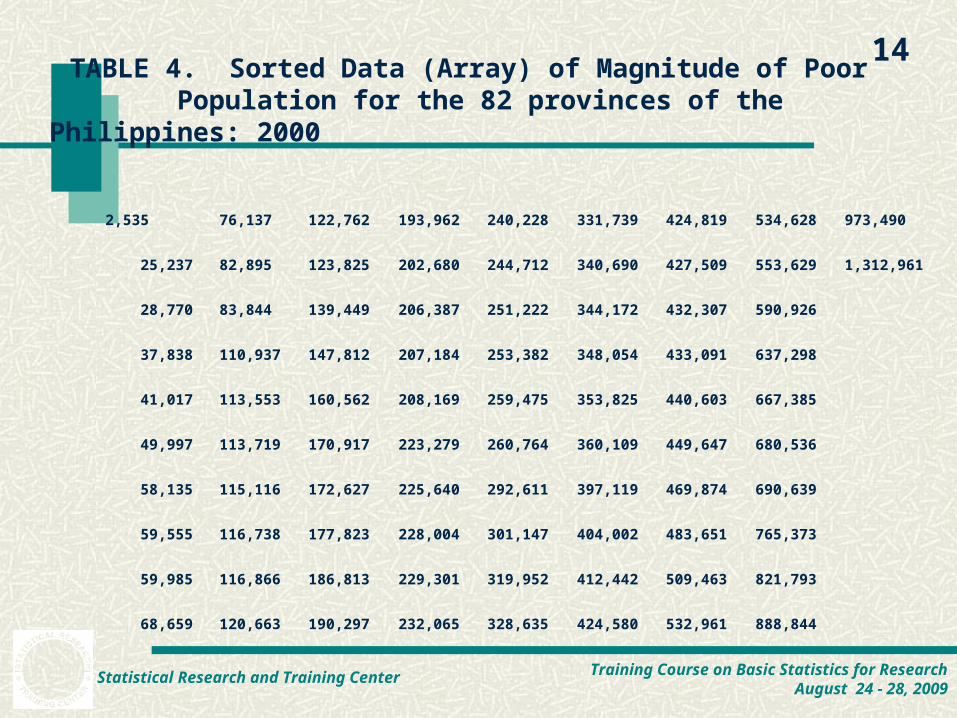
TABLE 4. Sorted Data (Array) of Magnitude of Poor Population for the 82 provinces of the Philippines: 2000
2,535 76,137 122,762 193,962 240,228 331,739 424,819 534,628 973,490
25,237 82,895 123,825 202,680 244,712 340,690 427,509 553,629 1,312,961
28,770 83,844 139,449 206,387 251,222 344,172 432,307 590,926
37,838 110,937 147,812 207,184 253,382 348,054 433,091 637,298
41,017 113,553 160,562 208,169 259,475 353,825 440,603 667,385
49,997 113,719 170,917 223,279 260,764 360,109 449,647 680,536
58,135 115,116 172,627 225,640 292,611 397,119 469,874 690,639
59,555 116,738 177,823 228,004 301,147 404,002 483,651 765,373
59,985 116,866 186,813 229,301 319,952 412,442 509,463 821,793
68,659 120,663 190,297 232,065 328,635 424,580 532,961 888,844
15
Statistical Research and Training Center Training Course on Basic Statistics for ResearchAugust 24 - 28, 2009
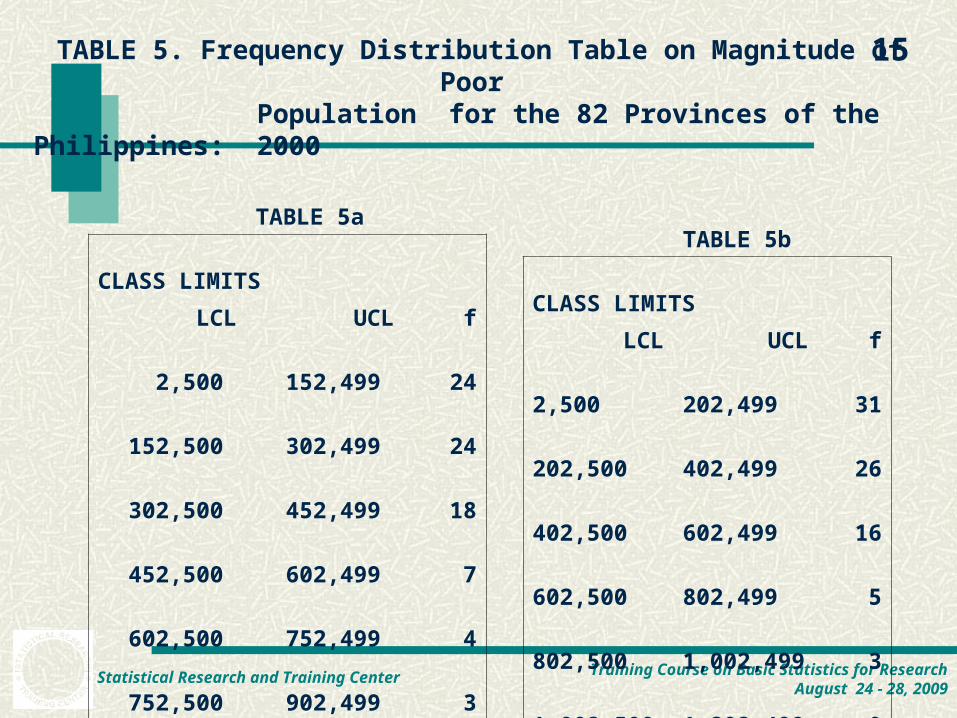
TABLE 5. Frequency Distribution Table on Magnitude of Poor Population for the 82 Provinces of the Philippines: 2000
TABLE 5a
CLASS LIMITS
LCL UCL f
2,500 152,499 24
152,500 302,499 24
302,500 452,499 18
452,500 602,499 7
602,500 752,499 4
752,500 902,499 3
902,500 1,052,499 1
1,052,500 1,202,499 0
1,202,500 1,352,499 1
82
TABLE 5b
CLASS LIMITS
LCL UCL f
2,500 202,499 31
202,500 402,499 26
402,500 602,499 16
602,500 802,499 5
802,500 1,002,499 3
1,002,500 1,202,499 0
1,202,500 1,402,499 1
82
16
Statistical Research and Training Center Training Course on Basic Statistics for ResearchAugust 24 - 28, 2009
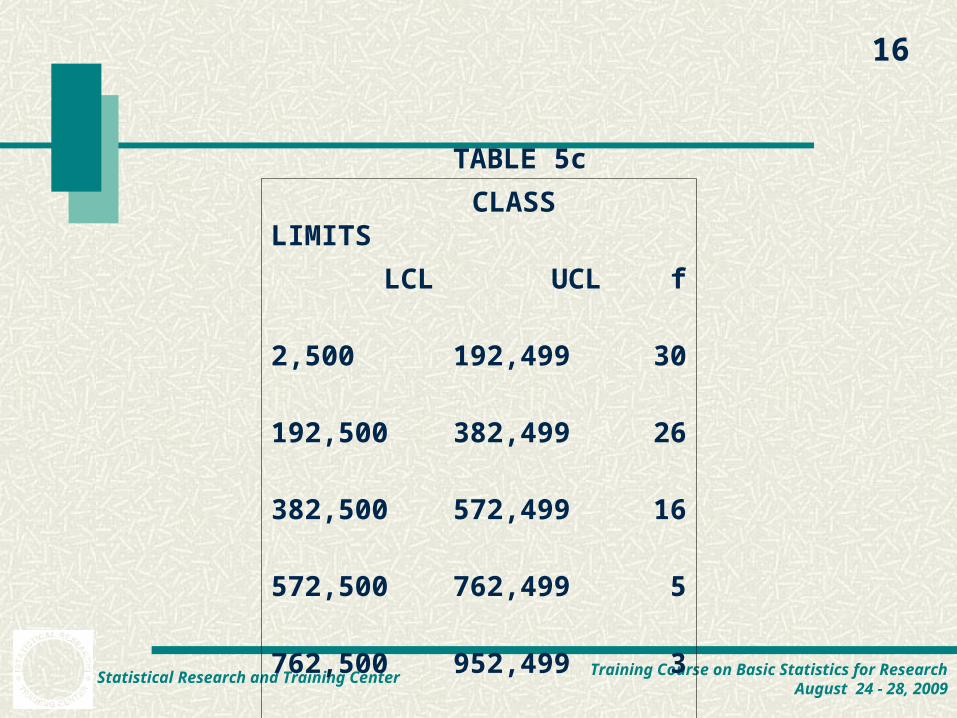
TABLE 5c
CLASS LIMITS
LCL UCL f
2,500 192,499 30
192,500 382,499 26
382,500 572,499 16
572,500 762,499 5
762,500 952,499 3
952,500 1,142,499 1
1,142,500 1,332,499 1
82
17
Statistical Research and Training Center Training Course on Basic Statistics for ResearchAugust 24 - 28, 2009
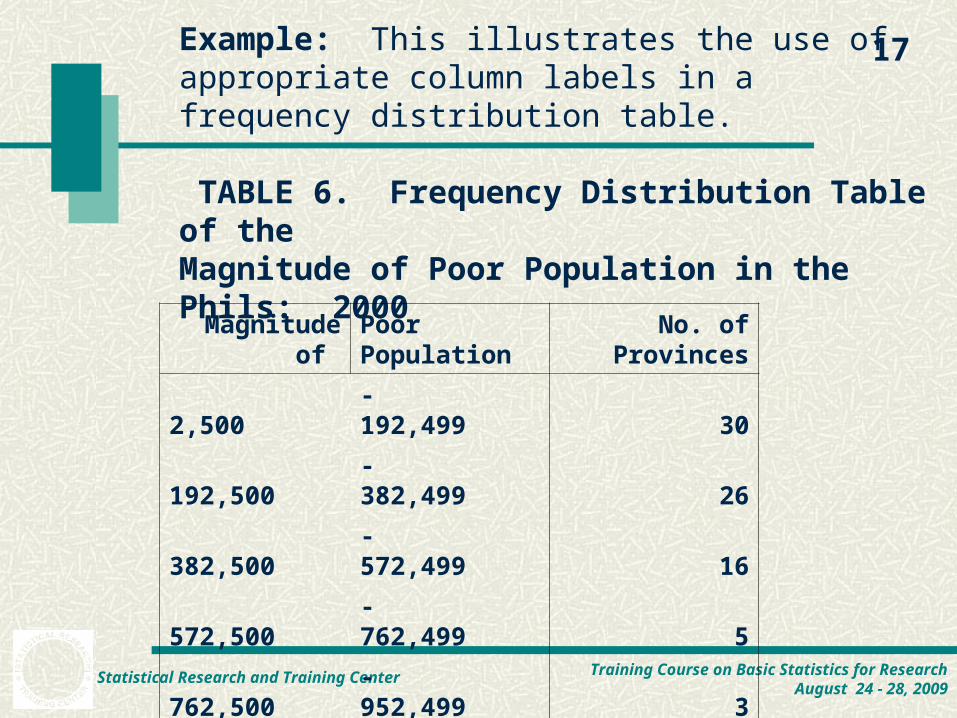
Example: This illustrates the use of appropriate column labels in a frequency distribution table.
TABLE 6. Frequency Distribution Table of the Magnitude of Poor Population in the Phils: 2000
Magnitude of Poor Population No. of Provinces
2,500 - 192,499 30
192,500 - 382,499 26
382,500 - 572,499 16
572,500 - 762,499 5
762,500 - 952,499 3
952,500 - 1,142,499 1
1,142,500 - 1,332,499 1
Total 82
18
Statistical Research and Training Center Training Course on Basic Statistics for ResearchAugust 24 - 28, 2009
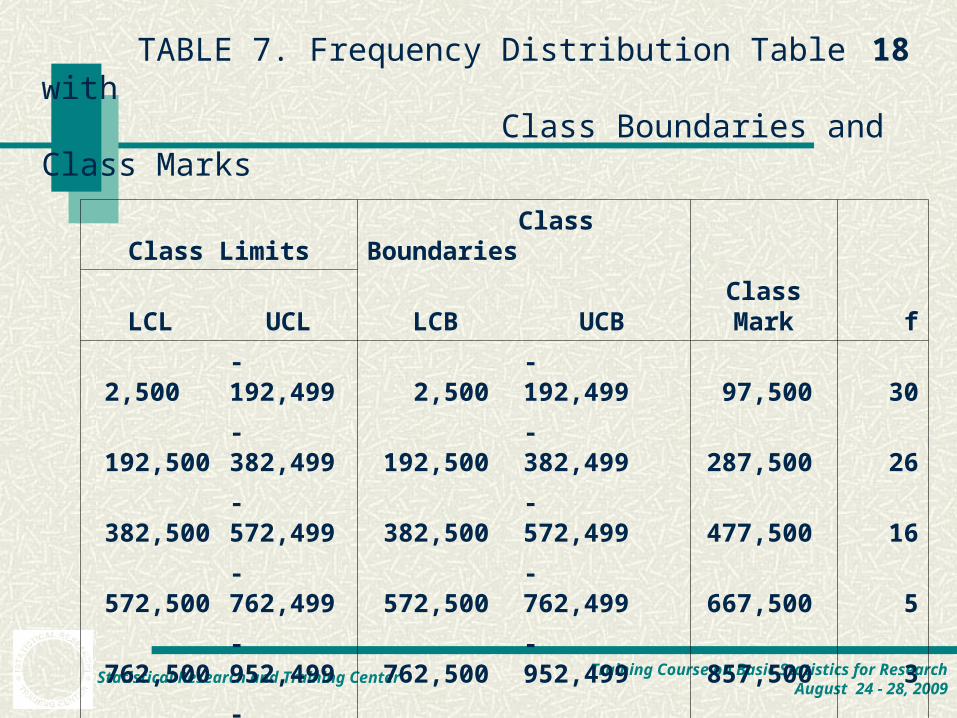
TABLE 7. Frequency Distribution Table with Class Boundaries and Class Marks
Class Limits Class Boundaries
LCL UCL LCB UCB Class Mark f
2,500 - 192,499 2,500 - 192,499 97,500 30
192,500 - 382,499 192,500 - 382,499 287,500 26
382,500 - 572,499 382,500 - 572,499 477,500 16
572,500 - 762,499 572,500 - 762,499 667,500 5
762,500 - 952,499 762,500 - 952,499 857,500 3
952,500 - 1,142,499 952,500 - 1,142,499 1,047,500 1
1,142,500 - 1,332,499 1,142,500 - 1,332,499 1,237,500 1
82
19
Statistical Research and Training Center Training Course on Basic Statistics for ResearchAugust 24 - 28, 2009
Relative Frequency and Relative Frequency Percentage
Relative frequency* divide the class frequency of a class interval to the number of observations* the sum of the relative frequency column is one
Relative frequency percentage* multiply the relative frequency by 100* the sum of the relative frequency percentage column is one hundred percent.
20
Statistical Research and Training Center Training Course on Basic Statistics for ResearchAugust 24 - 28, 2009
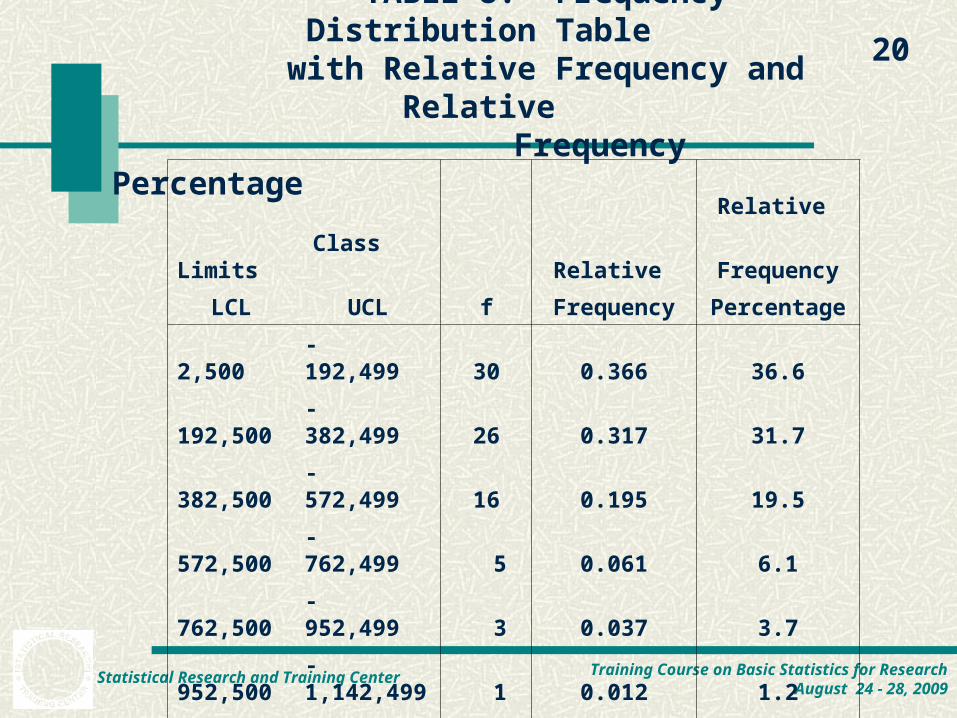
TABLE 8. Frequency Distribution Table with Relative Frequency and Relative
Frequency Percentage
Relative
Class Limits Relative Frequency
LCL UCL f Frequency Percentage
2,500 - 192,499 30 0.366 36.6
192,500 - 382,499 26 0.317 31.7
382,500 - 572,499 16 0.195 19.5
572,500 - 762,499 5 0.061 6.1
762,500 - 952,499 3 0.037 3.7
952,500 -1,142,499 1 0.012 1.2
1,142,500 -1,332,499 1 0.012 1.2
82 1.000 100.0
21
Statistical Research and Training Center Training Course on Basic Statistics for ResearchAugust 24 - 28, 2009
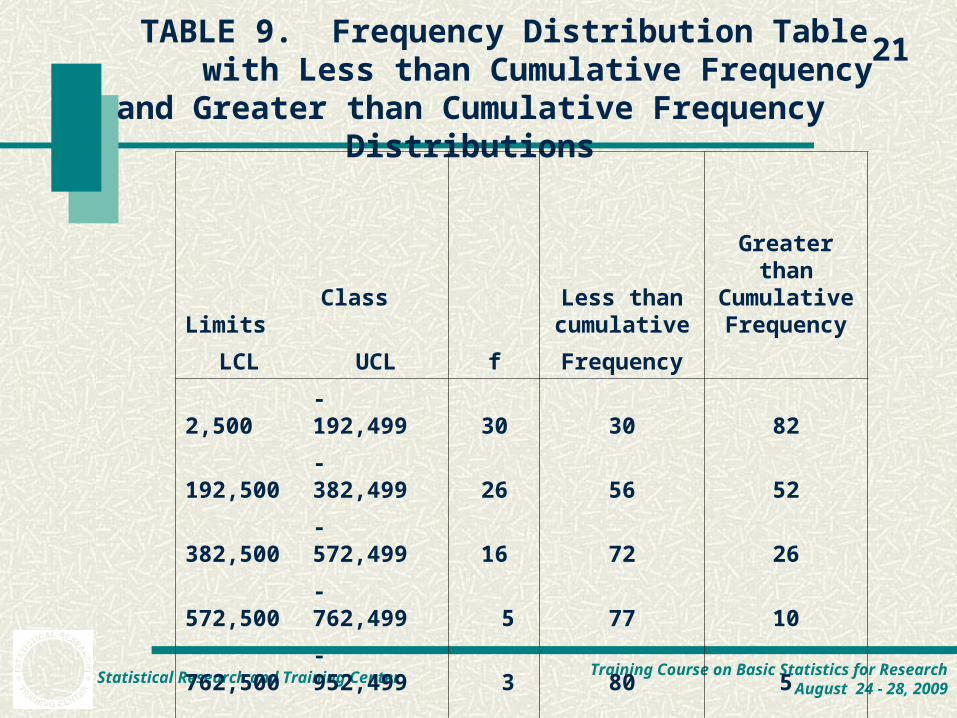
TABLE 9. Frequency Distribution Table with Less than Cumulative Frequency and Greater than
Cumulative Frequency Distributions
Class Limits Less than
cumulative
Greater than Cumulative Frequency
LCL UCL f Frequency
2,500 - 192,499 30 30 82
192,500 - 382,499 26 56 52
382,500 - 572,499 16 72 26
572,500 - 762,499 5 77 10
762,500 - 952,499 3 80 5
952,500 -1,142,499 1 81 2
1,142,500 -1,332,499 1 82 1
82
22
Statistical Research and Training Center Training Course on Basic Statistics for ResearchAugust 24 - 28, 2009
Graphical Representation of the Frequency Distribution
Frequency Histogram
- use the class frequency on the vertical axis and the class boundaries on the horizontal axis
Frequency Polygon
- use the class frequency on the vertical axis and the class mark on the horizontal axis
Training Course on Basic Statistics for Research
August 24-28, 2009
STATISTICAL RESEARCH AND TRAINING CENTERJ and S Building, 104 Kalayaan Avenue, Diliman, Quezon City
Thank you.