methods proposal, erosion susceptibility classification ... · this report has been prepared for...
TRANSCRIPT

i
Erosion Susceptibility Classification and Analysis of Erosion Risks for Plantation Forestry M Bloomberg 1
T Davies 2
R Visser 1
J Morgenroth 1
1 School of Forestry, University of Canterbury
2 Department of Geological Sciences, University of Canterbury
17 May 2011
This report has been prepared for the Ministry for the Environment and is confidential to that organisation and the University of Canterbury. Every effort has been made to ensure this publication is accurate. Inquiries and requests to:
Mark Bloomberg School of Forestry University of Canterbury PB 4800 Christchurch 8140, New Zealand
Email: [email protected]

ii

iii
Contents Glossary Summary A. Erosion Susceptibility Classification .................................................................................................. 1
A.1 Introduction .................................................................................................................................. 1 A.2 Review of Candidate Models ........................................................................................................ 3
A.2.1 Empirical versus process models of erosion susceptibility ....................................................... 3 A.2.2 Comparison of NZLRI, HEL and NZeem ..................................................................................... 4
A.3 Estimation of Erosion Susceptibility .............................................................................................. 5 A.3.1 Evidence in relation to surface erosion .................................................................................... 6 A.3.2 Evidence in relation to fluvial erosion....................................................................................... 9
A.4 Proposed method for ESC classification using the NZLRI Database ........................................... 10 A.4.1 Proposed erosion susceptibility classification ........................................................................ 11 A.4.2 Classification criteria ............................................................................................................... 12
A.5 Testing of classification ............................................................................................................... 14 A.6 Results of classification ............................................................................................................... 15
B. Erosion Risk Analysis for Plantation Forestry .................................................................................. 18
B.1 Introduction ................................................................................................................................ 18 B.2 Objectives.................................................................................................................................... 19 B.3 Identifying and evaluating predisposing factors ......................................................................... 20 B.4 Forest operations as preparatory or mitigating factors for soil erosion .................................... 21
B.4.1 Forest operations as mitigating factors .................................................................................. 21 B.4.2 Forest operations as preparatory factors ............................................................................... 25
B.5 Frequency of erosion events ....................................................................................................... 29 B.5.1 Rainfall intensity/duration and landslides .............................................................................. 29 B.5.2 Estimating frequency of erosion events ................................................................................. 29 B.5.3 Climate change ........................................................................................................................ 34
B.6 Assessment and management of erosion risks .......................................................................... 34 B.6.1 Identifying erosion risks from the ESC .................................................................................... 34
C. Protocol for analysis and management of erosion risks at an operational scale ........................... 37
C.1 Introduction ................................................................................................................................ 37 C.2 Analysis of erosion susceptibility and risk .................................................................................. 37
References Appendices

iv

v
Glossary
Most technical terms in this report are defined the first time they are used in the text. This
glossary contains terms which are used but not completely defined within the main report.
Antecedent conditions The conditions prevailing prior to a soil erosion or landslide event.
This description is normally used to characterize basin wetness, as
determined by long-duration low-intensity rainfall prior to the
event.
Cutoffs Raised mounds on a road surface at right angles to the grade,
which direct surface runoff away from the road surface (also
known as waterbars)
Deep disturbance Soil disturbance leaving no surviving vegetation; surface soil
removed to expose parent materials (e.g. colluvium or bedrock).
Dry ravel Movement of individual particles resulting from wetting and
drying, freezing and thawing, or mechanical disturbance, is
considered a surface erosion process.
Duration The length of time of occurrence of a rainfall event
Empirical model A model, mathematical function or other description of system
behaviour that is based on observation or experiment, but does
not include an underlying theoretical explanation of the system
Fillslopes The creation of a horizontal bench on a sloping hill surface using
excavated material, usually placed and then subject to some
degree of compaction
Outsloping Construction of earthworks with an outwards camber so that
surface water is directed away from the earthworks surface
Overland flow Surface movement of rainfall-derived water, not intercepted or
absorbed by vegetation or soil.
Polygon Two-dimensional polygons are used in a GIS to represent
geographical features that cover a particular area of the earth's
surface. LUC units are represented as polygons within the NZLRI

vi
Process-based model A model, mathematical function or other description of system
behaviour that is based on an underlying theoretical or
“mechanistic” explanation of the system
Rainfall intensity The rate at which rainfall occurs during a rainfall event (usually
expressed in millimetres per hour)
Raster Raster data consists of rows and columns of cells, with each cell
storing a single value. This allows a spatial representation of a
single variable in a GIS.
Sediment yield The mean sediment (soil and rock) load carried by a watercourse,
usually related to the amount of erosion occurring in the
watercourse catchment
Shallow disturbance Disturbance leaving ome surviving grasses/weeds; needle litter
removed or reworked, topsoil scarified but largely intact
Slash Residual above-ground parts of a tree crop or understorey shrub
layer not removed by harvesting e.g. branches, foliage,
unmerchantable parts of the tree stem.
Soil pore water pressure The pressure of groundwater held within a soil or rock, in gaps
between particles (pores). High soil water pressures can reduce
the cohesiveness of a soil and lead to failure of the soil mantle
Undisturbed ground Ground cover vegetation flattened but otherwise unaffected by
logging operations; litter layer and topsoil intact
Waterbars See “cutoffs”

vii
Summary
The objective of this study is the development of an erosion susceptibility classification (ESC),
which will be used to analyse the risks of erosion, sedimentation and environmental harm
associated with plantation forestry activities in New Zealand.
To do this, we used a conceptual model of landslide risk where
Erosion risk =erosion susceptibility x frequency of triggering events x downslope /downstream
consequences.
Erosion susceptibility is therefore just one component of erosion risk, which also depends on the
frequency of triggering events (usually high intensity rain storms) and the nature of the
downslope/downstream values impacted by the erosion (consequences).
Erosion susceptibility itself has two components, predisposing factors such as slope and lithology which
determine the inherent susceptibility of a land unit to erode, and preparatory/mitigating factors, which
respectively increase or reduce erosion susceptibility above or below this inherent level. Many
preparatory/mitigating factors are related to plantation forest management e.g. earthworks and
removal of the forest canopy by clearfell harvesting (preparatory factors), and reinstatement of a forest
canopies by tree planting or forest regeneration (mitigating factor).
We review several candidate methods for estimating erosion susceptibility in New Zealand, and opt for
the potential erosion severity values in the NZ Land Resource Inventory (NZLRI) and Land Use Capability
(LUC) database. These erosion severities range from 0 (negligible) to 5 (extreme), and were classified
into a three-class and four-class erosion susceptibility classification (ESC) as follows:
Potential erosion severity 0=negligible 1=slight 2=moderate 3=severe 4=very severe 5=extreme
Three class ESC 1 1 2 3 3 3
Four class ESC 1 1 2 3 4 4
Using this system, all map units (polygons) in the NZLRI, which covers the North and South Islands but
not outlying islands, were assigned to ESC classes and GIS analysis was used to produce maps and tables
depicting the spatial distribution of the ESC classes. Towns, quarries and the Department of
Conservation estate were excluded from this analysis, and classed as “undefined”.

viii
Based on this analysis we recommended a four-class ESC as it makes an important differentiation
between differentiation between 1) land units which are going to be difficult to afforest without very
severe adverse erosion effects, and 2) areas which, although having a severe erosion limitation to use,
are more suited to conventional plantation management.
The distribution of ESC classes by regional council regions is shown in the following table:
Area('000 ha)
Region Low Moderate High Very High
Undefined Total
Auckland 208 142 67 8 88 513
Bay Of Plenty 303 229 224 68 403 1228
Canterbury 1743 756 342 456 1236 4533
Gisborne 103 266 192 196 84 841
Hawke's Bay 504 341 154 151 301 1451
Manawatu-Wanganui 795 543 361 113 473 2285
Marlborough 114 191 162 91 495 1053
Nelson 3 10 18 3 8 43
Northland 450 266 318 50 190 1273
Otago 1307 565 471 193 663 3199
Southland 990 252 49 37 1705 3033
Taranaki 312 97 119 48 152 729
Tasman 109 87 114 27 642 979
Waikato 1077 547 307 53 465 2448
Wellington 306 194 88 57 169 816
West Coast 261 26 37 30 1982 2336
Total 8586 4513 3023 1581 9057 26,760
In the second part of this study, we made a qualitative analysis of the risks (defined as erosion
susceptibility × frequency of triggering events) We reviewed the mitigating effects of afforestation on
erosion susceptibility, and the preparatory effects of clearfell harvesting and associated earthworks
(roads, landings and quarries). For New Zealand plantations, there is a window of between 4-7 years
from the time of clearfelling until the replanted plantation crop establishes a full canopy, where
plantation sites are more susceptible to erosion. Using data from 12 New Zealand catchments, the
annual exceedance probability for landslide-causing rain storms was calculated for all New Zealand,
using a spatial database for mean annual rainfall (MAR). This indicated there were substantial areas of
New Zealand where the AEP was >0.2, so that it was likely that a landslide-causing rainfall event would
occur during the 4-7 year “window of susceptibility” after clearfelling of a plantation.
In the final part of this study, we re-examined the limitations of an ESC based on 1:50,000 scale
mapping, and discussed how risks from erosion in plantation forests may be managed at a more detailed
scale of 1:5000 to 1:10,000, required for accurate mapping of and planning for erosion risks.

1
A. Erosion Susceptibility Classification
A.1 Introduction
The objective of this study is the development of an erosion susceptibility classification (ESC),
which will be used to analyse “the risks of erosion, sedimentation and environmental harm
associated with plantation forestry activities in each of the classification zones” (MfE, 2011).
To do this requires an explicit model of the link(s) between erosion susceptibility and “risks of
erosion, sedimentation and environmental harm”. In this proposal, we use a conceptual model of
landslide risk described in Saunders and Glassey (2007). A diagram of this conceptual model is in
Appendix 1 to this proposal.
Briefly, there are three parts to estimation of erosion risk using the Saunders and Glassey model:
1. Erosion susceptibility is determined by two interacting factors—predisposition (of a land unit)
to erode, and preparatory factors.
a. Predisposition to erode is an intrinsic quality of a land unit determined by soil
type/lithology and topographic characteristics (slope, aspect, drainage pattern, slope
position or landform element).
b. A land unit with a specific predisposition to erode may be placed at greater likelihood
of erosion by preparatory factors. Examples relevant to forestry are removal of forest
cover by land preparation or harvesting, interruption of drainage patterns and
earthworks which undercut, and/or create unstable surcharge on, previously stable
slopes. Examples of natural preparatory factors include undercutting of toe slopes
when rivers change their course. A corollary is that management factors may
mitigate erosion e.g by reforestation of land units previously in short pasture, or by
engineering works to stabilise toeslopes or dewater slopes which are normally wet.
2. Likelihood and severity of an erosion event. Erosion occurs when there are triggering events,
most commonly high-intensity rain storms but also earthquakes or volcanic eruptions.
Different land units will have different probabilities of triggering events occurring, depending
on local climate or proneness to earthquakes. Some erosion classification systems (e.g. the
NZLRI system) bundle intrinsic erosion susceptibility with frequency of triggering events, to
estimate a potential erosion severity. Others e.g NZeem (Dymond et al., 2010) explicitly

2
model likelihood of triggering rain storms as a separate factor to the erosion susceptibility of
the land unit. Erosion susceptibility x frequency of triggering events determines erosion
hazard, an overall likelihood and severity of an erosion event.
3. Consequences of an erosion event. The final element in the calculation of risk is the
consequences of erosion. Therefore any analysis of erosion risk must include an evaluation of
these consequences i.e. Erosion risk =Erosion susceptibility x frequency of triggering events
x consequences. These consequences usually occur “downslope” of the erosion site, although
they may also occur upslope e.g where property or infrastructure is undercut by erosion. The
severity of the consequences and therefore erosion risk depends on the nature of what is
“downslope”—risks are higher when residential houses, valuable infrastructure or iconic
waterways are “downslope”, compared to farmland or unoccupied land where damage
caused by erosion involves low risk to human life and is reasonably cheap to repair.
A major advantage of the Saunders & Glassey model is that it explicitly separates triggering events
and downslope consequences from susceptibility (underlying predisposition to erode×
preparatory and/or mitigating factors). It clearly identifies all factors that contribute to risk; in
particular, it recognises that two erosion events of equal severity may have quite different levels
of risk, depending on what is located “downslope’ from where the erosion occurs.
In Section A of this report, we focus on the susceptibility of land units to erode. To normalise
the effect of preparatory/mitigating factors on erosion susceptibility, we will use the assumptions
that the NZLRI uses in estimating potential erosion severity i.e. land is under permanent pasture
vegetation and there are no soil conservation works but also no earthworks that might destabilise
the land (I. Lynn pers. comm., 26 April 2011). This means that all land units are compared purely
on the basis of their predisposition to erode, with a correction for differences in erosion
susceptibility due to different vegetation cover , intensity of earthworks, or other preparatory
factors.
Other contributing factors to erosion risk will be discussed in Section B (Analysis of Erosion Risk)
i.e:
Modifying effects of forestry earthworks and harvesting (=preparatory factors) on erosion
susceptibility
Frequency of triggering events.

3
Note that the brief for this study (MfE, 2011) requires only analysis of two out of three
components of erosion risk - susceptibility and frequency. This analysis will not analyse
consequences of erosion. Therefore, in this study the term “erosion risk” refers to the likely
frequency of occurrence of erosion with a given severity (magnitude and/or spatial density). This
definition of erosion risk is equivalent to “erosion hazard” as defined by the JTC-1 Joint Technical
Committee on Landslides and Engineered Slopes (Fell et al., 2008).
A.2 Review of Candidate Models
In this section, candidate models of erosion susceptibility will be reviewed for their usefulness in
predicting “the risks of erosion, sedimentation and environmental harm associated with
plantation forestry activities in each of the classification zones.” Additional criteria in this review
will be:
Data reliability. The input data for candidate models will be assessed for reliability i.e
resolution, accuracy and degree to which they have been generalised or extrapolated from
original field data.
The ECS should be understood by and acceptable to end-users.
A.2.1 Empirical versus process models of erosion susceptibility
In making an ESC two methods are available:
1. Utilisation of empirical information on erosion in New Zealand acquired over the last several
decades, using the NZ Land Resource Inventory (NZLRI) and the Land Use Capability (LUC) Classification
derived from it; or
2. Further develop recent initiatives using process-based slope stability assessments within a GIS
using topography, soils, vegetation and other land attributes available as GIS layers.
Pragmatically, we prefer the LUC classification because it uses comprehensive field assessments of
actual and potential erosion over the whole of New Zealand compiled by experts. In principle, this
approach is preferable because 1) it is based on observed erosion rather than on
modelled/simulated/computed erosion; and 2) it requires little if any field verification, in contrast to any
modelled classification which will require comprehensive field verification.

4
A further justification for using the first method arises from consideration of the present status of
erosion susceptibility modelling in GIS (usefully summarised by Carrara and Pike, 2008). While a number
of frameworks exist for applying physically-based slope stability models to spatially-varying land data,
considerable reservations remain about a number of factors. In particular,
The quality of the spatial data used in such models is very variable, and the cumulative errors in
calculation of slope stability have the potential to be high.
The resolution of the data is inevitably dependent on the mapping scale; where large areas are
to be mapped, scales are small and the ability to detect severe erosion susceptibility of a small
area is dubious.
Carrara and Pike (2008) note that: “It is still too early in the evolution of GIS-based landslide-hazard and
risk modelling to identify any “best” approach or set of techniques”.
Thus we propose to utilise the factual information available in the NZLRI to develop an initial nation-
wide set of erosion susceptibility assessments. In the future it may well be that GIS-based assessment
becomes equally as reliable as the NZLRI-based method, following improvements in slope stability
analysis and its application to spatially-distributed parameters; it is likely that the NZLRI data will play a
crucial part in the development and validation of such models. For the present we propose to utilise the
more analytically-based approaches at the second stage of this investigation, that is, in analysing risks
from erosion in plantation forests.
A.2.2 Comparison of NZLRI, HEL and NZeem
An ESC based on the national NZLRI database is the default option for this investigation. Other
candidate models (HEL, (Dymond et al., 2006) NZeem (Dymond et al., 2010) are partially based on
process models of erosion, and thus have drawbacks discussed in Section A2.1.
Furthermore, a detailed comparison of the NZLRI, HEL and NZeem for use in mapping the land
susceptible to mass movement affecting soil carbon stocks was made by Basher et al. (2010).
They concluded that “Of the three different approaches used to define susceptibility to mass
movement, potential erosion from the NZLRI provides the most robust and defensible
definition…”
In this investigation, we aim to classify land susceptibility to the same erosion types (mass
movement and gully erosion) defined by Basher et al. (2010). Rather than duplicate the detailed
analysis in Basher et al. (2010), we refer the reader to Section 3.4 (p.30 et seq.) in that document.

5
Although the preferred model for this investigation, the NZLRI has limitations as a predictor of erosion
“susceptibility” (as defined by Saunders and Glassey (2007)).
1. Actual erosion severity in the NZLRI database is only a guide to erosion susceptibility, since it
reflects the effects of mitigating/preparatory factors (e.g. existing vegetation cover) as well as a
stochastic element (e.g. the history of triggering rainfall events for that particular NZLRI unit).
2. For all NZLRI units, potential erosion type and severity was also assessed. While this represents
useful expert opinion, it is an estimate of potential erosion type and severity, rather than
erosion susceptibility. It bundles intrinsic land unit predisposition to erosion with an assumed
likelihood of triggering factors, which makes difficult an explicit analysis of risk using the
Saunders and Glassey (2007) model. However, it does attempt to explicitly account for
preparatory factors such as existing vegetation (by assuming land cover to be pasture) and also
cultivation (for arable soils). It also assumes that there are no soil conservation works and no
destabilising earthworks (I. Lynn pers. comm., 26 April 2011).
3. Potential erosion severity is based on expert opinion. As such, it can be “wrong”—assessments
by NZLRI surveyors of potential erosion severity can change with experience and observation
over a working lifetime.
A.3 Estimation of Erosion Susceptibility
Erosion susceptibility is defined as the interaction of predisposing factors and preparatory factors,
determining the intrinsic susceptibility of a land unit to erode (Section A1). Susceptibility is
determined, in the case of landslide erosion, by an inventory of landslides which have occurred in
the past and areas with potential to experience landsliding (Cascini, 2008)—a definition is
consistent with the use of potential erosion severity in the NZLRI.
Within the NZLRI, erosion forms are classified as shown in Table 1:

6
Table 1. Erosion Types and Symbols. Source: Table 7, Lynn et al. (2009).
However, not all erosion forms are likely to be significant in New Zealand plantation forests.
There is considerable New Zealand research, reviewed in the following Sections, to show that the
following are significant:
1. Landslides which includes all the mass–movement erosion types in Table 1 above.
2. Gully and tunnel gully erosion—forms of fluvial erosion.
Other forms of surface and fluvial erosion, as defined by Lynn et al. (2009) are unlikely to be
significant consequences of plantation forestry management, although sheet and rill erosion can
result in locally significant sedimentation from harvesting, land preparation and earthworks
operations (G. Ridley, pers. comm. 29 April 2011).
A.3.1 Evidence in relation to surface erosion
Surface erosion from harvest sites
Marden et al. (2006) note that most research on erosion in New Zealand plantations has concentrated
on effects of roading and associated mass-movement (landslide) erosion. However, Marden and co-
workers also examined the amount of surface (sheet) erosion (”slopewash”) from hauler-logged sites in
Mangatu Forest, Whangapoua Forest (Coromandel), Hawke’s Bay (Pakuratahi Catchment) and the
northern Boundary of Kaingaroa Forest (Pokairoa Catchment) (Marden and Rowan, 1997; Marden et al.

7
2006; Fahey et al. 2003; Marden et al., 2007). In all these studies, harvested sites (excluding
earthworks) were differentiated into the following classes:
Undisturbed ground including stumps and rock outcrops
Shallow disturbance, where topsoil may be scarified but is largely intact
Deep disturbance created by soil scraping by extracted logs and cables used in hauling, where
sediment is removed and redistributed on the site, and mineral soil and/or parent material is
exposed.
The results of these studies are summarised below:
1. Undisturbed ground and shallow disturbance (usually 80-90% of total ground cover) had
very low slopewash rates and contributed negligible sediment to stream in the study
catchments. Any slopewash was usually redistributed and stored in natural depressions
or trapped by vegetation downslope of the erosion area.
2. Deep disturbance areas comprised 9-15% of study areas, and contributed ~85% of total
slopewash from all disturbed sites. Where deep disturbance sites (including the soil
deposited by soil scraping) were connected to channels, these sites contributed to
sediment loads in catchment streams.
3. Sediment contributed to streams from deep disturbance sites was small in relation to
sediment contributed from landslides and gullies. Relative contributions of slopewash
were 0.2% (Pokairoa), 2% (Whangapoua)1 and 1% (Pakuratahi) of total sediment yield.
The % contribution for Mangatu is not specified, but was reported to be “several orders
of magnitude” lower than sediment generated from existing gully erosion in the
catchment. Note that for all these studies, sediment yields are calculated from
measured erosion on-site, and so give a realistic estimate of the scale of surface versus
mass-movement and gully erosion.
4. Slopewash rates from deep and shallow disturbance sites declined rapidly within two
years, due to revegetation of shallow disturbance sites and “hardening” of deep
disturbance sites i.e all loose sediment had been entrained, leaving a resistant surface.
Surface erosion from earthworks
Sheet erosion can occur on cut and fill surfaces created by earthworks. On unconsolidated road
fill surfaces, sheet and rill (fluvial) erosion may occur until consolidation and “hardening” occur.
1 But a further 26% of catchment sediment yield was due to “slope-scraping” deposits in watercourses.

8
As roads consolidate, there is a continuing low level of surficial erosion from road treads and
water tables (Fahey and Coker, 1992).
Fahey and co-workers studied the contribution of roads to erosion and sediment yields from
plantations on steep and erodible sites in the Marlborough Sounds and on the Separation Point
granites in the Motueka Catchment (Coker et al., 1993; Fahey and Coker, 1989, 1992, 1993). The
results from these and other New Zealand studies on granite, schist and pumice lithologies are
summarised in Fransen et al. (2001). Key results are:
1. Surface erosion from roads at harvest times may increase sediment yield five-fold
compared with that from pre-harvest ungraded and lightly used roads. Logging truck
traffic during rainfall events can markedly increase sedimentation from road surfaces.
2. However, surface sediment yield rates from roads were generally an order of magnitude
lower than estimated background catchment sediment yields. Note that these comments
apply to permanent forest roads. Sediment yields from harvest (skidder) tracks may
generate much higher proportions of catchment sediment yield catchment (Fransen et al.,
2001).
3. Infrequent road-related mass movements are major sources of sediment within forests
and have the greatest potential to affect streams. Road mass-movement erosion rates are
up to three orders of magnitude greater than surface erosion rates.
4. Mass-movement erosion rates decline with road age, but may increase to earlier levels
when roads are upgraded for harvesting activities, or when subject to intense storm
events—such as those that caused major road-related mass movements in the Motueka
Catchment in 1990 (Fahey and Coker, 1993).
Wind Erosion
The topic of wind erosion in New Zealand was most recently reviewed by Basher and Painter
(1997). They identify the following sites where wind erosion occurs
In the North Island, wind erosion occurs locally in three main environments covering ~5% of North
Island’s land area:
Mobile, coastal dunes on the west coast of Northland and the Manawatu that have not
yet been afforested or have poor grass cover;

9
High-altitude (>700 m) ash-mantled slopes in the central North Island that have poor
vegetation cover due to strong winds and cool temperatures;
Low-altitude hill country and alluvial terraces in the eastern North Island with low-fertility
soils and severe seasonal soil moisture deficits.
In contrast, in the South Island wind erosion is widespread. Basher and Painter (1997) estimate
that 19% of the South Island’s land area, occurring mainly on light-textured alluvial soils and
“loess-mantled terraces and slopes in low-rainfall, seasonally dry eastern regions subject to
common strong foehn winds.” On lowland sites, cultivation is a preparatory factor. On upland
sites, vegetation depletion (due to overgrazing and fire, coupled with climatic limitations to
vegetation recovery) is a preparatory factor for wind erosion.
However, Basher and Painter (1997) have recorded no wind erosion events in plantation or
indigenous forests. Clearly, forest canopies create a layer of relatively “still” air even in strong
wind storms, and this relatively “still” air will not have sufficient erosive power to entrain soil
particles. Even during the harvest phase in plantation forests, there is sufficient harvest residue
on the ground to create a boundary layer of air next to the ground with reduced wind speed, and
enough residual undisturbed ground with an intact litter layer and/or topsoil to keep soil
erodibility at a low level.
This absence of wind erosion is particularly important in plantations which have been widely
planted in New Zealand to stabilise mobile coastal dunes. This type of terrain is typically classified
as a severe or extreme potential for wind erosion in the national NZLRI database. Nonetheless,
the actual risk of wind erosion of sand dunes under a normal cycle of plantation forestry is very
low, (R. Cathcart (Northland Regional Council) pers. comm 20 April 2011 and Ian Moore (Ian
Moore and Associates) pers.comm. 9 May 2011) and we contend that wind erosion should not be
included in an ESC for forestry.
A.3.2 Evidence in relation to fluvial erosion
Fluvial erosion includes gully, tunnel gully, rill or streambank erosion (Lynn et al., 2009). Gully and
to a lesser extent tunnel gully erosion play a significant and well-documented role in New Zealand
hill country catchments, (Marden and Rowan, 1997; Eyles, 1983) and potential severity for both
erosion forms will be a criterion in the ESC.

10
Rill erosion is common on bare agricultural land, whether due to cultivation or depletion of
vegetation cover. In contrast, rill erosion is negligible in plantation forests—if it does occur, it will
be on unconsolidated soil deposits e.g. road fill and soil scraping (noted previously), and on
exposed mineral soils subject to deep disturbance. We contend that the potential erosion
severities for surface/rill erosion in the NZLRI are not an appropriate guide to the erosion
susceptibility ESC of a land unit. Surface/rill erosion is specific to disturbed (earthworks, deep
disturbance) sites, and is largely a function of the nature of the disturbance, not so much the
predisposition to erode of the underlying unit. Therefore we propose that potential rill and sheet
erosion severity should be excluded in estimating the ESC class for land units.
Streambank erosion may be triggered:
Indirectly, by erosion debris originating from “upslope” plantations. However, in this case
the streambank erosion is a consequence of upslope erosion, and can be mitigated by
control of that upslope erosion.
Directly, as a consequence of harvesting of forest adjacent to banks of streams. In this case, the
removal of forest may be a preparatory factor which increases streambank erosion
susceptibility. However, we are not aware of any published reports documenting direct effects
of harvesting plantation forestry on streambank erosion in New Zealand.
We contend that streambank erosion can be excluded from the proposed ESC for plantation forestry,
because streambanks can be protected from effects of harvesting by general standards (applying across
all classes of the proposed ESC). These general standards would require riparian strips where forest
harvesting is excluded, regardless of the erosion susceptibility of the adjoining land.
The next section outlines candidate models for a national ESC classification, in the context of the
Saunders and Glassey (2007) conceptual model.
A.4 Proposed method for ESC classification using the NZLRI Database
The current NZLRI database covers all areas in mainland New Zealand that are either currently
plantation forests, or have the potential to be established in plantation forest. If an erosion
susceptibility classification (ESC) can be specified in terms of attributes in the database, then land
units can be rapidly classified using those attributes as sort variables.
Notwithstanding the drawbacks of the potential erosion severity ratings in the NZLRI discussed in
Section A2.2 (i.e. they are potentially incorrect, and are not estimates of erosion susceptibility as

11
defined by Saunders and Glassey (2007)) they represent the best available data available for this
investigation. They will be used in conjunction with the LUC sub-class classifications to estimate the
intrinsic predisposition of land units to mass-movement and gully erosion. Note that LUC classification
can be related to potential limitations or hazards to productive use as follows (Lynn et al., 2009):
LUC Classes 1-5 Negligible to slight limitations or hazards (under permanent pasture)
LUC class 6 Moderate limitations or hazards
LUC Class 7 Severe limitations or hazards
LUC class 8 Very severe to extreme limitations or hazards.
Each LUC class is divided into four subclasses, depending on the dominant hazard or limitation to
productive use—erosion, wetness, climate or soil, denoted by subscripts of “e”, “w”, “c” or “s”
respectively. For example, an LUC unit with LUC class 6 and a wetness limitation to use would be
denoted as 6w.
While “erosion hazard” does not necessarily directly relate to potential erosion severity, there should be
some equivalence. If this is the case, then LUC subclasses 6e, 7e and 8e (where “e” denotes erosion as
the dominant limitation or hazard to use) should approximately correspond with potential erosion
severities of moderate, severe and very severe to extreme, respectively.
A.4.1 Proposed erosion susceptibility classification
MfE (2011) suggests a three-class ESC classification, with green, orange and red colours to denote
low, medium and high erosion susceptibility respectively. It also mentions the possibility of a
fourth classification (“scarlet”) for land with extremely high erosion susceptibility, although this
may present problems, for the following reasons:
A difficult problem with any classification is where to draw the class boundaries. Increasing
the number of classes from three to four increases the number of class boundaries from two
to three, increasing the potential for debate about those boundaries by 50%.
Similarly, a resource consent application for land which straddles two or more ESC classes may
have to default to the activity class assigned to the highest ESC class. Increasing the number
of ESC classes increases the potential for this to occur more often.
Despite these reservations, our intention is to produce two candidate ESC classifications, one with
three classes and one with four. We will examine these in terms of their ability to meet the

12
investigation objective: to produce a classification that can be used to analyse “the risks of
erosion, sedimentation and environmental harm associated with plantation forestry activities in
each of the classification zones.”
A.4.2 Classification criteria
Potential erosion severities for mass-movement and gully erosion were sourced from published bulletins
and extended legends as follows:
Table 2. Sources of data for estimated potential erosion severities.
NZLRI Legend NZLRI Region Bulletin
01 Northland Harmsworth (1996)
02 Waikato Page (1985) NI Correlation
03 Coromandel Page (1985) NI Correlation
04 BoP and Volcanic Plateau Blaschke (1985a)
05 Eastern BoP Page (1985) NI Correlation
06 Gisborne/East Coast Jessen et al (1999)
07 Nthern Hawkes Bay Page (1988)
08 Sth HB and Wairarapa Noble (1985)
09 Wellington Page (1995)
10 Taranaki/Manawatu Fletcher (1987)
11 Marlborough Lynn (1996)
12 (or 00) Sth Island SI Extended Legend, van Berkel (ed) (1983)
Data were listed in Excel spreadsheets, as a list of the units along with their potential erosion severity for
each erosion form. Next to the unit name in the spreadsheet we listed the page reference in the
appropriate bulletin, from which the estimates of potential erosion severity by erosion from were
obtained. At this stage, listed data only include all Class 6 and 7 units, and all Class 8s,c,w units. Class 1-
5 and 8e are assigned default erosion susceptibilities of 0 (minimum) and 4 (maximum) respectively
For each unit in the spreadsheets, the “maximum severity” was calculated from the highest potential
erosion severity out of those recorded for all mass movement erosion types, plus gully and tunnel gully
erosion. In other words, we used the maximum for a specific erosion form, not a cumulative value for
all erosion forms. In the case of the South Island, where a single potential severity value is assigned for a
unit, that severity was used to calculate “maximum severity” if any mass-movement or gully form was
recorded as a potential form of erosion. This is the same method used by Basher et al. (2010).
Note:

13
1. Other fluvial erosion forms and all surface erosion forms did not contribute to this maximum
severity rating. For example, a coastal sand dune unit might have low erosion susceptibility
because it is not prone to mass-movement or gully erosion. It might have a severe or even
extreme potential wind erosion severity, but this was not counted.
2. Some LUC units are mapped as compound units, where two LUC subclasses occur in a complex
within a single unit—for example, 4e6+6e20 is a compound unit composed of an arable (4e6)
and a non-arable (6e20) unit. In these cases, the maximum severity was taken as the maximum
severity for the LUC class with the higher potential erosion severity—in the example above, this
would be the LUC class 6e20 unit.
Using a mixture of the maximum severity ratings in the spreadsheets and default values (for Classes 1-5
and 8e), LUC units were assigned to an erosion susceptibility as follows:
Table 3. ESC classification criteria.
LUC Class Erosion Susceptibility Class (ESC) Values
All LUC Classes 1-5 Default=0
All LUC Classes 6 and 7, and 8s, c, w
Maximum potential erosion severity 0 1 2 3 4 5
ESC 1 1 2 3 4 4
All LUC classes 8e Default=4
Undefined-towns, quarries Default=−2
Undefined-Dept of Conservation estate
Default=−1
The Department of Conservation estate was excluded from the analysis, as were urban areas, quarries
and other areas unclassified in the NZLRI. These were assigned negative ESC values to allow them to be
identified during the spatial analysis of ESC using GIS.
There is uncertainty whether there will be a three-class or four class classification of erosion
susceptibility (ESC). Therefore we have carried out both as follows:

14
Three class classification Erosion Susceptibility Erosion Susceptibility Classification (ESC) 0,1 Low (green) 2 Moderate (orange) 3,4 High (red)
Four class classification Erosion Susceptibility Erosion Susceptibility Classification (ESC) 0,1 Low (green) 2 Moderate (yellow) 3 High (orange) 4 Very High (red)
To normalise the effect of preparatory/mitigating factors on erosion susceptibility, we will use the
assumptions that the NZLRI uses in estimating potential erosion severity i.e. land is under
permanent pasture vegetation and there are no soil conservation works but also no earthworks
that might destabilise the land (I. Lynn pers. comm., 26 April 2011). By doing this, we are able to
rank land units in terms of their underlying predisposition to erode, since the effect of
preparatory factors on erosion suceptibility is equal for all units. In other words, we assume that
the rank order of units’ ESC classifications is independent of preparatory factors. Units will
therefore remain in the same ESC class when subjected to different regimes for vegetation cover,
earthworks or other preparatory or mitigating factors.
A.5 Testing of classification
Classification of LUC classes 1-5 and 8e is likely to be uncontroversial. The key decisions will be in
relation to classification of LUC classes 6 (all subclasses), 7 (all subclasses) and 8(subclasses c, w,
s). These decisions were tested in three ways:
1. Review by land management consultants with experience in land use and NZLRI mapping in
their respective regions. The allocation of regions to consultants is shown in the following
table. No suitable consultant was available for the Westland region.
15
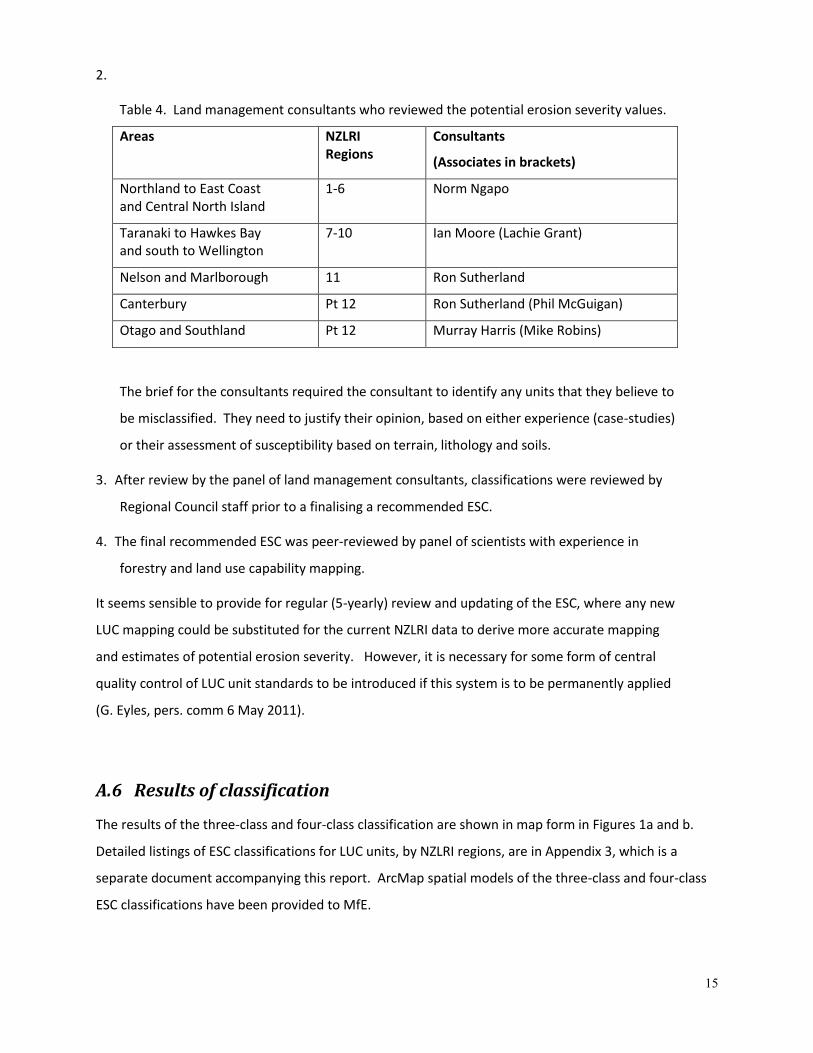
2.
Table 4. Land management consultants who reviewed the potential erosion severity values.
Areas NZLRI Regions
Consultants
(Associates in brackets)
Northland to East Coast and Central North Island
1-6 Norm Ngapo
Taranaki to Hawkes Bay and south to Wellington
7-10 Ian Moore (Lachie Grant)
Nelson and Marlborough 11 Ron Sutherland
Canterbury Pt 12 Ron Sutherland (Phil McGuigan)
Otago and Southland Pt 12 Murray Harris (Mike Robins)
The brief for the consultants required the consultant to identify any units that they believe to
be misclassified. They need to justify their opinion, based on either experience (case-studies)
or their assessment of susceptibility based on terrain, lithology and soils.
3. After review by the panel of land management consultants, classifications were reviewed by
Regional Council staff prior to a finalising a recommended ESC.
4. The final recommended ESC was peer-reviewed by panel of scientists with experience in
forestry and land use capability mapping.
It seems sensible to provide for regular (5-yearly) review and updating of the ESC, where any new
LUC mapping could be substituted for the current NZLRI data to derive more accurate mapping
and estimates of potential erosion severity. However, it is necessary for some form of central
quality control of LUC unit standards to be introduced if this system is to be permanently applied
(G. Eyles, pers. comm 6 May 2011).
A.6 Results of classification
The results of the three-class and four-class classification are shown in map form in Figures 1a and b.
Detailed listings of ESC classifications for LUC units, by NZLRI regions, are in Appendix 3, which is a
separate document accompanying this report. ArcMap spatial models of the three-class and four-class
ESC classifications have been provided to MfE.

16
Figure 1 shows that a three-class classification results in equal areas of hill country in both Islands being
classified as ESC=3 (High), and ESC=2 (moderate). However, under a three-class system, ESC class 3
includes both
1. Land units which are going to be difficult to afforest without severe adverse erosion effects.
2. Land units which, although having an erosion limitation to use, are more suited to conventional
plantation management.
The four-class classification differentiates ESC class 3 into two types, where ESC= 4 is difficult to afforest
without severe effects, and ESC 3 is possible to manage conventionally as a plantation forest, albeit with
limitations. For this reason, we recommend that the four-class ESC classification is used in the NES for
plantation forestry.
Figure 1. Erosion susceptibility classification; (a) Three-class classification (b) Four-class-classification.
Undefined areas include towns, quarries, and Department of Conservation Estate.
(a) (b)

17
The distribution of ESC classes by NZLRI regions is shown in Table 5, for the four-class ESC.
Table 5. ESC classes by NZLRI regions. . Undefined areas include towns, quarries, and Department of
Conservation Estate.
Area('000 ha)
Region Low Moderate High Very High
Undefined Total
Auckland 208 142 67 8 88 513
Bay Of Plenty 303 229 224 68 403 1228
Canterbury 1743 756 342 456 1236 4533
Gisborne 103 266 192 196 84 841
Hawke's Bay 504 341 154 151 301 1451
Manawatu-Wanganui 795 543 361 113 473 2285
Marlborough 114 191 162 91 495 1053
Nelson 3 10 18 3 8 43
Northland 450 266 318 50 190 1273
Otago 1307 565 471 193 663 3199
Southland 990 252 49 37 1705 3033
Taranaki 312 97 119 48 152 729
Tasman 109 87 114 27 642 979
Waikato 1077 547 307 53 465 2448
Wellington 306 194 88 57 169 816
West Coast 261 26 37 30 1982 2336
Total 8586 4513 3023 1581 9057 26,760
This classification shows the relatively high proportion of high and very high ESC classes in regions such
as Northland, Gisborne and Marlborough, compared to regions with relatively high areas of low ESC,
such as the Waikato and Bay of Plenty. Much of the Department of Conservation estate (undefined)
would be classified as ESC class 4 under a four-class ESC classification.

18
B. Erosion Risk Analysis for Plantation Forestry
B.1 Introduction
In this section the ESC will be used to analyse the risks of erosion associated with plantation
forestry activities in each of the classification zones (Request for Proposals RFP0049-01, MFE
2011).
Analysis is confined the following erosion forms in Lynn et al. (2009):
Gully and tunnel gully erosion
Mass movement forms i.e. soil slips, debris avalanche and debris flows, earthflows,
slumps, and rock falls.
Rill or sheet erosion on deeply disturbed soil or earthworks only.
Other fluvial or surface erosion forms are not included.
Erosion risk is defined as Erosion susceptibility x frequency of triggering events (erosion hazard in
the JTC-1 terminology), an overall likelihood and severity of an erosion event.
The interaction of erosion susceptibility and frequency of triggering rainfalls can be visualised
using the conceptual model advanced by Cepeda et al. (2010), as shown by Figure 2. Here the
intensity-duration (I-D) threshold defines a combination of rainfall intensity (millimetres of rain
per hour) and duration (hours) which will trigger landslides. The different threshold lines Thsusci to
ThsuscN show the threshold positions for land units of increasing erosion susceptibility, and
therefore decreasing threshold for rainfall intensity and duration before landsliding is initiated.
Triggering rainfall events for diminishing values of saturated permeability from Ep,j to Eq,j are
shown by circles.
As the I-D threshold increases, the likelihood of that threshold being reached in a rainfall event
decreases. Thus land with lower erosion susceptibility is less likely to be subject to a triggering
rainfall, and the frequency of landslide events is lower.

19
Figure 2. Conceptual model for relationship between erosion susceptibility and rainfall intensity and duration required to trigger landslides. Source: Cepeda et al. (2010).
B.2 Objectives
The RFP (MfE, 2011) describes the risk analysis phase of the project as entailing a “qualitative
(and relative) assessment of the erosion and sedimentation risks of plantation forestry activities
(afforestation, harvesting, earthworks, mechanical land preparation, and quarrying) in each of the
classification zones adopted.”
We intend to broaden the analysis to include a written description of erosion risks, assessment of
their likely frequency and severity, and recommendations for processes for assessment and
management of risks.
Note that this risk analysis is not site-specific. The ESC developed in previous Sections is a
“regional” (1:50,000) scale depiction of erosion susceptibility. The risk analysis for the ESC classes
will explore differences in the nature of erosion risk between regions, and how these differences
can be accommodated within a national environmental standard (NES) for plantation forestry.
The analysis of erosion risks for plantation forests will focus on:
1. Identifying and describing the underlying (“predisposing”) factors that influence erosion
susceptibility.
2. Plantation forest operations as preparatory or mitigating factors which interact with
predisposing factors to determine erosion susceptibility—in particular, how forest
operations can be managed so that they do not increase susceptibility of land to erosion.
We believe that a national ESC and NES for forestry will only work if it is backed up by

20
clear standards for design and execution of any forest operations which have the
potential to increase erosion susceptibility.
3. Estimation of the frequency of intense, triggering rainfall events on a regional basis within
New Zealand.
4. Using the frequency data for triggering events and the ESC to characterise:
a. Differences in the nature of erosion risk between the ESC classes, and how these
differences can be accommodated within a national environmental standard
(NES) for plantation forestry.
b. The extent to which plantation forest operations are constrained by erosion risk
within each ESC class, on a regional basis.
B.3 Identifying and evaluating predisposing factors
Predisposition to erode is an intrinsic quality of a land unit determined by soil type/lithology and
topographic characteristics (slope, aspect, drainage pattern, slope position or landform element).
In this study, predisposition to erode is specified by the potential erosion severity values assigned
to LUC units in the NZ Land Resource Inventory (NZLRI) database. While there is no specific
decision-tree or algorithm for assessing potential erosion severity, criteria listed in Lynn et al.
(2009) include present erosion severity and evidence of past erosion features. Also mentioned
are the dominant land use (strictly a preparatory factor rather than one related to predisposition
of a unit) and “magnitude and frequency of erosion causing events” (not strictly a component of
erosion susceptibility).
Present erosion severity is assessed using the guidelines in Table 8, Lynn et al. (2009), which relate
to the area and depth of the erosion features, and additional criteria:
Volume of erosion debris displaced
Nature of the parent rock and regolith
o Failure planes, crushing, rock strength
o Soil properties such as aggregation, slaking, fertility, porosity and drainage
Slope and slope length where the feature is located

21
Sidewall slope of gully or other incised features, and fluvial characteristics of channels
Likelihood of reactivation (e.g. by slope undercutting or triggering rainfall events)
Ease of repair or stabilisation
Position on hillslope and connectivity with stream channels (strictly related to downslope
consequences rather than erosion susceptibility).
In summary, while the potential erosion severity values for LUC units in the NZLRI are an expert
assessment of the likelihood and nature of erosion for a specific unit, they do confound factors related
to erosion susceptibility (rock, regolith, slope and channel characteristics; and preparatory features such
as undercutting and dominant vegetation) with other elements of erosion risk and risk management
such as likely frequency of triggering events or ease of stabilisation. Pragmatically, we have chosen the
LUC classification because it uses comprehensive field assessments of actual and potential erosion over
the whole of New Zealand compiled by experts. In principle, this approach is preferable because 1) it is
based on observed erosion rather than on modelled/simulated/computed erosion; and 2) it requires
little if any field verification, in contrast to any modelled classification which would require
comprehensive field verification.
A land unit with a specific predisposition to erode may be placed at greater or lesser susceptibility
to erosion by preparatory or mitigating factors respectively. Preparatory and mitigating factors
are discussed in the following section.
B.4 Forest operations as preparatory or mitigating factors for soil
erosion
B.4.1 Forest operations as mitigating factors
The role of forests in mitigating erosion and consequent sediment yield in New Zealand has been
thoroughly reviewed in a contract report to the MfE by Blaschke et al. (2008). Because the report by
Blaschke et al. is recent, exhaustive and has been published by MfE, we see no point in describing it in
detail. Instead, we will summarise the key findings only (Section B4.1.1).

22
B.4.1.1 Summary of findings from Blaschke et al. (2008)
The effect of vegetation cover on soil erosion and sediment yield, and in particular the contrast between
pasture, plantation forest and indigenous scrub and forest, has been intensively researched in New
Zealand over the last 60 years. Blaschke et al. (2008) reviewed a large number of published and
unpublished studies, and augmented this review with personal communications from research scientists
where necessary. Research relevant to the present study is reviewed in Chapters 3 (Physical effects of
afforestation and reversion on sediment yield) and 4 (Physical effects of afforestation and reversion
effects on erosion). Key findings are quoted directly:
“Small-catchment research studies provide conclusive evidence that afforesting or reverting
close to 100% of small catchments, reduces averaged annual sediment yields by at least 50%
and in most instances by greater than 80%.
Long-term sediment yield computations are available for many medium to large catchments
nationwide. These indicate that high sediment yields are associated with unstable geological
terrain or/and high rainfall zones. In these medium to large catchments, relative reductions of
50% or more in sediment yield, only translate to substantial reductions in absolute yield (tonnes
per square kilometre per year), if afforestation and reversion are targeted onto the parts of
catchments that have high sediment yields in the first place.
Substantial reductions cannot be expected immediately. The only published large-catchment
investigation of afforestation effects on sediment yield (Waipaoa), shows a time-lag of several
decades for reduction to work its way from headwaters to mouth. This is due to a large volume
of sediment, already in channel storage, gradually being transported downstream.
Storm damage surveys, state of environment surveys, and soil conservation effectiveness
surveys, provide enough data for us to conclude that large areas of soil can be protected from
erosion by:
o spaced planting of trees in pasture
o close-canopy afforestation
o scrub reversion
o bush retention
in the following circumstances:
o where land is erodible
o where sufficient trees are planted (on most or all of the unstable area) and tree or scrub
cover is maintained.”

23
Although not stated in their overall summary of findings, Blaschke et al. (2008, p31) also add the
important caveat that while there is “a widespread perception that less erosion occurs in forested or
scrubby terrain, than on land in pasture….bush and scrub do not provide total protection, especially in
higher-intensity storms (a fact often overlooked by advocates of afforestation / reversion options.”
However, Blaschke et al. (2008) do not closely review the time-dependency of:
1. Erosion mitigation effects of forestry (canopy rainfall interception, litterfall, root reinforcement)
which generally, but not always, increase with stand development over time.
2. The preparatory factors (earthworks, vegetation disturbance, deep soil disturbance) which are
also time-dependent, typically occurring at the beginning and end of the rotation—even if the
triggering event which initiates erosion occurs several years later.
The time dependency of these effects of forestry on erosion will be examined in subsequent sections
(Sections B4.1.2, B4.2).
B.4.1.2 Time dependency of mitigating effects
The mitigating effect of forest cover on soil erosion is due to 1) the soil reinforcing effect of the forest’s
root network, 2) generally lower soil water balances due to interception and evaporation of rainfall by
the rough forest canopy and 3) soil building effects (litterfall, nutrient cycling, aggregate stability) of a
permanent or semi-permanent forest canopy which is not disrupted by cultivation, fire or grazing.
There has been extensive research work focussed on soil reinforcement and canopy effects on
evapotranspiration, both here and overseas (for a recent review, see Stokes et al., 2008).
Marden (2004) reviewed studies of forest effectiveness in reducing erosion in New Zealand, and
reported reductions in landslide damage consistent with those in Blaschke et al. (2008). However,
Marden (2004) noted that reductions in landslide damage scaled with site occupancy by the forest—
they were least during forest establishment (stand age <6 years for radiata pine) and increased with
stand age due to increasing forest biomass and canopy cover. For example, after Cyclone Bola (1988)
landslide susceptibility in exotic plantations >8 years old and in intact indigenous forest cover was 16
times less than for both pasture and young (< 6 years) exotic plantations.
Watson et al. (1999) published a useful paper which examined how root reinforcement by kanuka and
radiata pine stands varied with stand age and stand development. An important finding was that the
higher stand densities of regenerating kanuka (~104 stems/ha) resulted in more rapid development of a
stabilising root network compared with radiata pine (typically planted at 833-1250 stems/ha). This was
illustrated in a conceptual diagram as follows:

24
Figure 3. Root reinforcement after clearfelling, radiata pine and kanuka. Source: Watson et al. (1999).
A key feature of this figure is that the interaction of 1) the decay curve for radiata pine net root
reinforcement after harvesting with 2) the root growth curve for the young replanted radiata pine stand,
results in a period of reduced root reinforcement of between 4.7-7.5 years post-harvest, depending on
the initial spacing of the replanted tree crop.
In Watson et al. (1999), extreme flood events were used as a surrogate for landslide-triggering extreme
rainfall events. A storm frequency analysis for the Waipaoa catchment (Gisborne Region) suggested
there was an 80% probability of an extreme flood event during the 4.7 year “window” when a stand
replanted immediately in radiata pine at 1250 stems/ha had less than 100% net root reinforcement.

25
The probability of a flood event occurring during the 5.6 year “window” for a stand replanted at 800
stems/ha was 85%. The likelihood of landslide-triggering events during the “window” of reduced net
root reinforcement is discussed in more detail in Section B4.2 of this study.
B.4.2 Forest operations as preparatory factors
The effect of forest operations and in particular tree harvesting and associated earthworks has been
extensively researched in New Zealand and overseas. This section will be based on Sidle and Ochiai’s
(2006, pp 163-203) useful review of forest harvesting and earthworks effects on occurrence of mass-
movement erosion. Where relevant, results from research in New Zealand plantation forests will also
be cited.
B.4.2.1 Harvesting
Loss of forest canopy and root systems
The most obvious effect of harvesting is the felling and removal of trees, with loss of canopy effects on
soil water balance and root-reinforcing effects in soils as dead tree roots decay. This process was
discussed fully in Section B4.1.2 of this report. Sidle and Ochiai (2006) comment that root
reinforcement effects are considered more important than canopy interception effects, and discuss
mitigation of harvesting effects through:
Re-establishment and maintenance of full canopy cover
Alternative harvesting methods to large-scale clearfelling, such as partial harvesting,
shelterwood harvests or individual tree selection. These alternative harvesting strategies are
used in North America and Europe for sites with high erosion susceptibility and/or high risks
associated with downslope consequences of erosion.
While the importance of rapid canopy-re-establishment is recognised in New Zealand plantation
forestry, companies are reluctant to limit size of clearfelling coupes for economic and operational
reasons. Nonetheless, research cited in Sidle and Ochiai (2006) and elsewhere suggests that limiting
coupe sizes and or partial harvesting are highly effective ways to reduce erosion susceptibility of forest
lands. Such limitations could also include exclusion of riparian areas from planting and harvesting of
commercial plantation species.
Deep soil disturbance including exposure of soil to erosion forces during harvesting (soil ploughing).

26
The deep soil disturbance effects of harvesting and roading are reviewed in detail in Section A3.1. The
results of New Zealand studies by Marden and co-workers are summarised below:
Undisturbed ground and shallow disturbance (usually 80-90% of total ground cover) had
very low slopewash rates.
Deep disturbance areas comprised 9-15% of study areas, and contributed ~85% of total
slopewash from all disturbed sites.
Sediment contributed to streams from deep disturbance sites was small in relation to
sediment contributed from landslides and gullies. Possible exceptions are where soil
ploughed by deep disturbance is deposited in a channel and becomes entrained by
streamflow during rainfall events; and where skidders or tractors are used on hillslopes
and temporary contour tracks are sidecut. Effects of contour tracks are discussed below,
in Section B4.2.2 (Earthworks).
Effects of management of slash from harvesting operations
Harvesting of trees leaves considerable quantities of small tree debris (“slash”) on the site. The optimal
management of slash from an erosion mitigation perspective is a matter of debate; the debris lying on
the ground has the potential to reduce the velocity of overland flow and hence to reduce surface and
gully erosion, but significant accumulations of it can block small streams causing outbursts that can
initiate gully erosion. Dumping slash in natural drainage channels forms traps for sediment resulting
from harvest operations, reducing sediment delivery off-site; but again, larger slash can form small-scale
log-jams that can sooner or later fail, releasing large quantities of stored debris and sediment
downstream. At a larger scale, collapsing natural log-jams have been implicated in one of New Zealand’s
worst debris-flow disasters, at Peel Forest in 1975.
In general the risk of accentuating sediment movement by retaining slash on the site is significantly
lower than that of removing it (see Sidle and Ochiai (2006, pp174-176). The known situations where
accentuated sediment movement has been generated by organic debris are at larger scale than is likely
to result from harvesting operations, involving substantial jams of logs from mature trees. At the scale of
slash any such effect is likely to be insignificant.
B.4.2.2 Earthworks
In this section, earthworks include temporary and permanent roads, landings, and quarries and contour
skid trails. Earthworks act as preparatory factors for erosion by:
Altering natural drainage patterns, concentrating water onto unstable portions of the hillslope.

27
Sidecutting of steep slopes leading to
o Undercutting of unstable slopes
o Side-casting of fill, thereby overloading and oversteepening fillslopes.
Creation of areas where the soil is exposed or deeply disturbed.
Fillslopes may fail as slumps, debris flows or debris avalanches; dormant earthflows and deep-seated
slides can be re-activated by side-cutting roads through toeslopes; and road fill material placed at the
head of dormant slumps can re-activate slump erosion. Exposed road surfaces may be more susceptible
to surface or fluvial erosion (Fransen et al., 2001), as well as dry ravel or debris avalanche (Sidle and
Ochiai, 2006).
With careful design and drainage, erosion susceptibility of roads and earthworks can be minimised.
However any earthworks involving cuts and fills necessarily decrease site stability. A general rule is that
unimproved (forest) roads increase landslide erosion by approximately two orders of magnitude
compared with undisturbed forests, and one order of magnitude compared with clearfell harvested
catchments where earthworks are absent (Sidle and Ochiai, 2006).
Fransen et al. (2001) reviewed 12 New Zealand studies of erosion from forest roads on granite, schist
and pumice lithologies. This review is discussed in detail in Section A3.1. Key results were:
Surface erosion from roads at harvest times may increase sediment yield five-fold
compared with that from pre-harvest ungraded and lightly used roads.
Surface sediment yields from roads were generally several orders of magnitude lower
than estimated sediment yields from mass movements, but surface erosion from harvest
(skidder) tracks may generate much higher proportions of sediment yield.
Infrequent road-related mass movements are major sources of sediment within forests.
Mass-movement erosion rates decline with road age, but may increase to earlier levels
when roads are upgraded for harvesting activities, or when subject to intense storm
events. J.Devonport, (pers. comm. 26 April 2011) notes that forest roads on erosion-
susceptible terrain in Hawke’s Bay may be an erosion hazard for up to 10 years after
construction.

28
B.4.2.3 Other operations
Other forest operations which may act as preparatory factors for erosion include vegetation
management (removal of competing weeds prior to planting a forest crop), effects of initial stocking and
thinning, and construction of firebreaks or fencelines. There is no published literature on the effect of
these practices on soil erosion, possibly because their effects are minor compared to those arising from
clearfelling and earthworks.
Vegetation management and initial stocking and thinning have effects on vegetation canopy and the live
root network, and allowing for scale, have similar effects on erosion susceptibility. On land with very
high erosion susceptibility, it may be desirable to manage forest canopies to maintain the mitigating
effects of an intact forest. For example, plantations planted under the Government’s East Coast
Forestry Project grant scheme must:
“have regular initial planting stocking densities. A grant area planted in radiata pine and Douglas fir is to
be planted at a minimum stocking rate of 1250 stems per hectare”
and must be thinned “ within the following parameters:
• the mean tree height must be five metres before thinning can occur
• when the mean tree height is between five and 12 metres, the stocking rate must be at least 500 stems
per hectare
• when the mean tree height is 15 metres or more, the stocking rate is to be between 250 and 500 stems
per hectare.” (MAF, 2007).
Effects of firebreaks or bulldozed fencelines depend on their location and width. If located on ridges,
erosion effects are usually limited to surface erosion of the firebreak surface. Because firebreaks are
kept permanently free of vegetation, surface erosion will continue, although declining in magnitude as
erodible material is removed and a resistant surface remains (“hardening”).
Where firebreaks or fencelines are bulldozed across a hillslope contour, their effects are similar to
temporary tracks since they are typically not constructed to an engineering standard nor do they have
any drainage apart from that afforded by techniques such as outsloping or waterbars (“cut-offs”).

29
B.5 Frequency of erosion events
B.5.1 Rainfall intensity/duration and landslides
In general, erosion risk (hazard) is higher under more intense rain. However, the occurrence of long-
duration, low-intensity rain can be important in preconditioning a slope for failure under later intense
rain by increasing the antecedent moisture content. Recent research has suggested that long-duration,
low-intensity rainfall can in fact cause slope failures under combinations of intensity and duration
significantly below accepted thresholds (e.g Brunetti et al., 2010), but appears to affect low-permeability
more than high-permeability soils such as found in New Zealand (Rahardjo et al., 2008); however there
appears to be a need for more research into this topic (Guzetti et al., 2007). Thus while at present it
appears worthwhile to include both antecedent rainfall and a measure of likely rainfall intensity in
developing methods for assessing landslide susceptibility, there is continuing discussion on the role of
long-duration rainfall events in the literature.
B.5.2 Estimating frequency of erosion events
Mass movement erosion and gully erosion are generally triggered by intense rainfall, although wet
antecedent conditions can act as a preparatory factor. The rainfall intensity and duration required to
cause a soil pore water pressure sufficient to cause failure of a given slope depends on a large number
of factors reviewed in Section A1; slope material and stratigraphy, slope angle(s) and planform
topography, vegetation/land use, aspect, and bedrock lithology. Geotechnical modelling techniques are
in principle able to predict the conditions under which a given slope will fail, but require data that are
usually not available. For regional studies the critical rainfall intensity-duration combinations might be
determined empirically, that is, by comparing databases of slope failures with the associated statistics of
local intense rainfall (e.g. Cepeda et al., 2010), or experience in similar terrain. However without
knowledge of pore water pressure, the dominating factor in slope stability, such studies may have
limited reliability.
In New Zealand, some data are available on slope failure occurrences as a function of 1) catchment
mean annual rainfall (e.g. Hicks, 1995), and 2) daily rainfall and antecedent rainfall (Glade, 1998; Glade
et al., 2000). Intense rainfall statistics are also available (Thompson, 2011). However the required
correlation between rainfall intensity and landslide hazard has not yet been analysed on a New Zealand-
wide basis. We would have liked to embark on this as part of the current project, but in the timeframe
available are unlikely to complete the task. Sufficient reliability for practical application would also be an
issue. Thus we propose to utilise the analysis of Hicks (1995) to estimate the frequency of rainfall-

30
triggered landslides, as it based on data covering a range of landforms in both the North and South
Islands.
B.5.2.1 Calculation of frequency
Hicks (1995) used landslide records for 12 major catchments in New Zealand, to estimate a relationship
between the average return interval (ARI, in years ) of landslide events to mean annual rainfall (MAR, in
mm). The data covered time intervals between 20 to >100 years and catchments with 500-2500 mm
MAR (except for one catchment with MAR=3505 mm).
Figure 4. Diagram showing location and timing of landslide frequency data used by Hicks (1995).
Hicks fitted a power relationship to the data, of the form
ARI=3009 x MARˉ0.894 (Eqn 1)
as shown in Figure 5. This relationship gave a reasonable fit to a limited data set (n=12).

31
Figure 5. Average return interval (ARI) vs mean annual rainfall (from Hicks, 1995. Data obtained by scale
measurement from Figure 2).
This relationship can be transformed so that
AEP=1−exp(−1/ARI) (Eqn 2)
where AEP= Annual Exceedance Probability, the probability that a landslide event will occur in any single
year. Figure 6 shows the plot of AEP vs MAR for Hicks’ data. A power function fitted to the data takes
the form
AEP=0.0006 x MAR0.7974. (Eqn 3)
One advantage of transforming the relationship is that it is easier to see outliers. For Hicks’ data set,
one clear outlier is the data point where MAR>2500 mm; the other possible outlier is the data point for
Kaikoura, which has a very high AEP (~0.35) for a relatively low MAR (~1800 mm). Hicks does caution
that the ARI-MAR relationship does not apply to mountain landscapes. In the case of Kaikoura, the high
probability of landslide events may be due to the rapid transition in terrain from sea level to the
Seaward Kaikoura Range.

32
Figure 6. Annual exceedance probability (AEP) vs mean annual rainfall (from Hicks, 1995).
Validation
Hicks used data from 12 locations, 3 in the South Island. The data were limited in number, and biased
towards the East Coast of the North Island and soft-rock lithologies. This precluded a formal testing of
the model. However, Hicks did test the model against data for 11 catchments in the Gisborne-East
Coast region, with MAR values ranging from 1231 to 2673 mm, and found good agreement between the
model and observed values.
Hicks’ model can also be compared with the results for the Waipaoa catchment in Watson et al. (1999),
where the observed AEP (~0.25) was somewhat higher than that predicted by Hicks for Waipaoa using
the MAR of 1305 mm at Mangatu Forest headquarters (0.18).
Classification
Hicks (1995) noted that ARI values for landslide events were scale-dependent. The larger the area
relevant to each ARI data point, the higher the likelihood that there would be a landslide event
somewhere within the area. He also noted that the fitted model was not likely to hold for mountainous
regions where MAR>2500mm. He therefore specified that the ARI (and therefore AEP) values calculated
by his model are specific to catchments of size 10-1000 km2, with MAR from 500-2500 mm.
However, if we assume that frequencies (ARI or AEP) scale with catchment area, it is possible to depict
relative ARI and AEP values for all New Zealand where MAR =500-2500mm, using grid (raster) values for
MAR (1950-1980) in a geospatial layer provided by NIWA (Figure 7).
Kaikoura

33
Figure 7. Five-class classification of MAR.
Inspection of Figure 7 suggests that a five-class classification of AEP could be based on the classification
of MAR, using the intervals in Figure 7:
Table 6. Proposed classification of AEP based on MAR
Class 1 2 3 4 5
MAR (mm) <500 500-750 750-1500 1500-2500 >2500
ARI (years) >11.6 8.1-11.6 4.4-8.1 2.7-4.4 <2.7
AEP <0.08 0.08-0.12 0.12-0.21 0.21-0.30 >0.30

34
Although the AEP values for Class 1(MAR <500mm) and Class 5 (>2500mm) cannot be inferred from
Hicks’ model, a reasonable assumption is that for Class 1 they are somewhat less than Class 2; and for
Class 5 they are somewhat greater than Class 4.
B.5.3 Climate change
The potential for significant future alteration to the climate of New Zealand is now well-
appreciated. The effects that such changes may have on erosion susceptibility can be stated in
general terms; for example, an increase in the frequency of intense rain may increase the
probability of failure of a given a slope occurring in any given year, though this may be offset to
some extent by a decrease in mean annual rainfall. However, such factors are difficult to
incorporate in a current assessment of erosion susceptibility. Where the data on which the NZLRI
is based are decades old, and a distinct (and long-term) change in climate has occurred, this could
be borne in mind in translating the NZLRI land classifications to erosion susceptibility; however
such situations are rare if not non-existent. Further, the failure of a given slope is very much a
statistical event; no-one can say whether the increased high-intensity rainfall frequency will be
manifest as actual storms within the next decade or not, nor whether the storms, when they
occur, will cause a specific slope to fail.
Thus incorporating climate change into an ESC is difficult; in particular, for a system intended to
be implemented immediately. In general, the changes in erosion susceptibility due to climate
change almost certainly lie within the (quite broad) band of variability of erosion assessments, so
are likely to be insignificant in the short term.
B.6 Assessment and management of erosion risks
B.6.1 Identifying erosion risks from the ESC
B.6.1.1 Erosion hazard
Erosion hazard is determined by erosion susceptibility of a site, and the likelihood or frequency of an
erosion triggering event. Using the Hicks (1995) model, the annual exceedance probability (AEP) of a
landslide triggering event is correlated with MAR (mm). An indication of erosion hazard at 1:50,000 scale
can be obtained by plotting the range of MAR classes in Table 5 by the ESC. The results of this are

35
depicted in Appendix 2, where the range of MAR classes is shown for each individual ESC class (using a
four-class ESC classification).
There is an expected correlation between ESC and MAR because in New Zealand rainfall varies
orographically. In general, it is steeplands that have highest MAR and because of their topography are
also most susceptible to erosion. This correlation is apparent in the figures in Appendix 2, and can be
explored further by plotting MAR as a function of ESC for all LUC polygons in New Zealand (Figure 8).
Figure 8 depicts only a moderate correlation between ESC and AEP, and each ESC class spans at least
three or more AEP classes. This suggests that:
The erosion susceptibility of an LUC unit, as determined by slope, lithology, soils etc., exerts an
effect on erosion risk that is partly independent of frequency of landslide triggering rainfalls.
Erosion risk will require an assessment of both ESC for an LUC unit, and frequency of triggering
rainfall events. Areas depicted in dark blue or black in Figure 7, where MAR>1500mm and
AEP>0.21, are likely to have a greater erosion risk for a given ESC class, than the balance of New
Zealand hill country where MAR is 750-1500mm.
Figure 8. MAR vs ESC for all New Zealand. Black line is the median, the box includes 25th-75th percentiles, and whiskers show “upper” and “lower” limits of data. Note that “outliers” are plotted as individual points. These occur mainly in mountainous areas and on the West Coast of the South Island.

36
B.6.1.2 Effects of scale
The ESC and analysis of risk in this report use spatial data at a 1:50,000 scale. Therefore the ESC derived
from the NZLRI is necessarily coarse, and in some cases polygons assigned a specific ESC are likely to
include a complex of sites with different erosion susceptibilities.
The intention is that the ESC acts as a decision rule for the activity status of forestry operations under
the Resource Management Act (RMA). The next stage involves the planning and execution of forestry
operations, with an appropriate level of regulation under the RMA. At this stage more detailed
consideration of local conditions of the likely effects of topography, soils, drainage and intense rainfall
statistics becomes both possible and necessary to refine the larger-scale ESC classification and make
operational decisions that manage risk to acceptable levels. This topic is covered in the following
sections.

37
C. Protocol for analysis and management of erosion risks at an operational scale
C.1 Introduction
The topics covered in this section are outside the brief for the development of a national ESC (MfE,
2011). However, we believe it is important to consider the implications of an ESC within the proposed
NES for plantation forestry. In particular
The ESC is based on mapping at 1:50,000 scale. This must be supported by detailed assessment
of erosion hazards and risks at a scale suitable for identifying the specific risks at a site or
operational level.
The ESC must be supported by specific standards for forestry operations that are appropriate for
the level of erosion risk on a site. We suggest a set of best management practices (BMP’s) which
could be used for this purpose. However, we emphasise that these are suggestions for
discussion purposes only, not recommendations.
C.2 Analysis of erosion susceptibility and risk
A typical map scale for forest operations planning and management varies between 1:5000 and
1:10,000, and most forest companies have contour maps of their forest estate at this scale, with contour
intervals usually between 5-20m. This scale coincides with that suitable for detailed assessment of
landslide hazards and downslope consequences, usually considered to be between 1:10,000 (Saunders
and Glassey, 2007) and 1:5000 (Cascini, 2008). We recommend that this range of scales be adopted for
planning, consent and operational management of erosion hazards on plantation forests.
In this section we will propose how risk analysis at an operational (~1:10,000) scale might vary for the
three or four different ESC Classes, and for varying levels of AEP for triggering rainfall events.
The higher the ESC class and the higher the AEP of erosion-triggering events, the greater the likelihood
of significant erosion caused by harvesting, and so the more detailed and rigorous is the required risk
analysis. A possible decision matrix integrating the ESC with likelihood of triggering rainfall events is
shown in Table 7. Note that this decision matrix is for discussion purposes only. The actual allocation of
risk analysis classes to specific cells in the matrix needs careful study, and the detail of the required risk
analysis will depend on the individual situation under consideration; i.e.
The specific types of erosion process able to occur,
Their specific causes,
The likely size or magnitude of erosion event,

38
The proposed forestry operations and the practicable mitigation possibilities.
The downslope consequences or receiving environment for any erosion debris originating from
a specific site.
Insofar as sites on the borderline between ESC classes might well require consent conditions more
severe than indicated by their ESC, it is not possible to specify in detail the risk analysis procedures for
each class and frequency. Ideally, a complete protocol would be developed, based on Figure 9
(source:Figure A3.2, Saunders and Glassey (2007)). This could be applied in the first instance to all sites
(except possibly those in the NA category), but particular aspects of the risk analysis could be bypassed
when they are shown to be unnecessary for a particular site.
Table 7. Decision Matrix using ESC and AEP
ESC Annual Exceedance Probability (AEP)
<0.08 0.08-0.12 0.12-0.21 0.21-0.30 >0.30
Low NA NA NA NA NA
Moderate NA NA SA SA SA
High SA SA FA FA FA
Very High FA FA FA FA FA NA=No risk analysis required to proceed. SA=Some risk analysis required. FA= Proceed under stringent conditions only if full risk analysis indicates risk can be managed to be acceptable.

39
Figure 9. Risk assessment process at operational scale (Saunders and Glassey, 2007). Note that this process is appropriate for urban landslide risks, and would need to be adapted for use in a rural context.

40
C.3 Management of forest operations to reduce preparatory effects on
erosion susceptibility and risk
In this section we propose a framework under the NES to mitigate the “preparatory” effects of
harvesting and earthworks on erosion susceptibility. We will cover planning and design, operational
management, regulation, and the role of best management practices (BMP’s).
We make the following preliminary comments:
Infrastructure and harvesting effects are difficult to avoid or eliminate and most often are
minimised.
Internationally, the most common concept for managing the adverse effects of infrastructure
and harvesting is the application of best management practices (BMP’s).
BMP’s are considered a desirable standard of management, whereby the regulatory authority
will accept unintended consequences (e.g. major erosion events) as a failure of the BMPs, not of
the harvest operation.
We recognise that there are few hard and fast rules for either infrastructure or harvesting that
achieve an overall best outcome. Hence
o BMP’s are effects based, that means BMP measures can vary according to both risk and
potential effects.
o There must be an agreed resource consent process for departure from BMP’s where
necessary to achieve environmental standards. The consent applicant can make a
technical case for design or operational standards that are lower than those in the
BMP’s.
BMP’s are ‘live documents’ with an agreed process for review and updating. As new information
comes to hand standards may be changed e.g. removal (or not) of woody debris in streams.
We recommend that an NES for plantation forestry should be supported by a national set of Forestry
BMP’s. They should include planning, operations and monitoring/auditing components and be written in
such a way that the information is readily transferable to the in-field practitioners (especially the
machine operators). Documents such as the NZFOA Best Environmental Practices Guide (2008) and LIRO
Forest Code of Practice (1993) could form the basis for the BMP’s, but a more focussed content on
technical requirements would simplify their use and implementation. Documents such as the Low
Volume Roads Engineering: BMP Field Guide (Kellar and Sherar, 2003) provide a well-illustrated example
of where to use and how to install BMPs. The ‘Water Quality BMP’s” for Montana Forests (MSU

41
Extension, 2001) is also a very professional document that starts at catchment scale concepts and then
photographically illustrates the importance of BMP’s at the operational level. It is a document often
referenced for its compactness and clarity.
Note: the NZ Forest Code of Practice was written by LIRO but with major contributions from both
Regional Councils and Forest Companies. In the mid-1990’s it was widely considered a national
document because of the absence (or in many cases the lack of development) of regional specific
guidelines. The document includes systems to develop ‘values’ and the possible impacts on those values.
It also provides a ‘simple’ operational section that was frequently used by many Councils as the
conditions of resource consent.
For an NES it would be prudent to develop Technical Guidelines (either as appendices to Forestry BMP
Guidelines or as a Field Guide). It would list specific metrics / dimensions associated with BMP practices.
The Technical Guidleines will take time to develop, but a possible starting document could be:
The Australasian Unsealed Roads Manual (ARRB, 2009) – which is used extensively by
the NZ Roading Authorities.
The new edition of the LIRO NZ Forest Road Manual (in final phase of review - due to be
released soon by NZFOA). It too focuses more on the technical aspects of infrastructure
construction.
Environment BOP (2000) “Erosion and Sediment Control Guidelines for Forestry”.
Environment Waikato (2009) “Operations Earthworks - Erosion and Sediment Control
Guidelines.”
Note that all the above documents are relatively large as they cover all aspects from planning through to
monitoring. By focussing just on the required technical aspects of BMPs it should be possible to create a
focussed and condensed document.
C.4 Relating BMP’s to the ESC
The NES will denote risk level by erosion susceptibility class (ESC). ESC is primarily dictated by slope, soils
and lithology. This is not unreasonable as slope in particular is a major driver of risk for both
infrastructure and harvesting as it relates to erosion. Here are some possible BMP’s and general
standards that could apply in a three-class (low, medium, high) ESC:
Risk Level 1: (low risk)

42
Rule: General adherence to a set of national Forestry BMP’s is required for both infrastructure
construction and maintenance and harvesting.
Enforcement: System of regular audits of operations. Failure, resulting in enforcement, is triggered by
actual or probable erosion effect on a receiving environment (consequence).
Three prudent requirements include:
(a) Requiring two members of each roading/construction/harvesting crew to complete and
maintain accreditation through the completion of BMP training modules. This would be
similar to the current safety rules.
(b) System of regular (3-6 monthly) Council inspections/consultations, or else inspection
following a complaint.
(c) Pre-harvest notification, and post harvest inspection (with consultation) of all harvest areas.
Harvest areas are defined as contiguous areas, or discontinuous areas grouped as agreed by
Council.
Development of a standard national audit form that is aligned with the Forestry BMP guideline is
required. A simple scoring system provides feedback to contractor, company and Council and provides a
benchmarking system to allow both temporal and spatial analyses of results. Effective audit should
include both ‘intent’ and ‘technical compliance’ components.
Risk Level 2: (moderate risk)
Rule: Harvesting – Limit of deep soil disturbance 6% by area within the harvest boundary, excluding
permanent road infrastructure. Mitigation measures to control or divert water to be implemented on all
areas exceeding 200 contiguous m2 that are deeply disturbed.
Rule: Infrastructure – Adherence to Forestry BMP Technical Guidelines, but deviation is possible with
agreement from Regional Council.
Enforcement: System of regular audits of operations as for Risk Level 1 areas. In addition:
Harvesting – Concern that harvesting exceeds 6% deep soil disturbance shall trigger an
investigation using appropriate methodology (e.g. McMahon et al. 1995). Exceeding soil
disturbance limits, or failure to mitigate larger contiguous areas of deep soil disturbance will
trigger enforcement actions (e.g. fine, enforced mitigation requirements on timeline, or in
severe cases stop work order).

43
Note: McMahon et al. (1995) is a line-transect soil disturbance survey method, based in part on
systems developed in Canada to inspect operations on federal lands, that has proven to be
robust and pragmatic for the comparison of soil disturbance levels.
Infrastructure – Post-harvest inspections to check compliance of installed infrastructure with
BMPs. Failure to comply will trigger enforcement actions.
Risk Level 3: (high risk)
Rule: Harvesting – A Harvest Plan must be developed and submitted for approval. Key aspects include
extraction system selection, extraction direction and the avoidance of damaging sensitive areas such as
streams. Limit of deep soil disturbance 4% by area within the harvest boundary, excluding permanent
road infrastructure. Mitigation measures to control or divert water to be implemented on all areas that
are deeply disturbed exceeding 100 contiguous m2.
Rule: Infrastructure – All infrastructure must be designed by, and the implementation overseen by, a
registered engineer, with erosion and sediment controls designed by a suitably qualified specialist.
Design should be of a high standard that includes layout planning at a larger scale (permanence of
infrastructure), minimisation of slope disturbance (through survey design), and road standards that
focus on maintaining slope stability. Adherence to Forestry BMP Technical Guidelines is also required.
Deviation of guidelines is only by submission and agreement of an “improved” new design and/or
protocols.
Enforcement: System of regular audits of operations as for Risk Level 1 areas. In addition:
Harvesting – Concern that harvesting exceeds 4% deep soil disturbance shall trigger an
investigation using appropriate methodology. Exceeding soil disturbance limit, or failure
to mitigate the larger contiguous areas of deep soil disturbance will trigger enforcement
actions.
Infrastructure – Compliance and post construction inspection report prepared by
Registered Engineer submitted to Regional Council. Failure to comply with BMP’s will
trigger enforcement actions.

44
D. Summary and Recommendations
D.1 Erosion Susceptibility Classification A three-class and four-class ESC were derived using the potential erosion severities for LUC units in the
NZLRI, mapped at 1:50,000 scale. Notwithstanding the limitations of this approach (coarse resolution of
map units, lack of strict equivalence between potential erosion severity and erosion susceptibility), a
four-class ESC provided a robust and sensible classification for erosion susceptibility. A three-class
system did not adequately differentiate between land units which are going to be difficult to afforest
without very severe adverse erosion effects, and areas which, although having an erosion limitation to
use, are more suited to conventional plantation management. We therefore recommend a four-class
ESC classification for use within the NES for plantation forestry.
The NZLRI database contains data that are now approaching 40 years old in some cases, especially
in the South Island. We recommend regular (5-yearly) review and updating of the ESC, where any
suitable new LUC mapping could be substituted for the current NZLRI data to derive more
accurate mapping and estimates of potential erosion severity. However, we reiterate the need
for a national set of standards for quality and for correlation of map units within the NZLRI.
D.2 Risk analysis This study focuses on erosion hazard rather than erosion risk in the strict sense, since downslope
consequences were not evaluated. A key contributor to erosion risk in plantation forests are the
preparatory and mitigating effects of afforestation, clearfell harvesting (including deep soil disturbance)
and earthworks (roads, landings, quarries). These effects are time dependent, so that risks are greatest
during a “window” of between 4-10 years exists at time of crop harvesting and establishment. Analysis
of AEP for landslide-triggering storms suggests that in most hill country areas of New Zealand, there is a
distinct likelihood that landslide triggering storms may occur during this “window” period where erosion
susceptibility has been increased by harvesting and earthworks.
D.3 Risk Management The ESC based on 1:50,000 scale mapping is only the first step in management of erosion risks from
plantation forests. In order to account for important variation in erosion susceptibility at a site level,
planning and regulation at a scale of 1:5000 to 1:10,000 is required. The degree of effort required for
adequate planning can be guided by the ESC, and also the AEP for landslide-triggering storms.

45
Site-level planning also allows for identification of consequences, downslope values that may be
impacted by erosion. These include receiving water bodies, infrastructure and buildings, as well as
human safety and welfare.
We strongly recommend that an NES for plantation forestry will require development of site-level
planning processes (including BMP’s), so that operational planning and management of harvesting and
earthworks are done to a uniform high standard throughout New Zealand.

46
References
ARRB (2009) Unsealed Roads Manual; Guidelines to good practice 3rd edition. ARRB Group, Victoria,
Australia
Basher L.R., Painter D.J. (1997). Wind erosion in New Zealand. Paper presented at the International
Wind Erosion Symposium/Workshop 3-5 June 1997 Kansas State University, Manhattan, Kansas,
USA.
Basher, L.R., Barringer, J., Lynn, I.H., & Page, M.J. (2010). Accounting for the effects of mass-movement
erosion on soil carbon stocks: defining and mapping land prone to mass movement erosion.
Landcare Research Contract Report LC0910/086. Nelson: Landcare Research.
Blaschke P., Hicks D., Meister A. (2008). Quantification of the flood and erosion reduction benefits, and
costs, of climate change mitigation measures in New Zealand. Report prepared by Blaschke and
Rutherford Environmental Consultants for MfE. Wellington: Ministry for the Environment. iv +
76 p.
Brunetti, M.T., Peruccacci, S., Rossi, M., Luciani, S., Valigi, D., Guzzetti, F. (2010). Rainfall thresholds for
the possible occurrence of landslides in Italy. Natural Hazards and Earth System Science 10 (3),
447-458.
Carrara, A. and Pike, R.J. (2008). GIS technology and models for assessing landslide hazard and risk
(editorial). Geomorphology 94: 257–260.
Cascini, L. (2008). Applicability of landslide susceptibility and hazard zoning at different scales
Engineering Geology 102, 164–177.
Cepeda,J., Höeg, K., Nadim, F. (2010). Landslide-triggering rainfall thresholds: a conceptual framework.
Quarterly Journal of Engineering Geology and Hydrogeology 2010; 43, 69-84
Coker, R.J., Fahey, B.D., Payne, J.J. (1993). Fine sediment production from truck traffic, Queen Charlotte
Forest, Marlborough Sounds, New Zealand. Journal of Hydrology (N.Z.), 31, 56-64.
Dymond, J.R., Ausseil, A-G., Shepherd, J. D., Buettner, L. (2006). Validation of a region-wide model of
landslide susceptibility in the Manawatu-Wanganui region of New Zealand. Geomorphology,
74(1-4), 70-79.
Dymond, J.R., Betts, H.D., Schierlitz, C.S. (2010). An erosion model for evaluating regional land-use
scenarios. Environ. Model. Softw., 25(3), 289-298.
Environment BOP (2000). Erosion and Sediment Control Guidelines for Forestry.
Environment Waikato (2009). Operations Earthworks—Erosion and Sediment Control.
Eyles, G. O. (1983). The distribution and severity of present soil erosion in New Zealand. New Zealand
Geographer, 39(1), 12-28.

47
Fahey, B.D., Marden, M., Phillips, C. (2003). Sediment yields from plantation forestry and pastoral
farming, coastal Hawke's bay, North Island, New Zealand. Journal of Hydrology (N.Z.), 42, 27-38.
Fahey, B.D., Coker, R.J. (1989). Forest road erosion in the granite terrain of southwest Nelson, New
Zealand. Journal of Hydrology (N.Z.), 28(2), 123-141.
Fahey, B.D., & Coker, R.J. (1993). Road-related mass movement in weathered granite, Golden Downs
and Motueka forests, New Zealand: a note. Journal of Hydrology (N.Z.), 31, 65-69.
Fahey, B.D., Coker, R.J. (1992). Sediment production from forest roads in Queen Charlotte Forest and
potential impact on marine water quality, Marlborough Sounds. New Zealand Journal of Marine
and Freshwater Research, 26, 187-195.
Fell, R., Corominas, J., Bonnard, C., Cascini, L., Leroi, E., & Savage, W. Z. (2008). Guidelines for landslide
susceptibility, hazard and risk zoning for land-use planning. Engineering Geology, 102, 99-111.
Fransen, P.J.B., Phillips, C.J., & Fahey, B.D. (2001). Forest road erosion in New Zealand: overview. Earth
Surface Processes and Landforms, 26(2), 165-174.
Glade, T., Crozier, M., & Smith, P. (2000). Applying Probability Determination to Refine Landslide-
triggering Rainfall Thresholds Using an Empirical “Antecedent Daily Rainfall Model”. Pure and
Applied Geophysics, 157(6), 1059-1079. doi:
Glade, T. (1998). Establishing the frequency and magnitude of landslide-triggering rainstorm events in
New Zealand. Environmental Geology, 35(2), 160-174.
Guzzetti, F., Peruccacci, S., Rossi, M., Stark, C.P. (2007). Rainfall thresholds for the initiation of landslides
in central and southern Europe. Meteorology and Atmospheric Physics 98 (3-4), 239-267
Hicks, (1995). A way to estimate the frequency of rainfall-induced mass movements (note). Journal of
Hydrology (NZ) 33(1), pp59-67.
Kellar, G. and Sherar, J. (2003). Low Volume Roads Engineering: Best Management Practices Field Guide.
Produced for the U.S. Agency for International Development.
Lynn, I.H., Manderson, A.K., Page, M.J., Harmsworth, G.R., Eyles, G.O., Douglas, G.B., Mackay,
A.D.,Newsome, P.J.F. (2009). Land Use Capability Survey Handbook - a New Zealand handbook
for the classification of land (3rd ed.): AgResearch, Landcare Research, GNS Science
McMahon, S. (1995). Survey method for assessing site disturbance. Logging Industry Research
Organisation Project Report 54.Rotorua, New Zealand
LIRO (1993). Forest Code of Practice. New Zealand Logging Industry Research Organisation, Rotorua,
New Zealand.
MAF. (2007). East Coast Forestry Project Grant Guidelines (pp. 1-16). Gisborne: East Coast Forestry
Project, MAF.

48
Marden, M.; Rowe, L., Rowan, D. ( 2007). Slopewash erosion following plantation harvesting in pumice
terrain and its contribution to stream sedimentation, Pokairoa Catchment, North Island, New
Zealand. Journal of Hydrology (New Zealand), 46(2), 73-90.
Marden, M., Rowan, D., Phillips, C. (2006). Sediment sources and delivery following plantation
harvesting in a weathered volcanic terrain, Coromandel Peninsula, North Island, New Zealand.
Soil Research, 44(3), 219-232. doi: doi:10.1071/SR05092
Marden, M. (2004). Future-proofing erosion-prone hill country against soil loss and degradation during
large storms—have past lessons been heeded? New Zealand Journal of Forestry 11-16.
Marden, M., & Rowan, D. (1997). Vegetation recovery and indicative sediment generation rates by
sheetwash erosion from hauler-logged settings at Mangatu Forest. N.Z. Journal of Forestry,
42(2), 29-34.
MfE (2011). RFP0049-01. Request for proposals for the Ministry for the Environment for development
of a National Erosion Susceptibility Classification. 23 February 2011.
MSU Extension (2001). Montana State University Extension Service Water Quality BMPs for Montana
Forests. Publication reference: EB158. MSU Extension Publications, Bozeman MT.
NZFOA (2008). Best Environmental Practices Guide. NZ Forest Owner’s Association, Wellington, New
Zealand.
Rahardjo, H., Leong, E.C., Rezaur, R.B. (2008). Effect of antecedent rainfall on pore-water pressure
distribution characteristics in residual soil slopes under tropical rainfall Hydrological Processes
22 (4), 506-523.
Saunders, W., Glassey, P. (compilers) (2007). Guidelines for assessing planning policy and consent
requirements for landslide prone land. GNS Science Miscellaneous Series 7.
Sidle, R.C., Ochiai, H. (2006). Landslides: Processes, Prediction, and Land Use. Water Resources
Monograph, American Geophysical Union.
Stokes A., Norris, J.E., van Beek, L.P.H., Bogaard, T., Cammeraat, E., Mickovski, S.B., Jenner, A., Di Iorio,
A.,Thierry Fourcaud, T. (2008). Chapter 4, How vegetation reinforces soil on slopes in J.E. Norris
et al. (eds.), Slope Stability and Erosion Control: Ecotechnological Solutions. Springer, 65–118.
Thompson,C. (2011). HIRDS v3., High Intensity Rainfall Design System. http://hirds.niwa.co.nz/
Watson,A., Phillips, C., Marden, M. (1999). Root strength, growth, and rates of decay: root
reinforcement changes of two tree species and their contribution to slope stability. Plant and
Soil 217: 39–47, 1999.

49
Appendix 1. Conceptual Model of Erosion Risk. After Saunders and Glassey (2007).
Predisposing Factors
Slope Rock type and properties Soil type and properties Topographic position and drainage
Preparatory Factors
Forest Removal Undercutting Earthworks Mitigating factors
Reforestation Soil conservation works
FREQUENCY
Return period/probability of
Triggering Event
Rainfall Seismic event Vulcanism
Frequency of landslide events
Historical Data
CONSEQUENCE
Elements at Risk
Human life Property Roads, communications Services Waterways Natural Values
Temporal probability
People Vehicles Seasonal effects
Vulnerability
Likelihood of damage Scale of damage RISK
Calculation Evaluation Management (Resource Management Plans, Consents, BMP’s)
EROSION SUSCEPTIBILITY

50
Appendix 2. Maps of MAR plotted for a four-class ESC classification (Very high, high, moderate and low)

51
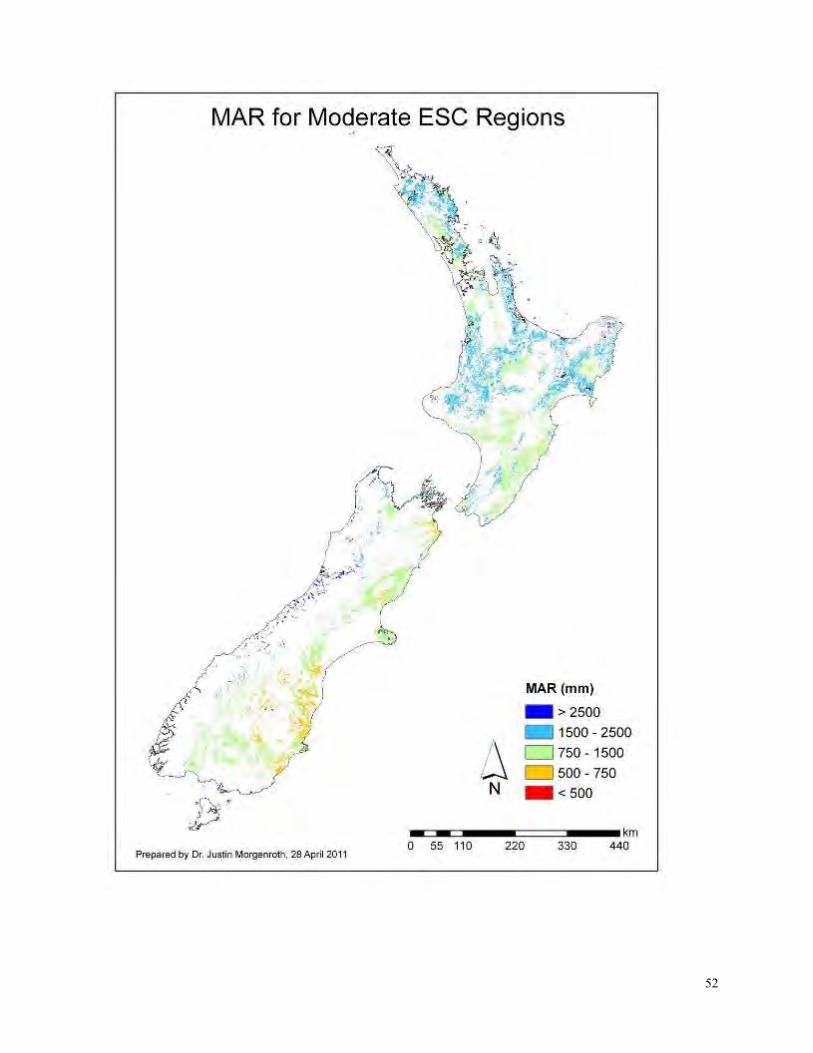
52

53