metis studies - european commission
TRANSCRIPT

METIS Studies October 2018
METIS Studies
Study S9
Cost-efficient
district heating development

2
Prepared by
Tobias Bossmann (Artelys) Pierre Attard (Artelys) Gaspard Peña Verrier (Artelys) Laurent Fournié (Artelys) Contact: [email protected]
This study was ordered and paid for by the European Commission, Directorate-General for Energy, Contract no. ENER/C2/2014-639. The information and views set out in this study are those of the author(s) and do not necessarily reflect the official opinion of the Commission. The Commission does not guarantee the accuracy of the data included in this study. Neither the Commission nor any person acting on the Commission’s behalf may be held responsible for the use which may be made of the information contained therein. © European Union, October 2018 Reproduction is authorised provided the source is acknowledged. More information on the European Union is available on the internet (http://europa.eu).
EUROPEAN COMMISSION
Directorate-General for Energy
Directorate A — Energy Policy
Unit A4 — Economic analysis and Financial
instruments
Directorate C — Renewables, Research and
Innovation, Energy Efficiency Unit C2 — New energy technologies, innovation and
clean coal
E-mail: [email protected]
European Commission
B-1049 Brussels

3
Table of Contents
Abbreviations and definitions ...................................................... 5
Abbreviations ............................................................................................ 5
METIS configuration................................................................................... 5
Executive summary ................................................................... 6
Introduction ............................................................................. 7
Review of large-scale heating technologies ................................... 8
Thermal boilers ......................................................................................... 8
Combined Heat and Power plants (CHP) ....................................................... 9
Electric boilers .........................................................................................10
Heat pumps .............................................................................................11
Geothermal plants ....................................................................................11
Solar thermal ...........................................................................................12
Heat storage ............................................................................................13
European district heating systems today and in 2030................... 14
State of play of district heating networks .....................................................14
Definition of 2030 network archetypes ........................................................20
Identification of the 2030 DH supply mix .....................................................32
Analysis of cost-efficient district heating with METIS .................... 37
Analysis of the 2030 base case ..................................................................37
Sensitivity assessment ..............................................................................41
Conclusions and outlook ........................................................... 48
References ............................................................................. 49


5
ABBREVIATIONS AND DEFINITIONS
ABBREVIATIONS
Abbreviation Definition
CAPEX Capital expenditures
CHP Combined heat and power
COP Coefficient of Performance
DH District heating
DHN District heating network
FOC Fixed operation and maintenance costs
KPI Key performance indicator
OPEX Operational expenditures
RES Renewable energy source
METIS CONFIGURATION
The configuration of the METIS model used in this study is summarised in Table 1.
Table 1 - METIS Configuration
METIS Configuration
Version METIS v1.4
Modules Heat module
Scenario METIS 2030 heat scenario
Time resolution Hourly (8760 consecutive time-steps per year)
Spatial granularity Member state

6
EXECUTIVE SUMMARY
Heat generation accounts for a major part of the European Union’s energy-related emissions and energy demand. The Clean Energy for all Europeans Package (CEP),
published by the European Commission in 2016, underlines that the heat sector is at the heart of the EU’s efforts to facilitate the transition towards a secure, competitive and sustainable energy system. In the same year, the Commission published its European Heating & Cooling Strategy which addresses the heat sector in particular and emphasizes the important role of district heating and combined heat and power in its ambitions to reduce energy demand and emissions.
In 2012, district heating covered 9% of the EU’s heat demand. Nearly 70% of all energy used for district heat generation were gas and coal. However, district heating allows to decarbonise heat generation via the integration of renewable energy sources (biomass, geothermal, solar), the utilisation of high-efficient heat generation plants (heat pumps, combined heat and power) and the exploitation of waste heat and renewable surplus electricity. Between 2012 and 2015, the use of biomass in European heat networks went up from 16 to 20%. Over the same period, heat generation from solar heating and
centralised heat pumps grew by 50%.
METIS is a mathematical model providing analysis of the European energy system. It simulates the operation of energy systems and markets on an hourly basis over a year, while factoring in uncertainties like weather variations. In order to determine the potential contribution of district heating networks to the reduction of energy demand and emissions, the district heat dimension is added to the METIS model. This study explains the extension
of the METIS tool, outlines the underlying information used for model development and scenario generation and demonstrates the functionalities of the new METIS heat module.
At the beginning, the study presents the outcomes of a literature survey. An overview of the large-scale heating technologies lists their major techno-economic parameters (e.g. technical configuration, cost data, efficiencies, typical operation modes and aspects of district heating network integration). The survey further sheds light on the current
situation of heat demand and district heating penetration across the different EU member states. A separate chapter is dedicated to the description of the configuration of individual networks and their evolution over time. This includes the description of examples of selected networks from different countries.
The METIS heat module aims at simulating in detail the (hourly) utilisation of district heating networks in a given year (in this study: 2030). It features two major functionalities. First, it allows to dimension the heat generation and storage assets of representative heat network archetypes that could potentially be existing in the EU in the year 2030 and that are used to represent future networks through clusters. The dimensioning takes into account techno-economic parameters as well as the network’s hourly heat demand profile. The overall configuration of the archetypes is inspired by an inventory of currently existing networks. The second functionality of the heat module comprises the assessment of the DH sector at a country-level for the entire EU. The METIS heat module comes with a
set of pre-defined key performance indicators in order to assess the operation of heat generation and storage assets as well as the DH-related (hourly and annual) heat supply mix, CO2 emissions and production costs, distinguished by fuel and technology. The heat module is calibrated for a given EU district heating scenario, which provides the overall fuel mix in the year 2030 for each country. Based on a comprehensive literature review of existing scenarios and the available data, a scenario from the EU project Mapping EU heat
supply is chosen. A dedicated matching algorithm translates the mix into a distinct number of networks per network archetype and country.
To illustrate the benefits of the newly added functionality of the METIS heat module, a case study is realised for the given scenario demonstrating the use of the key performance indicators and the facilities to exploit the scenario. A sensitivity assessment reveals the impact of a shift towards more heat pumps in residential district heating networks on future
energy demand, CO2 emissions and heat production costs.

7
INTRODUCTION
In the European Union (EU), buildings alone account for 40% of the overall energy consumption and 36% of the CO2 emissions (European Commission, 2018). The EU’s
strategy for a secure, competitive and sustainable thus addresses in particular the heat sector.
One pillar of heat supply is the utilisation of district heating networks. They rely on centralised heat generation units with decentralised consumers and allow for an efficient heat supply. In 2012, district heating networks (DHNs) covered around 9% of the EU’s residential and commercial heat demand. The main input fuel was natural gas (40%),
followed by coal (29%) and biomass (16%) (European Commission, 2016).
Already in 2004, the EU completed its Directive 2004/8/EC, known as Combined Heat and Power (CHP) Directive (European Commission, 2004). This Directive promotes the diffusion of district heating networks and the integration of high-efficient combined heat and power plants. In 2016, the European Commission published its EU Heating and Cooling Strategy (European Commission, 2016). It emphasizes the benefits of district heating and CHP and calls for the exploitation of the decarbonisation and efficiency potentials of new technological opportunities. This includes the utilisation of carbon-neutral heat generation (e.g. biomass and biogas boilers or CHP plants, solar thermal plants, geothermal plants), industrial waste heat recovery, new highly efficient heat generation technologies (e.g. large-scale heat pumps) and the heat generation from renewable surplus electricity.
These opportunities are important to consider in assessments that serve for current and upcoming policy-making. METIS is a mathematical model providing analysis of the European energy system1. It is developed on behalf of the European Commission and simulates the operation of energy systems and markets on an hourly basis over a year, while factoring in uncertainties like weather variations. For the above-mentioned reasons, it is important to integrate the district heating sector in the METIS tool. This will enable a realistic representation of the implications of the technological progress in district heating networks and the enhanced intertwining of the heat and electricity sectors. It will further
allow to test different configurations of the district heating networks in the EU member states. This allows to estimate the potential contribution of district heating networks to decarbonise the EU energy system and make it more competitive. Thereby, METIS provides a sound basis for the design and testing of adequate policy frameworks.
This study has five major objectives. It provides an overview of current and upcoming technologies (cf. Section 4) and DHN configurations (cf. Section 5.1). Based on this information, the study introduces potential network configurations that may exist in the year 2030 (cf. Section 5.2). In addition, a 2030 DH scenario is introduced (containing the annual energy mix for DH, distinguished by fuel and member state) which serves as basis for the hourly simulations with the METIS tool (cf. Section 5.3). The extension of the METIS tool towards the DH sector is at the core of this study and is explained in detail in dedicated text boxes located in Sections 5.2 to 6.1. For the purpose of demonstration, a short case study at the end of the report (cf. Section 6) illustrates the new model functionalities. It
showcases an analysis around the impact of different energy mixes in DH supply on emissions and costs with the new METIS module.
1 https://ec.europa.eu/energy/en/data-analysis/energy-modelling/metis

8
REVIEW OF LARGE-SCALE HEATING TECHNOLOGIES
The variety of large-scale heating technologies that can be incorporated in district heating (DH) networks is as large as the diversity in heat demand, which ranges from low to high
temperature, from constant to thermosensitive demand throughout the year. And due to the technological progress and the enhanced utilisation of sustainable heat sources, the technical solutions for DH systems become even more diverse, yet featuring different technological maturity and costs.
Prior to the description of existing and future DH network configurations, this Section provides an overview of available technologies and their main techno-economic parameters. All these parameters (output temperature, maturity, price) build a decision matrix for the design of future networks in which one technology could fit better than another (taking into account the distinct local constraints like the availability of renewable energy sources such as solar or geothermal). All data cited below are primarily based upon the JRC report Long term (2050) projections of techno-economic performance of large-scale heating and cooling in the EU (Grosse, Christopher, Stefan, Geyer, & Robbi, 2017).
THERMAL BOILERS
Boilers count among the most commonly used technologies in district heating networks. The operating principle is relatively simply and proven. Vapour is generated by burning a thermal fuel (usually natural gas, oil, biomass and waste). Via a heat exchanger, the heat is absorbed by a heat transfer fluid (generally water) which transports the heat through
the pipes of the district heating network to the consumers. In most networks the heat networks produce hot water or steam. Thermal boilers can deliver a wide range of temperature, from 40°C to above 100°C. The installed capacity of a unit varies typically between 40 and 250 MWth.
Thermal boilers are considered as mature technology, being in use already for several decades. As they feature a relatively high energy conversion efficiency (around 90%, cf. Table 2 for an overview of all heating technologies), simple technical design and are easily manageable, they are widely used in the majority of existing heat networks. For instance, in the DH network of Stockholm, out of 3 600 MWth installed capacities around 1 500 MWth are boilers.
Boilers are usually considered as peak technology or backup unit, as they are flexible and feature relatively low investment costs of 100 to 150 k€/MWth (depending on the fuel source)2. Yet, this is different for boilers fired with biomass. The investment cost for biomass boilers is higher than boilers running with other fuels. This implies that they need to run more hours during the year to cover the investment costs. Moreover, biomass is a local and carbon-neutral source and favourable for energetic independence. Hence, high full load hours of biomass boilers contribute to the sustainability and decarbonisation of district heating networks.
2 These costs relate to today’s installations but are likely to remain unchanged by 2030 as boilers are a fully mature
technology.

9
Figure 1 - Nominal investment costs in M€/MWth for large-scale heating technologies. Source: (Grosse, Christopher, Stefan, Geyer, & Robbi, 2017)
COMBINED HEAT AND POWER PLANTS (CHP)
In 2004, the European Commission adopted the Directive 2004/8/EC, often also referred to as the Combined Heat and Power (CHP) Directive (European Commission, 2004). This directive promotes the use of CHP in order to increase the energy efficiency of the European energy system and enhance security of supply.3 CHP technology can be considered as a highly energy efficient technology as energy losses
are substantially lower compared to the separate production of heat and electricity. While a CHP plant is less efficient in the individual production of heat and electricity compared to a classic thermal boiler or power plant, the overall system efficiency is higher as the waste heat generated during electricity production is transformed into a distinct heat product (complying with specific heat demand requirements, e.g. in terms of temperature level). The thermal efficiency of a CHP plant can be around 60% and the electric efficiency around
30%. The installed capacity of CHP plants varies between 200 and 1 000 MWth. There are two types of CHP plants. The first relies on a backpressure steam turbine, producing heat and electricity in a fixed ratio. The second makes use of a so-called extraction (condensing) steam turbine, featuring a variable ratio between power and heat output heat can be extracted between the different levels of power generation. CHP plants with a fixed ratio are mainly used in the industrial sector where heat production is a priority and heat demand is relatively constant whereas the second CHP type is useful in networks where heat demand varies throughout the year. As the share of non-flexible renewable energy power sources is supposed to further rise, CHP plants gain also in importance to balance the power system. If CHP plant operation is optimised from a power-perspective, the power output may be adjusted according to the actual requirements on the power market. That is power production is reduced in favour
of heat generation or vice versa, or power and heat output are adapted and surplus heat is feed into a dedicated heat storage and a lack in heat is compensated via a heat storage. Like boilers, CHP plants can run with different fuels, such as coal, gas, biomass or oil. In practice, gas currently is the most used fuel. Because of its relatively high investment costs
3 In 2012, the CHP directive was incorporated into the Directive 2012/27/EU on energy efficiency (Article 14).

10
(cf. Figure 1) CHP is considered as a base load technology. For instance, investment costs for coal and gas CHP range between 0.5 and 0.7 M€/MWth.
4 Biomass CHP is at least two
times higher than gas or coal CHP. In industrial networks, CHP plants typically run the whole year. In networks with primarily residential and commercial customers, the operating period is restricted from late autumn until early spring, when power prices are
sufficiently high to allow the CHP plants to obtain additional revenues. A more recent technology consists of so-called trigeneration plants. Trigeneration simultaneously produces heat, refrigeration and electricity (Marques, Hacon, & Tessarollo, 2010). There is an example of trigeneration in Montpellier, France. This plant consumes biomass and costed 16 M€ for a thermal capacity of 8 MWth (Ville de Montpellier, 2018). Table 2 - Overview of technical parameters for large-scale heating technologies. Source: (Grosse, Christopher, Stefan, Geyer, & Robbi, 2017)
Technology Efficiency Lifetime Production temperature
Waste CHP ηth =62%, ηel =19% 25 Whole range
Biomass CHP ηth =58%, ηel =27% 25 Whole range
Oil CHP ηth =58%, ηel =23% 30 Whole range
Gas CHP ηth =63%, ηel =24% 30 Whole range
Coal CHP ηth =58%, ηel =27% 35 Whole range
Waste Boiler 81% 30 Whole range
Biomass Boiler 84% 30 Whole range
Oil Boiler 81% 30 Whole range
Gas Boiler 87% 25 Whole range
Electric Boiler 99% 20 Whole range
Geothermal COP: 3.5 25 Low temperature
Heat pump COP: 3.5 25 Low temperature
Solar thermal fleet
n/a 25 Low temperature
Heat Storage 92% 25 Low temperature
ELECTRIC BOILERS
Electric boilers consist of an electric resistance or a set of electrodes to generate hot water or steam. The technology was originally more commonly used at a small scale as decentralised heat equipment for individual residential and commercial consumers,
providing sanitary hot water and space heat. It can hence be considered as a mature technology and the installed capacity can reach 30 MWth. Since electricity prices occasionally drop to zero or even below (in hours of renewable power oversupply), electric boilers are increasingly being considered for an application in DH networks, usually referred to as Power-to-Heat. Given the relatively simple technical design of electric boilers, investment costs are low. Instead, operational costs are comparatively high due to the
utilisation of electricity (a high-value energy carrier) at a conversion efficiency of about 95%. Consequently, electric boilers are typically installed as back-up heaters, to meet heat demand in the very few hours of extremely high heat demand, hence avoiding an over-dimensioning of other, more capital-intensive technologies (such as heat pumps) or to complement CHP-plants in DH networks, generating heat in hours of low electricity prices, when the utilisation of CHP plants becomes unprofitable.
For example, in Norway, when there is a hydro-power surplus, electric boilers are used in order to save fossil and flexible fuels. Through large electric boilers, excess power generation can be absorbed by district heating networks. In Sweden, an important electric
4 For the purpose of comparability, the CAPEX data for CHP plants which was provided by (Grosse, Christopher,
Stefan, Geyer, & Robbi, 2017) in costs per unit of electric capacity, have been transformed in costs per unit of heat
capacity, based on the ratio of electricity and heat output efficiency.

11
boilers integration has been experienced during the 1980s due to excess nuclear power generation (Averfalk H. , Ingvarsson, Persson, Gong, & Werner, 2017) (Averfalk H. , Ingvarsson, Persson, & Werner, 2014).
HEAT PUMPS
Heat pumps absorb heat from a low-temperature heat source, such as ambient air or the ground, and increase its temperature to release to a warmer environment. They are usually powered by electricity or gas. The main characteristic defining a heat pump is its Coefficient of Performance (COP). The COP describes the efficiency of the device that is the ratio between the electricity input and the useful heat output. This parameter depends mainly on the difference between the temperature of the both thermal sources: the COP drops with lowering heat source and rising heat supply temperatures. At moderate heat source temperatures, the COP ranges between 3 and 4 (i.e. the heat pump consumes 1 MWh of electricity to generate 3-4 MWh of useful heat). The most limiting factor for the integration of a heat pump in a DH network is the supply temperature of the network. While the supply temperature of heat pumps hardly exceeds
80°C, existing networks most commonly feature water temperature of 100°C and above (cf. Section 5.1.2). Yet, the latest generation of district heating networks operates at temperatures of 80°C and below, hence being compatible with heat pumps (see Section 5.3 for the long-term DH scenario). According to the Heat Roadmap Europe project, 25% to 30% of heat supplied by district heating networks could be generated by heat pumps by 2050 in the EU (David, Vad Mathiesen, Averfalk, Werner, & Lund, 2017). The heat pump use is encouraged because it can contribute to a significant reduction of primary energy
use (due to its high efficiency and even more if powered with RES-based electricity), and so to GHG emissions. Nowadays, the installed capacity in Europe for large scale heat pump plants for district heat networks is around 1 500 MWth, whereof 1 000 MWth being installed in Sweden. The average capacity of heat pumps is around 11 MWth (David, Vad Mathiesen, Averfalk, Werner, & Lund, 2017). Many projects are currently implemented in others countries. Heat pumps feature investment costs of about 0.7 M€/MWth. To recover their costs, heat
pumps typically need to run more than 7,000 hours per year and are thus considered as base load capacity. This minimum number of load hours can be lower if average electricity prices are low or heat prices are high.
GEOTHERMAL PLANTS
Although geothermal plants rely on heat pump technology to generate heat, they have specific constraints and are thus separately addressed. Geothermal heat is a natural source, like ambient heat but its potential depends significantly on the geographical location (cf. Figure 2). Further, there are various types of geothermal plants that differ principally with respect to the well depth.

12
Figure 2 – Overview of geothermal resources in Europe. Source: (Grosse, Christopher, Stefan, Geyer, & Robbi, 2017)
Geothermal plants use a pumping system. A heat carrier fluid circulates in a pipe in order to collect the heat stocked in the ground, implying additional power demand to run the pumps. A heat pump extracts the heat from the fluid and transfers it to the district heating
network. Unlike a simple heat pump system running with ambient heat, the temperature of the geothermal source is typically known and more stable throughout the year. This allows a more reliable forecasting of the COP and a more continuous operation of the plant. On the other hand, geothermal plants feature relatively high capital expenditures of about 1.2 M€/MWth, primarily due to the required drilling of 1 000 and 2 000 metres under ground. Hereby, the drilling represents a major risk for this technology, as the installation of a geothermal unit can require several drillings.
A new, still non-mature system of geothermal plants using hydraulic fracturing is currently under development: Enhanced Geothermal System features well depths of up to 10 km and can hence exploit geothermal heat sources where conventional geothermal plants cannot be used. Installed capacities of geothermal plants are comparable to those of heat pumps, between 10 and 50 MWth.
SOLAR THERMAL
Solar thermal plants consist of collectors that convert solar irradiance into heat. Given their utilisation of a renewable heat source they are considered carbon neutral. Two kinds of solar thermal collectors exist: flat plat collectors (FPC) and concentrators. FPC is the most commonly used technology with investment costs of around 450 k€/MWth. Light heats directly a surface conducting heat to fluid circulating in tubes under the surface. The output temperature is typically below 90°C. The Evacuated tube collectors with compound parabolic concentrator (ETC-CPC) is another system more efficient but also more expensive (650 k€/MWth). Two glass tubes are the main part of the Evacuated tube collectors. The vacuum substantially reduces heat losses. The utilisation rate is increased by additional mirror surfaces of the parabolic concentrator. The curved mirrors enable a higher temperature with the same surface.
Given the seasonality and intra-diurnal variation of the solar heat source, the utilisation and exploitation of a solar thermal plant is more efficient in combination with a seasonal storage and/or intraday storage. The storage enables to stock excess heat during midday hours and summer months and to keep the heat to cover heat demand at moment of low or no solar irradiance (i.e. evening and night time hours as well as autumn and winter time). Today, the majority of installed solar district heating systems operate with a storage. Solar thermal systems experience an increasing uptake in district heating networks. In Denmark, they rose from 613 000 m² of installed solar thermal collectors in 2015 to

13
1 000 000 m² in 2016. The installed capacity is expected to be around 8 000 000 m² in 2030 in Denmark (Galindo Fernandez, Roger-Lacan, Gährs, & Aumaitre, 2016). The biggest current installed capacity of solar plant of 110 MWth located in Silkeborg, Denmark (Grosse, Christopher, Stefan, Geyer, & Robbi, 2017). Leader countries in Solar District Heating (SDH) are Denmark, Sweden, Germany and Austria. The two main constraints for solar
thermal consist of its dependence on the solar irradiance and its space requirement.
HEAT STORAGE
A heat storage can transfer in a temporal dimension the heat production of a technology. This temporal dimension can have different scales. There are short-term storage systems that merely buffer the daily heat generation peak and cover demand in evening and night time hours and seasonal storage systems which can transfer heat from summer to winter, with a cycle of 6 month. These two temporal horizons define the technical parameters of the storage. The most common short-term heat storage is the hot water tank. It can optimize the daily heat production if the heat source is rather volatile (e.g. in the case of solar-thermal
generation) and/or balance the fluctuating heat demand, hence avoiding the over-dimensioning of the heat supply technologies. Storage can also be used to optimise the operation of CHP-based DH networks, i.e. maximising the revenues from the power sector while meeting heat demand in the network at lowest cost. Hot water tanks are a mature technology already used for district heating networks. The storage capacity can reach 1 500 MWh. Typical heat storages are designed for a storage discharge time of 5 to 12 hours. Heat losses are around 2% but they depend on the temperature of the water. The
investment cost is around 90 k€/MW for short term storages. Seasonal heat storage experiences an increasing use due to the enhanced utilisation of heat sources with varying heat availability throughout the year, such as solar thermal. During summer, when solar heat generation peaks and heat demand is lowest, surplus heat is used to “fill” the heat storage. In autumn and winter, when heat demand exceeds the actual solar heat generation, the remaining supply gap is met through heat from the storage. The most prominent example of applied seasonal storage is Denmark where
seasonal storage allows a coverage of heat demand of up to 50% with solar thermal heat for the solar district heating in Gram, Denmark (Galindo Fernandez, Roger-Lacan, Gährs, & Aumaitre, 2016).

14
EUROPEAN DISTRICT HEATING SYSTEMS TODAY AND IN 2030
This chapter provides a description of district heating systems in the EU today and possibly in the year 2030. It further introduces a scenario of the future district heating supply mix
that can be linked to the representation of individual networks.
STATE OF PLAY OF DISTRICT HEATING NETWORKS
5.1.1. THE ROLE OF DISTRICT HEAT IN THE EU
Most of the information outlined in this section is based on the Integrated Database of the European Energy Sector, IDEES, prepared by the Joint Research Centre, JRC (Mantzos, et al., 2018).5 The IDEES database contains exclusively historical data. If a given information does not originate from the IDEES database, this is explicitly stated.
In 2015, the heat demand of the 28 EU member states reached about 3 500 TWhth for
residential and tertiary sectors whereof 2 500 TWhth were dedicated to residential heat consumers. The residential heat demand includes space heating and sanitary hot water provision, with the bulk of demand being related to space heating (75%). In addition, more than 2 000 TWhth were dedicated to the industry in Europe (Fraunhofer ISI; TEP Energy; University Utrecht; ARMINES, 2017). The heat demand of each member state depends on the population, the economic activity and the temperature, as shown on Figure 3.
Figure 3 - Useful heat demand in the residential and tertiary sectors (for space heating and sanitary hot water) across all EU member states. Source: IDEES, 2018
The role of DH in the heat supply mix depends on each country and differs a lot across the EU. Figure 4 shows the overall heat demand for district heating (in nominal values, blue bar) and the share of heat demand that is covered by district heating (read frame) in 2015.
5 A preliminary version of the database was used for the preparation of this report.

15
Figure 4 - District heat for the residential and tertiary sectors in 2015 across all EU member states. Source: IDEES, 2018
It can be observed that in nominal values, Germany, Poland and Sweden feature the highest heat demand covered by district heating, with 63, 56 and 43 TWhth, respectively. For Germany, this represents 9% of the total German residential and commercial heat demand. However, in relative terms, other countries feature significantly higher shares. These are in particular Nordic and Eastern European countries. In Denmark, Sweden and
Finland, district heat represents more than 40%, in the Baltic countries (Latvia, Estonia and Lithuania) more than 30% of their heat demand. In western countries instead, such as the UK, Portugal or Belgium, merely 1% of the heat demand is covered by DH.6
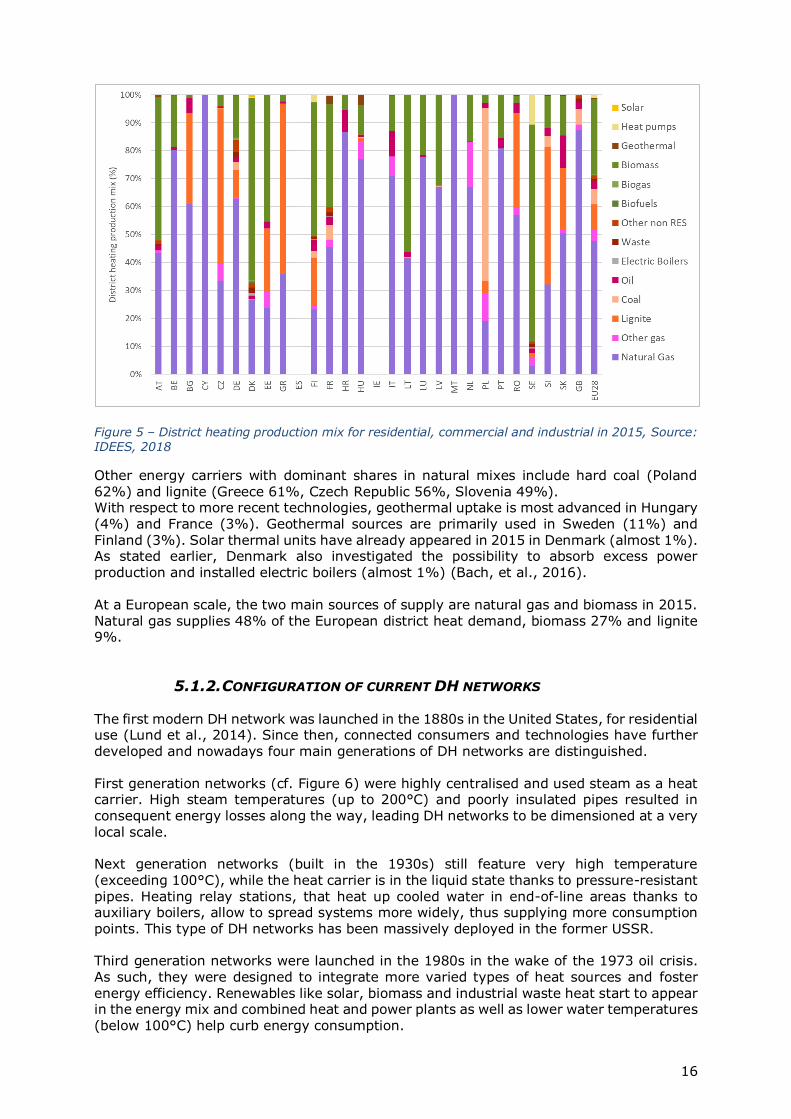
Regarding fuel mix of district heating, the situation is similarly heterogenous between the different countries. Figure 5 clearly shows that gas is the dominant energy carrier. Three out of four EU member states exhibit a share of gas in residential and commercial heat
demand of more than 33%. The second most important energy carrier is biomass, which is primarily used in the Nordic (Sweden 77%, Denmark 65%, Finland 48%) and in the Baltic countries (Lithuania 56%, Estonia 45%, Latvia 33%).
6 Ireland and Spain dispose of a very limited number of DH networks, covering less than 1% of heat demand. For
want of data in the IDEES database, no information is given for these countries in this report.
16
Figure 5 – District heating production mix for residential, commercial and industrial in 2015, Source: IDEES, 2018
Other energy carriers with dominant shares in natural mixes include hard coal (Poland 62%) and lignite (Greece 61%, Czech Republic 56%, Slovenia 49%). With respect to more recent technologies, geothermal uptake is most advanced in Hungary (4%) and France (3%). Geothermal sources are primarily used in Sweden (11%) and Finland (3%). Solar thermal units have already appeared in 2015 in Denmark (almost 1%). As stated earlier, Denmark also investigated the possibility to absorb excess power production and installed electric boilers (almost 1%) (Bach, et al., 2016). At a European scale, the two main sources of supply are natural gas and biomass in 2015. Natural gas supplies 48% of the European district heat demand, biomass 27% and lignite 9%.
5.1.2. CONFIGURATION OF CURRENT DH NETWORKS
The first modern DH network was launched in the 1880s in the United States, for residential use (Lund et al., 2014). Since then, connected consumers and technologies have further developed and nowadays four main generations of DH networks are distinguished.
First generation networks (cf. Figure 6) were highly centralised and used steam as a heat carrier. High steam temperatures (up to 200°C) and poorly insulated pipes resulted in consequent energy losses along the way, leading DH networks to be dimensioned at a very
local scale.
Next generation networks (built in the 1930s) still feature very high temperature (exceeding 100°C), while the heat carrier is in the liquid state thanks to pressure-resistant pipes. Heating relay stations, that heat up cooled water in end-of-line areas thanks to auxiliary boilers, allow to spread systems more widely, thus supplying more consumption points. This type of DH networks has been massively deployed in the former USSR.
Third generation networks were launched in the 1980s in the wake of the 1973 oil crisis. As such, they were designed to integrate more varied types of heat sources and foster energy efficiency. Renewables like solar, biomass and industrial waste heat start to appear in the energy mix and combined heat and power plants as well as lower water temperatures (below 100°C) help curb energy consumption.

17
Fourth generation DH networks are designed to provide heat via low temperature water to newly constructed eco-districts with well-insulated houses (featuring low specific energy demand). Further, these networks are specifically designed to interact with the power sector, incorporating so-called power-to-heat installations (i.e. electric boilers or heat pumps, cf. Section 4) to make use of decarbonise electricity and integrate power surplus
from intermittent renewables. Additionally, this latest generation of networks fosters distributed heat generation since the networks are dimensioned to enable connected consumers equipped with, say, individual solar heating systems to reinject hot water in the pipes.
Figure 6 - Overview of district heating network generations. Source: (Lund et al., 2014)
Table 3 provides a non-exhaustive list of existing district heating networks in Europe. These networks illustrate the different generations of networks previously introduced and serve
as basis to subsequently derive generic archetypes that are used for the DH modelling (cf. Section 5.2). The networks listed in the table are sorted from old, 2nd generation networks with important heat demand to more recent 3rd and 4th generation district heating networks.7 The district heating network in Chemnitz (Germany) was built in 1930. Typically for networks from this period and in this area, it relies primarily on lignite (which is regionally
available) that is burnt in a CHP plant. The network is dimensioned to meet an important heat demand of about 1 TWhth (INETZ, 2018; Bossmann, 2008).
7 For selected district heating networks, the underlying sources only provide installed capacities. These capacities
were translated into energy production by applying typical full load hours, based on (Grosse, Christopher, Stefan,
Geyer, & Robbi, 2017) in order to determine the served heat mixes.

18
Even taller and of similar age is the DH network from Copenhagen (Denmark), which is one of the biggest district heating in the world still increasing in term of heat consumption (Galindo Fernandez, Roger-Lacan, Gährs, & Aumaitre, 2016). In contrast to Chemnitz, biomass as low-carbon heat source has been added to the supply mix in the past.
The district heating network in Brescia (Italy) represents a medium-size network. Its peculiarity consists of the high share of waste that is transformed in heat and power via a CHP plant of 180 MWth. Waste is complemented by gas and coal. In addition, surplus heat (about 10 MWth) is recovered from a local steel industry (Galindo Fernandez, Roger-Lacan, Gährs, & Aumaitre, 2016).
The district heating networks from Tartu (Estonia) or Lyon (France) have been built several
decades ago, but rely nowadays on cleaner heat technologies (Galindo Fernandez, Roger-Lacan, Gährs, & Aumaitre, 2016). In 2015, more than 90% of heat delivered by the network in Tartu stemmed from biomass, a local resource. In Lyon, half of the heat is generated in efficient CHP plants (Agence Locale de l'Energie du Grand Lyon, 2016; Energie Lyon Métropole, 2018). Another 45% is waste heat from industrial plants close-by. These networks illustrate well that the supply mix of district heating networks and the possibilities
to decarbonise the heat supply mix depend importantly from the local situation, e.g. the availability of local resources (e.g. biomass), required heat temperature level or waste heat that can be recovered from local factories.
Gram in Denmark is an example of a recent 4th generation DH network integrating solar district heating. The network works at low temperature and is equipped with a storage unit in combination with a gas boiler to meet the peak load. It is one unit of storage pit of
122 000 m3 (8 500 MWhth) which can stock hot water between 20°C and 74°C. The seasonal storage stores heat in summer and releases it in winter (Galindo Fernandez, Roger-Lacan, Gährs, & Aumaitre, 2016). This example is particular as more than half of the heat delivered stems from the solar thermal source but there are other examples in Europe like in Vransko (Slovenia) where solar thermal meets about 10% of the overall heat demand (Indeal project, 2018).
The district heating network of Saclay near Paris (France) illustrates an example of a network relying to an important extent (60%) on a geothermal source whereas the HafenCity network in Hamburg is an example of a district heating network combining heat pumps and biogas CHP as baseload capacities and biomass and gas boilers for mid-merit and peak demand (Galindo Fernandez, Roger-Lacan, Gährs, & Aumaitre, 2016).

19
Table 3 - Examples of existing district heating networks in Europe
Gen. Location Constr. Heat demand Served heat mix
2-3 Chemnitz
(DE) 1930
- 1 TWhth
- Heat peak in 2008: 353 MWth
- Mainly residential
and tertiary
consumers
3 Copenhagen
(DK) 1923
- 10 TWhth - 93% residential - 6% tertiary - 1% local industry
3 Brescia (IT) 1972
- 1 TWhth
- 21 000 buildings
supplied
- 80% residential
- 20% tertiary
3 Tartu (EE) 1967
- 500 GWhth
- Heat peak in 2015:
328 MW
- Mainly residential
(80 000 buildings)
3 Lyon (FR) 1930
- 1 TWhth
- 50 000 households
- Residential and
commercial
consumers
4 Gram (DK) 2015
- 20 GWhth
- 1 171 residential
buildings
- Low temperature
- Seasonal storage
- 62% solar share
4 Paris Saclay
(FR) 2017
- 40 GWhth
- Heat peak: 37 MWth
- Mostly tertiary
- Two geothermal drills
700m depth at 30°C
- Storage
4
Hamburg
Hafen City
(DE)
2014
- 6 GWhth
- Ecodistrict with a low
temperature heat
demand (30% to 45%
below building code
requirements)

20
Based on the observations from the analysed networks, one may draw the following conclusions:
Coal plants are used in old district heating networks. Typically, the networks using coal meet high heat demand, such as in Dresden (Germany). Coal is used mostly in CHP plants, combined with mid-merit capacities like biomass and oil or gas for the peak load.
Biomass experiences an increasing utilisation in CHP plants and boilers, usually running in base load. In Tartu (Estonia), a biomass CHP plants runs in combination with a biomass boiler. Biomass is primarily used in areas where it is locally available.
Gas is typically used in two types of configurations, in CHP plants as mid-merit capacity or in boilers as peak capacity. Compared to coal, lignite and oil, gas features the lowest CO2 emissions of all fossil sources. For this reason and given the relatively high oil price, oil is incrementally disappearing from heat networks.
Heat pumps provide baseload, typically in combination with biomass boilers, gas boilers (Hamburg HafenCity, Germany), biomass/waste CHP (Stockholm, Sweden) or geothermal (Paris Saclay, France). Thermal storage units are used to avoid over-dimensioning of heat pumps and minimise capital expenditures.
Geothermal plants typically run as baseload, given the constant temperature of the heat source throughout the whole year. They are frequently used in combination with heat
pumps, and a boiler to meet peak heat demand such as in Saclay, FR.
Heat storage units experience an increasing deployment in different types of district heating. Storage capacities can optimise the use of CHP plants or heat pumps (Copenhagen, Denmark or Paris Saclay, France) and are usually necessary in combination with solar thermal plants (Gram, Denmark).
Industrial waste heat represents typically a constant heat source that is regularly integrated in large-scale DH networks that are located close to centralised industrial plants (Lyon, France or Barcelona, Spain). It is complemented by a more flexible boiler to meet peak heat demand.
Generally speaking, the design and dimensioning of networks incorporating new and clean technologies like heat pumps, geothermal or solar sources, are often embedded in an
urbanistic planning procedure taking into account many parameters such as the required temperature level of heat demand, the presence or absence of waste heat sources or opportunities of heat demand response. The previous remarks are thus to be understood as general conclusions that are not necessarily applicable to specific networks.
DEFINITION OF 2030 NETWORK ARCHETYPES
The previous section reveals that the diversity of heat networks is immense and that generalising conclusions do not necessarily comply with the configuration of each and every single network. The network archetypes that are introduced in the following as generic representation of future DH networks in order to enable DH modelling at a country and EU level should hence be understood as an approximative representation, bearing all the limitations related to the heterogeneity of the European DH sector.
The network archetypes derived from the previous analysis serve as a basis to dimension and simulate the hourly functioning of networks by means of the METIS heat module at the horizon 2030. That is, the archetypes are conceived as representative networks that should allow to cluster all networks existing in 2030 in the EU28+6. There are nine base archetypes that are inspired by the most common configurations observed among existing

21
networks as well as three auxiliary archetypes that are required to adequately represent the member states’ 2030 DH supply mix (cf. Section 5.3).
In the following, dedicated text boxes will give information about the modelling of DH networks in the METIS heat module, while the plain text describes the nine major
archetypes and gives an overview of the three auxiliary archetypes. The share of each archetype in the overall number of existing networks in the EU and in the overall EU heat supply via district heating is determined for a distinct 2030 scenario. This is explained in more detail in Section 5.3.3.
METIS heat module – Dimensioning of the archetypes’ heat supply capacities
The METIS heat module has for objective to reproduce the hourly functioning of different,
generic DH network archetypes (i.e. the hourly dispatch of the different connected heat
sources to meet demand) that could potentially be installed in different countries of the EU
in 2030. The METIS heat module performs two calculations at a time: (1) The optimisation
of peak and storage capacities for a pre-configured archetype with given hourly demand
and a given set of base-load and mid-merit capacities. (2) The hourly dispatch of all heat
generation and storage assets to meet the archetype’s heat demand at lowest costs.
Hourly heat demand profiles Each archetype has been defined to serve either residential and commercial or industrial heat demand, which determines the heat load profile. Residential and commercial consumers use DH networks mainly for space heating and in addition for sanitary hot water
supply which results in a high temperature sensitivity of the heat demand, peaking typically in winter months (cf. Figure 7). The heat demand profile for residential and commercial archetypes is derived from historic data of a French DH network operator, considering the French hourly temperature from 2015. Industrial heat consumption is substantially dedicated to manufacturing, which explains its much more constant profile over the year, with slightly higher levels on working days than on weekend days. The hourly annual industrial heat demand profile was inspired by the
2015 electricity demand profile of the French industry sector, as published by the French transmission system operator RTE (RTE, 2018).
Figure 7 - Hourly heat demand profile for the industrial and the residential sector. Source: French DHN operator, (RTE, 2018)

22
Peak capacity investment and dispatch optimisation
For each archetype, the annual heat demand plus a set of baseload and mid-merit capacities
are defined (including their individual capacities) based on the analysis of existing networks
and future network configurations.
The annual heat demand is applied to the respective hourly heat profile (residential or
industrial). Based on this pre-configuration, the METIS heat module jointly determines the
cost-optimal dimensioning of the peak asset (and storage if considered available) and the
hourly dispatch of all heat generation (and storage) technologies. The capacity dimensioning
takes into account the capital expenditures (CAPEX) and fixed operation and maintenance
costs (FOC) of the peak technology, while the dispatch optimisation is merely based on
variable heat generation costs, including fuel costs, operational costs and CO2-related costs
(based on the literature review given in Section 4).
In the end, the METIS optimisation module assigns to the peak plant the capacity value
that provides the highest welfare over the year.

23
5.2.1. BUSINESS-AS-USUAL
The Business-as-usual archetype (3rd generation) can be considered among the most wide-spread existing networks. This network is inspired by Chemnitz’s DH system that started to operate in the 1980s, serving around 1 million consumers, and other comparable
networks from the same period and of a similar size (like Dresden). It relies primarily on coal and gas capacities and supplies residential and tertiary consumers (500 GWhth annually).
As CHPs are designed to operate in a relatively continuous way, the coal asset is set to work from late autumn to early spring only. In summer, heat production relies solely on
the gas boiler, while this asset is used as peaker for the remainder of the year.
Business-as-usual – 3rd Generation
Type of consumers Annual heat demand
Residential8 500 GWh/y
Asset Capacity Full load
hours
Gas boiler 110 MW
(optimised) 1 400
Coal CHP 80 MW 4 350
8 The residential consumer type comprises consumers from the residential and the tertiary sectors.

24
5.2.2. GETTING GREEN
The Getting green archetype is designed to represent networks that were installed at least some 30 to 40 years ago (3rd generation) but shifted to a more environmentally friendly generation mix since then. It relies primarily on waste (in CHP) and biomass-based heat
generation, with gas as peak capacity. The archetype is inspired from the medium-sized city of Brescia (Italy), that supplies 21 000 buildings with heat and where waste generates 60% of the total supply.
Waste is disposed all year long and cannot be stocked until winter for later burning. Hence, the waste CHP is dimensioned so it can run at all time without causing too much economic loss on warm days. In summer, heat production may exceed demand but the sale of
generated power ensure for revenues from the power market. The biomass boiler operates as mid-merit capacity, while the gas boiler is used in winter only, to meet high seasonal demand.
Getting green – 3rd Generation
Type of consumers Annual heat demand
Residential 65 GWh/y
Asset Capacity Full load
hours
Gas boiler 12 MW
(optimised) 600
Biomass boiler 4 MW 3 700
Waste CHP 6 MW 7 000

25
5.2.3. BIOMASS ONLY
The Biomass only archetype relies completely on biomass. It was inspired by the district heating network from Tartu (Estonia), a medium-sized network where biomass covers 95% of the overall heat demand (the remainder is met with gas). In the Biomass only archetype,
biomass is used via two different technologies. A biomass CHP plant runs as baseload capacity, providing nearly three quarter of the overall heat supply, in particular from autumn to early summer. In periods of very high heat demand and in summer time, when heat demand is comparatively low, heat demand is met additionally or exclusively by a biomass boiler that has roughly the same thermal capacity than the biomass CHP plant.
The Biomass only archetype is likely to disseminate in countries with important biomass
potentials, such as the Scandinavian countries.
Biomass only– 3rd Generation
Type of consumers Annual heat demand
Residential 90 GWh/y
Asset Capacity Full load
hours
Biomass boiler 16 MW
(optimised) 1 400
Biomass CHP 15 MW 4 350

26
5.2.4. BIOMASS AND GAS
The Biomass and gas archetype is designed to account for the increasing number of mainly biomass-fuelled DH networks of medium size (65 GWhth/year). It is composed of a biomass boiler supplemented by a gas peaker, with biomass producing 97.5% of the heat supplied.
The gas boiler only comes into action on cold winter days when the biomass asset is not sufficient to meet demand.
Biomass and gas – 3rd Generation
Type of consumers Annual heat demand
Residential 65 GWh/y
Asset Capacity Full load
hours
Gas boiler 10 MW
(optimised) 170
Biomass boiler 15 MW 4 250

27
5.2.5. SOLAR
Solar heating systems are expected to grow in significance by the year 2030. This archetype is a simplified version of Gram’s DH network (Denmark). Since solar heating is not fully available all year long, it is accompanied by a biomass boiler, particularly
important to meet demand when there is a lack in solar-based heat supply, and a gas peaker for winter time. A heat storage has been dimensioned in order to maximize the utilisation of the solar thermal heat source, especially in summer when production is high but does not coincide with demand. On very cold days, the storage asset is leveraged with gas-produced heat, allowing for a reduced dimensioning of the gas boiler.
Solar – 4th Generation
Type of consumers Annual heat demand
Residential 35 GWh/y
Asset Capacity Full load
hours
Gas boiler 7 MW
(optimised) 850
Biomass boiler 5 MW 4 900
Heat storage 1.4 MW
(optimised) 450
Solar 3 MW 1 600

28
5.2.6. HEAT PUMP
Heat pumps are an efficient means of reducing DH systems’ energy consumption through their high efficiency (coefficient of performance of around 3.6). Unless the electricity carbon content is really high, the installation of heat pumps helps reducing carbon emissions. As
heat pumps are characterised by high CAPEX, they are dimensioned to feature high full load hours. Hence, heat pumps represent the baseload capacity, complemented by more flexible biomass and gas boilers. These thermal assets do not run in summer since heat pumps generate enough heat to match demand. The Heat pump archetype was inspired by Hamburg’s HafenCity eco-district (Germany) heat network, that supplies consumers featuring much lower-than-usual heat needs (cf. Table 3).
Heat pump – 4th Generation
Type of consumers Annual heat demand
Residential 145 GWh/y
Asset Capacity Full load
hours
Gas boiler 32 MW
(optimised) 550
Biomass boiler 15 MW 5 700
Heat pumps 10 MW 6 800
29
5.2.7. GEOTHERMAL
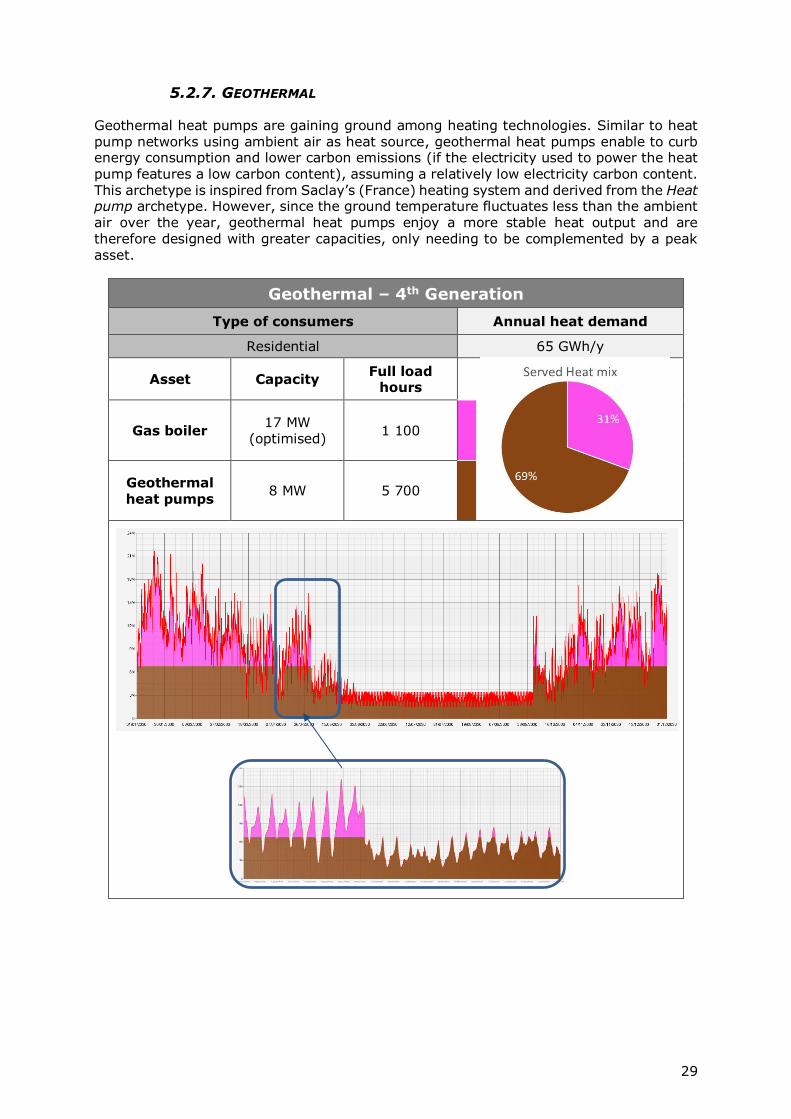
Geothermal heat pumps are gaining ground among heating technologies. Similar to heat pump networks using ambient air as heat source, geothermal heat pumps enable to curb energy consumption and lower carbon emissions (if the electricity used to power the heat
pump features a low carbon content), assuming a relatively low electricity carbon content. This archetype is inspired from Saclay’s (France) heating system and derived from the Heat pump archetype. However, since the ground temperature fluctuates less than the ambient air over the year, geothermal heat pumps enjoy a more stable heat output and are therefore designed with greater capacities, only needing to be complemented by a peak asset.
Geothermal – 4th Generation
Type of consumers Annual heat demand
Residential 65 GWh/y
Asset Capacity Full load
hours
Gas boiler 17 MW
(optimised) 1 100
Geothermal
heat pumps 8 MW 5 700

30
5.2.8. INDUSTRY - COAL
Industrial consumers have specific needs like high-temperature water or vapour and typically feature a relatively constant demand throughout the year. This implies the installation of large assets with low operational costs that can ensure continuous heat
production. Typical networks were installed 30 years ago or more and designed to provide affordable and reliable energy disregarding the environmental impacts.
The Industry – coal archetype thus represents a conventional industrial network where coal meets the bulk of demand and runs as baseload capacity (87% of total heat supply). A biomass CHP plant runs likewise continuously, but at lower capacity. A gas boiler is
installed to meet peak demand.
Industry - coal– 3rd Generation
Type of consumers Annual heat demand
Industrial 450 GWh/y
Asset Capacity Full load
hours
Gas boiler 10 MW
(optimised) 2 050
Biomass CHP 5 MW 7 900
Coal CHP 50 MW 7 900

31
5.2.9. INDUSTRY - GAS ONLY
In addition to the Industry – coal archetype, the Industry – gas only archetype is introduced. While the heat demand profile is identical, the latter features a lower heat demand (190 vs 450 GWh), and relies solely on gas-based heat generation. A CHP plant is
dimensioned to meet the bulk of demand that occurs quasi-constantly (even on weekends and during night time). A complementary gas boiler of much lower capacity is installed to meet occasional peak demand during day time of working days. It covers merely 2% of the annual heat demand and features full load hours of less than 1 500 hours per year.
Industry – gas only – 3rd Generation
Type of consumers Annual heat demand
Industrial 190 GWh/y
Asset Capacity Full load
hours
Gas boiler 3 MW
(optimised) 1 450
Gas CHP 23 MW 7 900

32
5.2.10. AUXILIARY ARCHETYPES
National generation mixes may vary substantially from a country to another and it is obviously impossible to explain the 2030 heat supply mix of all EU countries with the previously described archetypes. As a consequence, three additional auxiliary archetypes
were designed following the same methodology (Table 4) with the aim to provide a more accurate approximation of the future national DH heat supply mixes. For instance, one of them was designed with a single type of fuel, in order to avoid conflicts when the archetype’s energy mix is not consistent with a country’s fuel shares. The methodology and the detailed results of the matching algorithm (between the archetypes and the national heat supply mixes) is given in Section 5.3.3.
Table 4 - Main characteristics of auxiliary network archetypes
Archetype Consumers Annual heat demand
Served heat mix
Biomass and oil Residential 130 GWh Biomass CHP (42%)
Biomass boiler (50%)
Oil peaker (8%)
Gas only Residential 65 GWh Gas CHP (78%)
Gas peaker (22%)
Waste and biomass
Residential 65 GWh Waste CHP (55%)
Biomass peaker (45%)
IDENTIFICATION OF THE 2030 DH SUPPLY MIX
The METIS heat module requires (similar to the power and gas modules) a scenario framework from an external source, providing information about the overall heat demand and supply mix by member state. The following sections provide an overview of the different sources taken into consideration and how the annual supply and demand data is
matched with the archetypes introduced in the previous Section.
5.3.1. EUROPEAN COMMISSION DATA
Typically, METIS relies on the European Commission scenarios, such as the EUCO30 or the Reference scenario.9 The data set on district heating provided by the European Commission
allows for a distinction between different fuels and fossil heat generation technologies (e.g. industrial boilers, DH boilers and CHPs). However, no difference is made between electricity used by resistances and electricity as an input for heat pumps. Moreover, some concerns emerged over data consistence. The dataset is thus not considered as adequate for the utilisation in this study.
5.3.2. FTT:HEAT DATA
A study prepared by Radboud University and Cambridge Econometrics analyses the future technology transformation pathways for residential heating by applying the bottom-up model FTT:Heat. It aims at providing explicit representations of European residential heating choices up to the year 2050 (Radboud University, Cambridge Econometrics, 2017). Several scenarios including market competition, climatic conditions and policies are simulated over a baseline scenario, as well as corresponding heat demand projections, distinguished by EU member states. However, the results dataset discloses district heating
9 See for instance the METIS Technical Note 1 that explains how the METIS power system module is calibrated
with the EUCO27 scenario dataset:
https://ec.europa.eu/energy/sites/ener/files/integration_of_primes_scenarios_into_metis.pdf

33
only as an aggregate (next to other heat sources to meet overall heat demand) without distinguishing the fuel and technology mix of district heating (which is a major prerequisite for the integration in the METIS heat module).
5.3.3. MAPPING EU HEAT SUPPLY DATA
In 2017, in the framework of the Mapping EU heat supply project Fraunhofer ISI and partners prepared scenarios for heating and cooling demand supply in the EU until the year 2030 (Fraunhofer ISI; Fraunhofer ISE; IREES; Observ'ER; TU Wien; TEP Energy, 2017). This dataset was created by means of model-based simulations of heat supply mixes, including district heat, in all EU member states. The report assesses the contribution of district heating to meet residential, industrial and tertiary heat demand, as well as national district heating fuel mixes. Individual district heating technologies (such as CHP plants or boilers) are not distinguished.
This dataset appears to be the most comprehensive and consistent one and is thus used as a basis for the METIS heat module. Shares of technologies in archetypes, dimensioned after actual European networks, will come as a consequence of fuel mixes and archetypes structures.
Figure 8 - The technology mix for the district heating demand in the EU member states, Norway, Switzerland and Iceland for the year 2030. Source: (Fraunhofer ISI; Fraunhofer ISE; IREES;
Observ'ER; TU Wien; TEP Energy, 2017)
Under the given Current policy scenario, district heating would sharply develop in certain
countries, but its share in Europe’s heat demand is expected to stay around 9%. The scenario shows a shift in district heating systems from fossil fuels-based technologies, which provide 75% of supplied heat in 2012, to renewable sources, expected to account for 47% of heat generated by 2030 (cf. Figure 8). This renewable energy sources development represents a 38% surge. The main heat sources in the scenario consist of biomass, natural gas, coal and waste.
34
METIS heat module – Matching national heat supply mixes with archetypes
To enable a simulation of the hourly operation of district heating networks in all EU
member states, it is necessary to match the annual heat supply mix given by (Fraunhofer
ISI; Fraunhofer ISE; IREES; Observ'ER; TU Wien; TEP Energy, 2017) with the archetypes
that are made available in the METIS heat module. For this purpose, a simplified
optimisation approach is applied that determines the distribution of networks across the
12 archetypes (7 main + 5 auxiliary), in order to match the heat supply mix to the best
extent possible. This approach consists of two major steps:
Data harmonisation
The fuels of the annual energy consumption data provided by (Fraunhofer ISI;
Fraunhofer ISE; IREES; Observ'ER; TU Wien; TEP Energy, 2017) are clustered in order
to match the list of fuels considered in METIS’ archetypes (i.e. biomass, gas, coal, waste,
electricity and oil). Since archetypes have been designed in terms of supplied heat, the
technology specific conversion efficiencies are factored in in order to obtain energy input
to DHNs. Shares of industrial consumption are computed for every country based on the
data from (Fraunhofer ISI; Fraunhofer ISE; IREES; Observ'ER; TU Wien; TEP Energy,
2017).
Optimisation of network allocation to archetypes
The determination of the number of networks per archetype for each country is
formulated as a minimisation problem. The objective of the optimisation is, for every
fuel, to minimise the deviation between the cumulated fuel demand across all archetypes
and the national demand of the same fuel. The least squares method is applied to
quantify the deviation. The minimisation is carried out for every country, with special
weights assigned to marginal consumptions (e.g. oil, electricity) in order to bound
relative errors. With the aim of reproducing sectorial shares (residential plus tertiary vs.
industrial) of demand, the deviation of industrial consumption is integrated into the
objective function of error minimisation. The output of this process provides for each
country and each of the 12 archetypes the number of allocated networks.
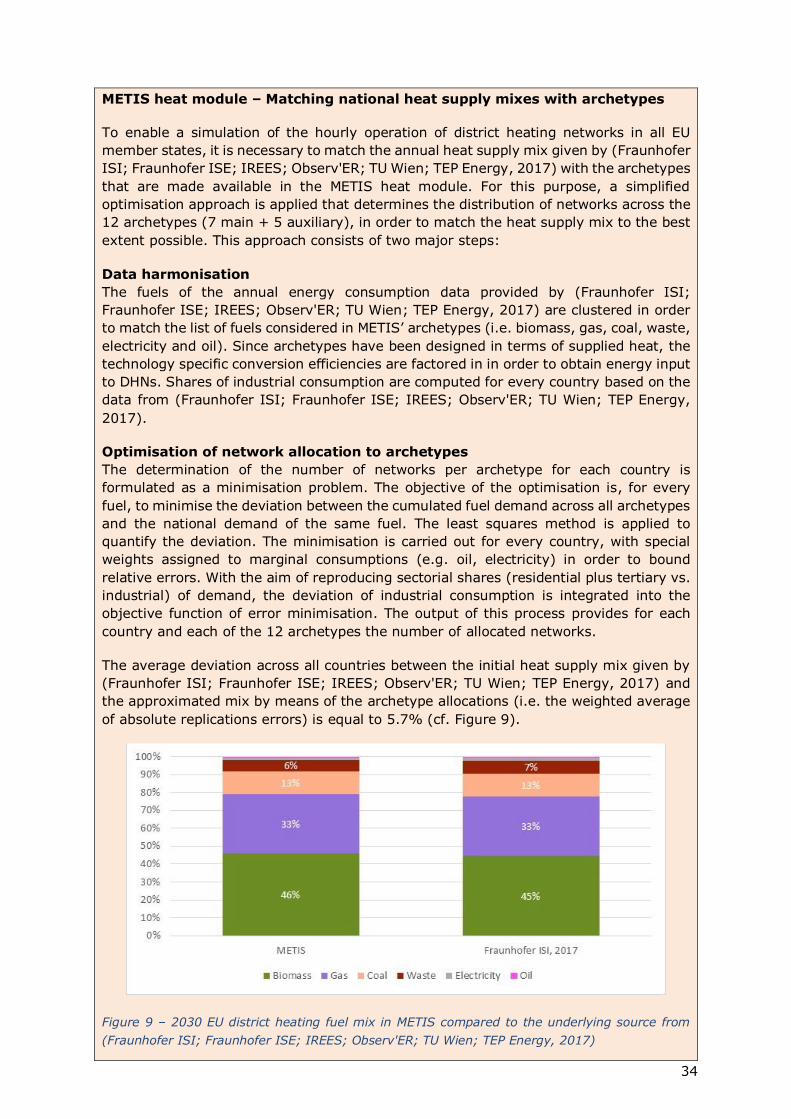
The average deviation across all countries between the initial heat supply mix given by
(Fraunhofer ISI; Fraunhofer ISE; IREES; Observ'ER; TU Wien; TEP Energy, 2017) and
the approximated mix by means of the archetype allocations (i.e. the weighted average
of absolute replications errors) is equal to 5.7% (cf. Figure 9).
Figure 9 – 2030 EU district heating fuel mix in METIS compared to the underlying source from
(Fraunhofer ISI; Fraunhofer ISE; IREES; Observ'ER; TU Wien; TEP Energy, 2017)

35
Table 5 provides an overview of the repartition of district heating in 2030 to the different archetypes, in terms of numbers of networks and supplied heat. It becomes apparent that the most prominent archetypes are the Biomass only as well as the Industry – gas only archetype, accounting for 25% and 20% of the supplied heat across the EU28+6, respectively, reflecting the prevalence of these fuels in the 2030 scenario from (Fraunhofer
ISI; Fraunhofer ISE; IREES; Observ'ER; TU Wien; TEP Energy, 2017). Given that the heat demand of the Biomass only archetype is below-average, its share in the total number of networks is even more important (34%). The total number of networks determined sums up to some 3,500 networks which is in the correct order of magnitude compared to today’s numbers.
Table 5 - Overview of the shares of each archetype in the European DH supply and in the number of all networks (for the 2030 scenario)
Type Archetype Annual heat
demand
Share of
networks
Share of
supplied
heat10
Residential –
3rd generation
Business as usual 500 GWh 1.5% 6.1%
Getting green 65 GWh 1.4% 0.8%
Gas only* 65 GWh 10.0% 5.6%
Biomass only 90 GWh 34.2% 25.0%
Biomass and gas 65 GWh 10.1% 5.5%
Biomass and oil* 130 GWh 6.0% 6.5%
Waste and biomass* 65 GWh 6.0% 9.6%
Residential –
4th generation
Solar 35 GWh 0.2% 0.1%
Heat pump 145 GWh 8.0% 9.6%
Geothermal 65 GWh 7.9% 4.1%
Industrial -
3rd generation
Industry - coal 450 GWh 1.8% 7.0%
Industry - gas only 190 GWh 12.9% 20.0% *This archetype is considered as auxiliary network archetype. Its design is inspired by existing networks.
Instead it was dimensioned to ensure the best possible representation of the fuel mix from the EU scenario from (Fraunhofer ISI; Fraunhofer ISE; IREES; Observ'ER; TU Wien; TEP Energy, 2017).
Figure 10 illustrates the allocation of the twelve different (main and auxiliary) archetypes to the individual countries. Despite the prevalence of biomass and gas, selected countries feature a dominance of other archetypes. Due to the important share of oil in their national DH supply mix, countries like Belgium, Spain, Greece or Portugal rely primarily on the Biomass and oil archetype, the latter being the only archetype featuring an oil component (8% of the archetype’s heat supply). In Norway, Slovakia and Sweden, the Heat pump archetype covers more than 40% of the national DH supply mix in 2030, with the heat pump covering nearly half of the archetypes heat generation. As solar will still represent a limited share in 2030’s EU DH supply mix, the Solar archetype only represents 0.2% of all European networks. Denmark is the country with the highest solar archetype share by 2030, with 1.5% of the national DH generation. The business-as-usual archetype tends to
disappear, except for Poland and Czech Republic where it covers 47% and 17% of the national DH supply, respectively.
10 Share of the archetype in the DH supply across all EU member states plus Norway, Switzerland, Serbia,
Montenegro, Macedonia and Bosnia-Hercegovina.

36
Figure 10 - Shares of archetypes in national DH supply mix in 2030, by country

37
ANALYSIS OF COST-EFFICIENT DISTRICT HEATING WITH METIS
Based on the selected 2030 scenario and the respective allocated archetypes described in Sections 5.2 and 5.3, a more detailed analysis is carried out. It has for objectives to
demonstrate the assessment opportunities with the newly developed METIS heat module by means of an illustrative case study (cf. Section 6.1) and to illustratively expound the impacts of changes in the DH fuel mix via a dedicated sensitivity assessment (cf. Section 6.2).
ANALYSIS OF THE 2030 BASE CASE
As soon as the information of the number of networks per archetype is imported in the METIS heat module, it is possible to simulate the national DH sectors of all EU28+6 countries.
METIS heat module – Creating a European context
The METIS heat module allows to visualise and configure each individual archetype. It
further provides a European perspective, detailing the characteristics of the DH sector in
each country based on the network allocation to the archetypes.
The network allocation serves as input for the heat module, together with a set of annual
electricity prices (based on the European Commission’s EUCO30-2030 scenario) as well
as national electricity CO2 content (based on the power system simulation of the EUCO30
scenario with the METIS power system module).11 Once all data is imported into the
METIS heat module, a specific script populates the specifically created European context
with respect to the archetypes’ coefficients by country, considering all country specific
data.
A set of pre-defined key performance indicators (KPIs) integrated in METIS allows to
analyse the European district heating context, aggregate input data and results or to
filter on countries, technologies or energies. This enables, for instance, to compute the
carbon footprint of a MWh of heat produced in country A, the production costs associated
with all gas boilers in country B or the overall fossil fuels consumption for district heating
in Europe. The METIS user interface allows to illustrate the data via a map view, different
kinds of charts that can be adapted according to the individual user needs or listed in
table format.
For the given 2030 scenario (in the following referred to as base case), a set of selected KPIs are shown. Figure 11 depicts the 2030 heat generation mixes and volumes of all
Central European countries. From the map it is directly apparent that fuel mixes vary substantially from one country to another. In Poland, half of the heat supply in DH networks relies on coal. An important coal share can likewise be observed in Germany’s mix. Other countries rather count on low carbon heating sources, like Great Britain, France and Netherlands that are expected to use mainly waste, biomass and gas. Hungary presents quite a significant share of electricity (8.6%) in comparison with neighbouring countries, due to the comparatively important utilisation of heat pumps.
11 The assumptions made for the optimisation of the archetypes (e.g. fuel prices, demand profile, cf. Section 5.2)
are conserved and thus the same for all countries, except for the annual electricity prices, which varies between
the different countries.

38
Figure 11 - Fuel mix for heat generation in 2030 in Central Europe
The difference in generation mixes has consequential implications on the countries’ DH-related carbon emissions (cf. Figure 12).12 For instance, while DH consumption in Germany exceeds the consumption in Poland, carbon emissions of both countries are relatively
similar because of Poland’s high share of coal in the generation mix.
Figure 12 - CO2 emissions linked to heat generation in 2030 in Central Europe
12 It is important to note that the allocation of emissions and fuel consumption from CHP plants to the heat and
electricity output is realised by applying the ratio of the respective conversion efficiencies. This wide-spread
approach, commonly referred to as Efficiency method, follows the guide given by World Resources Institute’s
GHG Protocol Initiative (WRI, 2006). Yet, for reasons of simplicity and applicability to all countries, this method
is not compliant with the guidelines provided in the European Commission’s Directive 2004/8/EC (European
Commission, 2004) and the related Commission Decision on harmonised efficiency reference values for separate
production of electricity and heat (C(2006) 6817) (European Commission, 2006).
100 TWhfuel
25 TWhfuel
5 TWhtuel

39
Heat-related carbon emissions depend on the fuel mix as well as the carbon content of the different fuels. In Austria, for instance, gas accounts for nearly half of energy consumption dedicated to heat generation but it is responsible for more than 90% of CO2 emissions (cf. Figure 13). In contrast, in Germany, coal is responsible for half of the emissions while only providing 13% of energy input to DHNs.
Figure 13 - Shares of fuels in energy input to DHNs and carbon emissions, 2030 Austria and Germany
In order to make the emissions better comparable across the countries, a dedicated KPI links the aggregated emissions to the amount of heat produced and shows the carbon content of every MWhth served (cf. Figure 14). This is a more appropriate metric to compare the environmental performance of the DH sectors. As expected, generating heat in Poland is nearly twice as emissive as in Germany, which has one of the highest heat carbon contents of Western Europe.
Figure 14 – Specific production costs and carbon content of served heat, by country
Besides, Figure 14 shows that the heat carbon footprint and the specific heat production costs are not significantly correlated.13 However, countries featuring lowest heat costs (e.g. Hungary, France, Slovakia and Norway) are also among the countries exhibiting the lowest
13 The price for one ton of CO2 is set at 27 €, in compliance with the European Commission’s EUCO30-2030
scenario.

40
heat carbon footprints. This is due to the high utilisation of biomass and waste, both having low prices14 and a comparatively low carbon content.
Total heat production costs are defined as the production of each asset multiplied with its operating costs (i.e. excluding capital expenditures). The variation of heat production costs
across the different countries can be explained by two major factors. The fuel mix affect the overall costs due to their respective fuel prices and related carbon costs. The technology mix affects the costs due to their individual conversion efficiencies and variable costs. That is, heat production costs are a direct result of national district heat production fleets. The respective KPI is shown in Figure 15, exhibiting the distribution of production costs across all heat generation technologies.
Figure 15 - Heat production costs by asset, by country
Figure 16 contrasts the energy input mix for heat supply with the production costs distinguished by fuel, for Belgium and Poland. In Belgium, the energy input to DHNs and
production costs appear relatively equally distributed across the different fuels because the two major fuels, gas and biomass, feature similar fuel prices of around 30 to 35 €/MWhfuel. For Poland, the contribution of coal to the fuel mix is smaller than to the production costs, given the comparatively low price of coal in comparison with gas (17 vs 32 €/MWhfuel).
Figure 16 - Shares of fuels in energy input to DHNs and composition of production costs, 2030 Belgium and Poland
14 Fuel prices are based on the European Commission’s EUCO30-2030 scenario.
41
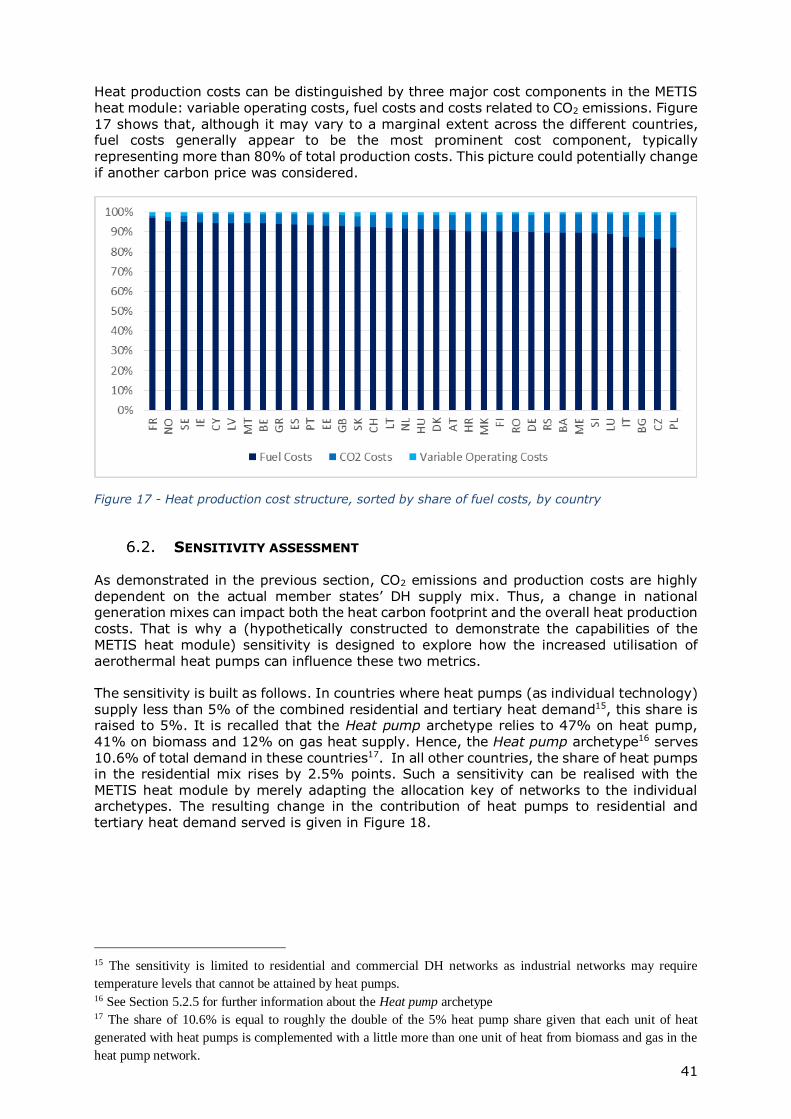
Heat production costs can be distinguished by three major cost components in the METIS heat module: variable operating costs, fuel costs and costs related to CO2 emissions. Figure 17 shows that, although it may vary to a marginal extent across the different countries, fuel costs generally appear to be the most prominent cost component, typically representing more than 80% of total production costs. This picture could potentially change
if another carbon price was considered.
Figure 17 - Heat production cost structure, sorted by share of fuel costs, by country
SENSITIVITY ASSESSMENT
As demonstrated in the previous section, CO2 emissions and production costs are highly dependent on the actual member states’ DH supply mix. Thus, a change in national generation mixes can impact both the heat carbon footprint and the overall heat production costs. That is why a (hypothetically constructed to demonstrate the capabilities of the METIS heat module) sensitivity is designed to explore how the increased utilisation of aerothermal heat pumps can influence these two metrics.
The sensitivity is built as follows. In countries where heat pumps (as individual technology) supply less than 5% of the combined residential and tertiary heat demand15, this share is raised to 5%. It is recalled that the Heat pump archetype relies to 47% on heat pump, 41% on biomass and 12% on gas heat supply. Hence, the Heat pump archetype16 serves 10.6% of total demand in these countries17. In all other countries, the share of heat pumps in the residential mix rises by 2.5% points. Such a sensitivity can be realised with the METIS heat module by merely adapting the allocation key of networks to the individual archetypes. The resulting change in the contribution of heat pumps to residential and tertiary heat demand served is given in Figure 18.
15 The sensitivity is limited to residential and commercial DH networks as industrial networks may require
temperature levels that cannot be attained by heat pumps. 16 See Section 5.2.5 for further information about the Heat pump archetype 17 The share of 10.6% is equal to roughly the double of the 5% heat pump share given that each unit of heat
generated with heat pumps is complemented with a little more than one unit of heat from biomass and gas in the
heat pump network.

42
Figure 18 - Share of heat pumps in residential and tertiary energy demand for DH, by country
Figure 19 shows the net change in fuel mix resulting from the integration of a single Heat Pump archetype (providing 145 GWhth) to a country’s generation mix, heat demand being equal. In all countries, the electricity consumption dedicated to district heat generation rises, while overall energy consumption diminishes. This effect is due to the high efficiency of heat pumps (coefficient of performance > 3).
Figure 19 – Net balance resulting from the integration of an additional Heat Pump archetype to the residential mix, by country
The impact of the shift towards heat pumps on production costs and carbon emissions strongly depends on the electricity price and the carbon content. Figure 20 gives an overview of the mean electricity prices18 and electricity carbon content of all member states, generated with the METIS power system module for the European Commission’s EUCO30-2030 scenario. The chart illustrates that the carbon content varies substantially
18 For this sensitivity, an average electricity price and carbon content are applied, given that the heat pumps runs
quasi-continuously throughout the entire year.

43
across all countries, with countries relying substantially on coal and lignite featuring highest emissions (above 1.2 tCO2/MWhel), such as Estonia or Czech Republic. Countries with high shares of renewable or nuclear power generation, exhibit close to zero carbon contents instead (e.g. Austria, France, Sweden). On the other hand, power prices are all contained in a relatively narrow range between 50 and 70 €/MWhel, with Cyprus, Portugal or France
as selected outliers.
Figure 20 - Carbon intensity and cost of electricity, by country (based on the European Commission’s EUCO30-2030 scenario, simulated with the METIS power system module)
6.2.1. IMPACT ON PRODUCTION COSTS
The impact of the shift towards heat pumps on production costs results from the change in national fuel mixes, weighted with the individual fuel prices.
In most countries, production costs19 tend to decrease yet to varying degrees (cf. Figure 21). The overall decrease in costs is essentially driven by fuel economies. Thanks to the high energy efficiency of heat pumps, the reduction of energy consumption even outweighs a potentially higher electricity price (compared to the replaced fuel) in many countries.
19 The impact on capital expenditures is not taken into account. To perform a holistic analysis and conclude about
the profitability of such a strategy, it would be necessary to benchmark the production cost savings with the change
in capital expenditures in each country.

44
Figure 21 – Change in production costs between base case and sensitivity, by country
This effect shall be explained in more detail by means of two examples. Italy counts among the countries that feature a reduction in energy demand but rising production costs due to the shift towards heat pumps. In the base case, the Italian residential fuel mix shows a large share of waste with comparatively low supply costs (5€/MWhfuel), implying that Italy’s heat production costs figure among the lowest in the EU by 2030 (cf. Figure 14). At the same time, the Italian electricity price counts among the highest ones with about 66 €/MWhel. Thus, in the sensitivity cheap waste and biomass are replaced by more expensive electricity. That is, the reduction in energy demand is not sufficient to outweigh this trade-off and, consequently, heat production costs increase slightly (cf. Figure 22).
Figure 22 - Combined effects of the sensitivity scenario on energy consumption and fuel costs, Italy
In contrast, in the case of Luxemburg the sensitivity implies a reduction in fuel demand and production costs. Luxemburg’s residential and tertiary district heating sector relies on biomass and gas only (cf. Figure 23), which exhibit comparatively high prices (at least 32 €/MWhfuel). Electricity price in Luxemburg are close to 70 €/MWhel (cf. Figure 20). The shift towards heat pumps increases electricity and gas consumption while it saves three times this amount in gas demand. Hence, the shift towards a fuel that is twice as expensive as the substituted fuel (namely electricity vs gas) is compensated by the division of energy demand by three, resulting in overall production costs reduction of nearly 2%.
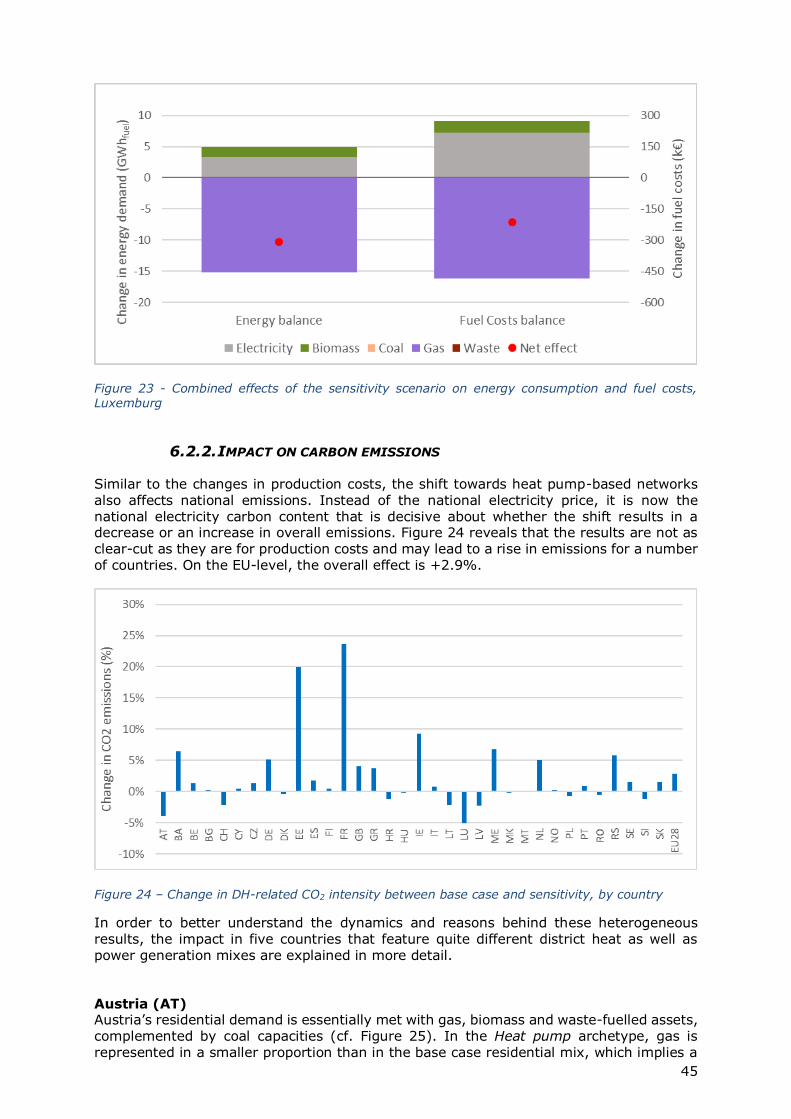
45
Figure 23 - Combined effects of the sensitivity scenario on energy consumption and fuel costs, Luxemburg
6.2.2. IMPACT ON CARBON EMISSIONS
Similar to the changes in production costs, the shift towards heat pump-based networks
also affects national emissions. Instead of the national electricity price, it is now the national electricity carbon content that is decisive about whether the shift results in a decrease or an increase in overall emissions. Figure 24 reveals that the results are not as clear-cut as they are for production costs and may lead to a rise in emissions for a number of countries. On the EU-level, the overall effect is +2.9%.
Figure 24 – Change in DH-related CO2 intensity between base case and sensitivity, by country
In order to better understand the dynamics and reasons behind these heterogeneous
results, the impact in five countries that feature quite different district heat as well as power generation mixes are explained in more detail. Austria (AT) Austria’s residential demand is essentially met with gas, biomass and waste-fuelled assets, complemented by coal capacities (cf. Figure 25). In the Heat pump archetype, gas is
represented in a smaller proportion than in the base case residential mix, which implies a

46
net reduction in gas, waste, biomass and carbon-intensive coal demand. At the same time, electricity demand rises. However, as Austria’s electricity has a very low carbon intensity (40 kgCO2/MWhel), the net effect implies a decrease of carbon emissions in the sensitivity (cf. Figure 26). In total, the shift facilitates curbing Austria’s heat-related emissions by almost 4% of the country’s annual emissions for the sector.
Germany (DE) In the base case model, Germany produces no heat from heat pumps but residential demand is mainly served with biomass and waste-fuelled heat production assets (plus some gas and marginal geothermal heat pumps).20 In the sensitivity scenario, the shift to heat pumps brings in electricity, biomass and gas, resulting in a net increase in electricity and gas demand and a net decrease of biomass and waste (which are both considered carbon neutral). Given that the carbon content of the German power mix is among the highest in the EU and equals 0.72 tCO2/MWhel in the EUCO30-2030 scenario, and the carbon content of gas is equal to 0.18 tCO2/MWhfuel, emissions rise by about 5% compared to the base case. France (FR) Under the given 2030 scenario, residential DH demand in France is mainly served by biomass and waste assets, plus some gas and electricity for geothermal heat pumps. The partial substitution by heat pump networks results in a decrease in biomass and waste demand and an increase in gas and electricity demand. The French power mix has one of the lowest carbon contents of Europe (50 kgCO2/MWh). Yet its rising utilisation and in particular the enhanced use of gas imply an increase in emissions by 24% compared to the base case, while the reduced demand in biomass and waste does not entail any
emission reduction. Hence, supplying more heat with heat pump networks (which rely on 12% gas-based heat generation) turns out not to be advantageous with respect to French district heating CO2 emissions.
Figure 25 - Combined effect of sensitivity scenario on fuel consumption, in five selected countries
20 In the present analysis, it is assumed that all coal still being used in 2030 in German district heating networks is
bound to industrial networks and hence does not appear in this sensitivity assessment.

47
Figure 26 - Combined effect of sensitivity scenario on carbon emissions, in five selected countries
Poland (PL) Poland’s residential DH fuel consumption is half-composed of coal, along with gas and biomass mainly. That is, for every unit of energy replaced by the Heat pump archetype, half a unit of coal is taken out of the mix. This shift implies an important decrease in coal-related emissions, which represent around 80% of the base case residential emissions. At
the same time, the carbon content of Polish electricity used by heat pumps in the newly added network is one of the highest in the EU (1.2 tCO2/MWhel). However, in total Poland’s DH emissions decrease by 0.7% compared to the base case as the high energy efficiency of heat pumps outweighs the increase in power generation-related carbon emissions. Sweden (SE) 2030 Sweden is expected to serve residential DH demand essentially with biomass
capacities, marginally complemented by waste, coal and gas-fuelled assets. The integration of heat pumps, accompanied by gas and biomass boilers, results in a net decrease in biomass, waste and coal demand, along with an increase in electricity and gas consumption. While reducing coal consumption helps curbing carbon emissions, its share in the original residential fuel mix is not sufficient to outweigh additional emissions due to the rise of gas demand. Electricity-related emissions only play a minor role due to the very low carbon content of 40 kgCO2/MWhel. Overall, replacing part of Sweden’s residential mix
with the Heat Pump archetype comes down to gas and electricity increases the DH-related carbon emissions by 1.5%.

48
CONCLUSIONS AND OUTLOOK
This study introduces the newly developed METIS heat module and illustrates its new functionalities. The design of the heat module and the calibration of the developed scenario
build upon a thorough literature review of existing and upcoming large-scale heating technologies, and district heating network configurations which are projected into the future (2030) via a set of distinct DH network archetypes. The actual dimensioning of the archetypes is realised with the METIS heat module which allows the optimisation of peak and heat storage capacities for a given hourly heat demand and a set of preconfigured baseload capacities, considering the individual techno-economic parameters of each asset. The user of the METIS heat module may further obtain the hourly utilisation of all assets
connected to each network archetype.
In order to determine the number of networks per network archetype in each member state, a 2030 district heating scenario is identified that provides the most comprehensive and coherent dataset currently publicly available. Through (automated) multiplication of the individual network characteristics (i.e. fuel demand, production costs or emissions per archetype) with the number of networks per archetype in each country, the METIS heat
module provides a nationwide picture of the DH sector in each member state by the year 2030.
By means of a set of key performance indicators, the user is empowered to analyse the European context and assess the impact of variations in the configuration of the national energy supply mix for district heat generation (via the adapted allocation of networks to the individual archetypes) with respect to fuel use, production costs and CO2 emissions.
For the purpose of illustration, a sensitivity assessment is carried out in this study, highlighting for instance that the shift towards more large-scale heat pumps clearly implies a reduction in energy input to district heating networks. Yet, whether this goes along with a reduction in heat production costs and CO2 emissions strongly depends on the individual electricity price and the carbon content in each country, as well as on the heat mix of the displaced heat networks and of the replacing heat pump-based heat network.
In addition to the previously stated analyses around the given scenario, the METIS heat module enables advanced users to carry out a set of additional assessments. This includes the design and cost-optimal dimensioning of additional archetypes with divergent asset portfolios and modified techno-economic parameters. The user may further update heat demand volumes and profiles, import hourly electricity price time series and vary fuel and carbon prices.

49
REFERENCES
Agence Locale de l'Energie du Grand Lyon. (2016). Se raccorder à un réseau de chaleur sur la métropole de Lyon - Fiche B01: Le réseau Centre Métropole. Retrieved from
https://www.alec-lyon.org/storage/Fiches-Reseaux-de-Chaleur/201606%20-%20B01%20-%20CENTRE%20METROPOLE%20vF.pdf?66b84e
Averfalk, H., Ingvarsson, P., Persson, U., & Werner, S. (2014). On the use of surplus electricity in district heating systems. The 14th International Symposium on District Heating and Cooling, Stockholm.
Averfalk, H., Ingvarsson, P., Persson, U., Gong, M., & Werner, S. (2017). Large heat pumps in Swedish district heating systems. Renewable and Sustainable Energy Reviews.
Bach, B., Werling, J., Ommen, T., Münster, M., Morales, J., & Elmegaard, B. (2016). Integration of large-scale heat pumps in the district heating systems of Greater Copenhagen. Energy.
Bossmann, T. (2008). Gekoppelte Modellierung des Strom- und Fernwärmemarktes in Deutschland. Technical University Berlin.
David, A., Vad Mathiesen, B., Averfalk, H., Werner, S., & Lund, H. (2017). Heat Roadmap Europe: Large-scale electric heat pumps in district heating systems. Energies.
doi:10.3390/en10040578 Energie Lyon Métropole. (2018). Chauffage urbain Grand Lyon. Retrieved from Un réseau
durable: http://chauffageurbain.centremetropole.grandlyon.com/Un-reseau-durable
European Commission. (2004). Directive 2004/8/EC on the promotion of cogeneration based on a useful heat demand in the internal energy market.
European Commission. (2006). Commission Decision establishing harmonised efficiency
reference values for separate production of electricity and heat. European Commission. (2016). An EU Strategy on Heating and Cooling, COM(2016) 51
final. European Commission. (2018). Buildings. Retrieved from
https://ec.europa.eu/energy/en/topics/energy-efficiency/buildings Fraunhofer ISI; Fraunhofer ISE; IREES; Observ'ER; TU Wien; TEP Energy. (2017). Mapping
and analyses of the current and future (2020 - 2030) heating/cooling fuel
deployment (fossil/renewables). Mapping EU heat supply project. Fraunhofer ISI; TEP Energy; University Utrecht; ARMINES. (2017). Profile of heating and
cooling demand in 2015 - D 3.1. Heat Roadmap Europe 2050 project. Galindo Fernandez, M., Roger-Lacan, C., Gährs, U., & Aumaitre, V. (2016). Efficient district
heating and cooling systems in the EU. JRC. Grosse, R., Christopher, B., Stefan, W., Geyer, R., & Robbi, S. (2017). Long term (2050)
projections of techno-economic performance of large-scale heating and cooling in
the EU. European commission. JRC. doi:10.2760/24422 Indeal project. (2018). Innovative Technology for District Heating and Cooling. Retrieved
from Indeal project: http://www.indeal-project.eu/case-studies/#Vransko INETZ. (2018). Fernwärme. Retrieved from Fernwärme:
https://www.inetz.de/startseite/netzanschluss/haushalt-gewerbe/fernwaerme/ Lund et al. (2014). 4th Generation District Heating. Integrating smart thermal grids into
future sustainable energy systems. Mantzos, L., Matei, N., Milholland, E., Rozsai, M., Tamba, M., & Wiesenthal, T. (2018). JRC-
IDEES 2015 database. JRC. doi:10.2760/182725 Marques, R. P., Hacon, D., & Tessarollo, A. (2010). Thermodynamic analysis of tri-
generation systems taking into account refrigeration, heating and electricity load demands. Energy and Buildings.
Radboud University, Cambridge Econometrics. (2017). FTT:Heat - A simulation model for technological change in the residential heating sector. Brussels.
RTE. (2018). Open Data RTE. Retrieved from Scénario "Référence" du bilan prévisionnel 2015 : consommation horaire brute: https://rte-opendata.opendatasoft.com/explore/dataset/bp_2015_scenario_conso_horaire_brute/
Ville de Montpellier. (2018). Unique en France, à Montpellier, une centrale à bois produisant chaleur, électricité et froid. Retrieved from

50
http://www.montpellier.fr/evenement/15592/3624-unique-en-france-a-montpellier-une-centrale-a-bois-produisant-chaleur-electricite-et-froid.htm
WRI. (2006). Allocation of GHG emissions from a combined heat and power (CHP) plant. World Resources Institute.