meto 621 chem lesson 6. a typical day in a pollution episode a common severe pollution weather...
TRANSCRIPT

METO 621 CHEM
Lesson 6
A Typical Day in a Pollution Episode
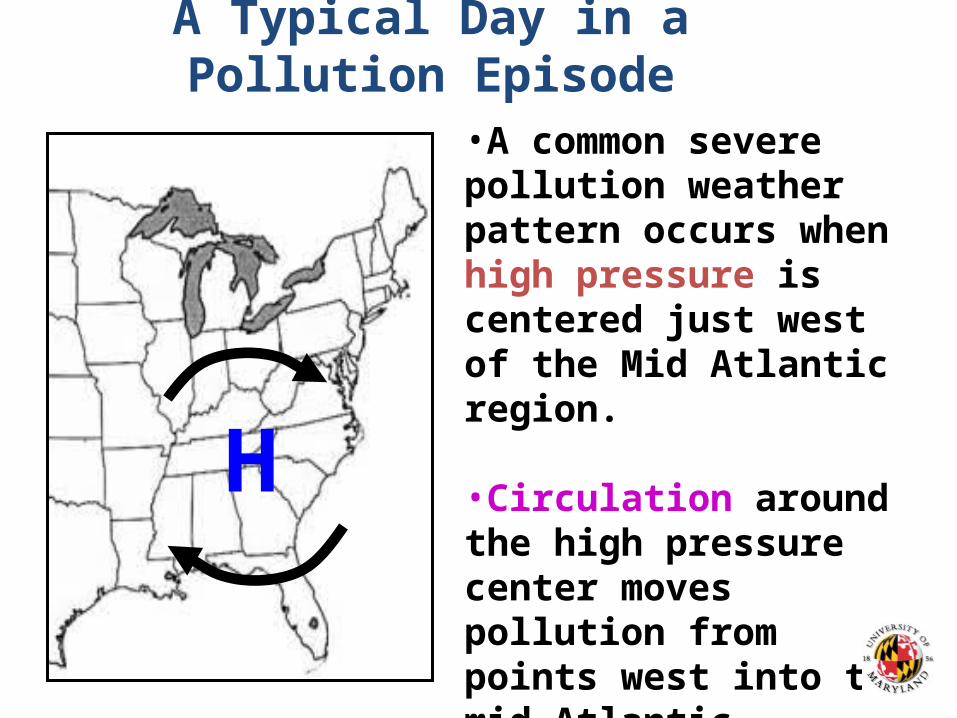
•A common severe pollution weather pattern occurs when high pressure is centered just west of the Mid Atlantic region.
•Circulation around the high pressure center moves pollution from points west into the mid-Atlantic.
H

Fort Meade profile 6/19/2001
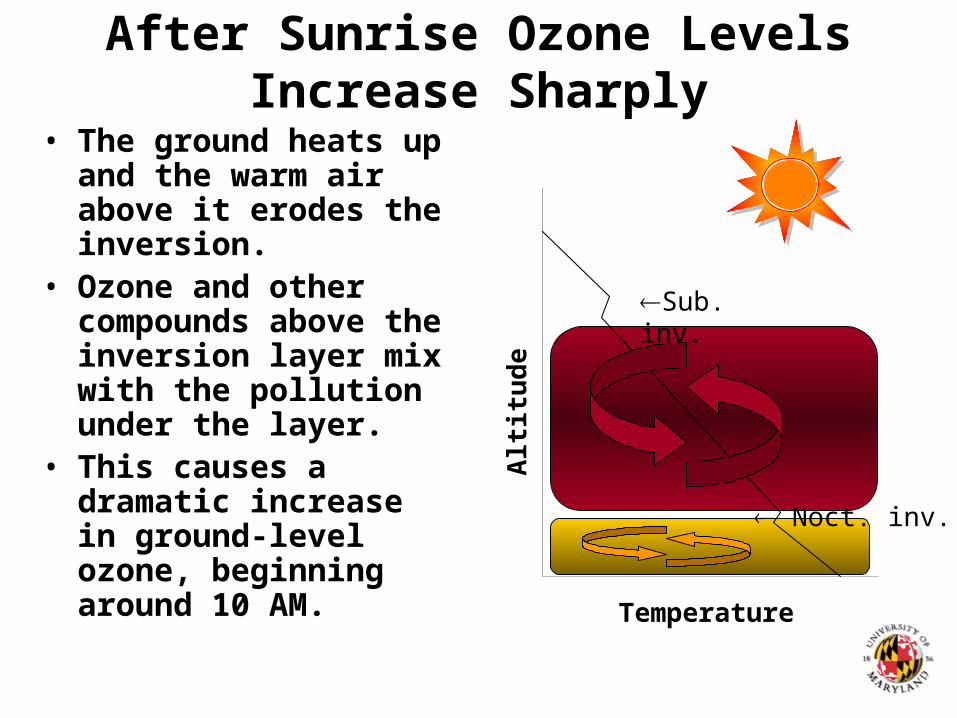
After Sunrise Ozone Levels Increase Sharply• The ground heats up and
the warm air above it erodes the inversion.
• Ozone and other compounds above the inversion layer mix with the pollution under the layer.
• This causes a dramatic increase in ground-level ozone, beginning around 10 AM.
Temperature
Alt
itu
de
Sub. inv.
Noct. inv.

Ozone Levels Reach a Maximum in the Afternoon
Temperature
Alt
itu
de
Sub. inv.
Temperature
Alt
itu
de
Sub. inv.
Noct. inv.
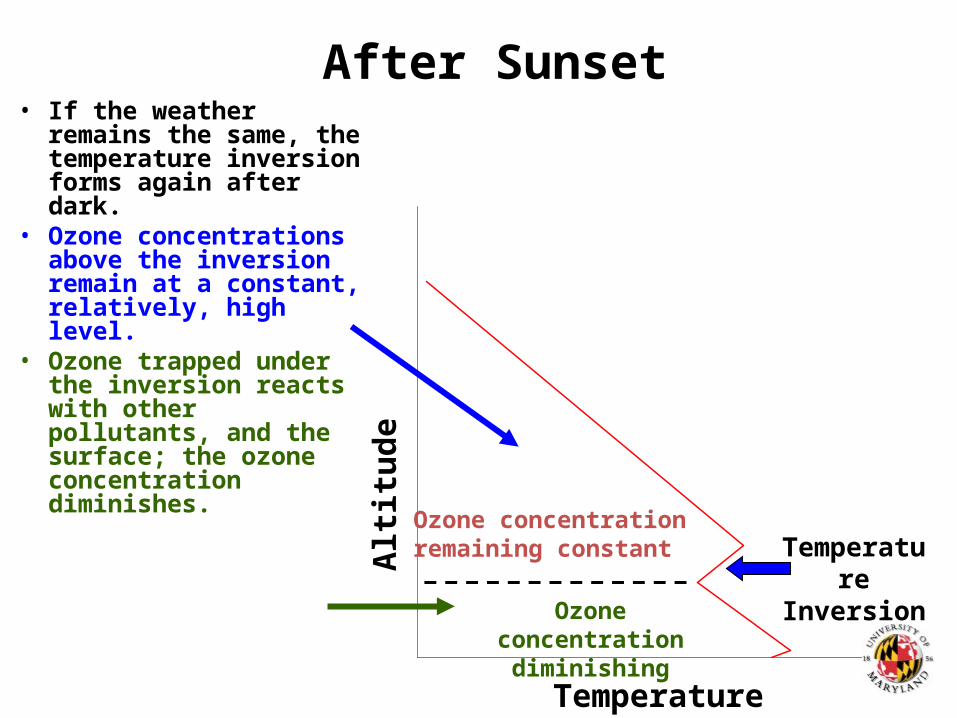
After Sunset• If the weather remains
the same, the temperature inversion forms again after dark.
• Ozone concentrations above the inversion remain at a constant, relatively, high level.
• Ozone trapped under the inversion reacts with other pollutants, and the surface; the ozone concentration diminishes.
Ozone concentration remaining constant
Ozone concentration diminishing
Temperature Inversion
Temperature
Alt
itu
de
Daily Ozone Cycle
Sunrise Sunset
Time of day
Ozone Concentration
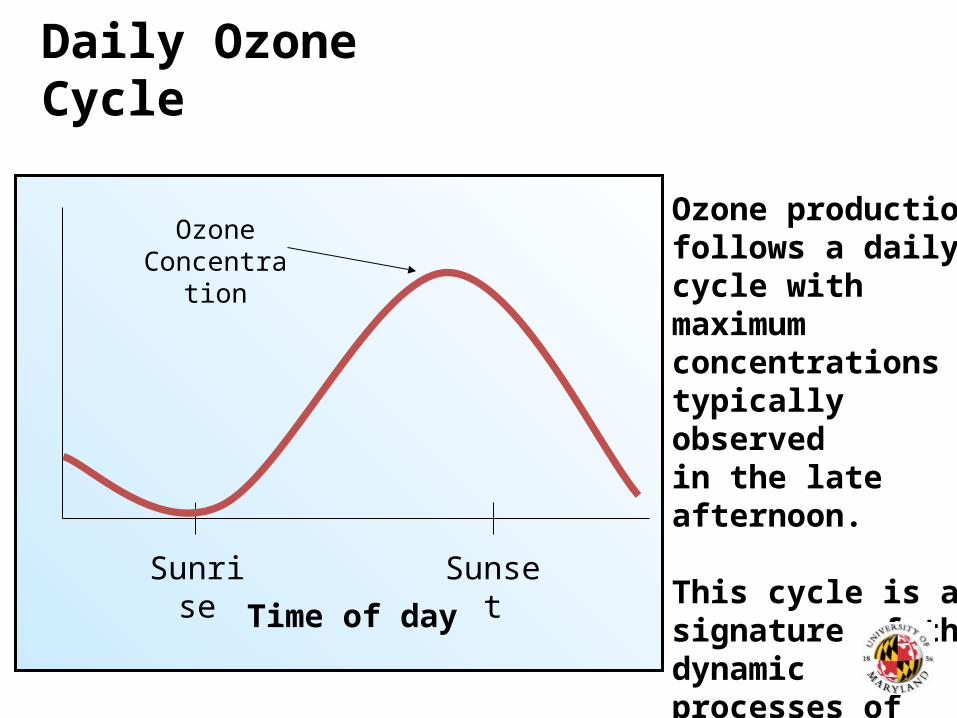
Ozone productionfollows a dailycycle with maximumconcentrations typically observedin the late afternoon.
This cycle is a signature of the dynamic processes of atmospheric air pollution
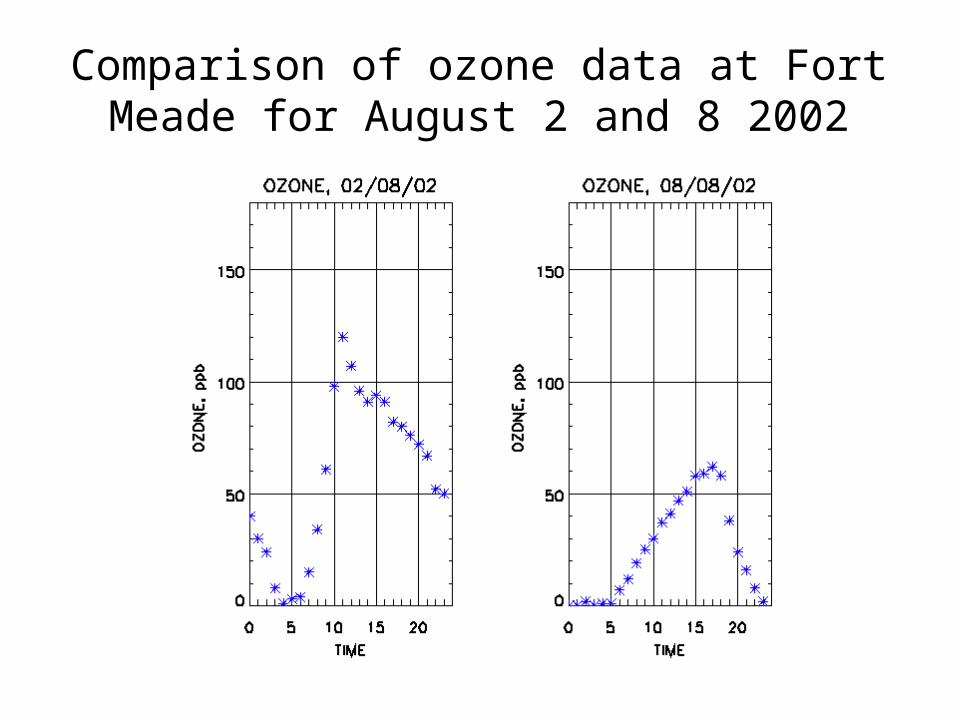
Comparison of ozone data at Fort Meade for August 2 and 8 2002
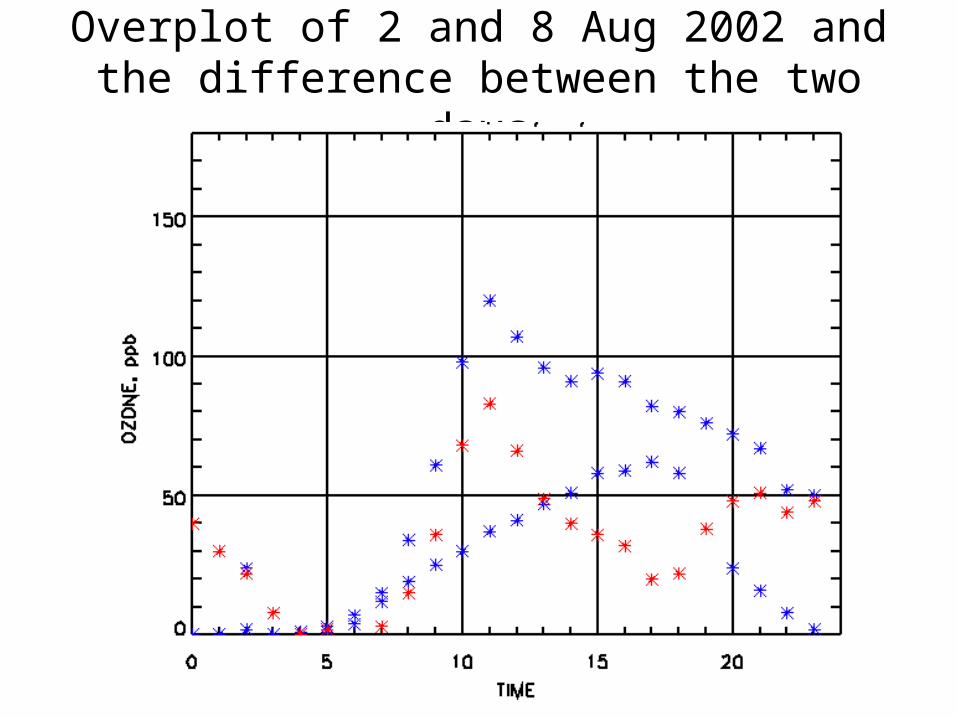
Overplot of 2 and 8 Aug 2002 and the difference between the two days
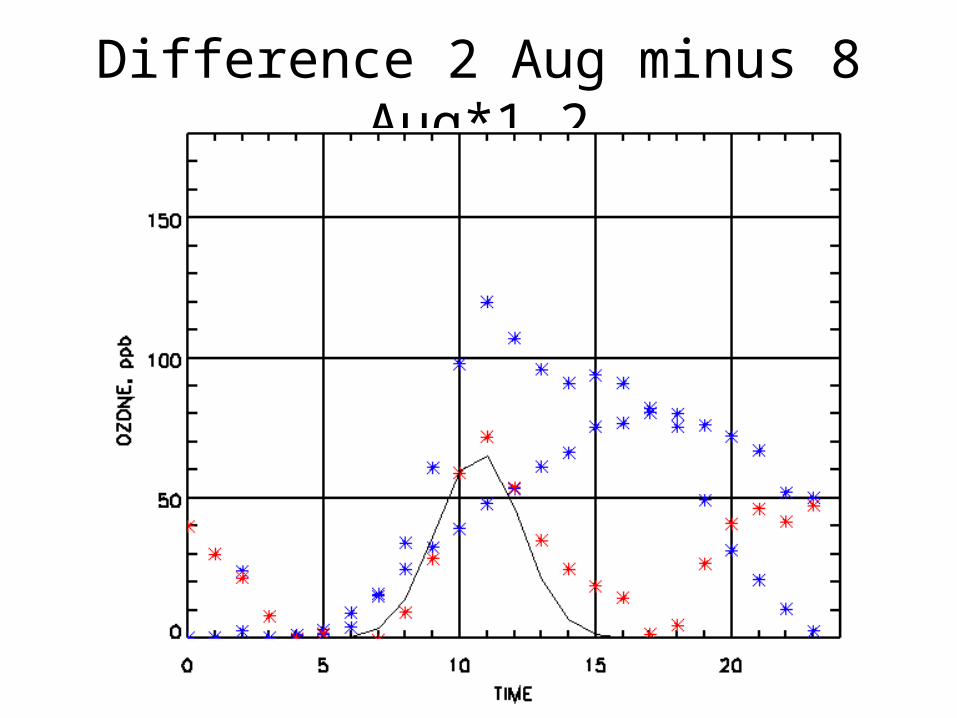
Difference 2 Aug minus 8 Aug*1.2
Comparison of Aug 2 and 8, 2002
• Ozone data for August 8 is typical for local pollution on a clear warm day.
• The NOx and VOC are emitted early in the morning and the ozone amount slowly increases as the temperature increases. The peak production is at about 3-4 in the afternoon when the temperature at the ground is a maximum.
• The back trajectory shows fast upper level winds, which start at a high altitude and then subside to boundary levels at Baltimore.
• Small probability of upper air being polluted.
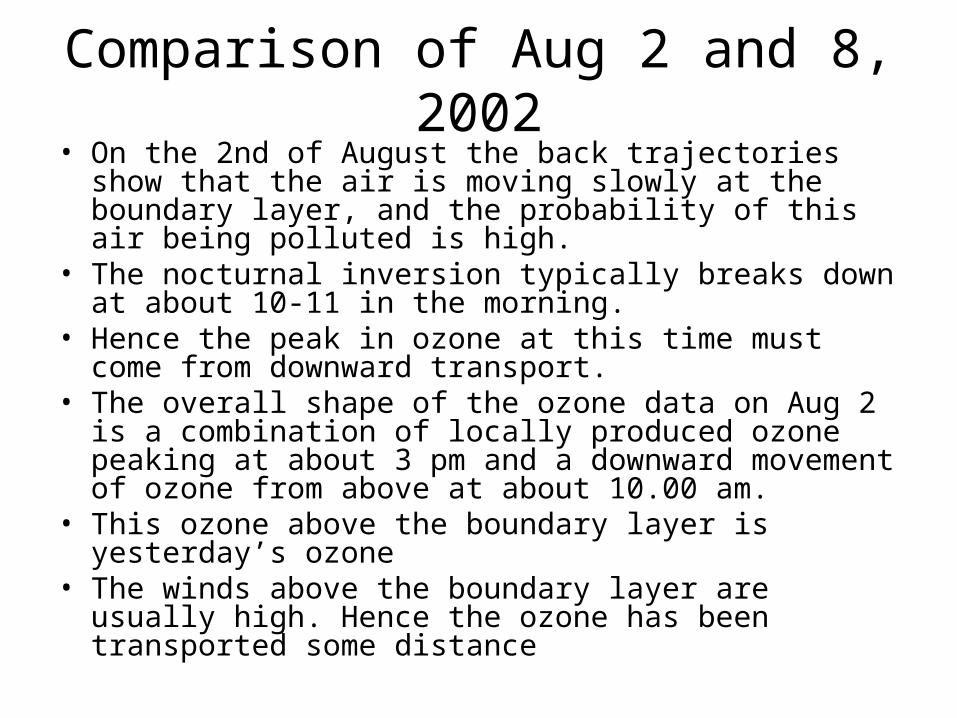
Comparison of Aug 2 and 8, 2002• On the 2nd of August the back trajectories show that the air is
moving slowly at the boundary layer, and the probability of this air being polluted is high.
• The nocturnal inversion typically breaks down at about 10-11 in the morning.
• Hence the peak in ozone at this time must come from downward transport.
• The overall shape of the ozone data on Aug 2 is a combination of locally produced ozone peaking at about 3 pm and a downward movement of ozone from above at about 10.00 am.
• This ozone above the boundary layer is yesterday’s ozone • The winds above the boundary layer are usually high. Hence
the ozone has been transported some distance

Westerly transport is often present when the highest ozone is observed in the mid-Atlantic.
24 hr. Back-trajectories on days of 1-hr. ozone exceedances from 1997 through 2002, Baltimore area

Aircraft measurements of ozone
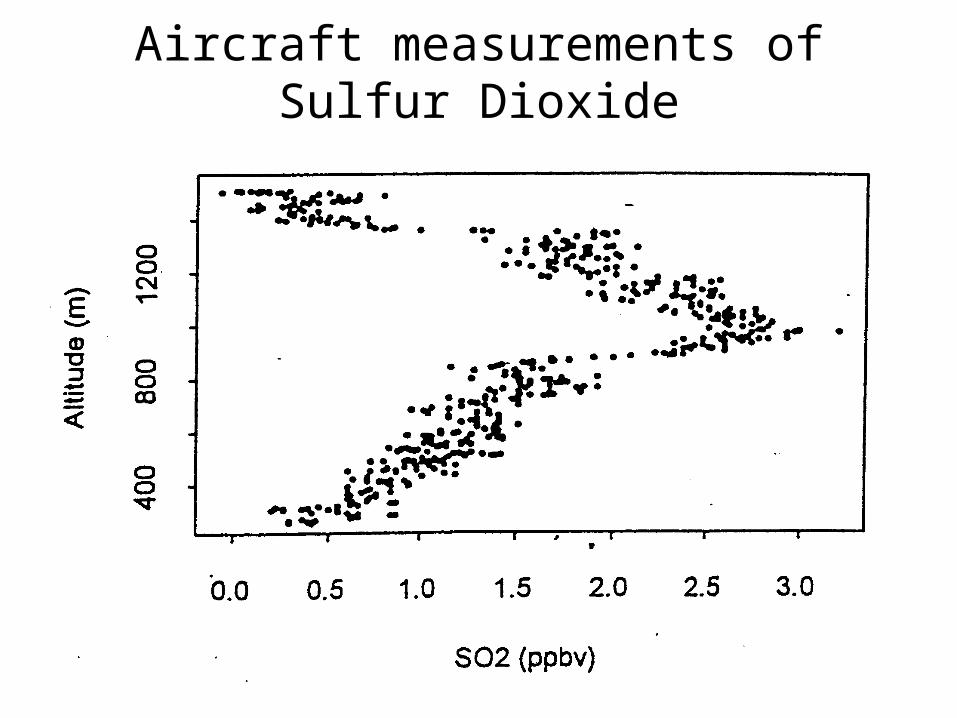
Aircraft measurements of Sulfur Dioxide

Upper level windsUpper level windsfrom the west…from the west…
……are turned by theare turned by thelee side troughlee side trough
Lee Side Trough
daytimedaytime
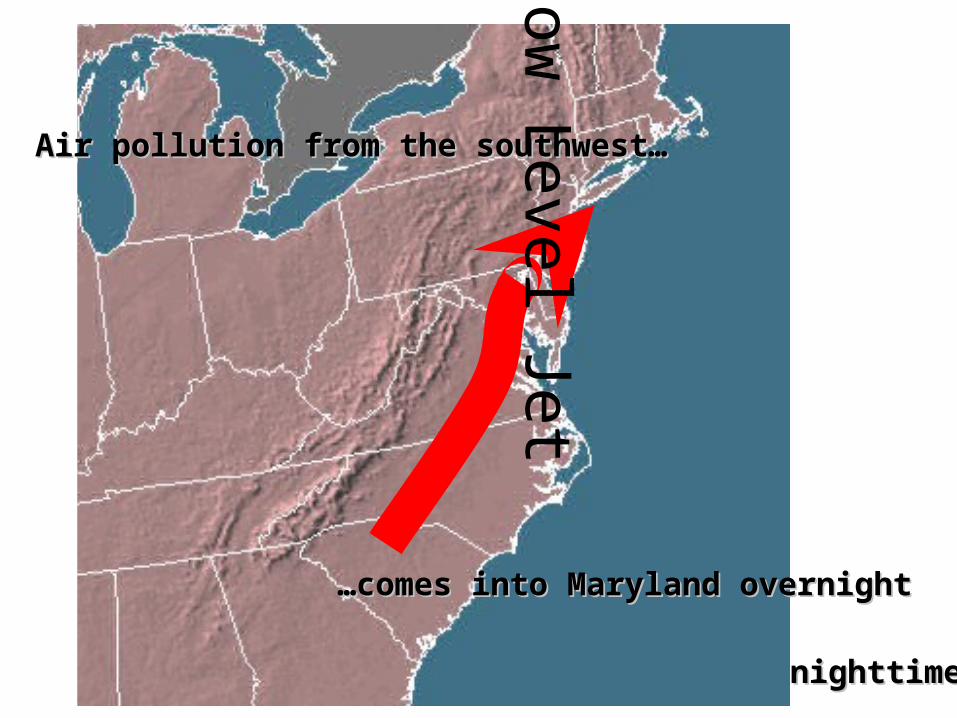
Low Level Jet
nighttimenighttime
Air pollution from the southwest…Air pollution from the southwest…
……comes into Maryland overnightcomes into Maryland overnight
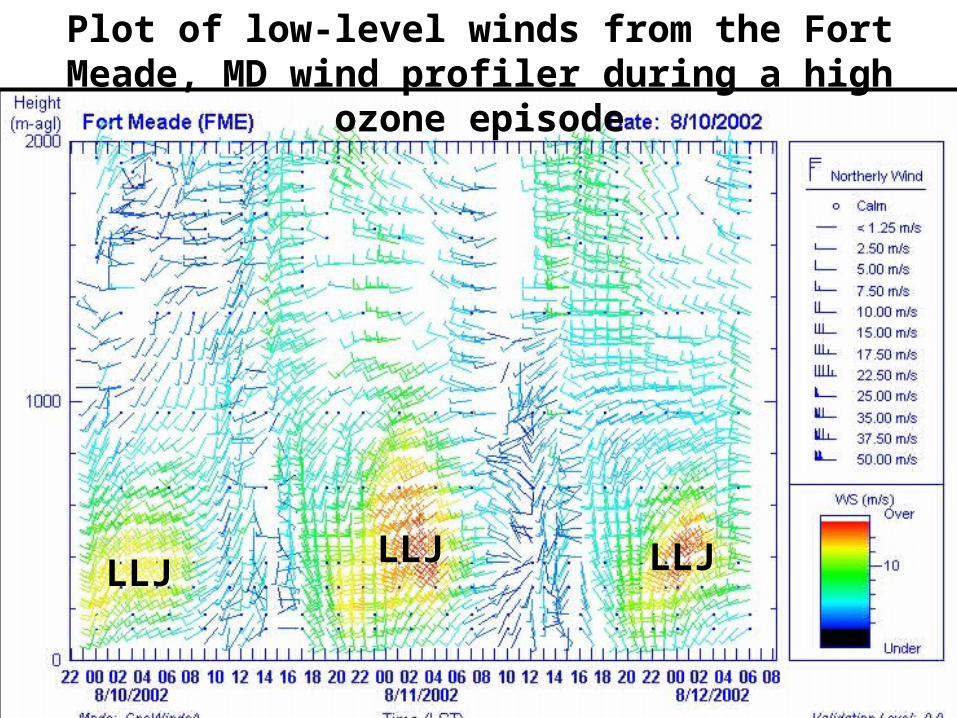
Plot of low-level winds from the Fort Meade, MD wind profiler during a high ozone episode
LLJLLJ LLJ

9:00 PM 11:00 PM 01:00 AM
03:00 AM 05:00 AM 07:00 AM
Rapid Update Cycle (RUC)
model depiction of the LLJ
during a high ozone period
(high wind speeds in red).
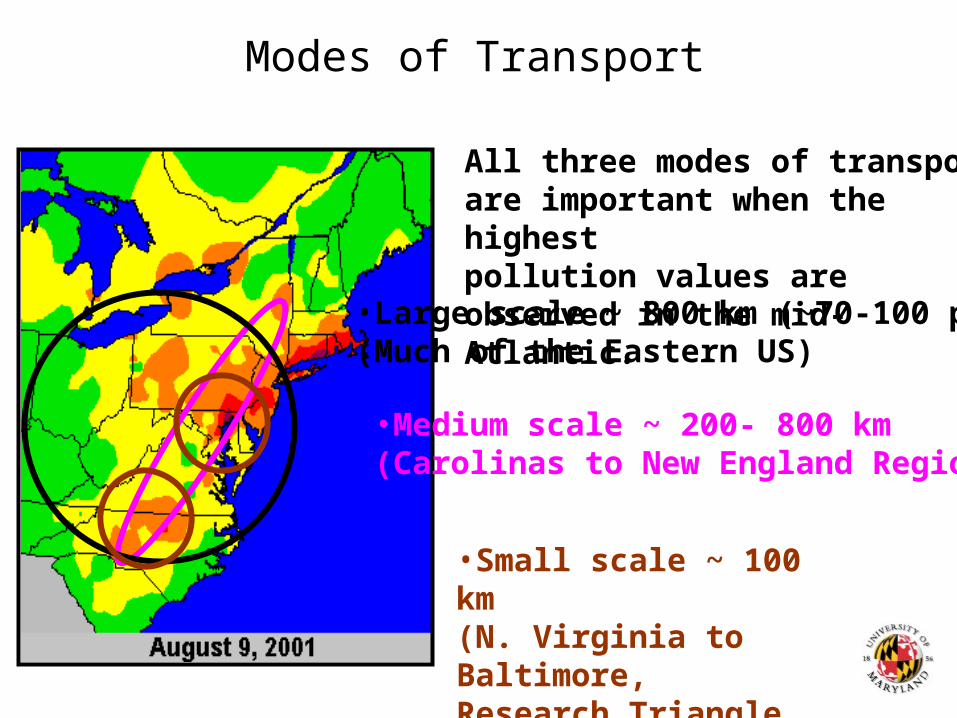
All three modes of transport are important when the highest pollution values are observed in the mid-Atlantic.
•Large scale ~ 800 km (~70-100 ppbv)(Much of the Eastern US)
•Medium scale ~ 200- 800 km(Carolinas to New England Region)
•Small scale ~ 100 km(N. Virginia to Baltimore,Research Triangle to NC/VA border)
Modes of Transport

Sources
• Different types of transport imply different types of sources– Local transport Cars, industry, and other
sources in the local area– Long distance transport Primarily power plants to
W, though plumes from cities certainly contribute.
– Low level jet Primarily cars and other
low level sources; moves from SW to NE

• On the mid-Atlantic’s worst ozone days, a significant amount of pollution comes from long distance transport originating in upwind states.
• UMD Aircraft measure levels as high as 110 ppbv floating in from the west
How Significant?
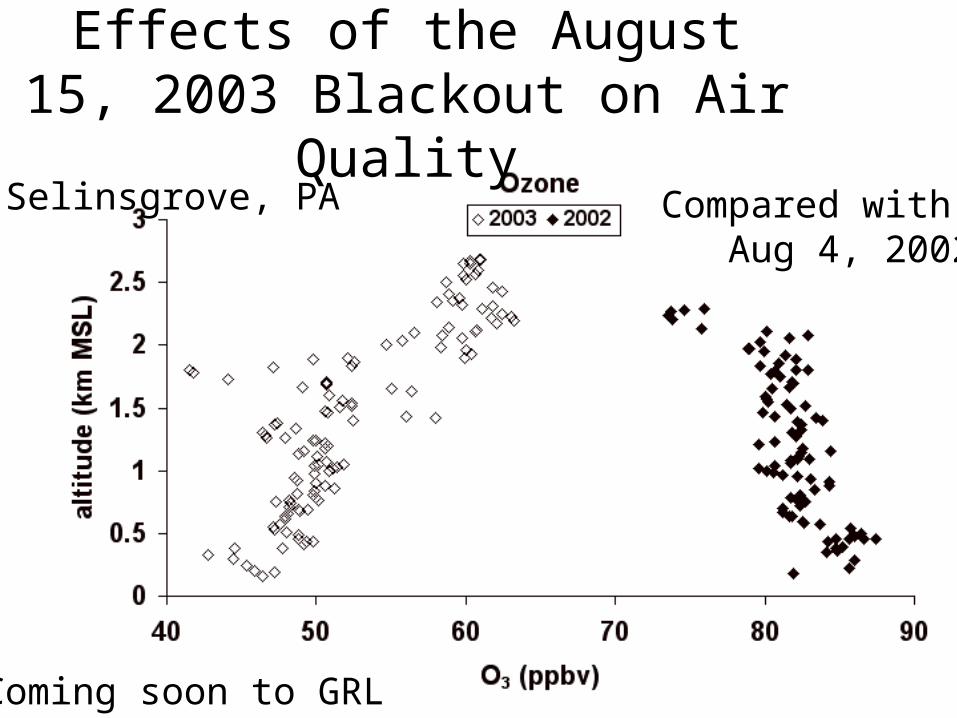
Effects of the August 15, 2003 Blackout on Air Quality
Compared with Aug 4, 2002
Coming soon to GRL
Selinsgrove, PA
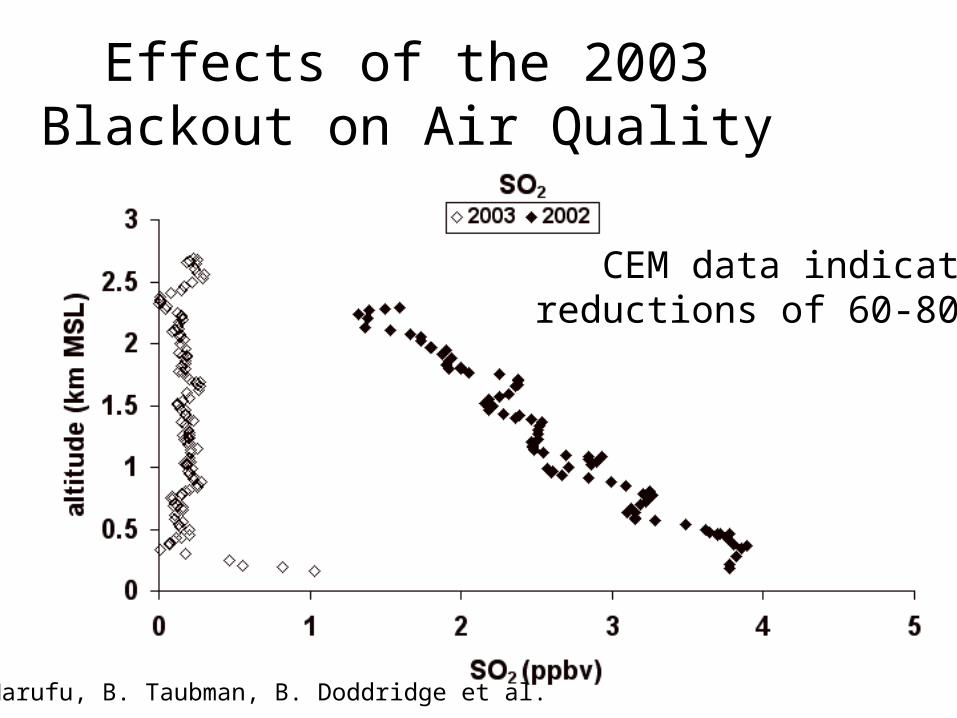
Effects of the 2003 Blackout on Air Quality
CEM data indicatereductions of 60-80%
L. Marufu, B. Taubman, B. Doddridge et al.

Effects of the 2003 Blackout on Air Quality
In summary
• It isn’t all transport…• It isn’t all local…• It isn’t all power plants…• It isn’t all automobiles…• The problem will not be solved by addressing any
one of these problems individually. ALL of these will have to show significant reductions for us to breathe clean air.