metodološki pristup istraŽivanju procesa · pdf filelučkoga kontejnerskog terminala...
TRANSCRIPT
POMORSTVO • Scientific Journal of Maritime Research • 26/1(2012) • str./pp. 227-250 227
Dr. sc. Zdenka Zenzerović / Ph. D.Mr. sc. Nataša Antonini / M. Sc.Mr. sc. Siniša Vilke / M. Sc.Sveučilište u Rijeci / University of RijekaPomorski fakultet u Rijeci /Faculty of Maritime Studies RijekaStudentska 251000 RijekaHrvatska / Croatia
Pregledni članakReview article
UDK / UDC: 519.872
656.61.073.235 (497.5 Rijeka)
Primljeno / Received: 26. travnja 2012. / 26th April 2012
Odobreno / Accepted: 4. lipnja 2012. / 4th June 2012
METODOLOŠKI PRISTUP ISTRAŽIVANJU PROCESA OPSLUŽIVANJA − STUDIJA SLUČAJA KONTEJNERSKOG
TERMINALA RIJEČKE LUKE1
METHODOLOGICAL APPROACH TO THE SERVICE PROCESS
RESEARCH CASE STUDY – CONTAINER TERMINAL AT THE PORT OF RIJEKA1
SAŽETAK
Za optimalno funkcioniranje kontejnerskog terminala od posebne je važnosti definirati kapacitet terminala koji će omogućiti ostvarenje definiranog plana proiz vodnje, a time i plana realizacije lučkih usluga. U praksi je vrlo teško odrediti i dimenzionirati optimalan kapa citet lučkoga kontejnerskog terminala zbog oscilacija lučkog prekrcaja uvjetovanih neravnomjernim pristiza njem kontejnerskih brodova na terminal te neujednačenim trajanjem operacija s kontejnerima. Cilj ovoga rada je prikazati metodološki pristup, odnosno metode primjenom kojih je moguće odrediti značajke i pokazatelje funkcioniranja lučkoga kontejnerskog terminala, a koji su temelj za donošenje odgovarajućih poslovnih odluka za promatrani terminal. Prikazana metodologija je testirana na primjeru kontejnerskog terminala riječke luke Brajdica.
Ključne riječi: korelacija, razdiobe vjerojatnosti, nepara metarski testovi, teorija redova čekanja, kontejnerski terminal riječke luke Brajdica
SUMMARY
For an optimal functioning of the container terminal, it is especially important to define the capacity of the terminal that affects the possibility of achieving the production plan, and also the realization plan for port services. In practice, it is very difficult to determine and submit an optimal capacity of a port container terminal because of the port reload fluctuation conditioned by the uneven arrival of container ships to the terminal and uneven duration of operations with containers. The goal of this paper is to present the methodological approach, that is, methods that enable to define the features and indicators of a port container terminal operation, which are fundamental for making relevant business decisions for a given terminal. The presented methodology was actually tested on the example of the container terminal “Brajdica” at the Port of Rijeka.
Key words: correlation, probability distributions, nonparametric tests, queuing theory, container terminal “Brajdica” at the Port of Rijeka
1 Ovaj rad je rezultat istraživanja na projektu: Kvantitativne metode u funkciji optimalnog upravljanja pomorskim susta-vom, broj projekta: 112-1121722-3308, koji financira Ministar-stvo znanosti, obrazovanja i športa Republike Hrvatske.
1 This paper is the research result on the project: “Quantitative Methods in the Function of the Optimal Management of Marine Systems”, project number: 112-1121722-3308, which is financed by the Ministry of Science, Education and Sport.
Z. Zenzerović, N. Antonini, S. Vilke: METODOLOŠKI PRISTUP ISTRAŽIVANJU PROCESA OPSLUŽIVANJA...
228 POMORSTVO • Scientific Journal of Maritime Research • 26/1(2012) • str./pp. 227-250
1. UVOD
Lučki diskontinuitet2 je pojam kojim je pro-fesor Ante Turina [16] označio kolebanja u pro-cesu proizvodnje lučke usluge kad u određeno vrijeme u luci nema brodova pa se ne iskrcava, odnosno ukrcava teret s/na brod ili pak kad u danima ili satima istog razdoblja brodovi mora-ju čekati na obavljanje određenih lučkih usluga. Posljedica je takvih kolebanja neravnomjernost lučkog prometa, tj. neujednačena količina tere-ta, broja putnika ili brodova tijekom promatra-nog razdoblja.
Ta se činjenica odnosi na sve vrste luka pa tako i na lučke kontejnerske terminale, tijekom godine, mjeseci i dana, ponavlja u određenim vremenskim ciklusima i prisutna je u svim luka-ma bez obzira na geografski položaj i državne granice, a rezultat je utjecaja različitih čimbeni-ka (sezonska uvjetovanost, nepravilnost “proiz-vodnje” lučke usluge zbog tehničkih, tehnološ-kih i organizacijskih razloga, elementarni poremećaji, ...).
Oscilacije prometa u lukama, koje se ne mogu izbjeći ni predvidjeti količinski u sadaš-njosti i budućnosti, utječu na problem dimenzi-oniranja svih elemenata koji sudjeluju u proce-su proizvodnje lučke usluge, posebno na utvrđivanje potrebnog broja pristana. Naime, luka bi trebala raspolagati rezervnim kapacite-tima za slučajeve dnevnog ili mjesečnog maksi-malnog prometa (tzv. “špica”) da bi se u sva-kom trenutku mogao obaviti lučki prekrcaj, ali takve bi rezerve kapaciteta smanjile stupanj nji-hova iskorištenja. Neravnomjernost prometa ne utječe samo na veličinu prekrcajnih i skladišnih kapaciteta u luci, već i na broj zaposlenih koji bi trebao biti usklađen s promjenama kapacite-ta, a sve se to negativno odražava na poslovanje luke.
Problem dimenzioniranja optimalnog kapa-citeta kontejnerskog terminala moguće je riješi-ti primjenom odgovarajućih kvantitativnih me-toda. Cilj je ovoga rada prikazati metodološki pristup, odnosno metode kojima se određuju značajke i pokazatelji funkcioniranja lučkoga kontejnerskog terminala, a koji su temelj za do-
2 Termin “diskontinuitet” nije najadekvatniji, jer taj pojam u lučkom prekrcaju ne znači prekid procesa proizvodnje lučke usluge, što bi se moglo zaključiti prema terminu, iako ponekad u luci može doći do takvog prekida. Zbog navedenih razloga predlažu se termini: “neravnomjernost”, “neujednačenost” ili “oscilacije” lučkog prekrcaja, odnosno lučkog prometa koji će biti korišteni u ovome radu.
1. INTRODUCTION
Port discontinuity2 is the term introduced by professor Ante Turina [16] referring to fluctua-tions in the manufacturing process of port serv-ices where at times there are no ships in the port and consequently there is no discharging or loading from/onto ships, or where, on days or hours within the same period, ships must wait for particular port services. Such fluctua-tions result in irregular port traffic, i.e., ununi-form quantity of cargo, number of passengers or ships over a given period.
This fact applies to all ports including the port container terminals, throughout the year, months and days, repeated at regular cycles and is present in all ports regardless of geographical location and national boundaries, and it is the result of the influence of various factors (season-al conditioning, irregularity “production” of port services for technical, technological and organi-zational reasons, elemental disturbances ...).
Traffic oscillations in ports, which cannot be avoided or foreseen in terms of quantity, both in present time or future, influence the issue of di-mensioning all elements involved in a port serv-ice process, particularly defining the required number of berths. Specifically, the container ter-minal should handle with the reserve capacity for cases of daily and monthly maximal traffic (“peak traffic”), so the containers, at any moment, could be reloaded, but such capacity reserves would re-duce the usage degree of the terminal. The unu-niform traffic does not influence only the volume of transshipment and warehouse capacities in a port, but the number of employees as well, which should be well coordinated with the changes in the capacity, and all these facts have a negative impact on the port operations.
The issue of dimensioning optimal capacity of container terminals may be solved by imple-menting certain quantitative methods. The ob-jective of this paper is to present the methodo-logical approach, that is, the methods used to determine features and indicators of a port container terminal operation, which are funda-mental for making relevant business decisions for the given terminal. For this purpose the sta-
2 Term “discontinuity” may not be the proper one, since, in port transshipment, it does not mean the ceasing of port service process, as it may suggest, although such a cease may occasionally occur. Therefore, the following terms are suggested: “irregularity”, “non uniformity” or “oscillations” in port transshipment or port traffic, which terms will be used hereinafter.
Z. Zenzerović, N. Antonini, S. Vilke: METHODOLOGICAL APPROACH TO THE SERVICE PROCESS...
POMORSTVO • Scientific Journal of Maritime Research • 26/1(2012) • str./pp. 227-250 229
nošenje odgovarajućih poslovnih odluka za promatrani terminal. U tu svrhu su korištene statističke metode (deskriptivna statistika, me-toda korelacije, testiranje hipoteze, neparame-tarski testovi) i metode operacijskih istraživanja (teorija redova čekanja).
U znanstvenoj i stručnoj literaturi je dosad objavljen niz radova vezanih uz primjenu teori-je redova čekanja (vidjeti popis literature), me-đutim, nije prikazan redoslijed metoda koje je neophodno primijeniti da bi se došlo do rezul-tata potrebnih za optimalno poslovno odlučiva-nje, što je učinjeno u ovome radu.
Prikazana metodologija ilustrirana je na pri-mjeru kontejnerskog terminala Brajdica luke Rijeka.
2. STATISTIČKA ANALIZA DOLAZAKA KONTEJNERSKIH
BRODOVA I VREMENA NJIHOVOG OPSLUŽIVANJA
Analiza toka dolazaka kontejnerskih brodo-va i vremena njihovog opsluživanja se provodi na način da se najprije ispita postojanje veze iz-među pristiglih brodova i vremena kada su ti brodovi stigli na terminal, a nakon dobivenog zaključka odrede odgovarajuće razdiobe vjero-jatnosti koje slijede navedene varijable.
2.1. Međuzavisnost broja brodova i dana pristizanja na kontejnerski terminal
S obzirom na oscilacije dolazaka brodova za pretpostaviti je da ne postoji nikakva veza iz-među broja kontejnerskih brodova i dana kada su ti brodovi pristigli na terminal. Da bi se ispi-tala postavljena pretpostavka primijenjena je metoda korelacije za grupirane elemente [15, str. 119].
Preduvjet za primjenu ove metode je priku-pljanje podataka o broju pristiglih brodova po danima za odabrane godine. U sljedećem kora-ku podaci se sređuju na način da je broj brodo-va grupiran prema broju brodova idućeg dana i broju brodova prethodnog dana. U tu svrhu se sastavlja korelacijska tablica u kojoj pojavu X predstavlja broj brodova idućeg dana, a pojavu Y broj brodova prethodnog dana. Podaci u ta-blici dobivaju se zbrajanjem svih slučajeva gdje je za određeni broj brodova, broj brodova pret-
tistical methods (descriptive statistics, correla-tion method, hypothesis testing, nonparametric tests) and the operations research methods (queuing theory) are used.
Till nowadays, numerous papers addressing the implementation of the queuing theory (please refer to References) have been pub-lished in scientific and technical literature, but none of them has presented the sequence of methods to be applied in order to learn the re-sults necessary for an optimal business decision making. It is this aspect of the problem that this paper addresses.
The presented methodology is illustrated by using the example of a container terminal at “Brajdica”, the Port of Rijeka container termi-nal.
2. STATISTICAL ANALYSIS OF THE CONTAINER SHIP
ARRIVALS AND THE TIME OF THEIR SERVING
The analysis of the flow of arrivals of con-tainer ships and their serving time is carried out in the way of first investigating the relationship between the arriving ships and the time when these ships arrived at the terminal, and after the conclusion has been reached, it is necessary to determine the appropriate probability distri-butions that follow these variables.
2.1. Interdependence between the number of ships and days of arrival at the container terminal
Considering the oscillations in the arrival of container ships, it is fair to assume that there is no relation between the number of container ships and the day the ships arrived at the termi-nal. In order to verify this hypothesis, the cor-relation method for grouped elements was ap-plied [15, pg.119].
A prerequisite for the application of this method is to collect the data on the number of ships arriving in the days of the year selected. In the next step the data are going to be ar-ranged in a way that the number of ships is grouped according to the number of ships the next day and the number of ships the previous day. For this purpose a correlation table is com-piled in which the occurrence of X is the number of ships the next day, and the occur-rence of Y is the number of ships the previous
Z. Zenzerović, N. Antonini, S. Vilke: METODOLOŠKI PRISTUP ISTRAŽIVANJU PROCESA OPSLUŽIVANJA...
230 POMORSTVO • Scientific Journal of Maritime Research • 26/1(2012) • str./pp. 227-250
hodnog dana iznosio Y, a istodobno broj brodo-va idućeg dana X.
Jakost veze između broja brodova idućeg i prethodnog dana pokazuje koeficijent korelaci-je koji se izračunava prema formuli [15, str. 124]
yx
jiyx
NYXNYXf
r ji
σσ∑ −⋅
= , (1)
gdje je:
f – frekvencija (broj dana)N – ukupan broj dana
σ x – standardna devijacija za pojavu X (broj brodova idućeg dana)
σ y – standardna devijacija za pojavu Y (broj brodova prethodnog dana)
X – aritmetička sredina za pojavu X
Y – aritmetička sredina za pojavu Y.
Koeficijent korelacije3 poprima vrijednosti u intervalu [-1, 1]. Kada se koeficijent korelacije približava ±1, veza među pojavama je jaka, kada je jednak ±1 pojave su linearno zavisne, a kada je koeficijent korelacije blizu nuli veza je slaba. Predznak koeficijenta korelacije pokazu-je je li veza prema smjeru pozitivna ili negativ-na.
Na temelju dobivene vrijednosti koeficijenta korelacije zaključuje se postoji li značajna ili slučajna zavisnost u redoslijedu dnevnih dola-zaka brodova.
Budući da su vrijednosti koeficijenta korela-cije, prema dosadašnjim iskustvima autora [20, str. 47–52] vrlo blizu nule, izlazi da nema zna-čajne zavisnosti u redoslijedu dnevnih dolazaka brodova na kontejnerski terminal, što znači da se dolasci brodova mogu promatrati kao neza-visni, u statističkom smislu slučajni i da se može uzeti da je broj brodova koji pristižu na kontej-nerski terminal slučajna (stohastička) varijabla.
Analogno se provodi ispitivanje i za varijablu duljina vremena opsluživanja brodova, odno-sno broj opsluženih brodova.
Da bi se pokazalo da nema bitne razlike iz-među koeficijenata korelacije za pojedine godi-ne (razdoblja) primjenjuje se postupak testira-nja hipoteze, odnosno ispitivanje pretpostavke
3 Vrijednost koeficijenta korelacije moguće je dobiti primje-nom računalnih programa dostupnih na internetu [11], [12].
day. The data in the table are obtained by sum-ming up all cases where, for a certain number of ships, the number of ships of the previous day is presented by Y, while the number of ships of the next day is presented by X.
The strength of relationship between the number of ships the next and the previous day shows the correlation coefficient which is calcu-lated by the formula [15, pg.124]
yx
jiyx
NYXNYXf
r ji
σσ∑ −⋅
= , (1)
where:
f – frequency (number of days)N – total number of days
σ x – standard deviation for the occurence of X (number of ships the next day)
σ y – standard deviation for the occurence of Y (number of ships the previous day)
X – arithmetic mean for the occurence of X
Y – arithmetic mean for the occurence of Y.
The correlation coefficient3 takes values in the interval [-1, 1]. When the correlation coeffi-cient approaches ±1, the connection between the phenomena is strong; when it is equal to ±1, the phenomena are linearly dependent, and when a correlation coefficient is close to zero, the connection is weak. The prefix of the correlation coefficient indicates whether the connection has a positive or negative direction.
On the basis of the correlation coefficient values, a conclusion can be made as to whether dependency is significant or random in the se-quence of the ships’ daily arrivals.
Since the value of the correlation coefficient, according to previous experiences of the authors [20, pg. 47-52], is very close to zero, it follows that there is no significant dependence of the or-der of the daily arrivals of ships at the container terminal, which means that the arrivals of the ships can be seen as independent, random in the statistical sense, and that the number of ships ar-riving at the container terminal can be taken as a random (stochastic) variable.
The duration of service and the number of serviced ships variables are tested in an analo-gous way.
3 The value of the correlation coefficient can be obtained by using computer programs available on the Internet [11], [12].
Z. Zenzerović, N. Antonini, S. Vilke: METHODOLOGICAL APPROACH TO THE SERVICE PROCESS...
POMORSTVO • Scientific Journal of Maritime Research • 26/1(2012) • str./pp. 227-250 231
o nepostojanju značajne razlike između njiho-vih vrijednosti [15, str. 333–334].
Postupak testiranja se odvija na sljedeći na-čin
H0: r1– r2= 0 i H1: r1– r2 ≠ 0 .
Empirijske vrijednosti koeficijenata korelaci-je se transformiraju pomoću odgovarajuće ta-blice u z1 i z2. Standardna pogreška razlike iz-među dviju vrijednosti z iznosi
31
31)(
2121 −
+−
=−nn
zze s , (2)
gdje su n1 i n2 ukupan broj dana. Hipoteza o jednakosti koeficijenata korelacije se prihvaća
kada se razlika 21 ˆˆ zz − , koja se dobiva primje-
nom tablice za preračunavanje r u vrijednost ,znalazi u intervalu
( )210 zze st −⋅± , (3)
gdje je t koeficijent pouzdanosti (t = 1,96 za ra-zinu značajnosti od 5%). Ako je izračunata ra-zlika u intervalu prihvaćanja nul-hipoteze, tada nema dovoljno argumenata da se ta hipoteza odbaci, a to dalje znači prihvaćanje da se koefi-cijenti korelacije za navedene godine međusob-no ne razlikuju bitno. Drugim riječima, na te-melju prethodnog zaključka slijedi da nije potrebno ispitivanje međuzavisnosti provoditi za svaku godinu pojedinačno, već je dovoljno uzeti samo jednu godinu ili razdoblje od više godina kao reprezentanta promatrane pojave.
2.2. Određivanje razdiobe vjerojatnosti za pristigle kontejnerske brodove i duljinu vremena njihovog opsluživanja
Dosadašnja istraživanja [20], [22] su pokaza-la da su broj pristiglih brodova i duljina vreme-na opsluživanja broda slučajne varijable; zbog toga nije moguće unaprijed odrediti vrijednosti tih varijabli, ali je moguće odrediti njihove raz-diobe vjerojatnosti.
Da bi se mogle izračunati vjerojatnosti reali-zacije slučajnih varijabli koje predstavljaju broj dolazaka brodova i broj opsluženih brodova na kontejnerskom terminalu potrebno je raspola-gati podacima o broju dolazaka brodova po da-nima, zatim provesti statističku analizu tih po-dataka te usporediti empirijsku razdiobu s odabranim teorijskim razdiobama, odnosno
To show that there is no significant difference between the correlation coefficients for each year (period), the procedure to test the hypoth-esis, i.e. testing the hypothesis that there is no significant difference between their values, is applied [15, pg.333-334].
The testing procedure is done as follows
H0: r1– r2= 0 i H1: r1– r2 ≠ 0 .
The empirical values of the correlation coef-ficients are transformed by using the appropri-ate tables in the z1 and z2.The standard error of the difference between the two values of z is
31
31)(
2121 −
+−
=−nn
zze s , (2)
where n1 and n2 are the total number of days. The hypothesis of equality of the correlation coefficients is accepted when the difference
21 ˆˆ zz − , which is obtained by applying a Table
for converting the value of r in the value of ,z is in the interval
( )210 zze st −⋅± , (3)
where t is the confidence coefficient (t = 1.96 for the level of significance of 5%). If the calculated difference is in the interval of accepting the null hypothesis, then there are no sufficient argu-ments to reject this hypothesis, but it still means the acceptance of the hypothesis that the corre-lation coefficients for these years do not differ significantly. In other words, based on the previ-ous conclusion, it follows that it is not necessary to test interdependencies performed for each year individually, but it is sufficient to take only one year or a period of several years as the rep-resentative of the observed phenomena.
2.2. Determination of the probability distribution for the container ships arrivals and the length of their serving time
The previous studies [20], [22] have shown that the number of arriving ships and the length of the ship serving time are the random varia-ble; therefore, it is not possible to predetermine the values of these variables, but it is possible to determine their probability distribution.
To be able to calculate the probability of the realization of the random variables represent-ing the number of the ships’ arrivals and the number of the ship serving time at the contain-er terminal, it is necessary to get the data on

Z. Zenzerović, N. Antonini, S. Vilke: METODOLOŠKI PRISTUP ISTRAŽIVANJU PROCESA OPSLUŽIVANJA...
232 POMORSTVO • Scientific Journal of Maritime Research • 26/1(2012) • str./pp. 227-250
odrediti teorijsku razdiobu s kojom se može aproksimirati empirijska razdioba.
Pretpostavka da je empirijska razdioba ras-poređena prema nekoj teorijskoj razdiobi ispi-tuje se testovima za verifikaciju statističkih hi-poteza, tzv. neparametarskim testovima, od kojih se u praksi najčešće koriste χ2_test (hi-kvadrat test) i Kolmogorov-Smirnovljev test4. Testiranjem se donosi odluka o prihvaćanju ili nul-hipoteze H0: empirijska razdioba se ponaša prema odabranoj teorijskoj razdiobi ili alterna-tivne hipoteze H1: empirijska razdioba se ne ponaša prema odabranoj teorijskoj razdiobi.
Ako se nakon primjene testa dobije zaključak da se empirijska razdioba ponaša prema nekoj teorijskoj razdiobi tada se ta razdioba može pri-hvatiti kao razdioba na temelju koje se donose zaključci o promatranoj empirijskoj razdiobi.
Primjena χ2_testa se temelji na vrijednosti χ2
koja se dobiva pomoću formule
( )χ 2
2
1=−
=∑ f f
f
i tii
n
ti, (4)
gdje je:
fi – originalna (empirijska) frekvencija i-te vrijednosti slučajne varijable u uzorku
fti – odgovarajuća teorijska (očekivana) fre-kvencija
n – broj klasa, odnosno broj parova vrijed-nosti fi i fti
N = ∑fi.
Teorijske frekvencije se izračunavaju po for-muli
fti = N·P(xi), (5)
gdje je N ukupan broj jedinica, a P(xi) su odgo-varajuće vjerojatnosti.
Odluka o prihvaćanju ili odbacivanju postav-ljene hipoteze temelji se na usporedbi izračuna-te vrijednosti χ2 i tablične vrijednosti χ2
0 koja se očitava iz Tablica kritičnih vrijednosti χ2_razdio-be zavisno od broja stupnjeva slobode (k) i stupnja značajnosti (α), odnosno na temelju vjerojatnosti pi koja pripada izračunatoj vrijed-nosti χ2.
4 Detaljnije o uporabi ovih testova vidjeti u literaturi iz stati-stike u poglavlju o neparametarskim testovima [6], [14], [18], [19]. Također se čitateljima preporučuju računalni programi koji se mogu naći na internetu [4], [11], [12].
the number of the ships’ arrivals per day, then carry out a statistical analysis of these data and compare the empirical distribution with the se-lected theoretical distribution, or determine the theoretical distribution with which the empiri-cal distribution can be approximated.
The hypothesis, that the empirical distribution is arranged on the basis of some theoretical dis-tribution, is subject to the statistical hypothesis tests, so called nonparametric tests, of which the most commonly used are χ2–test (chi–squared test) and Kolmogorov–Smirnov test4. The test is the basis for the decision making as to whether accept or reject the null hypothesis H0: empirical distribution behaves in line with the selected theoretical distribution or the alternative hy-pothesis H1: empirical distribution does not fol-low the theoretical distribution.
If the test asserts that the empirical distri-bution behaves in line with some theoretical, then such a distribution may be accepted as a distribution that represents the basis for mak-ing a conclusion in the given empirical distri-bution.
The implementation of the χ2_ test is based on the value χ2 obtained from the formula
( )χ 2
2
1=−
=∑ f f
f
i tii
n
ti, (4)
where:
fi – original (empirical) frequency of the i-th value of the random variable in the sample,
fti – corresponding theoretical (expected) frequency,
n – number of classes or the number of pairs of values fi and fti
N = ∑fi.
The theoretical frequencies are calculated by the formula
fti = N·P(xi), (5)
where N is the total number of units, and P (x) are the corresponding probabilities.
The decision on the acceptance or rejection of the hypotheses is based on the comparison of the calculated values χ2 and the values from
4 More details on using these tests may be found in References under nonparametric tests [6], [14], [18], [19]. Computer programs, available on Internet, are also suggested [4], [11], [12].
Z. Zenzerović, N. Antonini, S. Vilke: METHODOLOGICAL APPROACH TO THE SERVICE PROCESS...
POMORSTVO • Scientific Journal of Maritime Research • 26/1(2012) • str./pp. 227-250 233
Kolmogorov-Smirnovljev test (KS test) us-poređuje empirijsku Fn(x) s teorijskom F(x) funkcijom razdiobe. Apsolutna vrijednost mak-simalne razlike empirijske funkcije razdiobe i pretpostavljene teorijske
Dn = max|Fn(x) – F(x)|, (6)
(gdje je n broj elemenata u uzorku) je slučajna varijabla koja ima svoju razdiobu vjerojatnosti. Kolmogorovom razdiobom konstruira se kritič-na oblast testa, na način ako je maksimalna ra-zlika u jednoj točki (tj. za određenu vrijednost ispitivanog obilježja) prevelika i nađe se u kri-tičnoj oblasti, tada treba odbaciti hipotezu H0 da obilježje X u osnovnoj populaciji ima pret-postavljenu razdiobu.
Značajno ograničenje primjene KStesta je da pretpostavljena teorijska funkcija razdiobe mora biti neprekidna, za razliku od χ2_testa koji je izvorno kreiran za diskretne razdiobe vjero-jatnosti, ali se može prilagoditi i za kontinuira-ne razdiobe [6, str. 261].
Pored navedenih testova spominje se i An-derson-Darling test5.
Prema iskustvima autora kao i objavljenim stručnim i znanstvenim radovima [2, str. 78], [5], [8, str. 356], [22, str. 54], broj brodova često slijedi Poissonovu razdiobu, a taj se zaključak odnosi i na vrijeme opsluživanja broda6.
Kada rezultati testa pokažu da se navedene varijable ne prilagođavaju dovoljno dobro niti jednoj od odabranih teorijskih razdioba, tada statistika ne daje pravo prihvaćanja nul-hipote-ze, odnosno primjenu zakonitosti teorijske raz-diobe na zaključivanje o empirijskoj razdiobi. Međutim, pojedini statističari predlažu ili meto-du simulacije [8, str. 358] ili prihvaćanje pretpo-stavljene razdiobe kao aproksimaciju realnog problema [17], [3], s obrazloženjem [6, str. 265] da realne razdiobe vjerojatnosti koje opisuju sta-tističke zakonitosti realnih slučajnih pojava su samo približno normalne, približno eksponenci-jalne, te da je testiranje “donekle objektivan na-čin” za utvrđivanje odgovarajućeg modela. Ra-čunalni program WinQSB [1] također koristi aproksimaciju i metodu simulacije za probleme reda čekanja tipa G/G/S i za redove čekanja ko-jima je stupanj opterećenja kanala ρ ≥ 1.
5 Detalji se mogu naći u uputama računalnih programa Easy Fit [4] i Statgraphics [11].6 Međutim, moguće je da se uz iste podatke, primjenom jed-nog testa ili više testova dobiva zaključak o prihvaćanju razli-čitih razdioba vjerojatnosti [6, str. 245].
Table χ20 which is read from the Table of the
critical values χ2- distribution depending on the number of degrees of freedom (k) and on the level of significance (α), or based on the proba-bility pi that belongs to the calculated values χ2.
The Kolmogorov-Smirnov test (KS-test) com-pares the empirical Fn (x) with the theoretical F(x) distribution function. The absolute value of the maximum difference of the empirical distri-bution function and the assumed theoretical
Dn = max|Fn(x) – F(x)|, (6)
(where n is the number of elements in sample) is a random variable having its probability dis-tribution. The Kolmogorov distribution con-structs the test critical area so that if the maxi-mum difference in one point (i.e., for a particular value of the given property) it too large and falls in a critical area, the H0 hypoth-esis, stating that the property X in the basic population does have the assumed distribution, should be rejected.
A significant limit put on the application of the KS-test assumes that the theoretical distribu-tion function must be continuous, as opposed to χ2_ test, which was originally designed for dis-crete probability distributions, but can be adapt-ed for continuous distributions too [6, pg. 261].
Besides the above mentioned tests is the An-derson–Darling test5.
According to the experiences of the authors and published professional and scientific litera-ture [2, pg. 78], [5], [8, pg. 356], [22, pg. 54], the number of ships often follows the Poisson dis-tribution, and this conclusion applies also to the serving time of a ship 6.
When test results show that these variables do not adapt well enough to any of the selected theoretical distributions, then the statistics does not give the right to accept the null hypothesis, i.e., the application of the theoretical distribu-tion patterns to the conclusions made in respect to the empirical distribution. However, some statisticians suggest a method of simulation [8, pg. 358] or the acceptance of the supposed dis-tribution as an approximation of the real prob-lems [17], [3], with an explanation [6, pg. 265] that the real probability distribution describing the statistical rules of real random phenomena
5 Details can be found in the instructions of computer programs EasyFit [4] and Statgraphics [11].6 However, it is possible that the same data, using one or more tests, get a decision on the acceptance of various probability distributions [6, pg. 245].

Z. Zenzerović, N. Antonini, S. Vilke: METODOLOŠKI PRISTUP ISTRAŽIVANJU PROCESA OPSLUŽIVANJA...
234 POMORSTVO • Scientific Journal of Maritime Research • 26/1(2012) • str./pp. 227-250
3. DEFINIRANJE LUČKOGA KONTEJNERSKOG TERMINALA KAO SUSTAVA OPSLUŽIVANJA
Da bi se lučki kontejnerski terminal mogao definirati kao sustav opsluživanja najprije se, primjenom teorije redova čekanja, određuju osnovni parametri: prosječan broj kontejner-skih brodova (odnosno kontejnera) koji pristižu na terminal u promatranoj jedinici vremena i prosječan broj kontejnerskih brodova (odnosno kontejnera) koji se mogu opslužiti u jedinici vremena na terminalu. Zatim se na temelju tih parametara izračunavaju odgovarajući pokaza-telji funkcioniranja lučkoga kontejnerskog ter-minala, kako bi se na kraju, zavisno od postav-ljenog kriterija optimalnosti, donijela odluka o optimalnom kapacitetu lučkoga kontejnerskog terminala.
3.1. Sustavni pristup istraživanju kontejnerskog terminala
Lučki kontejnerski terminal je dio lučkog su-stava namijenjen prekrcaju kontejnera izravnim ili posrednim rukovanjem između kontejner-skih brodova i kopnenih prijevoznih sredstava, i obrnuto te ostalim djelatnostima vezanim za promet kontejnera. Zbog neravnomjernosti do-lazaka brodova i kopnenih vozila te organizaci-je tehnološkog procesa na kontejnerskom ter-minalu, u praksi prevladava posredno rukovanje kontejnerima preko slagališta [21, str. 36].
Lučki kontejnerski terminal je otvoreni su-stav koji neprekidno i vrlo intenzivno komuni-cira s okolinom i usko je vezan sa sustavom po-morskog prometa, sustavom kopnenog prekrcaja i ostalim sustavima koji su nositelji uslužnih aktivnosti neophodnih u prometu kon-tejnera.
Lučki kontejnerski terminal je složen sustav sa sljedećim podsustavima kao svojim elementi-ma [21, str. 36–37]:
• podsustav brod predstavlja element na koji je usmjerena aktivnost, a obuhvaća brodove, odnosno kontejnere prema vrsti i količini;
• podsustav operativna obala uključuje prista-ne, obalne kontejnerske dizalice i krcalište (operativna površina namijenjena operacija-ma s kontejnerima);
are only approximately normal, approximately exponential, and that testing is a “somewhat objective way” to determine the appropriate model. A computer program WinQSB [1] also uses the approximation and simulation meth-ods for the queuing problems of the G/G/S type and for the queues with the channel load de-gree (traffic intensity) ρ ≥ 1.
3. DEFINING THE PORT CONTAINER TERMINAL AS A
SERVING SYSTEM
In order to define a port container terminal as a serving system, basic parameters should be de-fined by using the queuing theory: the average number of container ships (or containers) arriv-ing in a given unit of time and the average number of container ships (or containers) that can be served on the terminal in a unit of time. Then, on the basis of these parameters, relevant indicators of a port container terminal operation are calculated, and finally, depending on the op-timality criterion, the decision is made on the optimal capacity of the port container terminal.
3.1. System approach to the study of a port container terminal
The port container terminal is a part of the port system whose purpose is the transshipment of containers by direct or indirect handling be-tween container ships and shore transportation and vice versa as well as other activities con-nected with the container traffic. Due to the random arrivals of ships and road vehicles and the organization of the technological processes in the port container terminal, handling through the stacking area predominates in practice (21, pg. 36).
The port container terminal is an open sys-tem which constantly and very intensively com-municates with the environment and is closely linked to the maritime transportation system, shore transportation system and other systems which carry out serving activities indispensable in the container traffic.
The port container terminal is a complex sys-tem with the following subsystems as its ele-ments [21, pg. 36-37]:
• the ship subsystem is an element which the ac-tivity is aimed at and which covers ships or containers according to the amount and type,
Z. Zenzerović, N. Antonini, S. Vilke: METHODOLOGICAL APPROACH TO THE SERVICE PROCESS...
POMORSTVO • Scientific Journal of Maritime Research • 26/1(2012) • str./pp. 227-250 235
• podsustav slagalište je otvoreni prostor ure-đen za smještaj i čuvanje različitih vrsta kon-tejnera do njihovog ukrcaja na brod ili utova-ra na kopneno vozilo;
• podsustav prometnica za unutarnji prijevoz čine željeznički kolosijeci, željeznička postro-jenja te cestovne prometnice;
• podsustav rukovanja kontejnerima obuhvaća operacije s kontejnerima na sidrištu, pristanu i slagalištu;
• podsustav organizacije je element terminala sa zadatkom planiranja, koordinacije, nadzo-ra i kontrole prekrcajnog procesa, admini-strativnog praćenja kontejnera, fakturiranja usluga lučkoga kontejnerskog terminala.
Elementi lučkoga kontejnerskog terminala su tehničke, tehnološke, ekonomske, pravne i organizacijske prirode i nalaze se u odnosima međusobne funkcionalne povezanosti.
Projektiranje svakog podsustava zasebno onemogućuje definiranje lučkoga kontejner-skog terminala kao cjeline, odnosno određiva-nje veza između navedenih podsustava. Stoga sustavni pristup nalaže da se svi elementi lučko-ga kontejnerskog terminala trebaju razmatrati zajedno kao podsustavi u međusobnoj interak-ciji da bi se moglo pratiti poslovanje lučkoga kontejnerskog terminala i postići njegovo opti-malno funkcioniranje.
Budući da kapacitet pristana determinira po-treban kapacitet ostalih podsustava lučkoga kontejnerskog terminala, a time i propusnu moć kontejnerskog terminala kao cjeline, pro-blem određivanja optimalnog kapaciteta lučko-ga kontejnerskog terminala svodi se na izraču-navanje optimalnog broja pristana, što će biti prikazano u ovome radu.
3.2. Pokazatelji funkcioniranja lučkoga kontejnerskog terminala
Iz prethodnih zaključaka slijedi da se broj dolazaka brodova i duljina vremena njihovog opsluživanja mogu uzeti kao slučajne varijable, a zatim empirijske razdiobe tih varijabli aprok-simirati s odgovarajućim teorijskim razdioba-ma. U tome se slučaju za izračunavanje pokaza-telja funkcioniranja lučkoga kontejnerskog terminala može primijeniti analitički pristup pomoću teorije redova čekanja.
• the quay subsystem is made up of berths, wharf container cranes and loading spots (operational surface area for carrying out operations with containers),
• the stacking area subsystem is an open area organized for the stacking and protection of various types of containers until they are dis-patched from the terminal,
• the internal traffic network subsystem is made up of railway tracks, rail installations and road networks,
• the container handling subsystem covers su-pervision of containers at anchorage, at the berth and on the stacking area,
• the organization subsystem is an element of the terminal aimed at planning, coordina-ting, supervising and controlling the transshi-pment processes, administrative monitoring of containers, invoicing port container termi-nal services, etc.
The elements of the port container terminal have a technical, technological, economic and organizational nature and are all in mutual functional interaction links.
Designing a particular subsystem separately is in collision with defining a port container ter-minal as a whole, as well as with determining the relationships between the subsystems. Therefore, a system approach claims that all el-ements of a port container terminal must be taken into consideration together as subsystems in mutual interaction with the aim of monitor-ing a port container terminal work and achiev-ing its optimal functioning.
Since the capacity of the berth determines the required capacity of other subsystems of port container terminals, and thus the through-put capacity of a container terminal as a whole, the problem of determining the optimum ca-pacity of the port container terminal is reduced to calculate the optimum number of berths, which will be shown in this paper.
3.2. Indicators of a port container terminal functioning
From previous findings, it follows that the number of the ship arrivals and the length of their serving time may be taken as random vari-ables, and after that the empirical distributions of these variables can be approximated with the corresponding theoretical distributions. In this case an analytical approach, using the queuing
Z. Zenzerović, N. Antonini, S. Vilke: METODOLOŠKI PRISTUP ISTRAŽIVANJU PROCESA OPSLUŽIVANJA...
236 POMORSTVO • Scientific Journal of Maritime Research • 26/1(2012) • str./pp. 227-250
Lučki kontejnerski terminal definira se kao sustav opsluživanja sa sljedećom strukturom [21, str.50]: ulazne jedinice su kontejnerski bro-dovi koji formiraju (ili ne) red čekanja (zavisno od trenutačne situacije) da bi bili opsluženi (iskrcaj kontejnera) na pristanu kontejnerskog terminala, te nakon obavljene usluge izašli iz sustava. Vrijedi i obrnuto, u slučaju ukrcaja kontejnera na brod.
Sa stajališta teorije redova čekanja lučki kon-tejnerski terminal ima ove značajke [21, str. 52]:
• Kontejnerski terminal je otvoreni sustav bu-dući da izvori ulaznog toka, tj. brodovi nisu sastavni dio sustava.
• Kontejnerski terminal je jednokanalni ili vi-šekanalni sustav (zavisno od broja pristana), s time da se na sidrištima formiraju redovi čekanja brodova za pojedine pristane.
• Broj pristiglih kontejnerskih brodova kao i duljina vremena opsluživanja, odnosno vrije-me boravka broda na pristanu raspoređeni su prema određenim teorijskim razdiobama (najčešće prema Poissonovoj ili Erlangovoj razdiobi reda k, gdje je k prirodan broj). Vri-jeme opsluživanja broda zajedno s vreme-nom provedenim u redu čekanja predstavlja vrijeme boravka broda na terminalu i jedan je od važnijih pokazatelja funkcioniranja luč-koga kontejnerskog terminala.
• S obzirom na disciplinu čekanja kontejnerski je terminal sustav u kojem se opsluživanje najčešće obavlja prema pravilu FIFO (prvi stigao − prvi opslužen), iako je moguće da postoje brodovi s prioritetom u opsluživanju.
Osnovni parametri lučkoga kontejnerskog terminala su intenzitet toka dolazaka brodova λ i intenzitet opsluživanja μ.
Za odabrani sustav kontejnerskog terminala parametar λ predstavlja prosječan broj kontej-nerskih brodova, odnosno kontejnera koji pri-stižu na terminal tijekom promatrane vremen-ske jedinice (primjerice: tijekom godine, mjeseca ili dana) ili recipročnu vrijednost pro-sječnog vremenskog intervala između dva uza-stopna dolaska broda λ = 1/ t–arr.
Analogno se objašnjava i intenzitet opsluži-vanja μ koji predstavlja prosječan broj kontej-nerskih brodova, odnosno kontejnera koji se mogu opslužiti u jedinici vremena na pojedi-nom pristanu ili recipročnu vrijednost prosječ-nog trajanja usluživanja μ = 1/ t–serv. Parametar μ
theory, can be applied for calculating the func-tioning indicators of the port container terminal.
A port container terminal is defined as a queu-ing system with the following structure [21, pg. 50]: the input units are container ships that form (or not) a queue (depending on the momentary situation) to be served (unloading of containers) at the container berths (serving channels), and leave the system when the service has been per-formed. This could also be reversed, in the case of container loading on board a ship.
From the queuing theory viewpoint, a port container terminal has the following characteris-tics [21, pg. 52]:
• A port container terminal is an open system as the ships are not a component part of the system.
• A port container terminal is a single or mul-tichannel system (depending on the number of berths) and, in this connection, ships at anchorage form queues for particular berths.
• The number of the ship’s arrivals, as well as the duration of the serving time, i.e. duration of the ship’s stay at the berth, are allocated according to certain probability distributions (most often according to Poisson’s or Erlang’s distribution of the k-order, where k is a natural number). The ship’s serving time, together with the time spent queuing at the berth, represents the time of the ship’s stay at the terminal, and is one of the more signi-ficant indicators of the port container termi-nal operations.
• As regards queuing discipline, a container terminal is a system where the serving is most often carried out according to the FIFO rule (first come-first served), but it is possible that there are certain ships which have priority in serving.
The basic parameters of the port container terminal are the intensity of the arrivals of ships (arrival rate) λ and the intensity of the ship serving (service rate) μ.
For the selected container terminal system, parameter λ represents the average number of container ships (i.e. containers) arriving at the terminal during the observed time unit (for ex-ample: during a year, month or day) or the re-ciprocal value of the average time interval be-tween two consecutive ship arrivals λ = 1/ t–arr.
The intensity of the ship serving μ, which represents the average number of container
Z. Zenzerović, N. Antonini, S. Vilke: METHODOLOGICAL APPROACH TO THE SERVICE PROCESS...
POMORSTVO • Scientific Journal of Maritime Research • 26/1(2012) • str./pp. 227-250 237
predstavlja propusnu moć jednog pristana, a umnožak S × μ, gdje je S oznaka za broj prista-na, propusnu moć, odnosno kapacitet kontej-nerskog terminala.
Količnik intenziteta toka dolazaka i intenzi-teta opsluživanja je stupanj opterećenja prista-na ili intenzitet prometa. U praksi se vrijednosti parametara λ i μ određuju na temelju empirij-skih podataka ili procjenom zavisno od cilja i predmeta istraživanja.
Na temelju definicije kontejnerskog termina-la kao sustava opsluživanja i osnovnih parame-tara terminala izračunavaju se pokazatelji funk-cioniranja lučkoga kontejnerskog terminala: koeficijent iskoristivosti kontejnerskog termi-nala, vjerojatnost opsluživanja, prosječan broj brodova u redu čekanja, odnosno na terminalu, prosječno vrijeme broda u redu čekanja, odno-sno provedeno na terminalu, ... .
Prema klasifikaciji problema redova čekanja, kontejnerski terminal je sustav s čekanjem koji dozvoljava beskonačni broj brodova u redu če-kanja s oznakom M/M/S/∞ ili G/G/∞, zavisno od teorijske razdiobe za dolaske i vrijeme op-služivanja broda.
Pokazatelji funkcioniranja kontejnerskog ter-minala izračunavaju se prema odgovarajućim formulama teorije redova čekanja7 [22, str. 19–26].
Promjena broja pristana utječe na povećanje, odnosno smanjenje vrijednosti pojedinih poka-zatelja kontejnerskog terminala: povećanjem broja pristana smanjuje se broj brodova u redu čekanja i na terminalu te vrijeme čekanja i vri-jeme boravka broda na terminalu, a povećava neiskorištenost pristana.
Na temelju pokazatelja o funkcioniranju kontejnerskog terminala može se postaviti pita-nje kako odrediti broj pristana da se čekanje broda i pristana svede na najmanji mogući iznos.
Odluka o optimalnom broju pristana kontej-nerskog terminala zavisi od postavljenog krite-rija optimizacije, primjerice: postotka iskorište-nja pristana, duljine vremena čekanja broda u redu, broja brodova u redu čekanja ili troškova
7 Osim navedenog izvora formule za izračunavanje pokaza-telja sustava opsluživanja mogu se naći u knjigama iz teori-je redova čekanja [3], [7], [8], [17]. Čitateljima se preporuča korištenje odgovarajućih računalnih programa, primjerice WINQSB koji se može naći na http://winqsb.en.softonic.com/download (travanj, 2012).
ships (i.e. containers) that can be served in a unit of time at a certain berth or the reciprocal value of the average time of the ship serving μ = 1/ t–serv has been analogously explained. The parameter μ represents the throughput of the single berth and the product S× μ, where S is the berth number, the throughput, or the ca-pacity of the container terminal.
The ratio between the arrival rate and the service rate is the degree of the berth load or the traffic intensity. In practice, the values of the parameters λ and μ are defined on the basis of the empirical data sheet or of the assessment depending on the goal and object of research.
Based on the definition of a container termi-nal as a queuing system and the basic parame-ters of the terminal, the indicators of the port container terminal functioning are calculated: the efficiency coefficient of a container termi-nal, the probability of serving, the average number of ships in the queue or at the termi-nal, the average time of a ship in the queue or spent at the terminal, ...
According to the classification of queuing problems, the container terminal is a queuing system that allows an infinite number of ships in the queue with the sign M/M/S/∞ or G/G/∞, depending on the theoretical distributions for the arrival rate and the serving time of a ship.
Indicators of a container terminal operation are calculated according to the corresponding formulas of the queuing theory7 [22, pg. 19–26].
The change in the number of berths affects the increase or decrease of the values of certain indicators of a container terminal: increasing the number of berths reduces the number of the queuing up ships and of the ships at the ter-minal as well as the waiting time and the stay time at the terminal, while the underutilization of the berth is increased.
On the basis of the container terminal opera-tion indicators, a question may be raised as to how to define the number of berths in order to reduce the waiting time and the number of berths as much as possible.
The decision on the optimal number of berths at a container terminal depends on the established optimization criteria, for example: the percentage utilization of the berth, the
7 Except from the above sources the formulas for calculating the parameters of the queuing process can be found in books on the theory of queues [3], [7], [8], [17]. Readers are advised to use appropriate computer programs, such WinQSB which can be found at http://winqsb.en.softonic.com/download (April 2012).
Z. Zenzerović, N. Antonini, S. Vilke: METODOLOŠKI PRISTUP ISTRAŽIVANJU PROCESA OPSLUŽIVANJA...
238 POMORSTVO • Scientific Journal of Maritime Research • 26/1(2012) • str./pp. 227-250
čekanja broda i nezauzetosti pristana, odnosno odabire se onaj kriterij koji se smatra najvažni-jim za efikasno funkcioniranje kontejnerskog terminala.
Efikasnost kontejnerskog terminala najčešće se u praksi određuje pomoću pokazatelja dulji-ne vremena boravka broda na terminalu (vrije-me broda provedeno u redu čekanja i vrijeme opsluživanja broda) i ona se povećava ili pove-ćanjem broja pristana ili skraćivanjem prosječ-nog vremena opsluživanja. Međutim, poveća-njem broja pristana povećat će se vjerojatnost da su pristani slobodni, a to znači da će se pove-ćati nezauzetost pristana. Isto tako, skraćivanje vremena opsluživanja broda može utjecati na kvalitetu usluge te na smanjenje broja dolazaka brodova. Zato se efikasnost kontejnerskog ter-minala najbolje može odrediti uvođenjem vri-jednosnih pokazatelja, tj. pomoću troškova, bu-dući da se u praksi čekanje broda plaća, a nezauzetost pristana se također može vrijedno-sno izraziti.
4. STUDIJA SLUČAJA – KONTEJNERSKI TERMINAL RIJEČKE LUKE BRAJDICA
Primjena predloženih metoda proučavanja procesa opsluživanja na lučkim kontejnerskim terminalima prikazana je na primjeru kontej-nerskog terminala riječke luke.
4.1. Tehničko-tehnološke značajke kontejnerskog terminala Brajdica
Do 2011. godine vlasnik kontejnerskog ter-minala Brajdica bila je tvrtka Jadranska vrata d.d. u stopostotnom vlasništvu Luke Rijeka d.d. Novi strateški partner i vlasnik 51% dionica tvrtke Jadranska vrata d.d., koja je njegovim ulaskom preimenovana u Adriatic Gate Conta-iner Terminal je međunarodni lučki operater ICTS (International Container Terminal Servi-ces).
Kontejnerski terminal Brajdica raspolaže s dva pristana: Kostrensko pristanište-jug te Ko-strensko pristanište-zapad. Dužina južnog pri-stana iznosi 295 metara, a dubina mora uz oba-lu 12 metara, dok je zapadni pristan dug 164 metara s dubinom mora uz obalu od 11 metara. Na zapadnom pristanu se nalazi obalna kontej-nerska dizalica Metalna, koja je preseljena s
length of the queuing up time of a ship, the number of ships queuing up or the waiting costs of a ship and the unoccupancy of the berth, and, finally, or, in other words, the one criteri-on, that is considered as the most important for an efficient functioning of the container termi-nal, is selected.
The efficiency of the container terminal is mostly defined by using the indicator of the du-ration of the ship stay at the terminal (the dura-tion of the ship in queue and the duration of the ship serving) and is increased either by in-creasing the number of berths or reducing the average serving time. However, by increasing the number of berths the probability that the berths are free will also increase which means that the unoccupancy of berths will increase. Moreover, reducing the time of a ship serving time can affect the quality of service and reduce the number of the ship arrivals. So the efficien-cy of the container terminal can be best deter-mined by using the value indicators, in other words the costs, since the waiting of the ship produces payments and the disengagement of the berths also carries a value.
4. CASE STUDY– THE CONTAINER TERMINAL “BRAJDICA” AT THE
PORT OF RIJEKA
The implementation of the proposed meth-ods for studying the serving processes at the port container terminals is presented through the example of the container terminal “Brajdi-ca” at the Port of Rijeka.
4.1. Technical-technological aspect of the container terminal “Brajdica”
Since the year 2011, the owner of the con-tainer terminal “Brajdica” has been the compa-ny Jadranska vrata, the company owned by the Port of Rijeka in 100 percent of stocks. The new strategic partner and the owner of 51 per-cent of the stocks of the company Jadranska vrata, which, with the entering of this new part-ner, was renamed into the Adriatic Gate Con-tainer Terminal, is now the international port operator ICTS (International Container Termi-nal Services).
The container terminal “Brajdica” has two berths: the first berth, the Kostrenska quay – SOUTH, and the second berth, the Kostrenska quay – WEST. The southern berth is 295 m long

Z. Zenzerović, N. Antonini, S. Vilke: METHODOLOGICAL APPROACH TO THE SERVICE PROCESS...
POMORSTVO • Scientific Journal of Maritime Research • 26/1(2012) • str./pp. 227-250 239
južnog pristana 2009. godine radi povećanja operativnog kapaciteta terminala. Metalna se koristi isključivo za prekrcaj manjih brodova, i to u slučaju zauzetosti južnog veza, budući da je dohvat dizalice ograničen i dozvoljava samo niže dizanje kontejnera. Na južnom pristanu trenutno su u eksploataciji dvije obalne kontej-nerske dizalice korejskog proizvođača Samsung koje svojim tehničko-tehnološkim značajkama osiguravaju potrebe prekrcaja kontejnerskog terminala.
Mehanizacija slagališta riječkog kontejner-skog terminala se sastoji od autodizalica s hva-tačem, čelnih viličara s dugim nosačima vilica te tegljača s prikolicama i poluprikolicama. Osno-vu slagališnih prekrcajno-prijevoznih sredstava čine autodizalice s hvatačem koje se ubrajaju u tzv. horizontalnu mehanizaciju.
Postojeća ukupna površina kontejnerskog terminala riječke luke iznosi približno 140 000 m2 od čega je površina slagališta kon-tejnera 56 100 m2.
Radi povećanja kapaciteta kontejnerskog terminala i mogućnosti servisiranja većih bro-dova u tijeku je izgradnja nove operativne oba-le u dužini od 328 metara u produžetku posto-jećeg Kostrenskog pristaništa-jug s dubinom mora uz pristan od 14,5 metara. Kostrensko pristanište-zapad koristit će se u prijelaznoj fazi do završetka produženja južnog pristaništa te nije predviđeno za daljnju eksploataciju u bu-dućnosti s obzirom na ograničenja u pogledu dubine mora i duljine pristana. Na tom pristanu se danas obavljaju prekrcajne operacije manjih feeder brodova samo u slučaju zauzetosti južne obale.
Nakon dogradnje postojećeg pristana na jugu će biti postavljene još dvije obalne kontej-nerske dizalice eksploatacijskih značajki po-trebnih za servisiranje kontejnerskih brodova Post-Panamax generacije kapaciteta od 8 000 do 10 000 TEU-a. Na taj će način postojeće dvi-je kontejnerske dizalice moći prelaziti na novi produženi dio obale i tako omogućiti prekrcaj broda s tri, odnosno četiri mosta, zavisno od ve-ličine broda.
Projekt proširenja terminala predviđa insta-laciju dva para portalnih prijenosnika velikog raspona na skladišnom prostoru punih kontej-nera kako bi se postigla bolja iskoristivost sla-gališne površine. Primjenom tih skladišnih mo-stova postojeća horizontalna tehnologija
and the sea depth is 12 m at the quay, while the western berth is 164 m long with the sea depth of 11 m at the quay. On the western berth, the older port container crane “Metalna” is locat-ed. This crane was moved from the south quay in 2009 in order to increase the operating ca-pacity of the terminal. “Metalna” is used only for the handling of smaller container ships, when the south berth is not available, since the crane outreach is limited allowing only the low-er lifting of containers. On the southern berth, there are two port container cranes manufac-tured by Samsung whose technical and techno-logical features ensure the existing needs of the container terminal.
The machinery of the Rijeka container ter-minal stacking area consist of a reachstackers, of main forklifts with long fork carriers, tug-master trailers and semi trailers. The bases of the transport-handling equipment operating on the stacking area are reachstackers that are part of the so-called horizontal machinery.
The actual total surface area of the container terminal in the Port of Rijeka is 140,000 m2 of which the stacking surface is 56,100 m2.
In order to increase the capacity of the con-tainer terminal and to serve larger ships, the new operating quay will be 328 meters long with the sea depth of 14.5 meters and will be constructed as the extension of the south quay. The Kostrenska quay – WEST will be used in the transitional phase till the ending of the ex-tension of the south quay and it is not predicted for further exploitation in the future, consider-ing the limits related to the sea depth and the length of the quay. On this quay, the reload op-erations of smaller feeder ships are done only when the south quay is not available.
After upgrading the existing quay on the south, two container cranes, with technical fea-tures necessary for servicing container ships of the Post-Panamax generation with the capacity of 8,000 to 10,000 TEU, will be placed on the south quay. The two existing container cranes will be able to move onto the new quay and will enable the serving of a ship with three or four cranes, depending on the size of the ship.
The project of the quay extension predicts the installation of two pairs of large range transtainers on the storage surface for full con-tainers, in order to enable a better usage of the stacking surface. By using these shore container cranes, the existing horizontal reload technolo-gy would be replaced by the vertical technology.
Z. Zenzerović, N. Antonini, S. Vilke: METODOLOŠKI PRISTUP ISTRAŽIVANJU PROCESA OPSLUŽIVANJA...
240 POMORSTVO • Scientific Journal of Maritime Research • 26/1(2012) • str./pp. 227-250
prekrcaja zamijenila bi se vertikalnom tehnolo-gijom.
Rekonstrukcija i nadogradnja terminala predviđa uređenje približno 167 000 m2 površi-ne lučkog područja, dok će se po završetku do-gradnje površina slagališta kontejnera s posto-jećih 56 100 m2 povećati na 103 600 m2.
Nakon realizacije opisanih projekata kapaci-tet kontejnerskog terminala Brajdica iznosit će približno 500 000 TEU-a godišnje.
4.2. Statistička analiza prometa kontejnerskog terminala Brajdica
Analiza kretanja kontejnerskog prometa ri-ječke luke [11] pokazuje da, nakon izrazitog pada koji se zbog ratnih događanja već počeo osjećati devedesetih godina te nastavio sve do kraja desetljeća, od 2001. godine kreće porast prometa. Tako je u 2000. godini prekrcano 9 722 TEU-a, da bi se pozitivna tendencija kre-tanja prometa kontejnera nastavila sve do 2008. godine kada je ostvareno 168 761 TEU-a, od-nosno 17 puta veći promet u odnosu na 2000. godinu. U 2009. godini zabilježen je pad kontej-nerskog prometa (prekrcano je 130 740 TEU-a) generiran u prvom redu smanjenjem uvoza usli-jed gospodarske krize, dok je tijekom 2010. go-dine ostvaren oporavak prometa rastom od 4% u odnosu na godinu dana ranije.
Uspoređujući broj brodova pristiglih na kon-tejnerski terminal s ostvarenim prometom uo-čeno je da broj brodova raste sporije u odnosu na količinu prometa što je u skladu s dolaskom sve većih brodova na terminal, odnosno veće količine prekrcanih kontejnera po pojedinom brodu. Tako je u 2008. godini na terminal prive-zano 256 brodova ili 33,3% više nego u 2003. godini, dok je u istom razdoblju promet pove-ćan za gotovo 6 puta.
Međutim, za sveobuhvatnu analizu nisu do-voljni samo podaci o godišnjem prometu i tica-nju brodova već treba uzeti u obzir promet po mjesecima i danima koji, zbog oscilacija, znatno utječe na dimenzioniranje kapaciteta terminala.
Na temelju metodologije iz dijela 2.1. ovoga rada ispitana je veza između broja brodova i dana pristizanja na terminal Brajdica; sastavlje-na je korelacijska tablica za broj brodova pristi-glih idućeg i prethodnog dana u razdoblju od 2000. do 2010. godine. S obzirom na prethodno objašnjene različite tendencije kretanja godiš-
The reconstruction and extension of the ter- extension of the ter-minal predicts the development of nearly 167,000 m2 of port surface, while, after upgrad-ing the container stacking surface with the ex-isting 56,100 m2, will increase to 103,600 m2.
After achieving the described projects, the capacity of the container terminal Brajdica will be nearly 500,000 TEU per year.
4.2. Statistical analysis of the traffic at the container terminal “Brajdica”
The analysis of container traffic trends in the Port of Rijeka [11] has shown that, after a strik-ing decrease, which due to the war started as early as in the ‘90s and continued up to the end of the decade, it has been increasing since the year 2001. In 2000, there were 9,722 TEU han-dled and the positive trend continued up to the year 2008 with 168,761 TEU, or with a 17 times larger transshipment as compared to the year 2000. In 2009, a decrease of the container traf-fic was noted (130,740 TEU), resulting from the reduced import caused by the economic cri-sis, while in 2010, the transshipment was slight-ly recovered, i.e. increased by 4% as compared with the previous year.
The comparison of the number of ships that arrived to the container terminal with the real-ized traffic shows that the number of ships in-creases slower as compared to the traffic vol-ume, which corresponds to the arrival of ever larger ships to the terminal, i.e., greater quanti-ty of containers per ship rate. In 2008, 256 ships were berthed, i.e. 33.3% more than in 2003, while the respective traffic increased by almost six times.
However, for a comprehensive analysis the data on the annual container traffic and on the arrivals of ships are not enough, so what should be taken into account are the monthly and daily container traffic data that, due to oscillations, significantly affect the dimensioning of the ter-minal capacity.
On the basis of the methodology presented in 2.1, the relation between the number of ships and days of their arrivals at the container ter-minal “Brajdica” has been examined; the cor-relation table has been compiled for the number of ships that arrived on the next and previous day in the period from 2000 to 2010. Considering the previous explanation in respect to different trends in the annual traffic, the pe-riods from 2000 to 2006 and from 2000 to 2010
Z. Zenzerović, N. Antonini, S. Vilke: METHODOLOGICAL APPROACH TO THE SERVICE PROCESS...
POMORSTVO • Scientific Journal of Maritime Research • 26/1(2012) • str./pp. 227-250 241
njeg prometa uzeto je u razmatranje razdoblje od 2000. do 2006. te od 2000. do 2010. godine. Za prvo razdoblje dobiven je koeficijent korela-cije r = – 0,0378641, a za drugo r = – 0,00021421.
S obzirom da su obje vrijednosti koeficijena-ta korelacije vrlo blizu nule, slijedi zaključak da ne postoji značajna zavisnost u redoslijedu dnevnih dolazaka brodova na terminal Brajdica u navedenim razdobljima, što znači da se dolas-ci brodova mogu promatrati kao nezavisni, tj. da su dolasci brodova u statističkom smislu slu-čajni.
Testiranjem koeficijenata korelacije za raz-doblje 2000. – 2006. i 2000. – 2010. ispitana je pretpostavka da ne postoji značajna razlika iz-među tih koeficijenata. Prema (2) i (3) interval prihvaćanja hipoteze glasi 0 ± 0,0496; razlika
21 ˆˆ zz − = 0,0379 – 0,0002 = 0,0377 se nalazi u tom intervalu na temelju čega se zaključuje da se na razini 5% značajnosti prihvaća pretpo-stavka da se koeficijenti korelacije u oba skupa međusobno ne razlikuju.
Iz navedenog slijedi da se broj dolazaka bro-dova na kontejnerski terminal Brajdica može uzeti kao slučajna varijabla, a zatim empirijske razdiobe te varijable aproksimirati s odgovara-jućim teorijskim razdiobama. Isti se zaključak dobiva i za varijablu − vrijeme boravka broda na kontejnerskom terminalu.
4.3. Usporedba empirijskih s teorijskim razdiobama
Ispitivanje o slaganju empirijske razdiobe s nekom od teorijskih razdioba provedeno je pri-mjenom neparametarskih testova (vidjeti 2.2. ovoga rada).
4.3.1. Dolasci brodova
S obzirom na različite tendencije kretanja prometa, empirijska razdioba za broj brodova pristiglih na terminal Brajdica je prema ocjeni autora sastavljena za tri razdoblja, i to: 2000.–2006., 2007.–2010. i 2000.–2010., a izračunati pokazatelji prikazani u tablici 1.
were considered. The obtained correlation co-efficients were r = – 0.037864 and r = – 0.00021421 for the first and second period re-spectively.
Given that both the values of the correlation coefficients very close to zero, it follows that there is no significant dependence on the order of the daily arrivals of ships at the container terminal “Brajdica” in those periods, which means that the arrivals of ships can be seen as independent, i.e. that the arrivals of ships are random in the statistical sense.
The correlation coefficients for the 2000 to 2006 and 2000 to 2010 periods were tested aiming to examine the hypothesis that there is no significant difference among the coefficients. According to (2) and (3), the hypothesis accept-ance interval is 0 ± 0.0496; the difference
21 ˆˆ zz − = 0.0379 – 0.0002 = 0.0377 is within the interval, thus leading to the conclusion that the hypothesis, stating that the correlation co-efficients of both the sets do not differ, is ac-cepted at a 5% significance level.
In view of all this, the number of the ship ar-rivals at the container terminal “Brajdica” can be taken as a random variable, and then the empirical distribution of these variables can be approximated with the corresponding theoreti-cal distributions. The same conclusion has been reached for the variable during the ship’s stay at the container terminal.
4.3. Comparison of the empirical and theoretical distributions
The examination of the empirical distribu-tion agreement with some of the theoretical distributions was performed by using the non-parametric tests (see 2.2. of this paper).
4.3.1. Arrivals of ships
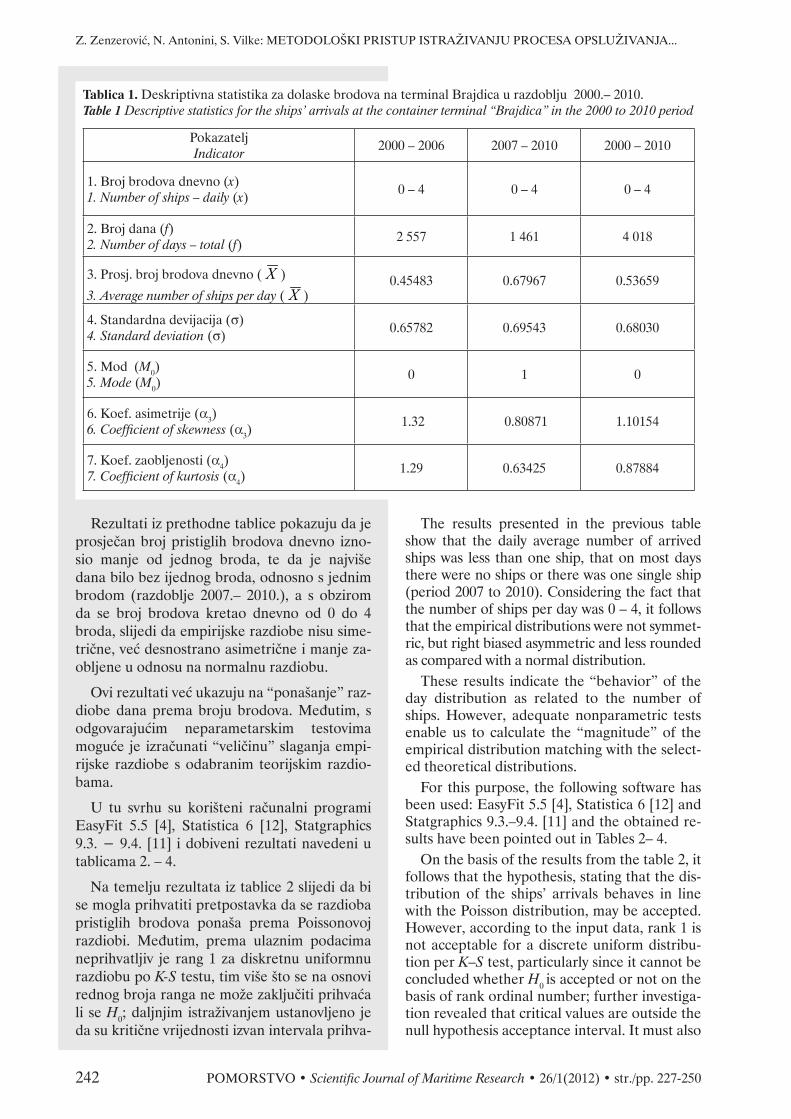
Considering the various tendencies in the movement of ships, the empirical distribution for the number of ships arrived at the container terminal “Brajdica” has been compiled at the author’s discretion for the three following peri-ods: 2000 to 2006, 2007 to 2010 and 2000 to 2010. The calculated indicators are shown in Table 1.
Z. Zenzerović, N. Antonini, S. Vilke: METODOLOŠKI PRISTUP ISTRAŽIVANJU PROCESA OPSLUŽIVANJA...
242 POMORSTVO • Scientific Journal of Maritime Research • 26/1(2012) • str./pp. 227-250
Rezultati iz prethodne tablice pokazuju da je prosječan broj pristiglih brodova dnevno izno-sio manje od jednog broda, te da je najviše dana bilo bez ijednog broda, odnosno s jednim brodom (razdoblje 2007.– 2010.), a s obzirom da se broj brodova kretao dnevno od 0 do 4 broda, slijedi da empirijske razdiobe nisu sime-trične, već desnostrano asimetrične i manje za-obljene u odnosu na normalnu razdiobu.
Ovi rezultati već ukazuju na “ponašanje” raz-diobe dana prema broju brodova. Međutim, s odgovarajućim neparametarskim testovima moguće je izračunati “veličinu” slaganja empi-rijske razdiobe s odabranim teorijskim razdio-bama.
U tu svrhu su korišteni računalni programi EasyFit 5.5 [4], Statistica 6 [12], Statgraphics 9.3. − 9.4. [11] i dobiveni rezultati navedeni u tablicama 2. – 4.
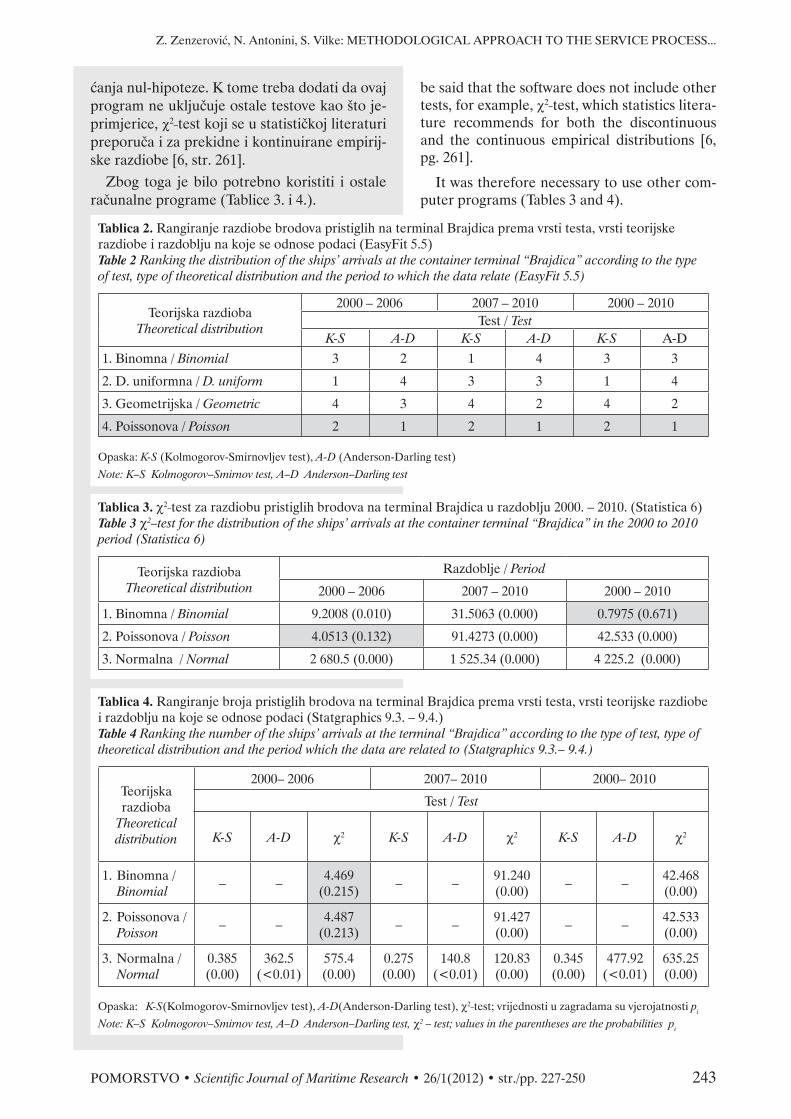
Na temelju rezultata iz tablice 2 slijedi da bi se mogla prihvatiti pretpostavka da se razdioba pristiglih brodova ponaša prema Poissonovoj razdiobi. Međutim, prema ulaznim podacima neprihvatljiv je rang 1 za diskretnu uniformnu razdiobu po KS testu, tim više što se na osnovi rednog broja ranga ne može zaključiti prihvaća li se H0; daljnjim istraživanjem ustanovljeno je da su kritične vrijednosti izvan intervala prihva-
Tablica 1. Deskriptivna statistika za dolaske brodova na terminal Brajdica u razdoblju 2000.– 2010.Table 1 Descriptive statistics for the ships’ arrivals at the container terminal “Brajdica” in the 2000 to 2010 period
PokazateljIndicator
2000 – 2006 2007 – 2010 2000 – 2010
1. Broj brodova dnevno (x)1. Number of ships – daily (x) 0 – 4 0 – 4 0 – 4
2. Broj dana (f)2. Number of days – total (f) 2 557 1 461 4 018
3. Prosj. broj brodova dnevno ( X )
3. Average number of ships per day ( X )0.45483 0.67967 0.53659
4. Standardna devijacija (σ)4. Standard deviation (σ) 0.65782 0.69543 0.68030
5. Mod (M0)5. Mode (M0)
0 1 0
6. Koef. asimetrije (α3)6. Coefficient of skewness (α3)
1.32 0.80871 1.10154
7. Koef. zaobljenosti (α4)7. Coefficient of kurtosis (α4)
1.29 0.63425 0.87884
The results presented in the previous table show that the daily average number of arrived ships was less than one ship, that on most days there were no ships or there was one single ship (period 2007 to 2010). Considering the fact that the number of ships per day was 0 – 4, it follows that the empirical distributions were not symmet-ric, but right biased asymmetric and less rounded as compared with a normal distribution.
These results indicate the “behavior” of the day distribution as related to the number of ships. However, adequate nonparametric tests enable us to calculate the “magnitude” of the empirical distribution matching with the select-ed theoretical distributions.
For this purpose, the following software has been used: EasyFit 5.5 [4], Statistica 6 [12] and Statgraphics 9.3.–9.4. [11] and the obtained re-sults have been pointed out in Tables 2– 4.
On the basis of the results from the table 2, it follows that the hypothesis, stating that the dis-tribution of the ships’ arrivals behaves in line with the Poisson distribution, may be accepted. However, according to the input data, rank 1 is not acceptable for a discrete uniform distribu-tion per K–S test, particularly since it cannot be concluded whether H0 is accepted or not on the basis of rank ordinal number; further investiga-tion revealed that critical values are outside the null hypothesis acceptance interval. It must also
Z. Zenzerović, N. Antonini, S. Vilke: METHODOLOGICAL APPROACH TO THE SERVICE PROCESS...
POMORSTVO • Scientific Journal of Maritime Research • 26/1(2012) • str./pp. 227-250 243
Tablica 2. Rangiranje razdiobe brodova pristiglih na terminal Brajdica prema vrsti testa, vrsti teorijske razdiobe i razdoblju na koje se odnose podaci (EasyFit 5.5)Table 2 Ranking the distribution of the ships’ arrivals at the container terminal “Brajdica” according to the type of test, type of theoretical distribution and the period to which the data relate (EasyFit 5.5)
Teorijska razdiobaTheoretical distribution
2000 – 2006 2007 – 2010 2000 – 2010Test / Test
KS AD KS AD KS A-D1. Binomna / Binomial 3 2 1 4 3 3
2. D. uniformna / D. uniform 1 4 3 3 1 4
3. Geometrijska / Geometric 4 3 4 2 4 2
4. Poissonova / Poisson 2 1 2 1 2 1
Opaska: KS (Kolmogorov-Smirnovljev test), AD (Anderson-Darling test)
Note: K–S Kolmogorov–Smirnov test, A–D Anderson–Darling test
Tablica 3. χ2_test za razdiobu pristiglih brodova na terminal Brajdica u razdoblju 2000. – 2010. (Statistica 6)Table 3 χ2–test for the distribution of the ships’ arrivals at the container terminal “Brajdica” in the 2000 to 2010 period (Statistica 6)
Teorijska razdiobaTheoretical distribution
Razdoblje / Period
2000 – 2006 2007 – 2010 2000 – 2010
1. Binomna / Binomial 9.2008 (0.010) 31.5063 (0.000) 0.7975 (0.671)
2. Poissonova / Poisson 4.0513 (0.132) 91.4273 (0.000) 42.533 (0.000)
3. Normalna / Normal 2 680.5 (0.000) 1 525.34 (0.000) 4 225.2 (0.000)
Tablica 4. Rangiranje broja pristiglih brodova na terminal Brajdica prema vrsti testa, vrsti teorijske razdiobe i razdoblju na koje se odnose podaci (Statgraphics 9.3. – 9.4.)Table 4 Ranking the number of the ships’ arrivals at the terminal “Brajdica” according to the type of test, type of theoretical distribution and the period which the data are related to (Statgraphics 9.3.– 9.4.)
Teorijskarazdioba
Theoreticaldistribution
2000– 2006 2007– 2010 2000– 2010
Test / Test
KS AD χ2 KS AD χ2 KS AD χ2
1. Binomna / Binomial
– – 4.469(0.215) – – 91.240
(0.00) – – 42.468(0.00)
2. Poissonova / Poisson
– – 4.487(0.213) – – 91.427
(0.00) – – 42.533(0.00)
3. Normalna / Normal
0.385(0.00)
362.5(<0.01)
575.4(0.00)
0.275(0.00)
140.8(<0.01)
120.83(0.00)
0.345(0.00)
477.92(<0.01)
635.25(0.00)
Opaska: KS(Kolmogorov-Smirnovljev test), AD(Anderson-Darling test), χ2_test; vrijednosti u zagradama su vjerojatnosti pi
Note: K–S Kolmogorov–Smirnov test, A–D Anderson–Darling test, χ2 – test; values in the parentheses are the probabilities pi
ćanja nul-hipoteze. K tome treba dodati da ovaj program ne uključuje ostale testove kao što je-primjerice, χ2_test koji se u statističkoj literaturi preporuča i za prekidne i kontinuirane empirij-ske razdiobe [6, str. 261].
Zbog toga je bilo potrebno koristiti i ostale računalne programe (Tablice 3. i 4.).
be said that the software does not include other tests, for example, χ2_test, which statistics litera-ture recommends for both the discontinuous and the continuous empirical distributions [6, pg. 261].
It was therefore necessary to use other com-puter programs (Tables 3 and 4).
Z. Zenzerović, N. Antonini, S. Vilke: METODOLOŠKI PRISTUP ISTRAŽIVANJU PROCESA OPSLUŽIVANJA...
244 POMORSTVO • Scientific Journal of Maritime Research • 26/1(2012) • str./pp. 227-250
Program Statistica za diskontinuirane slučaj-ne varijable (broj brodova) koristi samo χ2_test. Prema dobivenim rezultatima8 najbolje je slaga-nje broja pristiglih brodova s Poissonovom raz-diobom u razdoblju od 2000. do 2006. te s bino-mnom razdiobom u razdoblju od 2000. do 2010. godine.
Primjenom računalnog programa Statgraphi-cs dobiveni rezultati za različite testove dovode do zaključka da je razdiobu brodova pristiglih na kontejnerski terminal riječke luke najbolje aproksimirati binomnom, odnosno Poissono-vom razdiobom.
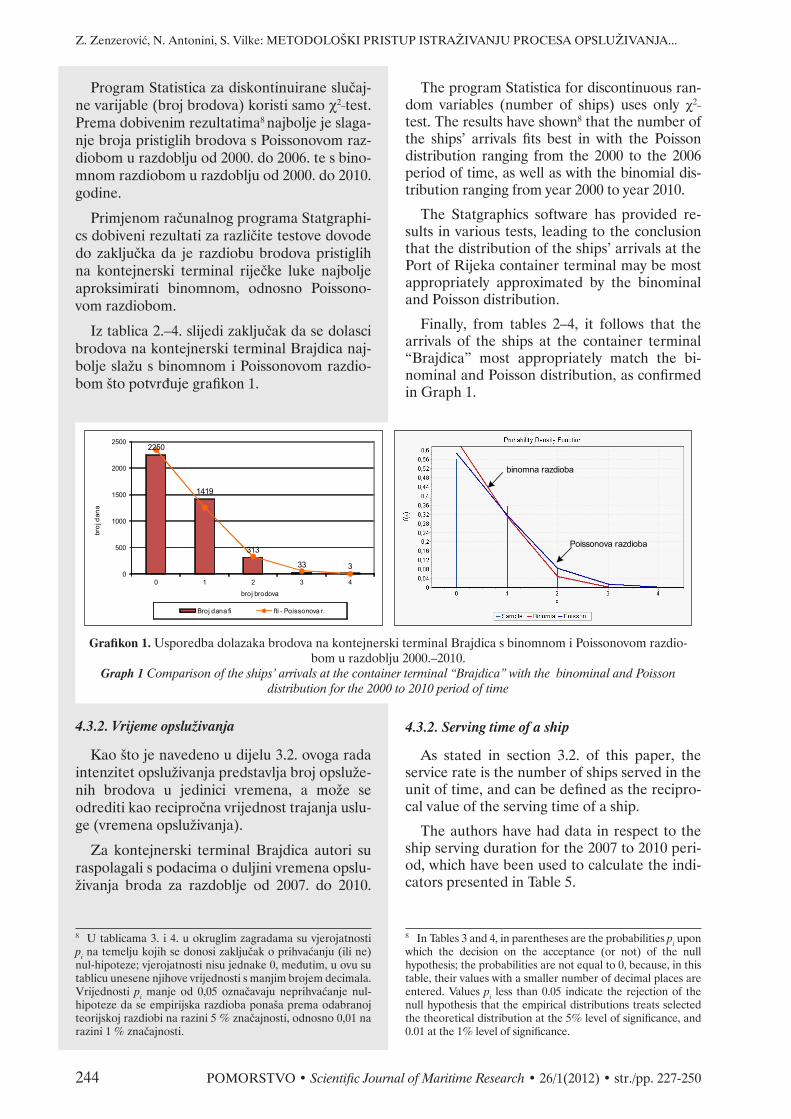
Iz tablica 2.–4. slijedi zaključak da se dolasci brodova na kontejnerski terminal Brajdica naj-bolje slažu s binomnom i Poissonovom razdio-bom što potvrđuje grafikon 1.
4.3.2. Vrijeme opsluživanja
Kao što je navedeno u dijelu 3.2. ovoga rada intenzitet opsluživanja predstavlja broj opsluže-nih brodova u jedinici vremena, a može se odrediti kao recipročna vrijednost trajanja uslu-ge (vremena opsluživanja).
Za kontejnerski terminal Brajdica autori su raspolagali s podacima o duljini vremena opslu-živanja broda za razdoblje od 2007. do 2010.
8 U tablicama 3. i 4. u okruglim zagradama su vjerojatnosti pi na temelju kojih se donosi zaključak o prihvaćanju (ili ne) nul-hipoteze; vjerojatnosti nisu jednake 0, međutim, u ovu su tablicu unesene njihove vrijednosti s manjim brojem decimala. Vrijednosti pi manje od 0,05 označavaju neprihvaćanje nul-hipo teze da se empirijska razdioba ponaša prema odabranoj teorijskoj razdiobi na razini 5 % značajnosti, odnosno 0,01 na razini 1 % značajnosti.
2250
1419
313
33 30
500
1000
1500
2000
2500
0 1 2 3 4
broj
dan
a
broj brodova
Broj dana fi fti - Poissonova r.
binomna razdioba
Poissonova razdioba
Grafikon 1. Usporedba dolazaka brodova na kontejnerski terminal Brajdica s binomnom i Poissonovom razdio-bom u razdoblju 2000.–2010.
Graph 1 Comparison of the ships’ arrivals at the container terminal “Brajdica” with the binominal and Poisson distribution for the 2000 to 2010 period of time
The program Statistica for discontinuous ran-dom variables (number of ships) uses only χ2_
test. The results have shown8 that the number of the ships’ arrivals fits best in with the Poisson distribution ranging from the 2000 to the 2006 period of time, as well as with the binomial dis-tribution ranging from year 2000 to year 2010.
The Statgraphics software has provided re-sults in various tests, leading to the conclusion that the distribution of the ships’ arrivals at the Port of Rijeka container terminal may be most appropriately approximated by the binominal and Poisson distribution.
Finally, from tables 2–4, it follows that the arrivals of the ships at the container terminal “Brajdica” most appropriately match the bi-nominal and Poisson distribution, as confirmed in Graph 1.
4.3.2. Serving time of a ship
As stated in section 3.2. of this paper, the service rate is the number of ships served in the unit of time, and can be defined as the recipro-cal value of the serving time of a ship.
The authors have had data in respect to the ship serving duration for the 2007 to 2010 peri-od, which have been used to calculate the indi-cators presented in Table 5.
8 In Tables 3 and 4, in parentheses are the probabilities pi upon which the decision on the acceptance (or not) of the null hypothesis; the probabilities are not equal to 0, because, in this table, their values with a smaller number of decimal places are entered. Values pi less than 0.05 indicate the rejection of the null hypothesis that the empirical distributions treats selected the theoretical distribution at the 5% level of significance, and 0.01 at the 1% level of significance.
Z. Zenzerović, N. Antonini, S. Vilke: METHODOLOGICAL APPROACH TO THE SERVICE PROCESS...
POMORSTVO • Scientific Journal of Maritime Research • 26/1(2012) • str./pp. 227-250 245
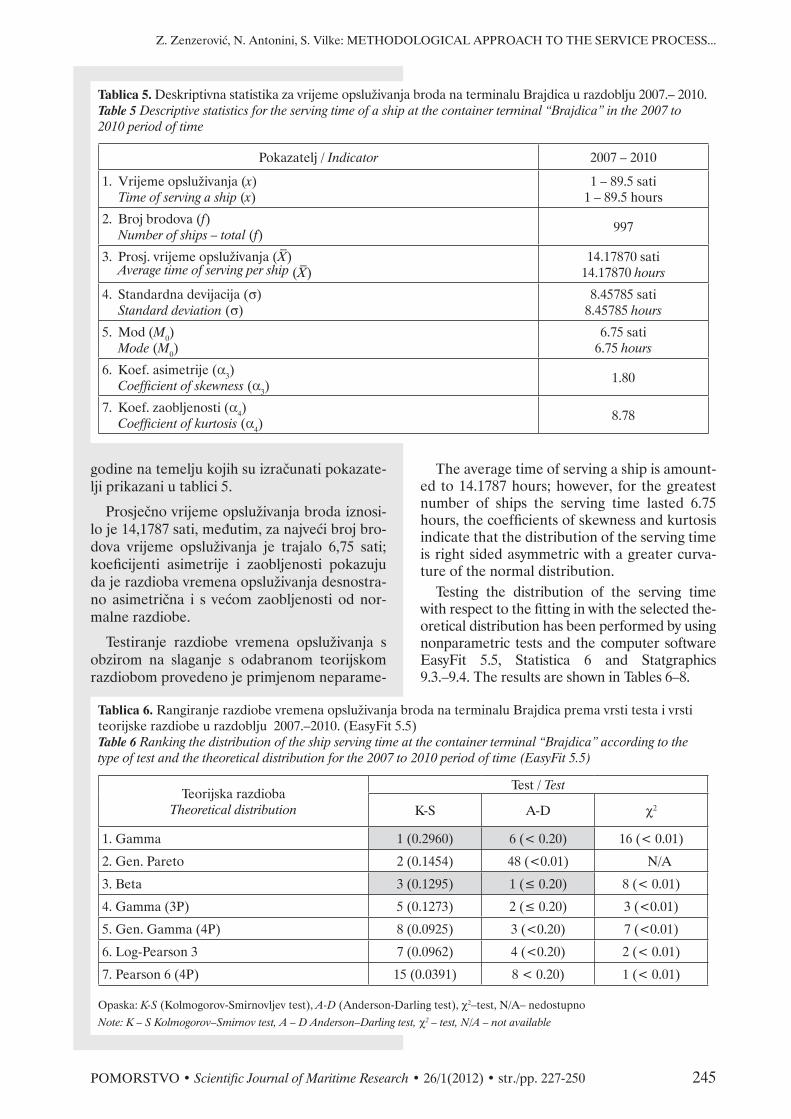
godine na temelju kojih su izračunati pokazate-lji prikazani u tablici 5.
Prosječno vrijeme opsluživanja broda iznosi-lo je 14,1787 sati, međutim, za najveći broj bro-dova vrijeme opsluživanja je trajalo 6,75 sati; koeficijenti asimetrije i zaobljenosti pokazuju da je razdioba vremena opsluživanja desnostra-no asimetrična i s većom zaobljenosti od nor-malne razdiobe.
Testiranje razdiobe vremena opsluživanja s obzirom na slaganje s odabranom teorijskom razdiobom provedeno je primjenom neparame-
Tablica 5. Deskriptivna statistika za vrijeme opsluživanja broda na terminalu Brajdica u razdoblju 2007.– 2010. Table 5 Descriptive statistics for the serving time of a ship at the container terminal “Brajdica” in the 2007 to 2010 period of time
Pokazatelj / Indicator 2007 – 2010
1. Vrijeme opsluživanja (x) Time of serving a ship (x)
1 – 89.5 sati1 – 89.5 hours
2. Broj brodova (f) Number of ships – total (f) 997
3. Prosj. vrijeme opsluživanja (X–)
Average time of serving per ship (X–)
14.17870 sati14.17870 hours
4. Standardna devijacija (σ) Standard deviation (σ)
8.45785 sati8.45785 hours
5. Mod (M0) Mode (M0)
6.75 sati6.75 hours
6. Koef. asimetrije (α3) Coefficient of skewness (α3)
1.80
7. Koef. zaobljenosti (α4) Coefficient of kurtosis (α4)
8.78
Tablica 6. Rangiranje razdiobe vremena opsluživanja broda na terminalu Brajdica prema vrsti testa i vrsti teorijske razdiobe u razdoblju 2007.–2010. (EasyFit 5.5)Table 6 Ranking the distribution of the ship serving time at the container terminal “Brajdica” according to the type of test and the theoretical distribution for the 2007 to 2010 period of time (EasyFit 5.5)
Teorijska razdiobaTheoretical distribution
Test / Test
K-S A-D χ2
1. Gamma 1 (0.2960) 6 (< 0.20) 16 (< 0.01)
2. Gen. Pareto 2 (0.1454) 48 (<0.01) N/A
3. Beta 3 (0.1295) 1 (≤ 0.20) 8 (< 0.01)
4. Gamma (3P) 5 (0.1273) 2 (≤ 0.20) 3 (<0.01)
5. Gen. Gamma (4P) 8 (0.0925) 3 (<0.20) 7 (<0.01)
6. Log-Pearson 3 7 (0.0962) 4 (<0.20) 2 (< 0.01)
7. Pearson 6 (4P) 15 (0.0391) 8 < 0.20) 1 (< 0.01)
Opaska: KS (Kolmogorov-Smirnovljev test), AD (Anderson-Darling test), χ2–test, N/A– nedostupno
Note: K – S Kolmogorov–Smirnov test, A – D Anderson–Darling test, χ2 – test, N/A – not available
The average time of serving a ship is amount-ed to 14.1787 hours; however, for the greatest number of ships the serving time lasted 6.75 hours, the coefficients of skewness and kurtosis indicate that the distribution of the serving time is right sided asymmetric with a greater curva-ture of the normal distribution.
Testing the distribution of the serving time with respect to the fitting in with the selected the-oretical distribution has been performed by using nonparametric tests and the computer software EasyFit 5.5, Statistica 6 and Statgraphics 9.3.–9.4. The results are shown in Tables 6–8.
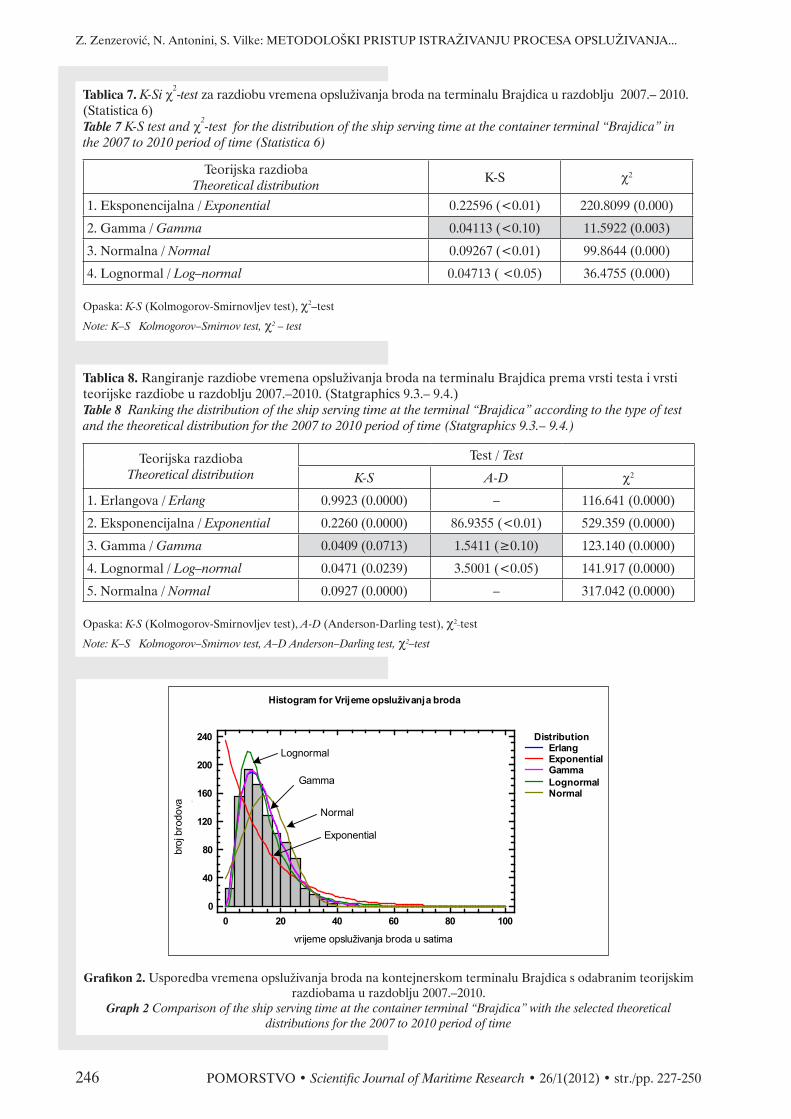
Z. Zenzerović, N. Antonini, S. Vilke: METODOLOŠKI PRISTUP ISTRAŽIVANJU PROCESA OPSLUŽIVANJA...
246 POMORSTVO • Scientific Journal of Maritime Research • 26/1(2012) • str./pp. 227-250
Tablica 7. KSi χ2-test za razdiobu vremena opsluživanja broda na terminalu Brajdica u razdoblju 2007.– 2010.
(Statistica 6)Table 7 KS test and χ2
test for the distribution of the ship serving time at the container terminal “Brajdica” in the 2007 to 2010 period of time (Statistica 6)
Teorijska razdiobaTheoretical distribution
K-S χ2
1. Eksponencijalna / Exponential 0.22596 (<0.01) 220.8099 (0.000)
2. Gamma / Gamma 0.04113 (<0.10) 11.5922 (0.003)
3. Normalna / Normal 0.09267 (<0.01) 99.8644 (0.000)
4. Lognormal / Log–normal 0.04713 ( <0.05) 36.4755 (0.000)
Opaska: KS (Kolmogorov-Smirnovljev test), χ2–test
Note: K–S Kolmogorov–Smirnov test, χ2 – test
Tablica 8. Rangiranje razdiobe vremena opsluživanja broda na terminalu Brajdica prema vrsti testa i vrsti teorijske razdiobe u razdoblju 2007.–2010. (Statgraphics 9.3.– 9.4.)Table 8 Ranking the distribution of the ship serving time at the terminal “Brajdica” according to the type of test and the theoretical distribution for the 2007 to 2010 period of time (Statgraphics 9.3.– 9.4.)
Teorijska razdiobaTheoretical distribution
Test / Test
KS AD χ2
1. Erlangova / Erlang 0.9923 (0.0000) – 116.641 (0.0000)
2. Eksponencijalna / Exponential 0.2260 (0.0000) 86.9355 (<0.01) 529.359 (0.0000)
3. Gamma / Gamma 0.0409 (0.0713) 1.5411 (≥0.10) 123.140 (0.0000)
4. Lognormal / Log–normal 0.0471 (0.0239) 3.5001 (<0.05) 141.917 (0.0000)
5. Normalna / Normal 0.0927 (0.0000) – 317.042 (0.0000)
Opaska: KS (Kolmogorov-Smirnovljev test), AD (Anderson-Darling test), χ2_test
Note: K–S Kolmogorov–Smirnov test, A–D Anderson–Darling test, χ2–test
Histogram for Vrijeme opsluživanja broda
0 20 40 60 80 100Vrijeme opsluživanja broda
0
40
80
120
160
200
240
freq
uenc
y
DistributionErlangExponentialGammaLognormalNormal
Gamma
Lognormal
Exponential
Normal
vrijeme opsluživanja broda u satima
broj
bro
dova
Grafikon 2. Usporedba vremena opsluživanja broda na kontejnerskom terminalu Brajdica s odabranim teorijskim razdiobama u razdoblju 2007.–2010.
Graph 2 Comparison of the ship serving time at the container terminal “Brajdica” with the selected theoretical distributions for the 2007 to 2010 period of time

Z. Zenzerović, N. Antonini, S. Vilke: METHODOLOGICAL APPROACH TO THE SERVICE PROCESS...
POMORSTVO • Scientific Journal of Maritime Research • 26/1(2012) • str./pp. 227-250 247
tarskih testova i računalnih programa Easy Fit 5.5, Statistica 6 i Statgraphics 9.3.– 9.4.
Dobiveni rezultati su prikazani u tablicama 6.–8.
Iz tablica slijedi da se na temelju podataka za razdoblje od 2007. do 2010. razdioba vremena opsluživanja ponaša prema gamma razdiobi, što potvrđuje grafikon 2.
4.4. Određivanje optimalnog broja pristana na kontejnerskom terminalu Brajdica
Iz prethodnih rezultata slijedi da je na kon-tejnerskom terminalu Brajdica na temelju do-sadašnjeg prometa, a zbog usporedbe s varija-blom vrijeme opsluživanja broda, za razdoblje od 2007. do 2010. prosječan broj pristiglih bro-dova iznosio λ = 0,6797 brodova dnevno. Uzev-ši u obzir prosječno vrijeme opsluživanja broda od 14,1787 sati izlazi da je propusna moć, od-nosno kapacitet pristana u tom razdoblju proci-jenjen na μ = 24 sata/14,1787 sati = 1,6927 brodova/dan te da je stupanj opterećenja termi-nala u razdoblju od 2007. do2010. (ρ = λ/μ) iznosio svega 0,40 (40%).
Za izračunavanje pokazatelja funkcioniranja kontejnerskoga terminala primijenjen je raču-nalni program WINQSB [1].
Prema opcijama koje navedeni program nudi ulazni parametri su prosječan vremenski razmak između dva uzastopna dolaska broda (1/λ) te prosječno vrijeme zadržavanja broda na termi-nalu (1/μ). To znači da je za daljnje istraživanje potrebno analizirati varijablu vremenski razmak između dva uzastopna dolaska broda prema she-mi 4.3. ovoga rada da bi se odredila teorijska razdioba koju slijedi navedena varijabla ili, što je jednostavnije, izračunati recipročnu vrijednost od prosječnog broja pristiglih brodova λ.
Ovim istraživanjem se došlo do zaključka da je proces opsluživanja na kontejnerskom termi-nalu Brajdica problem reda čekanja tipa M/G/S. Primjenom programa WINQSB vrijednosti po-kazatelja su unesene u tablicu 9. Radi uspored-be u tablici su dani rezultati za razdoblje 2007.– 2010. te posebno za 2010.
Također je razmatrana varijanta procesa op-služivanja s prometom očekivanim u sljedećim godinama od 300 000 TEU-a pa je pretpostavlje-no prosječno 529 pristiglih brodova godišnje s približno 500−550 TEU-a po brodu (λ = 1,450
It follows from these tables that, on the basis of the data for the 2007 to 2010 period of time, the serving time distribution matches the gam-ma distribution, as confirmed in Graph 2.
4.4. Determination of the optimum number of berths at the container terminal “Brajdica”
As the results have shown, based on the previ-ous traffic and on the comparison of the ship serving time duration at the container terminal “Brajdica” in the 2007 to 2010 period of time, the average number of the ships’ arrivals was λ = 0.6797 per day. Considering the average serving time of 14.1787 hours per ship, it follows that the throughput or berth capacity in that pe-riod was estimated to μ = 24 hours/14.1787 hours = 1.6927 ship/day and that the degree of the terminal load (ρ = λ/μ) in the period from the year 2007 to the year 2010 equaled to as low as 0.40 (40%).
Software WINQSB [1] has been used for cal-culating the container operation indicators.
Following the options offered by the soft-ware, the input parameters are the average time between two subsequent arrivals of ships (1/λ) and the average stay at the terminal (1/μ). It means that it is necessary to analyze the aver-age time variable between the two subsequent arrivals of ships according to the instructions shown in 4.3 herein in order to define the theo-retical distribution followed by the mentioned variable or, which is a simpler solution, calcu-late the reciprocal value of the average number of the arrived ships λ.
This research has led to the conclusion that the serving process at the container terminal “Brajdica” is of the M/G/S type queuing issue. The software WINQSB has been used for fill-ing up values in Table 9. For the sake of com-parison, the presented results refer to the pe-riods from 2007 to 2010 and separately for the year 2010. The alternative serving process, in-volving 300,000 TEUs traffic as expected in the following years, has been considered as well, assuming an average number of 529 ships’ arrivals with approximately 500-550 TEUs per ship (λ = 1.450 ship/day), and, based on the data for the “Brajdica” container terminal operation in 2010 [23], the average number of the served ships (one berth with two cranes) amounted to μ = 2.0712 ship/per day.
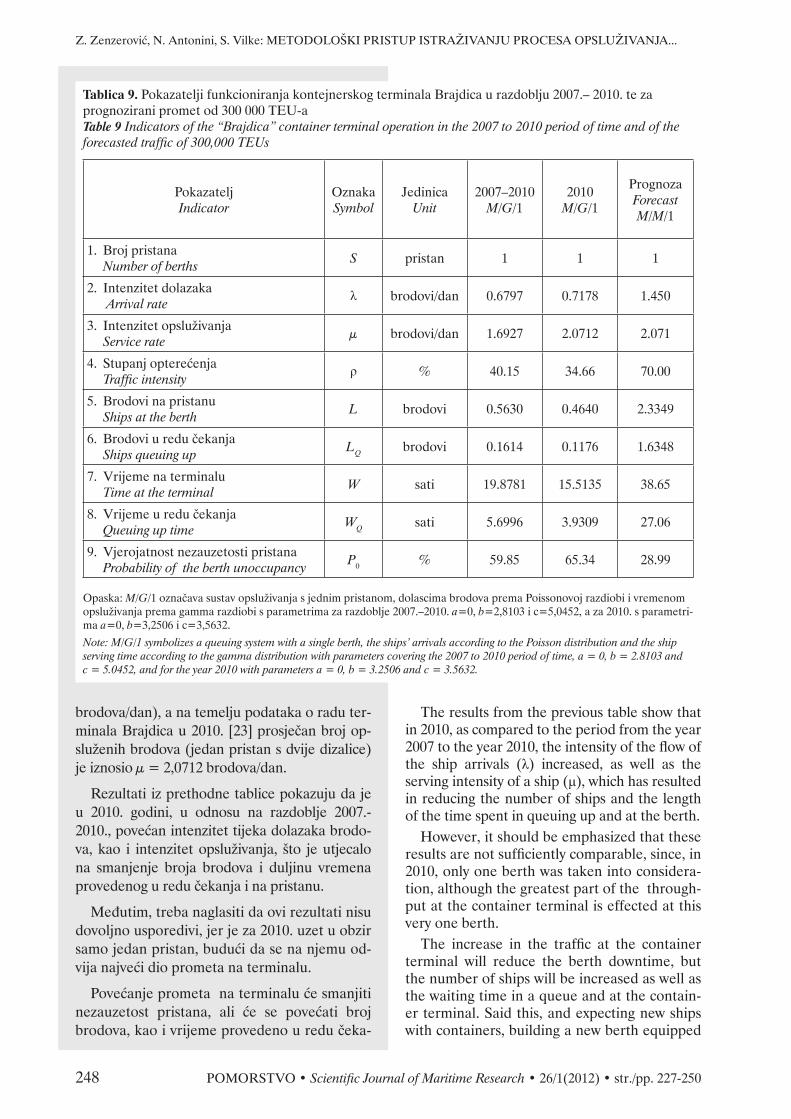
Z. Zenzerović, N. Antonini, S. Vilke: METODOLOŠKI PRISTUP ISTRAŽIVANJU PROCESA OPSLUŽIVANJA...
248 POMORSTVO • Scientific Journal of Maritime Research • 26/1(2012) • str./pp. 227-250
brodova/dan), a na temelju podataka o radu ter-minala Brajdica u 2010. [23] prosječan broj op-služenih brodova (jedan pristan s dvije dizalice) je iznosio μ = 2,0712 brodova/dan.
Rezultati iz prethodne tablice pokazuju da je u 2010. godini, u odnosu na razdoblje 2007.-2010., povećan intenzitet tijeka dolazaka brodo-va, kao i intenzitet opsluživanja, što je utjecalo na smanjenje broja brodova i duljinu vremena provedenog u redu čekanja i na pristanu.
Međutim, treba naglasiti da ovi rezultati nisu dovoljno usporedivi, jer je za 2010. uzet u obzir samo jedan pristan, budući da se na njemu od-vija najveći dio prometa na terminalu.
Povećanje prometa na terminalu će smanjiti nezauzetost pristana, ali će se povećati broj brodova, kao i vrijeme provedeno u redu čeka-
Tablica 9. Pokazatelji funkcioniranja kontejnerskog terminala Brajdica u razdoblju 2007.– 2010. te za prognozirani promet od 300 000 TEU-aTable 9 Indicators of the “Brajdica” container terminal operation in the 2007 to 2010 period of time and of the forecasted traffic of 300,000 TEUs
PokazateljIndicator
OznakaSymbol
Jedinica Unit
2007–2010M/G/1
2010M/G/1
PrognozaForecastM/M/1
1. Broj pristana Number of berths
S pristan 1 1 1
2. Intenzitet dolazaka Arrival rate
λ brodovi/dan 0.6797 0.7178 1.450
3. Intenzitet opsluživanja Service rate
μ brodovi/dan 1.6927 2.0712 2.071
4. Stupanj opterećenja Traffic intensity
ρ % 40.15 34.66 70.00
5. Brodovi na pristanu Ships at the berth
L brodovi 0.5630 0.4640 2.3349
6. Brodovi u redu čekanja Ships queuing up
LQ brodovi 0.1614 0.1176 1.6348
7. Vrijeme na terminalu Time at the terminal
W sati 19.8781 15.5135 38.65
8. Vrijeme u redu čekanja Queuing up time
WQ sati 5.6996 3.9309 27.06
9. Vjerojatnost nezauzetosti pristana Probability of the berth unoccupancy
P0 % 59.85 65.34 28.99
Opaska: M/G/1 označava sustav opsluživanja s jednim pristanom, dolascima brodova prema Poissonovoj razdiobi i vremenom opsluživanja prema gamma razdiobi s parametrima za razdoblje 2007.–2010. a=0, b=2,8103 i c=5,0452, a za 2010. s parametri-ma a=0, b=3,2506 i c=3,5632.
Note: M/G/1 symbolizes a queuing system with a single berth, the ships’ arrivals according to the Poisson distribution and the ship serving time according to the gamma distribution with parameters covering the 2007 to 2010 period of time, a = 0, b = 2.8103 and c = 5.0452, and for the year 2010 with parameters a = 0, b = 3.2506 and c = 3.5632.
The results from the previous table show that in 2010, as compared to the period from the year 2007 to the year 2010, the intensity of the flow of the ship arrivals (λ) increased, as well as the serving intensity of a ship (μ), which has resulted in reducing the number of ships and the length of the time spent in queuing up and at the berth.
However, it should be emphasized that these results are not sufficiently comparable, since, in 2010, only one berth was taken into considera-tion, although the greatest part of the through-put at the container terminal is effected at this very one berth.
The increase in the traffic at the container terminal will reduce the berth downtime, but the number of ships will be increased as well as the waiting time in a queue and at the contain-er terminal. Said this, and expecting new ships with containers, building a new berth equipped
Z. Zenzerović, N. Antonini, S. Vilke: METHODOLOGICAL APPROACH TO THE SERVICE PROCESS...
POMORSTVO • Scientific Journal of Maritime Research • 26/1(2012) • str./pp. 227-250 249
nja i na terminalu. Sve to dokazuje da je, oče-kujući nove brodove s kontejnerima, opravdana izgradnja novog pristana s odgovarajućim bro-jem dizalica čija je realizacija u tijeku.
Prema 3.2. ovoga rada optimalan broj prista-na se određuje na temelju postavljenog kriterija optimizacije koji je izražen u naturalnim ili vri-jednosnim jedinicama. S obzirom na složenost sustava opsluživanja na kontejnerskom termi-nalu autori preporučuju da se optimalno rješe-nje odredi koristeći model ukupnih troškova koji obuhvaća troškove svih sudionika u proce-su opsluživanja (brod, pristan, teret), a koji je detaljno prikazan u radu [23].
5. ZAKLJUČAK
Za optimalno funkcioniranje terminala od posebne je važnosti definirati kapacitet kontej-nerskog terminala koji utječe na mogućnost ostvarenja postavljenog plana proizvodnje, a time i plana realizacije lučkih usluga.
Lučki kontejnerski terminal je sustav složen od određenog broja međusobno zavisnih podsu-stava. Problem određivanja optimalnog kapaci-teta lučkoga kontejnerskog terminala svodi se na izračunavanje optimalnog broja pristana, s obzi-rom da kapacitet pristana determinira potreban kapacitet ostalih podsustava, a time i propusnu moć kontejnerskog terminala u cjelini.
Međutim, zbog oscilacija prekrcaja kontejne-ra uvjetovanih neravnomjernim pristizanjem brodova na lučki kontejnerski terminal te neu-jednačenim trajanjem operacija s kontejneri-ma, u praksi nije jednostavno utvrditi i dimenzi-onirati optimalan kapacitet terminala.
Jedan od načina određivanja optimalnog ka-paciteta lučkoga kontejnerskog terminala je pri-mjena odgovarajućih kvantitativnih metoda. U ovom je radu prikazan metodološki pristup, od-nosno metode kojima se određuju značajke i po-kazatelji funkcioniranja lučkoga kontejnerskog terminala, a koji su baza za donošenje odgovara-jućih odluka vezanih za poslovanje terminala. U tu svrhu su prikazane odgovarajuće statističke metode i metode operacijskih istraživanja.
Prikazana metodologija je primijenjena na kontejnerski terminal riječke luke Brajdica, međutim, ta se metodologija može primijeniti za bilo koji terminal u sadašnjim ili budućim uvjetima poslovanja uz preduvjet raspolaganja odgovarajuće statističke baze podataka.
with an adequate number of cranes is quite jus-tified, and this project has been in progress.
According to section 3.2. of this paper, the optimal number of berths is determined based on a set of optimization criteria, which is ex-pressed in natural units or securities. Given the complexity of the system of the ship serving time at the container terminal, the authors have recommended that the optimal solution is de-termined by using the total costs model, which includes costs of all of those involved in the service activities (ship, berth, cargo), as de-scribed in details in paper [23].
5. CONCLUSION
For the optimal functioning of the container terminal it is especially important to define the capacity of the terminal that affects the possi-bility of achieving the set plan, and thus the plan of the port services realization.
The port container terminal is a complex sys-tem made up of a number of interdependent subsystems. The problem of determining the optimum capacity of the seaport container ter-minal comes down to calculating the optimal number of berths, since the capacity of the berth is determined by the required capacity of other subsystems, as is the throughput capacity of the container terminal taken as a whole.
However, due to the fluctuation in the con-tainer transshipment caused by irregular ships’ arrivals at the port container terminal and by varied duration of the container operations, it is not easy to define and dimension the optimal terminal capacity.
One way of determining the optimum capac-ity of a port container terminal is the applica-tion of appropriate quantitative methods. This paper presents a methodological approach, i.e. the methods to determine the characteristics and indicators of the functioning of port con-tainer terminals, which are the basis for making appropriate decisions regarding the operation at the terminal. For this purpose, appropriate statistical methods and methods of operational researches are presented.
The presented methodology has been ap-plied to the “Brajdica” container terminal at the Port of Rijeka. However, this methodology can be applied to any container terminal in the current or future operating conditions, but with a set prerequisite to give access to all relevant statistical databases.

Z. Zenzerović, N. Antonini, S. Vilke: METODOLOŠKI PRISTUP ISTRAŽIVANJU PROCESA OPSLUŽIVANJA...
250 POMORSTVO • Scientific Journal of Maritime Research • 26/1(2012) • str./pp. 227-250
LITERATURA / REFERENCES
[1] Chang, Y. L., Win QSB, Decission Support Software for MS/0M, John Wiley & Sons, Inc., 1998.http://winqsb.en.softonic.com/download (travanj, 2012.)
[2] El-Naggar, M.E., Application of Queuing Theory to the Container Terminal at Alexandria Seaport, Journal of Soil Science and Environmental Management, 1(2010), 4, str. 77–85.
[3] Gross, D.,C. M. Harris, Fundamentals of Queueing Theory, Wiley Series in Probability and Statistics, John Wiley&Sons, Inc., 1998.
[4] EasyFit 5.5, http://www.mathwave.com/downloads.html (studeni, 2011.) [5] Kuo Tu-Cheng, et al., A Case Study of Inter-arrival Time Distributions of Container Ships, Journal of Mari-
ne Science and Technology, 14 (2006), 3, str. 155–164. [6] Pauše, Ž., Uvod u matematičku statistiku, Zagreb, Školska knjiga, 1993. [7] Petrić, J., Operaciona istraživanja, knjiga druga, Beograd, Savremena administracija, 1987. [8] Petrić, J., et al., Operaciona istraživanja, zbirka rešenih zadataka, Beograd, Naučna knjiga, 1988. [9] Petz, B., Osnovne statističke metode za nematematičare, Jastrebarsko, Naklada Slap, 1997. [10] Queuing Theory, Concept and Applications, The Icfai University Press, Hyderabad, Editors: B.V.S., Prasad
and B. Kanaka, India, 2009. [11] Statgraphics Centurion XVI.I, http://www.statgraphics.com/downloads.htm (ožujak, 2012.) [12] Statistica 6.0, StatSoft, 2001. [13] Statistika tvrtke Adriatic Gate Container Terminal d.d. [14] Suhir, E., Applied Probability for Engineers and Scientists, New York, McGraw-Hill, 1997. [15] Šošić, I, V. Serdar, Uvod u statistiku, Zagreb, Školska knjiga, 2002. [16] Turina, A., Lučki prekrcaj i njegov diskontinuitet, Rijeka, Zbornik Više pomorske škole u Rijeci, 1949. –
1964, str. 149–158. [17] Vukadinović, S., Elementi teorije masovnog opsluživanja, Beograd, Naučna knjiga, 1988. [18] Vukadinović, S., J. Popović, Matematička statistika, Beograd, Univerzitet u Beogradu, Saobraćajni fakultet,
2008. [19] Vuković, N., Statistička analiza, Beograd, Naučna knjiga, 1987. [20] Zenzerović, Z., Optimizacijski modeli planiranja kapaciteta morskih luka, doktorska disertacija, Rijeka, Z.
Zenzerović, 1995. [21] Zenzerović, Z., Model određivanja optimalnog kapaciteta lučkoga kontejnerskog terminala, U: Optimizacija
sustava hrvatskih kontejnerskih luka, poglavlje 3., Rijeka, Visoka pomorska škola u Rijeci, 2001., str. 47–71. [22] Zenzerović, Z., Teorija redova čekanja, II. dio, Stohastički procesi, Rijeka, Pomorski fakultet u Rijeci, Sveu-
čilište u Rijeci, 2003. [23] Zenzerović, Z., S. Vilke, M. Jurjević, Teorija redova čekanja u funkciji planiranja kapaciteta kontejnerskog
terminala riječke luke, Pomorstvo, 25 (2011), 1, str. 45–69.