metr 323: physical meteorology—a peer review of teaching
TRANSCRIPT

University of Nebraska - LincolnDigitalCommons@University of Nebraska - Lincoln
UNL Faculty Course Portfolios Peer Review of Teaching Project
2013
METR 323: Physical Meteorology—A PeerReview of Teaching Project Benchmark PortfolioJun WangUniversity of Nebraska Lincoln, [email protected]
Follow this and additional works at: http://digitalcommons.unl.edu/prtunl
Part of the Atmospheric Sciences Commons, Higher Education Commons, and the HigherEducation and Teaching Commons
This Portfolio is brought to you for free and open access by the Peer Review of Teaching Project at DigitalCommons@University of Nebraska - Lincoln.It has been accepted for inclusion in UNL Faculty Course Portfolios by an authorized administrator of DigitalCommons@University of Nebraska -Lincoln.
Wang, Jun, "METR 323: Physical Meteorology—A Peer Review of Teaching Project Benchmark Portfolio" (2013). UNL FacultyCourse Portfolios. 50.http://digitalcommons.unl.edu/prtunl/50

Course Portfolio
METR 323 – Physical Meteorology
Jun Wang Associate Professor
Department of Earth and Atmospheric Sciences University of Nebraska-Lincoln Lincoln, NE 68588
Phone: (402)472-3597; Email: [email protected]
30 May 2013 !!Table of Contents Executive Summary ............................................................................................................ 1 Course Description .............................................................................................................. 1 Teaching Methods/Course Materials/Course Activity ........................................................ 2
Lecture ............................................................................................................................. 2 Homework/Outdoor hands-on activities ......................................................................... 5 Mid-term/Final Exam ...................................................................................................... 9
Assessment of Student Learning ....................................................................................... 11 Appendix A: Syllabus ....................................................................................................... 14 Appendix B. Survey conducted in the class. ..................................................................... 18 !! !

! 1!
Executive)Summary)The portfolio documents the method that I used for teaching METR 323 - “Physical Meteorology” in Spring 2013. The method is designed to improve the students’ learning through hands-on activities, and to adjust the teaching plan based upon the assessment of the student learning. Hands-on out-door activities are added into the course; statistical analysis and anonymous survey are conducted to benchmark the improvement in students' learning. Results show that hands-on activities not only increase the student's interest and understanding in the course materials, but also improve the overall students' satisfaction for the course. By documenting the results and activities throughout the course, I am able to systematically analyze and improving my teaching skills that will be helpful in my future teaching of the same course as well as other courses. It is also hoped that the portfolio will make my teaching visible to my peers and help my colleagues who might teach the similar course in the future.
Course)Description))METR 323 - “Physical Meteorology” is a one-semester four-credit course required for all undergraduate majors in the Department of Earth and Atmospheric Sciences at University of Nebraska-Lincoln (UNL). In addition to normal lectures, it includes 1-credit lab as well. It is a critical course in atmospheric sciences, and most students enrolled in the class are seniors. The course essentially provides student an opportunity to learn physical fundamentals that every meteorologist/climatologist needs to know. It serves as a prerequisite course to many other 300-level and 400-level courses. In the past, this course is perceived to be very challenging and difficult, and students won’t take it until in their last semester right before graduation. The course introduces the physical processes that provide the foundation for weather forecasting and climate prediction, including radiative transfer, cloud and precipitation formation, as well as the atmospheric electricity. The course also explores the physical underpinnings of such atmospheric phenomena as optical displays (for example, rainbows, halos, etc.) and lightning. These topics are closely related to our daily lives, and also essential for the students to learn many higher-level courses particularly in the technical area of atmospheric sciences. These topics are also recommended as part of the curriculum by the National Weather Service for training meteorologists. In fact, to be hired as a civil servant by NOAA to conduct weather forecast, the student needs to show that these topics are covered by various courses in their transcripts. The prerequisite for this course include CSCE 150E (programing with Fortran), METR 205 (thermal dynamics), and PHYS 212 (general physics II). The programming course is needed, as the course will require students to apply physical principals they learned in the class to solve real problems related to atmosphere and weather. In the digital era, this means that students’ answers to questions should be quantitative if all possible, and so, the lab associated with this course is designed to provide opportunity for students to develop their programming skills. The quantitative skills (such as computer programming) are essential for undergraduates majoring in atmospheric sciences. This is because the knowledge of today’s weather is essential for conducting accurate forecast of tomorrow’s weather. Consequently, atmospheric science is awash with observation data collected by

! 2!
various kinds of platforms ranging from ground stations, air planes, balloons, satellites, and buoys (over the ocean). Analyzing these observation data is highly valuable for students to get hands-on experience of atmospheric physics, and to become a good weather forecaster or atmospheric scientist. In terms of content, the course is broadly divided into two parts drawn materials respectively from two different textbooks (see Appendix A). The first part is about radiative transfer including energy from the Sun, how solar energy is transferred in the atmosphere, and interacts with surface, how solar energy is distributed around the Earth, and how Earth is cooled through its emission of infrared energy out of the space. When describing the radiative transfer processes in the atmosphere, the roles of clouds, aerosols, and trace gases (including greenhouse gases) are also introduced, and hence particle scattering and gas absorption spectra are taught. From particle scattering theory, students will learn to explain why the sky is blue, how rainbow is formed, why CO2 is a greenhouse gas, as well as at what conditions we can see Glory, Green storms, and Halo in the atmosphere. The second part of the course is about clouds, especially how water droplets and ice crystals are distributed inside the clouds, the size, the number, and the life cycle of cloud droplets, as well as the processes responsible for the formation of rain, snow, and hail. At the end of the course, the concept of how atmospheric lightning is formed is also introduced. While the topics described above are interesting, teaching the physics behind these phenomenon is challenging because: (a) radiation is something that we can not visualize it in detail; it can be felt but is not tangible for physically touching, moving, and/or detangling; (b) understanding the concept of how atmospheric particles and gases interact with radiation requires lots of imagination of the processes at the microphysical scale; (c) few observational data is collected within clouds during precipitation or storm events, and hence the theory of rain formation requires imagination as well.
Teaching)Methods/Course)Materials/Course)Activity The course consists of three major components: lecture in class, homework/lab assignments, mid-term and final exam. In 2013, I added out-door field activities as part of the lab assignment and conducted surveys to allow students to reflect on these out-door activities. Those newly added activities are documented and analyzed here as part of my participation in UNL’s Peer-Review Teaching program.
Lecture)A major goal of this course is to deliver the fundamental knowledge and problem solving skills in atmospheric science to the students; therefore the course is almost entirely lecture based, although inquires are also frequently used throughout the lecture. I use the Blackboard system for outside classroom communication; the lecture materials are often

! 3!
posted one-day early before the actual class, and homework/lab assignments are posted on the day when they are distributed to the students. During the lecture, from time to time, I will ask pop-up questions to each student in a sequence according to the alphabet order of their family’s names; this is to check the students’ understanding and encourage them to actively participate in the classroom learning. Often, these questions are designed to be in series to develop students’ critical thinking for interpreting a complicated concept or figure. Typical examples include:
• What do you find or can you see/learn from this figure/concept? • Tell us what are the main features in this figure, and why is that? • That student has shared his/her thoughts about why the results appear like this, do
you have a different thought or you agree with that student? • If what that student just said is correct, why/how we can see such and such in the
figure or observed data? In addition to the materials in the textbook, I often will link the course materials to many forefronts of current research in the field. I am a true believer that the beauty of science should be and can be explained by simple sentences and physical principals. Hence, by linking what students learned in the textbook to what are being actively researched in the field, the students can appreciate more of what they learned, see how the theory itself is evolving and applied in the reality, understand what are the well-known or less known areas -- all of which in turn further spark students’ interest in the course. For example, when I teach the CO2 effect on climate, I showed two slides: one is the time series of CO2 with most current data record (Fig. 1); one is the upward terrestrial radiation measured by NASA’s satellite over Mars and Earth (Fig. 2). The first is topical, as most students already heard a lot from TV and other medias on the increasing trend of CO2. But, how much is CO2 in today’s atmosphere? Starting with this question, I found students are immediately interested to see the first slide. The second slide also interests students because it is the data collected by satellite over Mars - something that can immediately trigger the students’ curiosity. I then use this slide to point out the specific wavelengths (15 µm) that CO2 absorbs the terrestrial radiation – students can find easily from the slide that there is a deep dip in the observed spectra. Finally, I link these two slides together, and ask students that if CO2 acts like a blanket to absorb the radiation emitted from the Earth surface and CO2 concentration in atmospheric continuously increases, what the temperature in atmosphere will be? Most students are engaged with this question and can have a right answer. In addition, they will also know the CO2 amount in the atmosphere is around 400 ppm now, but can increase by 3-4 ppm next year, and CO2 absorbs at 15 µm. Such quantitative knowledge is an essential part that makes an undergraduate student taking physical meteorology class differ from other undergraduates!

! 4!
Figure 1. A slide showing the increase of CO2.
Figure 2. A slide shown the satellite-measured spectra of upward radiation over Mars and Earth.
Black: 7-month running avg.!
http://www.esrl.noaa.gov/gmd/ccgg/index.html!http://www.esrl.noaa.gov/gmd/ccgg/trends/!
Mars spectra!
Earth spectra!

! 5!
Homework/Outdoor)handsBon)activities)In total, 5 homework sets are assigned to the students, and all homework are graded by a full-time Graduate Teaching Assistant who also teaches the lab. Every homework usually consists a series of problems that will take student 2-3 weeks to complete. Indeed, the later homework also builds up the previous one, and they are connected by a series of small problems that eventually lead students to develop a numerical model to estimate the amount of solar energy for any given time and location over the Earth. This numerical model is useful for planning of solar power plants, but cannot be completed by a single homework. By completing all the homework, the students are able to see the strategy to tackle a big problem with a series of small steps. Two hands-on activities are added into the Spring 2013 assignment to strengthen the students’ learning as well as their ability to solve real problems.
a) Take measurements of direct solar radiation at specific wavelengths, as well as diffuse and direct amount of solar energy at the surface (Figure 3). Through this hands-on activity, students appreciate more deeply on the concept of direct vs. diffuse radiation, as well as particle scattering in the atmosphere. They also had hands-on experience to learn Beer’s law, a fundamental law for deriving the atmospheric turbidity and optical depth from direct sun measurements, as well as how direct, diffuse, and total solar energy at the surface vary with the optical depth in the atmosphere. Further, they also learned more about the concept of broadband vs. narrow band radiation, and the application of theory (such as Beer’s law) to design the measurements.
b) Analyze the role of cloud and solar radiation in regulating the seasonal variation
of surface temperature in Lincoln NE (Figure 4). Such analysis really brings what students learned to home. In Lincoln, the monthly mean temperature in 2001-2010 peaked in June, although the radiation from the Sun always peaks in July. The mismatch is because that the cloud fraction is higher in July than in June, so the actual solar input at the surface is maximum in June instead of July. Indeed, after considering both cloud fraction and solar radiation, the monthly variation of surface temperature can be explained by 99% (Figure 5).

! 6!
.
Fig. 3. Hands-on activities for students to take measurements of direct and diffuse solar energy at the surface, the atmospheric optical depthand water vapor amount using Sun-photometer and Pynaromenters.

! 7!
Figure 4. Monthly variation of temperature, cloud fraction and clear-sky solar flux in Lincoln, NE in 2001-2010. The Lincoln monthly mean temperature is from the reports by National Weather Service, cloud fraction data is from NASA’s satellite observation, and clear-sky downward solar flux is from the numerical model developed by the student in the class through homework 1-4.

! 8!
Figure 5. A plot of a student’s homework showing the correlation of Lincoln’s monthly mean temperature in 2001-2010 (y-axis) with (a) clear-sky monthly-mean downward solar flux; (b) monthly-mean cloud fraction, and (c) all sky monthly-mean downward flux. All sky monthly mean downward flux is product between clearly sky and cloud fraction. The figure clearly shows the Lincon’s variation of monthly temperature can be better explained by considering cloud fraction.

! 9!
MidBterm/Final)Exam)The mid-term exam is held right before the Spring break, covering the lecture materials related to radiative transfer. The final exam is held in the final exam week, covering primarily the lecture materials related to cloud, precipitation, and lightning. The materials taught prior to mid-term exam only take up ~10% in the final exam. While the mid-term and final exam organically and respectively cover the two parts of the course, they are linked through the role of cloud in the atmospheric radiative transfer. In the class one week before each exam, I provide ~40 minute review in the class to highlight the key topics taught in the class. I also layout the structure of the exam, and handout a 3-by-7 inch note card for students to write whatever they want and bring that note card during the exam. My philosophy for designing an exam is not to test the students’ memory, but to evaluate the students’ understanding of physical principals and concepts, as well as students’ use of these principals and concepts to solve practical problems. Memorizing what being taught is not an effective way for student to learn; only those memories with a good understanding can last long. With above thinking for designing the exam, the problems in the exam often include multiple options, true/false and why, figure interpretation, and quantitative problem solving. One example of linking theory to real phenomena is provided in Figure 6.

! 10!
Figure 6. A problem in the final exam showcases the emphasis of linking the theory to the interpretation of real observations.

! 11!
Assessment)of)Student)Learning)Assessment of student learning is based upon the students’ homework/lab assignment grade, mid-term and final exam grade, as well as the survey conducted in the class. Final grade of the course is a sum of homework grade (30%), mid-term exam grade (30%), and final exam (30%), with a full score of 100. Grade A is given if the overall score is 90 and more. See details about grading in Appendix A. In Spring 2013, 18 students were enrolled in the class, including two graduate students. Only one student’s final grade is B, the other students all received a grade of A. It is also noted that the class only had one female student, but the student who received B was not the female student. Correlation analysis shows a moderate correlation (R2=0.25) between homework average score and the exam score (Figure 7). This suggests that students should spend their efforts in learning regularly by doing homework and lab assignment in order to learn well throughout the semester. Further analysis shows that, after the field hands-on activity is introduced, the majority of students (15 out of 18) had significant improvement in their exam grade (Figure 8). Further survey (Appendix B) shows that students were overall happy with learning through hands-on activity and through survey to reflect their recommendations to the instructor regarding the potential area for improving teaching.

! 12!
Figure 7. correlation analysis between homework grade average vs. exam grade for mid-term (top) and final (bottom).
R²!=!0.28644!
0.7!
0.75!
0.8!
0.85!
0.9!
0.95!
1!
1.05!
1.1!
1.15!
1.2!
0.7! 0.8! 0.9! 1! 1.1! 1.2!
mid$term(score(
homework(grade(average(prior(to(mid$term(
R²!=!0.25176!
0.8!
0.85!
0.9!
0.95!
1!
1.05!
0.8! 0.85! 0.9! 0.95! 1! 1.05! 1.1! 1.15!
Final(Grade(
homework(grade(average(

! 13!
Figure 8. Scatter plot of mid-term score vs. final exam score. After the field hands-on activity was introduced, only 3 students that did not show any improvement in the final score (as compared to their mid-term exam score) all other 15 students showed apparent improvement (by average 5 points out of 100) in their final exam grade over their mid-term exam grade. Note, in both final and mid-term exams, the total points are 120, and the students’’ score are scaled to 1.2 here for the purpose of plotting.
R²!=!0.16887!
0.7!
0.75!
0.8!
0.85!
0.9!
0.95!
1!
1.05!
1.1!
1.15!
1.2!
0.7! 0.8! 0.9! 1! 1.1! 1.2!
7inal(exam(score((after(7ield(hands$on(activity()(
mid$term(score((prior(to(7ield(hands$on(activity)(

! 14!
Appendix)A:)Syllabus)

! 15!
PHYSICAL METEOROLOGY
INSTRUCTOR: DR. JUN WANG http://www.eas.unl.edu/~jwang
INSTRUCTOR’S CONTACT INFORMATION Office: Bessey Hall, Room 303 Phone: 402-472-3597 Email: jwang7 at unl dot edu Office hour: Tuesday 2:00-5:00 pm or by appointment; best through email contact TA’S CONTACT INFORMATION Amy Gehring Email: [email protected] COURSE INFORMATION Course #: METR 323/823 Prerequisites: CSCE 150E, METR 205, PHYS 212 (or Permission) Class time: 9:30 - 10:45am, Tu. &Th. Classroom: 104 Bessey Hall COURSE DESCRIPTION In this course we will investigate the physical processes that provide the foundation for weather forecasting and climate prediction, including radiative transfer, cloud and precipitation formation, as well as the atmospheric electricity. We will also explore the physical underpinnings of such atmospheric phenomena as optical displays (for example, rainbows, halos, etc.) and lightning. The primary software used for this class is IDL (Interactive Data Language). REQUIRED TEXTBOOKS A first course in atmospheric radiation (second edition), by G. W. Petty, Sundog
publishing, ISBN: 0972903313, 2006. A short course in cloud physics (third edition), by R. R. Rogers and M. K. Yau,
Butterworth-Heinemann publishing, ISBN:0750632151, 1996. OTHER TEXTBOOKS An Introduction to Atmospheric Radiation (second Edition), by K. N. Liou, Academic
Press, ISBN: 0124514510, 2002. Atmospheric science – an introductory survey (section edition), by J. M. Wallace and P.
V. Hobbs, Academic Press, ISBN: 012732951X, 2006. Lighting – physics and effects, by V. A. Radkov and M. A. Uman, Cambridge University
Press, ISBN: 0521035414, 2003.

! 16!
LAB ASSIGNMENTS Lab assignments are given regularly. Students should turn in their completed assignments by due date given in the assignment. The penalty for late return of assignments is 20% deduction per day on the grade of that assignment. EXPECTATIONS The course has many hands-on projects that require computer programming and field work. Improving computer programming skills requires a daily grind of practice and determination. Students are expected to work hard and achieve the highest standards. Independent work is strongly encouraged. I also expect students to participate actively in class by asking and answering questions about the course material. GRADUATE CREDIT To earn graduate credit for this course, students will be expected to complete a term project in addition to the above requirements. The nature and topic of the project will be determined in consultation with the instructor. SICK/EMERGENCY LEAVE POLICY If you will miss an exam for medical or emergency reasons, you must contact the instructor or leave a message with the department secretary (402-472-2663) before the scheduled exam time. Makeup exams will be given only to those students who have contacted the instructor or the department secretary prior to the scheduled exam. OTHER BUSINESS POLICY If you will miss the due date of an assignment because of business travel (e.g., attending AMS or other conferences), the due date of the assignment will be extended for a time period equivalent to the number of days you actually spent in the travel. In order to obtain this extension, you must inform your instructor about your travel time before the travel. GRADE POLICY Regular lab assignments: 30% of final grade; One mid-term exam: 30% of final grade; Final exam: 40% of final grade; Grading scale: A ≥ 90%; 80% ≤ B < 90%; 70% ≤ C < 80%; 60% ≤ D < 70%; E < 60% FINAL NOTE If you have a documented learning disability and will be requesting academic accommodation for this class, please contact The Offices of Services for Students with Disabilities (http://www.unl.edu/ssd/).

! 17!
CLASS SCHEDULE1
!!!!!!!!!!!!!!!!!!!!!!!!!!!!!!!!!!!!!!!!!!!!!!!!!!!!!!!!1!The!schedule!is!subject!to!change!depending!on!progress!of!the!class!and!other!unpredictable!factors.(Lab!assignments!and!handEout!materials!will!be!given!regularly.!
Week # Date Topics Remarks 1 01/08 Introduction GWP Ch1
01/10 AMS meeting 2 01/15 Properties and description of Radiation GWP Ch3&3
01/17 Reflection and refraction GWP Ch4 3 01/22 TBD
01/24 On travel 4 01/29 Reflection and refraction GWP Ch4
01/31 Radiative properties of natural sufaces GWP Ch5 5 02/05 Blackbody law and thermal emission GWP Ch6
02/07 Blackbody law and thermal emission GWP Ch6 6 02/12 Gas absorption and particle scattering GWP Ch9
02/14 Gas absorption and particle scattering GWP Ch7,11,12 7 02/19 Atmospheric optical phenomena GWP Ch7, 8, 11
02/21 Optical phenomena and radiative transfer GWP Ch 7 8 02/26 Radiative transfer GWP Ch 8
03/28 Radiative transfer GWP Ch 10 9 03/05 Radiative transfer, heating rate GWP Ch 10
03/07 Mid-term review 10 03/12 Visiblity
03/14 Mid-term exam 11 03/19 Spring break
03/21 Spring break 12 03/26 Observed properties of clouds RY Ch5
03/28 Observed properties of clouds RY Ch5 13 04/02 Formation of Cloud Droplets RY Ch6
04/04 Formation of warm rain RY Ch7, 8 14 04/09 Formation of ice crystals RY Ch9
04/11 Ice Rain and Snow RY Ch10 15 04/16 Precipitation Process & lightning RY Ch 12
04/18 Lightning Hands-out 16 04/23 TBD
04/25 Review for final exam 17 Final exam

! 18!
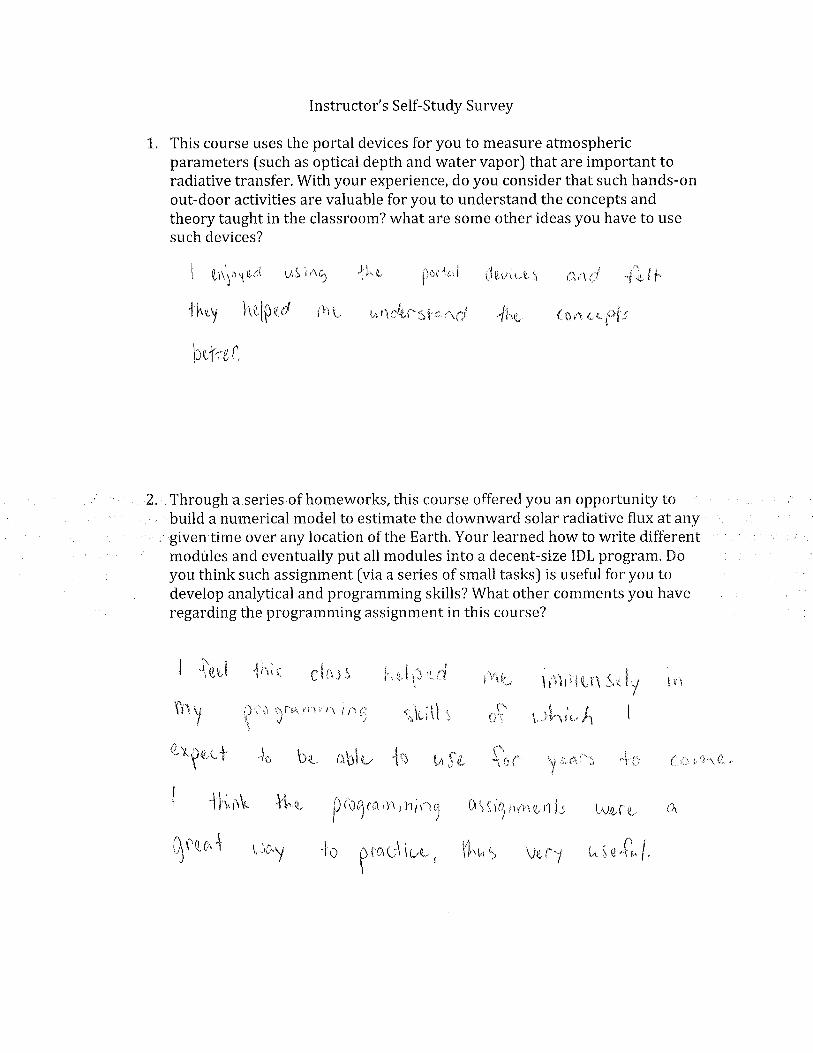
Appendix)B.)Survey)conducted)in)the)class.)