metrics, benchmarking best practices - werc · pdf filemetrics, benchmarking & best...
TRANSCRIPT
www.werc.org
Metrics, Benchmarking& Best Practices
Increasing DC Productivity & Efficiency
www.werc.org
• Why qualitative and quantitative benchmarking go hand‐in‐hand
• Critical warehouse metrics – WERC’s DC Measure Study. Where does your company stand?
• A step‐by‐step description of an approach to benchmarking.
• WERC’s Assessment Program
In this session…
www.werc.org
“If you can’t measure it, you can’t manage it.”
~ Peter Drucker
www.werc.org
“The process of improving performance by continuouslyidentifying, understanding, and adapting outstanding practices and processes found inside and outside the organization.
Benchmarking (seeks) to improve any given business process by exploiting "best practices" rather than merely measuring the best performance. Best practices are the cause of best performance. Studying best practices provides the greatest opportunity for gaining a strategic, operational, and financial advantage.”
The American Productivity and Quality Center (APQC)
Benchmarking is…
www.werc.org
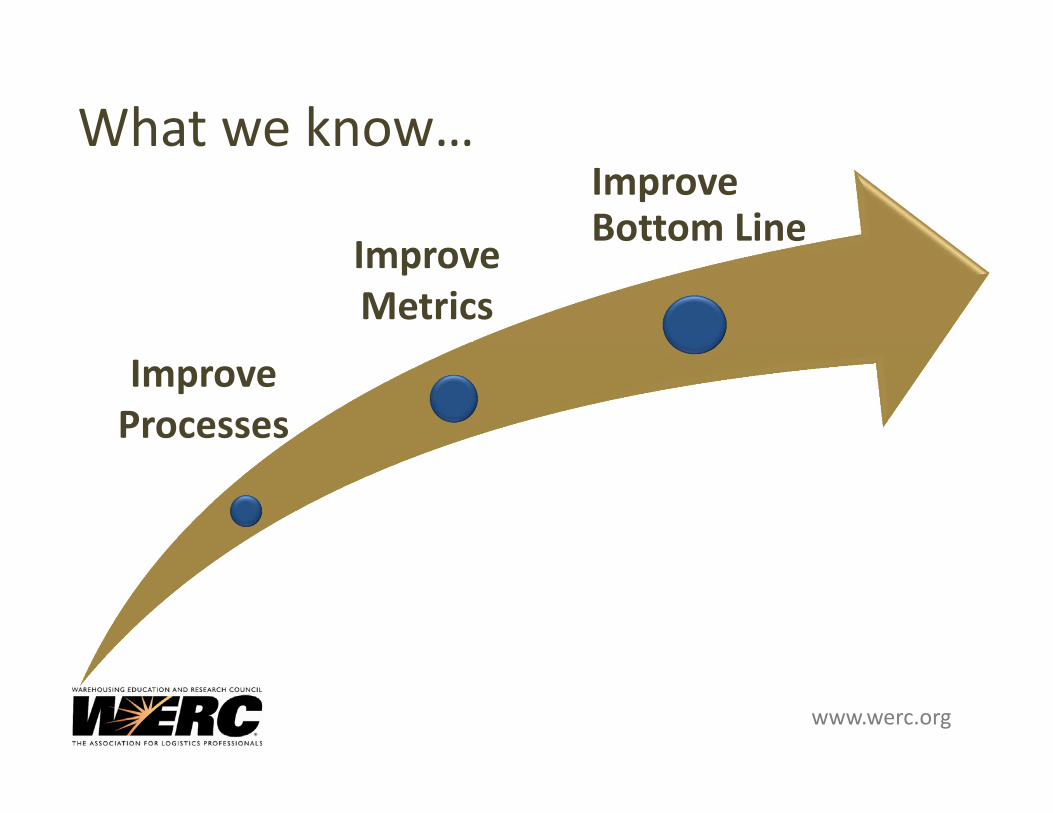
Improve Bottom Line
Improve Metrics
Improve Processes
What we know…
www.werc.org
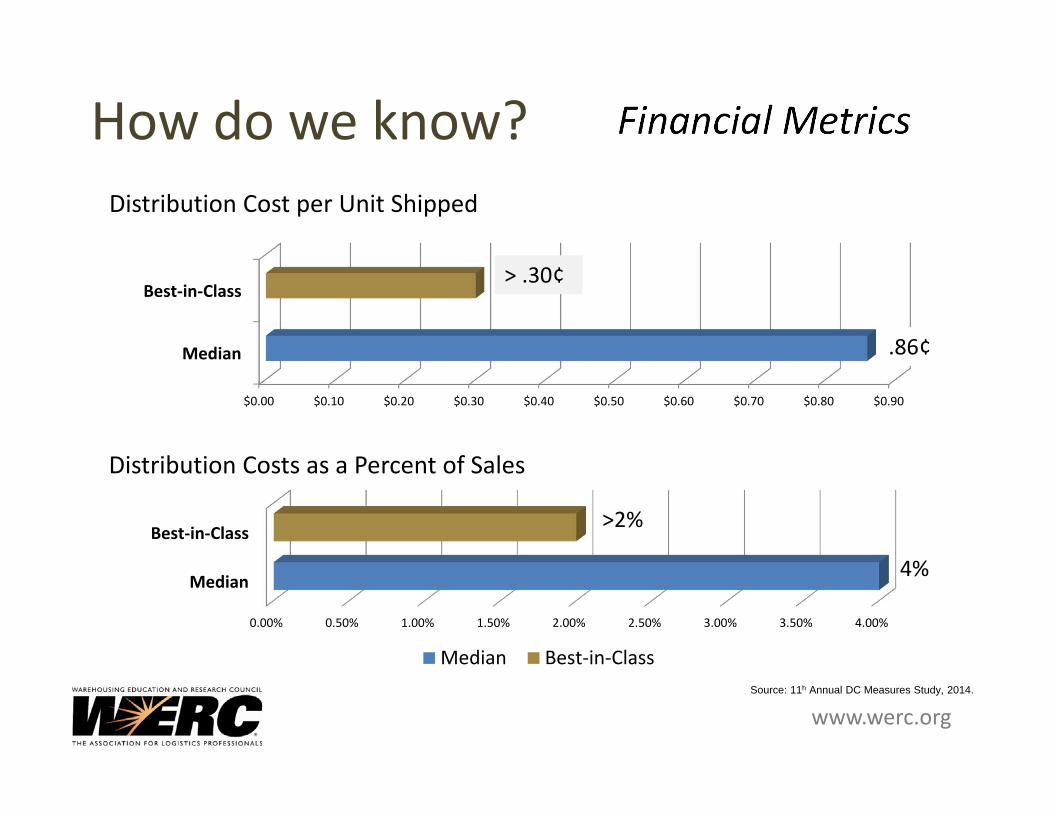
Financial Metrics
Source: 11h Annual DC Measures Study, 2014.
How do we know?
0.00% 0.50% 1.00% 1.50% 2.00% 2.50% 3.00% 3.50% 4.00%
Median
Best‐in‐Class
Distribution Costs as a Percent of Sales
Median Best‐in‐Class
>2%
4%
$0.00 $0.10 $0.20 $0.30 $0.40 $0.50 $0.60 $0.70 $0.80 $0.90
Median
Best‐in‐Class
Distribution Cost per Unit Shipped
> .30¢
.86¢
www.werc.org
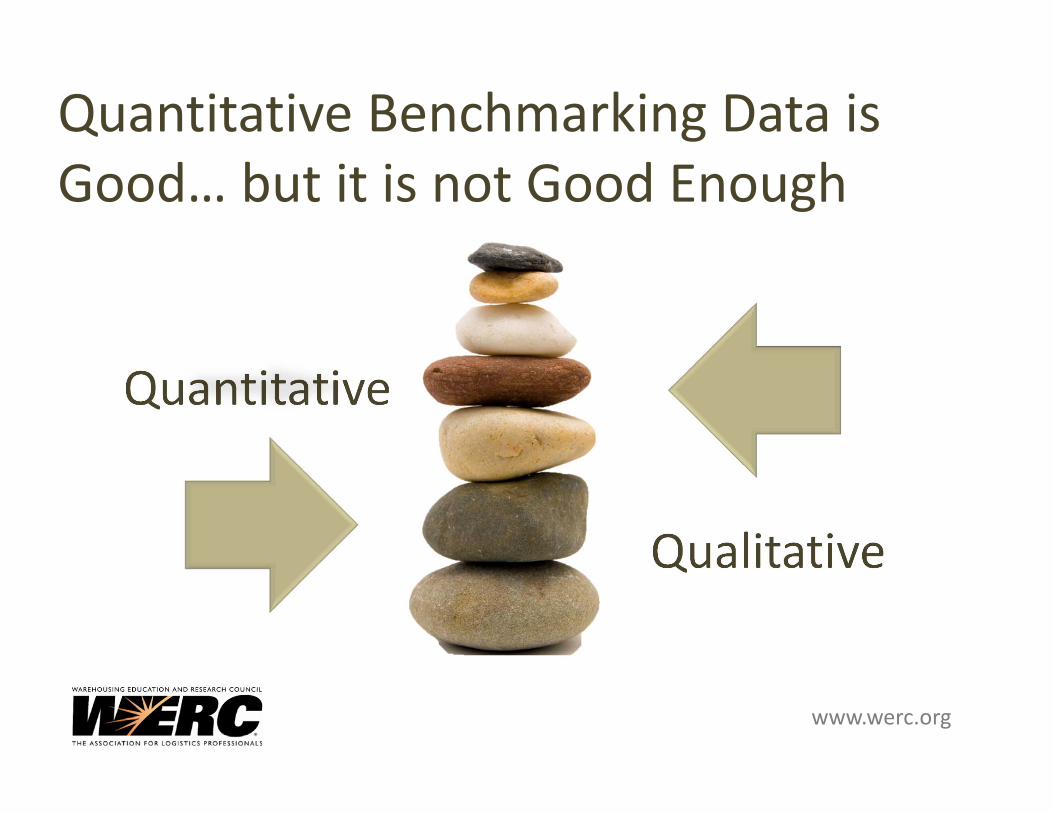
Quantitative
Qualitative
Quantitative Benchmarking Data is Good… but it is not Good Enough
www.werc.org
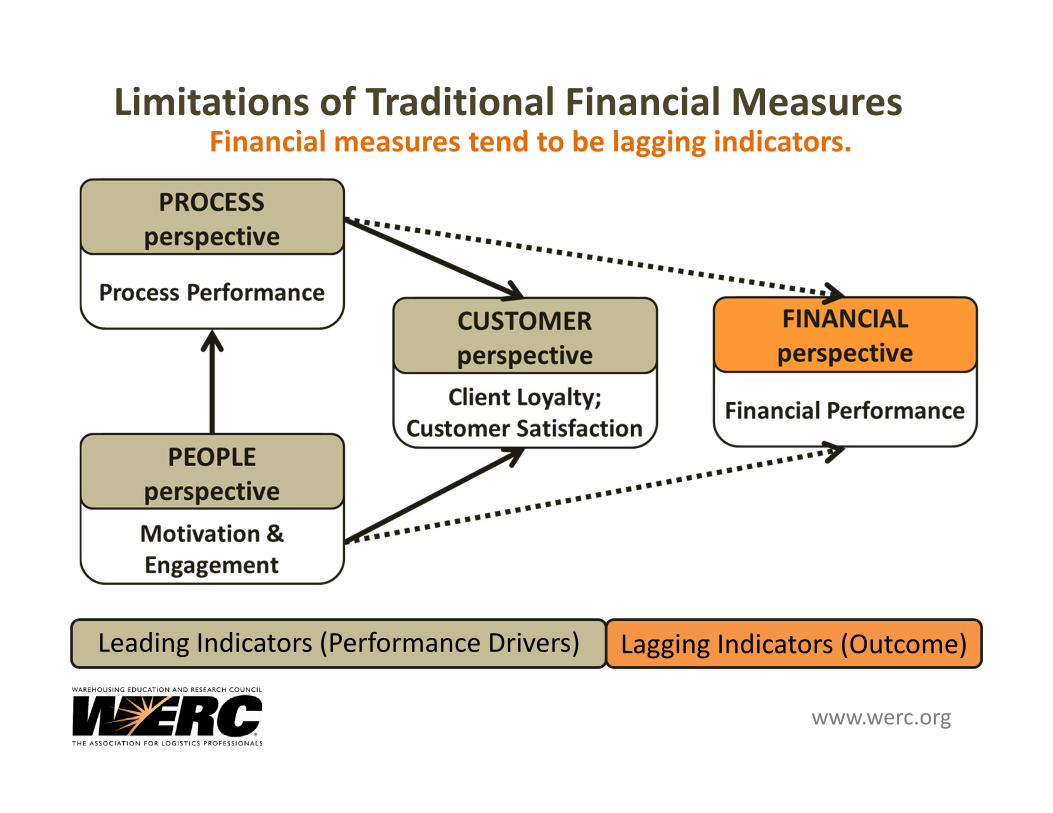
Financial measures tend to be lagging indicators.
Leading Indicators (Performance Drivers) Lagging Indicators (Outcome)
Limitations of Traditional Financial Measures
www.werc.org
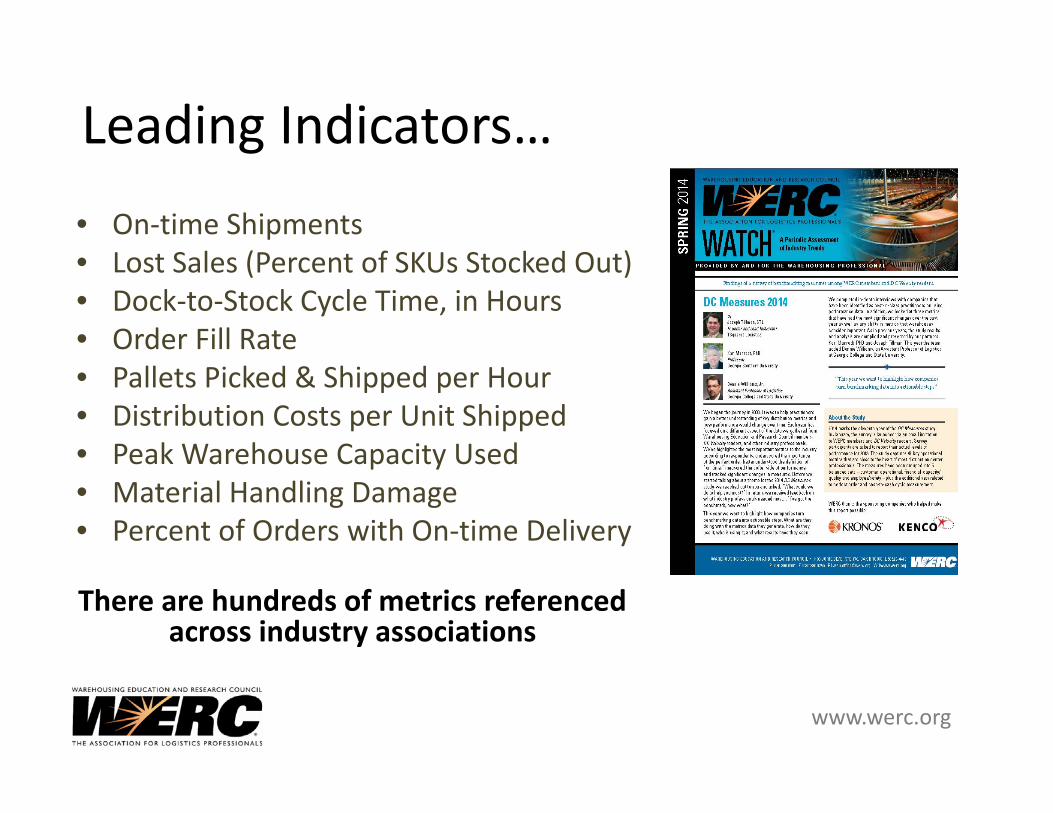
Leading Indicators…• On‐time Shipments• Lost Sales (Percent of SKUs Stocked Out)• Dock‐to‐Stock Cycle Time, in Hours• Order Fill Rate• Pallets Picked & Shipped per Hour• Distribution Costs per Unit Shipped• Peak Warehouse Capacity Used• Material Handling Damage• Percent of Orders with On‐time Delivery
There are hundreds of metrics referencedacross industry associations
www.werc.org
Research Team:Karl B. Manrodt, Ph.D. Professor, Georgia Southern University
Donnie Williams, Jr. Assistant Professor of Logistics, Georgia College and State University
Joe TillmanCTL Founder ‐ TSquared Logistics LLC
10
The WERC Research Team & Partners…
Research Sponsor:Research Partner:
Data Licensed By:
www.werc.org
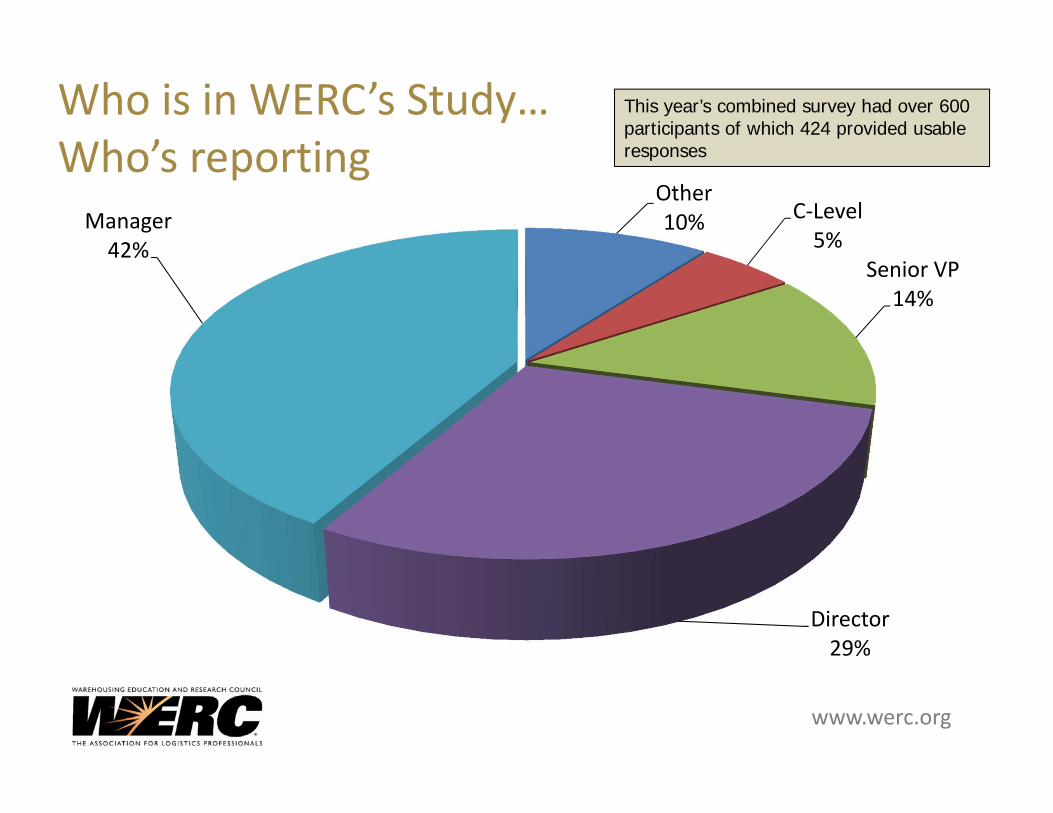
Other10% C‐Level
5%Senior VP
14%
Director29%
Manager42%
Who is in WERC’s Study… Who’s reporting
This year’s combined survey had over 600 participants of which 424 provided usable responses
www.werc.org
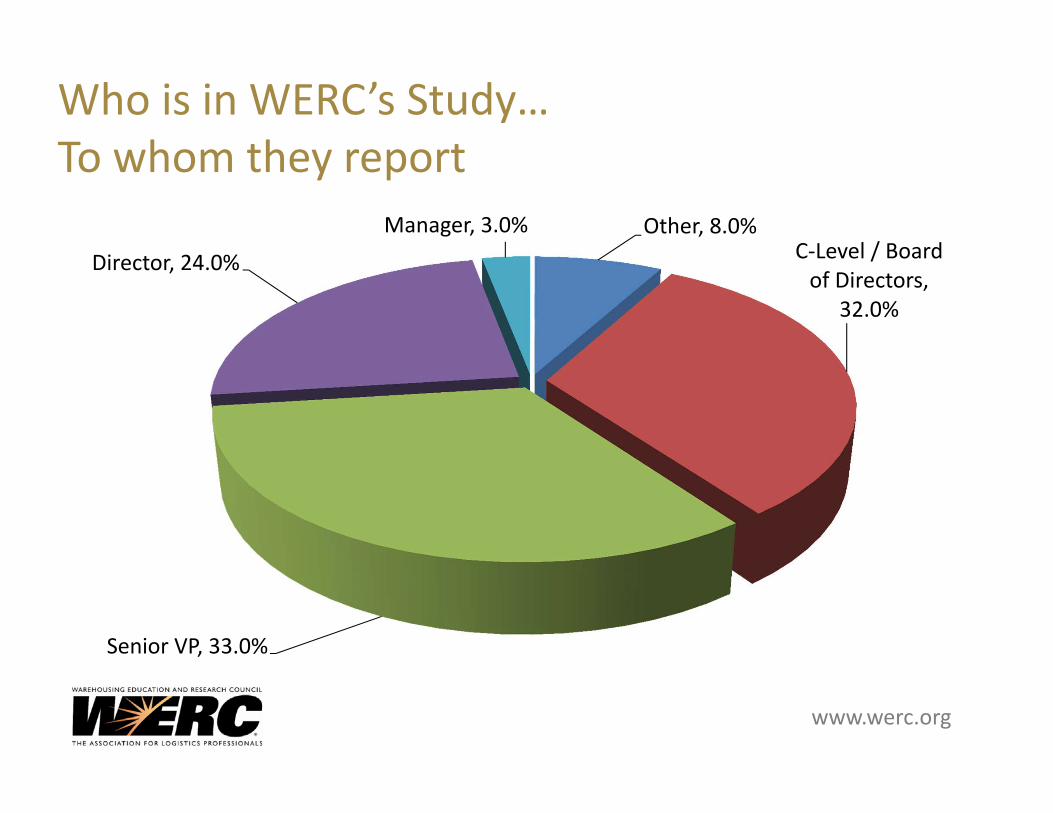
Who is in WERC’s Study… To whom they report
Other, 8.0%C‐Level / Board of Directors,
32.0%
Senior VP, 33.0%
Director, 24.0%
Manager, 3.0%
www.werc.org
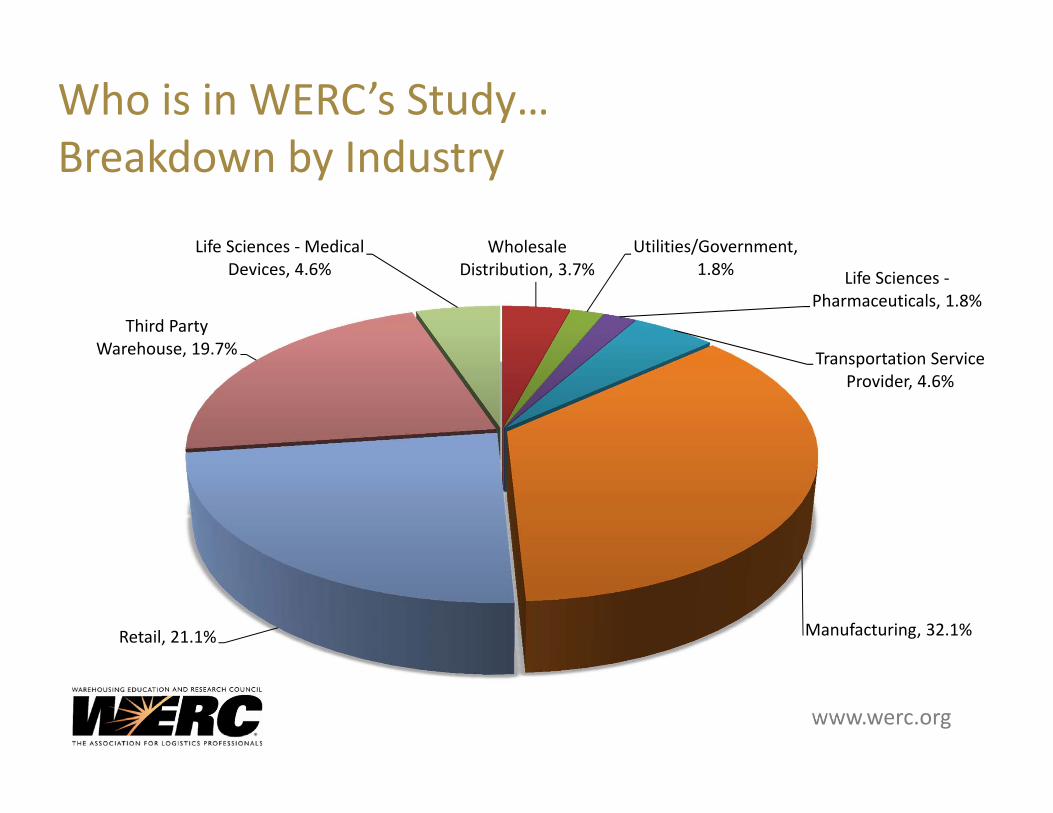
Who is in WERC’s Study… Breakdown by Industry
Wholesale Distribution, 3.7%
Utilities/Government, 1.8% Life Sciences ‐
Pharmaceuticals, 1.8%
Transportation Service Provider, 4.6%
Manufacturing, 32.1%Retail, 21.1%
Third Party Warehouse, 19.7%
Life Sciences ‐Medical Devices, 4.6%
www.werc.org
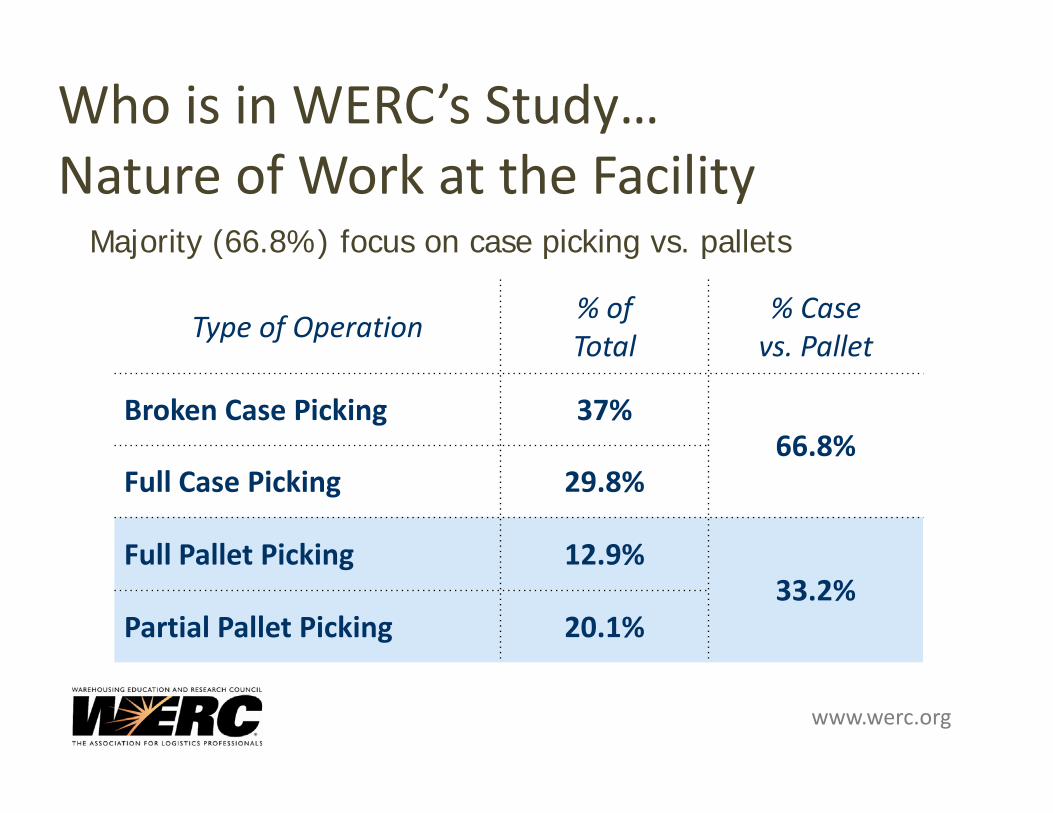
Who is in WERC’s Study… Nature of Work at the Facility
Majority (66.8%) focus on case picking vs. pallets
Type of Operation % ofTotal
% Casevs. Pallet
Broken Case Picking 37%66.8%
Full Case Picking 29.8%
Full Pallet Picking 12.9%33.2%
Partial Pallet Picking 20.1%

www.werc.org
Manufacturer Wholesaler/Distributor Retailer
18.6% 36.7% 22.3% 22.3%
End User/Consumer
Respondents serve customers across the supply chain
Who is in WERC’s Study… Primary Customer Served
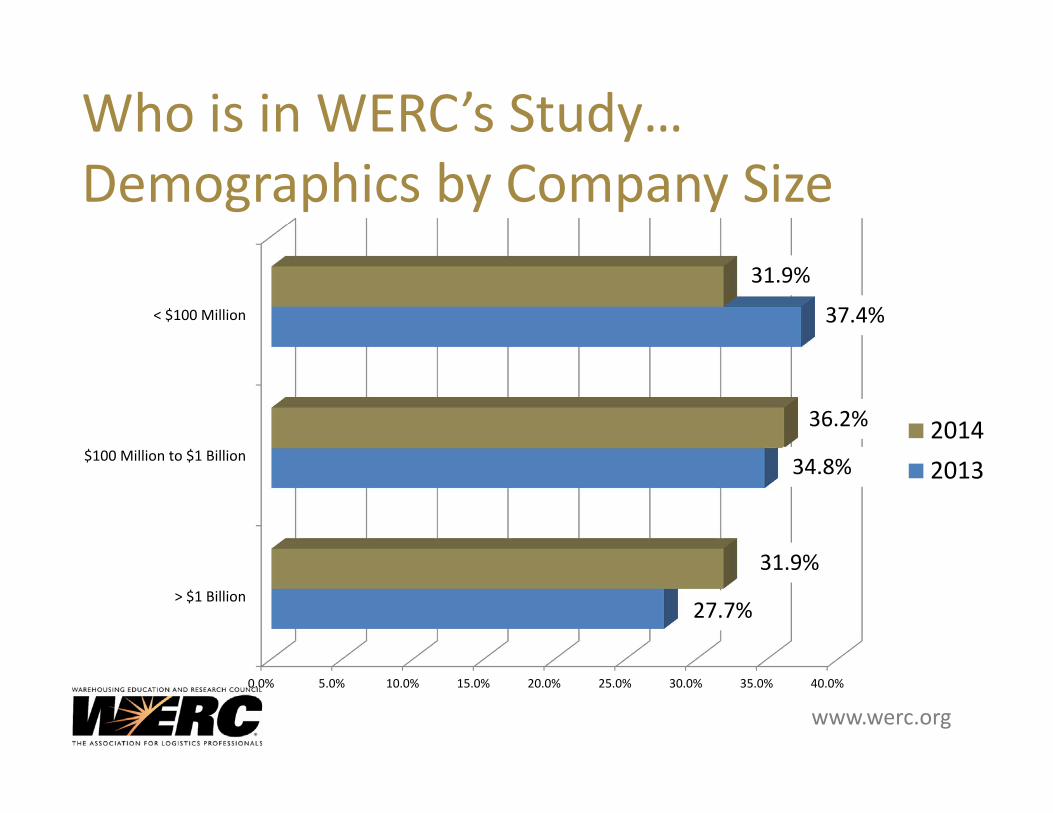
www.werc.org0.0% 5.0% 10.0% 15.0% 20.0% 25.0% 30.0% 35.0% 40.0%
> $1 Billion
$100 Million to $1 Billion
< $100 Million
20142013
31.9%
37.4%
36.2%
34.8%
31.9%
27.7%
Who is in WERC’s Study… Demographics by Company Size
www.werc.org
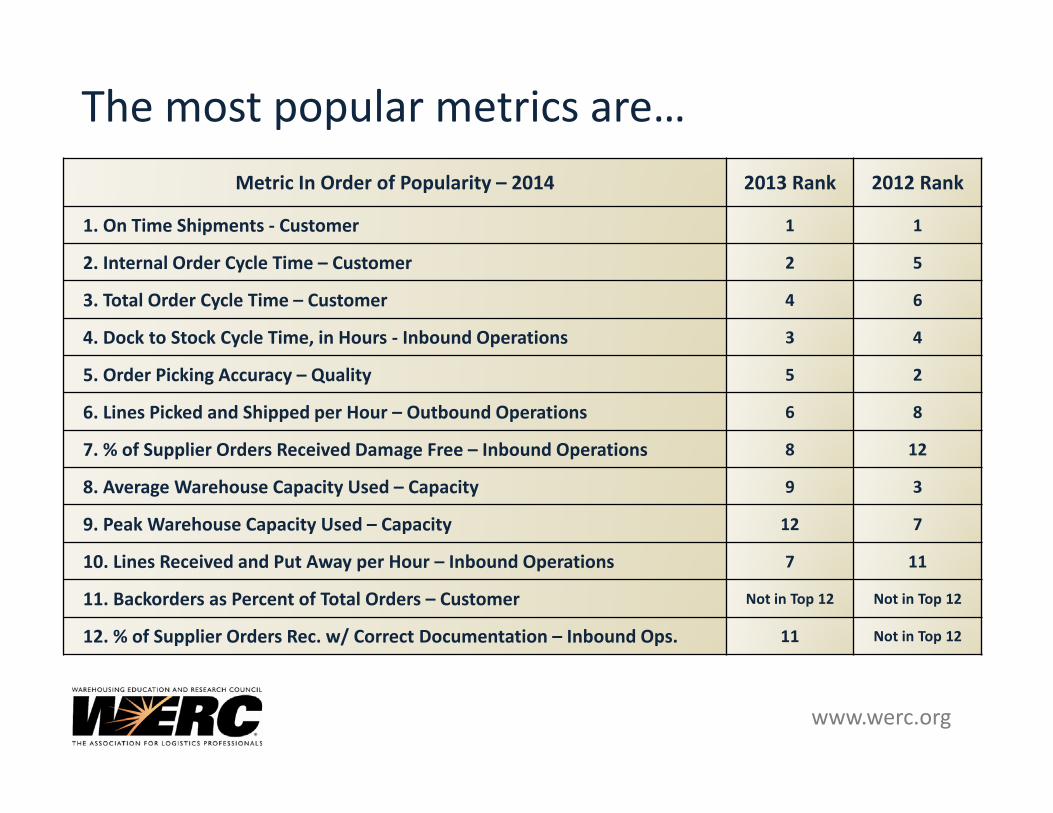
Metric In Order of Popularity – 2014 2013 Rank 2012 Rank
1. On Time Shipments ‐ Customer 1 1
2. Internal Order Cycle Time – Customer 2 5
3. Total Order Cycle Time – Customer 4 6
4. Dock to Stock Cycle Time, in Hours ‐ Inbound Operations 3 4
5. Order Picking Accuracy – Quality 5 2
6. Lines Picked and Shipped per Hour – Outbound Operations 6 8
7. % of Supplier Orders Received Damage Free – Inbound Operations 8 12
8. Average Warehouse Capacity Used – Capacity 9 3
9. Peak Warehouse Capacity Used – Capacity 12 7
10. Lines Received and Put Away per Hour – Inbound Operations 7 11
11. Backorders as Percent of Total Orders – Customer Not in Top 12 Not in Top 12
12. % of Supplier Orders Rec. w/ Correct Documentation – Inbound Ops. 11 Not in Top 12
The most popular metrics are…
www.werc.org
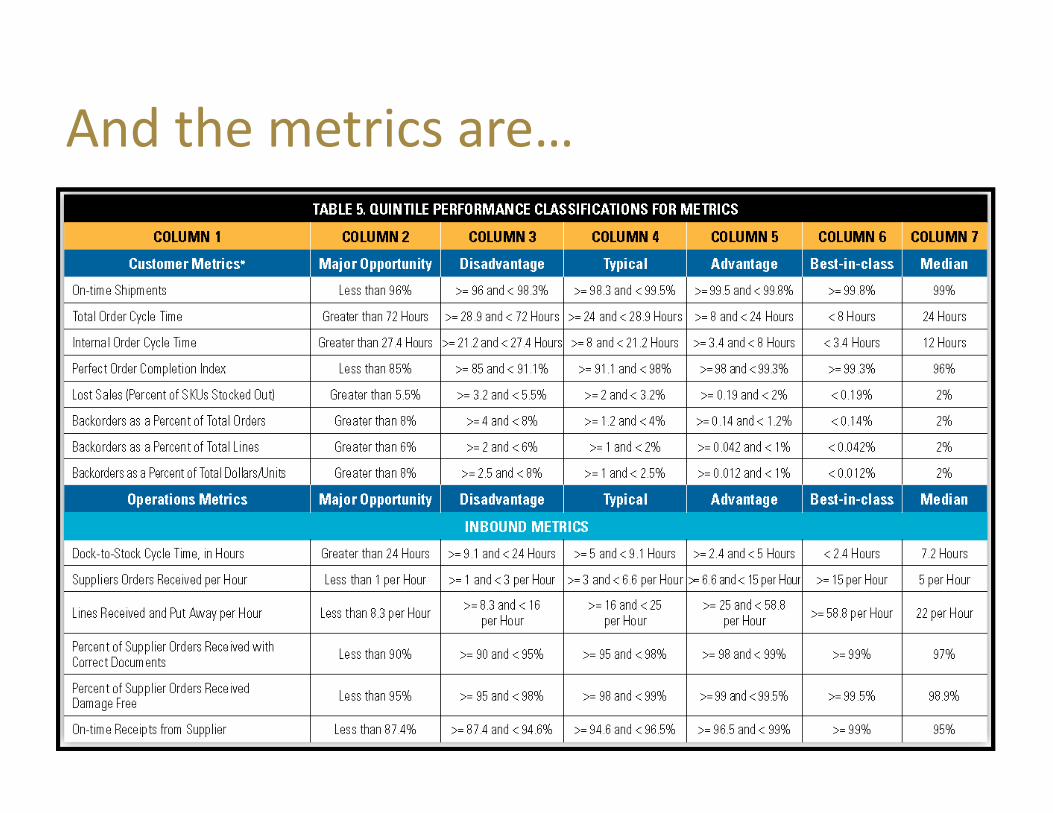
And the metrics are…
www.werc.org
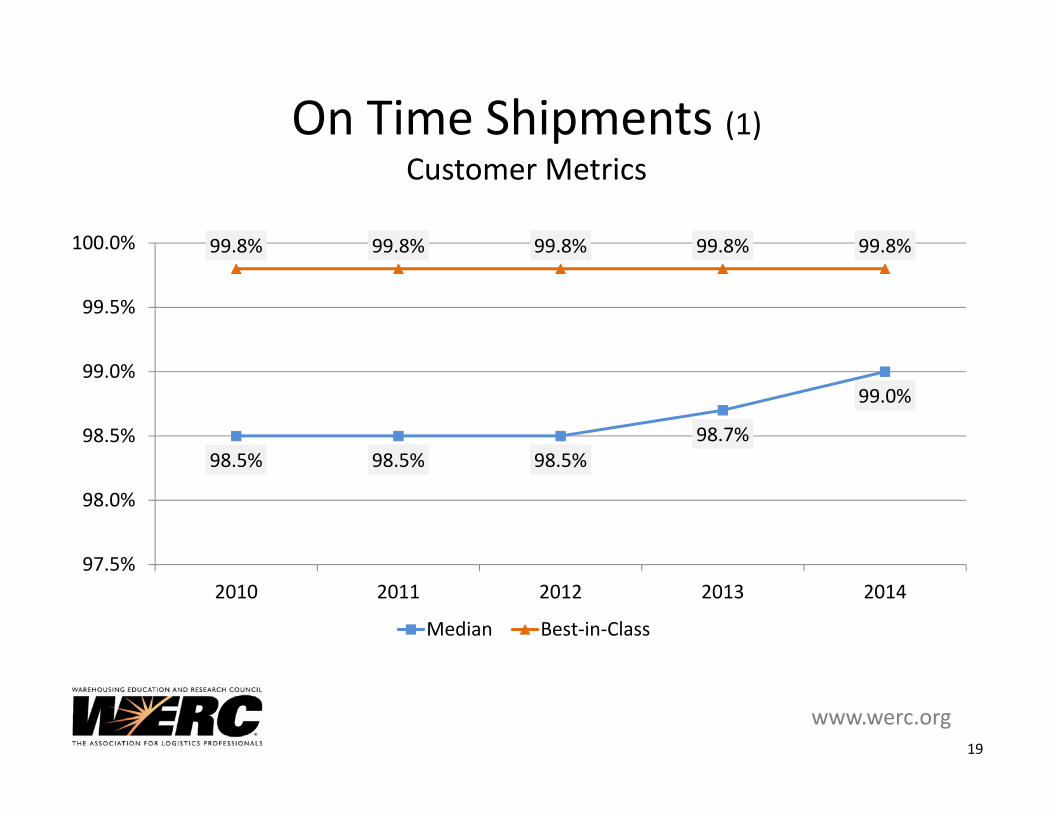
On Time Shipments (1)Customer Metrics
19
98.5% 98.5% 98.5%98.7%
99.0%
99.8% 99.8% 99.8% 99.8% 99.8%
97.5%
98.0%
98.5%
99.0%
99.5%
100.0%
2010 2011 2012 2013 2014
Median Best‐in‐Class
www.werc.org
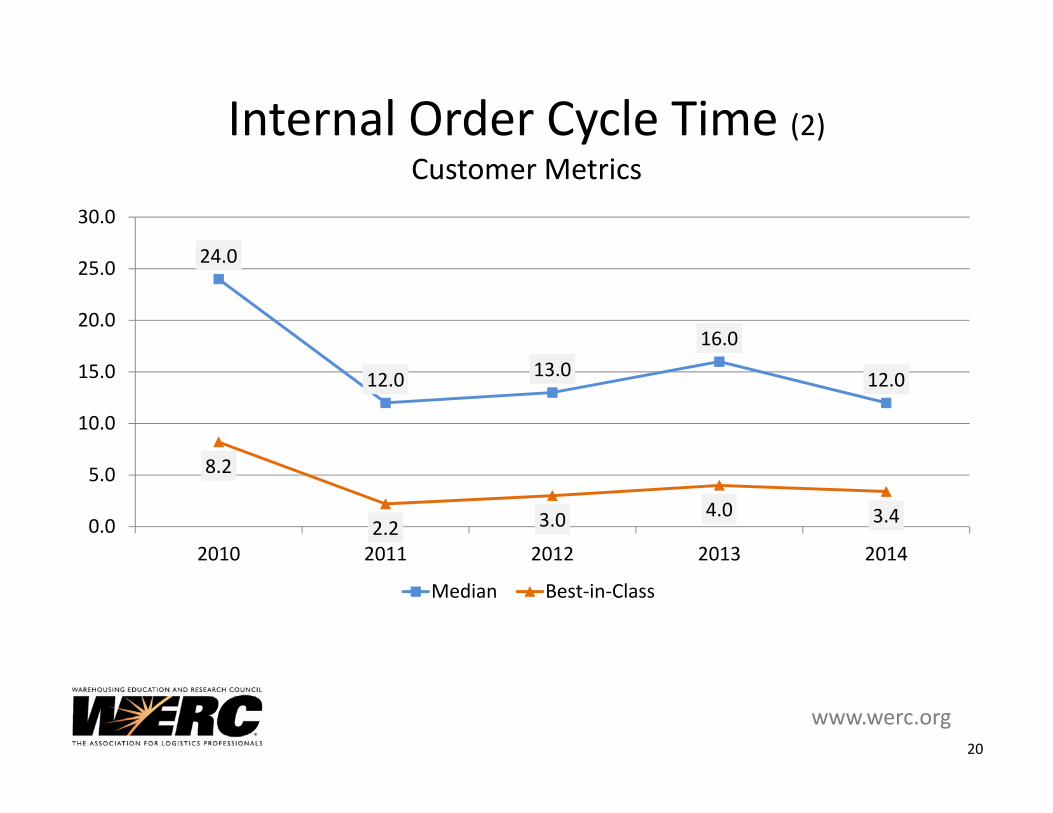
Internal Order Cycle Time (2)Customer Metrics
20
24.0
12.0 13.016.0
12.0
8.2
2.2 3.0 4.0 3.40.0
5.0
10.0
15.0
20.0
25.0
30.0
2010 2011 2012 2013 2014
Median Best‐in‐Class
www.werc.org
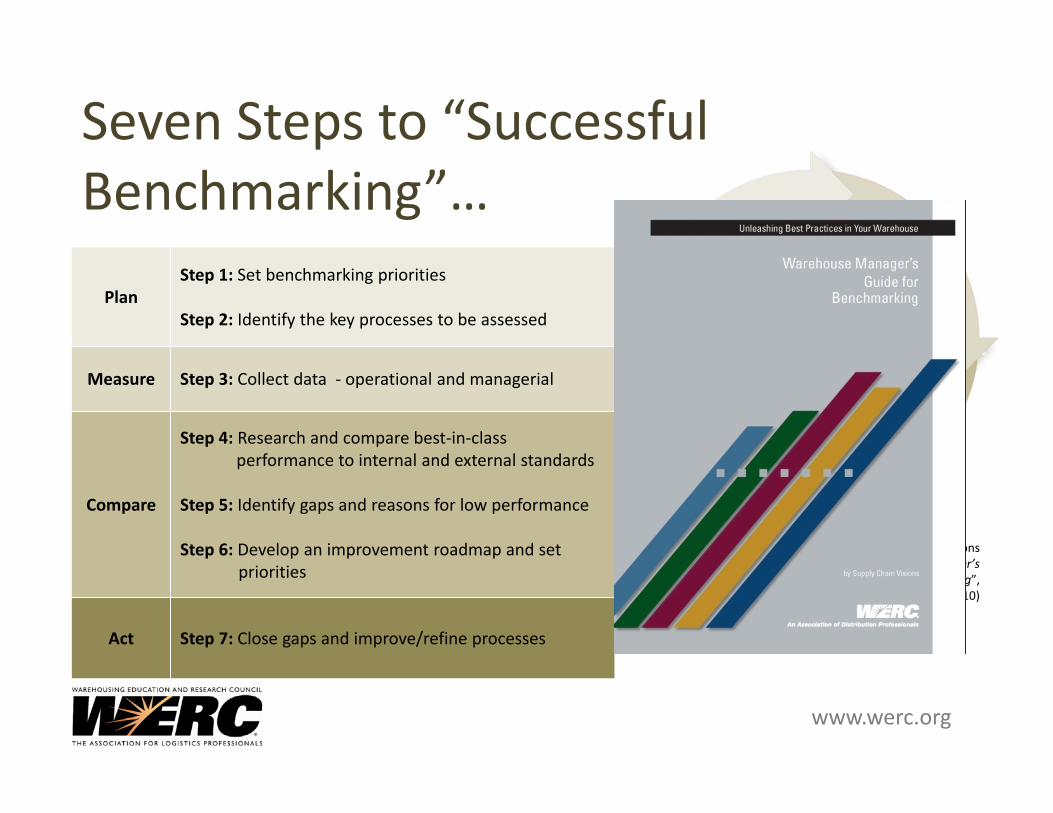
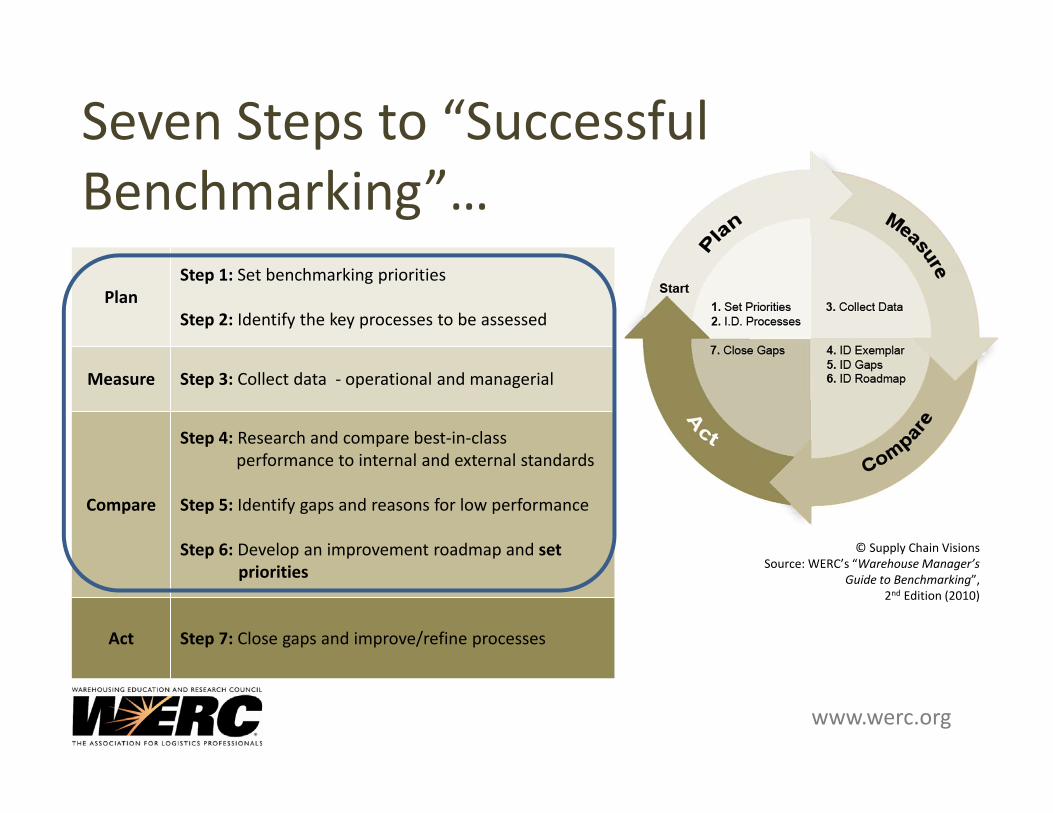
© Supply Chain VisionsSource: WERC’s “Warehouse Manager’s
Guide to Benchmarking”, 2nd Edition (2010)
PlanStep 1: Set benchmarking priorities
Step 2: Identify the key processes to be assessed
Measure Step 3: Collect data ‐ operational and managerial
Compare
Step 4: Research and compare best‐in‐class performance to internal and external standards
Step 5: Identify gaps and reasons for low performance
Step 6: Develop an improvement roadmap and set priorities
Act Step 7: Close gaps and improve/refine processes
Seven Steps to “Successful Benchmarking”…
www.werc.org
Plan – Step 1: Set Benchmarking Priorities
The best place to start is with a vision statement and values.
www.werc.org
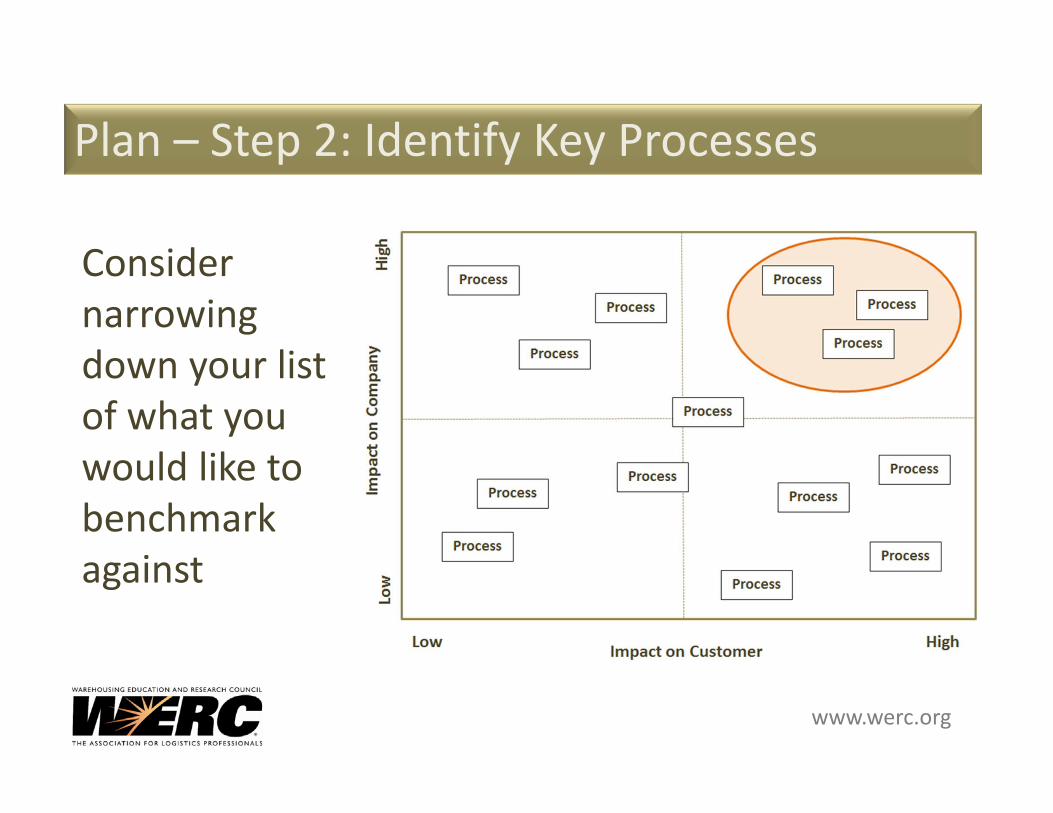
Consider narrowing down your list of what you would like to benchmark against
Plan – Step 2: Identify Key Processes
www.werc.org
Measure –Step 3: Collect Data – Operational & Managerial
• Yourself (other locations)• Customers• Formal benchmarking services• Industry Associations
www.werc.org
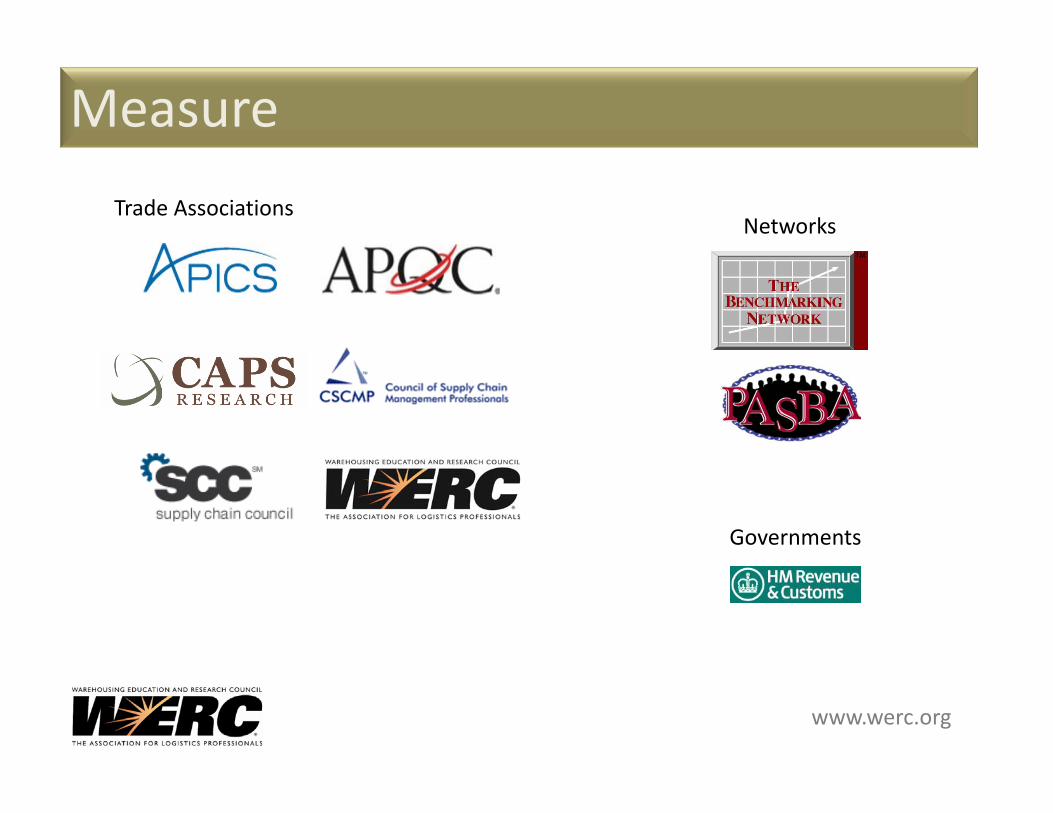
Trade AssociationsNetworks
Governments
Measure
www.werc.org
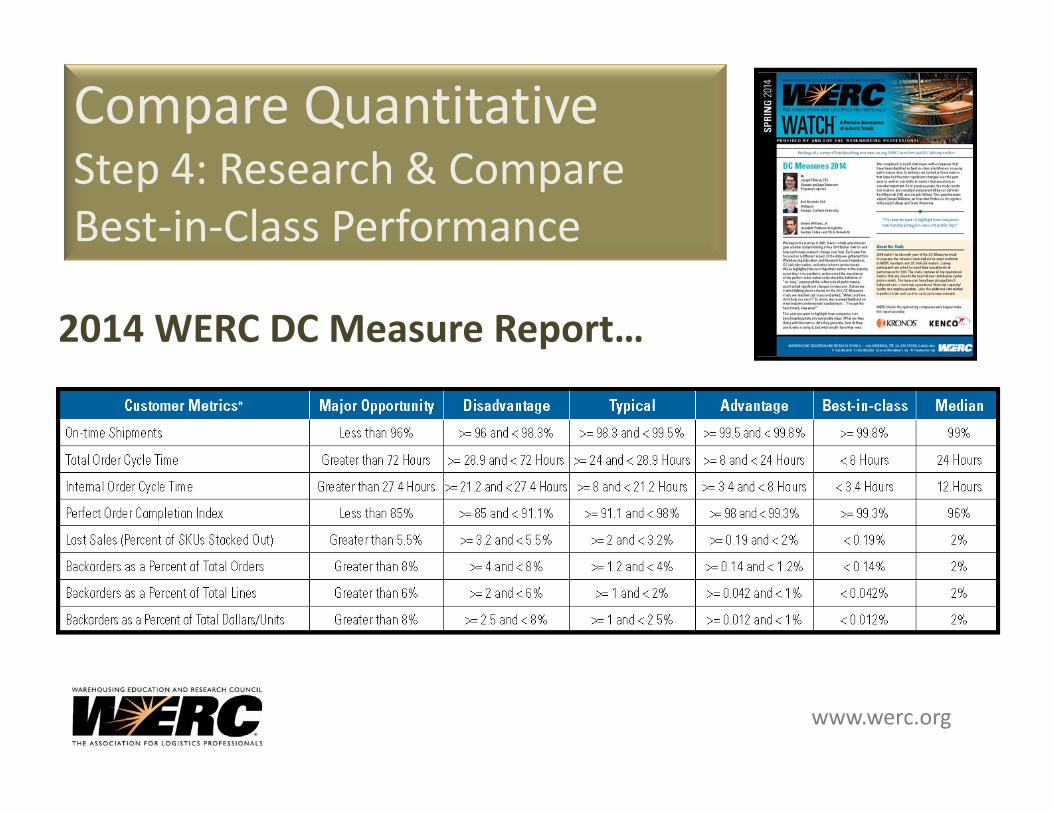
Compare QuantitativeStep 4: Research & Compare Best‐in‐Class Performance
2014 WERC DC Measure Report…
www.werc.org
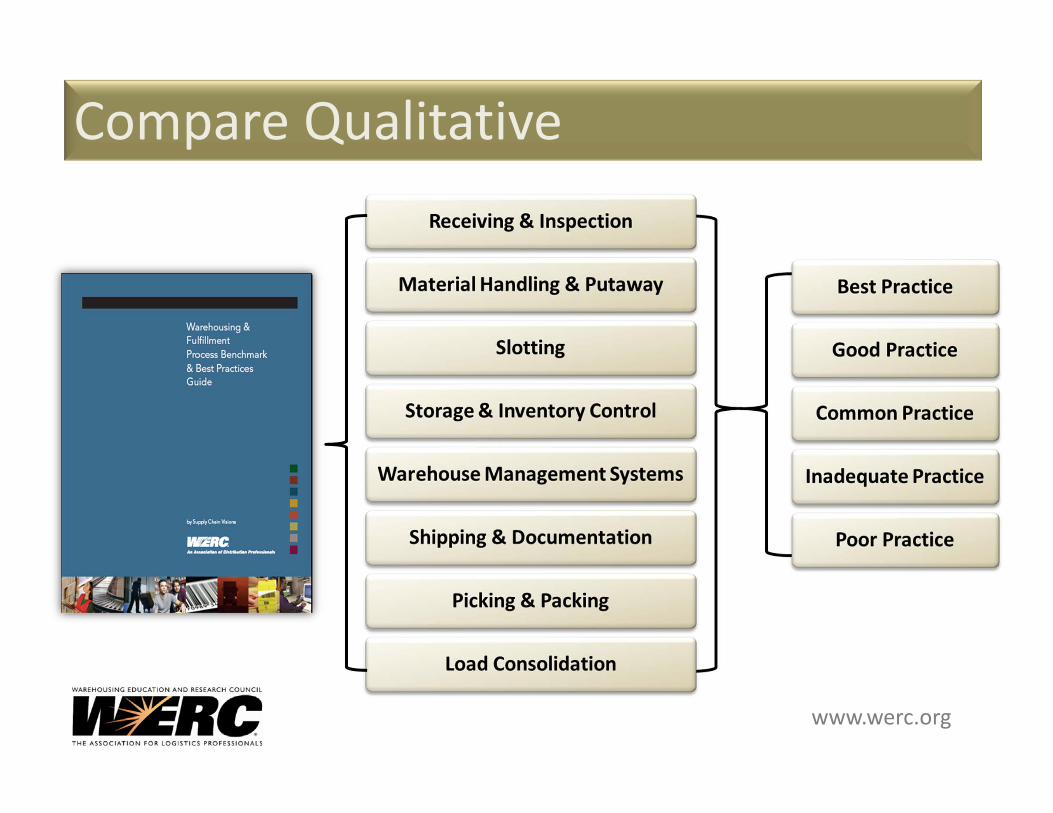
Compare Qualitative
www.werc.org
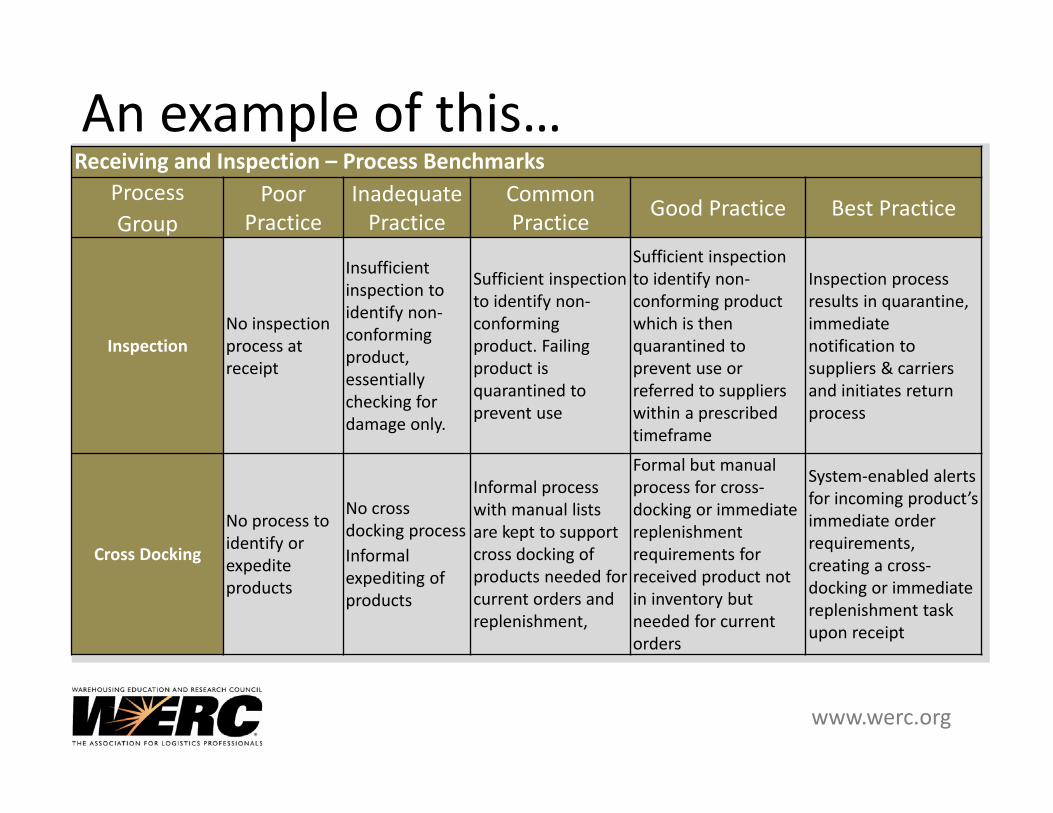
An example of this…Receiving and Inspection – Process Benchmarks
ProcessGroup
Poor Practice
Inadequate Practice
Common Practice Good Practice Best Practice
InspectionNo inspection process at receipt
Insufficient inspection to identify non‐conforming product, essentially checking for damage only.
Sufficient inspection to identify non‐conforming product. Failing product is quarantined to prevent use
Sufficient inspection to identify non‐conforming product which is then quarantined to prevent use or referred to suppliers within a prescribed timeframe
Inspection process results in quarantine, immediate notification to suppliers & carriers and initiates return process
Cross Docking
No process to identify or expedite products
No cross docking processInformal expediting of products
Informal process with manual lists are kept to support cross docking of products needed for current orders and replenishment,
Formal but manual process for cross‐docking or immediate replenishment requirements for received product not in inventory but needed for current orders
System‐enabled alerts for incoming product’s immediate order requirements, creating a cross‐docking or immediate replenishment task upon receipt
29
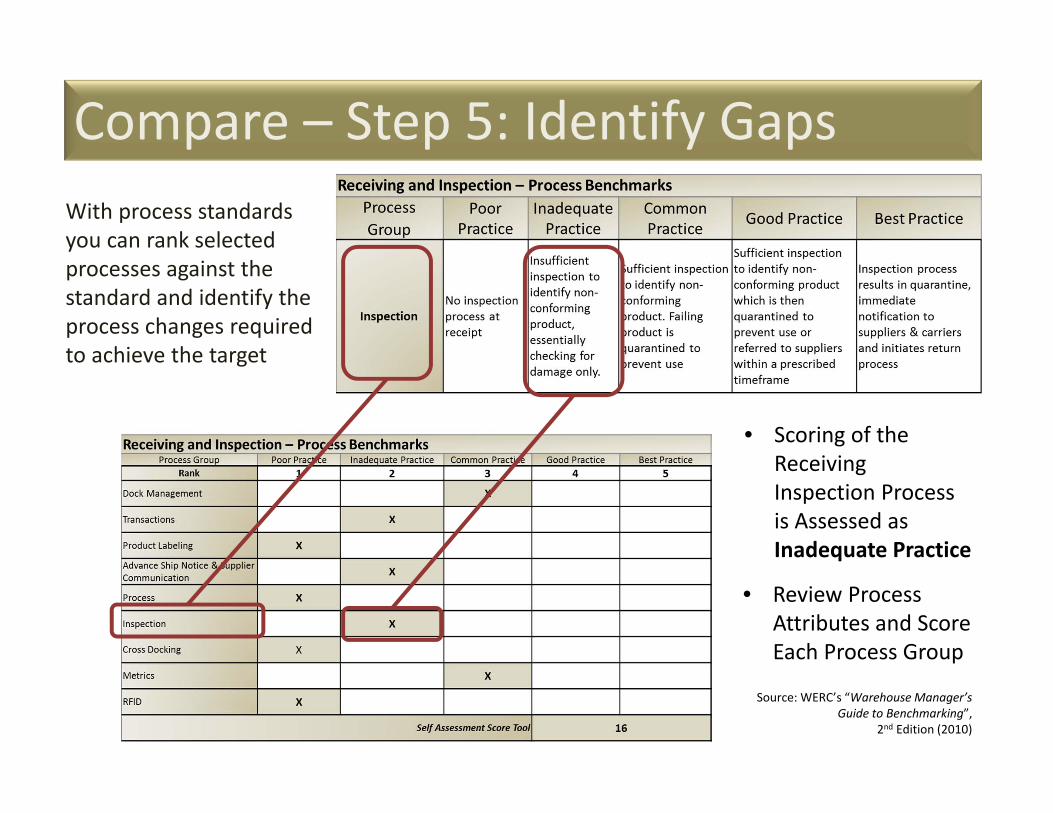
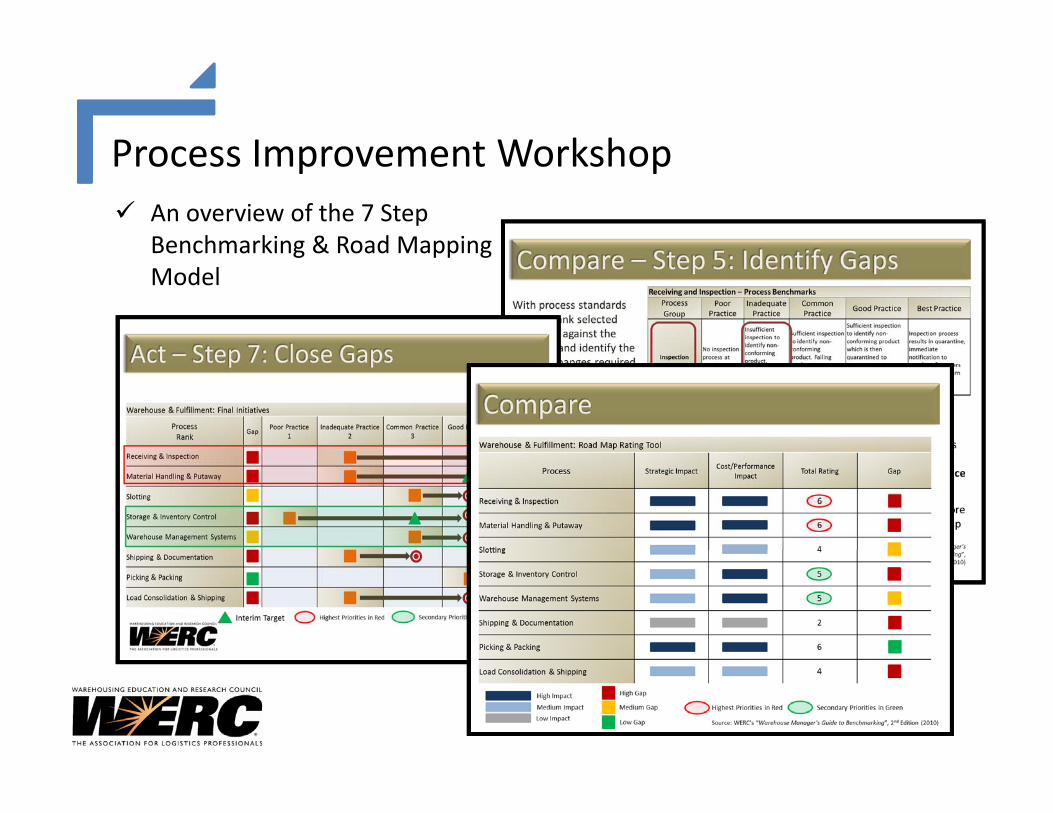
Compare – Step 5: Identify Gaps
• Review Process Attributes and Score Each Process Group
• Scoring of the Receiving Inspection Process is Assessed as Inadequate Practice
With process standards you can rank selected processes against the standard and identify the process changes required to achieve the target
Source: WERC’s “Warehouse Manager’s Guide to Benchmarking”,
2nd Edition (2010)
www.werc.org
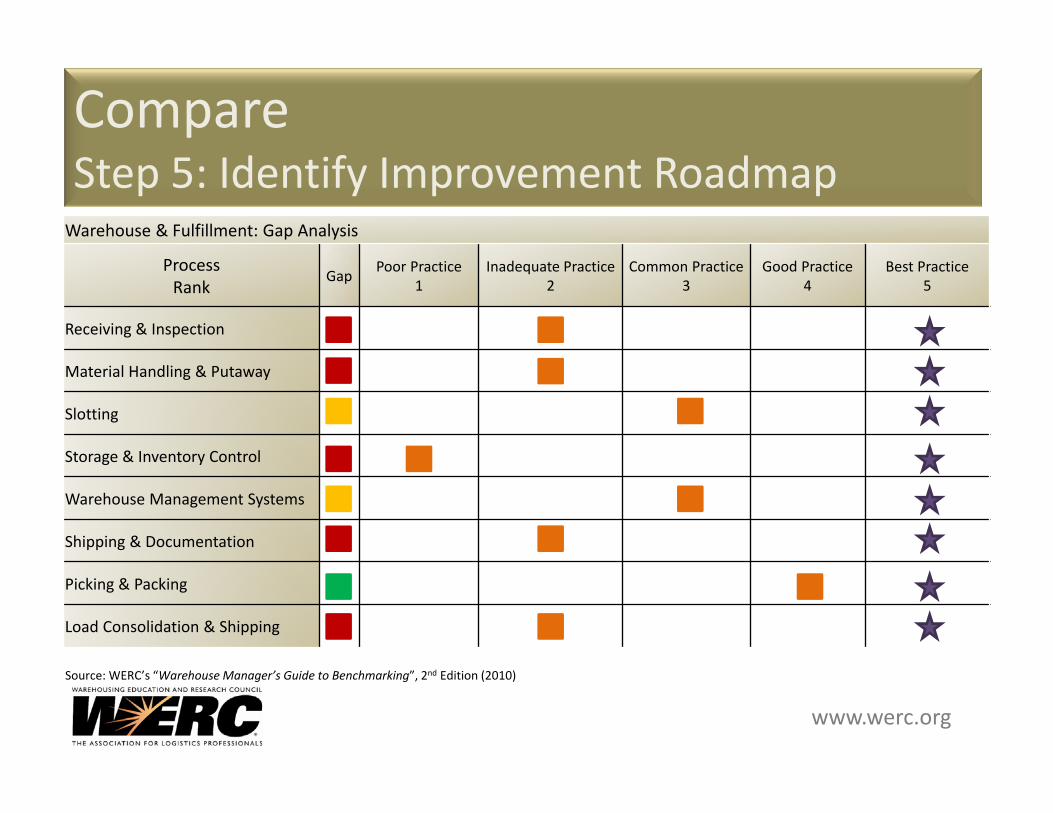
Compare Step 5: Identify Improvement RoadmapWarehouse & Fulfillment: Gap Analysis
ProcessRank
Gap Poor Practice1
Inadequate Practice2
Common Practice3
Good Practice4
Best Practice5
Receiving & Inspection
Material Handling & Putaway
Slotting
Storage & Inventory Control
Warehouse Management Systems
Shipping & Documentation
Picking & Packing
Load Consolidation & Shipping
Source: WERC’s “Warehouse Manager’s Guide to Benchmarking”, 2nd Edition (2010)
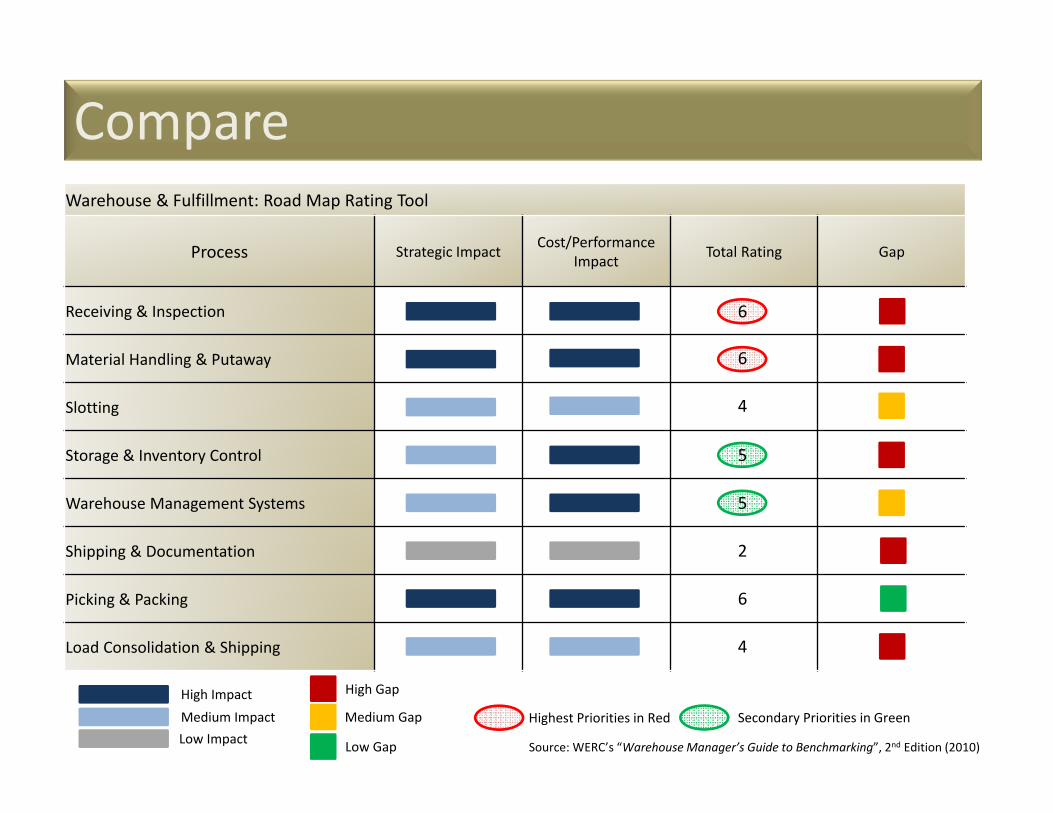
Warehouse & Fulfillment: Road Map Rating Tool
Process Strategic Impact Cost/Performance Impact Total Rating Gap
Receiving & Inspection
Material Handling & Putaway
Slotting
Storage & Inventory Control
Warehouse Management Systems
Shipping & Documentation
Picking & Packing
Load Consolidation & Shipping
Compare
High ImpactMedium Gap
Low Impact
High Gap
Low Gap
Highest Priorities in Red Secondary Priorities in GreenMedium Impact
6
6
4
5
5
2
6
4
Source: WERC’s “Warehouse Manager’s Guide to Benchmarking”, 2nd Edition (2010)
www.werc.org
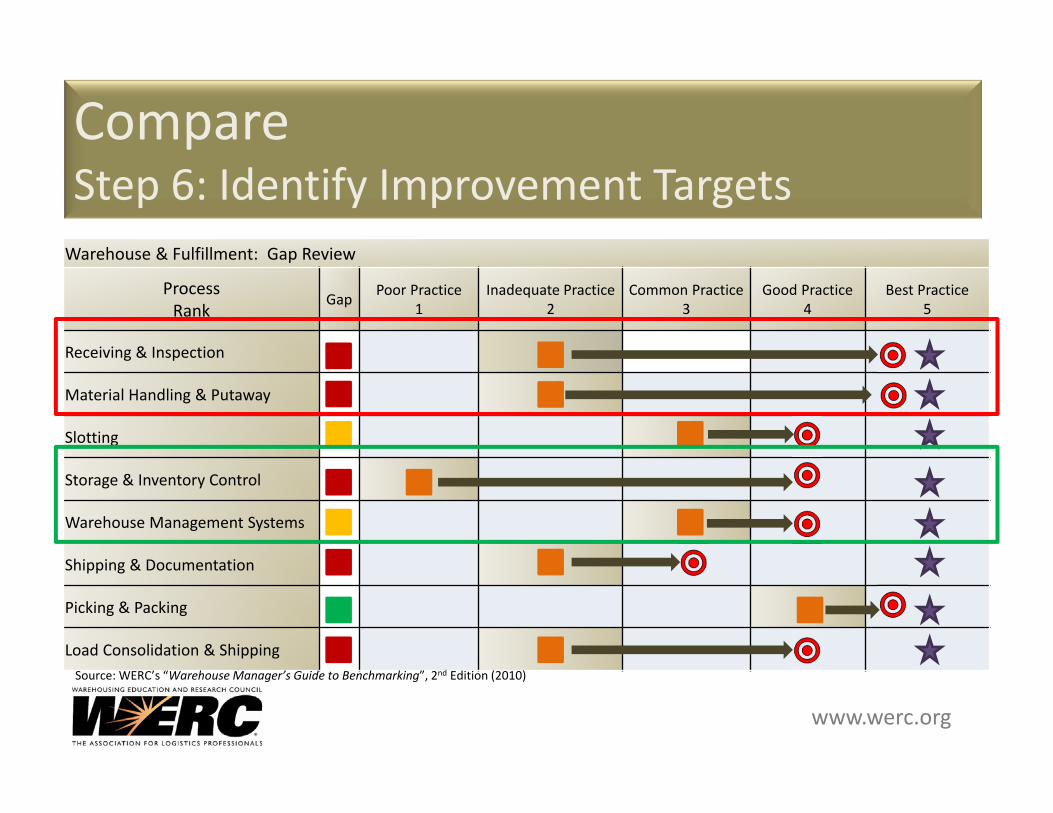
CompareStep 6: Identify Improvement TargetsWarehouse & Fulfillment: Gap Review
ProcessRank
Gap Poor Practice1
Inadequate Practice2
Common Practice3
Good Practice4
Best Practice5
Receiving & Inspection
Material Handling & Putaway
Slotting
Storage & Inventory Control
Warehouse Management Systems
Shipping & Documentation
Picking & Packing
Load Consolidation & ShippingSource: WERC’s “Warehouse Manager’s Guide to Benchmarking”, 2nd Edition (2010)
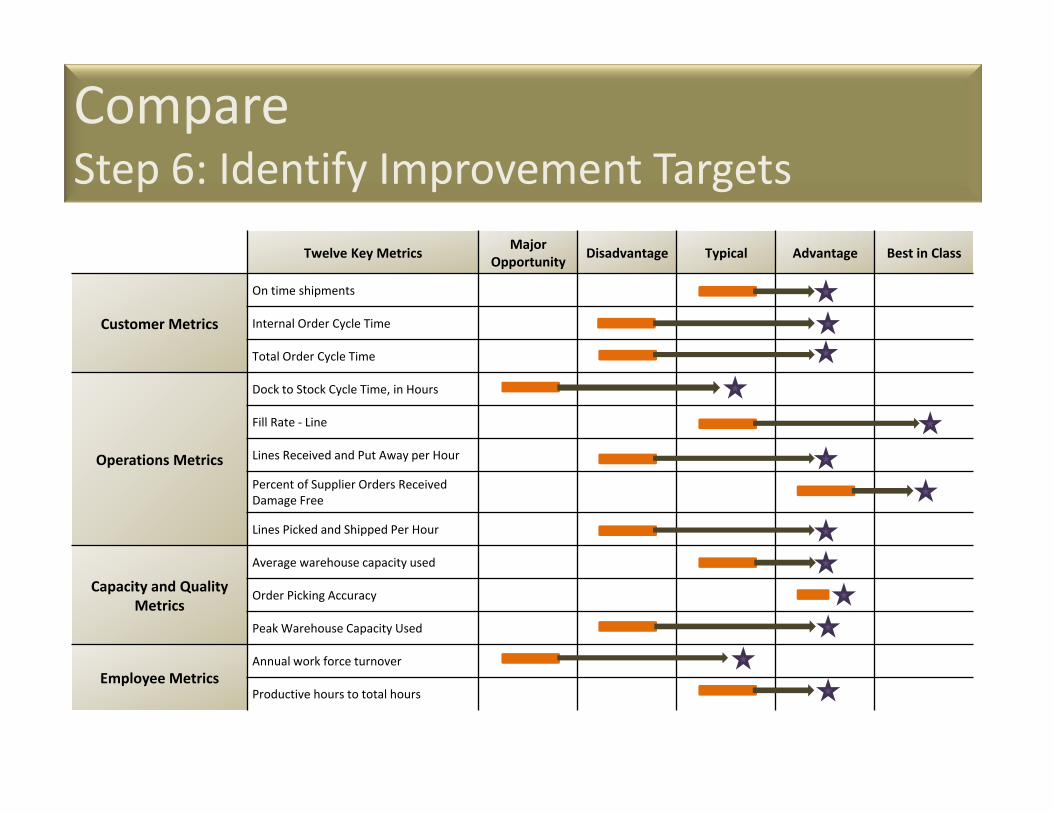
CompareStep 6: Identify Improvement Targets
Twelve Key Metrics Major Opportunity Disadvantage Typical Advantage Best in Class
Customer Metrics
On time shipments
Internal Order Cycle Time
Total Order Cycle Time
Operations Metrics
Dock to Stock Cycle Time, in Hours
Fill Rate ‐ Line
Lines Received and Put Away per Hour
Percent of Supplier Orders Received Damage Free
Lines Picked and Shipped Per Hour
Capacity and Quality Metrics
Average warehouse capacity used
Order Picking Accuracy
Peak Warehouse Capacity Used
Employee MetricsAnnual work force turnover
Productive hours to total hours
www.werc.org
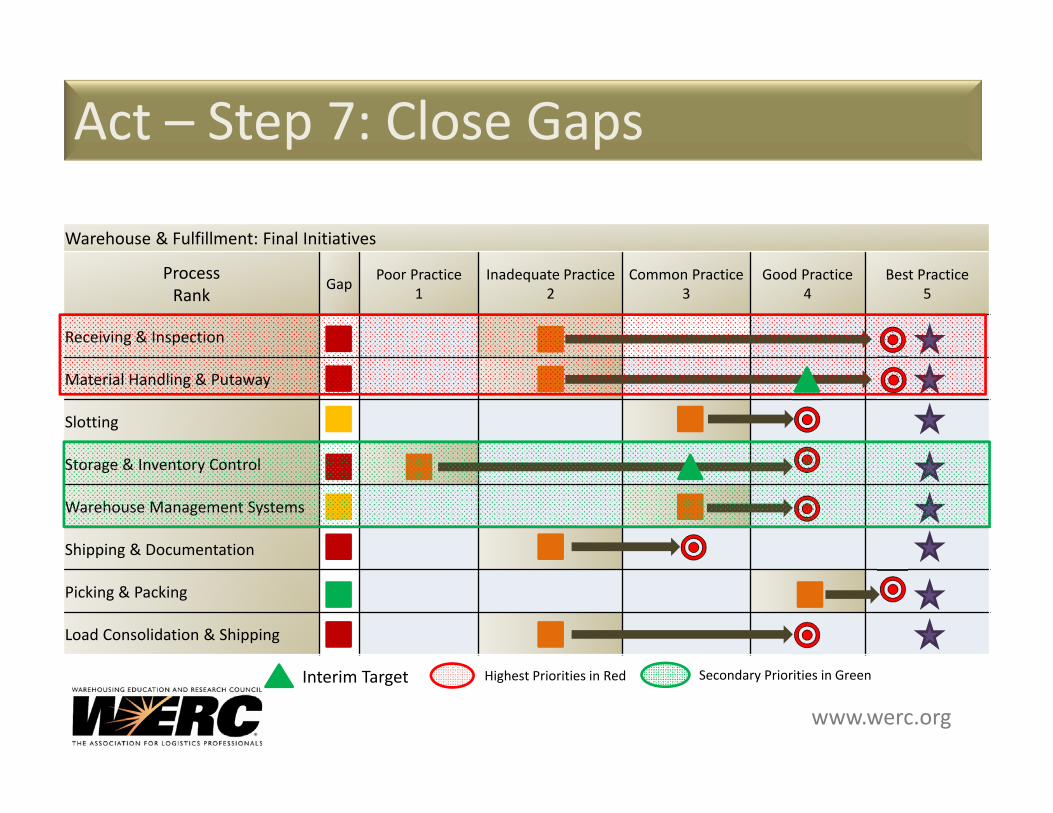
Act – Step 7: Close Gaps
Warehouse & Fulfillment: Final Initiatives
ProcessRank
Gap Poor Practice1
Inadequate Practice2
Common Practice3
Good Practice4
Best Practice5
Receiving & Inspection
Material Handling & Putaway
Slotting
Storage & Inventory Control
Warehouse Management Systems
Shipping & Documentation
Picking & Packing
Load Consolidation & Shipping
Interim Target Highest Priorities in Red Secondary Priorities in Green
www.werc.org
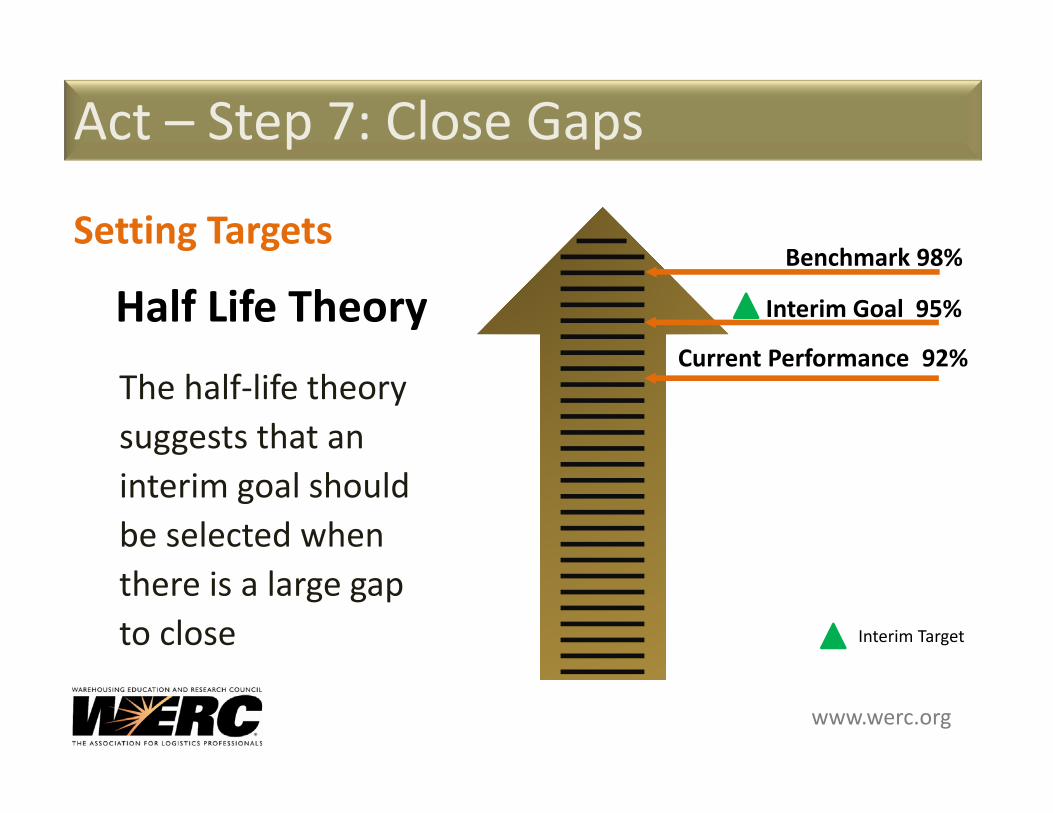
Setting Targets
The half‐life theory suggests that an interim goal should be selected when there is a large gap to close
Half Life Theory
Act – Step 7: Close Gaps
Benchmark 98%
Interim Goal 95%
Current Performance 92%
Interim Target
www.werc.org
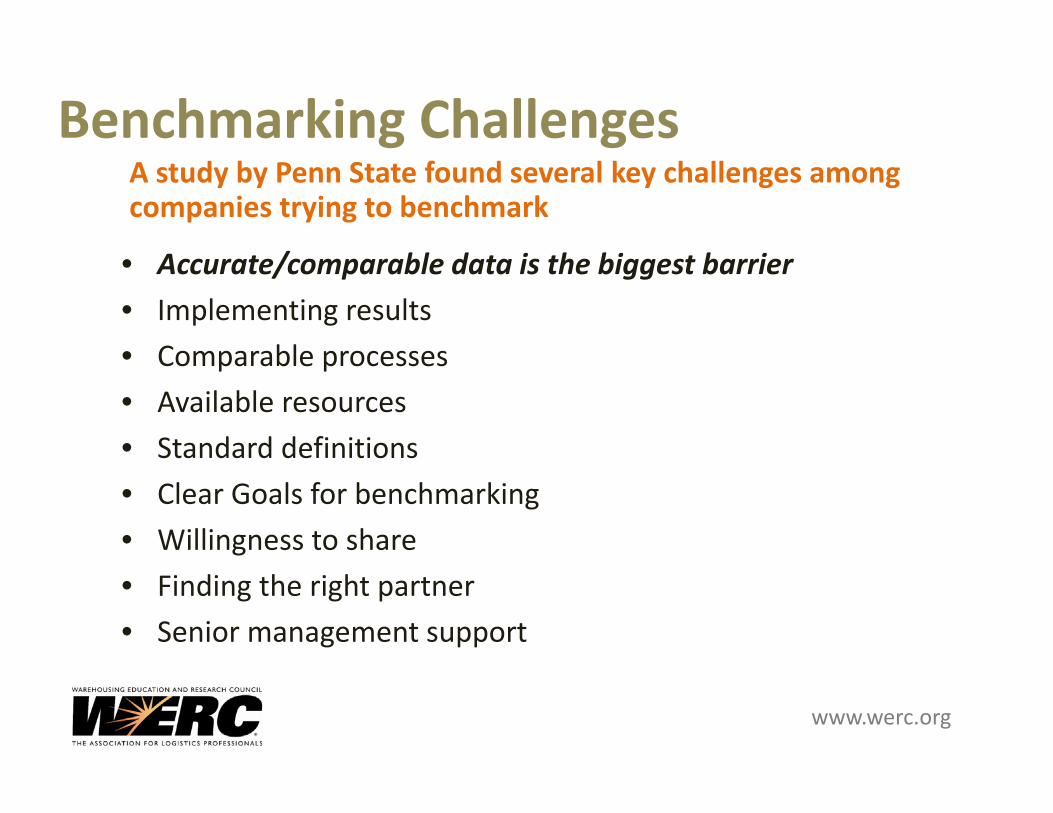
Benchmarking ChallengesA study by Penn State found several key challenges among companies trying to benchmark
• Accurate/comparable data is the biggest barrier• Implementing results• Comparable processes• Available resources• Standard definitions• Clear Goals for benchmarking• Willingness to share• Finding the right partner• Senior management support
www.werc.org
WERC’s Assessment & Certification Program
www.werc.org
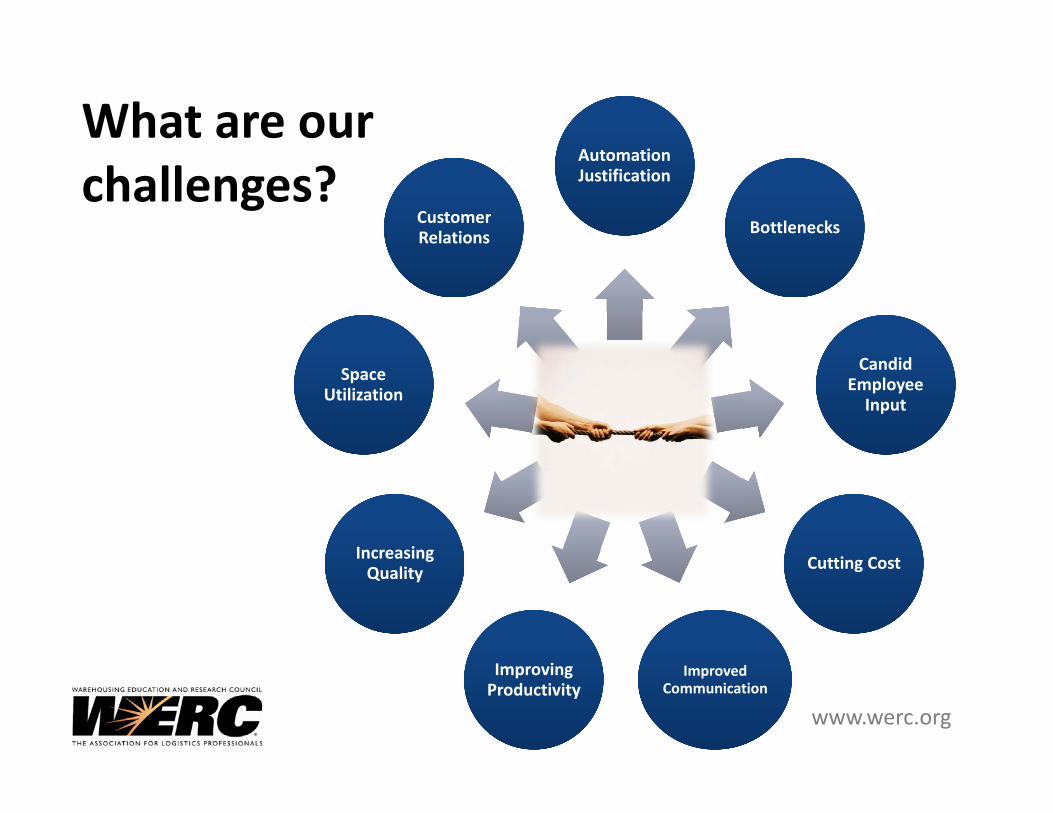
ChallengesChallenges
Automation JustificationAutomation Justification
BottlenecksBottlenecks
Candid Employee Input
Candid Employee Input
Cutting CostCutting Cost
Improved Communication
Improved Communication
Improving ProductivityImproving Productivity
Increasing Quality
Increasing Quality
Space UtilizationSpace
Utilization
Customer RelationsCustomer Relations
What are our challenges?
www.werc.org
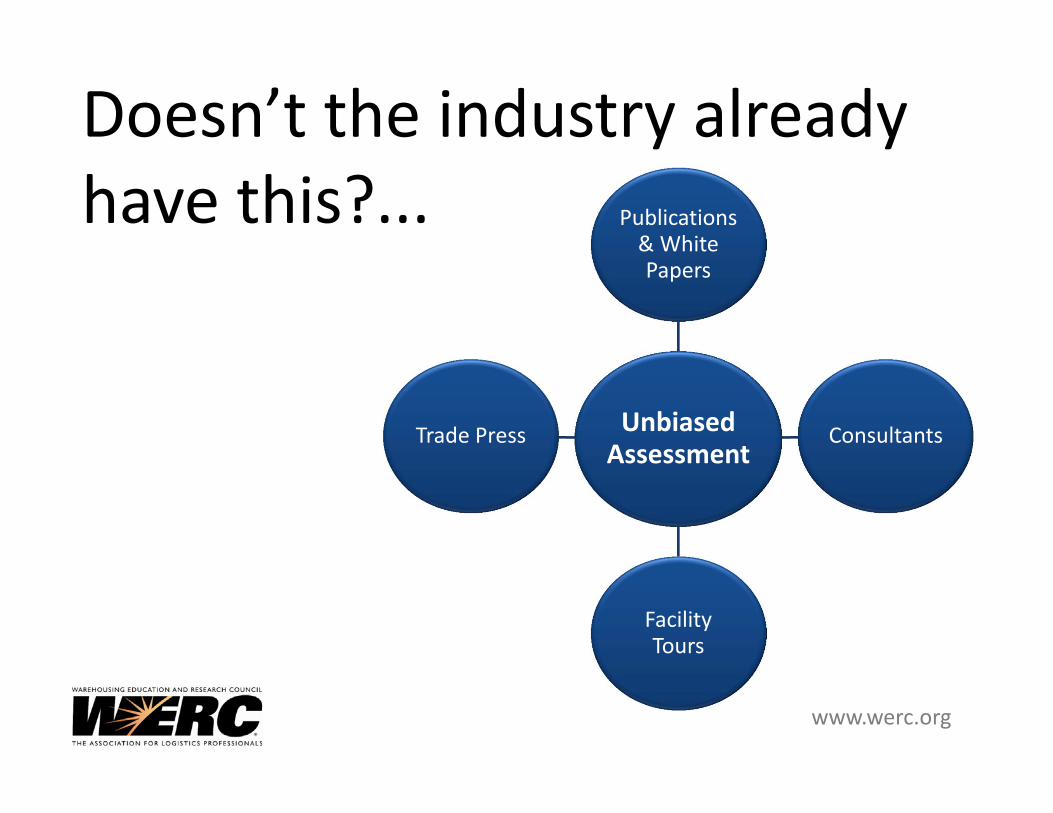
Doesn’t the industry already have this?... Publications
& White Papers
Consultants
Facility Tours
Trade Press Unbiased Assessment

www.werc.org
Compare Qualitative

www.werc.org
An example of this…Receiving and Inspection – Process Benchmarks
ProcessGroup
Poor Practice
Inadequate Practice
Common Practice Good Practice Best Practice
InspectionNo inspection process at receipt
Insufficient inspection to identify non‐conforming product, essentially checking for damage only.
Sufficient inspection to identify non‐conforming product. Failing product is quarantined to prevent use
Sufficient inspection to identify non‐conforming product which is then quarantined to prevent use or referred to suppliers within a prescribed timeframe
Inspection process results in quarantine, immediate notification to suppliers & carriers and initiates return process
Cross Docking
No process to identify or expedite products
No cross docking processInformal expediting of products
Informal process with manual lists are kept to support cross docking of products needed for current orders and replenishment,
Formal but manual process for cross‐docking or immediate replenishment requirements for received product not in inventory but needed for current orders
System‐enabled alerts for incoming product’s immediate order requirements, creating a cross‐docking or immediate replenishment task upon receipt

www.werc.org
© Supply Chain VisionsSource: WERC’s “Warehouse Manager’s
Guide to Benchmarking”, 2nd Edition (2010)
PlanStep 1: Set benchmarking priorities*
Step 2: Identify the key processes to be assessed*
Measure Step 3: Collect data ‐ operational and managerial*
Compare
Step 4: Research and compare best‐in‐class performance to internal and external standards*
Step 5: Identify gaps and reasons for low performance*
Step 6: Develop an improvement roadmap and set priorities*
Act Step 7: Close gaps and improve/refine processes
Seven Steps to “Successful Benchmarking”…

www.werc.org
Application
Pre‐Audit Survey
Onsite Audit
Delivery of Results
Process Improvement Workshop
Rate, Rank & Plan
Assessment & CertificationProcess…
Pre‐Audit
Day 1Day 2
www.werc.org
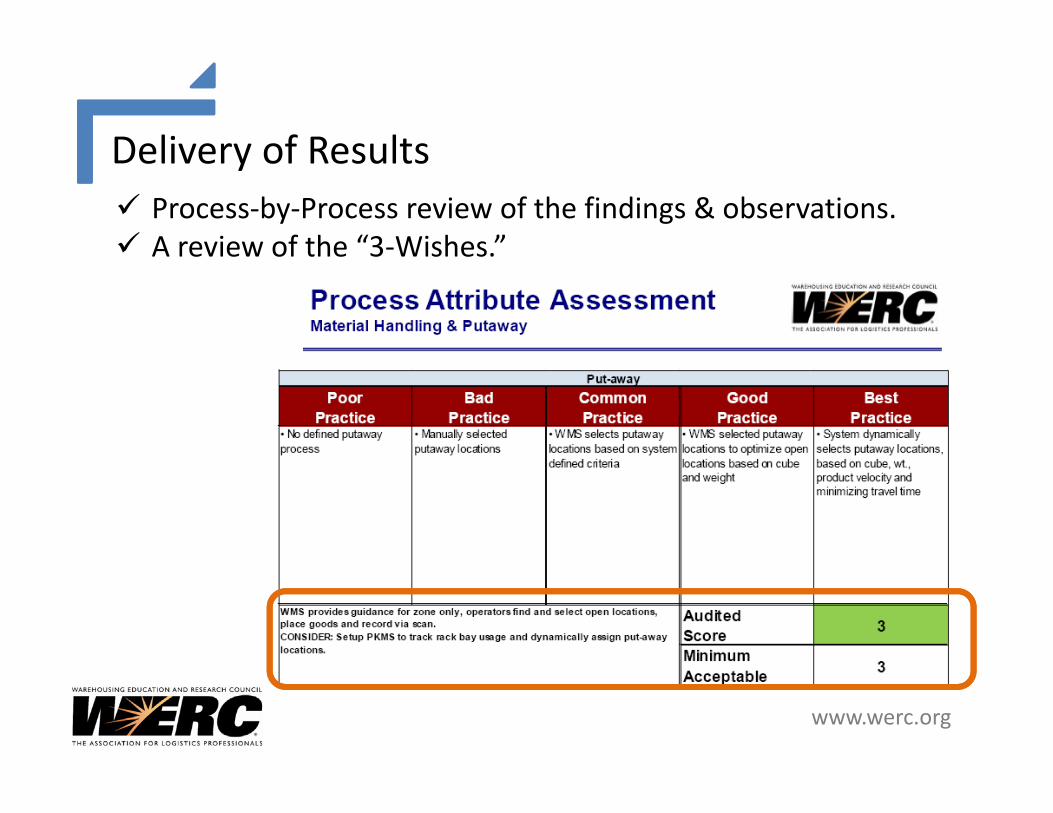
Delivery of Results Process‐by‐Process review of the findings & observations. A review of the “3‐Wishes.”
www.werc.org
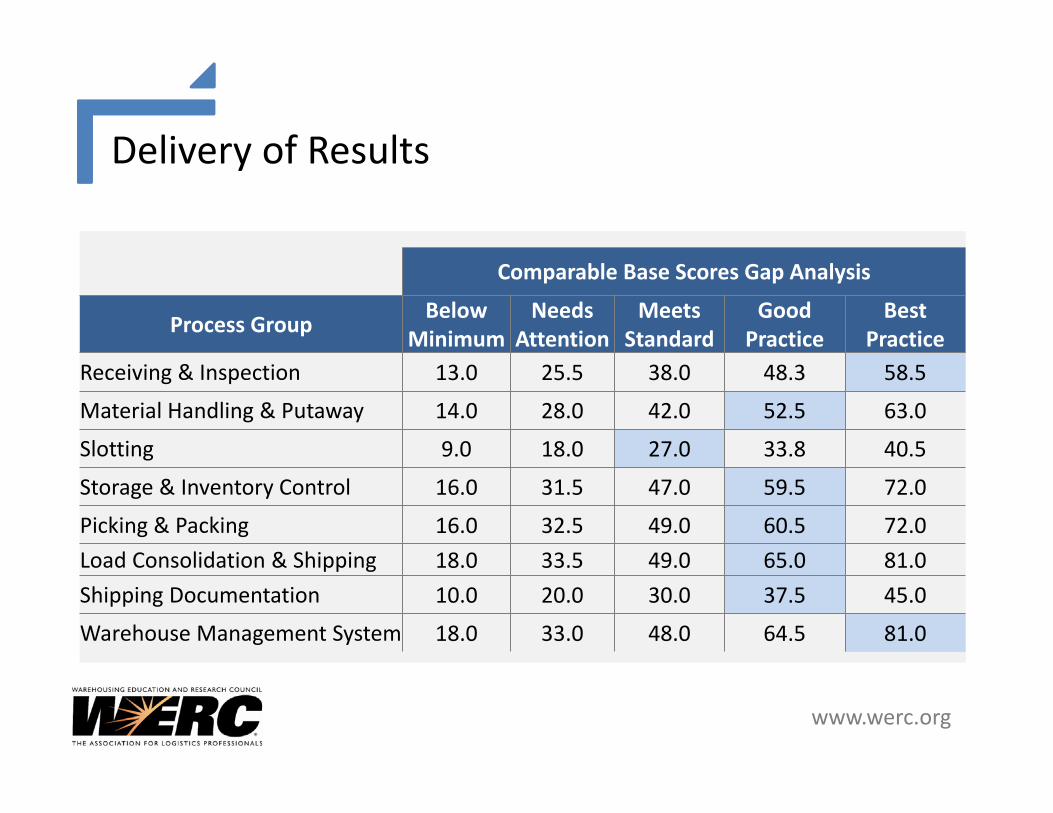
Comparable Base Scores Gap Analysis
Process Group Below Minimum
Needs Attention
Meets Standard
GoodPractice
Best Practice
Receiving & Inspection 13.0 25.5 38.0 48.3 58.5
Material Handling & Putaway 14.0 28.0 42.0 52.5 63.0
Slotting 9.0 18.0 27.0 33.8 40.5
Storage & Inventory Control 16.0 31.5 47.0 59.5 72.0
Picking & Packing 16.0 32.5 49.0 60.5 72.0Load Consolidation & Shipping 18.0 33.5 49.0 65.0 81.0Shipping Documentation 10.0 20.0 30.0 37.5 45.0
Warehouse Management System 18.0 33.0 48.0 64.5 81.0
Delivery of Results
www.werc.org
Process Improvement Workshop An overview of the 7 Step
Benchmarking & Road Mapping Model
www.werc.org
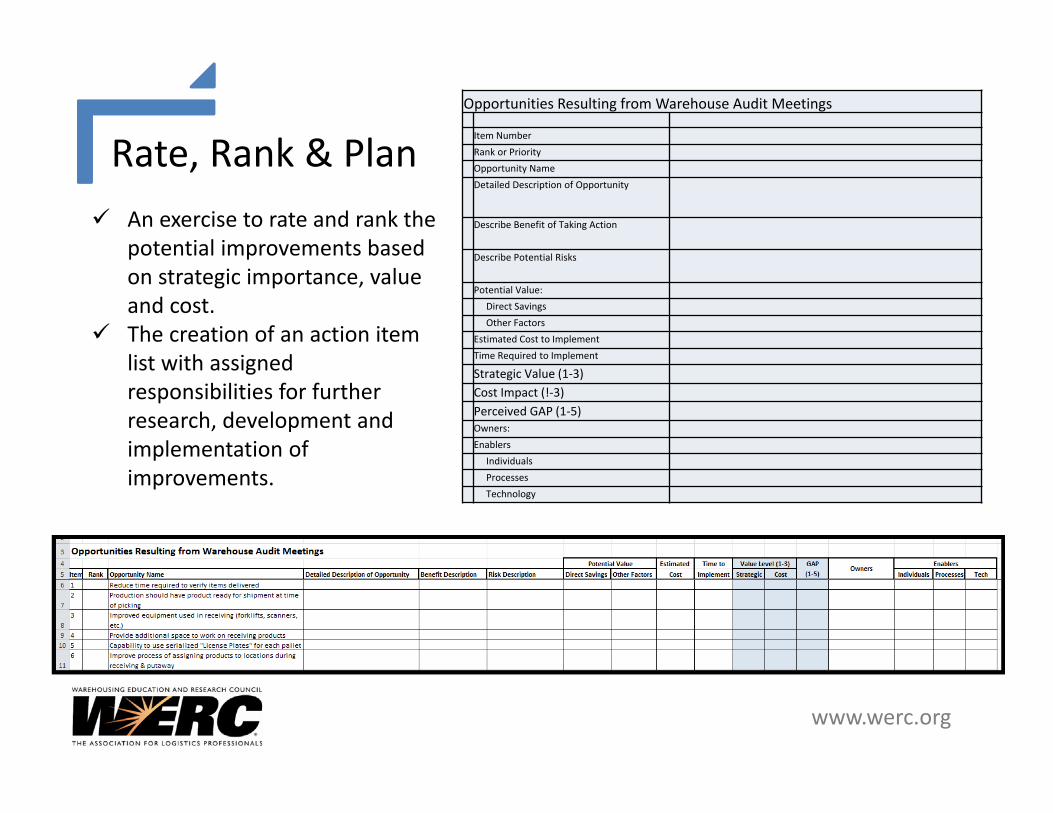
Rate, Rank & PlanOpportunities Resulting from Warehouse Audit Meetings
Item NumberRank or PriorityOpportunity NameDetailed Description of Opportunity
Describe Benefit of Taking Action
Describe Potential Risks
Potential Value:Direct SavingsOther Factors
Estimated Cost to ImplementTime Required to Implement
Strategic Value (1‐3)Cost Impact (!‐3)Perceived GAP (1‐5)Owners:Enablers
IndividualsProcessesTechnology
An exercise to rate and rank the potential improvements based on strategic importance, value and cost.
The creation of an action item list with assigned responsibilities for further research, development and implementation of improvements.
www.werc.org
© Supply Chain VisionsSource: WERC’s “Warehouse Manager’s
Guide to Benchmarking”, 2nd Edition (2010)
PlanStep 1: Set benchmarking priorities
Step 2: Identify the key processes to be assessed
Measure Step 3: Collect data ‐ operational and managerial
Compare
Step 4: Research and compare best‐in‐class performance to internal and external standards
Step 5: Identify gaps and reasons for low performance
Step 6: Develop an improvement roadmap and set priorities
Act Step 7: Close gaps and improve/refine processes
Seven Steps to “Successful Benchmarking”…
www.werc.org49
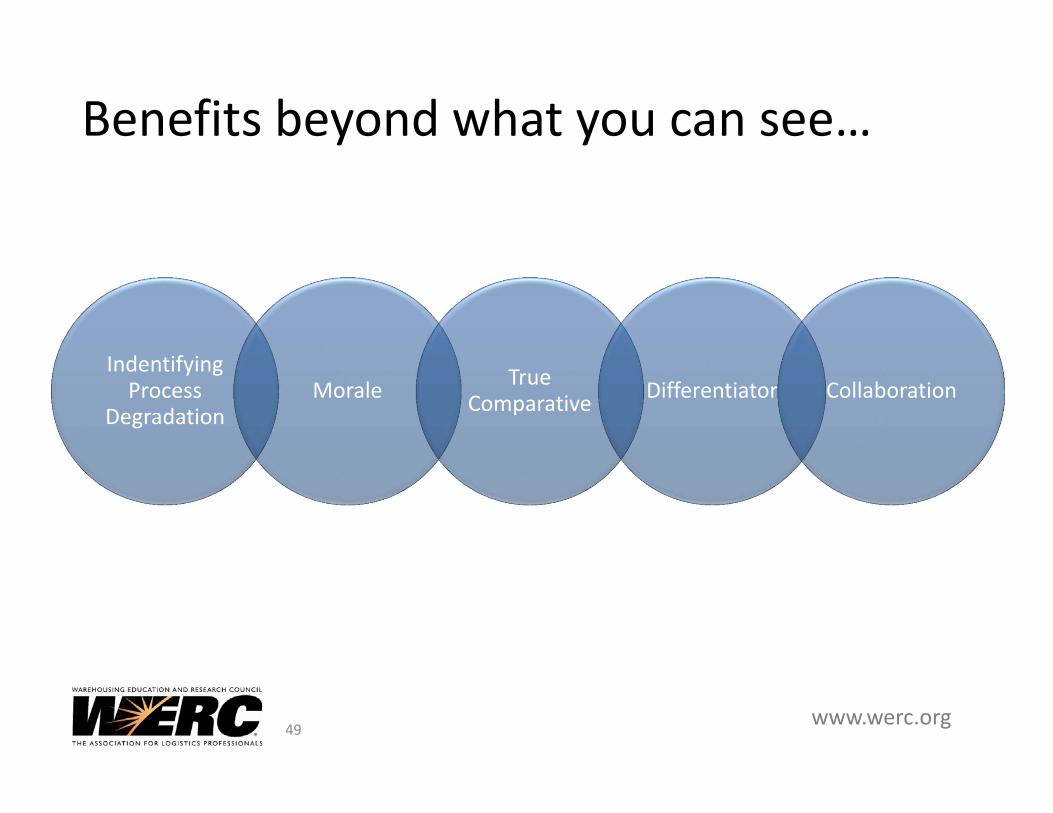
Benefits beyond what you can see…
Indentifying Process
DegradationMorale True
Comparative Differentiator Collaboration
www.werc.org
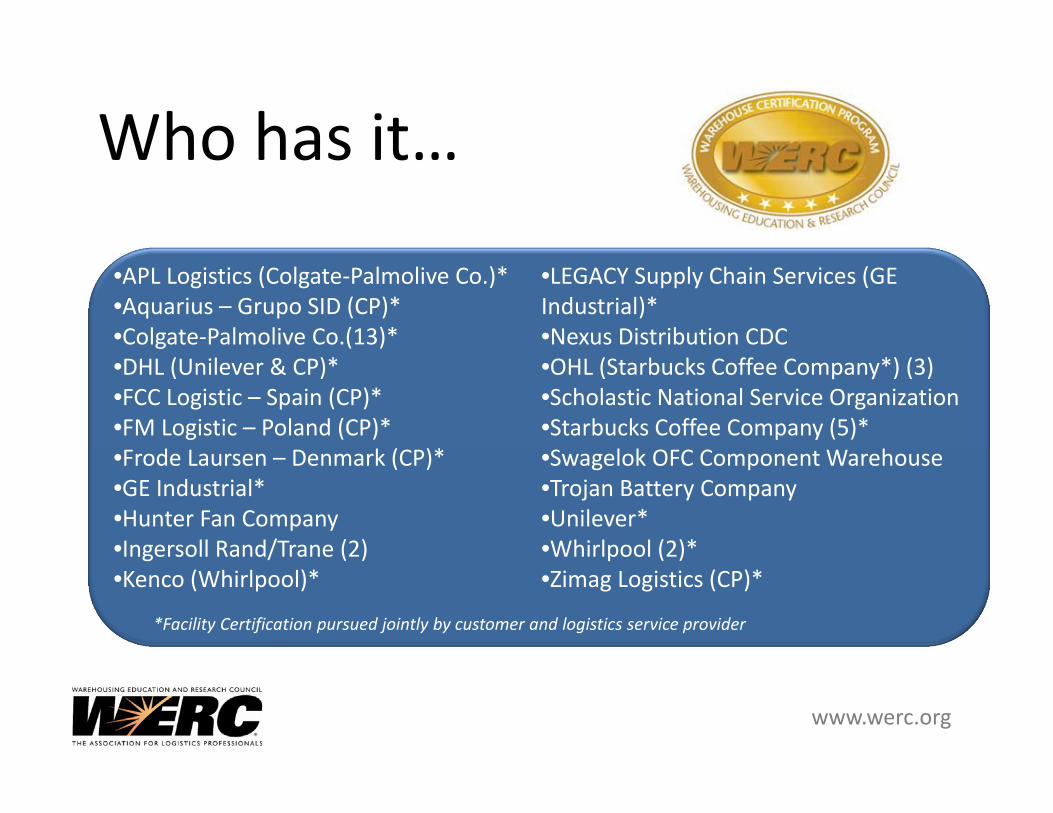
Who has it…
•APL Logistics (Colgate‐Palmolive Co.)*•Aquarius – Grupo SID (CP)*•Colgate‐Palmolive Co.(13)*•DHL (Unilever & CP)*•FCC Logistic – Spain (CP)*•FM Logistic – Poland (CP)*•Frode Laursen – Denmark (CP)*•GE Industrial*•Hunter Fan Company•Ingersoll Rand/Trane (2)•Kenco (Whirlpool)*
•LEGACY Supply Chain Services (GE Industrial)*•Nexus Distribution CDC•OHL (Starbucks Coffee Company*) (3)•Scholastic National Service Organization •Starbucks Coffee Company (5)*•Swagelok OFC Component Warehouse•Trojan Battery Company•Unilever*•Whirlpool (2)*•Zimag Logistics (CP)*
*Facility Certification pursued jointly by customer and logistics service provider
www.werc.org
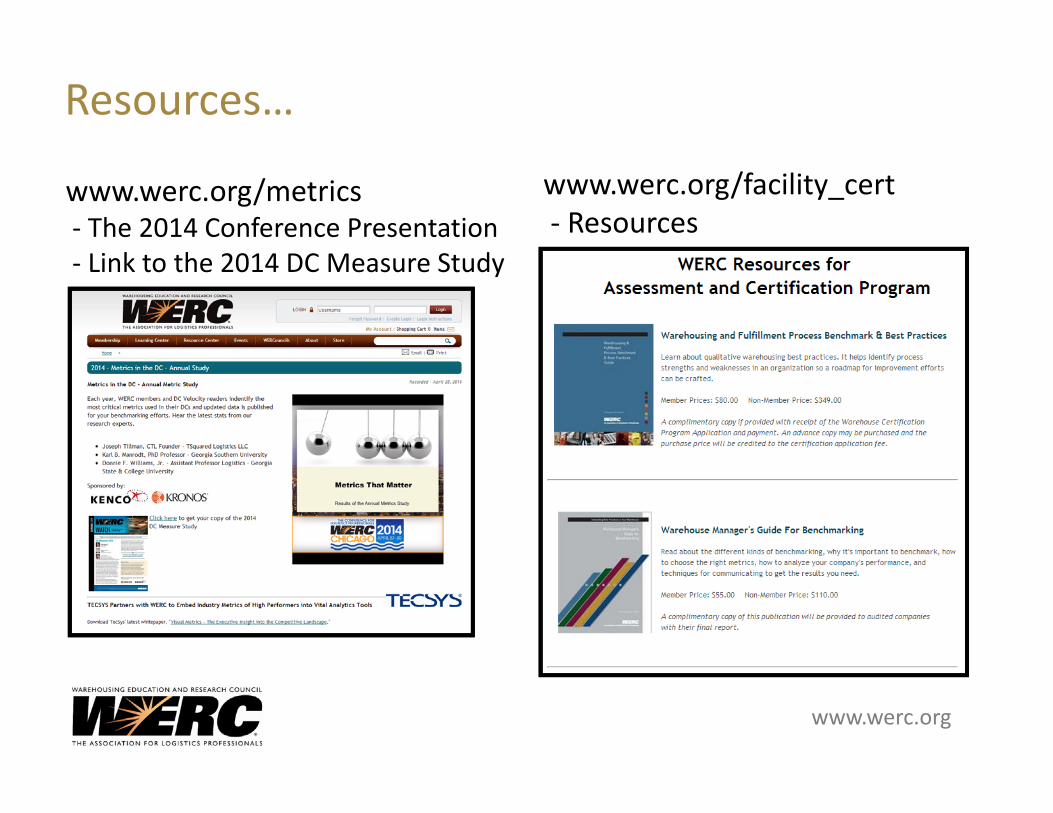
Resources…
www.werc.org/metrics‐ The 2014 Conference Presentation‐ Link to the 2014 DC Measure Study
www.werc.org/facility_cert‐ Resources
www.werc.org
Michael Mikitka, CEOWarehousing Education & Research Council
P: 630.990.0001 / [email protected]