metrics for management and vdc methods to predict...
TRANSCRIPT
Metrics
Center for Integrated Facility Engineering
Metrics for Management and VDC Methods to Predict and Manage them
John Kunz
CIFE, Stanford University

Metrics
Center for Integrated Facility Engineering
(c) 2012
2
Metrics Overview
Session Objectives
Metrics
[Lecture/
discussion;
Demo;
interactive
planning
session]
Understand and experience:
• types of metrics, including project outcome objectives,
process performance, and controllable factors
• how to track them
• methods to use them in management
• entering metrics into the POP and associated
modeling tools.

Metrics
Center for Integrated Facility Engineering
(c) 2012
3
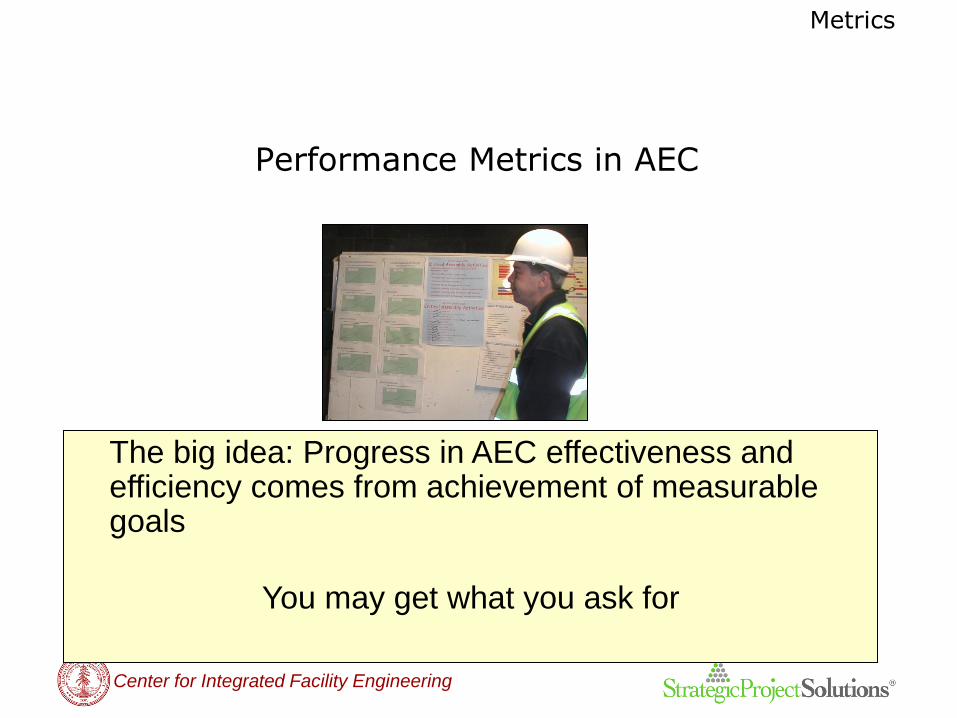
Performance Metrics in AEC
The big idea: Progress in AEC effectiveness and efficiency comes from achievement of measurable goals, which include controllable, process and outcome metrics.
You may get what you ask for

Metrics
Center for Integrated Facility Engineering
(c) 2012
4
Performance Metrics in AEC
"Be careful if you don't know where you're going in life, because you might not get there."
Yogi Berra, 2007, at St. Louis University

Metrics
Center for Integrated Facility Engineering
(c) 2012
5
Management by Objectives (MBO) requires metrics
• a process of agreeing on objectives within an
organization so that management and employees agree
to the objectives and understand what they are.
– The term "management by objectives" was first popularized by
Peter Drucker in his 1954 book The Practice of Management
– Source: Wikipedia

Metrics
Center for Integrated Facility Engineering
(c) 2012
6
Performance Metrics in AEC
Agenda
• Motivations for metrics
• VDC Objectives
• Methods
• Call to action
Metrics
Center for Integrated Facility Engineering 7
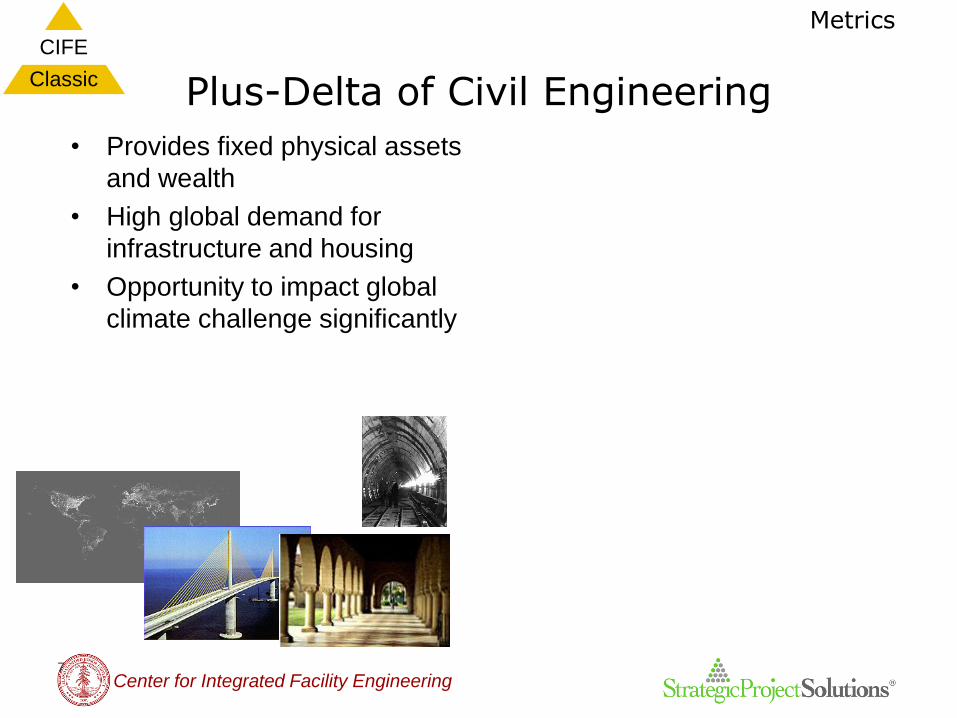
Plus-Delta of Civil Engineering
• Provides fixed physical assets
and wealth
• High global demand for
infrastructure and housing
• Opportunity to impact global
climate challenge significantly
CIFE
Classic

Metrics
Center for Integrated Facility Engineering 8
Plus-Delta of Civil Engineering
• Provides fixed physical assets
and wealth
• High global demand for
infrastructure and housing
• Opportunity to impact global
climate challenge significantly
• Low productivity
compete with other
ways to spend $
• High energy use and
rising energy costs
• Structural reliability <<
societal need (Chile)
Persson, Sustainable City of
Tomorrow: B01—Experiences of a
Swedish Housing exposition
Guilllermo Gomez, PUChile
CIFE
Classic
US Department of Commerce,
compiled by P. Teicholz

Metrics
Center for Integrated Facility Engineering
(c) 2012
9
Issue: How to respond to the issues of productivity, energy, structural reliability?
• Incremental improvement incremental change
– Decades of evidence
• Breakthrough improvement significant change
– Business objective: Significantly improve project
delivery performance for the client
– To achieve breakthrough: select & align Outcome,
Process and controllable performance metrics
Metrics
Center for Integrated Facility Engineering
(c) 2012
10
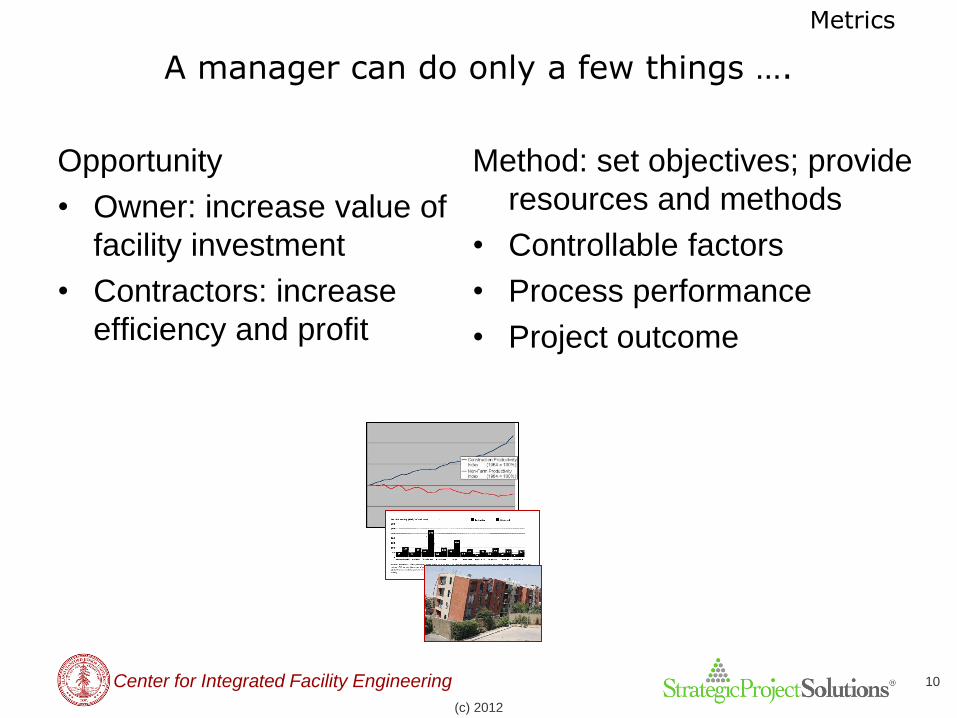
A manager can do only a few things ….
Opportunity
• Owner: increase value of
facility investment
• Contractors: increase
efficiency and profit
Method: set objectives; provide
resources and methods
• Controllable factors
• Process performance
• Project outcome

Metrics
Center for Integrated Facility Engineering
(c) 2012
11
Objectives: theoretical framework
• Control (Management): – What we want; what we can control
– e.g., P, O, P functions, scope, behaviors to measure and manage
Process – What we measure day by day, week by week
– Basis on which we manage and intervene
– e.g., Design, schedule & cost conformance
Outcome • What we report to client, senior management
• e.g., project safety, schedule, cost, quality
Metrics
Center for Integrated Facility Engineering
(c) 2012
12
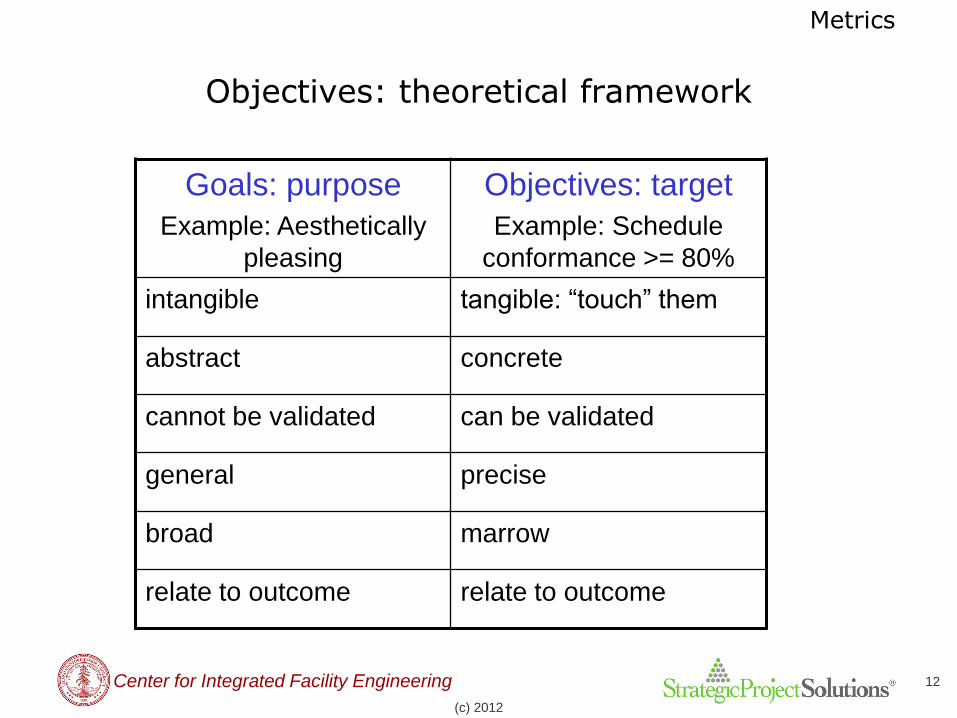
Objectives: theoretical framework
Goals: purpose
Example: Aesthetically
pleasing
Objectives: target
Example: Schedule
conformance >= 80%
intangible tangible: “touch” them
abstract concrete
cannot be validated can be validated
general precise
broad marrow
relate to outcome relate to outcome
Metrics
Center for Integrated Facility Engineering
(c) 2012
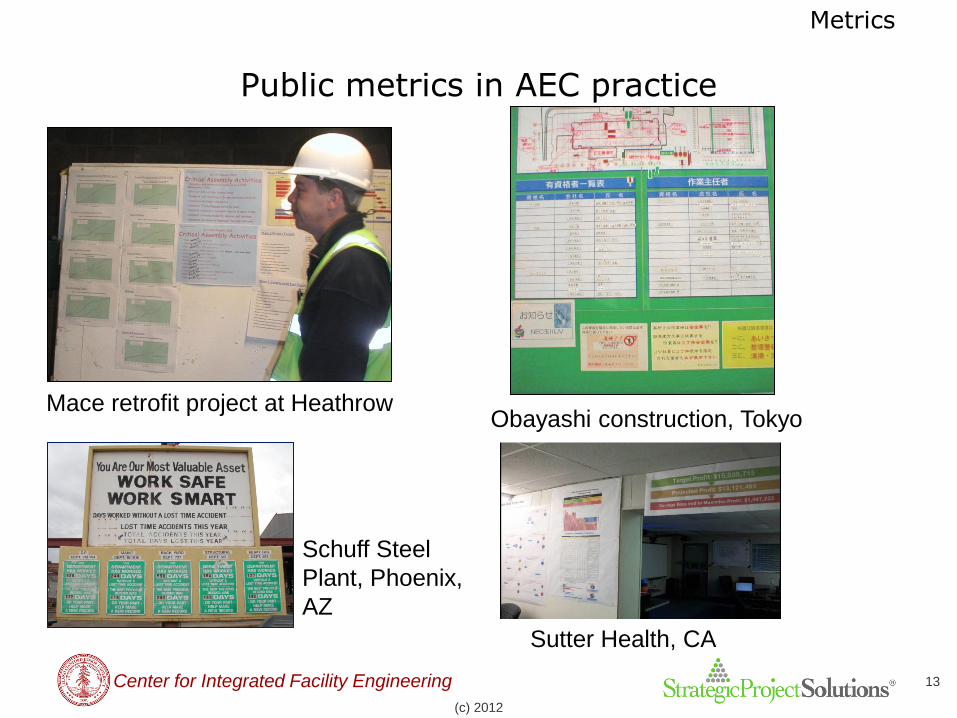
13
Public metrics in AEC practice
Mace retrofit project at Heathrow Obayashi construction, Tokyo
Schuff Steel
Plant, Phoenix,
AZ
Sutter Health, CA

Metrics
Center for Integrated Facility Engineering
(c) 2012
14
Virtual Design and Construction (VDC)
Use of multi-disciplinary performance models of design-construction projects, including
– Product (i.e., facilities)
– Organization of the design-construction-operation team
– Work Processes
– Economic Impact (i.e., model of both cost and value of capital investments)
to support (explicit, public) business objectives.
Metrics
Center for Integrated Facility Engineering
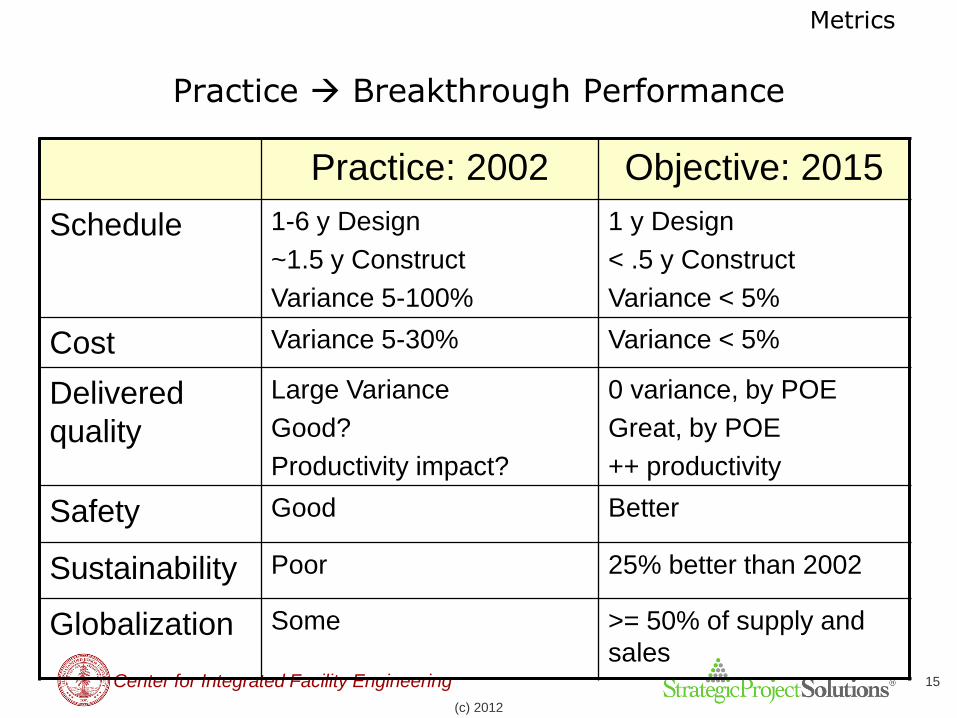
Practice Breakthrough Performance
(c) 2012
15
Practice: 2002 Objective: 2015
Schedule 1-6 y Design
~1.5 y Construct
Variance 5-100%
1 y Design
< .5 y Construct
Variance < 5%
Cost Variance 5-30% Variance < 5%
Delivered
quality
Large Variance
Good?
Productivity impact?
0 variance, by POE
Great, by POE
++ productivity
Safety Good Better
Sustainability Poor 25% better than 2002
Globalization Some >= 50% of supply and
sales

Metrics
Center for Integrated Facility Engineering
(c) 2012
16
Design-Construction Practice Controllable Objectives
for CIFE Member Companies
2002
Operate with a strategic plan
to implement VDC
incrementally
Use (Visualization) stage of
VDC confidently
• Staff each project with four
VDC trained engineers
2011
• Operate with a strategic plan for
VDC; manage by public and
explicit M-B process metrics
• Use (Integration) (>= 5 business
purposes on >=10 major
projects/year)
• Pilot (Automation); automate
>30% of routine design and
construction activity (> 2 pilot
projects/year); and
• Staff each project with four VDC
trained engineers
Metrics
Center for Integrated Facility Engineering
(c) 2012
17
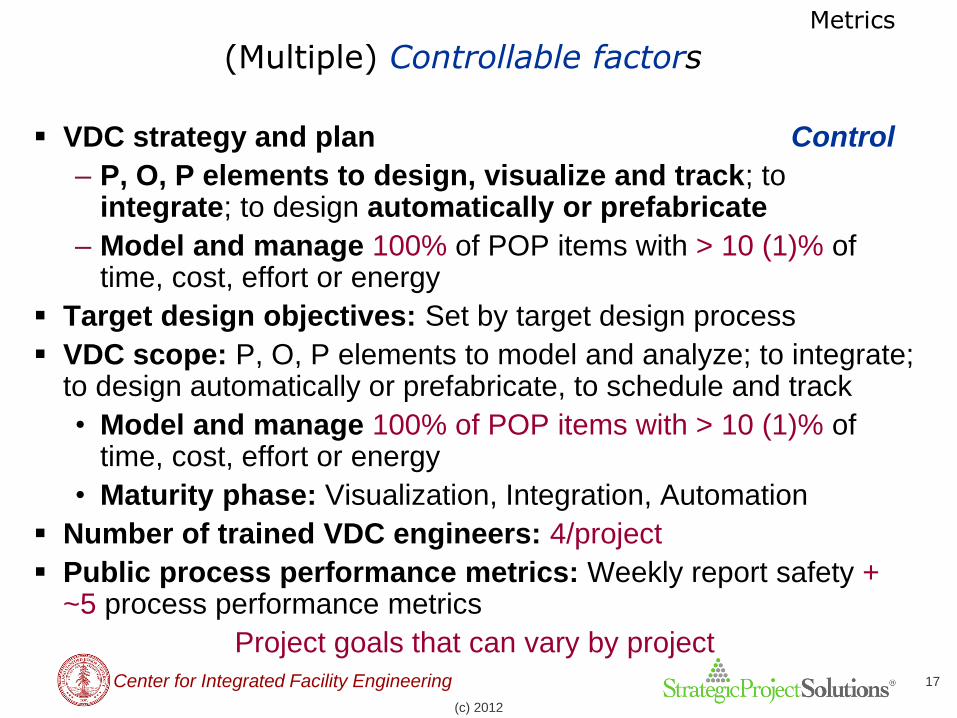
(Multiple) Controllable factors
VDC strategy and plan Control
– P, O, P elements to design, visualize and track; to integrate; to design automatically or prefabricate
– Model and manage 100% of POP items with > 10 (1)% of time, cost, effort or energy
Target design objectives: Set by target design process
VDC scope: P, O, P elements to model and analyze; to integrate; to design automatically or prefabricate, to schedule and track
• Model and manage 100% of POP items with > 10 (1)% of time, cost, effort or energy
• Maturity phase: Visualization, Integration, Automation
Number of trained VDC engineers: 4/project
Public process performance metrics: Weekly report safety + ~5 process performance metrics
Project goals that can vary by project

Metrics
Center for Integrated Facility Engineering
(c) 2012
18
(Multiple) Controllable objectives
Stakeholder engagement: public and explicit definition of who, when, for what purpose
Coordination activities (requests + responses)
• 90% of all coordination activity planned (weekly), explicit, planned and publicly reported
90% of all planned coordination activity is reported (weekly) by intended recipients to have been timely and suitable
Prediction basis: > 80% of all predictions by founded, automated methods
Design versions: 2 or more >= 80% of all decisions that affect more than 10% (2%) of cost, effort or schedule
Globalization strategy and plan: >= 50% of components and services from global suppliers
Lifecycle cost factors considered: money; natural resources consumed; emissions
Metrics
Center for Integrated Facility Engineering
(c) 2012
19
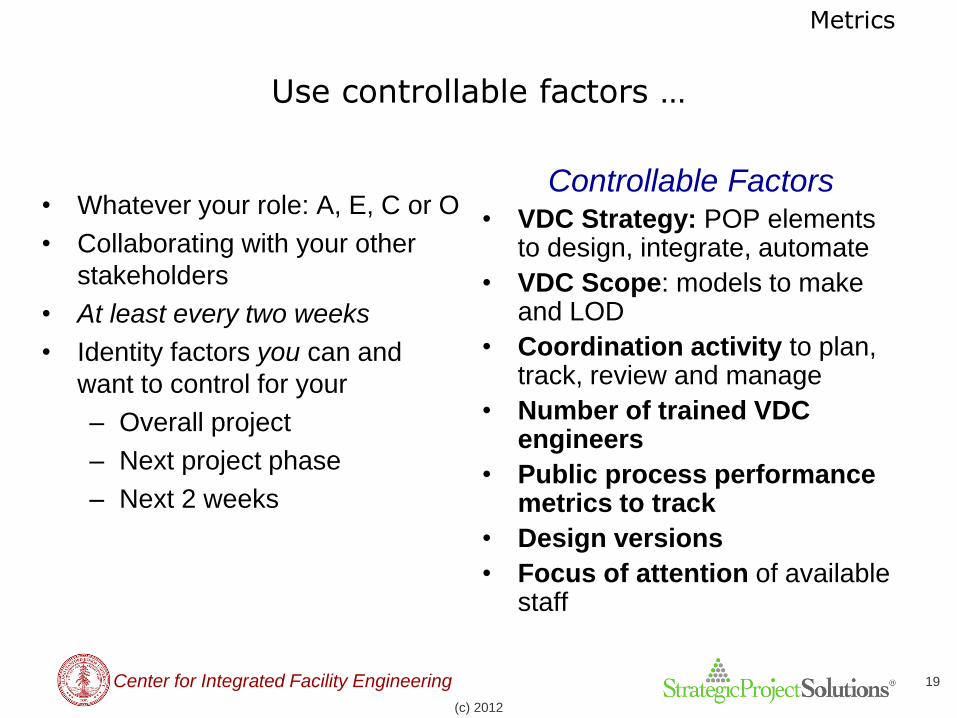
Use controllable factors …
• Whatever your role: A, E, C or O
• Collaborating with your other
stakeholders
• At least every two weeks
• Identity factors you can and
want to control for your
– Overall project
– Next project phase
– Next 2 weeks
Controllable Factors • VDC Strategy: POP elements
to design, integrate, automate
• VDC Scope: models to make and LOD
• Coordination activity to plan, track, review and manage
• Number of trained VDC engineers
• Public process performance metrics to track
• Design versions
• Focus of attention of available staff
Metrics
Center for Integrated Facility Engineering
(c) 2012
20
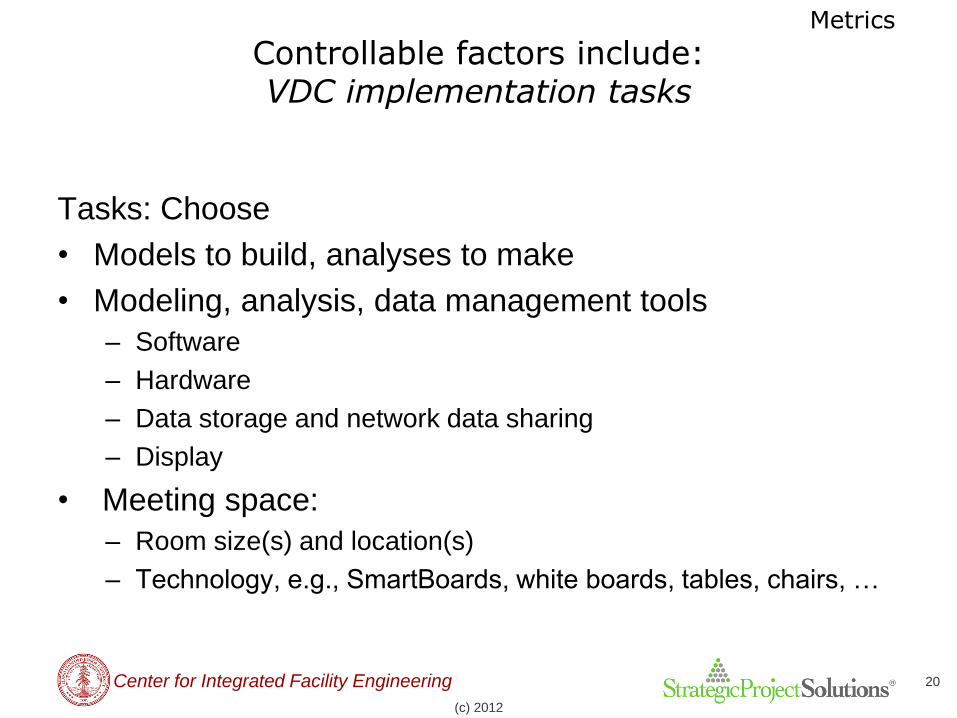
Controllable factors include: VDC implementation tasks
Tasks: Choose
• Models to build, analyses to make
• Modeling, analysis, data management tools
– Software
– Hardware
– Data storage and network data sharing
– Display
• Meeting space:
– Room size(s) and location(s)
– Technology, e.g., SmartBoards, white boards, tables, chairs, …

Metrics
Center for Integrated Facility Engineering
(c) 2012
21
Controllable factors include: Operating agreements for VDC meetings
• intended meeting participation
• expected preparation of participants
• duration
• frequency
• agenda management strategy
• review process to check quality, cost and schedule conformance
• expected use of models, analyses, metrics

Metrics
Center for Integrated Facility Engineering
(c) 2012
22
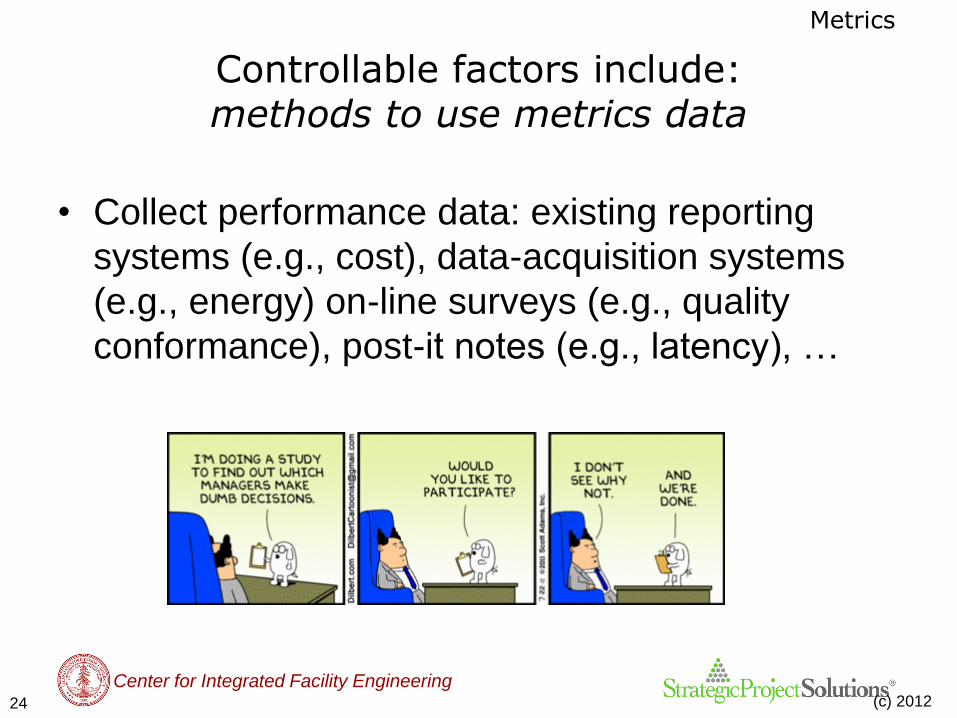
Controllable factors include: methods to use metrics data
• Collect performance data: existing reporting systems
(e.g., cost), data-acquisition systems (e.g., energy) on-
line surveys (e.g., quality conformance), post-it notes
(e.g., latency), …
• Display: bar charts; spider diagrams; time plots
– Include measured data, objective (range), traffic light status
• Report: on the wall; meetings; web …
• Interpret: responsible party, selected groups
Metrics
Center for Integrated Facility Engineering
(c) 2012
23
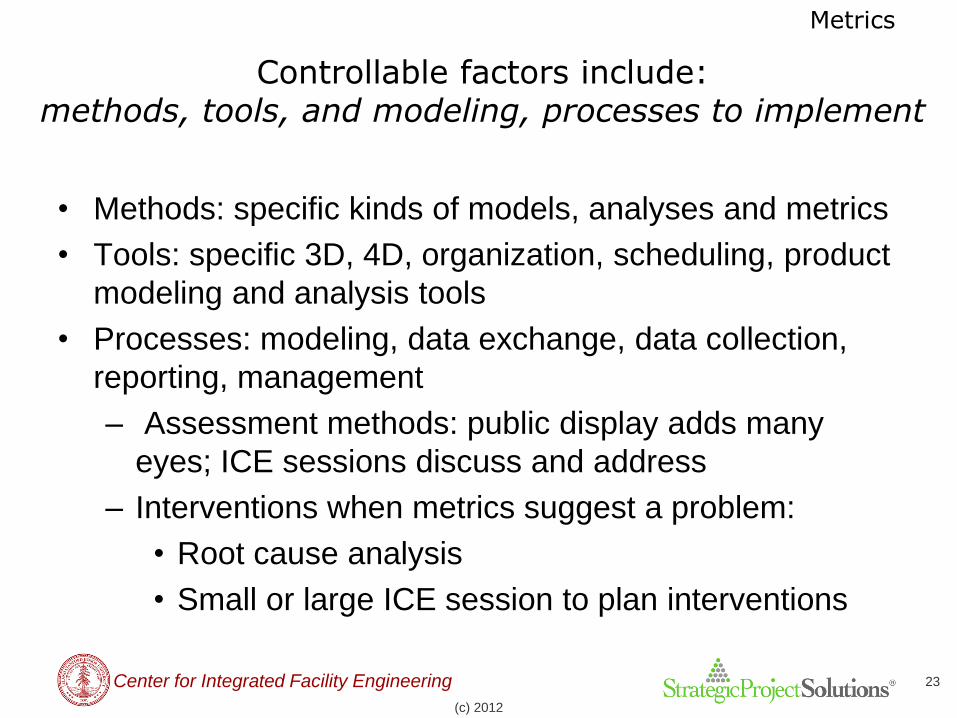
Controllable factors include: methods, tools, and modeling, processes to implement
• Methods: specific kinds of models, analyses and metrics
• Tools: specific 3D, 4D, organization, scheduling, product
modeling and analysis tools
• Processes: modeling, data exchange, data collection,
reporting, management
– Assessment methods: public display adds many
eyes; ICE sessions discuss and address
– Interventions when metrics suggest a problem:
• Root cause analysis
• Small or large ICE session to plan interventions
Metrics
Center for Integrated Facility Engineering (c) 2012 24
Controllable factors include: methods to use metrics data
• Collect performance data: existing reporting
systems (e.g., cost), data-acquisition systems
(e.g., energy) on-line surveys (e.g., quality
conformance), post-it notes (e.g., latency), …
Metrics
Center for Integrated Facility Engineering
(c) 2012
25
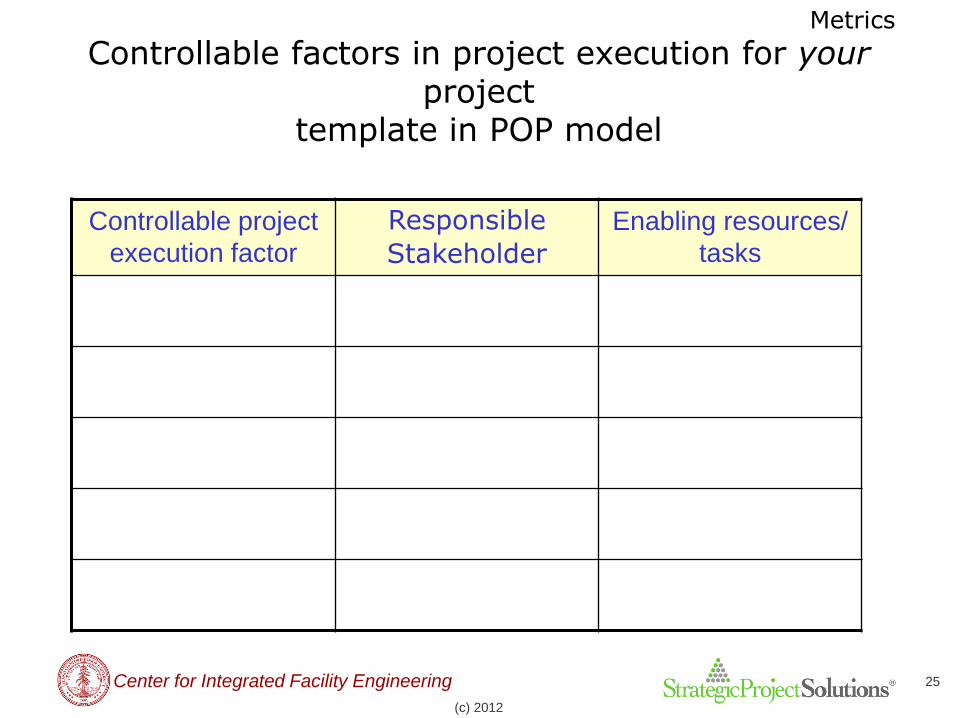
Controllable factors in project execution for your project
template in POP model
Controllable project
execution factor
Responsible
Stakeholder
Enabling resources/
tasks

Metrics
Center for Integrated Facility Engineering
(c) 2012
26
VDC impacts traditional management practices
Changes Issues
Management risk identification
and attention allocation
become model-based
Physical and social environment that
fosters multi-stakeholder interaction
Use iRooms for design and
construction management!
Stakeholders need a shared
vocabulary and methods
Believability, timeliness of project
definition
Build POP models early and often!
Stakeholders need skill to
make, analyze and engage
with models
Train; give slack to learn
Consider Certificate Program
VDC becomes a new process
to manage
Stakeholder(s) to model and analyze
Adapt organization and process!

Metrics
Center for Integrated Facility Engineering
(c) 2012
27
Method to Manage Using VDC in Practice
Method: objectives
• Controllable factors: choose them!
Process performance: measured ~ daily, weekly
– Safety
– Schedule, cost, quality conformance
– Response, decision latency
– Risk
– Field RFIs
– Rework volume
– Field material delivery
Project outcome: seek breakthrough

Metrics
Center for Integrated Facility Engineering
(c) 2012
28
(Multiple) Measurable Process objectives
• Safety: 0 lost-work incidents
• Conformance to schedule (PPC), cost, quality, target value, delivery & stakeholder participation objectives: [>=90 - 99% within 2% of plan]
• Schedule conformance = “percent of promises/plan complete” (PPC)
• Stakeholder participation: reported meaningful and timely participation of intended stakeholders in design/construction reviews
• Latency
• Response (decision-making no earlier than necessary): [minutes in design sessions; mean <= 1 working days; 95% < 2 days]
• Decision (decision-making promptness): [minutes in design sessions; mean <= 1 working days; 95% < 2 days]
Project objectives that can vary by project

Metrics
Center for Integrated Facility Engineering
(c) 2012
29
(Multiple) Measurable Process objectives
• Risk: 100% concurrence by all intended review stakeholders that sub-tasks were completed per specification for all tasks that affect life or corporate safety
• Field performance:
– Material delivery: 98% within 24 hours of use
– Field-generated Requests for Information: 0 (for questions related to issues that could have been identified at the award of the construction contract)
– Rework volume: 0
• Timely, meaningful and relevant meeting participation: 90% as reported by all intended stakeholders
Project objectives that can vary by project

Metrics
Center for Integrated Facility Engineering
(c) 2012
30
Use process metrics …
• Whatever your role: A, E, C or O
• Collaborating with your other
stakeholders
• Daily or weekly,
– measure process
performance
– compare predicted and
measured process metric
values with objectives
• Based on variances, update
product, organization and
process scope to improve
performance
Process
• Safety
• Conformance to schedule
(PPC), cost, quality, delivery,
stakeholder participation
objectives
• Latency (promptness)
• Risk
• Field material delivery,
Requests for Information,
rework
• Meeting participation
Metrics
Center for Integrated Facility Engineering
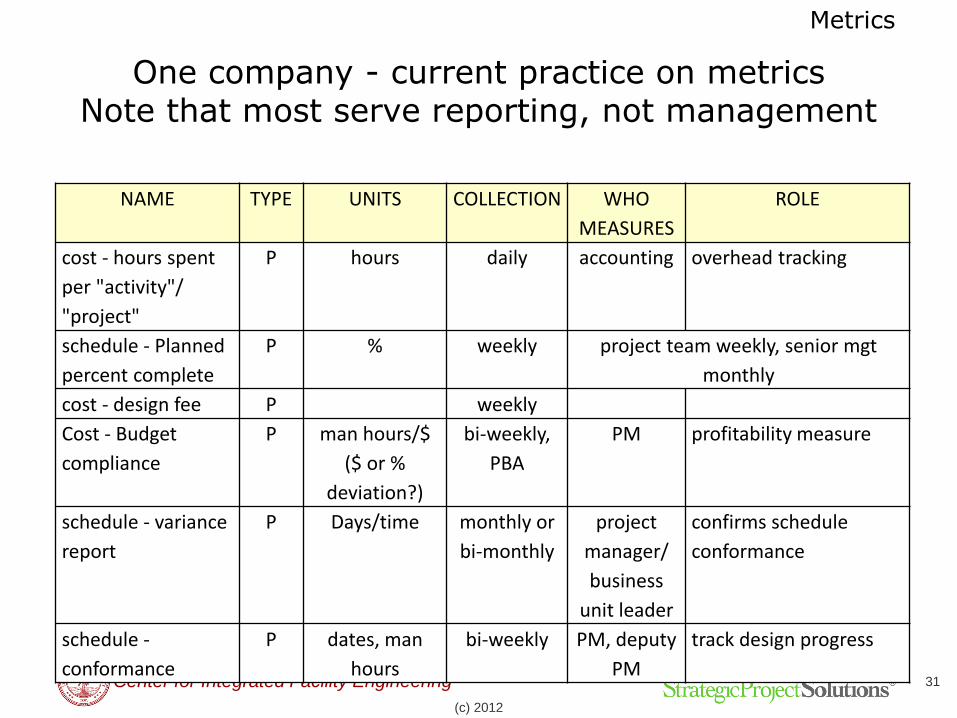
One company - current practice on metrics Note that most serve reporting, not management
NAME TYPE UNITS COLLECTION WHO
MEASURES
ROLE
cost - hours spent
per "activity"/
"project"
P hours daily accounting overhead tracking
schedule - Planned
percent complete
P % weekly project team weekly, senior mgt
monthly
cost - design fee P weekly
Cost - Budget
compliance
P man hours/$
($ or %
deviation?)
bi-weekly,
PBA
PM profitability measure
schedule - variance
report
P Days/time monthly or
bi-monthly
project
manager/
business
unit leader
confirms schedule
conformance
schedule -
conformance
P dates, man
hours
bi-weekly PM, deputy
PM
track design progress
(c) 2012
31

Metrics
Center for Integrated Facility Engineering
Metrics matrix for one project Note that most serve reporting, not management
(c) 2012
32
Control
specification/
Conformance:
Communication
Behavior:
Schedule: Cost: Quality:
Model product,
process
breakdown
structures, LOD
and scope
Meeting
Effectiveness
Latency Detailed Cost
Conformance
Field-
Generated
RFIs
VDC/Lean process
steps
Visualization use Conformance
(PPC)
Cost: Rework
Volume
Client
Satisfaction
Commitment
schedule level of
detail
Field Interest in
model or metrics
content
Field Material
Delivery
Safety
performance
Vico
performance
Alignment of
organization
incentives and
interests

Metrics
Center for Integrated Facility Engineering
Legend for Latency Levels 1: 1-2 days (objective)
2: 3-4 days
3: 5-6 days
4: 7-8 days
5: >8 days
Bubble size
• 1 response
2-3 responses •
Many responses
come promptly. Who
provides them?
Stakeholder latency over time for most critical issue of the week: Data suggest some stakeholders do not respond promptly
Many responses come
slowly. Why?
Latency an
issue
33
Color code:
Red = bad
Yellow = risk
Green = OK

Metrics
Center for Integrated Facility Engineering
Objective: 4-5
Client satisfaction over time: Data suggest client concern over GC performance
Some survey results
indicate satisfaction
Client clearly developed
an issue. Caused by
emergence of latency
as an issue?
Latency an
issue
34
Metrics
Center for Integrated Facility Engineering
(c) 2012
35
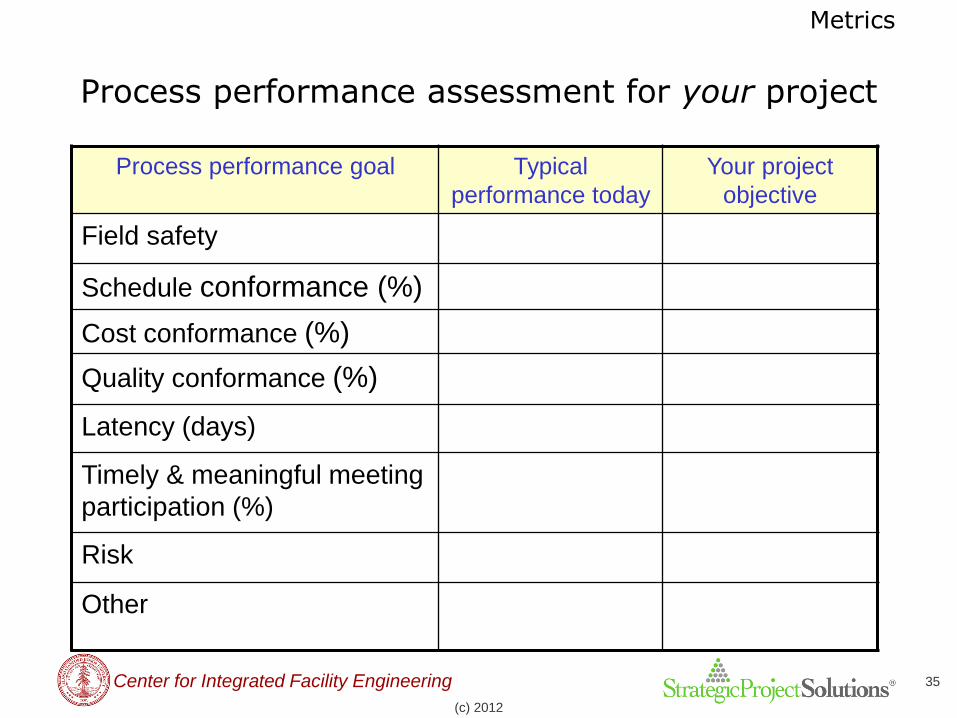
Process performance assessment for your project
Process performance goal Typical
performance today
Your project
objective
Field safety
Schedule conformance (%)
Cost conformance (%)
Quality conformance (%)
Latency (days)
Timely & meaningful meeting
participation (%)
Risk
Other
Metrics
Center for Integrated Facility Engineering
(c) 2012
36
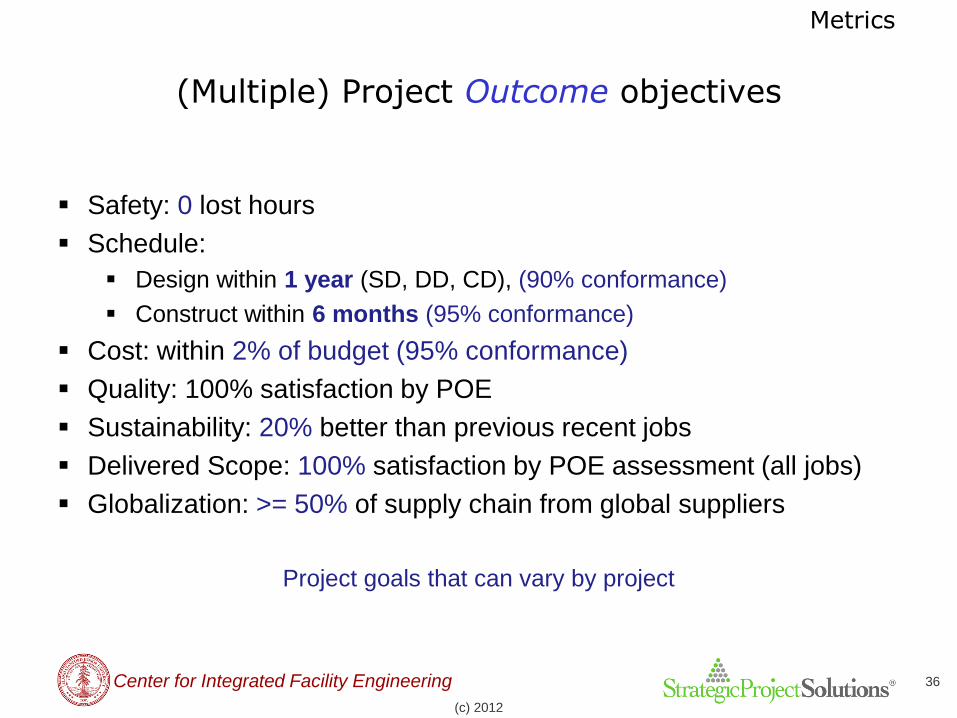
(Multiple) Project Outcome objectives
Safety: 0 lost hours
Schedule:
Design within 1 year (SD, DD, CD), (90% conformance)
Construct within 6 months (95% conformance)
Cost: within 2% of budget (95% conformance)
Quality: 100% satisfaction by POE
Sustainability: 20% better than previous recent jobs
Delivered Scope: 100% satisfaction by POE assessment (all jobs)
Globalization: >= 50% of supply chain from global suppliers
Project goals that can vary by project

Metrics
Center for Integrated Facility Engineering
(c) 2012
37
Outcome performance assessment for your project
Outcome performance
goal
Typical performance
today
Your project
objective
Field safety
Schedule
Cost
Quality
Risk
Energy
Other
Metrics
Center for Integrated Facility Engineering
(c) 2012
38
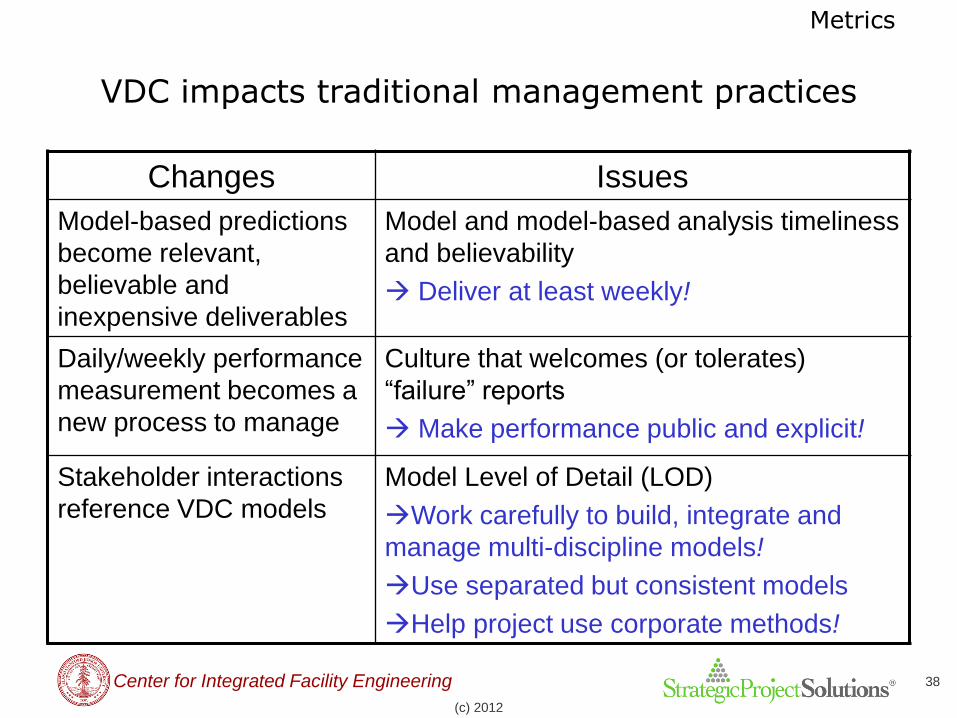
VDC impacts traditional management practices
Changes Issues
Model-based predictions
become relevant,
believable and
inexpensive deliverables
Model and model-based analysis timeliness
and believability
Deliver at least weekly!
Daily/weekly performance
measurement becomes a
new process to manage
Culture that welcomes (or tolerates)
“failure” reports
Make performance public and explicit!
Stakeholder interactions
reference VDC models
Model Level of Detail (LOD)
Work carefully to build, integrate and
manage multi-discipline models!
Use separated but consistent models
Help project use corporate methods!

Metrics
Center for Integrated Facility Engineering
(c) 2012
39
Use outcome performance …
• Whatever your role: A, E, C or O
• Collaborating with your other
stakeholders
• At every major milestone
• Compare measured outcome
values with objectives
• Based on variances, update
– objectives for controllable
factors
– process and outcome
objectives
Outcomes
• Safety
• Schedule
• Cost
• Delivered Scope
• Sustainability
• Globalization
Metrics
Center for Integrated Facility Engineering
(c) 2012
40
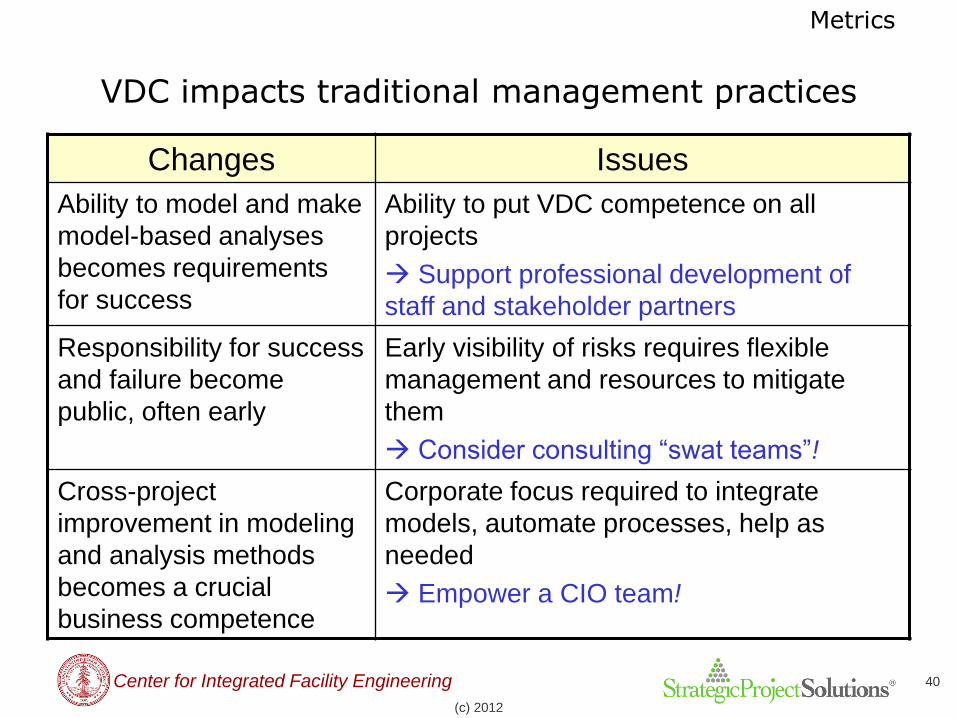
VDC impacts traditional management practices
Changes Issues
Ability to model and make
model-based analyses
becomes requirements
for success
Ability to put VDC competence on all
projects
Support professional development of
staff and stakeholder partners
Responsibility for success
and failure become
public, often early
Early visibility of risks requires flexible
management and resources to mitigate
them
Consider consulting “swat teams”!
Cross-project
improvement in modeling
and analysis methods
becomes a crucial
business competence
Corporate focus required to integrate
models, automate processes, help as
needed
Empower a CIO team!
Metrics
Center for Integrated Facility Engineering 41
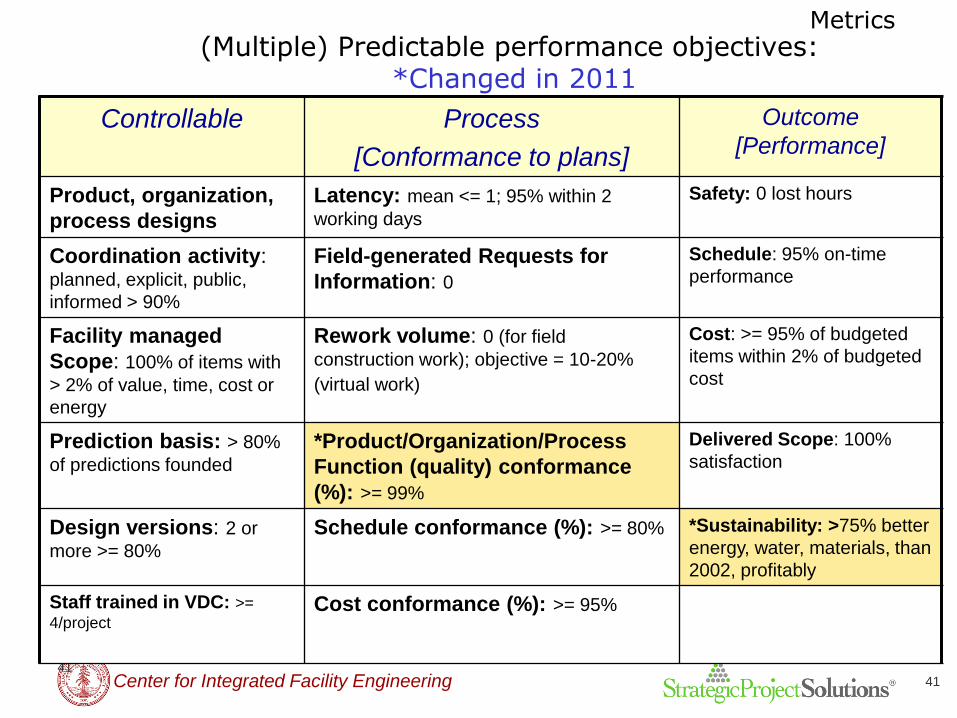
(Multiple) Predictable performance objectives: *Changed in 2011
Controllable Process
[Conformance to plans]
Outcome
[Performance]
Product, organization,
process designs
Latency: mean <= 1; 95% within 2
working days
Safety: 0 lost hours
Coordination activity: planned, explicit, public,
informed > 90%
Field-generated Requests for
Information: 0
Schedule: 95% on-time
performance
Facility managed
Scope: 100% of items with
> 2% of value, time, cost or
energy
Rework volume: 0 (for field
construction work); objective = 10-20%
(virtual work)
Cost: >= 95% of budgeted
items within 2% of budgeted
cost
Prediction basis: > 80%
of predictions founded
*Product/Organization/Process
Function (quality) conformance
(%): >= 99%
Delivered Scope: 100%
satisfaction
Design versions: 2 or
more >= 80%
Schedule conformance (%): >= 80% *Sustainability: >75% better
energy, water, materials, than
2002, profitably
Staff trained in VDC: >=
4/project
Cost conformance (%): >= 95%
41

Metrics
Center for Integrated Facility Engineering 42
(Multiple) Predictable performance objectives: We recommend project collect all process metrics
Controllable Process
[Conformance to plans]
Outcome
[Performance]
Product, organization,
process designs
Organization Latency: mean <= 1;
95% within 2 working days
Safety: 0 lost hours
Coordination activity: planned, explicit, public,
informed > 90%
Process Field-generated Requests
for Information: 0
Schedule: 95% on-time
performance
Facility managed
Scope: 100% of items with
> 2% of value, time, cost or
energy
Process Rework volume: 0 (for field
construction work); objective = 10-20%
(virtual work)
Cost: >= 95% of budgeted
items within 2% of budgeted
cost
Prediction basis: > 80%
of predictions founded
Product/Organization/Process
Function (quality) conformance
(%): >= 99%
Delivered Scope: 100%
satisfaction
Design versions: 2 or
more >= 80%
Process Schedule conformance
(%): >= 80%
*Sustainability: >75% better
energy, water, materials, than
2002, profitably
Staff trained in VDC: >=
4/project
Product/Organization Cost
conformance (%): >= 95%
42
Metrics
Center for Integrated Facility Engineering
(c) 2012
43
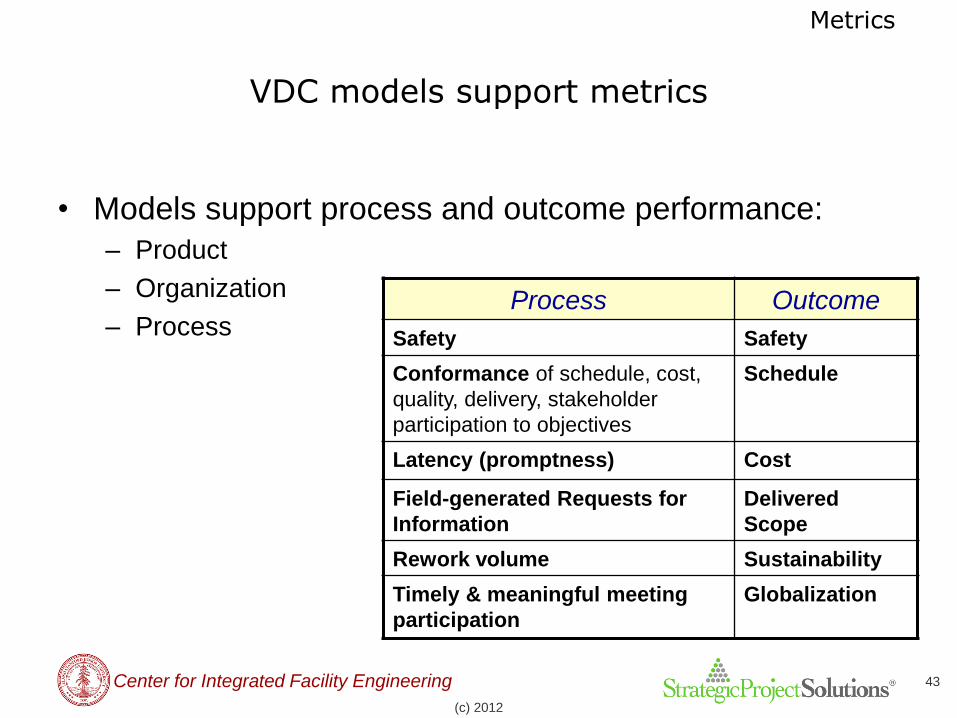
VDC models support metrics
• Models support process and outcome performance:
– Product
– Organization
– Process
Process Outcome
Safety Safety
Conformance of schedule, cost,
quality, delivery, stakeholder
participation to objectives
Schedule
Latency (promptness) Cost
Field-generated Requests for
Information
Delivered
Scope
Rework volume Sustainability
Timely & meaningful meeting
participation
Globalization
Metrics
Center for Integrated Facility Engineering
(c) 2012
44
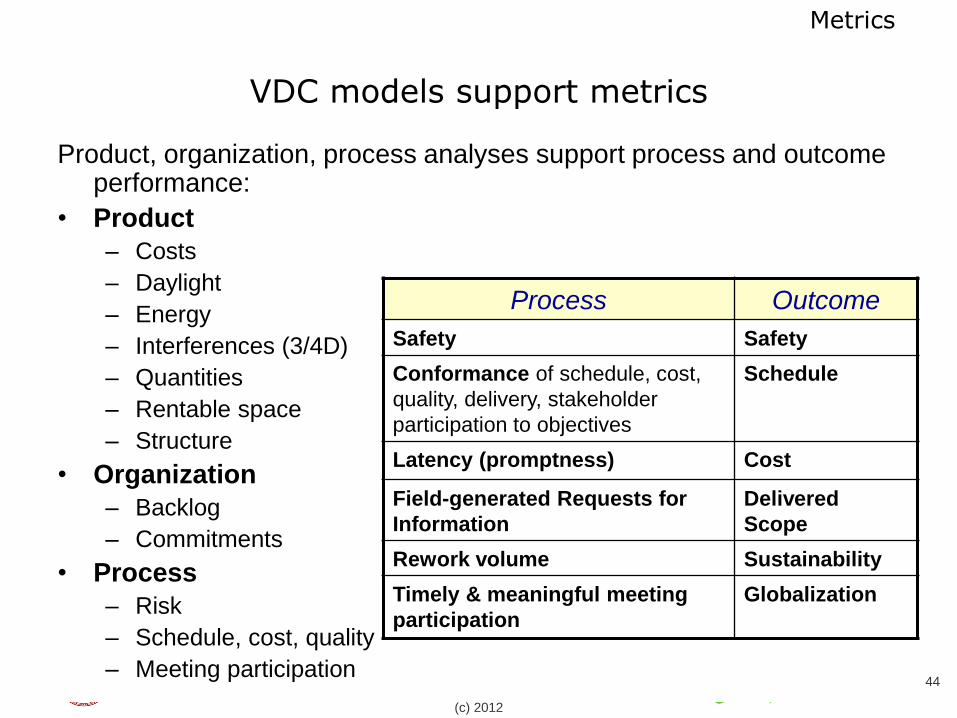
VDC models support metrics
Product, organization, process analyses support process and outcome performance:
• Product
– Costs
– Daylight
– Energy
– Interferences (3/4D)
– Quantities
– Rentable space
– Structure
• Organization
– Backlog
– Commitments
• Process
– Risk
– Schedule, cost, quality
– Meeting participation
Process Outcome
Safety Safety
Conformance of schedule, cost,
quality, delivery, stakeholder
participation to objectives
Schedule
Latency (promptness) Cost
Field-generated Requests for
Information
Delivered
Scope
Rework volume Sustainability
Timely & meaningful meeting
participation
Globalization
Metrics
Center for Integrated Facility Engineering
(c) 2012
45
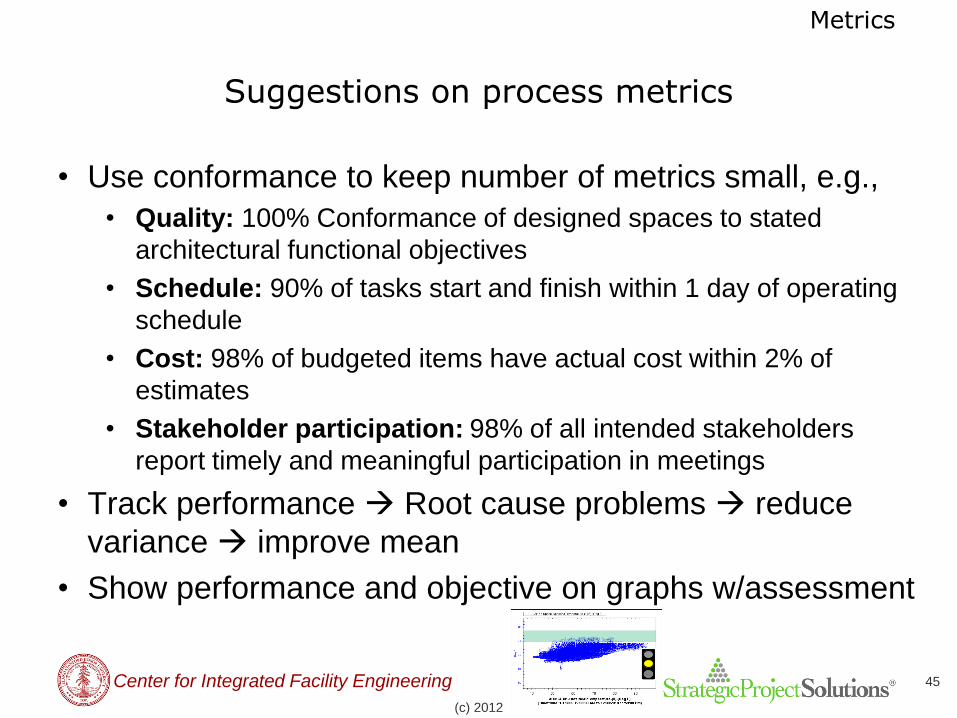
Suggestions on process metrics
• Use conformance to keep number of metrics small, e.g.,
• Quality: 100% Conformance of designed spaces to stated
architectural functional objectives
• Schedule: 90% of tasks start and finish within 1 day of operating
schedule
• Cost: 98% of budgeted items have actual cost within 2% of
estimates
• Stakeholder participation: 98% of all intended stakeholders
report timely and meaningful participation in meetings
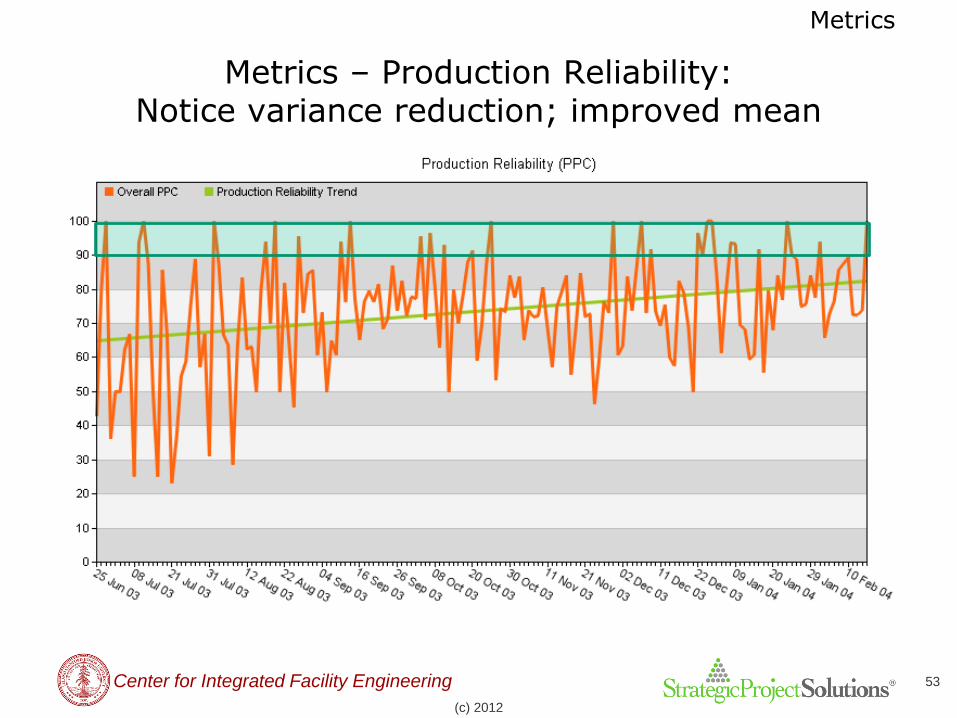
• Track performance Root cause problems reduce
variance improve mean
• Show performance and objective on graphs w/assessment
Metrics
Center for Integrated Facility Engineering
Conformance failure … a true story
There is a conflict in the Construction Documents as to the extent of demolition
of Building 122 between the architectural drawings and the structural
drawings.
The structural drawings indicate the Second Floor is to be protected in place to
serve as a roof for the walkway coming in from Building 165C.
The architectural plans indicate that demolition is to be done down to the First
Level.
Rather than send an RFI to resolve the conflict, the contractor went ahead and
demolished the building down to the First Level.
Now, the design team is required rebuild the Second Level.
(c) 2012
46
Metrics
Center for Integrated Facility Engineering
(c) 2012
47
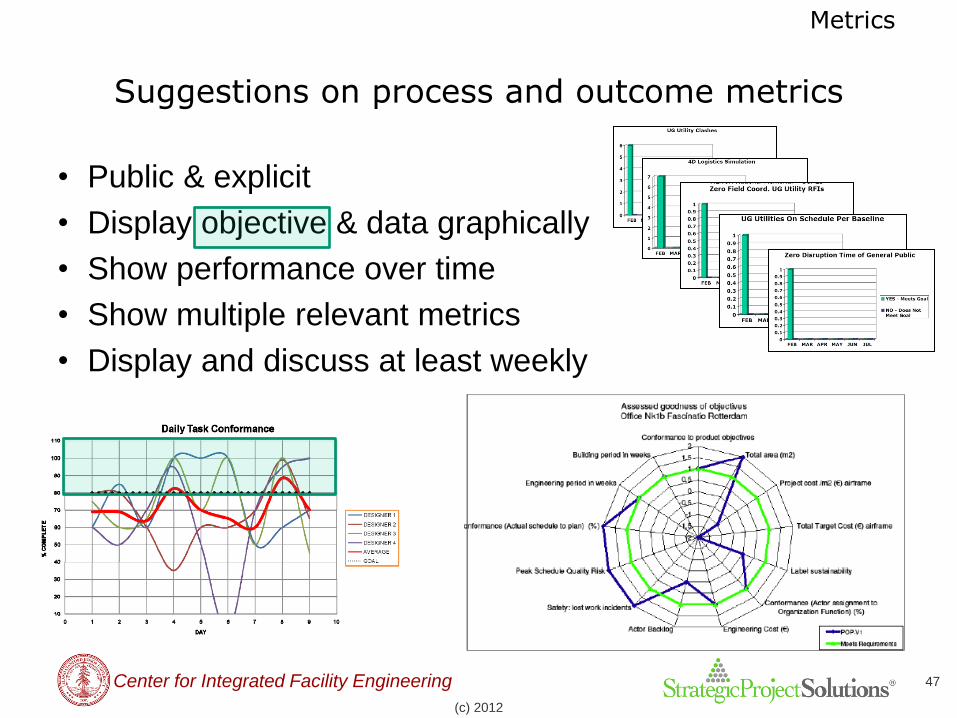
Suggestions on process and outcome metrics
• Public & explicit
• Display objective & data graphically
• Show performance over time
• Show multiple relevant metrics
• Display and discuss at least weekly

Metrics
Center for Integrated Facility Engineering
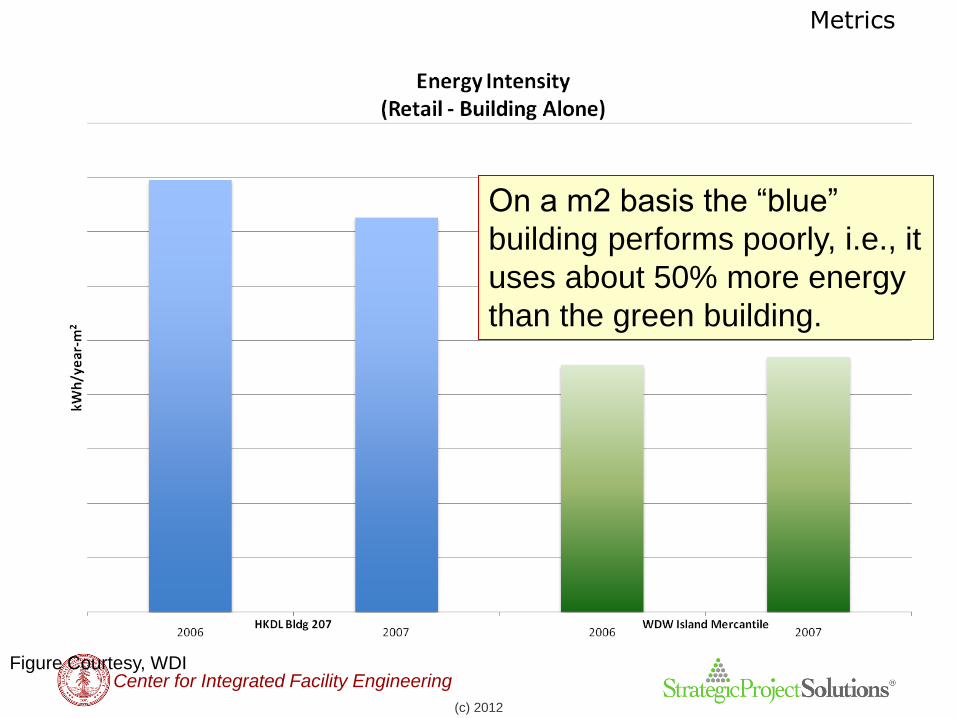
• Cost [KwH / year - m2]
(c) 2012
48
2006/7 2006/7
Performs better
– by cost HKDL WDW
Suggestion - choose units carefully: cost vs. list-cycle cost vs. value
Data Courtesy, WDI

Metrics
Center for Integrated Facility Engineering
• Cost [KwH / year - m2] Value [KwH / year - transaction - m2]
(c) 2012
49
HKDL Performs better
– by value WDW
2006/7 2006/7
Suggestion - choose units carefully: cost vs. list-cycle cost vs. value
Data Courtesy, WDI

Metrics
Center for Integrated Facility Engineering
Suggestion - choose units carefully: cost vs. list-cycle cost vs. value
50
First cost (related to initial
investment, design and
construction phase)
Lifecycle cost (LCC)/Period --
20, 30, or whatever # of
years
Lifecycle cost per value
earned (e.g., per person-
occupancy-hour, $ of profit,
patient treated, …)
Cost ($ or hours) First cost/sf LCC/sf LCC/value metric
Energy (kBtu) Kwh construction/sf Kwh/sf Kwh/value metric
CO2 (tons of CO2 equivalent) tCO2 embodied in product
(including CO2 from
production, transportation)
tCO2/sf tCO2/value metric
Quality (% conformance to
explicitly stated design
intent, normalized by item
relative weight)
Cost of design and
construction services plus
interest on any loans
Productivity cost of workers
who must compensate for
quality deficit
Productivity cost of workers
who must compensate for
quality deficit/value metric
Safety (Incidents or lost-
work hours)
/Msf;
project cost of workers comp
insurance
/Msf;
operational cost of workers
comp insurance;
/hr of operation;
/work hours of operation
/value add of facility
Schedule Duration (Weeks) Cost of design and
construction services +
interest on any loans
n/a Additional income (loss)
because of schedule gain
(delay)
Schedule Conformance (%) Cost of contingency to
account for schedule
variability
n/a n/a
Metrics
Center for Integrated Facility Engineering
On a m2 basis the “blue”
building performs poorly, i.e., it
uses about 50% more energy
than the green building.
Figure Courtesy, WDI
(c) 2012

Metrics
Center for Integrated Facility Engineering Figure Courtesy, WDI
On a transaction per m2 basis the
“green” building performs poorly, i.e.,
it uses about 80% more energy than
the green building.
(c) 2012
Metrics
Center for Integrated Facility Engineering
(c) 2012
53
Metrics – Production Reliability: Notice variance reduction; improved mean

Metrics
Center for Integrated Facility Engineering
(c) 2012
54
Suggestions on process and outcome metrics
• Focus on a small manageable set (>= 7)
• Display and interpret them publicly and explicitly
– Show objective and data
– Add traffic light to show status
– Add comments to explain why yellow or red status
• Continually reassess how metrics can and do support
management

Metrics
Center for Integrated Facility Engineering
(c) 2012
55
Comments from VDC Value Survey:
Projects often do not track and manage using quantitative
performance metrics today
• Quantitative impacts remain largely invisible – VDC
seems to sell itself
• Quantitative data response low
– 90% do not quantitatively track impacts
• Most respondents do not know cost performance!!
• Half of participants do not know performance!!
Metrics
Center for Integrated Facility Engineering
(c) 2012
56
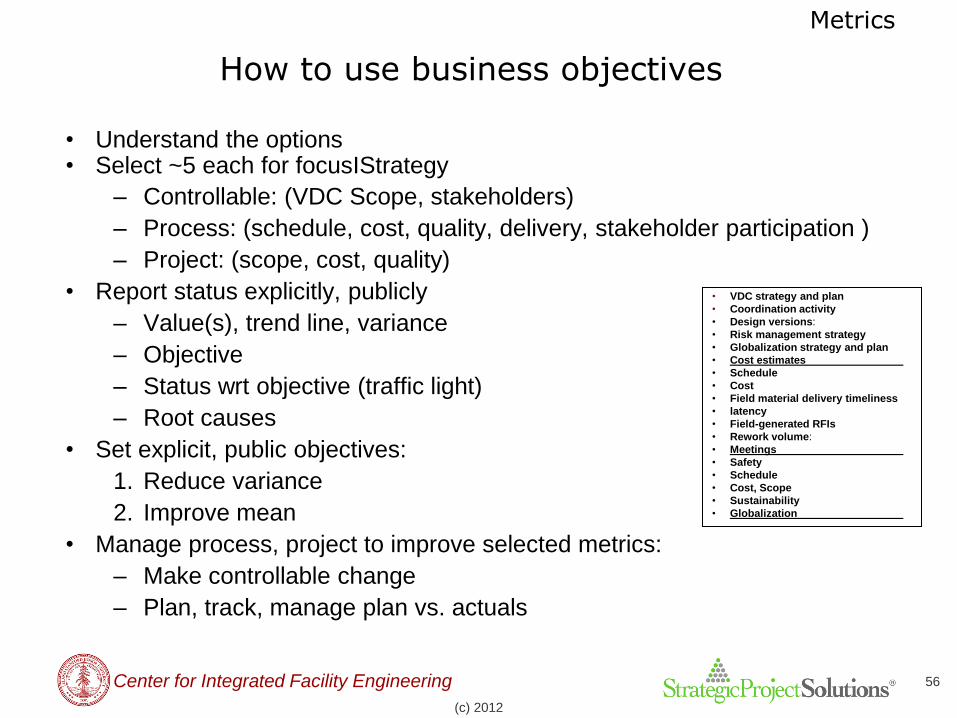
How to use business objectives
• Understand the options • Select ~5 each for focusIStrategy
– Controllable: (VDC Scope, stakeholders)
– Process: (schedule, cost, quality, delivery, stakeholder participation )
– Project: (scope, cost, quality)
• Report status explicitly, publicly
– Value(s), trend line, variance
– Objective
– Status wrt objective (traffic light)
– Root causes
• Set explicit, public objectives:
1. Reduce variance
2. Improve mean
• Manage process, project to improve selected metrics:
– Make controllable change
– Plan, track, manage plan vs. actuals
• VDC strategy and plan
• Coordination activity
• Design versions:
• Risk management strategy
• Globalization strategy and plan
• Cost estimates
• Schedule
• Cost
• Field material delivery timeliness
• latency
• Field-generated RFIs
• Rework volume:
• Meetings
• Safety
• Schedule
• Cost, Scope
• Sustainability
• Globalization

Metrics
Center for Integrated Facility Engineering
(c) 2012
57
Meeting new Performance Objectives
Integrated business
approach
• Culture: public commitment;
public performance reporting
• Technology: predict, track
• Strategy: unique value
• People: skills, incentives
• Organization: structure
• Process: planning, execution,
objectives
Culture
Technology
Strategy
Process
Organization
People
Metrics
Center for Integrated Facility Engineering
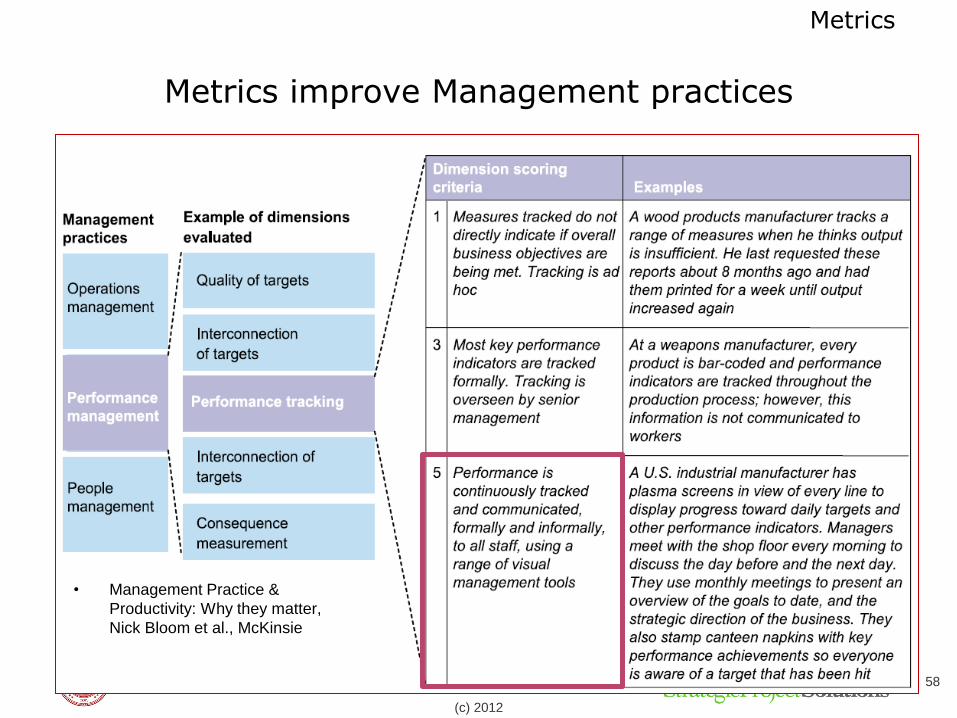
Metrics improve Management practices
• Management Practice &
Productivity: Why they matter,
Nick Bloom et al., McKinsie
(c) 2012
58
Metrics
Center for Integrated Facility Engineering
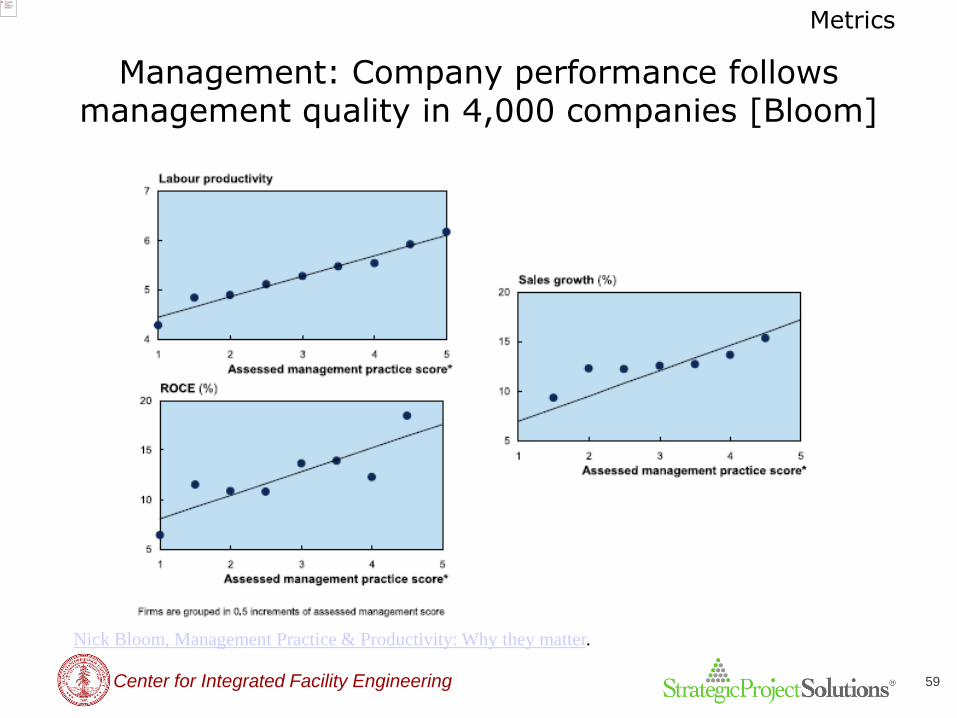
Management: Company performance follows management quality in 4,000 companies [Bloom]
59
Nick Bloom, Management Practice & Productivity: Why they matter.

Metrics
Center for Integrated Facility Engineering
(c) 2012
60
Qualitative Benefits using metrics to manage
• Greater level of interaction between office and field re planning and reliability
• Improved communication among engineers and between engineers and foremen
• Improved process understanding of how work is completed at detailed level and consequent planning
• Better offline work planning and structuring via multidisciplinary teams
• Desire to improve project business processes to eliminate waste in the overall production system – teams engaged in continuous improvement
• Increased understanding of workload capacity leading to increased productivity
• Feeling of empowerment among site teams to influence and own the plan (people help to implement what they help to create!)

Metrics
Center for Integrated Facility Engineering
(c) 2012
61
VDC Big Ideas
• Build project model early and often, before committing
large money or time
• What
– Product, Organization, Process (POP)
• How:
– Virtual: in the computer
– Visual: multi-discipline, multi-view, for multiple stakeholders
– Objective-based: set and track explicit public objectives
– Detailed: 10% (2%) of project time, money, risk

Metrics
Center for Integrated Facility Engineering
(c) 2012
62
Metrics Implementation table Metrics table sheet in POP model
Name Objective Type
[C, P, O]
How to
use in
managem
ent
Source of
data
Display Collection
frequency
M
E
T
R
I
C
S
Type: Controllable, Process, Outcome
Display: Bar chart; Time line; Spider, …

Metrics
Center for Integrated Facility Engineering
(c) 2012
63
For ICE Session on use of Metrics on your project
Create ppt summary of your intended uses of metrics on your project:
1. Controllable factor and Metrics implementation tables in POP
model
2. Comments:
• Recommend next steps for modeling, analysis, new tools, new
competences to enable metrics
• Identify expected managerial results, methods of metrics
• Relate metrics plan to your VDC implementation plan

Metrics
Center for Integrated Facility Engineering
(c) 2012
64
Metrics Overview
Session Objectives
Metrics
[Lecture/
discussion;
Demo;
interactive
planning
session]
Understand and experience:
• types of metrics, including project outcome objectives,
process performance, and controllable factors
• how to track them
• methods to use them in management
• entering metrics into the POP and associated
modeling tools.

Metrics
Center for Integrated Facility Engineering
ORID: Focused Conversation and Analysis
(c) 2012
65
Objective
What do you recall
seeing?
Reflective
Positive
What do you feel
positive about?
Reflective
Negative
What do you find
negative?
Interpretive
What sense do you
make of it?
Decisional
What agreements
can be made now?
Metrics
Center for Integrated Facility Engineering
Performance Metrics in AEC
The big idea: Progress in AEC effectiveness and efficiency comes from achievement of measurable goals
You may get what you ask for