metrics to support informed decision-making for consumers ... · metrics to support informed...
TRANSCRIPT

METRICS TO SUPPORT INFORMED DECISION-MAKING FOR CONSUMERS OF
BIOBASED PRODUCTS
ORGANISATION FOR ECONOMIC CO-OPERATION
AND DEVELOPMENT
2
ORGANISATION FOR ECONOMIC CO-OPERATION
AND DEVELOPMENT
The OECD is a unique forum where the governments of 30 democracies work together to address the economic, social and environmental challenges of globalisation. The OECD is also at the forefront of efforts to understand and to help governments respond to new developments and concerns, such as corporate governance, the information economy and the challenges of an ageing population. The Organisation provides a setting where governments can compare policy experiences, seek answers to common problems, identify good practice and work to co-ordinate domestic and international policies.
The OECD member countries are: Australia, Austria, Belgium, Canada, the Czech Republic,
Denmark, Finland, France, Germany, Greece, Hungary, Iceland, Ireland, Italy, Japan, Korea, Luxembourg, Mexico, the Netherlands, New Zealand, Norway, Poland, Portugal, the Slovak Republic, Spain, Sweden, Switzerland, Turkey, the United Kingdom and the United States. The Commission of the European Communities takes part in the work of the OECD.
OECD Publishing disseminates widely the results of the Organisation's statistics gathering
and research on economic, social and environmental issues, as well as the conventions, guidelines and standards agreed by its members.
This work is published on the responsibility of the Secretary-General of the OECD. The opinions expressed and arguments employed herein do not necessarily reflect the official views of the Organisation or of the governments of its member countries.
Publié en français sous le titre: Lignes directrices de l’OCDE relatives aux pratiques exempla ires
concernant les centres de ressources biologiques
© OECD 2009
No reproduction, copy, transmission or translation of this publication may be made without written permission. Applications should be sent to OECD Publishing: [email protected] or by fax (+33-1) 45 24 13 91. Permission to photocopy a portion of this work should be addressed to the Centre Français d‟exploitation du droit de Copie, 20 rue des Grands-Augustins, 75006 Paris, France ([email protected]).


Metrics to Support Informed Decision-making for Consumers of Biobased Products - 2009
4
FOREWORD
The case study has been developed by delegates to the OECD Task Force on Industrial Biotechnology Mr Marvin Duncan (USDA), Mr. Roger K. Conway (USDA) and colleagues. 1
The document focuses on efforts in the United States to develop metrics to support sound decision choices by industry and consumers in the selection and use of biobased products. Public policy initiatives have been important in spurring the movement toward increased use of biobased products in the effort to lighten the U.S. environmental footprint and enhance its energy security. This has included developing metrics based on sound science that also provide useful information to inform consumer selections of biobased products. In addition, it is important to understand the effect on the environment and particular measures of that effect, such as accumulation of CO2 and other greenhouse gases.
The document addresses reasons why it was deemed necessary to develop and focus on these indices and the role they will serve in informing consumer selections. The question of whether biobased products should be held to the same performance standards as non-biobased products is discussed. The paper also discusses the origin and use of the three primary measures developed and promoted by U.S. officials and manufacturers for use in measuring content and efficacy of biobased products as related to environmental issues. These measures are biobased content, environmental performance, and economic performance.
The Committee for Scientific and Technological Policy declassified this document.
1 About the Authors: Dr. Marvin Duncan is a Senior Agricultural Economist in the Office of Energy Policy
and New Uses in the U.S. Department of Agriculture (USDA), Office of the Chief Economist. Barbara C.
Lippiatt is an Economist in the Commerce Department’s National Institute of Standards and Technology
(NIST). Zia Haq is a Senior Analyst in the U.S. Department of Energy. Dr. Michael Wang is Manager of
the Systems Assessment Section at Argonne National Laboratory. Dr. Roger K. Conway is Director of the
Office of Energy Policy and New Uses in USDA’s Office of the Chief Economist.
Metrics to Support Informed Decision-making for Consumers of Biobased Products - 2009
5
TABLE OF CONTENTS
FOREWORD .................................................................................................................................................. 4
METRICS TO SUPPORT INFORMED DECISION-MAKING FOR CONSUMERS OF BIOBASED PRODUCTS.................................................................................................................................................... 6
Growing Industry Interest in Bio-based Products ................................................................................ 6 The Need to Measure Environmental Attributes .................................................................................. 6 Measuring Biobased Content .................................................................................................................. 8 Selecting Appropriate Performance Standards..................................................................................... 9 Product Preference and Labeling Programs .......................................................................................... 9 BEES Sustainability Indices for Biobased Products ........................................................................... 11 Environmental Performance Measurement ........................................................................................ 12 Life-Cycle Impact Assessment ............................................................................................................... 13 Life-Cycle Interpretation ........................................................................................................................ 15 Economic Performance Measurement ................................................................................................. 16 BEES Sustainability Indices: Value to BioPreferred .......................................................................... 16 BEES Sustainability Indices: Looking Ahead ...................................................................................... 17 An Example of BEES Information to Support Decision making ...................................................... 17 Evaluating the Environmental Impacts of Biofuels Production ....................................................... 20 Energy Independence and Security Act of 2007 ................................................................................. 22 The GREET Model .................................................................................................................................. 22 Selected GREET Results ........................................................................................................................ 24 Key Uncertainties .................................................................................................................................... 25 Sustainability Considerations ................................................................................................................ 32 Conclusion ................................................................................................................................................ 33
REFERENCES ............................................................................................................................................. 34

Metrics to Support Informed Decision-making for Consumers of Biobased Products - 2009
6
METRICS TO SUPPORT INFORMED DECISION-MAKING FOR CONSUMERS OF BIOBASED PRODUCTS
A sea change appears to be underway in the United States, and around the world, as consumers increasingly seek to acquire and use products that are kinder to the environment. As a consequence of that trend, industry, consumers, and governments are giving increased attention to the facts behind product claims to being green, having a light environmental footprint, being biodegradable, and being biobased. As these product advertising claims have become prevalent, both consumers and manufacturers sometimes have been mistaken about the actual environmental characteristics of products (8).
Growing Industry Interest in Bio-based Products
The United Sates industry has had a particular interest in developing biobased products. On the one hand, consumers have been calling for “green products” with a lighter environmental footprint. For competitive reasons, industry has been eager to develop such products. Industry also has recognized that the United States may never again be price-competitive on petroleum and natural gas feedstocks for developing petrochemical products against oil and gas supplies in certain other areas of the world. Both oil and natural gas production costs seem likely to remain lower in several areas of the world such as Russia, West Africa, and the Middle East than in the United States. A number of these countries currently are pursuing a development policy focused on exploiting their economic advantage in petroleum and natural gas production by moving downstream in the industry to develop petrochemical industries to serve world markets. On the other hand, U.S. industry seems convinced that the United States can meet world-class feedstock competition in the production of bio-based feedstocks for its chemical industries.
The Need to Measure Environmental Attributes
An environmentally attuned consuming public is seeking to use products that are more environmentally sustainable. Manufacturers are seeking to meet the expectations of consumers, as well as to reduce the environmental footprint of their own businesses. This, of course, requires that credible processes be implemented to accurately measure the level of biobased content in products and their effect on the environment. As a result, governments are turning their attention to identifying measurements that can provide credible evaluation of the life-cycle environmental and health effects of these products, and where biobased content is claimed, metrics that can provide an accurate measure of the biobased content.
This paper focuses on efforts in the United States to develop metrics to support sound decision choices by industry and consumers in the selection and use of biobased products. Public policy initiatives have been important in spurring the movement toward increased use of biobased products in the effort to lighten the U.S. environmental footprint and enhance its energy security. This has included developing metrics based on sound science that also provide useful information to inform consumer selections of biobased products. In addition, it is important to understand the effect on the environment and particular measures of that effect, such as accumulation of CO2 and other greenhouse gases.

Metrics to Support Informed Decision-making for Consumers of Biobased Products - 2009
7
This paper addresses reasons why it was deemed necessary to develop and focus on these indices and the role they will serve in informing consumer selections. The question of whether biobased products should be held to the same performance standards as non-biobased products is discussed. The paper also discusses the origin and use of the three primary measures developed and promoted by U.S. officials and manufacturers for use in measuring content and efficacy of biobased products as related to environmental issues. These measures are biobased content, environmental performance, and economic performance.
Interest in biobased products has been building in the United States for a number of years, as both public policymakers and product manufacturers have sought ways to improve environmental sustainability associated with commonly used products and to access domestically sourced materials as building blocks for a wider array of products. Looking to biological materials to provide feedstock materials to use is a logical consequence.
Interest in biobased products in the United States has a long history. Early in the 20th century, biobased materials were thought to be preferred feedstocks for products ranging from motor fuels to lubricants to plastics. However, the emergence of the petrochemical industry and its ability to provide low-cost, readily accessible alternatives to more expensive and more limited-use biobased products doomed the biobased movement that was known as the “Chemurgic Movement” to economic irrelevancy.
A number of factors emerged at the beginning of the 21st century to give promise and vigor to what is now referred to as an emerging “biobased economy.” First, there is a much greater understanding and appreciation of environmental sustainability. Americans now better understand the monetary, social, and human health costs of environmental degradation. In addition, science has made large gains in its ability to deconstruct biological material and use its components to create a growing array of products that previously could be made only from fossil energy sources. Finally, as the United States has faced a growing dependence on imported oil and experienced rising oil and natural gas prices, industry public policymakers have sought domesti-cally produced feedstock materials to augment energy feedstock supplies and to assure economic competitiveness and energy security.
Public policy initiatives have been unusually important in moving forward the transition to a more biobased economy. These initiatives have supported a wide range of research and development and market penetration initiatives. In the case of biofuels, tax incentives and renewable fuel requirements have provided and continue to provide important support for industry development. (26) Earlier, a USDA buydown of feedstock cost was unusually successful in jump-starting the industry. Tax credits have been critically important for solar and wind energy development as well. (6) For biobased products, the preferred procurement by Federal agencies and their contractors and the voluntary labeling program for biobased products are proving to be important industry drivers. (37)
Initially, proponents of the bioeconomy were principally interested in creating products with the highest possible biobased content. In that way, they were assured of maximum substitution of biobased for fossil energy feedstock. Moreover, there was a perception, initially, that the higher the biobased content, the lighter the biobased environmental footprint might be.
This approach quickly gave way to a more nuanced understanding of biobased products development. The first realization was that biobased products would need to meet the same performance standards as fossil energy products if there was to be broad consumer acceptance of and substitution of biobased for fossil energy products. In practice, that meant that the upper level of biobased content of a product was constrained by the performance standard it needed to

Metrics to Support Informed Decision-making for Consumers of Biobased Products - 2009
8
meet. The more severe the use conditions for a product, such as a lubricant or hydraulic oil, the more constrained the biobased content would be in order to meet the severe use performance standard.
A second realization was that as useful as the environmental characteristics in the product itself were, it was much more important to understand the life-cycle environmental impact of producing and using a bioproduct. For example, a product itself may appear environmentally benign, but the production of the feedstock from which it is made, the manufacturing process itself, or the final disposal of the product could have a signifi cantly adverse effect on the environment. Thus, a clear understanding of the environmental and health effects of a product required knowledge about its environmental and health effects profile on a cradle-to-grave basis. Examples of this can be found in the clearing of forested areas in Southeast Asia and conversion to palm oil plantations to supply feedstocks for increased biodiesel production. Another example, found in the United States, is the potential conversion of erosion prone lands from grass or forest to crop land for the production of row crops to provide feedstocks for ethanol production.
A third realization was that while a given product might be either less or more costly than its non-biobased competitor when purchased, what really mattered was the cost comparison over the life of the product. Though more expensive to purchase, a biobased product might well have a longer useful life and have lower final disposal costs than a non-biobased product, thus offsetting a higher initial purchase price. Hence, product costs measured over a product‟s useful life provide the most appropriate measure of a product‟s relative economic worth.
Measuring Biobased Content
Yet another issue was that of biobased content, itself. If consumers were to have confidence in purchasing what they thought were biobased products, a means to measure biobased content would be needed. How was it to be measured? And would it be measured in a consistent manner across manufacturers and across products? A widely agreed-upon, reliable, and scientifi cally sound means was needed to accurately measure biobased content of products that were marketed as biobased.
Because USDA could not identify a currently available and reliable test for biobased content, it brought the need for such a test to the attention of the Biobased Plastics Subcommittee of ASTM International, a major voluntary standards-setting organization with worldwide activities. ASTM International develops and adopts standards on a consensus basis using a committee structure that includes balanced representation of experts and stakeholders on the subject material from the “producer” (e.g., producer or seller of products subject to standards development), “user” (e.g., purchaser or user of these products), and “general interest” stakeholder communities (e.g., academe and government).
The Biobased Plastics Subcommittee developed a radioisotope test to determine the biobased carbon in a material or product as a percent of weight (mass) of the total organic carbon in the material or product. The test, in effect, determines the new carbon (biobased) in a product as a percent of total organic carbon in the material or product. This test is accurate to within plus or minus 3 percentage points. Use of the test assures comparability of test results across products and manufacturers in determining biobased content. The formal title of the test is Test Methods for Determining the Biobased Content of Natural Range Materials Using Radiocarbon and Isotope Ratio Mass Spectrometry Analysis, ASTM Standard D 6866 (4). This test is being widely adopted by manufacturers in determining biobased content of those products marketed as biobased.

Metrics to Support Informed Decision-making for Consumers of Biobased Products - 2009
9
Selecting Appropriate Performance Standards
A defining question regarding biobased products is what performance standards should these products be expected to meet. Should a separate class of biobased standards be developed, perhaps less rigorous than standards for fossil energy products, to facilitate development of products with maximum biobased content? After consultation with industry and with product users, USDA concluded that these products should be subject to the same performance standards as the fossil energy-based products with which they would compete, in order to achieve the broadest market acceptance.
To consider separate standards, and perhaps less rigorous standards for biobased products than for fossil energy-based products, ran the clear risk of establishing biobased products as “second rate” products that could not meet accepted norms of performance. USDA believed that would have had a chilling effect on market acceptance of biobased products. It would have been unfair, as well, to the manufacturers of biobased products whose products were formulated to meet the same performance standards as fossil energy-based products against which they compete.
Product Preference and Labeling Programs
USDA‟s focus on biobased products was sharpened in 2002 with the passage of the Farm Security and Rural Investment Act (the 2002 Farm Bill). Section 9002 of that farm bill created a program of preferred procurement and labeling of biobased products. (13) USDA was charged with developing, implementing, and operating this program, which has been named the BioPreferred Program. In the farm bill, biobased products were defined as products determined by the Secretary to be commercial or industrial products (rather than food, feed, or fuel) that are composed in whole or in significant part, of biological products or renewable domestic agricultural materials (including plant, animal, and marine materials) or forestry materials. (12)
In developing this program, USDA was required to determine a number of factors including the availability of such items and the economic and technological feasibility of using such items, including life-cycle costs. USDA was also asked to provide information to Federal agencies on the availability, relative price, performance, and environmental and public health benefits of such items on a life-cycle basis. In addition, where appropriate, USDA was to recommend the level of biobased material to be contained in the procured product.
USDA addressed the economic and technological feasibility in two ways: first, it determined the array of products in the marketplace that fell under the umbrella of an item to be designated for preferred procurement and, second, it identified the industry-accepted performance standards these products met, under a designated item.
Performance standards applicable to a given biobased product are those that are commonly used by industry for fossil energy-based products in similar applications in use. These standards are gathered through communication with product manufacturers and Federal agency technical personnel who determine standards required in particular use applications. Federal agencies need not purchase biobased products under the BioPreferred Program that do not meet their legitimate performance standards. Lack of availability within a reasonable timeframe and availability only at unreasonable prices also are legitimate reasons for Federal agencies not to purchase biobased products under this program.
In its designation process, USDA has chosen to set a biobased content level for each of the 75 items for which rules to designate have been promulgated or proposed, or are in internal USDA clearance. These content levels are established after review by USDA of the content level of

Metrics to Support Informed Decision-making for Consumers of Biobased Products - 2009
10
biobased products currently in the marketplace that fall under the item to be designated. The BioPreferred Program encourages Federal agencies to purchase biobased products with the highest biobased content, subject to meeting the performance requirements of the use application. These items account for over 6,770 biobased products currently in the marketplace, and produced by more than 1,422 companies. USDA has identified another 112 items on which designation and rulemaking have not yet begun. Almost all these products that fall under these items are produced by U.S. manufacturers. To date, USDA market research has identified nearly 11,000 biobased products in the marketplace and over 1,900 companies involved in biobased product production and marketing.
To determine biobased product availability and relative price, USDA has conducted extensive market research on biobased products and manufacturers.
Environmental and public health performance were to be determined on a cradle-to-grave basis by USDA for designation of items using the analytic technique developed by the National Institute of Standards and Technology called BEES (Building for Environmental and Economic Sustainability), which quantifies environmental and public health performance using the internationally standardized life-cycle assessment approach (a cradle-to-grave approach). (18)
When a manufacturer of a qualifying biobased product falling under an already designated item is asked by a Federal agency for a life-cycle assessment, that manufacturer may respond using the BEES analytic tool or following standard guidance developed by ASTM International (ASTM D7075), which also uses a life-cycle assessment approach. For designating items for preferred procurement, USDA relies on the BEES analytic technique. In responding to customer inquiries for this information on a product basis, manufacturers may use either BEES or ASTM D7075.
The BEES analytic tool provides quantitative information for 12 environmental and public health indicators. For example, it quantifies carbon absorption and emissions for its Global Warming indicator. BEES also synthesizes its 12 indicators into an overall score for a product based on environmental importance weightings developed by a BEES Stakeholder Panel, thus providing a ready means of ranking products.
The use of the BEES quantitative measurements permit a customer to evaluate the overall environmental and health effects of a product‟s use and also enable an evaluation of the product on a measure-by-measure assessment. This permits a customer to focus on those environmental and health attributes most important to his or her purchase decision. For example, in the case of biobased cutting fluids for machine tooling activities, the health effects of product use may be more important than certain other measures. In the case of other products, global warming measures may be more important.
With either the BEES analytic tool or ASTM D7075 standard guidance, a life-cycle assessment is developed using a consistent analytic framework. This permits comparison across biobased products. Since these evaluation tools can be used on fossil energy products as well, comparisons with fossil energy-based alternative products are also feasible.
A key factor in support of the evaluative procedure adopted by USDA in its rulemaking for the BioPreferred program is the consistent analytic framework for evaluation that permits comparison across products.
The BioPreferred Program establishes an accurate and scientifically supported set of quantitative measures. The program does not tell the Federal agency or other consumer which product to purchase, but instead provides quantitative information that enables the user to responsibly
Metrics to Support Informed Decision-making for Consumers of Biobased Products - 2009
11
weigh the relative merits of each biobased product being considered, or the relative merits of a biobased product versus a fossil energy-based product.
The preferred procurement program (known as the BioPreferred Program) established in the 2002 Farm Bill was to be focused on new and emerging products and markets rather than established products and markets. (14) Thus, the USDA Office of Energy Policy and New Uses (OEPNU) was required to determine for purposes of the program how to distinguish between established and new and emerging markets. USDA concluded to determine mature market status by whether a generic grouping of products had significant national market penetration in 1972. If there was not a significant national market penetration in that year, a generic grouping of products then qualifies for designation for preferred procurement. That means, for example, that cotton, woollen, silk, or linen products could not qualify for preferred procurement, although they could qualify if they were blended with an appropriate amount of a biobased material that did not have signifi cant market presence in 1972. That year coincided with the first very rapid run-up in crude oil prices in the United States which triggered renewed attention to development and production of biobased products and renewable fuels. Incidentally, the 2002 Farm Bill excluded motor vehicle fuels and electricity from the preferred procurement program, which are covered in the 1992 Energy Policy Act, the 2005 Energy Policy Act, and the 2007 Energy Independence and Security Act.
The voluntary labeling program provided for the BioPreferred Program will be built around standards and metrics similar to those used in the preferred procurement portion of the Program. It is anticipated that the labeling program will be open to all biobased products, irrespective of whether they had a significant market presence in 1972. While the voluntary labeling program is not fully developed at this point, early indications suggest it may enjoy an even warmer reception than the preferred procurement program.
Subsequent sections of this paper discuss in some depth these and other metrics USDA is using to evaluate the environmental effects of bioproduct use at a product level and at a macro level.
BEES Sustainability Indices for Biobased Products
The National Institute of Standards and Technology (NIST), an agency of the US Department of Commerce, is the U.S. national measurement institute. NIST develops unbiased, state-of-the-art measurement science that advances the Nation‟s technology infrastructure and is needed by industry to continually improve products and services. With this mission in mind, the agency began the Building for Environmental and Economic Sustainability (BEES) program in 1994, with the goal of developing a rational, systematic technique for selecting environmentally preferred, cost-effective products. The BEES software, which applies the technique to 230 building products, is in widespread use today, with more than 24,000 users in over 80 countries. (21)
The BEES approach attracted the attention of the U.S. Environmental Protection Agency‟s (EPA) Environmentally Preferable Purchasing (EPP) Program in 1997. Recognizing its applicability to all industrial products, the tool was further developed and recommended by EPP for cost-effective, environmentally preferable Federal purchasing, including biobased product purchasing. Since 2002, NIST has further developed BEES in support of the USDA BioPreferred Program.
The BEES analytical technique takes a multidimensional, life-cycle approach. That is, it considers multiple environmental and economic impacts over the entire life of a product. Considering multiple impacts and life-cycle stages is necessary because product selection decisions based on
Metrics to Support Informed Decision-making for Consumers of Biobased Products - 2009
12
single impacts or stages could obscure others that might cause equal or greater damage. In other words, a multidimensional approach is necessary for a comprehensive, balanced analysis.
It is relatively straightforward to select products based on minimum life-cycle economic impacts because products are bought and sold in the marketplace. But how does one consider environmental impacts in purchase decisions? Impacts such as global warming, water pollution, and resource depletion are for the most part economic externalities, that is, their costs are not reflected in the market prices of the products that generated the impacts. Moreover, even if there were a mandate today to include environmental “costs” in market prices, it would be nearly impossible to do so due to difficulties in assessing these impacts in economic terms. How does one put a price on clean air and clean water? What is the value of human life? Economists have debated these questions for decades, and consensus does not appear likely.
While environmental performance cannot be measured on a monetary scale, it can be quantified using the multi-disciplinary approach known as environmental life-cycle assessment (LCA). The BEES approach measures environmental performance using an LCA approach, following guidance in the International Organization for Standardization (ISO) 14040 standard for LCA. (19) An ASTM International standard for Multi-Attribute Decision Analysis also is followed in order to synthesize LCA results across multiple impacts into a single, decision-enabling environmental performance score. (3) Economic performance is measured separately using the ASTM International standard life-cycle cost (LCC) approach. (5)
Environmental Performance Measurement
Environmental life-cycle assessment is a “cradle-to-grave” system approach for measuring environmental performance. The approach is based on the belief that all stages in the life of a product generate environmental impacts and must therefore be analyzed, including raw materials acquisition, product manufacture, transportation, use, and ultimately waste management. An analysis that excludes any of these stages is limited because it ignores the full range of upstream and downstream impacts of stage-specific processes.
The strength of environmental life-cycle assessment is its comprehensive scope. Many environmental claims and strategies today are based on a single life cycle stage or a single environmental impact. A product is claimed to be “green” because it has recycled or biobased content, or is criticized for not being green because its manufacture contributes to air pollution. These single-attribute claims may be misleading because they ignore the possibility that other life-cycle stages, or other environmental impacts, may yield offsetting impacts. For example, the recycled content product may have high embodied energy content, leading to fossil fuel depletion, global warming, and acid rain impacts during the raw materials acquisition, manufacturing, and transportation life-cycle stages. LCA thus broadens the environmental discussion by accounting for shifts of environmental problems from one life-cycle stage to another, or one environmental medium (land, air, or water) to another. The benefit of the LCA approach is in implementing a tradeoff analysis to achieve a genuine reduction in overall environmental impact, rather than a simple shift of impact.
The general LCA methodology involves four steps. The goal and scope definition step spells out the purpose of the analysis and its breadth and depth. The inventory analysis step identifies and quantifies the environmental inputs and outputs associated with a product over its entire life cycle. Environmental inputs include use of water, energy, land, and other resources; outputs include releases to air, land, and water. However, it is not these inputs and outputs, or inventory flows, which are of primary interest. Of more interest are their consequences, or impacts on the environment. Thus, the next LCA step, impact assessment, characterizes these inventory flows in

Metrics to Support Informed Decision-making for Consumers of Biobased Products - 2009
13
relation to a set of environmental impacts. For example, the impact assessment step might relate carbon dioxide emissions, a flow, to global warming, an impact. Finally, the interpretation step combines the environmental impacts in accordance with the goals of the LCA study.
While this section focuses primarily on the BEES life-cycle impact assessment and interpretation approaches adopted by BioPreferred, it is important to note that rigorous, consistent life-cycle scoping and inventory analysis are critical for credible LCAs. For example, the BEES goal and scoping phase sets consistent boundaries for all product systems under study, whereby all life- cycle industrial processes that meet either mass or energy contribution criteria are included in the analysis. Some additional processes are included based on their cost contribution, even if they do not meet established mass or energy criteria, because a significant cost may indicate scarce natural resources or numerous subsidiary industrial processes potentially involving high energy consumption. For more on BEES‟ consistent scoping and inventory analysis criteria, refer to the BEES technical documentation. (21)
Life-Cycle Impact Assessment
The impact assessment step of LCA quantifies the potential contribution of a product‟s inventory flows to a range of environmental impacts. There are several well-known LCA impact assessment approaches.
Direct Use of Inventories
In the most straightforward approach to LCA, the impact assessment step is skipped, and the life cycle inventory results are used as is in the final interpretation step to help identify opportunities for pollution prevention or increases in material and energy efficiency for processes within the life cycle. However, this approach, in effect, gives the same weight to all inventory flows (e.g., carbon dioxide emissions and lead releases). For most products, equal weighting of flows is unrealistic.
Ecological Scarcity (Switzerland)
With this approach, “Eco-Points” are calculated for a product, using the “Eco-Factor” determined for each inventory flow (29). Eco-Factors are based on current annual flows relative to target maximum annual flows for the geographic area considered. The Eco-Points for all inventory flows are added together to give one single, final measure of impact. While appealing, the concept has a number of difficulties, such as being valid only in a specific geographical area, problems in estimating target flows, and that the scientific calculation of environmental impacts is inextricably combined with political and subjective judgment. The preferred approach is to separate the life-cycle impact and interpretation steps.
Environmental Priorities System (Sweden).
The Environmental Priority Strategies in Product Development System, the EPS, takes an economic approach to assessing environmental impacts. (7) The basis for the evaluation is the Environmental Load Unit, which corresponds to the willingness to pay 1 European currency unit. The final result of the EPS is a single number summarizing all environmental impacts, based on society‟s judgment of the importance of each environmental impact, its intensity, frequency, loca-tion and timing, the contribution of each flow to the impact, and the cost of decreasing each inventory flow by one weight unit. Although this methodology is popular in Sweden, its use is criticized due to its lack of transparency and the quantity and quality of the model‟s underlying assumptions.

Metrics to Support Informed Decision-making for Consumers of Biobased Products - 2009
14
Eco-Indicator 99
The Eco-Indicator 99 method is a “damage-oriented” approach to life-cycle impact assessment developed in The Netherlands. (23) It is appealing for its emphasis on simplifying the subsequent life-cycle assessment step, namely, the weighting of the relative importance of environmental impacts. To this end, a very limited number of environmental damage categories, or “endpoints,” are evaluated: Human Health, Ecosystem Quality, and Resources. Damage models are used to evaluate products in relation to these three damage categories. While the Eco-Indicator 99 method offers promise for the future, it has been criticized to date due to the many scientific assessment gaps in the underlying damage models.
Environmental Problems
The Environmental Problems approach to impact assessment was developed within the Society for Environmental Toxicology and Chemistry (SETAC). (17) It involves a two-step process:
Classification of inventory flows that contribute to specific environmental impacts. For example, greenhouse gases such as carbon dioxide, methane, and nitrous oxide are classified as contributing to global warming.
Characterization of the potential contribution of each classifi ed inventory flow to the corresponding environmental impact. This results in a set of indices, one for each impact, which is obtained by weighting each classified inventory flow by its relative contribution to the impact. For instance, the Global Warming Potential index is derived by expressing each greenhouse gas in terms of its equivalent amount of carbon dioxide heat-trapping potential.
The Environmental Problems approach does not offer the same degree of relevance for all environmental impacts. For global and regional effects (e.g., global warming and acidification), the method provides an accurate description of the potential impact. For impacts dependent upon local conditions (e.g., smog), it may result in an over simplification of the actual impacts because the indices are not tailored to localities.
BEES Impact Assessment
The Environmental Problems approach is preferred by most LCA practitioners and scientists today. For this reason, BEES uses the approach where possible. The U.S. EPA Office of Research and Development has developed TRACI (Tool for the Reduction and Assessment of Chemical and other environmental Impacts), a set of state-of-the-art, peer-reviewed U.S. life-cycle impact assessment methods that have been adopted in BEES. (33) Ten of the eleven TRACI 1.0 impacts follow the Environmental Problems approach: Global Warming Potential, Acidification Potential, Eutrophication Potential (a water-pollution indicator), Fossil Fuel Depletion, Habitat Alteration/Land Use, Criteria Air Pollutants, Human Health, Smog, Ozone Depletion, and Ecological Toxicity. Water Use is assessed in TRACI 1.0 using the Direct Use of Inventories Approach, as is Indoor Air Quality, the 12th and final BEES impact.
For a brief description of the 12 BEES environmental impacts, go to http://www.bfrl.nist.gov/oae/software/bees/scores_USDA.html. For a more detailed description, refer to the BEES technical documentation. (21)

Metrics to Support Informed Decision-making for Consumers of Biobased Products - 2009
15
Life-Cycle Interpretation
At the LCA interpretation step, the life cycle impact assessment results are evaluated. Few products are likely to dominate competing products in all BEES impact categories. Rather, one product may outperform the competition relative to fossil fuel depletion and habitat alteration/land use, fall short relative to eutrophication and ecological toxicity, and fall somewhere in the middle relative to acidification. To compare the overall environmental performance of competing products, the performance scores for all impact categories may be synthesized by weighting each impact category by its relative importance to overall environmental performance, then computing the weighted average impact score.
As part of the BioPreferred item designation process, BEES scores a product‟s environmental performance using a set of weights developed by a BEES stakeholder panel to support environmentally preferable purchasing in the United States. (15) Convened by NIST in 2006, the balanced panel of LCA experts, product manufacturers, and purchasers/users applied the ASTM International Standard for Multi-Attribute Decision Analysis to synthesize their perspectives on the relative importance of the 12 environmental impacts in BEES. The resulting weight set draws on each panelist‟s personal and professional understanding of, and value attributed to, each impact category. While the synthesized weight set may not equally satisfy each panelist‟s view of impact importance, it does reflect contemporary values in applying LCA to real-world decisions. Across all panelists and with explicit consideration of short-, medium-, and long-term time hori-zons, global warming, weighted at 29 percent, was judged most important, yet not so important that decisions can be made solely on the basis of this impact. Other important concerns include human health (13 percent) fossil fuel depletion (10 percent), criteria air pollutants (9 percent), water use (8 percent), ecological toxicity (7 percent), eutrophication (6 percent), and habitat alteration (6 percent). Also of interest are the identified impact areas of concern assigned the lowest weights: smog formation (4 percent), indoor air quality (3 percent), acidification (3 percent), and ozone depletion (2 percent). Their low weights may indicate either there is not as much immediate concern or that the remedial actions associated with the impact for the most part are underway.
To simplify decision making and facilitate biobased purchasing, BioPreferred reports BEES life-cycle environmental performance results as single scores using the BEES Stakeholder Panel weight set. For the sake of transparency and to highlight the underlying tradeoffs among impacts, BioPreferred also reports the contribution of each individual BEES impact to this score, as well as supporting detail for the two impacts judged most important, Global Warming and Human Health.

Metrics to Support Informed Decision-making for Consumers of Biobased Products - 2009
16
Economic Performance Measurement
For BioPreferred, BEES measures a product‟s economic performance using the ASTM International life-cycle cost (LCC) method. (5) Economic performance is evaluated over a fixed period (known as the study period) that begins with the purchase of the product and ends at some point in the future. Over this period, the LCC method evaluates both “first costs” and “future costs.” For consumable products for which future costs are irrelevant, the study period is set at zero and economic performance is measured on a first-cost basis alone. For durable products such as equipment and building products, the LCC study-period length depends upon the decisionmaker. For a private investor, its length is set at the period of product ownership. For society as a whole, the study-period length is often set at the useful life of the longest lived alternative in a product category.
The same study-period length is used to evaluate all products in a category to account for the fact that different products have different useful lives. For BioPreferred, BEES takes the societal perspective, setting the study period-length for most durable products at the useful life of the longest lived alternative. If an alternative lasts more than 50 years, however, the study period is limited to 50 years because technological obsolescence becomes an issue, data become too uncertain, and the farther in the future, the less important the costs. The BEES study period for biobased building products is set at 50 years.
The LCC method sums over the study period all relevant costs associated with a product. Alternative products for the same functional product category, say floor covering, can then be compared on the basis of their LCCs to determine which is the least cost means of fulfilling that function over the study period. Categories of cost typically include costs for purchase, instal-lation, operation, maintenance, repair, replacement, and disposal. A negative cost item is the residual value, or the product value remaining at the end of the study period.
The LCC method accounts for the time value of money by using a discount rate to convert all future costs to its equivalent present value. Future costs must be expressed in terms consistent with the discount rate used. There are two approaches. First, a real discount rate may be used with constant-dollar (e.g., 2007) costs. Real discount rates reflect that portion of the time value of money attributable to the real earning power of money over time and not to general price inflation. Even if all future costs are expressed in constant dollars, they must be discounted to reflect this portion of the time value of money. Second, a market discount rate may be used with current-dollar amounts (e.g., actual future prices). Market discount rates reflect the time value of money stemming from both inflation and the real earning power of money over time. When applied properly, both approaches yield the same LCC results. For BioPreferred, BEES computes LCCs using constant year dollars and that year‟s prevailing real discount rate (3 percent in 2007) mandated by the U.S. Office of Management and Budget for most Federal analyses. (37)
BEES Sustainability Indices: Value to BioPreferred
Use of the BEES approach for item designation adds value to BioPreferred for several reasons. First, BEES development and analysis by the National Institute of Standards and Technology, a non-regulatory Federal agency known for developing unbiased world-class measurement science, lends integrity to the results. Second, BEES is internally consistent with respect to underlying life-cycle costs, scoping, inventory analysis, impact assessment, and interpretation criteria, permitting fair comparisons among biobased products. Third, BEES‟ use of consensus standard guidance for life-cycle environmental and economic impact assessment permits comparisons of biobased products with traditional petroleum products because the standard measurement methods apply to all industrial products.
Metrics to Support Informed Decision-making for Consumers of Biobased Products - 2009
17
Taken together, BEES‟ integrity, internal consistency, and results comparability promote technological innovation. Its use of a performance-based approach–one that accounts for inevitable tradeoffs among the many dimensions of life-cycle environmental and economic performance, rather than one prescribing arbitrary performance thresholds on an impact-by-impact basis– levels the playing field for industry and promotes competition on a meaningful basis. In the short run, performance-based measures enable meaningful improvement by manufacturers in the emerging bioeconomy by pinpointing weak links in their products‟ life cycles (e.g., process efficiencies, transportation distances). In the long run, performance-based measurements are essential for technological innovation. If BioPreferred were to judge envi-ronmental performance solely on the basis of maximum biobased content – a single-attribute prescriptive requirement–manufacturers would be motivated to find the least-cost means of maximizing biobased content. Some may accomplish this through inferior performance on other important attributes. Prescriptive requirements inhibit innovation by restricting the choices available to manufacturers. The BEES performance-based measures, on the other hand, give manufacturers the freedom to develop products that can compete on the basis of best value, which is critical to a sustainable bioeconomy.
BEES Sustainability Indices: Looking Ahead
BEES must remain flexible to keep pace with advances in measurement science. As carbon cycling during the agricultural production and product disposal stages becomes better understood, for example, improved soil carbon measurements should be integrated into BEES life-cycle inventory databases. Furthermore, life-cycle impact assessment is an evolving science. While BEES incorporates state-of-the-art impact assessment methods today, the science will continue to evolve and methods now in use – particularly those for land use, water intake, and human health–are likely to change and improve over time. Future versions of BEES should incorporate these improved methods as they become available.
As science advances, so will the relative importance society places on environmental impacts. BioPreferred uses the 2006 BEES Stakeholder Panel importance weights to synthesize its 12 environmental impact scores into a single decision-enabling score. Similarly, the U.S. Office of Management and Budget issues annual updates to its discount rates to account for changes in the real earning power of the dollar over time. BEES uses these discount rates in its life-cycle economic performance scoring to convert future costs to their equivalent present value. As both society‟s tradeoffs and the dollar‟s earning power change over time, BEES should incorporate these values in a systematic manner; one that preserves comparability among BEES results while at the same time accommodating inevitable change.
An Example of BEES Information to Support Decision making
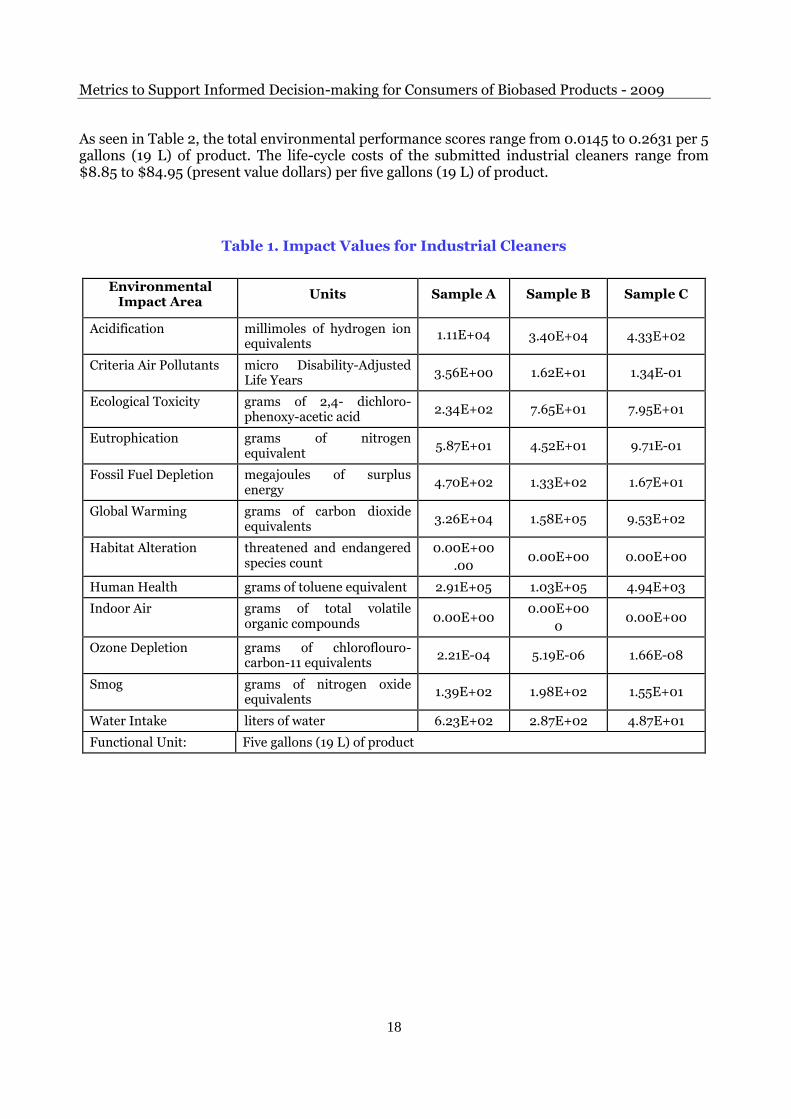
The following tables and chart illustrate the output from a BEES analysis. An analysis of the environmental and human health benefits and the life-cycle costs of three selected biobased industrial cleaners was performed using the BEES analytical tool. The environmental impact values for these three products are presented in Table 1. The environmental performance scores are presented in Table 2 and in Figure 1. The lower the values, the more preferable the product would be from an environmental and health perspective. This analytical tool can be used to compare the environmental desirability across products, as illustrated in the comparisons across the three industrial cleaners, samples A, B, and C. Note that while quantifying the uncertainty surrounding BEES results is an important future research direction, the underlying impact assessment models at present preclude such quantification.
Metrics to Support Informed Decision-making for Consumers of Biobased Products - 2009
18
As seen in Table 2, the total environmental performance scores range from 0.0145 to 0.2631 per 5 gallons (19 L) of product. The life-cycle costs of the submitted industrial cleaners range from $8.85 to $84.95 (present value dollars) per five gallons (19 L) of product.
Table 1. Impact Values for Industrial Cleaners
Environmental Impact Area
Units Sample A Sample B Sample C
Acidification millimoles of hydrogen ion equivalents
1.11E+04 3.40E+04 4.33E+02
Criteria Air Pollutants micro Disability-Adjusted Life Years
3.56E+00 1.62E+01 1.34E-01
Ecological Toxicity grams of 2,4- dichloro-phenoxy-acetic acid
2.34E+02 7.65E+01 7.95E+01
Eutrophication grams of nitrogen equivalent
5.87E+01 4.52E+01 9.71E-01
Fossil Fuel Depletion megajoules of surplus energy
4.70E+02 1.33E+02 1.67E+01
Global Warming grams of carbon dioxide equivalents
3.26E+04 1.58E+05 9.53E+02
Habitat Alteration threatened and endangered species count
0.00E+00
.00 0.00E+00 0.00E+00
Human Health grams of toluene equivalent 2.91E+05 1.03E+05 4.94E+03
Indoor Air grams of total volatile organic compounds 0.00E+00
0.00E+00
0 0.00E+00
Ozone Depletion grams of chloroflouro-carbon-11 equivalents
2.21E-04 5.19E-06 1.66E-08
Smog grams of nitrogen oxide equivalents
1.39E+02 1.98E+02 1.55E+01
Water Intake liters of water 6.23E+02 2.87E+02 4.87E+01
Functional Unit: Five gallons (19 L) of product

Metrics to Support Informed Decision-making for Consumers of Biobased Products - 2009
19
Table 2. Environmental Performance Scores for Industrial Cleaners
Environmental Impact Area Sample A Sample B Sample C
Total Environmental Performance Score1 0.2470 0.2631 0.0145
Acidification (3%) 0.0000 0.0000 0.0000
Criteria Air Pollutants (9%) 0.0017 0.0076 0.0001
Ecological Toxicity (7%) 0.0201 0.0066 0.0068
Eutrophication (6%) 0.0183 0.0141 0.0003
Fossil Fuel Depletion (10%) 0.1331 0.0377 0.0047
Global Warming (29%) 0.0369 0.1792 0.0011
Habitat Alteration (6%) 0.0000 0.0000 0.0000
Human Health (13%) 0.0238 0.0084 0.0004
Indoor Air (3%) 0.0000 0.0000 0.0000
Ozone Depletion (2%) 0.0000 0.0000 0.0000
Smog (4%) 0.0037 0.0052 0.0004
Water Intake (8%) 0.0094 0.0043 0.0007
Economic Performance (Life-cycle Costs($))2 82.00 84.95 8.85
First Cost 82.00 84.95 8.85
Future Cost (3.9%) (3) (3) (3)
Functional Unit Five gallons (19 L) of product
1 Numbers in parentheses indicate weighting factor. 2 Costs are per functional unit. 3 For this item, no significant/quantifiable performance or durability differences were identified among competing alternative products. Therefore, future costs were not calculated.

Metrics to Support Informed Decision-making for Consumers of Biobased Products - 2009
20
Figure 1
BEES Environmental Performance Scores for Industrial Cleaners
Environmental Performance Scores - Industrial Cleaners
0 0.05 0.1 0.15 0.2
Water Intake (8%)
Smog (4%)
Ozone Depletion (2%)
Indoor Air (3%)
Human Health (13%)
Habitat Alteration (6%)
Global Warming (29%)
Fossil Fuel Depletion (10%)
Eutrophication (6%)
Ecological Toxicity (7%)
Criteria Air Pollutants (9%)
Acidification (3%)
Sample A
Sample B
Sample C
Evaluating the Environmental Impacts of Biofuels Production
This section of the paper looks at the environmental effects of biofuels production and use in the United States. The discussion lays out the setting within which biofuels production is increasing and applies an analytical framework, known as GREET (Greenhouse gases, Regulated Emissions, and Energy use in Transportation) to evaluate the environmental effects of that increased production of biofuels. (2)
In recent years, the biofuels industry has experienced significant growth. The potential for continued growth of this industry in the United States, Brazil, and many countries around the world has motivated the examination of the environmental impacts associated with this expansion. (1, 20, 29) Environmental impacts due to biofuels production fall under four major categories: greenhouse gas emissions, criteria air pollutant emissions, land use changes including soil carbon impacts, and water use impacts. The U.S. Department of Energy (DOE) realizes the importance of good environmental stewardship for biofuels and is working with the U.S. Department of Agriculture, the Environmental Protection Agency, other agencies, and the private sector to examine the issue of greenhouse gas emissions impacts due to direct and indirect land use changes, as well as other factors of sustain-ability such as water use, fertilizer use, and air quality impacts. These efforts are especially important and timely since the 2007 Energy

Metrics to Support Informed Decision-making for Consumers of Biobased Products - 2009
21
Independence and Security Act establishes specific environmental goals that biofuels have to meet. DOE and the U.S. Department of State have been working to address global biofuels sustainability issues with key international partners through the Global Bioenergy Partnership (GBEP). (25) It is important to recognize that biofuels environmental impacts in the United States are vastly different from impacts in Brazil or Indonesia. This paper focuses primarily on the greenhouse gas and land use change issues being faced by the United States and will not include discussions on the water implications of biofuels.
Since these are complex issues, it is necessary to provide some context to the discussion. First, the environmental impacts associated with biofuels are dynamic and will change over time. It is anticipated that corn-based ethanol will continue to play a role in meeting the demand for liquid fuels in the United States. The existing corn ethanol industry has the potential to reduce its energy requirement and greenhouse gas emissions. In the long term, the industry is expected to transition from corn ethanol to cellulosic ethanol and other advanced biofuels. Additional reductions in greenhouse gas emissions will take place as cellulosic ethanol conversion processes and new crops for bio-diesel production, such as jatropha, enter the market. The U.S. Department of Energy is committed to the emergence of an advanced cellulosic biofuels industry, which will use agricultural wastes, forest residues, energy crops, and urban wood residues that do not compete with food. DOE estimates that in the future, with adequate research and development activities, the technically available resource base of cellulosic feedstock materials could be about 1.3 billion dry tons/year (1.2 billion t/year) in the United States (30). There are several potentially viable alternative crops that can be harvested to provide the cellulosic feedstocks needed for biorefi neries. DOE-funded screening trials have identified switchgrass as having potential for poor quality soils, thus providing a good alternative to food crops grown on valuable agriculture land. This is another key step toward developing sustainable biofuels without negative impacts to land use and food needs. (22)
The Department has announced more than $1 billion of investment over the past year, which includes 10 major cellulosic biofuels demonstration projects (which use cellulosic <emphasis="italic">versus</emphasis> food-based feedstocks) and three bioenergy centers led by major research universities and DOE‟s national laboratories, which aim to achieve transformational breakthroughs in the Nation‟s ability to produce sustainable, competitive biofuels. The DOE initiative is being matched by private sector investment in cellulosic biofuels conversion technologies.
46. Second, biofuels environmental impacts must be compared to land use and greenhouse gas impacts associated with alternative transportation sector fuels such as heavy oil, tar sands, and shale oil deposits which are very difficult and costly to extract. As conventional oil production declines, heavy oil, tar sands, and deep sea recovery of conventional oil are the frontier fuels that will provide the incremental barrels of gasoline in future years. They have significant greenhouse gas emissions consequences, land use changes due to deforestation, and ecological impacts in the ocean environment. This paper will not explore these issues, but biofuels environmental impacts cannot be considered in isolation without quantifying the consequences of the fuels they are replacing.

Metrics to Support Informed Decision-making for Consumers of Biobased Products - 2009
22
Energy Independence and Security Act of 2007
A major milestone was the recent enactment of the Energy Independence and Security Act of 2007 (EISA)2 by the U.S. Congress in December 2007. EISA mandates the production of 36 billion gallons (136 x109 L) of biofuels by 2022. Fifteen billion gallons (57 x109 L) of this amount are to be from corn-based ethanol and 21 billion gallons (80 x109 L) are to be from advanced biofuels and cellulosic feedstocks. Assuming this to be mostly ethanol which has a 67 percent energy content per gallon compared to gasoline, this translates to about 24 billion gallons (91 x109 L) on a gasoline equivalent basis per year3. It is estimated that the United States will consume about 167 billion gallons (632 x109 L) of motor gasoline in 20224. Thus, the EISA mandate will displace about 14 percent of the motor gasoline demand in 2022.
In addition, section 201 of EISA stipulates that biofuels have to meet certain greenhouse gas life cycle emissions standards to qualify as advanced biofuels and cellulosic biofuels. This section defines lifecycle greenhouse gas emissions as follows: “The term „lifecycle greenhouse gas emissions‟ means the aggregate quantity of greenhouse gas emissions (including direct emissions and significant indirect emissions such as significant emissions from land use changes), as determined by the Administrator [of the Environmental Protection Agency]5, related to the full fuel lifecycle, including all stages of fuel and feedstock production and distribution, from feedstock generation or extraction through the distribution and delivery and use of the finished fuel to the ultimate consumer where the mass values of all greenhouse gases are adjusted to account for their relative global warming potential.” This is significant because it is the first time that lifecycle emissions reduction has become a legal requirement. This provision will have significant U.S. and global ramifications and provides additional motivation to understand the emissions impacts associated with biofuels. The next section examines the key issues on this topic.
The GREET Model
The U.S. Department of Energy has sponsored the development of the GREET model at Argonne National Laboratory to conduct lifecycle emissions impact analysis of a variety of liquid transportation fuels including biofuels. A brief description of the model will be provided here and further details can be found at http://www.transportation.anl.gov.
For a given vehicle and fuel system, GREET calculates the consumption of total energy, consumption of fossil energy (petroleum, natural gas, and coal together and separately), emissions of greenhouse gases, and emissions of criteria pollutants. Greenhouse gases emissions included in GREET are: carbon dioxide (CO2), methane (CH4), and nitrous oxide (N2O). Criteria pollutants included in GREET are: volatile organic compounds (VOC), carbon monoxide (CO), nitrogen oxide (NOx), particulate matter with size smaller than 10 µm (PM10), particulate matter with size smaller than 2.5 µm (PM2.5), and sulfur oxides (SOx). Emissions of criteria pollutants are further separated into urban and total emissions. GREET calculates complete well-to-wheels
2 Full text of bill is available from http://www.thomas.gov.
3 This is because neat ethanol has an energy content of 75,700 Btu/gallon (21.3 MJ/L) (lower heating value basis) and gasoline has an energy content of 115,000 Btu/gallon (32.0 MJ/L). Conversion factors from the GREET model.
4 Energy Information Administration, Annual Energy Outlook 2008, reference case, Table 11.
5 Text in brackets added by author for clarification.

Metrics to Support Informed Decision-making for Consumers of Biobased Products - 2009
23
analysis of fuel-vehicle systems. It is developed in a user-friendly spreadsheet platform with a graphical user interface. GREET includes more than 100 fuel production pathways and more than 70 vehicle/fuel systems. These vehicle/fuel systems cover all major vehicle technologies in the market and research and development arena including: conventional spark-ignition engines, direct injection engines, compression ignition engines, hybrid electric vehicles, and fuel cell vehicles. Of the more than 100 fuel production pathways, GREET includes the following biofuels production pathways:
Corn to ethanol
Crop residues such as corn stover to ethanol
Switchgrass to ethanol
Fast growing trees such as poplars and willows to ethanol
Forest residues to ethanol
Sugarcane to ethanol
Soybeans to biodiesel via transesterification
Soybeans to renewable diesel via hydrogenation
Soybeans to renewable gasoline via hydrogenation
Corn to butanol
Cellulosic biomass (including crop residues, switchgrass, fast growing trees, and forest residues) to Fischer-Tropsch diesel via gasification
Cellulosic biomass (including crop residues, switchgrass, fast growing trees, and forest residues) to hydrogen via gasification
Figure 2 illustrates the concepts of well-to-wheels and well-to-pump. The well-to-wheels analysis in GREET covers:
feedstock extraction (crude oil extraction, or harvesting of biomass crops)
feedstock transportation (crude oil transportation from the well to the refinery, or biomass transportation from field to conversion facility)
fuel production (crude oil refining to motor gasoline and diesel, or biomass conversion to ethanol)
fuel transportation (motor gasoline transportation from refinery to dispensing pump, or ethanol transportation from conversion facility to dispensing pump), and
fuel use in vehicles (differences in combustion properties of motor gasoline and ethanol such as the lower Btu content of ethanol compared to gasoline)
Figure 3 shows the coverage of biofuels well-to-wheels analysis in GREET.

Metrics to Support Informed Decision-making for Consumers of Biobased Products - 2009
24
Figure 2
The scope of well-to-wheels and well-to-pump
Figure 3
Coverage of Well-to-Wheels Analysis of Biofuels in GREET
Selected GREET Results
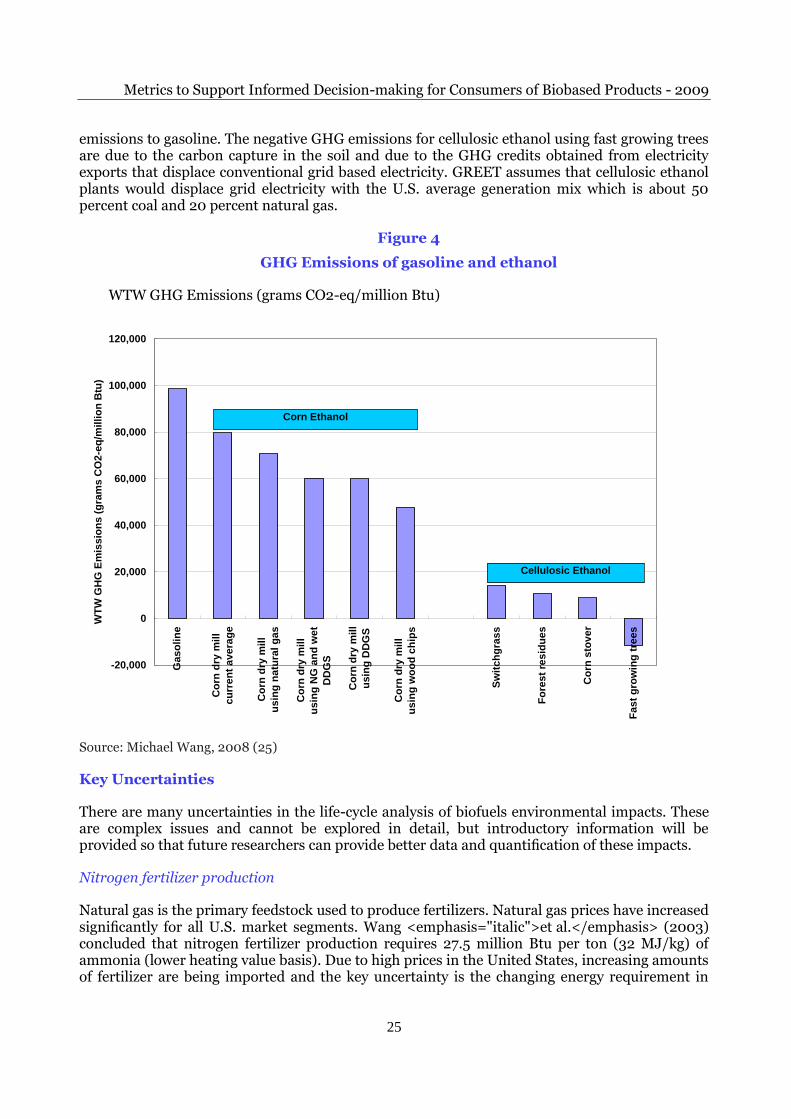
Figure 4 shows the greenhouse gas emissions associated with production of gasoline and ethanol under different assumptions. Compared to gasoline, corn ethanol has moderately lower greenhouse gas (GHG) emissions and cellulosic ethanol has significantly lower GHG emissions. For corn ethanol, key actions that can lower GHG emissions include the elimination of drying distillers dry grain solubles (DDGS) in corn ethanol plants, and the use of renewable process fuels such as wood chips and DDGS itself to provide heat and power for corn ethanol plant operation. On the other hand, corn ethanol plants using coal for heat and power may have similar GHG
Metrics to Support Informed Decision-making for Consumers of Biobased Products - 2009
25
emissions to gasoline. The negative GHG emissions for cellulosic ethanol using fast growing trees are due to the carbon capture in the soil and due to the GHG credits obtained from electricity exports that displace conventional grid based electricity. GREET assumes that cellulosic ethanol plants would displace grid electricity with the U.S. average generation mix which is about 50 percent coal and 20 percent natural gas.
Figure 4
GHG Emissions of gasoline and ethanol
WTW GHG Emissions (grams CO2-eq/million Btu)
-20,000
0
20,000
40,000
60,000
80,000
100,000
120,000
Ga
so
lin
e
Co
rn d
ry m
ill
cu
rre
nt
av
era
ge
Co
rn d
ry m
ill
us
ing
na
tura
l g
as
Co
rn d
ry m
ill
us
ing
NG
an
d w
et
DD
GS
Co
rn d
ry m
ill
us
ing
DD
GS
Co
rn d
ry m
ill
us
ing
wo
od
ch
ips
Sw
itc
hg
ras
s
Fo
res
t re
sid
ue
s
Co
rn s
tov
er
Fa
st
gro
win
g t
ree
s
WT
W G
HG
Em
iss
ion
s (
gra
ms
CO
2-e
q/m
illi
on
Btu
)
Cellulosic Ethanol
Corn Ethanol
Source: Michael Wang, 2008 (25)
Key Uncertainties
There are many uncertainties in the life-cycle analysis of biofuels environmental impacts. These are complex issues and cannot be explored in detail, but introductory information will be provided so that future researchers can provide better data and quantification of these impacts.
Nitrogen fertilizer production
Natural gas is the primary feedstock used to produce fertilizers. Natural gas prices have increased significantly for all U.S. market segments. Wang <emphasis="italic">et al.</emphasis> (2003) concluded that nitrogen fertilizer production requires 27.5 million Btu per ton (32 MJ/kg) of ammonia (lower heating value basis). Due to high prices in the United States, increasing amounts of fertilizer are being imported and the key uncertainty is the changing energy requirement in
Metrics to Support Informed Decision-making for Consumers of Biobased Products - 2009
26
foreign fertilizer plants compared to U.S. production processes. Additional data and analysis are needed to characterize the energy requirements in fertilizer plants throughout the world. GREET accounts for the energy used in producing phosphate, potash, and lime although the energy used to produce them is smaller than for nitrogen fertilizer. Furthermore, a significant amount of nitrogen fertilizer is produced from coal in China and India. As a result the use of nitrogen fertilizers in China and India has higher carbon and criteria pollutant emissions consequences than in the United States. If these two countries use nitrogen fertilizers for biofuels feedstock growth, then there will be significant environmental impacts in those countries.
N2O emissions from fertilizers
N2O is a greenhouse gas that is released from nitrogen fertilizers applied on the soil through processes of nitrification and denitrification. This is referred to as direct N2O emissions. N2O can also be produced as a result of volatilization of nitrate compounds from soil to the air and through leaching and runoff of nitrate into water streams. This is referred to as indirect N2O emissions. To estimate total N2O emissions, one needs to know the input amount of nitrogen and the conversion rate of nitrogen into N2O. In the United States, it is estimated that about 5 ounces of nitrogen/bushel (4 030 g/m3) of corn harvested is left on the soil each year as a result of the above-ground and below-ground biomass that remains after a corn harvest cycle (24). In addition, the nitrogen fertilizer itself results in the addition of about 420 grams of nitrogen/bushel (11 919 g/m3) of corn to the soil for a total of 560 grams nitrogen/bushel (15 891 g/m3) of corn (142 + 420) (24). These estimates have a relatively small amount of variation depending on the condition of the soil, soil management practices such as no-till harvesting, weather, price of the fertilizer, and other factors. The GREET model uses these values as U.S. national averages. There is much greater uncertainty with respect to the conversion rate of nitrogen into N2O. GREET uses a conversion rate of 1.3 percent for both direct and indirect N2O emissions (24), which is recommended by the Intergovernmental Panel on Climate Change (IPCC). Further empirical evidence and data are needed to clarify N2O conversion rates and the factors that cause those rates to change.
Figure 5 shows the historical trend in nitrogen application rate for corn farming in the United States. The declining use of nitrogen fertilizer is primarily due to the use of better seed varieties and better farming practices. As mentioned above, high natural gas prices have resulted in high nitrogen fertilizer prices, and this has provided a financial incentive to farmers to more efficiently manage their nitrogen input. This trend is expected to continue as natural gas prices are expected to remain high in the foreseeable future. There is a tradeoff between nitrogen fertilizer application and yield, although to some extent that relationship has been altered due to the use of better seed varieties. Therefore, the key uncertainty is the extent to which nitrogen can be reduced before impacting productivity. Besides the benefit of reduced N2O emissions from corn fields, reduced nitrogen fertilizer applications will decrease nitrate runoff into surface and underground waters.

Metrics to Support Informed Decision-making for Consumers of Biobased Products - 2009
27
Figure 5: U.S. Corn Nitrogen Consumption Trend
COMMERCIAL NITROGEN APPLIED PER BUSHEL OF CORN PRODUCED
1980 - 2006 ACTUAL & TREND TO 2030
0.00
0.20
0.40
0.60
0.80
1.00
1.20
1.40
1.60
1.80
1980 1985 1990 1995 2000 2005 2010 2015 2020 2025 2030
Source: Blue, Johnson & Associates, Inc.
Pounds per Bushel
Actual
Trend
CO2 emissions from lime
Lime (calcium carbonate or CaCO3) is applied every few years in fields to increase the pH of acidic soils to the 6.5 pH to 7.0 pH levels that are necessary for corn growth. The calcium carbonate is converted to calcium oxide (CaO) and CO2. GREET assumes a lime application rate of 42.3 ounces/bushel (34 053 g/m3) of corn and CO2 emissions from lime conversion in corn fields accounts for about 4% of the total greenhouse gas emissions for corn-based ethanol.
Energy use for corn farming
The GREET model uses an estimate of 22,500 Btu/bushel (674 MJ/m3) of corn to represent
direct fuel use on corn farms. This estimate includes diesel and gasoline for powering the farm equipment, liquefied petroleum gas and natural gas for drying the corn and for other farming operations, and electricity for irrigation (24). The breakdown of energy use is assumed to be as follows: diesel fuel 38 percent, natural gas 22 percent, LPG 19 percent, gasoline 12 percent, and electricity 9 percent.
Energy used in ethanol plants
Dry mill ethanol plants in the United States get their heat primarily from natural gas. Typically, feedstock costs are the biggest expense and process fuel costs are the second largest expense in ethanol plants. Due to recently high natural gas prices, new plant designs are being developed that will reduce process fuel requirements or use alternative fuels including biomass for heat and power needs. An evaluation has been done of the energy use of different ethanol plant types and the consequent greenhouse gas emissions results. This evaluation shows that, on average, corn

Metrics to Support Informed Decision-making for Consumers of Biobased Products - 2009
28
dry mill plants use 26,420 Btu/gallon (7.36 MJ/L) of natural gas, 8,900 Btu/gallon (2.48 MJ/L) of coal, and 0.88 kWh/gallon of electricity (0.84 MJ/L) (24).
Due to the concern over high natural gas prices, new ethanol plants under construction or in the planning phases are anticipated to be much more energy efficient and have the option to use a broader array of fuels. Options being considered include higher efficiency natural gas systems, selling wet distillers DDGS to nearby animal farms, and considering alternative fuels (such as combusting DDGS, gasifying wood chips, or using coal) to provide heat and power. It is estimated that about 30 percent of the thermal energy used in dry mills is consumed by the dryers to dry DDGS to about 10 percent moisture content for long-distance transportation and long shelf life. Wood chips are a potential process fuel for corn ethanol plants. Two corn ethanol plants in Minnesota are adding wood chip gasifiers to produce synthesis gas. The synthesis gas can then be used as a direct heat source or it can be combusted through turbines to provide electricity.
Distillation consumes 50 percent of the energy in a corn dry mill plant. After fermentation, the water-ethanol slurry has only about 5 percent alcohol and needs to be distilled through a series of energy- intensive steps to become pure alcohol. New membrane-separation techniques with hydrophilic membranes are becoming established. These could reduce energy consumption of the distillation steps by up to 60 percent, reducing the total plant energy consumption by 30 percent. Other supersonic steam injection techniques could significantly improve the yield, further reducing the energy consumption per unit of corn feedstock. Table 3 shows the energy used in typical U.S. corn dry mill ethanol plants.
Table 3. Energy use in new corn dry mill ethanol plants
Plant type Natural gas (Btu/gallon)
(MJ/L)
Coal (Btu/gallon)
(MJ/L)
Renewable fuel (Btu/gallon)
(MJ/L)
Electricity (kWh/gallon)
(MJ/L)
Dry mill using natural gas producing dry DDGS
33,330
(9.28)
None None 0.75
(0.71)
Dry mill using natural gas producing wet DDGS
21,830
(6.08)
None None 0.75
(0.71)
Dry mill using coal producing dry DDGS
None 40,260
(11.22)
None 0.90
(0.86)
Dry mill using coal producing wet DDGS
None 26,060
(7.26)
None 0.90
(0.86)
Dry mill using wood chips producing dry DDGS
None None 40,260
(11.22)
0.90
(0.86)
Dry mill using DDGS as fuel and producing dry DDGS
None None 40,260
(11.22)
0.75
(0.71)
Metrics to Support Informed Decision-making for Consumers of Biobased Products - 2009
29
Accounting for co-products
Distillers dry grain solubles (DDGS) is a byproduct of corn dry mills. In 2007, the U.S. ethanol industry produced 14.6 million metric tons of DDGS (dry mills produce 16 pounds (7.3 kg) of DDGS per bushel of corn). Currently, DDGS is being used as animal feed. However, new applications for DDGS are being developed, including their potential use as a chemical intermediate platform. These chemical intermediates can be used in pharmaceuticals, paints, polymers, coatings, and other industrial materials [National Corn Growers Association]. GREET accounts for the animal feed value of DDGS when calculating the net greenhouse gas emissions from corn ethanol production. This is done by using the displacement method where energy use and emissions associated with the production of conventional animal feeds are estimated and are treated as credits for DDGS. GREET also assumes that approximately 1 pound (0.45 kg) of corn and 0.8 pound (0.36 kg) of soybean meal are displaced by a pound of DDGS. As corn ethanol expands in the U.S. DDGS would have to be used in additional markets that are further away from animal feedlots. DDGS currently has a limited shelf life, although research is being done to improve this and other characteristics which would allow DDGS to be shipped across the country and into export markets. As Figure 6 shows, U.S. exports of DDGS have increased dramatically in the last few years due to these advances and the demand from overseas markets for the animal feed value of DDGS.
Land use change and resulting CO2 emissions
Two types of land use changes can occur as a result of biofuels production: direct land use change and indirect land use change. Direct land use change is the conversion of agriculturally productive cropland and other crop types from existing crop farming or non-crop growth to a biofuels feedstock. An example of direct land use change would be the conversion of U.S. cropland previously devoted to soybean into corn or pasture land into corn fields. A limited amount of analysis has been done to quantify direct land use changes due to corn ethanol and cellulosic ethanol production in the U.S. Better data are needed to empirically quantify the impacts of direct land use change. USDA conducted a detailed simulation of the potential land use changes that could occur for a 4-billion-gallon (15 x109 L) per year corn ethanol industry. Based on that simulation, the GREET model incorporates a soil carbon emission factor of 195 grams CO2/bushel (5534 g CO2/m3) of corn to account for direct land use change. The corn ethanol industry today is producing about 6.5 billion gallons (25 x109 L) per year of ethanol and is projected to grow to 15 billion gallons (57 x109 L) per year by 2015, according to the Energy Independence and Security Act (EISA). The cellulosic ethanol industry is projected to grow from near zero today to 16 billion gallons (60.6 x10⁹ L) per year by 2022, according to EISA. Better data and emissions factors are needed to correspond to present-day and future market realities.

Metrics to Support Informed Decision-making for Consumers of Biobased Products - 2009
30
Figure 6
U.S. DDGS Exports: 1997-2007
US DGS Export: 1000 MT/Yr 3,500
US DGS Export: 1000 MT/Yr
0
500
1,000
1,500
2,000
2,500
3,000
3,500
1997 1998 1999 2000 2001 2002 2003 2004 2005 2006 2007
Source: ProExporter Network
Indirect land use change is the second order impact on land use that may occur as a result of direct land use changes. An example of indirect land use change can be constructed from the soybean to corn situation cited above. Due to the reduction in U.S. soybean land (occurring as a result of the direct impact of increasing corn production), if other countries begin devoting additional land to soybeans to meet world demand, the second order land conversion effect is referred to as indirect land use change. Indirect land use change can also occur if additional demand for corn due to ethanol demand in the United States results in a reduction in U.S. corn exports. The reduction in U.S. corn exports results in a conversion of land in other countries to corn cultivation as they attempt to meet global corn demand. Under this circumstance, the incremental land in other countries being converted to corn is considered to be an indirect land use effect.
Indirect land use change is much more difficult to assess. No thorough, comprehensive simulation of potential land use change due to increasing biofuels production has been done yet. An analytically rigorous simulation of indirect land use change would require the construction of a time dependent general equilibrium model that takes into account supply and demand of agricultural commodities, existing and future land use patterns, and the impact of biofuels on fossil fuel displacement. A global model would have to be constructed that can depict trade in biofuels, agricultural commodities, and fossil fuels. The soil carbon content and vegetative carbon content of different lands, including forests, would have to be quantified in this model. Several efforts are underway in the United States and Europe to analytically address the indirect land use issues. It should be recognized that this is not a simple task and the complicating factors mean

Metrics to Support Informed Decision-making for Consumers of Biobased Products - 2009
31
that careful data collection, reasonable assumptions, and appropriate methodologies need to be used to generate credible results. Indirect land use does not lend itself to a rough calculation. In the United States, tool development activities are being led by the U.S. Environmental Protection Agency, the U.S. Department of Energy, the California Air Resources Board, and the U.S. Department of Agriculture. European countries including United Kingdom, Germany, and France are also studying this issue. (10) U.S. agencies are working through the U.S. Department of State and the Global Bioenergy Partnership (GBEP) to coordinate these activities and share information and results. (9) Results from these activities should become available towards the end of 2008.
Figure 7
Projected U.S. Corn Yield Increases
AVERAGE CORN YIELDS WITH MARKER ASSISTED BREEDING
AND 4% PER YEAR TECHNOLOGY BUMPS IN 2015-2020
0.0
50.0
100.0
150.0
200.0
250.0
300.0
350.0
1975 1980 1985 1990 1995 2000 2005 2010 2015 2020 2025 2030
Bushels per Acre
Actual Corn Yield
Trend 90-06
Marker Assisted Breeding
Technology Bumps 4%
Source: Actual Corn Yield, USDA
Source: Actual Corn Yield, USDA
One of the key issues in the land use change area is the anticipated changes in agricultural productivity in future years. Figure 7 shows the historically observed increases in corn yield seen in the United States and represents one scenario for yield growth in future years. Average corn yield in the United States in 2006 was about 149 bushels/harvested acre (9.35 t/ha) with wide variability, depending on soil conditions and climate [USDA, 2007]. Yields ranged from 72 bushels/harvested acre (4.52 t/ha) in Alabama to 166 bushels/ harvested acre (10.42 t/ha) in Iowa.
The United States is the largest corn producer in the world. China is the next largest corn producer and productivity there is 84 bushels/harvested acre (5.29 t/ha), only about 56 percent of the U.S. corn yield. Brazil is the third largest corn producer in the world and average productivity there is 51 bushels/harvested acre (3.23 t/ha), only 35 percent of the U.S. yield.

Metrics to Support Informed Decision-making for Consumers of Biobased Products - 2009
32
Figure 8 shows the variation in corn productivity among different countries. This underscores the importance of potential for yield growth not only in the United States but for corn producers all over the world. Average yield in the United States could approach 290 bushels/harvested acre (18.2 t/ha) by 2030. As corn prices increase, there would be greater incentives for farmers around the world to provide nutrients and improve productivity. As Figure 8 illustrates, there is significant potential for productivity growth in Argentina, China, Ukraine, South Africa, Brazil, Mexico, and India. The implication is that additional corn could be produced from the same amount of land, thereby mitigating direct and indirect land-use change impacts.
Sustainability Considerations
Sustainability criteria are being developed or are looked at around the globe in the hope that biofuels can bring environmental benefits along with other benefits such as rural development or energy security. The differences in sustainability criteria between countries and established Roundtables on Sustainable Palm Oil (RSPO) and on Sustainable Biofuels (RSB) are described by Pinto (27) and summarized in Table 4. The complexity of the schemes and their differences raise concerns, as they could end up being trade barriers and could add to the cost of producing biofuels.
Figure 8
International Corn Yields
0
1
2
3
4
5
6
7
8
9
10
US Canada EU Argentina China Ukraine South Africa Brazil Mexico India
Yie
ld (
metr
ic t
on
nes/h
a)
Source: USDA, National Agricultural Statistics Service. (35)
The assessment of the overall impacts of biofuels (as well as petroleum derived fuels) is still a work in progress. The recent publication of articles on the carbon balance of biofuels has identified the effect of land use change (LUC) on the net carbon balance – primarily for corn-

Metrics to Support Informed Decision-making for Consumers of Biobased Products - 2009
33
based ethanol and soy-based biodiesel. Even if the annual harvest of material is used to offset fossil carbon use, the carbon dioxide offset will be negative until the debt caused by the carbon emissions of LUC is repaid (11, 32). LUC takes many forms and can include a minimal change in the case of fallow lands that are depleted or without much vegetation or a large change if a mature forest is replaced by an annual crop. (31, 36)
One paper (33) analyzed the impacts of the rapid biofuels expansion with models that simulate and project future food, feed, and biofuel production for a few scenarios. Included in the models used in this one scenario are global direct and indirect LUC parameters, which assess how food production will be relocated around the world to accommodate biofuels production from food crops. These LUC parameters are currently being extensively researched, but are not yet well established or validated, leading to significant confusion regarding actual impacts of biofuels production. The authors‟s precautionary conclusion from this scenario was that biofuels are detrimental to reductions of greenhouse gas (GHG) as renewable alternatives to fossil fuel use in transportation in a 30-year carbon debt repayment period. The IPCC accounting framework uses a 100-year carbon debt repayment period and there are carefully researched scenarios for forest substitution for biodiesel crops that give net GHG reductions (28). DOE is currently conducting a full life-cycle assessment on the impacts of EISA. Results should be available in 2009.
The sustainability of biofuels and their effect on world food markets are being questioned. Advances in lignocellulosic biofuels technologies and partnerships between the public and private sector are vastly improving the sustainability of biofuels. While the rapid increase in biofuels has contributed to higher food prices, other factors, including high food demand in developing countries; record-high prices of fossil fuels; reduced grain reserves; speculation in financial markets; and weather-related crop shortfalls have also contributed to higher food costs. It is important that research, development, and demonstration (RD&D) be vigorously pursued worldwide for both food and energy crops to address the sustainability and cost of each.
Conclusion
U.S. consumers have evidenced growing demand for the purchase and use of green and biobased products. However, too often environmental effects of these products–and even the biobased content–have not been well documented.
In addition, U.S. policymakers, in response to rapidly rising fossil energy prices in recent years, have instituted policy frameworks that are serving to greatly increase the amount of biofuels and biobased products produced and consumed in the country. Increasingly, policymakers and consumers are calling for reliable analytical techniques to evaluate both the biobased content and the environmental effects of the use of these biobased products.
The analytical methods discussed in this paper represent significant progress in the efforts to reliably evaluate biobased content of products and the environmental effects of the production of biobased feedstocks, manufacture of products, use of biobased industrial products and motor fuels, and final disposal of the products. The analytical techniques discussed in this paper represent conceptual breakthroughs in evaluating such products on a cradle-to-grave basis, thus providing a much clearer understanding of the overall environmental effects, and the underlying tradeoffs among effects, of the production and use of these products.
It is hoped that the U.S. experience in developing and using such life-cycle evaluative techniques will prove helpful to policy makers and consumers both within the United States and in other countries.

Metrics to Support Informed Decision-making for Consumers of Biobased Products - 2009
34
REFERENCES
1. Alexander Farrell, Richard Plevin, Brian Turner, Andrew Jones, Michael O‟Hare, Daniel Kammen, “Ethanol Can Contribute to Energy and Environmental Goals”, Science, http://www.sciencemag.org, January 27, 2006.
2. Argonne National Laboratory, GREET Model and documentation, http:// www.transportation.anl.gov/software/GREET.
3. ASTM International, Standard Practice for Applying the Analytic Hierarchy Process to Multiattribute Decision Analysis of Investments Related to Buildings and Building Systems, ASTM Designation E1765-02, West Conshohocken, PA, 2002.
4. ASTM International, Test Methods for Determining the Biobased Content of Natural Range Materials Using Radiocarbon and Isotope Ratio Mass Spectrometry Analysis, ASTM Designation D6866, West Conshohocken, PA, 2005.
5. ASTM International, Standard Practice for Measuring Life-Cycle Costs of Buildings and Building Systems, ASTM Designation E917-05, West Conshohocken, PA, 2005.
6. awea.org, American Wind Energy Association, “Wind Power Outlook 2007” and “Legislative Affairs,” accessed 1-24-08.
7. B. Steen, A Systematic Approach to Environmental Priority Strategies in Product Development (EPS). Version 2000, CPM Report 1999:4 and 5, CPM, Chalmers University, Göteborg 1999.
8. Business Week, “How Green Is That Gizmo?,” December 31, 2007/ January 7, 2008, p. 36.
9. David Tillman, Jason Hill, and Clarence Lehman, “Carbon-Negative Biofuels from Low-Input High-Diversity Grassland Biomass”, Science, http://www.sciencemag.org, December 8, 2006.
10. European Commission, Joint Research Center, http://ies.jrc.cec.eu.int/ wtw.html.
11. Fargione, J.; Hill,J.; Tilman, D.; Polasky, S.; Hawthorne, P. (2008). “Land Clearing and the Biofuel Carbon Debt.” Science 319(5867): 1235-1238.
12. Farm Security And Rural Investment Act of 2002, Public Law 107-171-May 13, 2002, Section 9001.
13. Farm Security And Rural Investment Act of 2002, Public Law 107-171-May 13, 2002, Section 9002.
14. Farm Security And Rural Investment Act of 2002, Public Law 107-171-May 13, 2002, House Report 107-424, Title IX Energy, 3. Federal Procurement of Biobased Products.

Metrics to Support Informed Decision-making for Consumers of Biobased Products - 2009
35
15. Gloria, T.G., Lippiatt, B.C., and Cooper, J., “Life Cycle Impact Assessment Weights to Support Environmentally Preferable Purchasing in the United States,” Environmental Science and Technology, November/ December 2007.
16. Global Bioenergy Partnership, http://www.globalbioenergy.org.
17. Guinée et al., LCA -An operational guide to the ISO-standards, CML, Leiden, The Netherlands, 2001; SETAC-Europe, Life Cycle Assessment, B. DeSmet, <emphasis="italic">et al.</emphasis> (eds), 1992; SETAC, A Conceptual Framework for Life Cycle Impact Assessment, J. Fava, <emphasis="italic">et al.</emphasis> (eds), 1993; and SETAC, Guidelines for Life Cycle Assessment: A “Code of Practice”, F. Consoli, <emphasis="italic">et al.</emphasis> (eds), 1993.
18. http://www.bfrl.nist.gov/oae/software/bees/ (see BEES for USDA).
19. International Organization for Standardization (ISO), Environmental Management--Life-Cycle Assessment--Principles and Framework, International Standard 14040, 2006.
20. Jason Hill, Erik Nelson, David Tillman, Stephen Polasky, and Douglas Tiffany, “Environmental, Economic, and Energetic Costs and Benefi ts of Biodiesel and Ethanol Biofuels”, Proceedings of the National Academy of Sciences, Vol. 103, No. 30, http://www.pnas.org, July 25, 2006.
21. Lippiatt, B.C., BEES 4.0: Building for Environmental and Economic Sustainability Technical Manual and User Guide, NISTIR 7423 (Gaithersburg, MD: National Institute of Standards and Technology, May 2007). Software available at www.bfrl.nist.gov/oae/software/bees.
22. Lynn Wright, Historical Perspective on How and Why Switchgrass was Selected as a “Model” High-Potential Energy Crop, prepared for the U.S. Department of Energy, ORNL/TM-2007/109, Oak Ridge National Laboratory, Oak Ridge, TN, July 2007.
23. M. Goedkoop and R. Spriensma, The Eco-indicator‟99: A Damage Oriented Method for Life Cycle Impact Assessment, VROM Zoetermeer, Nr. 1999/36A/B, 2nd edition, April 2000.
24. M. Q. Wang, M. Wu, and H. Hong, “Life-Cycle Energy and Greenhouse Gas Emission Impacts of Different Corn Ethanol Plant Types,” Environmental Research Letter, 2:024001, 2007.
25. M. Q. Wang, “Well-to-Wheels Energy and Greenhouse Gas Emissions Results and Issues of Fuel Ethanol”, paper presented at Farm Foundation Workshop The Lifecycle Carbon Footprint of Biofuels, http://www.farmfoundation.org/projects/08-22LifecycleCarbonFootprintBiofuels.htm, January 2008.
26. Paul C. Westcott, Ethanol Expansion in the United States: How Will the Agricultural Sector Adjust?”, Economic Research Service, U.S. Department of Agriculture, Washington, DC, FDS-07D-01, May 2007.
27. Pinto, M.S. Global: Biofuels Sustainability Criteria, Special Biofuels Report, Global Biofuels Center, http://www.ifqcbiofuels.org/.

Metrics to Support Informed Decision-making for Consumers of Biobased Products - 2009
36
28. Reinhardt, G., N.; Rettenmaier, <emphasis="italic">et al.</emphasis> (2007). Rain Forest for Biodiesel? Ecological effects of using palm oil as a source of energy. Frankfurt am Main, WWF Germany: 52, http://www.wwf.de/fi leadmin/fm-wwf/pdf_ neu/wwf_palmoil_study_english.pdf, retrieved May 2008.
29. R. Frischknecht et. al, “Swiss Ecological Scarcity Method: The New Version 2006,” Berne, Switzerland, 2006.
30. Robert Perlack, Lynn Wright, Anthony Turhollow, Robin Graham, Bryce Stokes, and Don Urbach, Biomass as Feedstock for Bioenergy and Bioproducts Industry: the Technical Feasibility of a Billion-Ton Annual Supply, prepared for the U.S. Department of Energy and the U.S. Department of Agriculture, ORNL/TM-2005/66, 26. 26. 26 http://www1.eere.energy.gov/biomass/publications.html, Oak Ridge National Laboratory, Oak Ridge, TN, April 2005.
31. Schlamadinger, B. and G. Marland (1996). “The role of forest and bioenergy strategies in the global carbon cycle.” Biomass and Bioenergy 10(5-6): 275-300.
32. Searchinger, T.; Heimlich, R.; Houghton, R.; Dong, F.; Elobeid, A.; Fabiosa, J.; Tokgoz, S.; Hayes, D.; Yu, T. (2008). “Use of U.S. Croplands for Biofuels Increases Greenhouse Gases Through Emissions from Land Use Change.” Science 319(5867): 1238-1240.
33. U.S. Environmental Protection Agency, Tool for the Reduction and Assessment of Chemical and Other Environmental Impacts (TRACI): User‟s Guide and System Documentation, EPA/600/R-02/052, U.S. EPA Office of Research and Development, Cincinnati, OH, August 2002.
34. U.S. Office of Management and Budget (OMB) Circular A-94, Guidelines and Discount Rates for Benefi t-Cost Analysis of Federal Programs, Washington, DC, October 27, 1992 and OMB Circular A-94, Appendix C, Washington, DC, January 2007.
35. U.S. Department of Agriculture, Agricultural Statistics 2007, http://www. nass.usda.gov/Publications/Ag_Statistics/2007/index.asp, 2007.
36. Watson, R. T., I. R. Noble, et al., Eds. (2000). Land Use, Land-Use Change, and Forestry, Cambridge University Press.
37. www.usda.gov/biopreferred