metro holdings limited - links.sgx.com · metro city metro tower bay valley shanghai shama century...
TRANSCRIPT

METRO HOLDINGS LIMITED FY2019 RESULTS PRESENTATION 28 MAY 2019

CONTENTS ● About Metro
● Property Investment & Development
● Investment Portfolio
● Property Development
● Recent Investments in FY2020
● Retail Operations
● Financial Highlights
● Growth Strategies
● Market Outlook
2

About Metro
2

Who We Are
Metro Holdings was founded in 1957 by the late Mr. Ong Tjoe Kim as a textile store and has been listed on SGX-ST since 1973. Over the years, under the leadership of the late Mr. Jopie Ong, Metro has evolved into a property investment and development group, backed by an established retail track record, with strong presence in Singapore, China, Indonesia and the United Kingdom.
4

Our International Presence China
Shanghai Metro City Metro Tower Bay Valley Shanghai Shama Century Park Shanghai Plaza Guangzhou GIE Tower Chengdu The Mall, part of The Atrium
Indonesia . Trans Park Juanda, Bekasi Trans Park Bintaro 11 Metro Stores in Jakarta/ Bandung/Makassar/Surabaya/ Solo/Manado
Singapore . The Crest at Prince Charles Crescent Tampines Grande
3 Metro Stores
United Kingdom London 5 Chancery Lane Manchester Middlewood Locks Milliners Wharf The Hat Box Sheffield Sheffield Digital Campus
As at 28 May 2019
Legend Properties Commercial Malls Residential Mixed-use Development Retail Retail Stores
5

2
Property Investment & Development

Property Portfolio Investment Properties
(1)As at 31 March 2019
7
GIE Tower, Guangzhou, China
Metro City, Shanghai, China
Metro Tower, Shanghai, China
5 Chancery Lane, London, UK
Type of Development Commercial Retail Commercial Commercial
Key Project Description
Part of a 7-storey shopping podium &
35-storey office
Lifestyle entertainment centre directly linked
to MRT
Grade-A office spread across 26 floors (annex
to Metro City)
Office building located in Midtown
Central London
% owned by Group 100% 60% 60% 50%
Tenure 50-yr term from 1994 36-yr term from 1993 50-yr term from 1993 Freehold
Site Area Strata-Titled 15,434 sqm 4,933 sqm 0.487 acres
Lettable Area 28,390 sqm 38,391 sqm 40,349 sqm 7,882 sqm
Occupancy Rate(1) 94.2% 99.7% 98.3% 100%
Valuation (100%)(1) S$112 million S$199 million S$235 million S$141 million
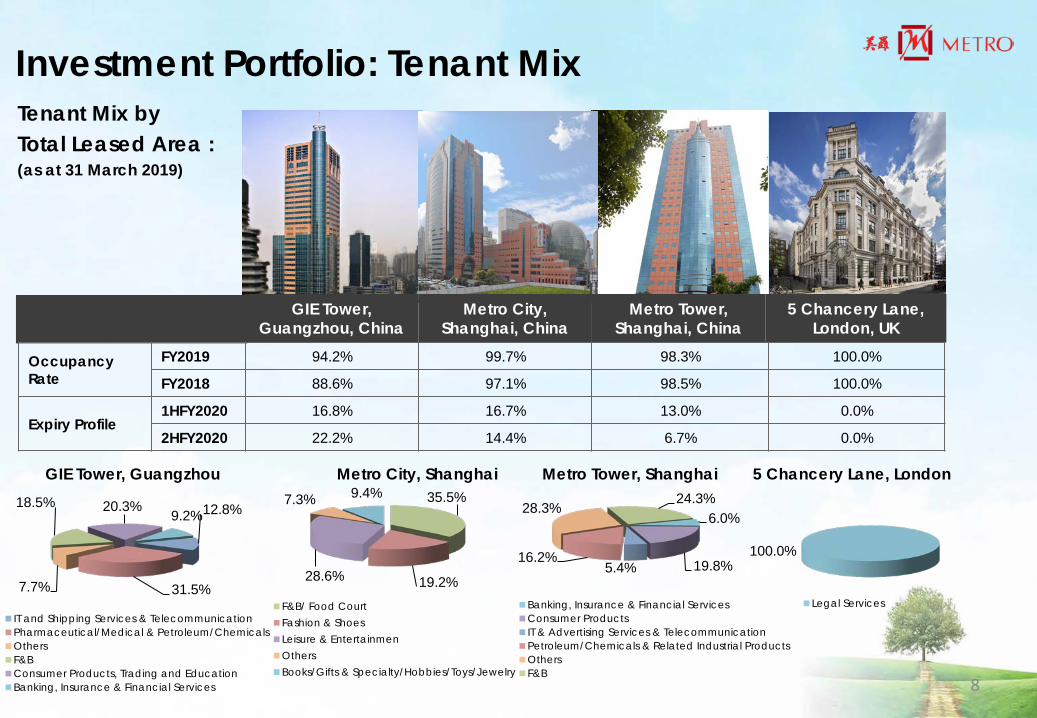
35.5%
19.2% 28.6%
7.3% 9.4%
F&B/ Food CourtFashion & ShoesLeisure & EntertainmenOthersBooks/Gifts & Specialty/Hobbies/Toys/Jewelry
Tenant Mix by Total Leased Area : (as at 31 March 2019)
Investment Portfolio: Tenant Mix
GIE Tower, Guangzhou, China
Metro Tower, Shanghai, China
Metro City, Shanghai, China
Metro City, Shanghai Metro Tower, Shanghai
6.0%
19.8% 5.4% 16.2%
28.3% 24.3%
Banking, Insurance & Financial ServicesConsumer ProductsIT & Advertising Services & TelecommunicationPetroleum/Chemicals & Related Industrial ProductsOthersF&B
5 Chancery Lane, London, UK
5 Chancery Lane, London
100.0%
Legal Services
12.8%
31.5% 7.7%
18.5% 20.3% 9.2%
IT and Shipping Services & TelecommunicationPharmaceutical/Medical & Petroleum/ChemicalsOthersF&BConsumer Products, Trading and EducationBanking, Insurance & Financial Services 8
GIE Tower, Guangzhou
Occupancy Rate
FY2019 94.2% 99.7% 98.3% 100.0%
FY2018 88.6% 97.1% 98.5% 100.0%
Expiry Profile 1HFY2020 16.8% 16.7% 13.0% 0.0%
2HFY2020 22.2% 14.4% 6.7% 0.0%

Property Portfolio Development Properties
(1) GFA refers to Gross Floor Area (2) GDV refers to Gross Development Value (3) 100% land cost for project (4) 100% purchase consideration
The Crest, Prince Charles Crescent, Singapore
Trans Park Juanda, Bekasi, Jakarta, Indonesia
Trans Park Bintaro, Jakarta, Indonesia
Type of Development Residential Residential Residential
% owned by Group 40% 90% 90%
Key Project Description
469 units with total GFA(1) of 50,854 sqm
5,622 units with total GFA(1) of 162,754 sqm
Five 32-storey residential towers within a mixed development
2 residential towers comprising 1,400 apartment and 170 SoHo units with total GFA(1) of 61,619
sqm
Site Area 23,785 sqm 4.5 hectares n.a.
GDV(2)/Valuation (100% basis) S$516.3 million(3) IDR1.99 trillion(4) IDR1.33 trillion(4)
Current Status >85% sold Bekasi mall has opened and apartment sales are underway
Piling complete, super structural work and apartment
sales are underway
9
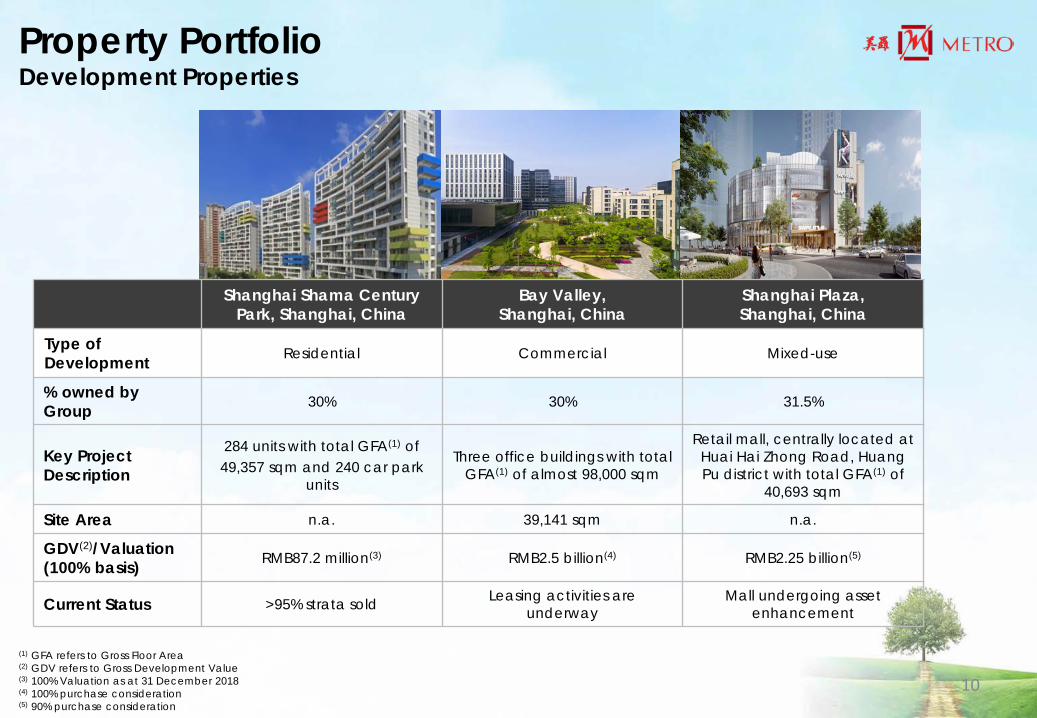
Property Portfolio Development Properties
(1) GFA refers to Gross Floor Area (2) GDV refers to Gross Development Value (3) 100% Valuation as at 31 December 2018 (4) 100% purchase consideration (5) 90% purchase consideration
Shanghai Shama Century Park, Shanghai, China
Bay Valley, Shanghai, China
Shanghai Plaza, Shanghai, China
Type of Development Residential Commercial Mixed-use
% owned by Group 30% 30% 31.5%
Key Project Description
284 units with total GFA(1) of 49,357 sqm and 240 car park
units
Three office buildings with total GFA(1) of almost 98,000 sqm
Retail mall, centrally located at Huai Hai Zhong Road, Huang Pu district with total GFA(1) of
40,693 sqm
Site Area n.a. 39,141 sqm n.a.
GDV(2)/Valuation (100% basis) RMB87.2 million(3) RMB2.5 billion(4) RMB2.25 billion(5)
Current Status >95% strata sold Leasing activities are underway
Mall undergoing asset enhancement
10

Milliners Wharf The Hat Box, Manchester, UK
Middlewood Locks, Manchester, UK
Sheffield Digital Campus, Sheffield, UK
Type of Development Residential Mixed-use Commercial
% owned by Group 25% 25% 50%
Key Project Description
Phase 1 sold (144 apartments );
Phase 2 (~60 apartments)
2,215 units and commercial space including offices, hotel, shops, restaurants and a gym
with total GFA(1) of 222,967 sqm
Two office buildings with total GFA(1) of 12,191 sqm
Site Area 1.06 acres 24 acres 1.03 acres
GDV(2)/Consideration (100% basis) n.a. £700 million(2) £40 million(2)
Current Status Planning for Phase 2 underway
Phase 1: 571 units completed and being handed over;
277 units in Phase 1 and all 546 units in Phase 2 sold to Get
Living, a UK private rented sector venture
Acero Works (7,460 sqm) sold in May 2018; Development works are now focused on Vidrio House (4,731 sqm)
Property Portfolio Development Properties
(1) GFA refers to Gross Floor Area (2) GDV refers to Gross Development Value (3) 100% purchase consideration
11
Recent Investments In FY2020 (Post March 2019)
2

7 & 9 Tampines Grande, Singapore
Description
Two blocks of premium Grade-A eight-storey office towers with retail and F&B on the ground floor, BCA Green Mark
Platinum and LEED® Gold Certified
% owned by Group 50%
Site Area (sqft) 86,110
Total GFA (sqft) 361,660
Land Tenure 99 years from 2007 (87 years left)
Total Consideration (100%) S$91.2 million(1)
Acquisition Date 18 April 2019
Connectivity
25-minutes from CBD, 10-minutes from Changi Airport and 5-minutes from
Tampines MRT interchange that is part of both East-West and Downtown lines
Status
~91% committed occupancy, Office Tower 1 leased to Hitachi, Office Tower 2 is multi-let tenants,
Ground floor retail (1) 100% purchase consideration of the equity component
13

The Mall, part of The Atrium, Chengdu, China
Description LEED® Gold certified commercial mall, which is part of a landmark mixed-use
development
% owned by Group 25%
Site Area (sqm) 123,170
Total GFA (sqm) 45,352
NLA (sqm) 26,078 with 387 carpark lots
Total Consideration (100%) RMB800 million(1)
Acquisition Date 15 May 2019
Connectivity
Located in the heart of Chengdu’s CBD & the Dacisi business corridor, close to
the Chunxi & the Hong Xing Road pedestrian malls such as Taikoo Li
Chengdu. Mall is well connected by 2 train stations & over 20 bus lines
Status Mall to undergo asset enhancement and tenant mix re-structuring
(1) 100% purchase consideration of the equity component 14

Retail Operations
2
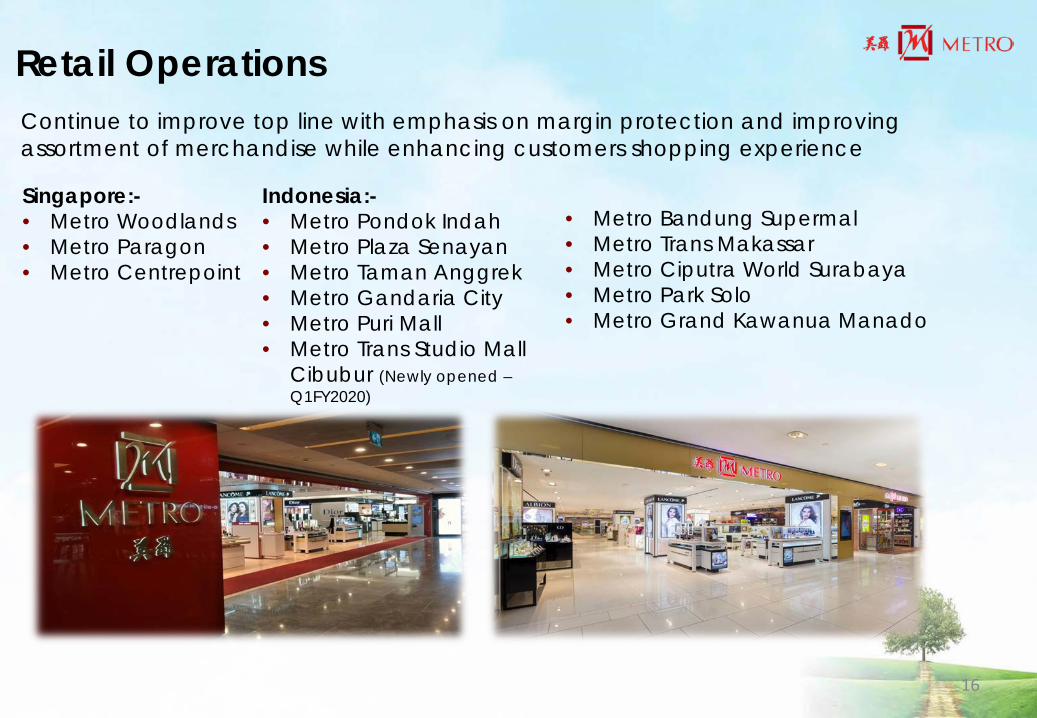
Continue to improve top line with emphasis on margin protection and improving assortment of merchandise while enhancing customers shopping experience
Retail Operations
Singapore:- • Metro Woodlands • Metro Paragon • Metro Centrepoint
Indonesia:- • Metro Pondok Indah • Metro Plaza Senayan • Metro Taman Anggrek • Metro Gandaria City • Metro Puri Mall • Metro Trans Studio Mall
Cibubur (Newly opened – Q1FY2020)
• Metro Bandung Supermal • Metro Trans Makassar • Metro Ciputra World Surabaya • Metro Park Solo • Metro Grand Kawanua Manado
16

Financial Highlights
2

FY2019 Key Financial Highlights Registered Profit Before Tax (PBT) of S$107.0 million in FY2019, as compared to PBT of S$170.7 million in FY2018 that includes a one-off very substantial divestment gain of S$164.5 million from its associate company
Property division - PBT decreased by S$59.5 million to S$113.4 million in FY2019, from S$172.9 million in
FY2018
− Lower contribution from associates by S$114.8 million, mainly due to absence of the Group’s share of Top Spring’s very substantial disposal gain of S$164.5 million (after tax);
− Lower other net income by S$18.4 million, mainly from absence of the divestment gain of Nanchang of S$15.8 million in FY 2018; partially offset by
− Higher contribution from joint-ventures by S$64.5 million, mainly from increase in fair value gains on investment properties from Metro Tower and Metro City, Shanghai, and 5 Chancery Lane, London in FY2019 and absence of share of The Crest’s Additional Buyer’s Stamp Duty in FY2018; and
− Fair value gain on investment property, GIE Tower, Guangzhou, of S$14.7 million in FY2019, up from S$0.4 million in FY2018
Retail division – Registered Net loss before Tax of S$6.4 million, from a Net Loss of S$2.2 million in FY2018 − Singapore’s retail division recorded a higher loss due to impairment of fixed assets and provision for stock
obsolescence and lower contribution by S$1.0 million from Indonesian retail associate
Strong Balance Sheet − Net Assets of S$1,539 million as at 31 March 2019, as compared to S$1,482 million as at 31 March 2018
18

Key Financial Highlights- 4QFY2019 Revenue S$40.0 million
16.6% YoY
4QFY2018 S$34.3 million
PBT S$58.1 million
554.4% YoY
4QFY2018 (restated) S$8.9 million
Remarks: (1) Increase in revenue by 16.6% mainly due to the property division recognising revenue of S$6.1 million from the sale of property rights of the
residential development properties in Bekasi, Jakarta
(2) Profit Before Tax increased by S$49.2 million, mainly attributable to:
– Fair value gain on investment property, GIE Tower, Guangzhou, of S$14.7 million in 4QFY2019, up from S$0.4 million in 4QFY2018;
– Improved contribution from associates (net of tax) by S$27.3 million, mainly because in 4QFY2018 Top Spring made provision for doubtful debts and impaired available for sale investments and had higher operating costs, which was partially offset by S$10.3 million additional share of gain from the very substantial disposal of eight property projects; and
– Higher contribution from joint ventures (net of tax) by S$28.9 million, mainly due to fair value gains on investment properties; partially offset by
– Lower other net income mainly due to absence of divestment gain of S$15.8 million from the disposal of the 30% equity interest in Nanchang associate in 4QFY2018
19

Key Financial Highlights- FY2019
Revenue S$172.0 million
26.1% YoY
FY2018 S$136.3 million
PBT S$107.0 million
37.3% YoY
FY2018 (restated) S$170.7 million(1)
Basic EPS 11.5 cents
40.1% YoY
FY2018 (restated) 19.2 cents
NAV Per Share S$1.83
2.8% YoY
FY2018 (restated) S$1.78
20
Remarks: (1) Includes S$164.5 million (net of tax) share of a gain arising from a very substantial disposal of eight property projects by
Top Spring in FY2018
Return on Total Assets 5.3 %
45.9% YoY
FY2018 (restated) 9.8%
Return on Equity 6.4%
43.4% YoY
FY2018 (restated) 11.3%

Key Financial Highlights- FY2019
3.85x
Comprises: • Ordinary Dividend
- 2.0 cents • Special Dividend
- 2.5 cents
Proposed Dividend(1)
S$37.3 million
FY 2018 S$41.4 million
Dividend Cover 2.56x
33.5% YoY
FY2018 (restated)
21
10.0% YoY
Remarks: (1) FY2019’s proposed dividend subject to shareholders’ approval at the AGM in July 2019

Consolidated Income Statement
(S$ ‘000)
4th Quarter Ended Full Year Ended
31-Mar-19 31-Mar-18 Change 31-Mar-19 31-Mar-18 Change
(restated) (restated)
Revenue 40,030 34,327 16.6% 171,964 136,326 26.1%
Profit Before Tax 58,122 8,882 554.4% 107,022 170,702 (37.3%)
Comprising: Metro City, Metro Tower, GIE Tower, 5 Chancery Lane (Incl Fair Value) 47,817 5,487 771.5% 74,977 30,701 144.2%
Key Associates – Top Spring, Nanchang, Bay Valley, Shanghai Plaza (Incl Fair Value & Divestment Gain)
(3,009) (5,533) (45.6%) (5,567) 129,250 n.m.
Residential Project – The Crest, Bekasi 723 (763) n.m. 10,922 (16,799) n.m.
Retail (3,572) (931) 283.7% (6,355) (2,172) 192.6%
Investments (InfraRed Fund II, MGSA, etc) 15,235 7,604 100.4% 31,415 26,672 17.8%
Others 928 3,018 (69.3%) 1,630 3,050 (46.6%)
Profit After Tax 51,170 1,259 n.m. 95,684 159,695 (40.1%)
22

Balance Sheet Highlights
(S$ million) As at
Change 31-Mar-19 31-Mar-18
(restated) Investment Property 112.0 100.2 11.8%
Associates 758.1 544.2 39.3%
Joint Ventures 237.7 419.9 (43.4%)
Other Non-current Assets 103.3 84.8 21.8%
Current Assets 693.5 552.8 25.5%
Total Assets 1,904.6 1,701.9 11.9%
Current Liabilities 166.4 192.1 (13.4%)
Long Term and Deferred Liabilities 199.1 27.7 618.8%
Total Net Assets 1,539.1 1,482.1 3.8% Shareholders' Funds 1,515.2 1,473.6 2.8%
Non-controlling Interests 23.9 8.5 181.2%
23

Dividend Payout
* FY2019’s proposed dividend subject to shareholders’ approval at the AGM in July 2019
2 2 2 2 2 2 2
2
4 4 5
3 3 2.5
0
2
4
6
8
FY2013 FY2014 FY2015 FY2016 FY2017 FY2018 FY2019*
Special Ordinary
Cents per Share Payout Ratio
40%
80%
0
20%
60% 51.2% 51.1%
46.5%
34.8%
Payout rate
51.3%
26.0%
39.1%
24

Growth Strategies
2
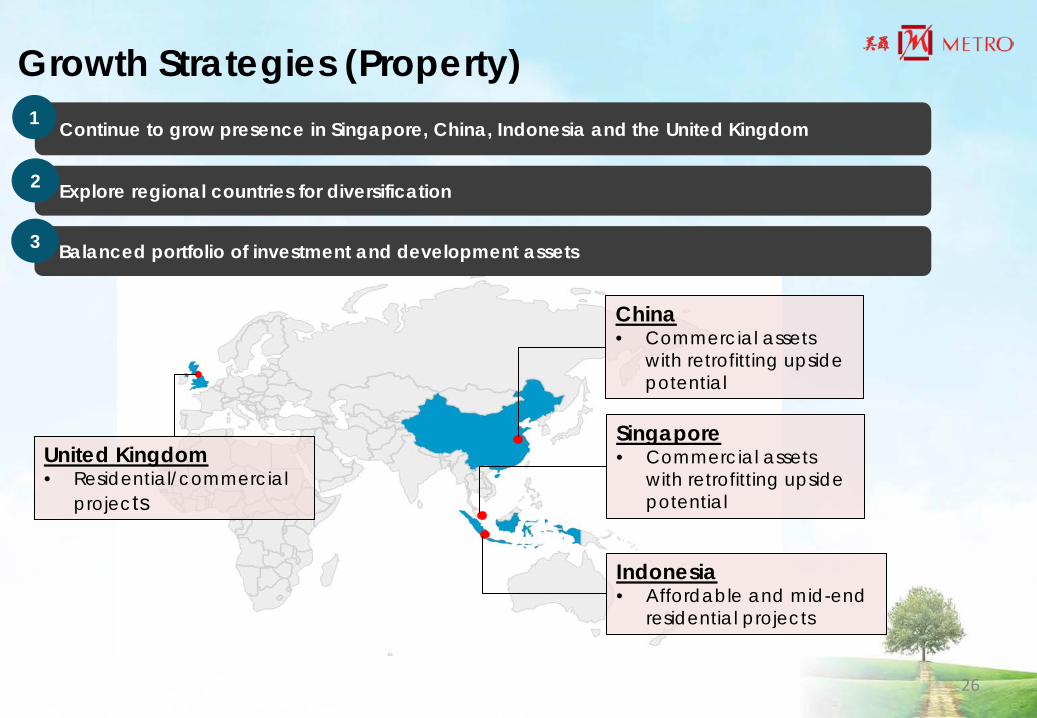
Growth Strategies (Property)
Explore regional countries for diversification
Continue to grow presence in Singapore, China, Indonesia and the United Kingdom
2
1
China • Commercial assets
with retrofitting upside potential
United Kingdom • Residential/commercial
projects
Indonesia • Affordable and mid-end
residential projects
Singapore • Commercial assets
with retrofitting upside potential
Balanced portfolio of investment and development assets 3
26

Growth Strategies (Property)
Strategic alliances with existing and new partners 4
Leverage on strong balance sheet and capital market 6
Continue to achieve efficiency in capital recycling 5
PARTNERS
27

Growth Strategies (Retail)
Consolidate operational efforts to achieve higher efficiency and productivity
Capitalise on retail brand name in Singapore and Indonesia 1
3
Continue to focus on multi-media strategy and deployment of technology to enhance customers shopping experience
2
28

Thank You
2

Market Outlook
2

Market Outlook: China, Real Estate
Opportunities Amidst The Improved Funding Environment CBRE, Greater China Real Estate Market Outlook 2019 • Despite a range of headwinds including U.S.-China trade conflict and tighter monetary conditions,
China commercial real estate transaction volume reached a record high of RMB251.7 billion in 2018, a 4% increase from 2017
• While these same factors will impact the market this year, investment demand is likely to remain firm, with foreign and domestic buyers expected to continue to seek opportunities in China, supported by an easing monetary policy environment
Market Headwinds Strengthen CBRE, Greater China Real Estate Market Outlook 2019 • Economic headwinds strengthened in 2018 amid
deleveraging, supply-side reform and U.S.-China trade conflict
• GDP growth weakened to 6.4% in Q4 2018, the lowest rate of growth since Q2 2009
• Economic data published in December indicated slower export, manufacturing, consumption, real estate investment and sales growth
31
Market Outlook: Shanghai, Office Softer Demand From Subdued Economic Growth Colliers, Shanghai Grade-A Office Market Update Q4 2018 • 7.37 million sqm of new supply is scheduled to be completed over 2019 to 2023, with approximately 2.68
million sqm expected to be completed in 2019 • Vacancy rate is expected to reach 23.9% by end-2019, before making a steady decline during 2021-2023
to 19.8% • Rents are expected to fall 4.4% YoY in 2019 and remain flat in 2020, before rising steadily over 2021-2023 • New projects with high quality, decent accessibility and lower rents should remain competitive in the
market Supply Remains The Biggest Challenge Savills, Shanghai Office – February 2019 • Longer digestion periods for new projects and higher vacancies in old buildings stepped up pressure on
landlords from increasing new stock
• Jing’an International Centre, which was launched in Q4 2018, added 65,000 sqm of new office space, bringing the full-year supply to 778,500 sqm
• More than 1.0 million sqm of Grade-A office space is scheduled to launch in 2019 • Core market rents increased by 0.3% on an index basis in 2018, currently averaging RMB9.0 per sqm per
day • Shanghai’s business environment to improve amidst favourable measures to invigorate the private sector
32

Market Outlook: Shanghai, Retail Leisure and entertainment brands to energise retail spaces Savills, Shanghai Retail – April 2019 Colliers, East China Retail Market Update H2 2018 • Retail sales grew by 6.3% YoY in the first two months of 2019, as
compared to 6.7% over the same period in 2018
• Only one new project, Orstar City, was launched in Q1 2019, adding 44,000 sq m of space to the market
• In Q1 2019, vacancy rates increased by 0.2% QoQ to 6.8% in prime retail areas, and 1.1% QoQ to 7.9% in non-prime retail areas
• Demand for leisure and entertainment brands in malls have been increasing in recent quarters as landlords look to energise retail spaces, drive footfall, and increase consumer engagement and time spent in their retail spaces
• Tenants such as family entertainment centres, indoor theme parks and diversified niche sports have been identified as key attractions
• Colliers expects supply pressure to ease over 2019 to 2023, supported by personal income tax cut, combination of online and offline retailing, and retailers’ transformation
• Shanghai’s average rents are expected to have a moderate correction over 2019-2020 and as most of the new projects are located in non-prime areas, rents should then grow steadily over 2021-2023 as supply eases amid firm demand
Rising Prime Rents
33

Market Outlook: Chengdu, Retail First-store economy stimulates urban vitality Savills, Chengdu Retail – April 2019 • Retail sales of consumer goods in Chengdu reached RMB117.7
billion, up 8.9% YoY in the first two months of 2019 • One new shopping mall, Ito Plaza, opened in Q1 2019, adding
80,000 sqm to Chengdu’s retail stock • City-wide shopping mall stock now stands at 5.8 million sqm • Demand for retail space remained stable in Q1 2019, with a net
absorption of 60,848 sqm, while city-wide vacancy rates rose by 0.1 ppt to 4.6%
• As a result of the Chengdu government’s “First-store Economy” Plan, the market continued to welcome several international brands to Chengdu in Q1 2019
• Going forward, around 400,000 sqm of new supply is expected to be added to Chengdu’s retail market in the rest of 2019
• Underpinned by an overall positive market sentiment, the strong level of absorption pushed the city-wide average first-flor shopping mall rent to RMB431.5 per sqm per month with an increase of 0.5% QoQ
Chengdu Shopping Mall Supply
Chengdu Retail Submarket Rent Index
34
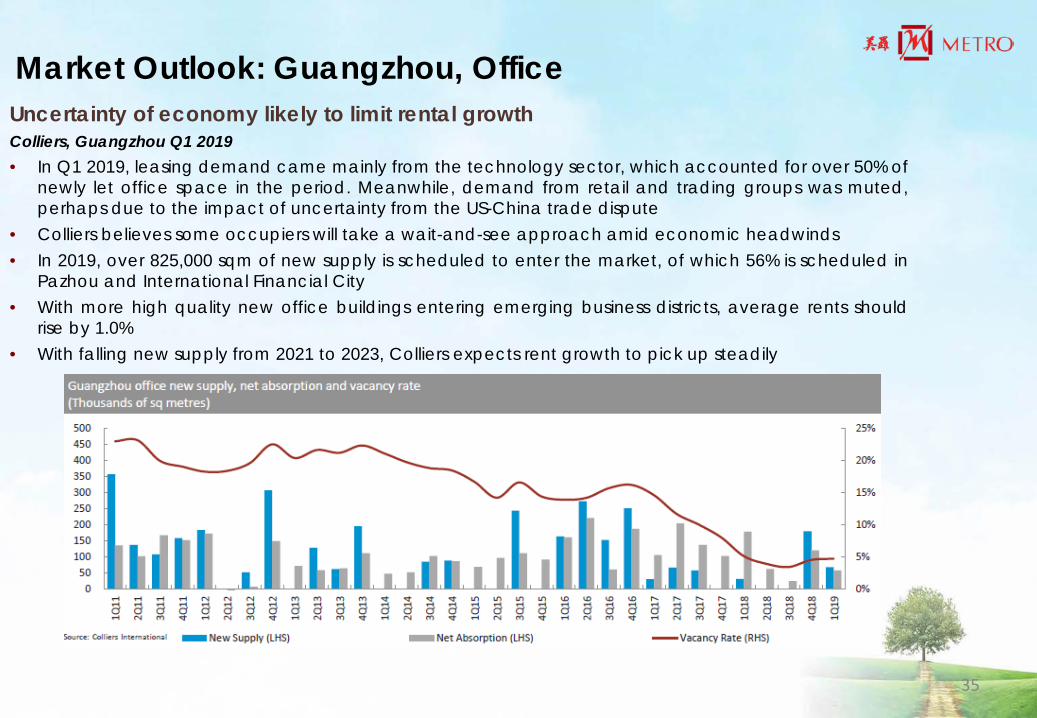
Market Outlook: Guangzhou, Office Uncertainty of economy likely to limit rental growth Colliers, Guangzhou Q1 2019 • In Q1 2019, leasing demand came mainly from the technology sector, which accounted for over 50% of
newly let office space in the period. Meanwhile, demand from retail and trading groups was muted, perhaps due to the impact of uncertainty from the US-China trade dispute
• Colliers believes some occupiers will take a wait-and-see approach amid economic headwinds • In 2019, over 825,000 sqm of new supply is scheduled to enter the market, of which 56% is scheduled in
Pazhou and International Financial City • With more high quality new office buildings entering emerging business districts, average rents should
rise by 1.0% • With falling new supply from 2021 to 2023, Colliers expects rent growth to pick up steadily
35

Market Outlook: Manchester, Residential
UK’s most significant residential investment market JLL, Northern England Residential Forecasts 2019 • Manchester City Centre recorded over £1.6 billion invested over the past 24 months in new purpose
built private rental developments in the city centre, mainly on a forward funding basis • A total of ~5,600 purpose built private rental units are now under construction making Manchester by
far the largest multifamily rental market outside London • JLL estimates that currently up to 3,000 units are needed per year for a growing city centre population
expected to rise from 55,000 currently to 100,000 by 2026. And given that delivery in the last five years has averaged less than 1,000 new units per annum, a ramp up in supply is long overdue
• JLL expects price growth of 3% pa over the next five years compared with a national average of 2.2% pa. Rental growth in Manchester is forecast to average 3.1% pa compared with 2.4% pa across the UK
House price growth (% pa) 2019 2020 2021 2022 2023 2019-23(1)
Manchester 2½ 2½ 3 3½ 3½ 15.9
Greater London ½ 2 4 4 3½ 14.8
UK ½ 1 3 3½ 3 11.4
Source: JLL (1)Cumulative growth
36

Market Outlook: Sheffield, Office Exciting infrastructure, investment and opportunity Knight Frank, Sheffield Office Market 2018 • Occupier take-up reached 363,584 sq ft in 2018, 15%
ahead of the 10-year average • During the year, co-working provider Spaces leased
c.25,000 sq ft at Acero Works, which was sold in May 2018 to Britannia Invest A/S for £26.6 million. The BREEAM ‘Excellent’ building forms part of Sheffield Digital Campus
• Grade-A availability continued to fall in 2018, dipping below the 100,000 sq ft mark by year end
• The tight supply environment is set to continue with HSBC taking new space within Phase 1 of Heart of the City II and 1 Charter Square to be delivered in 2019. Only 26,000 sq ft of this will come to market vacant
• Prime yields remained at 6.00% throughout the year. Compared with the major UK cities, Sheffield offices now offer a discount of up to 125 bps
37

Market Outlook: Central London, Office
Remarkable resilience despite political uncertainty Knight Frank, Central London Quarterly Offices Q4 2018 • Central London office take-up reached 14.80 m sqft in 2018, outperforming expectations and marking
the highest annual total since 2014 • In Q4 2018, Central London supply fell to 14.16 m sqft, which is 13% below the long-term average and
equates to a vacancy rate of 6.2% • Prime headline rents across the majority of submarkets remained stable over the final quarter of 2018,
with the exception of Soho and Fitzrovia, which increased to £87.50 per sqft • Prime West End and City rents have remained stable at £105.00 per sqft and £70.00 per sqft,
respectively • Although 2019 presents ongoing political uncertainty around Brexit, international investors were
undeterred and London remains by far the biggest global destination for foreign investment in real estate
• Investment turnover in 2018 reached £16.30 billion, which although marginally down on 2017, is still 15% ahead of the long-term average
• Knight Frank expects this trend to continue in 2019, as London remains a more attractive destination for South Korean investment than Europe or the United States
38

Market Outlook: Singapore, Residential Stronger case for readjustment of cooling measures Savills, Singapore Residential Sales – March 2019 • From October to December 2018, developers launched 1,657 uncompleted private residential units
while new sales totaled 1,836 • Despite the July 2018 cooling measures, the overall marketing landscape that emerged in the fourth
quarter was that projects with good location attributes and competitive prices could still achieve healthy initial launch take-up rates
• Sales of existing homes in the secondary market fell for the second straight quarter and posted a steep 26.5% quarter-on-quarter (QoQ) decline to 2,024 units
• From the Urban Redevelopment Authority’s (URA) latest statistical release, overall private home prices eased 0.1% QoQ in Q4/2018, the first quarterly decline since Q2/2017. However, the market is viewing this slight decline as a blip rather than the start of a trend reversal
• Prices for the basket of high-end non-landed homes tracked by Savills dipped 0.2% QoQ in Q4/2018 and averaged at S$2,403 per sq ft (psf) by end-2018
• As of end-2018, the pipeline supply of island-wide private residential properties with planning approvals had increased 2.3% QoQ to 51,498 units. Of this number, 34,824 units or 67.6% of stock remained unsold
• Whilst sales for maiden project launches hovered in the 22% to 29% range in 2018, Savills expects those numbers to downshift to 15% to 22% in 2019
39

Market Outlook: Singapore, Retail Moderating economic growth, seasonal CNY effects • The Singapore economy grew 1.3% YoY in 1Q2019, moderating from the 1.9% growth in 4Q2018(1);
GDP growth is expected to grow 1.5% to 3.5% in 2019(2)
• Singapore’s retail sales index for February 2019 decreased 10.0% YoY, while department stores dropped 11.8% YoY(3). This was due mainly to higher sales in February 2018 associated with the Chinese New Year festive season
• Both tourism receipts and tourist arrivals set new records for the third consecutive year in 2018, recording a 1.0% and 6.2% growth, respectively(4)
• STB maintains an optimistic outlook for 2019, expecting tourism receipts to grow a further 1% to 3% and international visitor arrivals to rise between 1% and 4%(4)
(1) Ministry of Trade and Industry Singapore, April 12, 2019 – “Singapore’s GDP grew by 1.3 per cent in the first quarter of 2019” (2) Ministry of Trade and Industry Singapore, February 15, 2019 – “MTI maintains 2019 GDP growth forecast at 1.5 to 3.5 per cent” (3) Singstat, February 2019 – Retail sales index and food & beverage sales index (4) Singapore Tourism Board, February 13, 2019 – “Third consecutive year of growth for Singapore tourism sector in 2018”
40

Market Outlook: Singapore, Commercial Steady rental growth Colliers, Singapore Office Q1 2019 CBRE, Singapore Real Estate Market Outlook 2019 • CBD Grade-A office rental growth remained stable at 2.3% QoQ in Q1 2019, raising monthly rent to S$9.64
(US$7.12). Increasing landlord confidence underpinned lower incentives and rental uplift • Q1 2019 net absorption was driven by technology and flexible workspace sectors, as vacancy tightened to 3.9% • CBD Grade-A rental growth is expected to grow 8% in 2019 and 5% in 2020, moderating from 15% in 2018, and to
experience a slight decline in 2021 in anticipation of higher supply in 2022, before a rebound thereafter • CBRE sees Grade-A (core CBD) vacancy tightening from 6.2% to 5.1% as at end 2018, highlighting the robust take-
up of prime and new office space. With a very limited pipeline of such spaces in the horizon, vacancy for this submarket is expected to compress further. As core CBD office rents continue to rise and with dropping availability of prime space, occupiers are expected to widen their location criteria in office requirements in order to secure suitable premises. This could help drive up leasing demand for Grade-B/B+ offices in choice locations.
41

Market Outlook: Indonesia, Residential Overall sales remain low; election on the minds of buyers JLL, Jakarta Property Market Review Q4 2018 • The LRT and MRT projects are of particular interest to residential developers and a number of projects
with access to these transport corridors are already in the pipeline. The LRT in particular is providing opportunities for developers of high rise residential to create or participate in Transit Oriented Developments (TODs)
• Buyers remained cautious in 4Q18 with the overhang of the April 2019 election. As the fasting month immediately follows, it may be the second half of 2019 before JLL sees a significant recovery in market activity
• Condominium prices in the luxury segment have remained relatively flat for some time in the face of weak demand. The middle and lower segments have seen some moderate increases
42
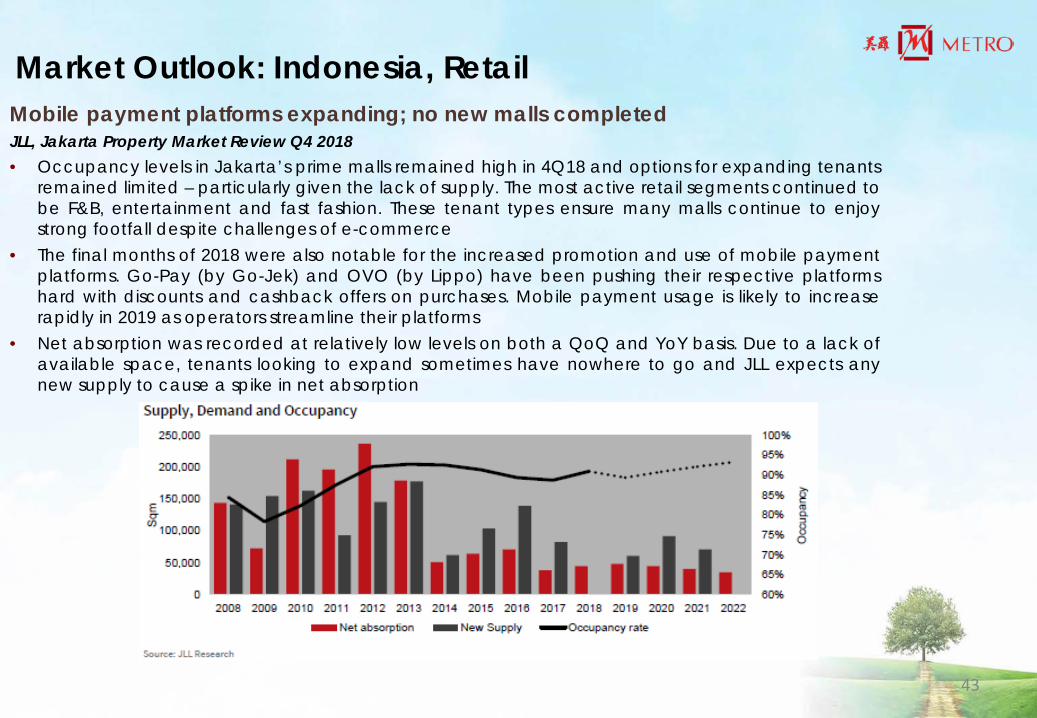
Market Outlook: Indonesia, Retail Mobile payment platforms expanding; no new malls completed JLL, Jakarta Property Market Review Q4 2018 • Occupancy levels in Jakarta’s prime malls remained high in 4Q18 and options for expanding tenants
remained limited – particularly given the lack of supply. The most active retail segments continued to be F&B, entertainment and fast fashion. These tenant types ensure many malls continue to enjoy strong footfall despite challenges of e-commerce
• The final months of 2018 were also notable for the increased promotion and use of mobile payment platforms. Go-Pay (by Go-Jek) and OVO (by Lippo) have been pushing their respective platforms hard with discounts and cashback offers on purchases. Mobile payment usage is likely to increase rapidly in 2019 as operators streamline their platforms
• Net absorption was recorded at relatively low levels on both a QoQ and YoY basis. Due to a lack of available space, tenants looking to expand sometimes have nowhere to go and JLL expects any new supply to cause a spike in net absorption
43