metropolitan housing outlook: in-depth housing analysis ... · spring 2013 metropolitan housing...
TRANSCRIPT

metropolitan housing outlook Autumn 2013
in-Depth housing analysis for Canada, the provinces, and nine metropolitan areas.

About The Conference Board of CanadaWe are:
� The foremost independent, not-for-profit, applied
research organization in Canada.
� Objective and non-partisan. We do not lobby
for specific interests.
� Funded exclusively through the fees we charge
for services to the private and public sectors.
� Experts in running conferences but also at con-
ducting, publishing, and disseminating research;
helping people network; developing individual
leadership skills; and building organizational
capacity.
� Specialists in economic trends, as well
as organizational performance and public
policy issues.
� Not a government department or agency,
although we are often hired to provide
services for all levels of government.
� Independent from, but affiliated with, The
Conference Board, Inc. of New York, which
serves nearly 2,000 companies in 60 nations
and has offices in Brussels and Hong Kong.
Publication 14-190©2013 The Conference Board of Canada*Published in Canada • All rights reservedAgreement No. 40063028*Incorporated as AERIC Inc.
®The Conference Board of Canada and the torch logo are registered trademarks of The Conference Board, Inc.
Forecasts and research often involve numerous assumptions and data sources, and are subject to inherent risks and uncertainties. This information is not intended as specific investment, accounting, legal, or tax advice.
Genworth MI Canada Inc.Genworth MI Canada Inc., through its subsidiary, Genworth Financial Mortgage Insurance Company Canada, has been the leading Canadian private residen-tial mortgage insurer since 1995. Known as Genworth Canada, “The Homeownership Company,” it provides default mortgage insurance to Canadian residential mort-gage lenders that enables low-down-payment borrowers to own a home more affordably and stay in their homes during difficult financial times. Genworth Canada com-bines technological and service excellence with risk man-agement expertise to deliver innovation to the mortgage marketplace. As at September 30, 2013, Genworth Canada, had $5.6 billion in total assets and $3.0 billion in shareholders’ equity. Based in Oakville, Ontario, Genworth Canada employs approximately 260 people across Canada. Find out more at www.genworth.ca.
PrefaceThis report provides an in-depth analysis of the housing market at the national, provincial, and metropolitan lev-els. Covering a wide range of housing market statistics, such as interest rates, housing starts, mortgage approvals, and home prices, this report connects the economy with housing market activity. It also provides insights into the financial situation of consumers.
Nine census metropolitan areas are covered: Québec City, Montréal, Toronto, Ottawa–Gatineau, Winnipeg, Calgary, Edmonton, Vancouver, and Victoria.
Provincial coverage includes the Atlantic provinces, Quebec, Ontario, the Prairies, Alberta, and British Columbia.
This report is completed twice a year.
Metropolitan Housing Outlook: In-Depth Housing Analysis for Canada, the Provinces, and Nine Metropolitan Areasby Alan Arcand, Mario Lefebvre, Jane McIntyre, Greg Sutherland, and Robin Wiebe

Contents
What has Changed? . . . . . . . . . . . . . . . . . . . . . . . . . . . . . . . . . . . . . . . . . . . . . . . . . . . . . . . . . . . . . . . 1
executive summary . . . . . . . . . . . . . . . . . . . . . . . . . . . . . . . . . . . . . . . . . . . . . . . . . . . . . . . . . . . . . . . . 2
national overview . . . . . . . . . . . . . . . . . . . . . . . . . . . . . . . . . . . . . . . . . . . . . . . . . . . . . . . . . . . . . . . . . 7
provincial overview . . . . . . . . . . . . . . . . . . . . . . . . . . . . . . . . . . . . . . . . . . . . . . . . . . . . . . . . . . . . . . . 12Atlantic Canada . . . . . . . . . . . . . . . . . . . . . . . . . . . . . . . . . . . . . . . . . . . . . . . . . . . . . . . . . . . . . . . . . . . . . . . . . . . . 12
Quebec . . . . . . . . . . . . . . . . . . . . . . . . . . . . . . . . . . . . . . . . . . . . . . . . . . . . . . . . . . . . . . . . . . . . . . . . . . . . . . . . . . . 15
Ontario . . . . . . . . . . . . . . . . . . . . . . . . . . . . . . . . . . . . . . . . . . . . . . . . . . . . . . . . . . . . . . . . . . . . . . . . . . . . . . . . . . . 18
Prairies . . . . . . . . . . . . . . . . . . . . . . . . . . . . . . . . . . . . . . . . . . . . . . . . . . . . . . . . . . . . . . . . . . . . . . . . . . . . . . . . . . . 21
Alberta . . . . . . . . . . . . . . . . . . . . . . . . . . . . . . . . . . . . . . . . . . . . . . . . . . . . . . . . . . . . . . . . . . . . . . . . . . . . . . . . . . . 24
British Columbia . . . . . . . . . . . . . . . . . . . . . . . . . . . . . . . . . . . . . . . . . . . . . . . . . . . . . . . . . . . . . . . . . . . . . . . . . . . 27
metropolitan overview . . . . . . . . . . . . . . . . . . . . . . . . . . . . . . . . . . . . . . . . . . . . . . . . . . . . . . . . . . . . . 30Québec City . . . . . . . . . . . . . . . . . . . . . . . . . . . . . . . . . . . . . . . . . . . . . . . . . . . . . . . . . . . . . . . . . . . . . . . . . . . . . . . 30
Montréal. . . . . . . . . . . . . . . . . . . . . . . . . . . . . . . . . . . . . . . . . . . . . . . . . . . . . . . . . . . . . . . . . . . . . . . . . . . . . . . . . . 34
Toronto . . . . . . . . . . . . . . . . . . . . . . . . . . . . . . . . . . . . . . . . . . . . . . . . . . . . . . . . . . . . . . . . . . . . . . . . . . . . . . . . . . . 38
Ottawa–Gatineau . . . . . . . . . . . . . . . . . . . . . . . . . . . . . . . . . . . . . . . . . . . . . . . . . . . . . . . . . . . . . . . . . . . . . . . . . . . 42
Winnipeg . . . . . . . . . . . . . . . . . . . . . . . . . . . . . . . . . . . . . . . . . . . . . . . . . . . . . . . . . . . . . . . . . . . . . . . . . . . . . . . . . 46
Calgary. . . . . . . . . . . . . . . . . . . . . . . . . . . . . . . . . . . . . . . . . . . . . . . . . . . . . . . . . . . . . . . . . . . . . . . . . . . . . . . . . . . 50
Edmonton. . . . . . . . . . . . . . . . . . . . . . . . . . . . . . . . . . . . . . . . . . . . . . . . . . . . . . . . . . . . . . . . . . . . . . . . . . . . . . . . . 54
Vancouver . . . . . . . . . . . . . . . . . . . . . . . . . . . . . . . . . . . . . . . . . . . . . . . . . . . . . . . . . . . . . . . . . . . . . . . . . . . . . . . . 58
Victoria. . . . . . . . . . . . . . . . . . . . . . . . . . . . . . . . . . . . . . . . . . . . . . . . . . . . . . . . . . . . . . . . . . . . . . . . . . . . . . . . . . . 62
Definition and Concepts . . . . . . . . . . . . . . . . . . . . . . . . . . . . . . . . . . . . . . . . . . . . . . . . . . . . . . . . . . . 66


The Conference Board of Canada
The forecast for Canada’s real gross domes-
tic product is relatively unchanged from our
spring 2013 Metropolitan Housing Outlook,
as the main assumptions supporting the outlook seem
to be holding up. Growth in Canada’s real GDP is
expected to be 1.8 per cent in 2013—a second consecu-
tive year of tepid growth. However, housing markets
have strengthened in some regions over the past couple
of months, and consumer and business confidence
has picked up. As a result, the Canadian economy
is expected to perform better in 2014, expanding by
2.4 per cent. This is still a 0.1 percentage point down-
ward revision from six months ago when we completed
the previous housing outlook publication.
The Canadian dollar lost ground this past summer,
pulled down, in part, by weaker commodity prices,
including heavily discounted crude oil. The loonie is
expected to average US$0.97 this year, much lower
than the US$1.02 forecast in the previous housing out-
look. Despite some pickup in the economy in the com-
ing months, the Canadian dollar is expected to slip to
US$0.96 for 2014, a 7-cent drop from the last housing
outlook publication.
Modest economic growth and tighter mortgage rules
lowered demand in Canada’s new housing market in the
first half of this year. Accordingly, builders are expected
to reduce housing starts by 15.5 per cent in total for
2013, down to 181,400 units. This is an 800-unit
reduction from the previous Metropolitan Housing
Outlook. However, demand has already improved in
some markets, and so modest growth of 1.9 per cent is
anticipated for housing starts next year. In level terms,
housing starts are expected to be 184,900 units in 2014,
up from 184,500 units in the last publication.
Weaker demand in the Canadian housing market in
the past few months has also slowed price growth in
the new home market. The current outlook forecasts
new home prices will rise by 1.8 per cent this year
and 2 per cent in 2014. This is down from the 2.1 per
cent and 2.5 per cent increases anticipated six months
ago. Meanwhile, resale prices have been stronger so
far in 2013. Existing home prices are now expected
to increase 3.1 per cent this year, up from the 0.9 per
cent increase expected in the previous outlook. Resale
price growth will be more moderate next year, how-
ever, at 1.7 per cent, down from the 3.3 per cent
forecast previously.
The number of mortgage approvals is also expected
to be lower in 2013, slipping 2.3 per cent, the second
annual decline in a row. This is a more pronounced
drop than the 1.1 per cent decline expected six months
ago. Next year, with housing markets improving, total
mortgage approvals are anticipated to grow by 2.9 per
cent, an upward revision from the 1.7 per cent expected
in the previous forecast.
What has Changed?

The Conference Board of Canada
NaTIONal OVerVIeW
Canada’s economic prospects seem to be bright-
ening: housing markets remain decent, con-
sumer and business confidence has picked up,
and the U.S. economy is improving. Accordingly,
Canada’s real GDP is forecast to advance by 2.4 per
cent in 2014, following 1.8 per cent growth this year.
Employment growth is also forecast to pick up from
1.3 per cent this year to 1.4 per cent in 2014, cutting the
unemployment rate from 7.2 per cent to 7 per cent.
Financial markets have calmed recently. While the
European sovereign debt crisis still lurks, the eurozone
has emerged from crisis mode. The U.S. Federal Reserve
continues its policy of quantitative easing, and the Bank
of Canada has said interest rates will stay low as long as
Canada’s economy remains weak and inflation is dormant.
On the currency front, the Canadian dollar is still below
par with its U.S. counterpart, largely a result of the global
flight to the “safe haven” of the U.S. dollar. Meanwhile,
mortgage interest rates are on the rise as yields on
bonds, from which mortgages are funded, increase.
Accordingly, we expect the posted three-year conven-
tional mortgage rate to increase gradually from 3.8 per
cent in 2013 to 4.4 per cent in 2014 and 5.1 per cent in
2015. This, along with ongoing employment gains,
should allow indebted households to adapt gradually to
the resulting higher mortgage payments. There is little
sign of current mortgage stress; default rates are low.
Canadian housing markets remain generally solid, despite
repeated attempts to cool them by tightening mortgage
insurance rules. Housing starts dipped to 175,500 units
at an annual rate during the first quarter of 2013, but
quickly rebounded to 185,500 units in the second quar-
ter. We expect starts to end the year at 181,400 units.
For next year, we expect nearly 185,000 starts. New
home price growth will remain subdued at 1.8 per cent
this year and 2 per cent in 2014, down from gains of
2.2–2.4 per cent between 2010 and 2012. The national
housing market does not seem out of balance with
demographic requirements. Canada’s ratio of housing
starts to absolute population changes has averaged
0.54 over the past 25 years and has been near that each
of the past three years. Meanwhile, the national average
existing home price, which increased by a marginal
0.2 per cent in 2012, is forecast to rise 3.1 per cent to
$372,770 this year and 1.7 per cent in 2014.
In short, Canadian housing markets should land softly.
The economy continues to advance modestly. Interest
rates, although rising, remain low. Recent homebuyers
have locked in low mortgage rates and will have paid
off a relatively large share of their debt when they have
to renegotiate. New construction does not appear out of
line with demographic requirements, even in Toronto,
where concern over inflated condominium supplies
abounds. A crash would require a significant negative
surprise like an interest rate spike or employment col-
lapse. Since none of this is in the cards, a housing crash
like the one in the U.S. is nowhere near a possibility.
PrOVINCIal OVerVIeW
Stronger performance by British Columbia’s goods-pro-
ducing industries will lift GDP expansion to 3 per cent
in 2014, following a disappointing 1.5 per cent in 2013.
This will produce only 0.3 per cent job growth in 2013
but a stronger 1.7 per cent in 2014. Housing markets
are improving in Vancouver and Victoria, although a
subdued Chinese economy could cool offshore demand
for provincial real estate. Housing starts are nonetheless
forecast to decline 8 per cent in 2013, and then jump
over 10 per cent in 2014. Little change is expected in
prices for both new and existing homes in 2013 and
2014, after both dropped in 2012.
Alberta has largely shrugged off the effect of the June
floods, thanks to decent energy sector activity. Provincial
GDP is forecast to rise 3.2 per cent in 2013 and 3 per cent
in 2014. This will lift employment 2.2 per cent in 2013
and 2 per cent in 2014. Housing starts are predicted to
rise 4.3 per cent in 2013, building on a 30 per cent jump
in 2012. They should essentially stabilize in 2014. We
executive summary

Autumn 2013—metropolitan Housing Outlook | 3
The Conference Board of Canada
expect the average sale price of an existing home to rise
4.5 per cent in both 2013 and 2014; new home price
growth should be closer to 3 per cent in both years.
Healthy GDP growth of 2.5 per cent is forecast in 2013
for Manitoba and Saskatchewan combined and then
2.3 per cent in 2014. This will foster job growth of
2.2 per cent in 2013 and 1.6 per cent in 2014. Economic
momentum will largely come from Saskatchewan’s
goods-producing sector, since Manitoba’s metal mining
and services sectors are expected to be weak. Housing
starts soared 31 per cent in the two provinces combined
in 2012, but should drop 19 per cent in 2013 this year.
But construction volumes will remain very strong, in
line with continued sound population growth, and a
small 4.4 per cent rebound is expected for 2014. The
average resale home price will increase 5.3 per cent in
2013 and 4.7 per cent in 2014, while new home prices
will rise 3.3 per cent and 3.2 per cent.
Continued manufacturing struggles in 2013 will limit
Ontario’s GDP growth to 1.2 per cent, but next year
will see manufacturing improve and GDP advance
2.2 per cent. Employment is forecast to rise 1.3 per cent
in 2013 and 1.6 per cent in 2014. Housing starts are on
track to fall 21 per cent this year, led by a big drop in
multi-family starts. For 2014, we see both single and
multiple construction stabilizing, with total starts rising
by 2.5 per cent. Average existing home price growth is
forecast to slow to 2.8 per cent in 2013 and 1.6 per cent
in 2014. Moderate new home price advances are fore-
cast: 3 per cent this year and 1.8 per cent in 2014.
Quebec’s GDP is forecast to rise only 1.4 per cent this
year but a stronger 2.2 per cent in 2014. Still, employ-
ment will grow 1.4 per cent this year and 1.1 per cent
next. Significant declines in both single-detached and
multi-family construction are forecast to cut total hous-
ing starts by 24 per cent in 2013, the third consecutive
annual decline. Next year is forecast to see both single
and multiple starts stabilize. House price growth will be
modest: 1 per cent this year and 2.7 per cent in 2014 for
existing homes and advances of 1.4 per cent and 1.9 per
cent for new units.
Canada’s four Atlantic provinces will see their com-
bined GDP grow 2.3 per cent in 2013, following a 1.5
per cent contraction in 2012. A 1.9 per cent expansion
is on tap for 2014. Employment advances will remain
sluggish at 0.5 per cent in 2013 and 0.6 per cent in
2014. Housing markets are similarly weak. This year,
we expect double-digit percentage drops in both single-
detached and multi-family construction to cut total
starts by 13.4 per cent. Another 11 per cent drop is on
tap for 2014, as multiples retrench further. The average
existing home price is forecast to dip 1.5 per cent this
year, but rise 2.9 per cent in 2014. The average new
home price is forecast to rise 3.6 per cent this year and
1.7 per cent in 2014.
MuNICIPal OVerVIeW
Most cities are forecast to see somewhat slower GDP
growth in 2013 than in 2012. Victoria’s 0.1 per cent
GDP expansion (down from an already-low 0.3 per cent
in 2012) is predicted to be the slowest among our cities.
Edmonton is forecast to be this year’s leader, although
its GDP growth of 4.2 per cent will be a cooling from
hikes near or above 6 per cent in the previous three
years. For 2014, we expect growth will accelerate in all
cities except Edmonton, where it will slow to a still-
strong 3.2 per cent. Calgary’s 3.4 per cent will be next
year’s fastest advance, while Ottawa’s 1.6 per cent will
be the slowest, as the city grapples with ongoing federal
restraint. Unsurprisingly, the Alberta cities are the only
two cities where GDP growth is expected to average at
least 3 per cent per year between 2015 and 2017. By
contrast, we think Québec City’s GDP expansion will
average only 2 per cent.
For the second consecutive year, sales of existing homes
are forecast to drop everywhere except the Alberta cites in
2013. In the case of Calgary and Edmonton, sales growth,
while positive this year, will slow from the previous
year’s pace. The most notable news elsewhere is the
apparent end of Vancouver’s market correction. Sales
rose briskly during the second quarter of 2013 and
exceeded their year-earlier volume for the first time
since the third quarter of 2011. Nonetheless, sales will
still end 2013 down 2.3 per cent. Sales in Toronto are
also expected to post their second straight annual dip.
This year’s largest forecast drops are in the province of
Quebec—10 per cent in Québec City and 8 per cent in
Montréal. For 2014, we think sales will rise everywhere
except Ottawa, which will suffer a fifth straight annual

4 | metropolitan Housing Outlook—Autumn 2013
The Conference Board of Canada
sale decline. Increases will be modest elsewhere, with a
3 per cent gain in Winnipeg leading the pack. Between
2015 and 2017, sales will rise at an annual average rate
of roughly 2 to 3 per cent in most places except
Toronto, where growth will be slightly faster.
Quarterly sales-to-new-listings ratio data indicate bal-
anced markets in most cities, although the more volatile
monthly data show Calgary has edged into a sellers’ pos-
ition and Québec City has dipped into buyers’ territory.
Measured by annual data, though, we expect balanced
markets everywhere in 2013. Still, the sales-to-new-
listings ratio will fall in our five easternmost cities, led
by a 7 percentage point drop in Québec City. Vancouver
and Victoria will see 6 and 7 percentage point increases
respectively. For 2014, we expect the ratio to advance
in five cities, the largest gain being another 6 percent-
age point rise in Vancouver. Little movement in most
cities’ sales-to-new-listings ratio is expected between
2015 and 2017. A 2 percentage point increase in
Montréal and a similar decline in Winnipeg are the
only two changes greater than 1 per cent.
The average resale price is poised to rise in all cities in
2013 for the first time since 2010. Last year, the average
resale price fell in Vancouver and Victoria. This year,
prices are forecast to inch higher in both these cities,
but still at the slowest pace among our nine areas.
Unsurprisingly, we expect Calgary will enjoy the fastest
price growth in 2013, at 4.7 per cent. For 2014, we
think price growth will remain the strongest in Alberta,
with prices forecast to rise 4.6 per cent in both Calgary
and Edmonton. But price advances will remain below
2 per cent in both B.C. cities, which are again forecast to
have our nine cities’ slowest price growth. Between 2015
and 2017, price gains will be the strongest in Calgary,
Edmonton, and Winnipeg, which are all forecast to see
advances average at least 4 per cent annually.
Widespread pullbacks in housing starts are expected in
2013. Especially large drops are forecast for our eastern
cities; Montréal, Toronto, and Québec City are all
expected to see starts decline near 30 per cent, while
starts are forecast to fall 21 per cent in Ottawa. Only
Edmonton and Winnipeg are forecast to see increases,
and these will both be less than 10 per cent. Another
uneven year is expected in 2014, with starts forecast to
drop in five cities, led by a 16 per cent decline in
Edmonton. Between 2015 and 2017, we see the fastest
starts growth in Toronto and Winnipeg. During the past
five years, more multi-family units than single-detached
homes were built in six of our nine cities; multiples’
share was over 70 per cent in Québec City, Montréal,
Toronto, and Vancouver. This proliferation of multi-
family units is expected to increase, particularly in for-
mer single-family bastions like Calgary, Edmonton, and
Winnipeg. Vancouver will continue to see the lowest
share of single-detached units; these are forecast to make
up only 20 per cent of starts between 2013 and 2017.
Low and easing interest rates following the 2009 reces-
sion have contained increases in average principle and
interest payments in most cities, despite rising house
prices. Indeed, these payments were lower in 2013 than
in 2008 in Calgary, Edmonton, and Victoria and rose
only 5 to 6 per cent in Montréal, Ottawa, and Vancouver.
But carrying costs did rise in double-digit terms in
Toronto, Québec City, and Winnipeg. Rising mortgage
interest rates in 2014 are predicted to lift average monthly
mortgage payments moderately in all cities; the largest
jump will be 4.8 per cent in Calgary and Edmonton.
Vancouver remains our least affordable city, both abso-
lutely and measured against local incomes. Monthly
principle and interest payments in Vancouver are pro-
jected to average $4,030 in 2014 and consume 41 per
cent of average household income. No other city
approaches these levels.
Financial Indicators (Canada)
2012 2013f 2014f
Exchange rate (U.S./Can.) 1.00 0.97 0.96
Inflation rate 1.5 1.1 1.9
Bank rate 1.3 1.2 1.5
One-year mortgage rate 3.2 3.1 3.7
Three-year mortgage rate 3.9 3.8 4.4
Five-year mortgage rate 5.3 5.2 5.3
Federal bonds: 1–3 years 1.1 1.2 1.5
Federal bonds: 7 years 1.5 2.0 2.3
Federal bonds: long term 2.4 2.9 3.0
f = forecastSources: Bank of Canada; Canada Mortgage and Housing Corporation; Canadian Real Estate Association; Statistics Canada; The Conference Board of Canada.

Autumn 2013—metropolitan Housing Outlook | 5Ec
onom
ic In
dica
tors
GDP
(200
2 $
mill
ions
)em
ploy
men
t (00
0s)
unem
ploy
men
t rat
ePe
rson
al In
com
e pe
r Cap
itare
tail
Sale
s ($
mill
ions
)
2012
2013
f20
14f
2012
2013
f20
14f
2012
2013
f20
14f
2012
2013
f20
14f
2012
2013
f20
14f
Cana
da1,
661,
559
1,69
0,67
11,
730,
882
17,5
1017
,736
17,9
867.
37.
27.
034
,136
35,0
2836
,018
468,
252
483,
438
501,
819
1.7
1.8
2.4
1.2
1.3
1.4
3.4
2.6
2.8
2.6
3.2
3.8
atla
ntic
pro
vinc
es89
,660
91,7
0693
,415
1,11
01,
115
1,12
210
.310
.39.
835
,323
36,3
1637
,290
34,4
4935
,119
36,1
74–1.5
2.3
1.9
0.7
0.5
0.6
3.2
2.8
2.7
1.4
1.9
3.0
Queb
ec30
3,32
230
7,65
631
4,38
93,
985
4,04
24,
085
7.8
7.7
7.6
35,9
2136
,486
37,4
4910
3,64
810
5,55
110
9,22
21.0
1.4
2.2
0.8
1.4
1.1
3.1
1.6
2.6
1.1
1.8
3.5
Québ
ec C
ity32
,661
33,0
8533
,811
421
424
433
5.1
4.6
4.6
39,2
2340
,216
41,3
4712
,413
12,6
8513
,064
1.2
1.3
2.2
0.5
0.8
2.0
3.9
2.5
2.8
2.1
2.2
3.0
Mon
tréal
158,
778
160,
851
164,
287
1,97
92,
018
2,03
18.
58.
07.
936
,250
37,3
2038
,118
45,9
9348
,466
50,1
261.1
1.3
2.1
1.4
2.0
0.6
3.6
3.0
2.1
1.7
5.4
3.4
Onta
rio57
4,46
958
1,25
259
4,14
46,
786
6,87
46,
982
7.9
7.7
7.6
38,8
1039
,681
40,8
8716
5,17
716
6,62
417
3,39
11.4
1.2
2.2
0.8
1.3
1.6
2.3
2.2
3.0
1.6
0.9
4.1
Otta
wa
62,5
3263
,015
64,0
2571
269
971
06.
36.
46.
145
,137
44,8
1646
,226
17,3
7917
,470
18,0
720.8
0.8
1.6
2.5
–1.8
1.6
3.1
–0.7
3.1
2.8
0.5
3.4
Toro
nto
284,
318
288,
915
296,
856
3,00
73,
084
3,13
48.
58.
28.
040
,055
41,2
5242
,274
67,6
6968
,348
70,7
941.9
1.6
2.7
1.6
2.5
1.6
3.4
3.0
2.5
1.0
1.0
3.6
Prai
ries
106,
366
109,
063
111,
582
1,16
71,
192
1,21
25.
14.
74.
638
,399
39,5
7140
,617
34,7
6635
,404
36,9
012.4
2.5
2.3
1.5
2.2
1.6
3.7
3.1
2.6
4.6
1.8
4.2
Win
nipe
g33
,144
33,6
0434
,310
417
420
426
5.6
5.9
5.5
37,2
3138
,004
39,0
7810
,360
10,6
6911
,157
1.5
1.4
2.1
2.1
0.7
1.5
3.2
2.1
2.8
1.8
3.0
4.6
albe
rta27
6,90
828
5,64
429
4,22
62,
149
2,19
62,
240
4.6
4.7
4.7
51,7
6853
,516
54,8
5268
,452
73,0
5776
,462
3.9
3.2
3.0
2.6
2.2
2.0
5.6
3.4
2.5
6.9
6.7
4.7
Calg
ary
105,
987
109,
485
113,
164
752
770
792
4.8
4.9
4.6
55,5
2456
,602
58,1
7624
,164
25,2
2426
,531
4.3
3.3
3.4
3.7
2.4
2.8
1.5
1.9
2.8
3.6
4.4
5.2
edm
onto
n78
,082
81,3
8483
,989
693
710
722
4.7
4.5
4.6
49,1
1050
,187
51,2
2522
,467
23,6
5924
,841
5.9
4.2
3.2
3.3
2.5
1.6
2.8
2.2
2.1
4.5
5.3
5.0
Briti
sh C
olum
bia
191,
749
194,
568
200,
473
2,31
32,
320
2,36
06.
86.
56.
237
,742
38,7
0439
,810
61,5
6562
,170
64,4
771.7
1.5
3.0
1.6
0.3
1.7
3.2
2.5
2.9
1.9
1.0
3.7
Vanc
ouve
r10
8,03
811
0,42
811
3,87
21,
275
1,28
11,
313
6.7
6.5
6.2
38,7
1139
,207
40,4
9428
,628
28,9
6330
,074
2.6
2.2
3.1
1.9
0.5
2.5
3.5
1.3
3.3
3.4
1.2
3.8
Vict
oria
14,9
7614
,995
15,3
1818
618
418
55.
55.
65.
240
,656
41,1
6742
,169
4,18
34,
159
4,28
00.3
0.1
2.2
2.2
–1.2
0.7
3.1
1.3
2.4
1.2
–0.6
2.9
f = fo
reca
stIta
lics
indi
cate
per
cent
age
chan
ge.
Sour
ces:
Ban
k of
Can
ada;
Can
adia
n Re
al E
stat
e As
soci
atio
n; S
tatis
tics
Cana
da; T
he C
onfe
renc
e Bo
ard
of C
anad
a.

6 | metropolitan Housing Outlook—Autumn 2013
Dem
ogra
phic
and
Hou
sing
Indi
cato
rs
Popu
latio
n (0
00s)
Hous
ing
Star
tsHo
usin
g Co
mpl
etio
nsex
istin
g Ho
me
Pric
esNe
w H
ome
Pric
es
2012
2013
f20
14f
2012
2013
f20
14f
2012
2013
f20
14f
2012
2013
f20
14f
2012
2013
f20
14f
Cana
da34
,827
35,1
9335
,586
214,
827
181,
446
184,
927
180,
646
188,
966
177,
776
361,
494
372,
769
379,
236
413,
730
421,
284
429,
782
1.1
1.1
1.1
10.8
–15.5
1.9
3.0
4.6
–5.9
0.2
3.1
1.7
2.3
1.8
2.0
atla
ntic
pro
vinc
es2,
363
2,36
12,
366
12,6
4710
,950
9,73
411
,699
11,3
5210
,109
142,
756
140,
607
144,
668
339,
660
351,
763
357,
729
0.1
–0.1
0.2
1.0
–13.4
–11.1
2.8
–3.0
–11.0
1.0
–1.5
2.9
2.3
3.6
1.7
Queb
ec8,
043
8,10
98,
173
47,3
6736
,220
36,3
9544
,564
42,7
5837
,309
272,
014
274,
868
282,
264
304,
180
308,
506
314,
380
0.9
0.8
0.8
–2.1
–23.5
0.5
0.1
–4.1
–12.7
4.1
1.0
2.7
1.5
1.4
1.9
Québ
ec C
ity77
077
778
46,
262
4,38
64,
134
5,51
84,
881
4,00
725
6,19
626
7,82
127
4,74
323
2,17
623
5,38
723
9,89
81.1
1.0
0.9
12.6
–30.0
–5.8
–2.6
–11.5
–17.9
5.0
4.5
2.6
2.9
1.4
1.9
Mon
tréal
3,95
83,
996
4,03
720
,420
14,3
7615
,392
19,0
9217
,110
14,8
8331
8,24
432
3,25
333
1,30
332
5,45
933
0,35
033
6,94
91.0
1.0
1.0
–9.9
–29.6
7.1
–3.9
–10.4
–13.0
3.5
1.6
2.5
1.4
1.5
2.0
Onta
rio13
,489
13,6
0613
,755
76,7
4260
,326
61,8
0558
,613
63,8
8660
,512
381,
328
392,
017
398,
171
517,
813
533,
304
542,
869
1.0
0.9
1.1
13.2
–21.4
2.5
–3.3
9.0
–5.3
5.0
2.8
1.6
4.7
3.0
1.8
Otta
wa
1,27
31,
286
1,29
48,
873
7,03
46,
225
8,12
26,
838
6,63
132
9,15
033
3,74
633
9,77
140
4,02
740
8,56
441
6,64
41.4
1.0
0.7
6.3
–20.7
–11.5
–2.8
–15.8
–3.0
2.5
1.4
1.8
2.6
1.1
2.0
Toro
nto
5,94
16,
042
6,14
748
,368
34,1
3338
,717
31,9
0736
,403
38,7
4852
0,66
353
3,03
554
3,45
660
5,47
362
0,13
763
1,16
91.7
1.7
1.7
21.7
–29.4
13.4
–5.7
14.1
6.4
7.5
2.4
2.0
5.1
2.4
1.8
Prai
ries
2,34
22,
378
2,41
717
,210
13,8
7014
,477
12,8
6914
,715
13,5
1326
0,30
827
4,07
028
6,99
039
7,47
041
0,65
942
3,78
01.6
1.5
1.7
31.2
–19.4
4.4
6.6
14.3
–8.2
5.5
5.3
4.7
3.2
3.3
3.2
Win
nipe
g77
878
979
84,
025
4,30
43,
953
3,25
83,
891
3,93
325
5,08
026
3,52
927
3,44
643
2,93
044
9,45
845
8,24
91.6
1.3
1.2
20.5
6.9
–8.2
2.5
19.4
1.1
5.7
3.3
3.8
4.2
3.8
2.0
albe
rta3,
860
3,97
34,
051
33,3
9634
,823
34,6
9826
,446
31,8
1131
,701
361,
969
378,
376
395,
376
435,
951
447,
813
462,
468
2.4
2.9
2.0
29.9
4.3
–0.4
8.9
20.3
–0.3
2.6
4.5
4.5
1.1
2.7
3.3
Calg
ary
1,30
91,
350
1,37
813
,186
12,8
3413
,444
9,59
312
,129
12,9
1241
2,31
543
1,76
045
1,79
849
0,12
850
9,41
552
6,00
23.2
3.1
2.1
43.5
–2.7
4.8
24.8
26.4
6.5
2.3
4.7
4.6
1.7
3.9
3.3
edm
onto
n1,
230
1,26
41,
289
12,7
5814
,006
11,7
3410
,166
13,1
1412
,442
334,
300
346,
581
362,
609
382,
809
387,
803
399,
334
2.8
2.8
1.9
38.3
9.8
–16.2
13.7
29.0
–5.1
2.7
3.7
4.6
0.9
1.3
3.0
Briti
sh C
olum
bia
4,61
84,
657
4,71
227
,465
25,2
5727
,819
26,3
8025
,564
25,4
2551
2,97
451
6,75
352
9,04
663
4,71
563
4,71
464
4,99
01.0
0.9
1.2
4.0
–8.0
10.1
17.0
–3.1
–0.5
–7.9
0.7
2.4
–0.4
0.0
1.6
Vanc
ouve
r2,
464
2,50
12,
541
19,0
7117
,357
16,5
3616
,958
18,0
7317
,339
730,
063
737,
162
750,
861
662,
097
662,
452
674,
797
1.5
1.5
1.6
6.7
–9.0
–4.7
31.3
6.6
–4.1
–6.4
1.0
1.9
–0.5
0.1
1.9
Vict
oria
363
365
367
1,66
31,
347
1,46
51,
591
1,61
01,
434
484,
164
486,
225
492,
802
400,
585
397,
915
403,
822
0.4
0.4
0.6
1.9
–19.0
8.7
–3.1
1.2
–10.9
–2.8
0.4
1.4
–2.8
–0.7
1.5
f = fo
reca
stIta
lics
indi
cate
per
cent
age
chan
ge.
Sour
ces:
CM
HC H
ousi
ng T
ime
Serie
s Da
taba
se; C
anad
ian
Real
Est
ate
Asso
ciat
ion;
Que
bec
Fede
ratio
n of
Rea
l Est
ate
Boar
ds; S
tatis
tics
Cana
da; T
he C
onfe
renc
e Bo
ard
of C
anad
a.

Autumn 2013—metropolitan Housing Outlook | 7
The Conference Board of Canada
national overview
Canada’s economy is again expected to grow by a modest 1.8 per cent this year, but increase to 2.4 per cent growth in 2014 thanks to the improv-
ing U.S. economy next year. A slower resale housing market and tighter mortgage rules discouraged builders in the new home market through the last half of 2012 and into the first quarter of 2013. Although starts have picked up again in recent months, the outlook calls for total housing starts to decline 15.5 per cent this year and grow by just 1.9 per cent next year.
eCONOMIC OuTlOOk
Canada’s real gross domestic product is set to grow by
1.8 per cent in 2013. For much of the first half of 2013,
economic indicators provided few encouraging signs.
But through the summer, consumer and business con-
fidence picked up and the U.S. economy gained some
speed. Indeed, stronger business investment is expected
to help Canada’s economic growth advance at a reason-
able pace (above 2 per cent) through the second half
of this year, leading to a 2.4 per cent forecast increase
in real GDP for 2014. However, hiring will remain
muted. And, while tight labour markets (especially in
Saskatchewan and Alberta) and subdued inflation will
help lift households’ purchasing power, real consumer
spending will not outpace income as households try to
reduce their debt burdens and increase savings. Public
sector spending will also remain muted this year and
next. Provincial and federal governments are both
targeting balanced budgets, some sooner than others,
resulting in very little contribution to economic growth.
Still, some provinces have avoided cutting back on
much-needed infrastructure, and most provinces are
accommodating modest budgetary increases to health
care spending. Thus, the brunt of the public sector cuts
in 2013–14 will be felt in public administration, educa-
tion, and social programs.
Canada
Housing Starts(000s)
f = forecastSources: The Conference Board of Canada; CMHC Housing TimeSeries Database.
House Price Growth(percentage chage)
f = forecastSources: The Conference Board of Canada; CMHC Housing TimeSeries Database; Canadian Real Estate Association; Quebec Federation of Real Estate Boards.
2010 11 12 13f 14f 15f 16f 17f0
50100150200250
Singles Multiples 20-year average
2010 11 12 13f 14f 15f 16f 17f0
2
4
6
8New Resale

8 | metropolitan Housing Outlook—Autumn 2013
The Conference Board of Canada
FINaNCIal MarkeTS OuTlOOk
The U.S. Federal Reserve has reiterated that the cur-
rent pace of quantitative easing through major bond
purchases will continue until the unemployment rate
falls below 7 per cent, and that interest rates will remain
essentially at zero until even later, when the unemploy-
ment rate falls to below 6.5 per cent. Equity markets
have been appeased, recovering from an early summer
dive and stabilizing. At the same time, given that the
Canadian economy is not yet at full capacity and that
near-term growth may be choppy, the Bank of Canada
has indicated that monetary conditions will remain
loose until economic growth strengthens or inflation
starts to accelerate. We expect the Bank of Canada will
likely start raising rates gradually by mid-2014, well
ahead of the U.S., largely because the gap between the
economic potential and the current output level is sig-
nificantly smaller in Canada than in the United States.
Therefore, as economic conditions improve south of
the border, excess capacity in Canada will be eaten up
more quickly.
Over the past few months, the loonie has lost ground
vis-à-vis the greenback. In part, the swoon in the
Canadian dollar—from above parity in February to
below US$0.95 in July—was the result of softer com-
modity prices, especially heavily discounted Western
Canadian Select crude oil. But it was also about the
strength in the U.S. dollar, as Canada’s currency
remained steady in comparison with many other curren-
cies. Federal Reserve statements about possibly easing
the pace of bond purchases in its quantitative easing
program made global financial and equity markets nerv-
ous and pushed up the value of the U.S. dollar. Overall,
the Canadian dollar is expected to average US$0.97 this
year and US$0.96 in 2014.
HOuSING OuTlOOk
Canada’s new home market capped an impressive
three-year run of growth last year. From 2010 to
2012, a recovering economy and low interest rates
drove demand for new homes, as builders increased
starts by an average of 13.4 per cent per year, up to
214,800 units in 2012—back above 200,000 units for
the first time since 2008. Growth in multiple-unit starts
was particularly strong over the past two years, thanks
to a wave of condominium development across the
country. But new home price growth remained modest,
at an annual average of 2.3 per cent. Average annual
growth in existing home prices was a much stronger
6.7 per cent in 2010 and 2011, but fell to just 0.2 per
cent last year, signalling a slower resale market. While
housing starts rose nearly 11 per cent in total last year,
developers began to curtail new home construction in
the second half of the year. The new home market was
feeling the effects of the federal government’s decision
to limit rising household debt by steadily lowering the
qualifying period for insured mortgages from 40 years
in 2008 to just 25 years by mid-2012, making it diffi-
cult for some first-time homebuyers to enter the market.
With economic growth tepid, builders continued to
reduce housing starts through the first quarter of 2013.
Starts then increased once again in the second quarter
Mortgage Approval Growth(dollar volume percentage change)
f = forecastSources: The Conference Board of Canada; Genworth MI Canada; CMHC Housing Time Series Database.
Household Net Worth(as a per cent of disposable income)
Sources: The Conference Board of Canada; Statistics Canada.
2010 11 12 13f 14f 15f 16f 17f−15−10
−505
1015
Conventional High-ratio
1998 00 02 04 06 08 10 12500
550
600
650
700

Autumn 2013—metropolitan Housing Outlook | 9
The Conference Board of Canada
of this year. In part, builders were lured back to the
market by rising sales of existing homes and prices
in the first months of 2013. Still, the Canadian hous-
ing market is expected to stay cool this year and next.
Following the recent run-up in multiple starts in a
number of urban centres, a significant number of new
units will become available over coming months, help-
ing to keep some builders at bay. Overall, housing
starts are forecast to fall by 15.5 per cent to 181,400
units in 2013 and increase by a modest 1.9 per cent
to 184,900 units in 2014. New home price growth is
expected to remain around 2 per cent this year and next.
Meanwhile, resale home prices are set to rise 3.1 per
cent in 2013, because of stronger gains at the beginning
of this year, and a much more moderate 1.7 per cent
next year.
Looking ahead, there is room for more growth in the
new home market. In general, even with the significant
growth in housing starts since 2010, they are still in line
with demographic requirements. Over the past 20 years
on average, 0.47 homes have been started per additional
person in Canada’s population. During the past three
years, this ratio has been 0.46—well within historical
norms. By 2015, better employment gains will also
reignite demand despite the gradual rise in interest
Consumer Finances(left, per cent; right, per 1 million people)
1998 00 02 04 06 08 10 120.10.20.30.40.50.60.7
100125150175200225250
Mortgages in arrears Bankruptcies
1998 00 02 04 06 08 10 120.3
0.4
0.5
0.6
0.7
50
100
150
200
250Mortgages in arrears Bankruptcies
1998 00 02 04 06 08 10 120.1
0.3
0.5
0.7
0.9
200
250
300
350
400Mortgages in arrears Bankruptcies
1998 00 02 04 06 08 10 120.20.30.40.50.60.7
100150200250300350
Mortgages in arrears Bankruptcies
1998 00 02 04 06 08 10 120
0.2
0.4
0.6
0.8
60
100
140
180
220Mortgages in arrears Bankruptcies
1998 00 02 04 06 08 10 120.1
0.3
0.5
0.7
0.9
100
150
200
250
300Mortgages in arrears Bankruptcies
Atlantic Provinces Quebec
Ontario Prairie Provinces
Alberta British Columbia
Sources: The Conference Board of Canada; Canadian Bankers Association; Superintendent of Bankruptcy Canada.
10 | metropolitan Housing Outlook—Autumn 2013
The Conference Board of Canada
rates. As economic growth accelerates, therefore,
developers will be encouraged to boost housing starts to
about 197,100 units in 2015 and above 210,000 units by
2017. Growth in new home prices is forecast to remain
at 2 per cent on an average annual basis from 2015 to
2017, while resale price growth will be slightly higher,
at 2.5 per cent per year on average.
MOrTGaGe OuTlOOk
Mortgage interest rates are widely expected to increase
in the next year, pushing up carrying costs. Yields on
bonds, from which banks finance mortgages, have already
moved higher. Still, the Bank of Canada is not expected
to start raising its overnight rate before mid-2014, and
even then, the Bank will raise rates only gradually, giv-
ing households time to adapt. Furthermore, employment
and income growth will help to further alleviate some of
the pressure of rising interest rates on households. In fact,
rising mortgage rates could even provide a short-term
boost to the market, as house-hunters with mortgages
pre-approved at low interest rates rush to buy homes
before these contracted rates expire. The current out-
look calls for the three-year conventional mortgage rate
to rise from a record-low 3.8 per cent this year to 4.4
per cent in 2014 and 5.1 per cent in 2015.
The total number of mortgage approvals fell by 0.3 per
cent 2012, as the resale housing market slowed in the
second half of last year. Approvals in the new home
market continued to climb however, rising 2.2 per
cent. Both markets are forecast to see lower levels of
mortgage approvals in 2013, reducing total approvals
by 2.3 per cent. With growth in the new home market
expected to be modest in 2014, the number of new
mortgage approvals will decline once again. However,
thanks to the existing home market, total mortgage
approvals are anticipated to rise in 2014, up by 2.9 per
cent. The dollar volume of mortgage approvals rose
0.7 per cent last year, thanks to price growth in the
new and resale markets. A similar increase is expected
for 2013, with growth in dollar volumes improving to
4.5 per cent next year. Not surprising, tighter mortgage
rules are having a bigger impact on the number of
high-ratio mortgage approvals (set to fall 3.1 per cent
in 2013) than the number of conventional mortgage
approvals (set to drop 1.7 per cent). Growth in high-
ratio approvals will be 1.3 per cent for 2014, while con-
ventional mortgage approvals will rise 4.2 per cent.
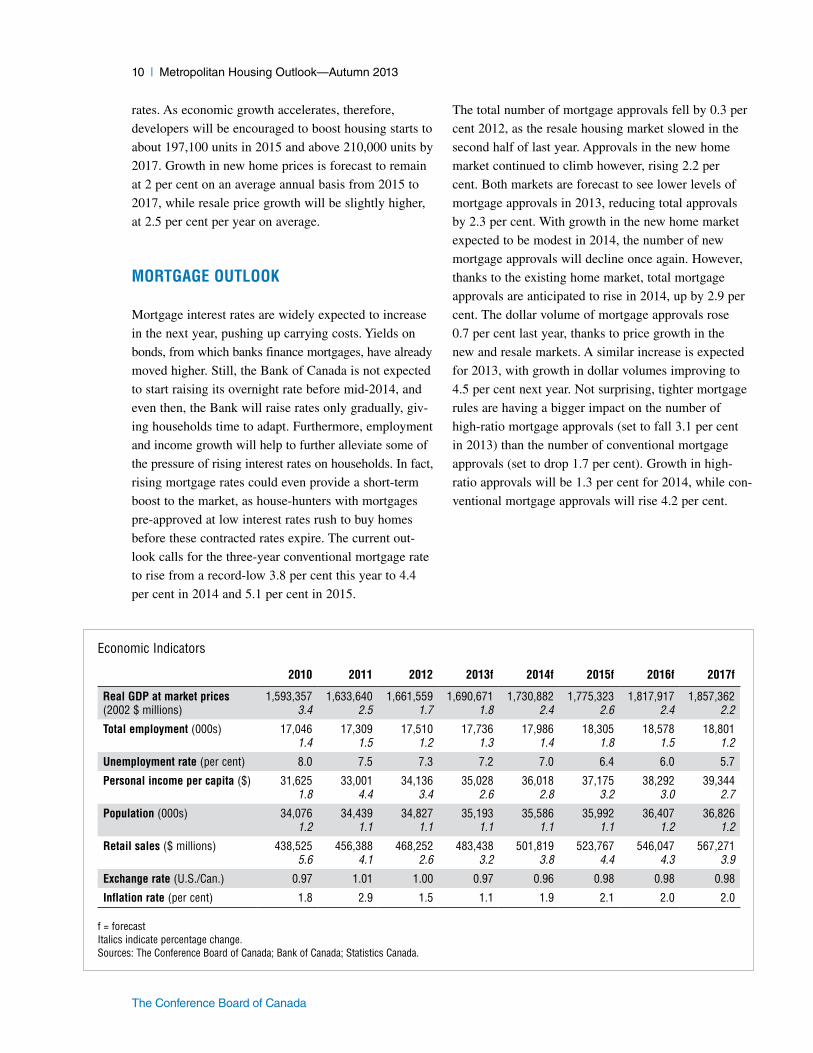
Economic Indicators
2010 2011 2012 2013f 2014f 2015f 2016f 2017f
real GDP at market prices 1,593,357 1,633,640 1,661,559 1,690,671 1,730,882 1,775,323 1,817,917 1,857,362(2002 $ millions) 3.4 2.5 1.7 1.8 2.4 2.6 2.4 2.2
Total employment (000s) 17,046 17,309 17,510 17,736 17,986 18,305 18,578 18,8011.4 1.5 1.2 1.3 1.4 1.8 1.5 1.2
unemployment rate (per cent) 8.0 7.5 7.3 7.2 7.0 6.4 6.0 5.7
Personal income per capita ($) 31,625 33,001 34,136 35,028 36,018 37,175 38,292 39,3441.8 4.4 3.4 2.6 2.8 3.2 3.0 2.7
Population (000s) 34,076 34,439 34,827 35,193 35,586 35,992 36,407 36,8261.2 1.1 1.1 1.1 1.1 1.1 1.2 1.2
retail sales ($ millions) 438,525 456,388 468,252 483,438 501,819 523,767 546,047 567,2715.6 4.1 2.6 3.2 3.8 4.4 4.3 3.9
exchange rate (U.S./Can.) 0.97 1.01 1.00 0.97 0.96 0.98 0.98 0.98
Inflation rate (per cent) 1.8 2.9 1.5 1.1 1.9 2.1 2.0 2.0
f = forecastItalics indicate percentage change.Sources: The Conference Board of Canada; Bank of Canada; Statistics Canada.

Autumn 2013—metropolitan Housing Outlook | 11
The Conference Board of Canada
Financial Indicators(per cent)
2010 2011 2012 2013f 2014f 2015f 2016f 2017f
Bank rate 0.9 1.3 1.3 1.2 1.5 2.3 3.2 3.9
Prime lending rate 2.6 3.0 3.0 3.0 3.3 4.1 5.0 5.7
Three-month Treasury bill 0.6 0.9 1.0 1.0 1.2 2.0 2.9 3.5
One-year conventional mortgage rate 3.5 3.5 3.2 3.1 3.7 4.5 5.4 6.0
Three-year conventional mortgage rate 4.3 4.3 3.9 3.8 4.4 5.1 5.9 6.6
Five-year conventional mortgage rate 5.6 5.4 5.3 5.2 5.3 5.6 6.3 6.9
Federal bonds: 1 year 1.5 1.4 1.1 1.2 1.5 2.1 2.9 3.6
Federal bonds: 5 years 2.4 2.1 1.4 1.7 2.0 2.4 3.0 3.6
Federal bonds: 7 years 2.7 2.3 1.5 2.0 2.3 2.5 3.1 3.7
Federal bonds: 10 years 3.2 2.8 1.9 2.3 2.5 2.7 3.2 3.8
Federal bonds: long term 3.7 3.3 2.4 2.9 3.0 3.0 3.4 3.9
f = forecastItalics indicate percentage change.Sources: The Conference Board of Canada; Bank of Canada; Statistics Canada.
Housing Indicators
2010 2011 2012 2013f 2014f 2015f 2016f 2017f
Housing starts 189,930 193,950 214,827 181,446 184,927 197,088 207,126 210,21227.4 2.1 10.8 –15.5 1.9 6.6 5.1 1.5
Singles 92,554 82,392 83,657 76,797 77,530 81,028 84,391 82,60922.3 –11.0 1.5 –8.2 1.0 4.5 4.1 –2.1
Multiples 97,376 111,558 131,170 104,650 107,397 116,060 122,735 127,60332.6 14.6 17.6 –20.2 2.6 8.1 5.8 4.0
Housing completions 186,212 175,431 180,646 188,966 177,776 183,522 195,782 201,2935.3 –5.8 3.0 4.6 –5.9 3.2 6.7 2.8
Singles 90,578 79,976 80,630 79,303 76,330 78,099 82,314 82,29315.7 –11.7 0.8 –1.6 –3.7 2.3 5.4 0.0
Multiples 95,635 95,455 100,015 109,663 101,446 105,423 113,468 119,000–3.0 –0.2 4.8 9.6 –7.5 3.9 7.6 4.9
average price of a new home ($) 395,561 404,247 413,730 421,284 429,782 439,275 447,938 456,4882.2 2.2 2.3 1.8 2.0 2.2 2.0 1.9
average price of a resale home ($) 338,199 360,648 361,494 372,769 379,236 389,163 399,110 408,6576.8 6.6 0.2 3.1 1.7 2.6 2.6 2.4
f = forecastItalics indicate percentage change.Sources: The Conference Board of Canada; CMHC Housing Time Series Database; Canadian Real Estate Association; Quebec Federation of Real Estate Boards; Statistics Canada.

12 | metropolitan Housing Outlook—Autumn 2013
The Conference Board of Canada
G rowth in the Atlantic Canadian economy is expected to be 2.3 per cent this year and 1.9 per cent in 2014. Rising oil production both in
Newfoundland and Labrador and in Nova Scotia is contrib-uting to these increases. However, housing starts in all four provinces are forecast to decline in 2013 and 2014, having topped 10,000 units for the past 12 years now. Starts will continue to fall in the medium term as well, bringing them back in line with demographic needs.
eCONOMIC OuTlOOk
Atlantic Canada’s real gross domestic product is
expected to grow by 2.3 per cent in 2013, following a
1.5 per cent contraction in 2012. The region’s economy
is then forecast to post a more modest increase in 2014,
rising 1.9 per cent. Much of the decrease in real GDP
last year, and the strength this year, has been driven by
change in the Newfoundland and Labrador economy.
The province’s economy contracted by 4.8 per cent
in 2012, largely because of a 20 per cent drop in oil
production. This year, renewed growth in the oil sec-
tor, along with a booming construction industry, will
allow Newfoundland and Labrador’s economy to grow
by a forecast 5.4 per cent. Meanwhile, after strug-
gling for the past two years, Nova Scotia’s economy
look brighter in the short term as well, thanks to Deep
Panuke’s newly completed offshore natural gas field.
Production at the field is forecast to help lift real GDP
growth from 1.1 per cent 2013 to 2.9 per cent next
year. However, the economy of Prince Edward Island
continues to face a less-than-stellar outlook. Efforts by
the provincial and federal governments to balance their
budgets will continue to weigh on the economy, holding
growth in real GDP to a forecast 1.3 per cent this year
and just 1 per cent in 2014. In New Brunswick, eco-
nomic growth is forecast to accelerate from 0.8 per cent
in 2013 to 1.9 per cent next year, as weakness in the
construction and food processing sectors offsets gains
in the resources and manufacturing sectors.
provincial overview
atlantic Canada
Housing Starts(000s)
f = forecastSources: The Conference Board of Canada; CMHC Housing TimeSeries Database.
2010 11 12 13f 14f 15f 16f 17f0
5
10
15
Singles Multiples 20-year average
House Price Growth(percentage chage)
f = forecastSources: The Conference Board of Canada; CMHC Housing TimeSeries Database; Canadian Real Estate Association.
2010 11 12 13f 14f 15f 16f 17f−2
0
2
4
6
New Resale
Autumn 2013—metropolitan Housing Outlook | 13
The Conference Board of Canada
HOuSING OuTlOOk
Atlantic Canada’s new home market came roaring back
after the global recession, as builders increased hous-
ing starts 17.2 per cent in 2010, up to 12,800 units,
their highest level since 2003. Low interest rates and
improved consumer confidence were boosting hous-
ing demand across the region. Buyers of new homes in
Nova Scotia were benefitting from the introduction of
a $7,000 sales tax rebate that year as well. Somewhat
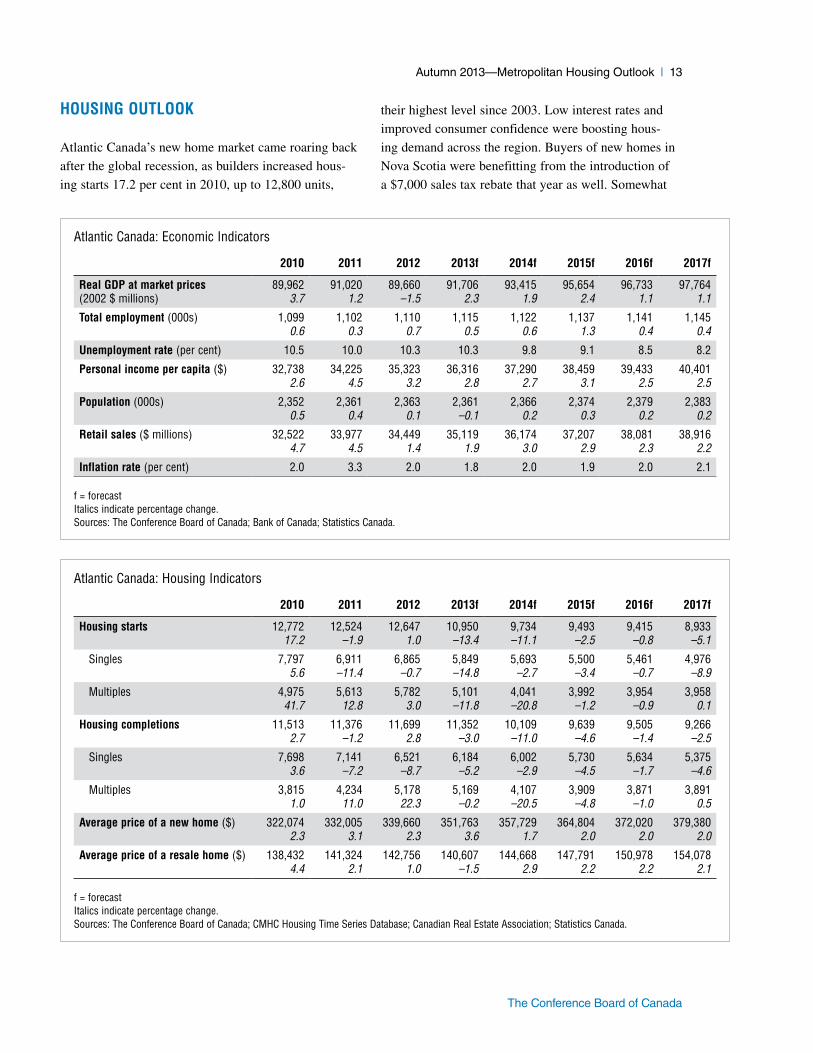
Atlantic Canada: Economic Indicators
2010 2011 2012 2013f 2014f 2015f 2016f 2017f
real GDP at market prices 89,962 91,020 89,660 91,706 93,415 95,654 96,733 97,764(2002 $ millions) 3.7 1.2 –1.5 2.3 1.9 2.4 1.1 1.1
Total employment (000s) 1,099 1,102 1,110 1,115 1,122 1,137 1,141 1,1450.6 0.3 0.7 0.5 0.6 1.3 0.4 0.4
unemployment rate (per cent) 10.5 10.0 10.3 10.3 9.8 9.1 8.5 8.2
Personal income per capita ($) 32,738 34,225 35,323 36,316 37,290 38,459 39,433 40,4012.6 4.5 3.2 2.8 2.7 3.1 2.5 2.5
Population (000s) 2,352 2,361 2,363 2,361 2,366 2,374 2,379 2,3830.5 0.4 0.1 –0.1 0.2 0.3 0.2 0.2
retail sales ($ millions) 32,522 33,977 34,449 35,119 36,174 37,207 38,081 38,9164.7 4.5 1.4 1.9 3.0 2.9 2.3 2.2
Inflation rate (per cent) 2.0 3.3 2.0 1.8 2.0 1.9 2.0 2.1
f = forecast Italics indicate percentage change.Sources: The Conference Board of Canada; Bank of Canada; Statistics Canada.
Atlantic Canada: Housing Indicators
2010 2011 2012 2013f 2014f 2015f 2016f 2017f
Housing starts 12,772 12,524 12,647 10,950 9,734 9,493 9,415 8,93317.2 –1.9 1.0 –13.4 –11.1 –2.5 –0.8 –5.1
Singles 7,797 6,911 6,865 5,849 5,693 5,500 5,461 4,9765.6 –11.4 –0.7 –14.8 –2.7 –3.4 –0.7 –8.9
Multiples 4,975 5,613 5,782 5,101 4,041 3,992 3,954 3,95841.7 12.8 3.0 –11.8 –20.8 –1.2 –0.9 0.1
Housing completions 11,513 11,376 11,699 11,352 10,109 9,639 9,505 9,2662.7 –1.2 2.8 –3.0 –11.0 –4.6 –1.4 –2.5
Singles 7,698 7,141 6,521 6,184 6,002 5,730 5,634 5,3753.6 –7.2 –8.7 –5.2 –2.9 –4.5 –1.7 –4.6
Multiples 3,815 4,234 5,178 5,169 4,107 3,909 3,871 3,8911.0 11.0 22.3 –0.2 –20.5 –4.8 –1.0 0.5
average price of a new home ($) 322,074 332,005 339,660 351,763 357,729 364,804 372,020 379,3802.3 3.1 2.3 3.6 1.7 2.0 2.0 2.0
average price of a resale home ($) 138,432 141,324 142,756 140,607 144,668 147,791 150,978 154,0784.4 2.1 1.0 –1.5 2.9 2.2 2.2 2.1
f = forecast Italics indicate percentage change.Sources: The Conference Board of Canada; CMHC Housing Time Series Database; Canadian Real Estate Association; Statistics Canada.

14 | metropolitan Housing Outlook—Autumn 2013
The Conference Board of Canada
surprisingly, even though demand was accelerating,
growth in new home prices was slowing, slipping to a
modest 2.3 per cent in 2010, down from 3.1 per cent the
previous year and 10.9 per cent in 2008. In the resale
market, existing home prices did strengthen a little in
2010, rising from 3.7 per cent in 2009 to 4.4 per cent.
Weaker economies hampered demand in the hous-
ing markets in Newfoundland and Labrador and in
New Brunswick in 2011. In turn, builders in those
two provinces reduced housing starts, lowering them
1.9 per cent for the Atlantic region as a whole—even
though starts in Nova Scotia and Prince Edward Island
continued to increase. Indeed, Prince Edward Island’s
new home market was particularly busy in 2011, with
builders raising starts by nearly 25 per cent in response
to stronger international migration numbers as a result
of the province’s nominee program. Builders in Prince
Edward Island held housing starts steady last year as
well. A number of new condominium developments
also increased starts in Newfoundland and Labrador’s
new home market in 2012. But, with real GDP growth
still muted, starts fell in each of Nova Scotia and
New Brunswick, holding the increase in total starts
for Atlantic Canada to just 1 per cent last year. Home
prices in the new and resale markets continued to be
modest over the past two years, increasing 2.7 per cent
on an average annual basis in the new market and an
average of 1.6 per cent in the resale market.
In spite of stronger economic growth overall for
Atlantic Canada in 2013, tighter mortgage rules, the
completion of some condominium projects, and a return
to more modest population growth in Prince Edward
Island have all been lowering demand in the region’s
new home market. In addition, in level terms, housing
starts in Atlantic Canada have been well above demo-
graphic requirements for a number of years now, having
topped 10,000 units annually for more than a decade.
Moreover, with interest rates eventually rising, builders
are expected to lower Atlantic Canada’s housing starts
both this year and through the medium term. Starts are
forecast to fall 13.4 per cent in 2013, 11.1 per cent in
2014, and by an average of 2.8 per cent per year from
2015 to 2017.
Growth in new home prices is expected to rise slightly
in 2013, up to 3.6 per cent, while resale prices are fore-
cast to fall 1.5 per cent, the first annual price decline in
13 years. Over the rest of the forecast, 2014 to 2017,
price growth in the new market is anticipated to aver-
age 1.9 per cent annually, while it is forecast to average
2.3 per cent per year in the resale market.
Autumn 2013—metropolitan Housing Outlook | 15
The Conference Board of Canada
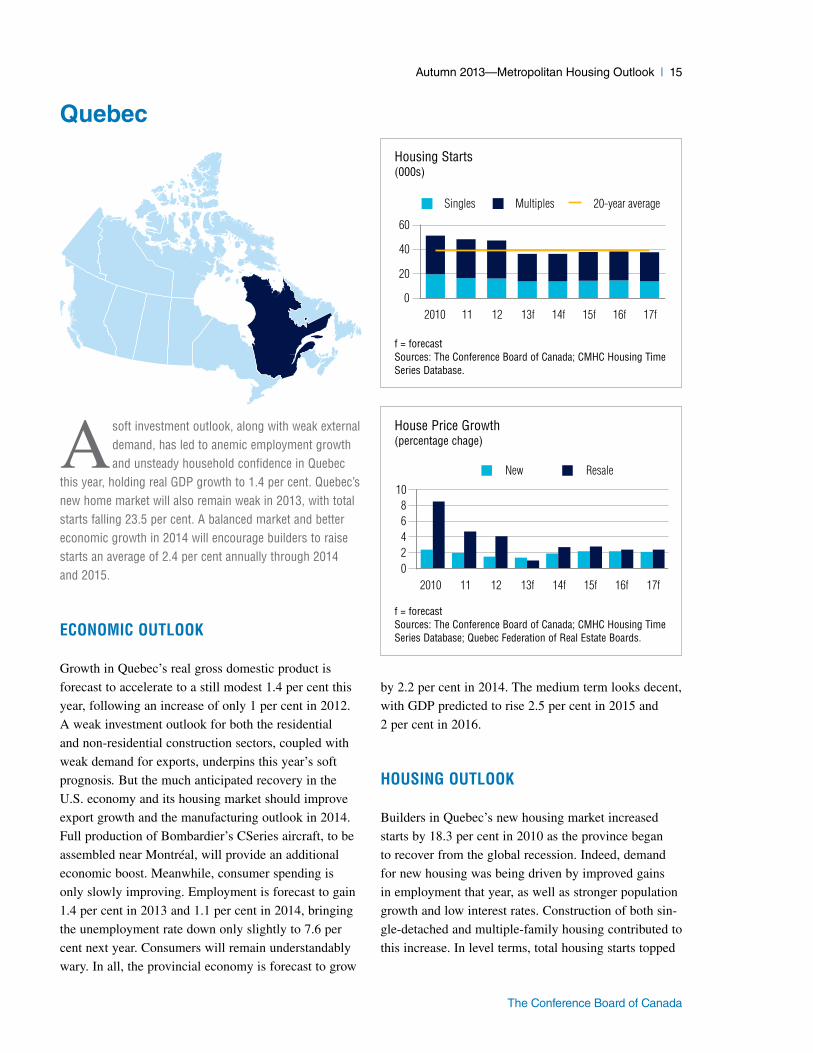
A soft investment outlook, along with weak external demand, has led to anemic employment growth and unsteady household confidence in Quebec
this year, holding real GDP growth to 1.4 per cent. Quebec’s new home market will also remain weak in 2013, with total starts falling 23.5 per cent. A balanced market and better economic growth in 2014 will encourage builders to raise starts an average of 2.4 per cent annually through 2014 and 2015.
eCONOMIC OuTlOOk
Growth in Quebec’s real gross domestic product is
forecast to accelerate to a still modest 1.4 per cent this
year, following an increase of only 1 per cent in 2012.
A weak investment outlook for both the residential
and non-residential construction sectors, coupled with
weak demand for exports, underpins this year’s soft
prognosis. But the much anticipated recovery in the
U.S. economy and its housing market should improve
export growth and the manufacturing outlook in 2014.
Full production of Bombardier’s CSeries aircraft, to be
assembled near Montréal, will provide an additional
economic boost. Meanwhile, consumer spending is
only slowly improving. Employment is forecast to gain
1.4 per cent in 2013 and 1.1 per cent in 2014, bringing
the unemployment rate down only slightly to 7.6 per
cent next year. Consumers will remain understandably
wary. In all, the provincial economy is forecast to grow
by 2.2 per cent in 2014. The medium term looks decent,
with GDP predicted to rise 2.5 per cent in 2015 and
2 per cent in 2016.
HOuSING OuTlOOk
Builders in Quebec’s new housing market increased
starts by 18.3 per cent in 2010 as the province began
to recover from the global recession. Indeed, demand
for new housing was being driven by improved gains
in employment that year, as well as stronger population
growth and low interest rates. Construction of both sin-
gle-detached and multiple-family housing contributed to
this increase. In level terms, total housing starts topped
Quebec
Housing Starts(000s)
f = forecastSources: The Conference Board of Canada; CMHC Housing Time Series Database.
2010 11 12 13f 14f 15f 16f 17f0
20
40
60
Singles Multiples 20-year average
House Price Growth(percentage chage)
f = forecastSources: The Conference Board of Canada; CMHC Housing Time Series Database; Quebec Federation of Real Estate Boards.
2010 11 12 13f 14f 15f 16f 17f02468
10
New Resale

16 | metropolitan Housing Outlook—Autumn 2013
The Conference Board of Canada
51,000 units in 2010, their highest level since 2004.
However, in spite of the higher population growth,
at their 2010 level, starts were above demographic
requirements. As a result, inventories rose, and growth
in new home prices slowed, dropping to 2.4 per cent,
down from 2.9 per cent the previous year and an aver-
age of 5 per cent annually in the five years before that.
Quebec: Economic Indicators
2010 2011 2012 2013f 2014f 2015f 2016f 2017f
real GDP at market prices 295,398 300,275 303,322 307,656 314,389 322,277 328,842 334,565(2002 $ millions) 2.5 1.7 1.0 1.4 2.2 2.5 2.0 1.7
Total employment (000s) 3,918 3,955 3,985 4,042 4,085 4,144 4,191 4,2201.8 1.0 0.8 1.4 1.1 1.5 1.1 0.7
unemployment rate (per cent) 7.9 7.7 7.8 7.7 7.6 7.2 6.9 6.8
Personal income per capita ($) 33,518 34,828 35,921 36,486 37,449 38,548 39,591 40,5331.8 3.9 3.1 1.6 2.6 2.9 2.7 2.4
Population (000s) 7,895 7,968 8,043 8,109 8,173 8,236 8,299 8,3621.0 0.9 0.9 0.8 0.8 0.8 0.8 0.8
retail sales ($ millions) 99,551 102,505 103,648 105,551 109,222 113,052 116,600 119,8876.2 3.0 1.1 1.8 3.5 3.5 3.1 2.8
Inflation rate (per cent) 1.3 3.0 2.1 1.2 2.0 2.2 2.0 1.9
f = forecast Italics indicate percentage change.Sources: The Conference Board of Canada; Bank of Canada; Statistics Canada.
Quebec: Housing Indicators
2010 2011 2012 2013f 2014f 2015f 2016f 2017f
Housing starts 51,363 48,387 47,367 36,220 36,395 37,907 38,539 37,64518.3 –5.8 –2.1 –23.5 0.5 4.2 1.7 –2.3
Singles 19,549 16,554 16,059 13,796 13,940 14,355 14,568 13,71311.5 –15.3 –3.0 –14.1 1.0 3.0 1.5 –5.9
Multiples 31,814 31,833 31,308 22,424 22,456 23,552 23,971 23,93223.0 0.1 –1.6 –28.4 0.1 4.9 1.8 –0.2
Housing completions 45,798 44,526 44,564 42,758 37,309 36,899 38,291 38,1175.8 –2.8 0.1 –4.1 –12.7 –1.1 3.8 –0.5
Singles 18,738 15,779 15,847 14,228 13,639 13,548 13,962 13,52511.7 –15.8 0.4 –10.2 –4.1 –0.7 3.1 –3.1
Multiples 27,060 28,747 28,716 28,529 23,670 23,351 24,330 24,5922.1 6.2 –0.1 –0.7 –17.0 –1.3 4.2 1.1
average price of a new home ($) 293,728 299,580 304,180 308,506 314,380 321,452 328,636 335,6442.4 2.0 1.5 1.4 1.9 2.2 2.2 2.1
average price of a resale home ($) 249,591 261,411 272,014 274,868 282,264 290,069 297,039 304,1798.5 4.7 4.1 1.0 2.7 2.8 2.4 2.4
f = forecast Italics indicate percentage change.Sources: The Conference Board of Canada; CMHC Housing Time Series Database; Quebec Federation of Real Estate Boards; Statistics Canada.

Autumn 2013—metropolitan Housing Outlook | 17
The Conference Board of Canada
Higher inventories, a more modest economy, and
increased taxes all led builders to reduce housing starts
through 2011 and 2012. Starts fell 5.8 per cent in
2011 and another 2.1 per cent last year. Much of this
decrease was in the singles market, as multiple starts
were essentially flat in 2011 and declined just 1.6 per
cent in 2012. The multiples market was being boosted
by a number of condominium developments, especially
in Montréal and Québec City. Even with the lower
starts over the past two years, new home price growth
continued to decelerate, slipping to 1.5 per cent for
2012. Growth in resale prices was also slowing during
this time—falling from 8.5 per cent in 2010 to 4.1 per
cent last year—suggesting a weaker resale market
as well.
Builders reduced both single and multiple starts signifi-
cantly in the first quarter of 2013, as economic growth
remained modest and some condominium projects
wound down. The market was also being hampered by
tighter mortgage rules that were introduced last year.
Single starts slowed again in the second quarter of this
year, while multiples recorded a small increase. In all,
total housing starts are expected to decline 23.5 per cent
for 2013, down to 36,200 units, their lowest level since
2001. Price growth, in both the new and resale markets,
is forecast to remain modest in 2013, at 1.4 per cent and
1 per cent, respectively.
With housing starts now closer to demographic require-
ments, an improved economy and steady population
growth should bring builders back to the new home
market starting in 2014. Starts are expected to increase
0.5 per cent next year and 4.2 per cent in 2015. Price
growth is also anticipated to accelerate, albeit slowly,
in the coming years. New home prices are forecast to
grow by 1.9 per cent in 2014 and 2.2 per cent in 2015.
Resale price growth is expected to be just slightly
higher, at 2.7 per cent per year over the same two years.

18 | metropolitan Housing Outlook—Autumn 2013
The Conference Board of Canada
Ontario’s real gross domestic product will grow just 1.2 per cent in 2013, held back by weakness in both the public and private sectors. However,
growth in the economy is then expected to improve to 2.2 per cent next year. The province’s new home market is expected to see housing starts fall for the first time in four years this year as both single and multiple starts decline. With an improved economy next year, builders will slowly return to the new home market, increasing starts a modest 2.5 per cent for 2014.
eCONOMIC OuTlOOk
Broad-based weakness in demand from households,
government, and businesses (especially during late 2012
and early 2013) will result in real GDP growth of just
1.2 per cent for Ontario this year—the slowest pace
since the recession. This lacklustre pace of economic
growth, along with resulting slow employment growth,
is weighing on consumer spending, which is anticipated
to grow just 1.4 per cent for 2013. However, household
confidence (as measured by The Conference Board of
Canada’s Index of Consumer Confidence) has been
increasing recently, and this will translate into higher
spending on goods and services, especially durable
goods. As a result, real consumer spending is expected
to advance 2.7 per cent next year. Improving business
confidence and demand for exports should also help
overall economic growth pick up steam later this year
and into 2014. Accordingly, real GDP will expand
2.2 per cent next year.
HOuSING OuTlOOk
Ontario’s new home market has been robust for the
past three years. Indeed, stronger demand following the
2009 recession enticed builders to increase total hous-
ing starts an average of 15.1 per cent per year from
2010 to 2012. Demand was being boosted not only by
an improved economy but also by healthy population
gains and lower interest rates. In level terms, Ontario’s
housing starts reached 76,700 units in 2012, their
highest level since 2005. With stronger demand came
ontario
Housing Starts(000s)
f = forecastSources: The Conference Board of Canada; CMHC Housing TimeSeries Database.
2010 11 12 13f 14f 15f 16f 17f0
20406080
100
Singles Multiples 20-year average
House Price Growth(percentage chage)
f = forecastSources: The Conference Board of Canada; CMHC Housing TimeSeries Database; Canadian Real Estate Association.
2010 11 12 13f 14f 15f 16f 17f02468
10New Resale

Autumn 2013—metropolitan Housing Outlook | 19
The Conference Board of Canada
increased price growth as well—new home prices rose
an average of 3.8 per cent from 2010 to 2012, after
holding flat in 2009. Growth in resale home prices was
even larger during this time, at 6.7 per cent on an aver-
age annual basis.
The growth in housing starts in 2010 was split between
the singles and multiples markets. However, over
2011–12, all of the increase in starts was due to more
multiple-unit construction, as single-detached starts
declined each year. One of the biggest factors driving
Ontario: Economic Indicators
2010 2011 2012 2013f 2014f 2015f 2016f 2017f
real GDP at market prices 556,863 566,741 574,469 581,252 594,144 610,994 627,020 640,899(2002 $ millions) 3.5 1.8 1.4 1.2 2.2 2.8 2.6 2.2
Total employment (000s) 6,611 6,732 6,786 6,874 6,982 7,114 7,238 7,3301.6 1.8 0.8 1.3 1.6 1.9 1.7 1.3
unemployment rate (per cent) 8.6 7.8 7.9 7.7 7.6 6.6 6.1 5.9
Personal income per capita ($) 37,004 37,942 38,810 39,681 40,887 42,131 43,396 44,5652.7 2.5 2.3 2.2 3.0 3.0 3.0 2.7
Population (000s) 13,203 13,350 13,489 13,606 13,755 13,917 14,091 14,2701.2 1.1 1.0 0.9 1.1 1.2 1.2 1.3
retail sales ($ millions) 156,904 162,528 165,177 166,624 173,391 180,135 186,970 193,1915.4 3.6 1.6 0.9 4.1 3.9 3.8 3.3
Inflation rate (per cent) 2.4 3.1 1.4 1.3 2.0 2.1 2.0 2.0
f = forecast Italics indicate percentage change.Sources: The Conference Board of Canada; Bank of Canada; Statistics Canada.
Ontario: Housing Indicators
2010 2011 2012 2013f 2014f 2015f 2016f 2017f
Housing starts 60,433 67,821 76,742 60,326 61,805 70,458 81,339 86,98520.0 12.2 13.2 –21.4 2.5 14.0 15.4 6.9
Singles 28,089 26,884 25,567 23,282 23,630 26,691 30,789 32,07124.1 –4.3 –4.9 –8.9 1.5 13.0 15.4 4.2
Multiples 32,344 40,937 51,175 37,044 38,175 43,767 50,551 54,91316.6 26.6 25.0 –27.6 3.1 14.6 15.5 8.6
Housing completions 61,419 60,642 58,613 63,886 60,512 62,653 71,303 78,34011.2 –1.3 –3.3 9.0 –5.3 3.5 13.8 9.9
Singles 27,497 24,798 26,351 24,197 23,999 24,852 28,501 30,67011.0 –9.8 6.3 –8.2 –0.8 3.6 14.7 7.6
Multiples 33,922 35,844 32,261 39,688 36,513 37,801 42,802 47,67111.3 5.7 –10.0 23.0 –8.0 3.5 13.2 11.4
average price of a new home ($) 474,960 494,665 517,813 533,304 542,869 554,947 566,368 577,8432.5 4.1 4.7 3.0 1.8 2.2 2.1 2.0
average price of a resale home ($) 340,225 363,073 381,328 392,017 398,171 406,163 414,709 423,1688.3 6.7 5.0 2.8 1.6 2.0 2.1 2.0
f = forecast Italics indicate percentage change.Sources: The Conference Board of Canada; CMHC Housing Time Series Database; Canadian Real Estate Association; Statistics Canada.

20 | metropolitan Housing Outlook—Autumn 2013
The Conference Board of Canada
multiples construction in recent years has been the
influx of big high-rise condominiums, especially in
Toronto. Apartment condominium starts in Toronto
alone grew more than 70 per cent during 2010 and
2011, and by a further 42.8 per cent last year, to reach
a record 27,400 units in 2012. Province-wide, mul-
tiple starts were 67 per cent of the total starts built
last year, up from a share of 39 per cent just 10 years
ago. Apartment condominiums have become a more
attractive purchase for homeowners for several reasons,
not the least of which is their relative affordability
compared with single-detached homes. In addition,
apartment condominiums are popular with an aging
population, foreign investors, and also those who are
choosing to live closer to the downtown core to avoid
increased traffic flows.
A sluggish economy, tighter mortgage rules, and the
completion of several large developments have all
worked to reduce housing starts in both the singles
and multiples markets in recent months. Both single
and multiple housing starts fell through the second
half of 2012 and into the first quarter of this year.
While multiple starts then increased once more in
the second quarter, single starts continued on their
downward trend. In total, housing starts are forecast
to slip 21.4 per cent for 2013. Modestly rising inter-
est rates will keep demand in check early in 2014 as
well. Builders are forecast to continue to reduce starts
in the first half of next year. But renewed growth in the
economy next year should create additional demand in
the second half of 2014, helping to raise housing starts
by 2.5 per cent for the year as a whole. Growth in new
home prices is expected to decelerate this year and next,
down to 3 per cent and 1.8 per cent respectively. Resale
prices are forecast to grow by similar rates—2.8 in
2013 and 1.6 per cent in 2014.
Steady growth in real GDP and continued increases in
the population should help boost growth in Ontario’s
new home sector through the medium term. We antici-
pate housing starts will reach nearly 87,000 units by
2017. Growth in multiples will be only slightly higher
than that of singles in the coming years. Meanwhile,
price increases in both the new and resale home mar-
kets are anticipated to be modest, at an average of
2.1 per cent per year from 2015 to 2017.

Autumn 2013—metropolitan Housing Outlook | 21
The Conference Board of Canada
Housing markets in Manitoba and Saskatchewan continue to flourish, thanks to decent economic growth, ongoing job gains, and robust population
advances. Expected interest rate hikes next year are fore-cast to cool these markets only slightly. Housing demand is predicted to remain solid in both 2013 and 2014 and over the following few years. Although last year’s construction spike is unsustainable, housing starts are expected to stay high, even by recent standards, over the next few years. Price increases for both new and existing homes are also predicted to cool, but only a small slowing is expected.
eCONOMIC OuTlOOk
Healthy GDP growth continues in the Prairie provinces
of Manitoba and Saskatchewan, although it throttled
back to the mid-2 per cent range in 2012 from over
3 per cent in 2010 and 2011. Another 2.5 per cent GDP
rise is on tap for this year, but increases will ultimately
cool gradually to 1.6 per cent in 2017. Employment is
also forecast to keep rising, although gains will slow
from 2.2 per cent in 2013 to 1.1 per cent by 2017.
This will cut the unemployment rate from 5.1 per cent
in 2012 to 4.7 per cent this year and to 4.5 per cent
by 2017.
Economic growth in Manitoba will be modest this year
as a result of weakness in the metal mining sector and
subpar advances among services-producing industries.
There will still be decent gains in the manufacturing,
construction, and agriculture sectors. In Saskatchewan,
strong gains in mineral fuels production, as well as con-
struction and manufacturing, will keep the goods-pro-
ducing sector growing at a robust pace. But weakness
in potash production due to low potash prices slightly
clouds the outlook.
prairies
Housing Starts(000s)
f = forecastSources: The Conference Board of Canada; CMHC Housing TimeSeries Database.
2010 11 12 13f 14f 15f 16f 17f05
10
1520
Singles Multiples 20-year average
House Price Growth(percentage chage)
f = forecastSources: The Conference Board of Canada; CMHC Housing TimeSeries Database; Canadian Real Estate Association.
2010 11 12 13f 14f 15f 16f 17f0
2
4
6
8
New Resale

22 | metropolitan Housing Outlook—Autumn 2013
The Conference Board of Canada
HOuSING OuTlOOk
Robust economic growth has attracted substantial
in-migration to Manitoba and Saskatchewan and has
spurred healthy housing demand. Not so long ago, these
provinces were losing people. Their combined popula-
tion actually fell between 1999 and 2002. Now, the
number of residents in the two provinces combined has
risen at least 1 per cent in each of the past five years,
including a record 1.6 per cent gain in 2012. Major
Prairies: Economic Indicators
2010 2011 2012 2013f 2014f 2015f 2016f 2017f
real GDP at market prices 100,432 103,862 106,366 109,063 111,582 114,785 116,933 118,763(2002 $ millions) 3.6 3.4 2.4 2.5 2.3 2.9 1.9 1.6
Total employment (000s) 1,144 1,150 1,167 1,192 1,212 1,234 1,251 1,2651.4 0.5 1.5 2.2 1.6 1.8 1.4 1.1
unemployment rate (per cent) 5.3 5.2 5.1 4.7 4.6 4.6 4.5 4.5
Personal income per capita ($) 34,931 37,015 38,399 39,571 40,617 41,693 42,689 43,6191.8 6.0 3.7 3.1 2.6 2.6 2.4 2.2
Population (000s) 2,276 2,306 2,342 2,378 2,417 2,457 2,496 2,5331.4 1.3 1.6 1.5 1.7 1.6 1.6 1.5
retail sales ($ millions) 31,365 33,247 34,766 35,404 36,901 38,231 39,428 40,5214.8 6.0 4.6 1.8 4.2 3.6 3.1 2.8
Inflation rate (per cent) 1.1 2.9 1.6 2.3 2.4 2.2 2.1 2.1
f = forecast Italics indicate percentage change.Sources: The Conference Board of Canada; Bank of Canada; Statistics Canada.
Prairies: Housing Indicators
2010 2011 2012 2013f 2014f 2015f 2016f 2017f
Housing starts 11,795 13,114 17,210 13,870 14,477 15,269 15,113 14,91046.7 11.2 31.2 –19.4 4.4 5.5 –1.0 –1.3
Singles 7,806 7,983 9,340 7,853 8,387 8,831 8,771 8,35233.0 2.3 17.0 –15.9 6.8 5.3 –0.7 –4.8
Multiples 3,989 5,131 7,870 6,018 6,090 6,437 6,343 6,55883.9 28.6 53.4 –23.5 1.2 5.7 –1.5 3.4
Housing completions 10,368 12,077 12,869 14,715 13,513 14,255 14,314 13,9603.7 16.5 6.6 14.3 –8.2 5.5 0.4 –2.5
Singles 7,814 7,701 7,525 8,598 7,783 8,197 8,162 7,77920.4 –1.4 –2.3 14.3 –9.5 5.3 –0.4 –4.7
Multiples 2,555 4,376 5,344 6,117 5,730 6,058 6,152 6,182–27.2 71.3 22.1 14.5 –6.3 5.7 1.6 0.5
average price of a new home ($) 371,949 384,971 397,470 410,659 423,780 436,554 449,272 461,4563.9 3.5 3.2 3.3 3.2 3.0 2.9 2.7
average price of a resale home ($) 230,859 246,798 260,308 274,070 286,990 299,617 312,501 325,0017.0 6.9 5.5 5.3 4.7 4.4 4.3 4.0
f = forecast Italics indicate percentage change.Sources: The Conference Board of Canada; CMHC Housing Time Series Database; Canadian Real Estate Association; Statistics Canada.

Autumn 2013—metropolitan Housing Outlook | 23
The Conference Board of Canada
centres, particularly Saskatoon and Regina, are experi-
encing even faster growth. By 2017, the population of
Manitoba and Saskatchewan combined is forecast to be
over 2.5 million, up nearly 200,000 people from 2012.
This population growth has electrified residential con-
struction activity. Nonetheless, last year’s combined
volume of 17,210 housing starts, more than twice the
25-year average, was unsustainable and will not be
replicated during our forecast horizon. While both
single-detached and multi-family starts have risen in
recent years, increases in multi-family starts have been
relatively faster. Still, because new home prices are
relatively modest on the Prairies and incomes have risen
strongly, single-family homes continue to dominate the
market. Over the past five years, single homes have
made up a higher proportion of starts in the Prairies
than in any other region. This prevalence of single-
family homes is forecast to continue, but ease.
Indeed, housing starts in the Prairie provinces of
Manitoba and Saskatchewan pulled back to an annu-
alized pace near 14,200 units during the first half of
2013. We think this pace will generally be sustained
through year-end, resulting in a 19 per cent drop in
housing starts to roughly 13,900 units. Single-detached
and multi-family construction should experience similar
declines. A small uptick to nearly 14,500 starts is on tap
for 2014, and then volumes hovering near 15,000 units
between 2015 and 2017. This level of construction may
be slightly below demographic requirements, so there
could be upward surprises in the coming years.
Strong housing demand has generated brisk house
price increases. The average price of an existing home
rose 5.5 per cent last year and is expected to advance
a similar 5.3 per cent in 2013. Despite healthy sales
advances, resale markets in both Regina and Saskatoon
have slipped into buyers’ positions because of surging
listings. Winnipeg remains balanced. Accordingly,
we expect the average resale price in Manitoba and
Saskatchewan combined to rise a slower 4.7 per cent in
2014. Growth will continue easing, but stay healthy at
just above 4 per cent per year over the medium term.
The average price for a new home has risen between
3 and 4 per cent annually over the past three years and
is expected to advance similarly in both 2013 and 2014.
Yearly increases near 3 per cent are on tap between
2015 and 2017.

24 | metropolitan Housing Outlook—Autumn 2013
The Conference Board of Canada
A lberta’s strong economy and rapid population advances are fuelling expectations of a robust provincial housing market, despite Calgary’s
flooding. Housing starts are up this year and are expected to remain decent in 2014, albeit well below pre-recession levels. New home prices are rising gently, and we expect these increases to stay moderate. There could be modest pent-up new home demand in Alberta thanks to a relatively low ratio of housing starts to population changes. Healthy resale markets in Calgary and Edmonton are supporting strong provincial pricing, and solid gains are forecast to continue through the next few years.
eCONOMIC OuTlOOk
While the full effect of floods that hit Calgary and
southern Alberta in June will stretch out over years,
their immediate impact on economic growth will be
moderate; real GDP in the province will increase
3.2 per cent in 2013—the fourth consecutive year in
which Alberta’s performance will exceed the national
average—and a further 3 per cent in 2014. But Alberta
faces risks. Uncertainty surrounding key pipeline pro-
jects to export Alberta’s oil is one of these, as trans-
portation capacity is stretched in the face of rising
oil sands production. A second issue is the expected
competition from rising oil production in the United
States. Still, energy investment is projected to stay
elevated throughout the forecast, with benefits spread
out to many sectors of the Alberta economy. As a result,
employment is forecast to rise 2.2 per cent in 2013
and a further 2 per cent in 2014. This will keep the
unemployment rate at 4.7 per cent in both 2013 and
2014, well below the national average.
HOuSING OuTlOOk
Alberta’s magnetic economy has boosted provincial
population growth to 2.4 per cent in 2012 and an
expected 2.9 per cent this year. This is by far the fastest
growth among the six provinces and regions covered in
this report. While the rate of increase is forecast to slow
alberta
Housing Starts(000s)
f = forecastSources: The Conference Board of Canada; CMHC Housing TimeSeries Database.
2010 11 12 13f 14f 15f 16f 17f0
1020
3040
Singles Multiples 20-year average
House Price Growth(percentage chage)
f = forecastSources: The Conference Board of Canada; CMHC Housing TimeSeries Database; Canadian Real Estate Association.
2010 11 12 13f 14f 15f 16f 17f−2
0
2
4
6New Resale

Autumn 2013—metropolitan Housing Outlook | 25
The Conference Board of Canada
in 2014 and subsequently, Alberta’s relative population
gains will continue to outpace those elsewhere. In our
forecast, Alberta is expected to add nearly 300,000 resi-
dents between now and 2017.
Strong population growth remains a driver of demand
for Alberta’s new home markets. Housing starts rose
in both Edmonton and, astonishingly, even in flood-
stricken Calgary during the second quarter of this
year. Provincial starts averaged over 36,000 units at
Alberta: Economic Indicators
2010 2011 2012 2013f 2014f 2015f 2016f 2017f
real GDP at market prices 252,884 266,389 276,908 285,644 294,226 301,906 309,806 318,405(2002 $ millions) 4.3 5.3 3.9 3.2 3.0 2.6 2.6 2.8
Total employment (000s) 2,018 2,095 2,149 2,196 2,240 2,288 2,323 2,353–0.4 3.8 2.6 2.2 2.0 2.1 1.6 1.3
unemployment rate (per cent) 6.5 5.5 4.6 4.7 4.7 4.3 4.0 3.9
Personal income per capita ($) 46,069 49,046 51,768 53,516 54,852 56,740 58,409 60,0131.5 6.5 5.6 3.4 2.5 3.4 2.9 2.7
Population (000s) 3,716 3,769 3,860 3,973 4,051 4,119 4,187 4,2541.5 1.4 2.4 2.9 2.0 1.7 1.7 1.6
retail sales ($ millions) 59,910 64,006 68,452 73,057 76,462 80,123 83,382 86,4396.0 6.8 6.9 6.7 4.7 4.8 4.1 3.7
Inflation rate (per cent) 1.0 2.4 1.1 1.8 2.2 2.1 2.1 2.1
f = forecast Italics indicate percentage change.Sources: The Conference Board of Canada; Bank of Canada; Statistics Canada.
Alberta: Housing Indicators
2010 2011 2012 2013f 2014f 2015f 2016f 2017f
Housing starts 27,088 25,704 33,396 34,823 34,698 32,957 30,847 30,22833.5 –5.1 29.9 4.3 –0.4 –5.0 –6.4 –2.0
Singles 17,851 15,193 17,493 18,044 17,618 16,544 15,458 14,59524.4 –14.9 15.1 3.2 –2.4 –6.1 –6.6 –5.6
Multiples 9,237 10,511 15,903 16,779 17,079 16,413 15,389 15,63355.1 13.8 51.3 5.5 1.8 –3.9 –6.2 1.6
Housing completions 29,447 24,275 26,446 31,811 31,701 30,859 29,227 27,9746.6 –17.6 8.9 20.3 –0.3 –2.7 –5.3 –4.3
Singles 18,096 15,281 15,588 17,348 17,147 16,397 15,374 14,39729.7 –15.6 2.0 11.3 –1.2 –4.4 –6.2 –6.4
Multiples 11,351 8,994 10,858 14,463 14,554 14,462 13,853 13,577–17.0 –20.8 20.7 33.2 0.6 –0.6 –4.2 –2.0
average price of a new home ($) 432,312 431,184 435,951 447,813 462,468 473,976 484,151 494,3430.7 –0.3 1.1 2.7 3.3 2.5 2.1 2.1
average price of a resale home ($) 350,841 352,653 361,969 378,376 395,376 413,546 432,465 448,8703.0 0.5 2.6 4.5 4.5 4.6 4.6 3.8
f = forecast Italics indicate percentage change.Sources: The Conference Board of Canada; CMHC Housing Time Series Database; Canadian Real Estate Association; Statistics Canada.

26 | metropolitan Housing Outlook—Autumn 2013
The Conference Board of Canada
an annual rate during the first half of 2013, the high-
est two-quarter average since 2008. This represents a
remarkable increase from volumes that sank as low as
annualized 21,000 units in the first quarter of 2011.
Both single-detached units and multi-family starts rose.
Singles made up over half of all Alberta’s housing starts
in the first half of 2013, a distinction shared only with
Manitoba and Saskatchewan among the regions in this
report. Both areas enjoy high incomes and relatively
few land restrictions, important for single-detached
production.
Accordingly, we expect Alberta’s housing starts to end
2013 up 4.3 per cent near 34,800 units. This would be
the second straight annual gain, but modest compared
with the 30 per cent jump recorded in 2012. Growth in
single-detached starts is forecast to cool slightly, but
still end 2013 up 3.2 per cent, while multiple starts are
forecast to rise 5.5 per cent. Next year, starts are fore-
cast to hover near this level, clocking in at 34,700 units,
but then gradually ease to 30,200 units by 2017. These
volumes remain strong by historical standards: starts
averaged 26,300 units per year between 1988 and 2012.
Demographic demand easily supports these anticipated
volumes, as population growth is expected to remain
healthy. Moreover, there is no sign of overbuilding in
Alberta, as the ratio of housing starts to absolute popu-
lation changes is expected to trail its 25-year average
this year and in 2014.
Healthy resale markets in both Calgary and Edmonton
are underpinning solid provincial price growth. Alberta’s
average existing house price rose 2.6 per cent in 2012
and is expected to climb 4.5 per cent both this year
and in 2014. These would be the fastest gains since the
market corrected in 2009, but nowhere near boom-era
advances. The medium-term outlook includes brisk
increases near or above 4 per cent. By 2017, this fore-
cast implies an average Alberta resale price of nearly
$449,000. New home price growth has been slower; this
year’s 2.7 per cent growth follows a 1.1 per cent ascent
in 2013. For 2014, we expect a 3.3 per cent gain, fol-
lowed by annual increases between 2 and 2.5 per cent.

Autumn 2013—metropolitan Housing Outlook | 27
The Conference Board of Canada
An improving economy and emergence of bal-anced market conditions in Vancouver and Victoria bode well for British Columbia’s overall
housing market, although the strength of offshore demand remains a wild card. Easing population growth and evidence of modest overbuilding slightly cloud the housing market outlook. All in all, housing markets are expected to post only small gains over the coming years. Resale prices are expected to end 2013 little changed and advance modestly thereafter. Housing starts are forecast to rise gently in the medium term, following a dip this year, but remain below peak levels until 2017. Multiple units dominate provincial construction because of their prevalence in Vancouver.
eCONOMIC OuTlOOk
While British Columbia’s economy has suffered from
weak domestic demand and a soft job market, sluggish-
ness should dissipate by the end of the year. Real GDP
is expected to advance by 1.5 per cent this year and by
a healthy 3 per cent next year. Positive underpinnings
include stronger growth in the primary sector, construc-
tion, and manufacturing.
Following modest growth this year, the province’s for-
estry industry is forecast to enjoy double-digit gains in
2014 as a rebounding U.S. housing market demands
more lumber. The province’s manufacturing sector is
struggling this year, but 2014 looks better thanks to an
improving U.S. economy and the start of work on the
federal shipbuilding program. Strength in metal mining
and in unconventional gas production and drilling will
boost the mining industry in both 2013 and 2014.
Next year’s output growth acceleration among
B.C. goods industries is forecast to lift employ-
ment 1.7 per cent in 2014, improving on this year’s
0.3 per cent advance. This will cut the unemploy-
ment rate to 6.2 per cent in 2014. A stronger employ-
ment picture should improve prospects for B.C.
services-producing industries.
British Columbia
Housing Starts(000s)
f = forecastSources: The Conference Board of Canada; CMHC Housing Time Series Database.
2010 11 12 13f 14f 15f 16f 17f0
1020
3040
Singles Multiples 20-year average
House Price Growth(percentage chage)
f = forecastSources: The Conference Board of Canada; CMHC Housing Time Series Database; Canadian Real Estate Association.
2010 11 12 13f 14f 15f 16f 17f−10
−505
1015
New Resale

28 | metropolitan Housing Outlook—Autumn 2013
The Conference Board of Canada
HOuSING OuTlOOk
A firmer economy in 2014 should boost provincial
housing prospects, although rising interest rates will
temper gains. A modestly softer economic outlook for
China, an important source of housing investment in
B.C., is also curbing enthusiasm. Still, the market for
existing homes in 2014 will benefit from balanced mar-
ket conditions in the province’s three largest centres,
Vancouver, Victoria, and Abbotsford. The new home
British Columbia: Economic Indicators
2010 2011 2012 2013f 2014f 2015f 2016f 2017f
real GDP at market prices 183,658 188,475 191,749 194,568 200,473 207,033 213,715 219,256(2002 $ millions) 3.0 2.6 1.7 1.5 3.0 3.3 3.2 2.6
Total employment (000s) 2,257 2,275 2,313 2,320 2,360 2,409 2,453 2,4821.8 0.8 1.6 0.3 1.7 2.1 1.8 1.2
unemployment rate (per cent) 7.6 7.5 6.8 6.5 6.2 5.7 5.3 5.2
Personal income per capita ($) 35,155 36,574 37,742 38,704 39,810 41,113 42,358 43,4780.9 4.0 3.2 2.5 2.9 3.3 3.0 2.6
Population (000s) 4,523 4,572 4,618 4,657 4,712 4,770 4,830 4,8911.6 1.1 1.0 0.9 1.2 1.2 1.3 1.3
retail sales ($ millions) 58,549 60,406 61,565 62,170 64,477 67,203 69,821 71,9955.3 3.2 1.9 1.0 3.7 4.2 3.9 3.1
Inflation rate (per cent) 1.4 2.3 1.1 0.2 1.9 2.2 2.0 2.1
f = forecast Italics indicate percentage change.Sources: The Conference Board of Canada; Bank of Canada; Statistics Canada.
British Columbia: Housing Indicators
2010 2011 2012 2013f 2014f 2015f 2016f 2017f
Housing starts 26,479 26,400 27,465 25,257 27,819 31,005 31,871 31,51164.7 –0.3 4.0 –8.0 10.1 11.5 2.8 –1.1
Singles 11,462 8,867 8,333 7,973 8,263 9,107 9,344 8,90245.2 –22.6 –6.0 –4.3 3.6 10.2 2.6 –4.7
Multiples 15,017 17,533 19,132 17,284 19,556 21,898 22,527 22,60983.5 16.8 9.1 –9.7 13.1 12.0 2.9 0.4
Housing completions 27,699 22,549 26,380 25,564 25,425 27,677 29,632 29,587–6.2 –18.6 17.0 –3.1 –0.5 8.9 7.1 –0.2
Singles 10,741 9,279 8,787 8,463 8,013 8,564 9,128 8,91920.8 –13.6 –5.3 –3.7 –5.3 6.9 6.6 –2.3
Multiples 16,958 13,270 17,593 17,101 17,412 19,113 20,504 20,668–17.8 –21.7 32.6 –2.8 1.8 9.8 7.3 0.8
average price of a new home ($) 640,351 637,566 634,715 634,714 644,990 656,562 664,691 672,2932.8 –0.4 –0.4 0.0 1.6 1.8 1.2 1.1
average price of a resale home ($) 505,230 556,713 512,974 516,753 529,046 541,546 550,128 558,8499.8 10.2 –7.9 0.7 2.4 2.4 1.6 1.6
f = forecast Italics indicate percentage change.Sources: The Conference Board of Canada; CMHC Housing Time Series Database; Canadian Real Estate Association; Statistics Canada.

Autumn 2013—metropolitan Housing Outlook | 29
The Conference Board of Canada
market will remain burdened by high inventories of
unsold units in both Vancouver and Victoria, but these
are forecast to ease in 2014.
Provincial demographics provide an uneven back-
ground for new construction. On one hand, population
growth is forecast to bounce back above 1 per cent in
2014, following a 2013 dip to 0.9 per cent, and then
accelerate gently. But expected population advances
will remain below their 25-year average throughout our
forecast. Moreover, there are slight signs of overbuild-
ing. Following big recessionary dips in 2009 and 2010
in the provincial ratio of housing starts to population
growth, the ratio slightly surpassed its long-term aver-
age in 2012 and is expected to do so again in both 2013
and 2014.
B.C. housing starts are therefore forecast to fall by
8 per cent in 2013, the first significant easing since
the province recovered from recession in 2009. The
decline puts volumes below their long-term average and
nowhere near their 2007 peak. Single-detached starts
are on track to drop for a third straight year in 2013
and, this year, will be accompanied by falling multi-
family construction. For 2014, we expect starts to rise
10 per cent to 27,800 units, lifted by gains among both
single and multiple units. Starts are forecast to rise in
both 2015 and 2016. Total volumes will remain well
below pre-recession peak levels; we expect only about
31,900 units by 2016. Multiple starts will continue to
dominate, accounting for 70 per cent of all provincial
starts between 2013 and 2017, by far the largest propor-
tion among the six regions covered in this report.
Boosted by a recovery in the Vancouver market, British
Columbia’s average resale price has risen for three
straight quarters, moving above its year-earlier level
in the second quarter of 2013. This was the first year-
over-year advance since late 2011. Gains will remain
moderate and produce only a 0.7 per cent annual
increase in 2013. Stronger 2.4 per cent price hikes are
on tap for both 2014 and 2015, and then twin 1.6 per
cent increases are anticipated for 2016 and 2017.
These upticks will leave the province’s average resale
price near $559,000 in 2017, slightly above its 2011
peak. New home prices are expected to be flat in 2013,
following tiny declines in both 2011 and 2012, but
advance 1.6 per cent in 2014. We expect small annual
increases each year thereafter.
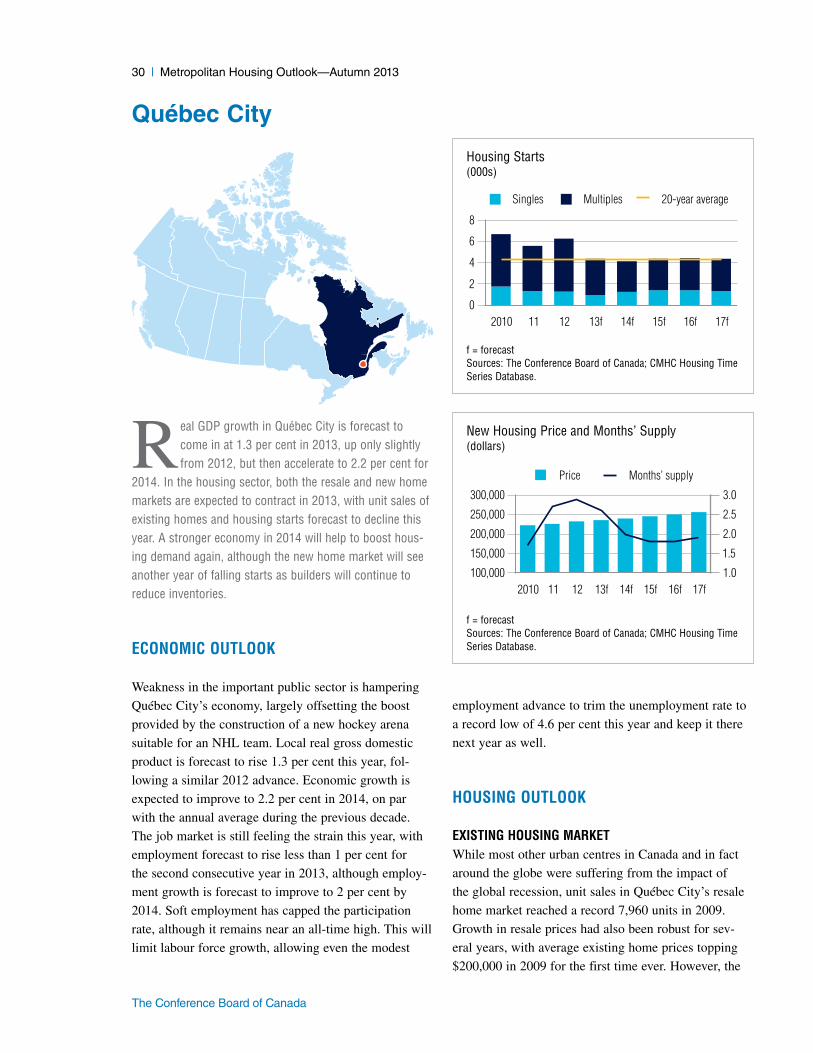
30 | metropolitan Housing Outlook—Autumn 2013
The Conference Board of Canada
Real GDP growth in Québec City is forecast to come in at 1.3 per cent in 2013, up only slightly from 2012, but then accelerate to 2.2 per cent for
2014. In the housing sector, both the resale and new home markets are expected to contract in 2013, with unit sales of existing homes and housing starts forecast to decline this year. A stronger economy in 2014 will help to boost hous-ing demand again, although the new home market will see another year of falling starts as builders will continue to reduce inventories.
eCONOMIC OuTlOOk
Weakness in the important public sector is hampering
Québec City’s economy, largely offsetting the boost
provided by the construction of a new hockey arena
suitable for an NHL team. Local real gross domestic
product is forecast to rise 1.3 per cent this year, fol-
lowing a similar 2012 advance. Economic growth is
expected to improve to 2.2 per cent in 2014, on par
with the annual average during the previous decade.
The job market is still feeling the strain this year, with
employment forecast to rise less than 1 per cent for
the second consecutive year in 2013, although employ-
ment growth is forecast to improve to 2 per cent by
2014. Soft employment has capped the participation
rate, although it remains near an all-time high. This will
limit labour force growth, allowing even the modest
employment advance to trim the unemployment rate to
a record low of 4.6 per cent this year and keep it there
next year as well.
HOuSING OuTlOOk
exISTING HOuSING MarkeT While most other urban centres in Canada and in fact
around the globe were suffering from the impact of
the global recession, unit sales in Québec City’s resale
home market reached a record 7,960 units in 2009.
Growth in resale prices had also been robust for sev-
eral years, with average existing home prices topping
$200,000 in 2009 for the first time ever. However, the
metropolitan overview
Québec City
Housing Starts(000s)
f = forecastSources: The Conference Board of Canada; CMHC Housing TimeSeries Database.
2010 11 12 13f 14f 15f 16f 17f0
2
4
6
8
Singles Multiples 20-year average
New Housing Price and Months’ Supply(dollars)
f = forecastSources: The Conference Board of Canada; CMHC Housing Time Series Database.
2010 11 12 13f 14f 15f 16f 17f100,000
150,000
200,000
250,000
300,000
1.0
1.5
2.0
2.5
3.0
Price Months’ supply

Autumn 2013—metropolitan Housing Outlook | 31
The Conference Board of Canada
city’s resale market was hit the following year, as buy-
ers began to shy away from the resale market, even as
the economy strengthened and interest rates fell. Sales
tumbled by 11.2 per cent in 2010, closer to 7,000 units.
Sellers, meanwhile, now encouraged by higher prices,
increased new listings 4.5 per cent, in turn, reducing the
sales-to-new-listings ratio to 63 per cent, down from
74 per cent in 2009. But with the market still close to
sellers’ territory, resale price growth remained robust in
2010, at 11.3 per cent.
As economic growth improved further, buyers returned
to Québec City’s resale market in 2011, increasing
unit sales 1.8 per cent. At the same time, sellers were
continuing to take advantage of stronger prices; new
listings rose by more than 10 per cent, thereby lower-
ing the sales-to-new-listings ratio to 58 per cent, falling
below 60 per cent for the first time in 11 years. Growth
in resale home prices then moderated to 4.3 per cent,
their smallest annual increase since 2002. Demand for
existing homes fell once more in 2012, as economic
Québec City: Economic Indicators
2010 2011 2012 2013f 2014f 2015f 2016f 2017f
real GDP at market prices 31,617 32,258 32,661 33,085 33,811 34,559 35,208 35,890(2002 $ millions) 3.0 2.0 1.2 1.3 2.2 2.2 1.9 1.9
Total employment (000s) 409 419 421 424 433 440 446 4513.7 2.4 0.5 0.8 2.0 1.7 1.3 1.1
unemployment rate (per cent) 4.9 5.4 5.1 4.6 4.6 4.5 4.4 4.4
Personal income per capita ($) 37,440 37,745 39,223 40,216 41,347 42,510 43,654 44,8571.4 0.8 3.9 2.5 2.8 2.8 2.7 2.8
Population (000s) 753 761 770 777 784 791 798 8051.0 1.0 1.1 1.0 0.9 0.9 0.9 0.9
retail sales ($ millions) 12,162 12,160 12,413 12,685 13,064 13,484 13,885 14,3045.9 0.0 2.1 2.2 3.0 3.2 3.0 3.0
Inflation rate (per cent) 1.4 3.0 2.2 1.3 2.0 2.2 2.0 1.9
f = forecast Italics indicate percentage change.Sources: The Conference Board of Canada; Statistics Canada.
MLS Sales-to-New-Listings Ratio and Price Growth(per cent)
f = forecast; MLS = Multiple Listing ServiceSources: The Conference Board of Canada; Quebec Federation of Real Estate Boards.
2010 11 12 13f 14f 15f 16f 17f0
3
6
9
12
40
50
60
70
80
Price growth Sales-to-new-listings ratio
Affordability(left, dollars; right, per cent)
f = forecastNote: Principle and interest payments assume average resale price, 10 per cent down payment, 25-year amoritization, and 5-year fixed mortgage rate.Sources: The Conference Board of Canada; Canadian Real Estate Association.
2010 11 12 13f 14f 15f 16f 17f500
1,000
1,500
2,000
10
15
20
25
P&I payment P&I/income

32 | metropolitan Housing Outlook—Autumn 2013
The Conference Board of Canada
growth slowed, and the region was hit by higher taxes
and tighter mortgage rules. Unit sales declined 0.2 per
cent last year. Growth in new listings was more modest
as well, at 2.1 per cent, while resale prices advanced
another 5 per cent.
Sales of existing units declined yet again in the first
quarter of this year, in line with the persistent weak-
ness in the economy. And while they posted a small
improvement through the middle of 2013, they are
expected to decrease in the fourth quarter, limited by
modest employment and income growth. Overall, unit
sales are forecast to contract 9.9 per cent this year,
down to 6,500 units. This will be the first time in nine
years that unit sales in Québec City’s resale market
have fallen below 7,000 units. The sales-to-new-listings
ratio is anticipated to slip to 50 per cent for 2013. This
positions the market in “balanced” territory, keeping
growth in resale prices at 4.5 per cent.
Next year, stronger economic growth is expected to
boost demand in the resale market, although the total
gain for the year will be modest given the forecast
weakness in the fourth quarter of 2013. In total, unit
sales are expected to increase 2.2 per cent in 2014. We
anticipate sellers will take a breather, however, leading
to a small decline in new listings. While the resulting
sales-to-new-listings ratio will increase to 52 per cent,
the market will remain balanced. As a result, resale
home price growth is expected to fall to 2.6 per cent.
With sales still below the long-term sales-to-population
ratio, there is room for additional growth in the resale
housing market through the medium term. Sales are
expected to increase an average of 3.1 per cent per year
from 2015 to 2017, and resale prices will rise by 2.6 per
cent on an average annual basis.
NeW HOuSING MarkeT Strong absorptions kept builders active in Québec
City’s new home market through the 2009 recession
and into 2010. Starts rose nearly 25 per cent in 2010
alone, reaching a six-year high of 6,700 units. Both
single-family and multiple-unit starts contributed to
this increase, although the growth in multiple starts was
much larger than the growth in single starts. However,
even with this significant increase in total housing starts
in 2010, demand outstripped supply, as months’ sup-
ply slipped to 1.7 months. Despite the tighter market,
growth in new home prices eased, falling to 3.2 per cent
for 2010, down from 7 per cent in 2009.
A slowing economy quickly reduced demand in Québec
City’s new home market in 2011. Absorptions fell
by 14.4 per cent, causing months’ supply to jump to
2.7 months. Builders pulled back from the market,
lowering starts by 16.6 per cent, with the decrease split
between singles and multiples. Growth in new home
prices decelerated further as well, easing to a 12-year
low of 1.4 per cent.
Québec City: Resale Housing Market Indicators
2010 2011 2012 2013f 2014f 2015f 2016f 2017f
unit sales 7,073 7,200 7,186 6,476 6,618 6,890 7,089 7,254–11.2 1.8 –0.2 –9.9 2.2 4.1 2.9 2.3
Dollar volume sales ($ millions) 1,655 1,757 1,841 1,734 1,818 1,940 2,048 2,149–1.1 6.1 4.8 –5.8 4.8 6.7 5.5 5.0
New listings 11,168 12,337 12,601 12,891 12,779 13,002 13,284 13,7114.5 10.5 2.1 2.3 –0.9 1.8 2.2 3.2
Sales-to-new-listings ratio (%) 63 58 57 50 52 53 53 53
average price of a resale home ($) 233,994 243,973 256,196 267,821 274,743 281,566 288,841 296,31111.3 4.3 5.0 4.5 2.6 2.5 2.6 2.6
f = forecastItalics indicate percentage change.Sources: The Conference Board of Canada; Quebec Federation of Real Estate Boards.

Autumn 2013—metropolitan Housing Outlook | 33
The Conference Board of Canada
Though economic growth continued to moderate last
year, builders increased housing starts by 12.6 per cent
in 2012, pushing months’ supply up to 2.9 months.
Starts were being fuelled by surging construction of
multiples as single starts eased by 5.3 per cent. With
this growth, the multiples sector appeared to be slightly
oversupplied by demographic standards last year,
although sagging starts of single-family units kept the
overall ratio of housing starts to population growth
slightly below historical norms.
For 2013, with the economy still muted, total hous-
ing starts are forecast to decline 30 per cent. Both
singles and multiples are expected to contract this year.
Multiple starts increased in the first quarter of 2013, but
fell in the second quarter, and are expected to decline
through the rest of the year as well, as builders bring
them more in line with demographics. Meanwhile,
single starts remained on their downward trend in the
first quarter of this year, but have since picked up. With
months’ supply forecast at 2.6 months for 2013, growth
in new home prices is expected to continue to be mod-
est this year, at 1.4 per cent. Builders are expected to
reduce multiple starts again in 2014, down an additional
15.5 per cent, to lower months’ supply further. At the
same time, single starts will begin to increase next year.
Accordingly, total housing starts are forecast to decline
by 5.8 per cent. The tighter market (months’ sup-
ply is forecast to be 2 months for 2014) will lead to a
slightly faster 1.9 per cent increase in new home prices
next year.
Québec City: New Housing Market Indicators
2010 2011 2012 2013f 2014f 2015f 2016f 2017f
Housing starts 6,674 5,564 6,262 4,386 4,134 4,387 4,442 4,36824.7 –16.6 12.6 –30.0 –5.8 6.1 1.2 –1.7
Singles 1,770 1,346 1,275 968 1,244 1,395 1,415 1,3371.6 –23.9 –5.3 –24.1 28.6 12.1 1.4 –5.5
Multiples 4,904 4,217 4,987 3,418 2,889 2,992 3,027 3,03235.8 –14.0 18.3 –31.5 –15.5 3.6 1.2 0.1
under construction 3,158 3,083 3,393 3,665 3,326 3,484 3,603 3,68227.0 –2.4 10.0 8.0 –9.3 4.8 3.4 2.2
Housing completions 6,419 5,667 5,518 4,881 4,007 4,240 4,340 4,30225.4 –11.7 –2.6 –11.5 –17.9 5.8 2.4 –0.9
Singles 1,959 1,354 1,235 1,153 1,176 1,383 1,410 1,35411.5 –30.9 –8.8 –6.6 2.0 17.6 2.0 –3.9
Multiples 4,460 4,313 4,283 3,728 2,831 2,857 2,930 2,94832.6 –3.3 –0.7 –13.0 –24.1 0.9 2.6 0.6
Newly completed and unabsorbed 863 1,219 1,298 1,172 713 622 634 6600.9 41.2 6.5 –9.7 –39.1 –12.8 2.0 4.1
absorptions 6,267 5,362 5,349 5,338 4,347 4,258 4,315 4,27922.8 –14.4 –0.2 –0.2 –18.6 –2.1 1.3 –0.8
Months’ supply 1.7 2.7 2.9 2.6 2.0 1.8 1.8 1.9
average price of a new home ($) 222,372 225,576 232,176 235,387 239,898 245,416 250,815 256,0823.2 1.4 2.9 1.4 1.9 2.3 2.2 2.1
f = forecastItalics indicate percentage change.Sources: The Conference Board of Canada; CMHC Housing Time Series Database.

34 | metropolitan Housing Outlook—Autumn 2013
The Conference Board of Canada
Montréal’s real GDP is expected to rise 1.3 per cent in 2013 and 2.1 per cent in 2014. In line with the modest economic growth, both the
resale and new housing markets will weaken this year, with declines forecast for unit sales and housing starts. But both markets will show renewed signs of life in 2014 and onward thanks to an improved economy and stable population growth.
eCONOMIC OuTlOOk
Montréal’s economy is expected to remain weak by
national standards this year, with forecast real gross
domestic product growth of only 1.3 per cent. Our
anticipation of 2.1 per cent GDP growth for 2014 will
keep the area trailing the nation next year as well.
Weakness has been especially pronounced among the
goods industries; in fact, their expansion has been
slower than that of the services-producing industries for
the past 12 years now. But despite soft output growth,
the job market has been decent. Employment is on track
to rise 2 per cent in 2013, the most since 2010. This
will lift the job count for the year 2013 as a whole to
over 2 million people for the first time ever, and help
to cut the unemployment rate to 8 per cent, down from
8.5 per cent in 2012 and its lowest average level in
five years.
HOuSING OuTlOOk
exISTING HOuSING MarkeT Following a 7.4 per cent decline in 2008, unit sales
in Montréal’s resale housing market increased 5.5 per
cent through 2009 and 2010 as the region’s economy
recovered from the global recession. Stronger popula-
tion growth and low interest rates were also bringing
buyers back to the market at this time. Sellers were a
little slower to react, however. As a result, the sales-to-
new-listings ratio rose to an average of 60 per cent (up
from 54 per cent in 2008), in turn leading to stronger
price growth. Average resale home prices increased
7.8 per cent in 2010, more than double their rate of
increase in the preceding two years.
montréal
Housing Starts(000s)
f = forecastSources: The Conference Board of Canada; CMHC Housing TimeSeries Database.
2010 11 12 13f 14f 15f 16f 17f05
10152025
Singles Multiples 20-year average
New Housing Price and Months’ Supply(dollars)
f = forecastSources: The Conference Board of Canada; CMHC Housing Time Series Database.
2010 11 12 13f 14f 15f 16f 17f200,000
250,000
300,000
350,000
400,000
1.0
1.5
2.0
2.5
3.0Price Months’ supply

Autumn 2013—metropolitan Housing Outlook | 35
The Conference Board of Canada
Higher taxes, tighter mortgage rules, and more modest
economic growth over the past two years then slowed
Montréal’s resale housing market once again. Unit
sales slipped 4.6 per cent in 2011 and an additional
0.6 per cent in 2012. Combined with moderate growth
in new listings, the sales-to-new-listings ratio fell back
to 52 per cent last year. Still, in spite of the balanced
market, resale price growth remained elevated through
2011–12, at an average of 4.2 per cent, with prices top-
ping $300,000 for the first time ever.
Persistent weakness in Montréal’s economy continued
to hurt the region’s resale housing market in the first
quarter of this year. And while sales did pick up in
the second quarter, likely, in part, thanks to improving
employment numbers, they are still well below year-
ago levels given the declines in the last half of 2012.
Indeed, unit sales of existing homes are forecast to drop
a total of 8 per cent in 2013, falling below 40,000 units
for the first time since 2006. But a stronger economy is
expected to encourage buying again next year, increas-
ing unit sales 2.6 per cent. Meanwhile, thanks to the
Montréal: Economic Indicators
2010 2011 2012 2013f 2014f 2015f 2016f 2017f
real GDP at market prices 154,388 157,015 158,778 160,851 164,287 169,095 173,431 177,732(2002 $ millions) 2.3 1.7 1.1 1.3 2.1 2.9 2.6 2.5
Total employment (000s) 1,954 1,952 1,979 2,018 2,031 2,066 2,097 2,1242.6 –0.1 1.4 2.0 0.6 1.8 1.5 1.3
unemployment rate (per cent) 8.6 8.3 8.5 8.0 7.9 7.7 7.5 7.3
Personal income per capita ($) 34,325 35,002 36,250 37,320 38,118 39,348 40,554 41,7571.3 2.0 3.6 3.0 2.1 3.2 3.1 3.0
Population (000s) 3,869 3,918 3,958 3,996 4,037 4,080 4,123 4,1681.4 1.3 1.0 1.0 1.0 1.1 1.1 1.1
retail sales ($ millions) 44,289 45,218 45,993 48,466 50,126 52,093 54,003 55,9256.0 2.1 1.7 5.4 3.4 3.9 3.7 3.6
Inflation rate (per cent) 1.2 2.8 2.0 1.2 2.0 2.2 2.0 1.9
f = forecast Italics indicate percentage change.Sources: The Conference Board of Canada; Statistics Canada.
MLS Sales-to-New-Listings Ratio and Price Growth(per cent)
f = forecast; MLS = Multiple Listing ServiceSources: The Conference Board of Canada; Quebec Federation of Real Estate Boards.
2010 11 12 13f 14f 15f 16f 17f0
3
6
9
45
50
55
60
Price growth Sales-to-new-listings ratio
Affordability(left, dollars; right, per cent)
f = forecastNote: Principle and interest payments assume average resale price, 10 per cent down payment, 25-year amoritization, and 5-year fixed mortgage rate.Sources: The Conference Board of Canada; Canadian Real Estate Association.
2010 11 12 13f 14f 15f 16f 17f1,000
1,500
2,000
2,500
20
22
24
26
P&I payment P&I/income

36 | metropolitan Housing Outlook—Autumn 2013
The Conference Board of Canada
higher prices, new listings remain on an upward trend
and are anticipated to rise 1.1 per cent this year and
3.2 per cent in 2014. This will push the sales-to-new-
listings ratio to 47 per cent, its lowest rate in 16 years.
With the market getting closer to buyers’ territory,
resale price growth is moderating, forecast to grow just
2.1 per cent per year on average over 2013–14.
In the medium term, a solid economy and stable popu-
lation growth of 1 per cent annually are expected to
lead to further growth in housing demand in the resale
market. Unit sales of existing homes are forecast to
increase by an average of 2.1 per cent annually from
2015 to 2017. Accordingly, the sales-to-new-listings
ratio is anticipated to rise slightly, nearing 50 per cent
by 2017. The balanced market will hold the growth in
resale prices to 2.6 per cent on an average annual basis.
NeW HOuSING MarkeT Montréal’s new home market also strengthened fol-
lowing the 2009 global recession, thanks to spillover
demand from the resale market. In total, builders
increased housing starts by 15.3 per cent in 2010 and
2.1 per cent in 2011. Much of this increase was due
to the multiple-unit market, as single-detached starts
grew in 2010 but then fell again in 2011. Indeed, the
multiples market was benefitting, in large part, from
a number of new condominium projects across the
region—a trend seen in many of Canada’s large urban
centres in recent years. Demand for condominiums
has risen as the population has started to age but also
because people are more and more choosing to live
downtown to avoid long commuting times given rising
traffic flows. Despite the growth in starts in 2010–11,
the demand for new homes was so strong that months’
supply in the new home market declined steadily, fall-
ing to 2.1 months for 2011 after hitting a 13-year high
of 2.8 months in 2009. As a result, growth in new home
prices accelerated slightly, averaging 3 per cent per
year, up from 2.4 per cent in 2009.
With condominium projects wrapping up and economic
growth modest, builders pulled back from both the
singles and multiples markets last year. Total housing
starts dropped by 9.9 per cent. Months’ supply con-
tinued to fall though, slipping to 1.9 months—below
2 months for the first time in seven years. Nevertheless,
new home prices rose by only 1.4 per cent, their small-
est increase since 1998.
Housing starts are poised to fall again in 2013. Single
and multiple starts declined substantially in the first
quarter of the year. Although both picked up in the
second quarter, more weakness is expected going for-
ward, given the slow economy and now rising inventor-
ies, especially of apartment condominiums. In total,
Montréal: Resale Housing Market Indicators
2010 2011 2012 2013f 2014f 2015f 2016f 2017f
unit sales 42,297 40,359 40,114 36,927 37,900 39,038 39,893 40,3741.3 –4.6 –0.6 –7.9 2.6 3.0 2.2 1.2
Dollar volume sales ($ millions) 12,390 12,408 12,766 11,937 12,556 13,311 13,932 14,4419.2 0.1 2.9 –6.5 5.2 6.0 4.7 3.7
New listings 72,138 75,472 77,097 77,946 80,473 81,854 82,077 81,8704.0 4.6 2.2 1.1 3.2 1.7 0.3 –0.3
Sales-to-new-listings ratio (%) 59 53 52 47 47 48 49 49
average price of a resale home ($) 292,926 307,446 318,244 323,253 331,303 340,986 349,234 357,6887.8 5.0 3.5 1.6 2.5 2.9 2.4 2.4
f = forecastItalics indicate percentage change.Sources: The Conference Board of Canada; Quebec Federation of Real Estate Boards.

Autumn 2013—metropolitan Housing Outlook | 37
The Conference Board of Canada
housing starts are forecast to decrease 29.6 per cent
this year. New home prices are also expected to remain
muted, increasing just 1.5 per cent.
As economic growth improves next year, steady popula-
tion increases should bring builders back to the market.
Moreover, Montréal does not appear to be overbuilt; the
ratio of housing starts to population growth has been
below its 25-year average in each of the past five years.
Accordingly, total starts are expected to edge higher in
2014 and in 2015, up by 7.1 per cent and 2.7 per cent,
respectively. Lower absorptions this year and next will
raise months’ supply to 2 months. New home price
growth is expected to continue to be modest, reaching
2 per cent in 2014 and 2.2 per cent in 2015.
Montréal: New Housing Market Indicators
2010 2011 2012 2013f 2014f 2015f 2016f 2017f
Housing starts 22,194 22,652 20,420 14,376 15,392 15,809 15,933 15,64015.3 2.1 –9.9 –29.6 7.1 2.7 0.8 –1.8
Singles 5,870 4,672 3,959 3,188 4,574 4,651 4,692 4,4308.2 –20.4 –15.3 –19.5 43.5 1.7 0.9 –5.6
Multiples 16,323 17,979 16,462 11,187 10,818 11,157 11,241 11,21018.1 10.1 –8.4 –32.0 –3.3 3.1 0.7 –0.3
under construction 14,346 16,214 18,567 17,229 16,623 17,050 17,395 17,57411.7 13.0 14.5 –7.2 –3.5 2.6 2.0 1.0
Housing completions 19,922 19,866 19,092 17,110 14,883 15,383 15,663 15,5122.2 –0.3 –3.9 –10.4 –13.0 3.4 1.8 –1.0
Singles 6,034 4,851 4,191 3,463 4,289 4,724 4,762 4,58315.7 –19.6 –13.6 –17.4 23.9 10.1 0.8 –3.7
Multiples 13,888 15,015 14,901 13,647 10,594 10,660 10,901 10,928–2.7 8.1 –0.8 –8.4 –22.4 0.6 2.3 0.3
Newly completed and unabsorbed 3,965 3,390 3,062 2,911 2,566 2,524 2,580 2,568–15.0 –14.5 –9.7 –4.9 –11.8 –1.7 2.2 –0.4
absorptions 21,086 19,833 19,697 17,126 15,208 15,365 15,588 15,5806.9 –5.9 –0.7 –13.1 –11.2 1.0 1.5 –0.1
Months’ supply 2.3 2.1 1.9 2.0 2.0 2.0 2.0 2.0
average price of a new home ($) 311,888 321,021 325,459 330,350 336,949 344,362 351,938 359,3293.1 2.9 1.4 1.5 2.0 2.2 2.2 2.1
f = forecastItalics indicate percentage change.Sources: The Conference Board of Canada; CMHC Housing Time Series Database.

38 | metropolitan Housing Outlook—Autumn 2013
The Conference Board of Canada
Toronto’s real GDP is forecast to rise by 1.6 per cent this year, limited by a decline in manufactur-ing output and a weak services sector. Next year,
stronger demand, both at home and south of the border, is expected to help economic growth improve to 2.7 per cent. Although unit sales of existing homes and housing starts are both set to fall in 2013, they are forecast to rise once again next year, albeit at a modest pace, thanks to the improving economy and continued population growth.
eCONOMIC OuTlOOk
Toronto’s economy is expected to grow by 1.6 per cent
in 2013, down from a modest 1.9 per cent increase in
2012. Although the construction sector is forecast to
grow at a faster pace this year, thanks to a host of non-
residential projects, many other sectors are expected
to post much slower growth or even declines. Indeed,
weaker demand for manufactured products in late 2012
is expected to lead to a lower manufacturing output in
2013—the first annual drop for this sector since the
2009 global recession. And despite stronger forecast
gains for employment in 2013—2.5 per cent versus
1.6 per cent in 2012—consumers have remained cau-
tious. As a result, wholesale and retail trade output is
expected to be flat this year, following a muted 0.4 per
cent increase last year. By 2014, with global economic
conditions expected to improve, overall economic activ-
ity will strengthen, leading consumers to open their
purse strings once more. In total, real gross domes-
tic product growth is forecast to reach 2.7 per cent
next year.
toronto
Housing Starts(000s)
f = forecastSources: The Conference Board of Canada; CMHC Housing TimeSeries Database.
2010 11 12f 13f 14f 15f 16f 17f0
1020304050
Singles Multiples 20-year average
New Housing Price and Months’ Supply(dollars)
f = forecastSources: The Conference Board of Canada; CMHC Housing Time Series Database.
2010 11 12f 13f 14f 15f 16f 17f400,000
500,000
600,000
700,000
0.4
0.5
0.6
0.7Price Months’ supply

Autumn 2013—metropolitan Housing Outlook | 39
The Conference Board of Canada
HOuSING OuTlOOk
exISTING HOuSING MarkeT Unit sales of existing homes in Toronto rose by 18 per
cent in 2009, nearly offsetting the decline from the
previous year when demand fell as a result of the onset
of the global recession in late 2008. Buyers were being
enticed not only by an improving economy in 2009 but
also by lower interest rates. Sellers were not as keen,
however—new listings slipped 16.5 per cent, thereby
raising the sales-to-new-listings ratio to 66 per cent. In
turn, growth in resale homes prices began to acceler-
ate, increasing to 4 per cent, up from just 1 per cent
the previous year. However, renewed uncertainty in
the economy meant buyers pulled back from the resale
market again in 2010, lowering unit sales 1.5 per cent.
And, while additional new listings helped to push the
sales-to-new-listings ratio back down to 57 per cent (in
balanced territory), resale home prices increased at an
even faster pace, up by 9.4 per cent.
Toronto: Economic Indicators
2010 2011 2012 2013f 2014f 2015f 2016f 2017f
real GDP at market prices 273,040 278,911 284,318 288,915 296,856 306,646 315,415 322,926(2002 $ millions) 3.9 2.1 1.9 1.6 2.7 3.3 2.9 2.4
Total employment (000s) 2,919 2,960 3,007 3,084 3,134 3,220 3,279 3,3262.3 1.4 1.6 2.5 1.6 2.8 1.8 1.4
unemployment rate (per cent) 9.1 8.4 8.5 8.2 8.0 7.1 6.7 6.5
Personal income per capita ($) 38,307 38,740 40,055 41,252 42,274 43,607 44,675 45,6532.2 1.1 3.4 3.0 2.5 3.2 2.5 2.2
Population (000s) 5,741 5,841 5,941 6,042 6,147 6,261 6,379 6,5001.8 1.7 1.7 1.7 1.7 1.9 1.9 1.9
retail sales ($ millions) 63,410 67,030 67,669 68,348 70,794 73,953 77,007 79,7616.5 5.7 1.0 1.0 3.6 4.5 4.1 3.6
Inflation rate (per cent) 2.5 3.0 1.5 1.4 2.0 2.1 2.0 2.0
f = forecast Italics indicate percentage change.Sources: The Conference Board of Canada; Statistics Canada.
MLS Sales-to-New-Listings Ratio and Price Growth(per cent)
f = forecast; MLS = Multiple Listing ServiceSources: The Conference Board of Canada; Canadian Real Estate Association.
2010 11 12f 13f 14f 15f 16f 17f0
4
8
12
50
55
60
65
Price growth Sales-to-new-listings ratio
Affordability(left, dollars; right, per cent)
f = forecastNote: Principle and interest payments assume average resale price, 10 per cent down payment, 25-year amoritization, and 5-year fixed mortgage rate.Sources: The Conference Board of Canada; Canadian Real Estate Association.
2010 11 12f 13f 14f 15f 16f 17f1,5002,0002,5003,0003,5004,000
152025303540
P&I payment P&I/income

40 | metropolitan Housing Outlook—Autumn 2013
The Conference Board of Canada
Continued low interest rates led buyers to return to
Toronto’s resale market in 2011, as sales increased by
4.3 per cent, to top 80,000 units for only the second
time on record. Accordingly, the sales-to-new-listings
ratio jumped to 62 per cent, keeping resale price
growth elevated, at 8 per cent for the year. Resale
prices grew another 7.5 per cent in 2012 as well, top-
ping $500,000—good news for sellers, who, in turn,
increased new listings by 8.7 per cent last year.
Notwithstanding the large increases in prices, exist-
ing homes remain relatively affordable in Toronto,
largely thanks to low interest rates. Indeed, the rela-
tionship of carrying costs to incomes and rents is still
well within historical norms. Specifically, principle
and interest payments on the average Toronto Multiple
Listing Service house consumed 26 per cent of aver-
age household incomes in 2012—the same percentage
as in 1991–92. This relative affordability, in the face of
soft economic growth and tighter mortgage rules, kept
existing home sales relatively high in 2012. True, they
declined by 5 per cent, but from an almost record high
in 2011.
Another round of interest rate cuts early in 2013 led to
a rebound in Toronto’s resale housing market through
the first half of this year, in spite of a still modest econ-
omy. Unit sales rose by an annual average of 4.1 per
cent in each quarter. Still, given the slowdown in the
fourth quarter of last year, unit sales are expected to
fall 3.6 per cent for the year 2013 as a whole. With
interest rates anticipated to slowly move up in the com-
ing months, sales growth is expected to be modest but
positive: unit sales of existing homes are forecast to
grow by 0.8 per cent next year. A stable economy and
solid population growth should keep unit sales on the
upswing, growing by 3.7 per cent on an average annual
basis from 2015 to 2017.
Meanwhile, sellers have been taking a breather lately,
and so new listings are expected to fall by 1.4 per cent
per year on average over this year and next. Better
economic conditions will bring sellers back to the
market by 2015, increasing new listings by an average
of 3.1 per cent over 2015–17. This will be enough to
keep the resale housing market in balanced territory.
As a result, growth in existing home prices will slow to
2.4 per cent this year, and then hover around the 2 per
cent mark from 2014 onward.
NeW HOuSING MarkeT Builders in Toronto’s new home market increased
housing starts nearly 70 per cent from 2010 to 2012,
to reach a record 48,400 units last year. Through 2010
and 2011, the growth in Toronto’s housing starts was
due to increases in both single-detached and multiple-
unit starts. While multiple starts rose once again in
2012, thanks to the continued development of a number
of large high-rise condominium developments across
the city, tighter mortgage rules lowered single starts
Toronto: Resale Housing Market Indicators
2010 2011 2012 2013f 2014f 2015f 2016f 2017f
unit sales 78,707 82,084 77,960 75,182 75,766 79,514 82,313 84,378–1.5 4.3 –5.0 –3.6 0.8 4.9 3.5 2.5
Dollar volume sales ($ millions) 35,273 39,744 40,591 40,075 41,176 44,109 46,564 48,6777.7 12.7 2.1 –1.3 2.7 7.1 5.6 4.5
New listings 137,939 132,217 143,784 141,872 139,867 144,925 149,298 152,94914.2 –4.1 8.7 –1.3 –1.4 3.6 3.0 2.4
Sales-to-new-listings ratio (%) 57 62 54 53 54 55 55 55
average price of a resale home ($) 448,158 484,187 520,663 533,035 543,456 554,737 565,693 576,8869.4 8.0 7.5 2.4 2.0 2.1 2.0 2.0
f = forecastItalics indicate percentage change.Sources: The Conference Board of Canada; Canadian Real Estate Association.

Autumn 2013—metropolitan Housing Outlook | 41
The Conference Board of Canada
by 4.3 per cent. Generally, over the past three years,
new home demand has been driven by increased for-
eign investment, the recovering economy, low inter-
est rates, and healthy population growth. In addition,
demand for affordable dwellings and for downtown
accommodation was further boosting the proportion of
multi-family starts.
Initially, the increase in demand kept up with the
increases in supply. Absorptions rose nearly 20 per cent
over 2010–11. But buyers backed away from the new
home market last year, lowering absorptions by 7.7 per
cent, and causing months’ supply to begin to creep
up. At the same time, a number of big condominium
projects were being completed. Accordingly, builders
reduced multiple starts considerably over the first half
of 2013. All told, total housing starts are expected to
slip 29.4 per cent this year, down to 34,100 units. But
the downturn will be short-lived. Although the ratio
of housing starts to population growth significantly
exceeded its historical average last year, this followed
several years of below-average readings. As a result,
a healthier economy and continued solid popula-
tion growth are expected to increase housing demand
again by next year. In turn, builders are expected to
return to the market, increasing total starts by 13.4 per
cent in 2014 and by an annual average of 6.1 per cent
from 2015 to 2017. By 2017, starts are forecast to be
46,200 units. This will keep months’ supply just under
0.5 months, a decent reading for the Toronto market.
Growth in new home prices also picked up speed in
recent years. New home prices rose by 4.1 per cent
on an average annual basis from 2010 to 2012, top-
ping $600,000 last year. Price growth in the new home
market is forecast to slow to 2.4 per cent in 2013 and
1.8 per cent in 2014, in line with the softer demand, and
then average 2.1 per cent per year over 2015–17.
Toronto: New Housing Market Indicators
2010 2011 2012 2013f 2014f 2015f 2016f 2017f
Housing starts 29,413 39,745 48,368 34,133 38,717 42,558 45,643 46,15412.5 35.1 21.7 –29.4 13.4 9.9 7.2 1.1
Singles 10,236 11,187 10,702 10,181 10,997 12,277 12,802 12,30829.3 9.3 –4.3 –4.9 8.0 11.6 4.3 –3.9
Multiples 19,177 28,557 37,666 23,951 27,721 30,281 32,840 33,8465.2 48.9 31.9 –36.4 15.7 9.2 8.5 3.1
under construction 47,581 49,424 60,964 66,156 65,290 65,229 65,316 65,381–0.8 3.9 23.3 8.5 –1.3 –0.1 0.1 0.1
Housing completions 31,393 33,831 31,907 36,403 38,748 42,580 45,638 46,00410.7 7.8 –5.7 14.1 6.4 9.9 7.2 0.8
Singles 9,804 9,106 11,036 10,109 10,814 12,397 12,769 12,15310.8 –7.1 21.2 –8.4 7.0 14.6 3.0 –4.8
Multiples 21,589 24,725 20,871 26,293 27,934 30,183 32,869 33,85110.7 14.5 –15.6 26.0 6.2 8.1 8.9 3.0
Newly completed and unabsorbed 1,698 1,382 1,628 1,356 1,469 1,651 1,804 1,85946.2 –18.6 17.8 –16.7 8.3 12.4 9.3 3.0
absorptions 30,668 34,222 31,588 36,807 38,575 42,420 45,484 45,9988.0 11.6 –7.7 16.5 4.8 10.0 7.2 1.1
Months’ supply 0.7 0.5 0.6 0.4 0.5 0.5 0.5 0.5
average price of a new home ($) 550,269 575,904 605,473 620,137 631,169 645,055 657,956 671,1152.6 4.7 5.1 2.4 1.8 2.2 2.0 2.0
f = forecastItalics indicate percentage change.Sources: The Conference Board of Canada; CMHC Housing Time Series Database.

42 | metropolitan Housing Outlook—Autumn 2013
The Conference Board of Canada
O ttawa–Gatineau’s economy is on track to expand by a modest 0.8 per cent in 2013, while employ-ment is poised to tumble by 1.8 per cent, the
biggest decline in 18 years. Fortunately, things are expected to improve next year, with both real GDP and job growth forecast to reach 1.6 per cent. However, the resale and new housing markets are expected to continue to weaken this year and next, with declines forecast for unit sales of exist-ing homes and housing starts.
eCONOMIC OuTlOOk
Ottawa–Gatineau’s economy continues to feel the pinch
of federal government cutbacks. Real GDP expanded
by only 0.8 per cent last year and is projected to grow
at the same lacklustre rate this year. The public admin-
istration sector, which accounts for about 30 per cent
of overall economic activity, is headed for its biggest
drop in employment on record this year. In fact, we
expect that about 12,800 public administration jobs
will be eliminated in Ottawa–Gatineau over 2013 and
2014, with the vast majority of these cuts coming in
2013. Fortunately, public administration employment
is expected to start stabilizing in 2014, allowing over-
all economic growth to improve to 1.6 per cent next
year. The economy will also continue to benefit from
robust non-residential construction activity, thanks to
several major ongoing projects, including the largest
construction project in Ottawa’s history—the $2.1-bil-
lion light-rail transit (LRT) project—and the $291-mil-
lion redevelopment of Lansdowne Park.
HOuSING OuTlOOk
exISTING HOuSING MarkeT Demand in Ottawa–Gatineau’s resale home market has
been decreasing for the past three years. After reaching
a near-record 19,300 units in 2009, unit sales of existing
homes declined an annual average of 1.7 per cent from
2010 to 2012. Although interest rates were very low
during this time, buyers were discouraged, in part, by
robust price growth. Indeed, existing home prices rose
ottawa–gatineau
Housing Starts(000s)
f = forecastSources: The Conference Board of Canada; CMHC Housing Time Series Database.
2010 11 12f 13f 14f 15f 16f 17f02468
10
Singles Multiples 20-year average
New Housing Price and Months’ Supply(dollars)
f = forecastSources: The Conference Board of Canada; CMHC Housing Time Series Database.
2010 11 12f 13f 14f 15f 16f 17f200,000250,000300,000350,000400,000450,000500,000
1.11.21.31.41.51.61.7
Price Months’ supply

Autumn 2013—metropolitan Housing Outlook | 43
The Conference Board of Canada
by 7.1 per cent per year on average over the 10-year
period from 2000 to 2010, topping $300,000 in 2009.
Through 2011 and 2012, fiscal restraint in the public
sector, and the resulting layoffs, weakened Ottawa–
Gatineau’s economy, further hampering demand in the
resale market.
At the same time, sellers were enticed by this strong
growth in resale prices. New listings increased by an
annual average of 6.4 per cent from 2010 to 2012. As
a result, the sales-to-new-listings ratio fell from 65 per
cent in 2009 to 51 per cent last year. In turn, resale
price growth finally began to slow, slipping to 5.9 per
cent in 2011 and 2.5 per cent in 2012. This was the
smallest increase in resale home prices in the Ottawa–
Gatineau region in 14 years.
Unit sales of existing homes fell again in the first
quarter of this year, and then increased in the second
quarter. However, given the persistent weakness in the
economy in 2013, reduced employment, the introduc-
tion of tighter mortgage rules last year, and rising
interest rates, demand is expected to remain muted
through the last half of this year and into next year
Ottawa–Gatineau: Economic Indicators
2010 2011 2012 2013f 2014f 2015f 2016f 2017f
real GDP at market prices 61,240 62,038 62,532 63,015 64,025 65,499 67,010 68,487(2002 $ millions) 3.0 1.3 0.8 0.8 1.6 2.3 2.3 2.2
Total employment (000s) 687 694 712 699 710 723 734 7442.4 1.0 2.5 –1.8 1.6 1.9 1.5 1.3
unemployment rate (per cent) 6.6 6.0 6.3 6.4 6.1 5.9 5.6 5.4
Personal income per capita ($) 42,481 43,787 45,137 44,816 46,226 47,787 49,213 50,5791.9 3.1 3.1 –0.7 3.1 3.4 3.0 2.8
Population (000s) 1,239 1,256 1,273 1,286 1,294 1,304 1,316 1,3301.6 1.4 1.4 1.0 0.7 0.7 0.9 1.1
retail sales ($ millions) 16,199 16,911 17,379 17,470 18,072 18,679 19,328 19,9705.0 4.4 2.8 0.5 3.4 3.4 3.5 3.3
Inflation rate (per cent) 2.5 3.0 1.3 1.3 1.9 2.1 2.0 2.0
f = forecast Italics indicate percentage change.Sources: The Conference Board of Canada; Statistics Canada.
MLS Sales-to-New-Listings Ratio and Price Growth(per cent)
f = forecast; MLS = Multiple Listing ServiceSources: The Conference Board of Canada; Canadian Real Estate Association.
2010 11 12f 13f 14f 15f 16f 17f0
2
4
6
8
45
50
55
60
65
Price growth Sales-to-new-listings ratio
Affordability(left, dollars; right, per cent)
f = forecastNote: Principle and interest payments assume average resale price, 10 per cent down payment, 25-year amoritization, and 5-year fixed mortgage rate.Sources: The Conference Board of Canada; Canadian Real Estate Association.
2010 11 12f 13f 14f 15f 16f 17f500
1,000
1,500
2,000
2,500
15
17
19
21
23
P&I payment P&I/income

44 | metropolitan Housing Outlook—Autumn 2013
The Conference Board of Canada
as well. Unit sales of existing homes are expected to
decline again in 2013 and 2014, down 5.2 per cent and
4.1 per cent, respectively. New listings have continued
to increase so far this year, although at a more moder-
ate pace. Accordingly, the sales-to-new-listings ratio is
forecast to drop to 47 per cent in 2013, thereby slow-
ing price growth further, down to 1.4 per cent. Sellers
are expected to take a breather in 2014, lowering new
listings by 9 per cent. However, the sales-to-new-
listings ratio will remain at just under 50 per cent, and
resale price growth will remain subdued at a forecast
1.8 per cent.
Over the following few years, as the economy stabil-
izes, demand in Ottawa–Gatineau’s resale market is
expected to pick up once more. Unit sales are forecast
to grow by 1.9 per cent per year on average from 2015
to 2017. New listings are anticipated to rise at a similar
pace, holding the market in a balanced state, with the
sales-to new-listings ratio hovering around 50 per cent.
Accordingly, growth in existing home prices is expected
to remain modest over 2015–17, at an annual average
rate of 2.1 per cent.
NeW HOuSING MarkeT Unlike the resale market, Ottawa–Gatineau’s new home
market has been more volatile over the last couple
of years, with starts at times increasing and at others
decreasing. Specifically, housing starts grew 2 per cent
in 2010, following a 13.7 per cent decline the previous
year. Builders were being drawn back to the market
in 2010 by rising absorptions, as buyers enjoyed a
healthier economy and low interest rates. This increase
in starts was entirely driven by the multiple-unit mar-
ket, as single-detached starts continued to fall. A small
decline in months’ supply, from 1.5 months to 1.3
months helped to boost growth in new home prices for
2010 as well, raising it to 4 per cent, up from 1.5 per
cent in 2009.
The threat of public sector layoffs lowered demand in
the new home market again in 2011, as absorptions
dropped more than 13 per cent. Builders pulled back
from the market as a result, reducing starts 8.7 per cent,
with the decline split between the singles and multiples
markets. In turn, price growth in the new home market
slowed to 3 per cent.
Absorptions continued to decline in 2012, in line with
the still weak economy. But a number of new condo-
minium and multi-family home developments saw the
light of day last year. In the end, while single starts
fell by 20.8 per cent last year, multiple starts increases
21.1per cent, raising total starts by 6.3 per cent overall.
The combination of lower absorptions and higher starts
raised months’ supply to 1.6 months in 2012, its high-
est level since 1998. As a consequence, growth in new
home prices decelerated further, down to 2.6 per cent.
Still, average new home prices reached $400,000 for
the first time last year.
Ottawa–Gatineau: Resale Housing Market Indicators
2010 2011 2012 2013f 2014f 2015f 2016f 2017f
unit sales 18,827 18,411 18,307 17,363 16,649 17,164 17,498 17,627–2.2 –2.2 –0.6 –5.2 –4.1 3.1 1.9 0.7
Dollar volume sales ($ millions) 5,709 5,912 6,026 5,795 5,657 5,950 6,201 6,3805.1 3.6 1.9 –3.8 –2.4 5.2 4.2 2.9
New listings 31,935 32,939 35,888 36,824 33,497 34,130 34,754 35,0897.1 3.1 9.0 2.6 –9.0 1.9 1.8 1.0
Sales-to-new-listings ratio (%) 59 56 51 47 50 50 50 50
average price of a resale home ($) 303,226 321,106 329,150 333,746 339,771 346,665 354,398 361,9397.5 5.9 2.5 1.4 1.8 2.0 2.2 2.1
f = forecastItalics indicate percentage change.Sources: The Conference Board of Canada; Canadian Real Estate Association.

Autumn 2013—metropolitan Housing Outlook | 45
The Conference Board of Canada
In spite of the persistent lull in the economy and even
lower absorptions, builders increased starts again
through the first half of 2013, raising both single and
multiple starts. But, with tighter mortgage rules, slow-
ing population growth, and expected increases in inter-
est rates in the coming months, demand is forecast to
remain on a downward trend. Builders are therefore
forecast to reduce starts in the second half of this year
and into 2014. Total starts are anticipated to decline by
20.7 per cent in 2013 and 11.5 per cent next year, slip-
ping below 7,000 units for the first time since 1999.
Months’ supply will fall to 1.3 months as a result,
allowing growth in new home prices to strengthen from
1.1 per cent this year to 2 per cent in 2014. Builders are
then expected increase starts by a modest 3.1 per cent,
per year, on average, over 2015 to 2017 as the economy
improves. A stable months’ supply will lead to a 2.2 per
cent average annual increase in new home prices.
Ottawa–Gatineau: New Housing Market Indicators
2010 2011 2012 2013f 2014f 2015f 2016f 2017f
Housing starts 9,138 8,344 8,873 7,034 6,225 6,309 6,522 6,8292.0 –8.7 6.3 –20.7 –11.5 1.4 3.4 4.7
Singles 3,304 2,945 2,333 2,089 2,048 2,037 2,028 2,041–5.9 –10.9 –20.8 –10.5 –2.0 –0.5 –0.4 0.6
Multiples 5,834 5,399 6,539 4,945 4,177 4,272 4,493 4,7897.0 –7.5 21.1 –24.4 –15.5 2.3 5.2 6.6
under construction 6,167 5,646 6,523 6,582 6,077 5,940 5,953 6,0141.2 –8.5 15.5 0.9 –7.7 –2.2 0.2 1.0
Housing completions 9,539 8,356 8,122 6,838 6,631 6,329 6,495 6,7491.0 –12.4 –2.8 –15.8 –3.0 –4.6 2.6 3.9
Singles 3,721 2,935 2,548 2,080 2,060 2,036 2,026 2,030–1.0 –21.1 –13.2 –18.4 –0.9 –1.2 –0.5 0.2
Multiples 5,818 5,421 5,574 4,759 4,571 4,294 4,469 4,7192.4 –6.8 2.8 –14.6 –3.9 –6.1 4.1 5.6
Newly completed and unabsorbed 1,086 1,073 1,096 872 763 659 668 726–1.8 –1.2 2.1 –20.4 –12.5 –13.6 1.4 8.7
absorptions 9,676 8,394 8,097 7,039 6,803 6,379 6,460 6,6789.6 –13.2 –3.5 –13.1 –3.4 –6.2 1.3 3.4
Months’ supply 1.3 1.5 1.6 1.5 1.3 1.2 1.2 1.3
average price of a new home ($) 382,463 393,812 404,027 408,564 416,644 426,227 435,604 444,7524.0 3.0 2.6 1.1 2.0 2.3 2.2 2.1
f = forecastItalics indicate percentage change.Sources: The Conference Board of Canada; CMHC Housing Time Series Database.

46 | metropolitan Housing Outlook—Autumn 2013
The Conference Board of Canada
A strengthening economy in 2014 should lift Winnipeg resale housing volumes following a small downtick this year. Price growth is also
expected to edge higher next year as sales pick up. The new home market should be rock-solid thanks to healthy new-unit absorptions, but a slight pullback in housing starts is expected for 2014 as multiple-family construction dips. Still, the medium-term outlook features a decent economy and brisk population growth that will underpin continued resale transaction and price advances, along with buoyant housing starts. Excellent ownership affordability and evi-dence of slight pent-up demand for new construction are additional positive factors.
eCONOMIC OuTlOOk
Moderate GDP growth of 1.4 per cent is on tap for
Winnipeg in 2013, with a slight acceleration to 2.1 per
cent in 2014. A strengthening services sector under-
pins the faster 2014 advance. Employment is forecast
to rise 1.5 per cent in 2014, more than doubling this
year’s projected 0.7 per cent increase. These job gains
will cut the local unemployment rate to 5.5 per cent in
2014, following a projected 16-year high of 5.9 per cent
this year. The outlook over the subsequent few years
features moderate gains in output and employment, but
ongoing sound population growth.
HOuSING OuTlOOk
exISTING HOuSING MarkeT Winnipeg’s resale market is balanced and is expected
to remain in this state throughout our forecast. Still,
the market is cooling slightly; easing sales demand and
rising listings supply point to moderating price growth
this year. Thereafter, rising sales will support slightly
stronger price advances.
Existing home sales averaged just over 11,700 units at
an annualized pace during the first half of 2013. This
was down modestly from the pace in the second half
Winnipeg
Housing Starts(000s)
f = forecastSources: The Conference Board of Canada; CMHC Housing TimeSeries Database.
2010 11 12f 13f 14f 15f 16f 17f012345
Singles Multiples 20-year average
New Housing Price and Months’ Supply(dollars)
f = forecastSources: The Conference Board of Canada; CMHC Housing Time Series Database.
2010 11 12f 13f 14f 15f 16f 17f300,000
350,000
400,000
450,000
500,000
0.5
1.0
1.5
2.0
2.5Price Months’ supply

Autumn 2013—metropolitan Housing Outlook | 47
The Conference Board of Canada
of 2012 and from last year as a the whole. We expect
sales to pick up slightly in the second half of 2013, but
still end the year below 11,900 units. While this volume
is a three-year low, it remains above the past decade’s
average. Moreover, transactions are forecast to rise 3
per cent in 2014 and 2.7 per cent annually on average
between 2015 and 2017. The 13,200 sales we expect by
2017 would be a record high for this market.
New listings have edged higher recently, averaging
nearly 17,000 units at an annual rate in the latest two
quarters, the most since 1998. But increases have been
gradual—between 1.8 and 3.2 per cent annually over
the past three years—suggesting that potential home
sellers believe a healthy market will value their units
fairly. Another moderate listings rise is on tap for 2013
as a whole. Generally easing sales and rising listings
cut the sales-to-new-listings ratio below 70 per cent in
the second quarter, the lowest since the first quarter of
2009, but still signalling a balanced market. For all of
2013, we expect the ratio to average 69 per cent, the
lowest since 2000. This still points to a balanced market
and will be the highest ratio among the cities covered
Winnipeg: Economic Indicators
2010 2011 2012 2013f 2014f 2015f 2016f 2017f
real GDP at market prices 32,181 32,640 33,144 33,604 34,310 35,393 36,341 37,170(2002 $ millions) 2.4 1.4 1.5 1.4 2.1 3.2 2.7 2.3
Total employment (000s) 408 409 417 420 426 435 442 4481.9 0.1 2.1 0.7 1.5 2.0 1.7 1.4
unemployment rate (per cent) 5.7 5.8 5.6 5.9 5.5 5.3 5.1 4.9
Personal income per capita ($) 35,509 36,091 37,231 38,004 39,078 40,389 41,720 43,0260.5 1.6 3.2 2.1 2.8 3.4 3.3 3.1
Population (000s) 753 766 778 789 798 808 818 8271.5 1.7 1.6 1.3 1.2 1.2 1.2 1.2
retail sales ($ millions) 9,933 10,175 10,360 10,669 11,157 11,534 11,940 12,3185.7 2.4 1.8 3.0 4.6 3.4 3.5 3.2
Inflation rate (per cent) 0.8 2.9 1.6 2.7 2.6 2.1 2.1 2.1
f = forecast Italics indicate percentage change.Sources: The Conference Board of Canada; Statistics Canada.
MLS Sales-to-New-Listings Ratio and Price Growth(per cent)
f = forecast; MLS = Multiple Listing ServiceSources: The Conference Board of Canada; Canadian Real Estate Association.
2010 11 12f 13f 14f 15f 16f 17f0
3
6
9
12
60
65
70
75
80
Price growth Sales-to-new-listings ratio
Affordability(left, dollars; right, per cent)
f = forecastNote: Principle and interest payments assume average resale price, 10 per cent down payment, 25-year amoritization, and 5-year fixed mortgage rate.Sources: The Conference Board of Canada; Canadian Real Estate Association.
2010 11 12f 13f 14f 15f 16f 17f500
1,000
1,500
2,000
10
15
20
25
P&I payment P&I/income

48 | metropolitan Housing Outlook—Autumn 2013
The Conference Board of Canada
in this report next year. By 2017, we expect slightly
faster gains in listings than in sales to trim the ratio to
63 per cent.
The easing market balance has prompted quarterly
drops in the average resale price during three of the
latest four quarters, although it remains above its year-
earlier level. These dips will trim annual price growth
to 3.3 per cent this year, the lowest since 2000 and
only about half the 20-year average of nearly 6 per cent
per year. Slightly faster growth of 3.8 per cent is on
tap for 2014 and then annual increases slightly above
4 per cent between 2015 and 2017. Notwithstanding
price gains and expected interest rate hikes, Winnipeg
housing will remain relatively affordable. Principle
and interest charges on the city’s average resale unit
are forecast to consume only 16.6 per cent of average
household income in 2014, above only Calgary and
Edmonton among the nine cities in this report.
NeW HOuSING MarkeT New home absorption has averaged a brisk 3,400 units
at an annual rate during the latest four quarters, exceed-
ing any annual figure on record and also the 20-year
average near 2,100 units. We expect absorptions to end
2013 above 3,700 units and exceed 4,000 units in 2014.
Further gains are expected through the medium term
thanks to solid local demand underpinnings. Despite
such strong absorptions, builders’ unsold stocks at the
end of the second quarter were nearly twice those dur-
ing the first quarter of 2012 because the completion of
new units had exceeded their take-up for five straight
quarters. Such inventories of completed and unoccupied
units are forecast to rise further during the second half
of 2013, but decline during 2014 as absorptions begin
to outpace completions. Although these inventories will
remain relatively high through 2017, they will shrink
from roughly 17 per cent of recent absorptions this year
to only 12 per cent of absorptions in 2017.
Strong demand for new homes lifted housing starts to
an annual pace of roughly 4,700 units in the first half
of 2013, the highest two-quarter average in 25 years.
This built on large jumps in starts in two of the past
three years, including last year’s 20.5 per cent increase.
Big increases in multi-family construction have largely
driven gains, although single-family starts have also
risen. Total starts are expected to ease slightly in 2014,
mainly because of a pullback in multiple construction,
then rise steadily. In 2017, we expect over 4,800 total
starts in the Winnipeg area, the most since 1987.
Despite recent large increases among multiple starts,
Winnipeg: Resale Housing Market Indicators
2010 2011 2012 2013f 2014f 2015f 2016f 2017f
unit sales 11,573 12,298 12,093 11,883 12,234 12,711 12,966 13,2390.6 6.3 –1.7 –1.7 3.0 3.9 2.0 2.1
Dollar volume sales ($ millions) 2,647 2,969 3,085 3,131 3,345 3,624 3,851 4,09210.9 12.2 3.9 1.5 6.8 8.3 6.3 6.3
New listings 15,976 16,385 16,675 17,295 18,249 19,367 20,128 20,8893.2 2.6 1.8 3.7 5.5 6.1 3.9 3.8
Sales-to-new-listings ratio (%) 72 75 73 69 67 66 64 63
average price of a resale home ($) 228,687 241,389 255,080 263,529 273,446 285,115 296,985 309,04710.3 5.6 5.7 3.3 3.8 4.3 4.2 4.1
f = forecastItalics indicate percentage change.Sources: The Conference Board of Canada; Canadian Real Estate Association.

Autumn 2013—metropolitan Housing Outlook | 49
The Conference Board of Canada
good affordability will keep single-family construction
dominant; this is the only city among the nine covered
in this report in which single starts make up more than
half of the forecast total between 2013 and 2017.
Local demographics continue to be supportive.
Population growth is forecast to remain above 1 per
cent through 2017, despite cooling from recent annual
gains of above 1.5 per cent. Moreover, the ratio of
housing starts to absolute population growth has
recovered only slowly from the 2009 recession and was
below its 25-year average in each of the past four years,
hinting at potential pent-up housing demand.
Winnipeg: New Housing Market Indicators
2010 2011 2012 2013f 2014f 2015f 2016f 2017f
Housing starts 3,218 3,342 4,025 4,304 3,953 4,576 4,793 4,84859.8 3.9 20.5 6.9 –8.2 15.8 4.7 1.1
Singles 1,915 1,993 2,123 2,272 2,220 2,546 2,641 2,59926.8 4.1 6.5 7.0 –2.3 14.7 3.8 –1.6
Multiples 1,303 1,349 1,903 2,032 1,733 2,031 2,152 2,249158.8 3.5 41.1 6.8 –14.7 17.2 6.0 4.5
under construction 1,847 2,383 2,904 3,570 3,672 3,700 3,727 3,75913.9 29.0 21.9 22.9 2.9 0.8 0.7 0.8
Housing completions 2,388 3,179 3,258 3,891 3,933 4,546 4,764 4,819–10.6 33.1 2.5 19.4 1.1 15.6 4.8 1.2
Singles 1,790 1,863 1,911 2,731 2,201 2,494 2,620 2,59310.5 4.1 2.6 42.9 –19.4 13.3 5.1 –1.0
Multiples 598 1,316 1,347 1,160 1,732 2,052 2,144 2,226–43.0 120.1 2.4 –13.9 49.4 18.4 4.5 3.8
Newly completed and unabsorbed 347 318 371 602 537 551 580 581–36.3 –8.2 16.7 62.1 –10.8 2.7 5.1 0.2
absorptions 2,523 3,176 3,089 3,732 4,050 4,506 4,735 4,827–10.2 25.9 –2.7 20.8 8.5 11.2 5.1 1.9
Months’ supply 1.6 1.2 1.4 1.9 1.6 1.5 1.5 1.4
average price of a new home ($) 396,430 415,489 432,930 449,458 458,249 465,179 471,099 477,0964.8 4.8 4.2 3.8 2.0 1.5 1.3 1.3
f = forecastItalics indicate percentage change.Sources: The Conference Board of Canada; CMHC Housing Time Series Database.

50 | metropolitan Housing Outlook—Autumn 2013
The Conference Board of Canada
Calgary’s economy and housing demand continue to thrive as energy sector activity remains healthy. Rising GDP is spurring employment growth.
On the resale housing market front, solid sales will lead to sound price gains this year and next. The new hous-ing market is benefitting from strong absorptions, which are trimming unsold stocks of new units and fostering new construction. The medium term also looks decent. Ongoing economic growth will continue to produce gains in resale sales and prices and keep housing starts above their 20-year average. Good housing affordability, measured against local incomes, is an ongoing benefit to this market and allows single-family starts to maintain a high market share compared with other cities covered in this report.
eCONOMIC OuTlOOk
Summertime flooding in Calgary captured national
attention. The resulting hit to third-quarter output will
limit Calgary’s GDP to 3.3 per cent growth in 2013,
modest by recent standards. Output will rise a slightly
faster 3.4 per cent in 2014, spurred by government-
funded rebuilding efforts. The job market will continue
to expand, with annual growth of 2.4 per cent this
year and 2.8 per cent in 2014 cutting the unemploy-
ment rate from 4.9 per cent this year to 4.6 per cent in
2014. Economic health should continue between 2015
and 2017, with GDP expanding roughly 3 per cent and
employment rising about 2 per cent each year.
HOuSING OuTlOOk
exISTING HOuSING MarkeT Calgary’s strong economic fundamentals allowed its
resale market to largely shrug off the floods. Seasonally
adjusted sales and the average resale price actually rose
during June, the flood month, and have subsequently
advanced. The market remains in “balanced” territory,
but is approaching sellers’ conditions. Price growth
is accelerating, although increases remain far below
boom-era advances. We expect the market to remain
balanced and price growth to stay healthy in 2014 and
over the following few years.
Calgary
Housing Starts(000s)
f = forecastSources: The Conference Board of Canada; CMHC Housing TimeSeries Database.
2010 11 12f 13f 14f 15f 16f 17f0369
1215
Singles Multiples 20-year average
New Housing Price and Months’ Supply(dollars)
f = forecastSources: The Conference Board of Canada; CMHC Housing Time Series Database.
2010 11 12f 13f 14f 15f 16f 17f400,000
450,000
500,000
550,000
600,000
0.8
1.0
1.2
1.4
1.6
Price Months’ supply

Autumn 2013—metropolitan Housing Outlook | 51
The Conference Board of Canada
Despite the flooding, transactions accelerated during
the second quarter, building on a 19 per cent increase
in 2012 and approaching an annualized 30,000 units,
the most since 2007. We expect sales to ease slightly
through year-end, but still end 2013 up 5.5 per cent
at 28,100 units. Calgary’s healthy economy should
produce a 2.4 per cent sales gain in 2014, then simi-
lar annual advances between 2015 and 2017. Sales
volumes will remain below peak levels throughout
our forecast.
The solidifying market has yet to attract a sustained
increase in new listings. These fell 4 per cent to
42,138 units in 2012, the second straight small annual
decline. The supply of listings hovered near this level
during the first half of 2013 and is expected to end the
year little changed. Continued gains in sales are ultim-
ately forecast to encourage potential vendors, lifting
listings 5 per cent in 2014 and modestly thereafter.
Calgary: Economic Indicators
2010 2011 2012 2013f 2014f 2015f 2016f 2017f
real GDP at market prices 96,414 101,651 105,987 109,485 113,164 116,794 120,275 123,640(2002 $ millions) 3.9 5.4 4.3 3.3 3.4 3.2 3.0 2.8
Total employment (000s) 705 725 752 770 792 809 824 837–1.3 3.0 3.7 2.4 2.8 2.1 1.9 1.6
unemployment rate (per cent) 6.8 5.8 4.8 4.9 4.6 4.3 4.2 4.0
Personal income per capita ($) 51,431 54,717 55,524 56,602 58,176 59,994 61,632 63,0612.1 6.4 1.5 1.9 2.8 3.1 2.7 2.3
Population (000s) 1,244 1,269 1,309 1,350 1,378 1,404 1,431 1,4591.8 2.0 3.2 3.1 2.1 1.9 1.9 2.0
retail sales ($ millions) 21,728 23,318 24,164 25,224 26,531 27,676 28,807 29,8926.8 7.3 3.6 4.4 5.2 4.3 4.1 3.8
Inflation rate (per cent) 0.8 2.2 1.0 2.0 2.3 2.1 2.1 2.1
f = forecast Italics indicate percentage change.Sources: The Conference Board of Canada; Statistics Canada.
MLS Sales-to-New-Listings Ratio and Price Growth(per cent)
f = forecast; MLS = Multiple Listing ServiceSources: The Conference Board of Canada; Canadian Real Estate Association.
2010 11 12f 13f 14f 15f 16f 17f0
2
4
6
40
50
60
70
Price growth Sales-to-new-listings ratio
Affordability(left, dollars; right, per cent)
f = forecastNote: Principle and interest payments assume average resale price, 10 per cent down payment, 25-year amoritization, and 5-year fixed mortgage rate.Sources: The Conference Board of Canada; Canadian Real Estate Association.
2010 11 12f 13f 14f 15f 16f 17f500
1,0001,5002,0002,5003,0003,500
13151719212325
P&I payment P&I/income

52 | metropolitan Housing Outlook—Autumn 2013
The Conference Board of Canada
Last year’s listings drops and rising sales lifted the
sales-to-new-listings ratio to 63.2 per cent for the full
year, the highest since 2006. The ratio remained ele-
vated in the first half of 2013 and will end the year
averaging 67 per cent. This is squarely within our
estimate of a balanced market, which ranges between
48 per cent and 71 per cent for this market. We expect
the ratio to average a similar 65 per cent in 2014, then
dip very slightly.
Unsurprisingly, Calgary’s resale prices are rising
briskly. Year-over-year growth has averaged a solid
4.6 per cent in the latest four quarters, including a first-
quarter jump near 8 per cent. These increases will lift
Calgary’s average price 4.7 per cent in 2013, the largest
gain since 2007 and finally exceeding that year’s peak
value. Similar price growth is expected between 2014
and 2016, with a slight tapering in growth to 4 per
cent in 2017. These increases will slightly erode local
housing affordability. Principle and interest charges on
Calgary’s average resale home were under 16 per cent
of average household income the last two years and are
expected to remain there in 2013. But house prices will
rise faster than incomes, pushing the ratio to roughly
20 per cent by 2017. This remains decent, as affordabil-
ity is better only in Edmonton, Ottawa, and Winnipeg
among the cities in this report.
NeW HOuSING MarkeT Buoyant housing demand is also energizing the new
home market. Absorption of new units averaged
11,200 units in the four quarters to the second quar-
ter of 2013, up 25 per cent from a year earlier. This
included a surge to an annualized 15,000 units in the
second quarter, the most since 2008. This strength will
lift absorptions to a full-year total of 12,140 units in
2013, up 25 per cent from 2012. Another increase of
nearly 6 per cent in absorptions is expected for 2014,
which will nonetheless leave them trailing the peak of
13,700 units reached in 2008. Solid new-unit take-up
trimmed the number of completed and unoccupied new
units in 2012 and is forecast to further shave them in
2013. While an increase in builder inventories is on tap
for 2014, we expect persistently strong absorptions to
limit the impact of these stocks on the market. Indeed,
forecast 2014 inventories will, on average, be equiva-
lent only to 7.8 per cent of the year’s absorptions—
below the 9.7 per cent average of the 18 years of data
available to us. We expect this share to remain stable
through 2017.
Healthy new-unit take-up fuelled a big jump in hous-
ing starts to 13,186 units in 2012, more than double the
recessionary trough in 2009, but well off peak levels
of the last decade. We expect starts to ease a modest
2.7 per cent in 2013 as an 11 per cent dip in multiple
starts slightly outweighs a 7 per cent gain in single-
detached starts. For 2014, rebounding multiple starts
Calgary: Resale Housing Market Indicators
2010 2011 2012 2013f 2014f 2015f 2016f 2017f
unit sales 20,996 22,466 26,634 28,112 28,793 29,418 30,027 30,620–15.6 7.0 18.6 5.5 2.4 2.2 2.1 2.0
Dollar volume sales ($ millions) 8,372 9,050 10,982 12,138 13,009 13,929 14,928 15,831–12.8 8.1 21.3 10.5 7.2 7.1 7.2 6.1
New listings 46,276 43,782 42,138 42,219 44,484 46,181 47,411 48,48111.1 –5.4 –3.8 0.2 5.4 3.8 2.7 2.3
Sales-to-new-listings ratio (%) 45 51 63 67 65 64 63 63
average price of a resale home ($) 398,764 402,852 412,315 431,760 451,798 473,470 497,139 517,0163.3 1.0 2.3 4.7 4.6 4.8 5.0 4.0
f = forecastItalics indicate percentage change.Sources: The Conference Board of Canada; Canadian Real Estate Association.

Autumn 2013—metropolitan Housing Outlook | 53
The Conference Board of Canada
will fuel a 5 per cent increase in total starts despite rela-
tively unchanged single-detached construction. In the
medium term, we expect housing starts to ease slightly,
as both single-family and multiple construction dip. By
2017, we expect 11,400 units to get under way; this
would slightly outpace the 20-year average of housing
starts. While multiple starts are expected to increase
their market share, they are forecast to make up only
52 per cent of total starts between 2013 and 2017. Only
Winnipeg is forecast to have a lower share of multiple
starts during this period. This speaks to Calgary’s rela-
tively good housing affordability.
Brisk population advances underpin this solid construc-
tion outlook. Calgary’s population rose 3.2 per cent in
2012, the fastest jump since 2006, and is forecast to
rise similarly in 2013. Population growth of roughly
2 per cent annually is expected between 2014 and 2017.
Moreover, Calgary’s ratio of housing starts to absolute
population hikes was below its 25-year average in both
2011 and 2012, hinting at the possibility of pent-up
housing demand.
Calgary: New Housing Market Indicators
2010 2011 2012 2013f 2014f 2015f 2016f 2017f
Housing starts 9,233 9,190 13,186 12,834 13,444 12,578 11,654 11,37848.9 –0.5 43.5 –2.7 4.8 –6.4 –7.3 –2.4
Singles 5,835 5,083 5,970 6,382 6,280 5,988 5,714 5,55723.7 –12.9 17.4 6.9 –1.6 –4.7 –4.6 –2.7
Multiples 3,398 4,107 7,217 6,452 7,164 6,590 5,941 5,821129.0 20.9 75.7 –10.6 11.0 –8.0 –9.9 –2.0
under construction 8,535 7,569 10,279 11,577 12,721 12,821 12,634 12,556–8.8 –11.3 35.8 12.6 9.9 0.8 –1.5 –0.6
Housing completions 10,991 7,689 9,593 12,129 12,912 12,608 11,888 11,34333.4 –30.0 24.8 26.4 6.5 –2.4 –5.7 –4.6
Singles 6,364 4,824 5,371 6,021 6,323 6,089 5,834 5,65448.3 –24.2 11.3 12.1 5.0 –3.7 –4.2 –3.1
Multiples 4,627 2,865 4,222 6,108 6,589 6,519 6,055 5,68817.2 –38.1 47.4 44.7 7.9 –1.1 –7.1 –6.0
Newly completed and unabsorbed 1,030 1,055 929 865 998 955 901 8781.5 2.4 –12.0 –6.9 15.4 –4.3 –5.7 –2.5
absorptions 10,753 7,816 9,687 12,140 12,811 12,676 11,934 11,34828.7 –27.3 23.9 25.3 5.5 –1.1 –5.9 –4.9
Months’ supply 1.1 1.6 1.2 0.9 0.9 0.9 0.9 0.9
average price of a new home ($) 482,596 482,091 490,128 509,415 526,002 539,089 549,821 560,7681.7 –0.1 1.7 3.9 3.3 2.5 2.0 2.0
f = forecastItalics indicate percentage change.Sources: The Conference Board of Canada; CMHC Housing Time Series Database.

54 | metropolitan Housing Outlook—Autumn 2013
The Conference Board of Canada
Edmonton’s housing markets continue to benefit from the area’s sound economy, low interest rates, and ongoing population growth, although the city’s
economic exposure to energy markets introduces risk. The resale market is balanced and is delivering steady gains in sales and the average price. We expect this balance to persist over the next few years—despite rising interest rates—thanks to the market’s favourable underpinnings. Strengthening new home demand has spurred construction, particularly of multi-family units. Starts will pull back in 2014, as multiples retrench, then stabilize.
eCONOMIC OuTlOOk
Edmonton’s economy is forecast to remain healthy.
While local GDP growth is expected to slow to 3.2 per
cent in 2014 from 4.2 per cent in 2013 and 5.9 per cent
in 2012, forecast advances remain above the national
average. Employment will rise 2.5 per cent in 2013 and
1.6 per cent in 2014, a more sustainable pace follow-
ing larger post-recession rebounds in 2011 and 2012.
This will trim the unemployment rate to 4.5 per cent
in 2013 and keep it low at 4.6 per cent in 2014. The
medium term also looks solid, with GDP advancing
roughly 3 per cent annually between 2015 and 2017 and
ongoing employment growth trimming the unemploy-
ment rate to 4.1 per cent by 2017.
HOuSING OuTlOOk
exISTING HOuSING MarkeT Edmonton’s resale market has recovered from the 2009
downturn and has hit a sustainable pace. Transactions
have remained relatively stable over the latest five quar-
ters, and new listings are also coming on the market
steadily. Moderate carrying costs and decent employ-
ment growth are giving consumers confidence to main-
tain this buying pace. The market’s currently balanced
state is projected to persist through the medium term,
fostering moderate sales and price growth.
edmonton
Housing Starts(000s)
f = forecastSources: The Conference Board of Canada; CMHC Housing TimeSeries Database.
2010 11 12f 13f 14f 15f 16f 17f0
5
10
15
Singles Multiples 20-year average
New Housing Price and Months’ Supply(dollars)
f = forecastSources: The Conference Board of Canada; CMHC Housing Time Series Database.
2010 11 12f 13f 14f 15f 16f 17f300,000
350,000
400,000
450,000
1.0
1.5
2.0
2.5
Price Months’ supply

Autumn 2013—metropolitan Housing Outlook | 55
The Conference Board of Canada
Annualized sales of existing homes have hovered
slightly above 18,000 units since the second quarter of
2012, apart from a brief dip during the fourth quarter of
2012. A modest easing is also expected during the final
quarter of 2013 as slightly rising mortgage rates cool
demand. Still, transactions for all of 2013 are expected
to be up 3.4 per cent after a 4 per cent increase in 2012.
The pace of gains will slow to 1.5 per cent in 2014,
but rebound to average 2.3 per cent annually between
2015 and 2017 as the local economy remains sound and
interest rates rise only moderately. We expect nearly
19,800 sales in 2017, well above the 20-year average,
but still below the 2006 peak of almost 22,000 units.
Fresh supplies of existing homes are also being deliv-
ered regularly. New listings edged higher in the first
half of 2013 following a late 2012 dip, but their annual-
ized volume near 30,250 units remained slightly below
the 31,400 units in 2012. We expect listings to dip
slightly along with sales later this year, ending 2013
at 30,100 units, down 4 per cent. For 2014, continued
sales increases will keep potential home sellers con-
fident of a good market for their units, boosting new
listings 2.7 per cent. Broadly similar gains are on tap
between 2015 and 2017 as market balance persists.
Edmonton: Economic Indicators
2010 2011 2012 2013f 2014f 2015f 2016f 2017f
real GDP at market prices 68,926 73,719 78,082 81,384 83,989 86,716 89,356 91,973(2002 $ millions) 5.7 7.0 5.9 4.2 3.2 3.2 3.0 2.9
Total employment (000s) 633 671 693 710 722 739 751 761–0.7 5.9 3.3 2.5 1.6 2.4 1.6 1.3
unemployment rate (per cent) 6.7 5.4 4.7 4.5 4.6 4.4 4.2 4.1
Personal income per capita ($) 45,061 47,785 49,110 50,187 51,225 52,990 54,401 55,6150.4 6.0 2.8 2.2 2.1 3.4 2.7 2.2
Population (000s) 1,176 1,197 1,230 1,264 1,289 1,311 1,334 1,3581.6 1.7 2.8 2.8 1.9 1.7 1.8 1.8
retail sales ($ millions) 20,138 21,492 22,467 23,659 24,841 25,923 26,999 28,0515.0 6.7 4.5 5.3 5.0 4.4 4.2 3.9
Inflation rate (per cent) 1.0 2.5 1.2 1.7 2.2 2.1 2.1 2.1
f = forecast Italics indicate percentage change.Sources: The Conference Board of Canada; Statistics Canada.
MLS Sales-to-New-Listings Ratio and Price Growth(per cent)
f = forecast; MLS = Multiple Listing ServiceSources: The Conference Board of Canada; Canadian Real Estate Association.
2010 11 12f 13f 14f 15f 16f 17f−2
0
2
4
6
45
50
55
60
65
Price growth Sales-to-new-listings ratio
Affordability(left, dollars; right, per cent)
f = forecastNote: Principle and interest payments assume average resale price, 10 per cent down payment, 25-year amoritization, and 5-year fixed mortgage rate.Sources: The Conference Board of Canada; Canadian Real Estate Association.
2010 11 12f 13f 14f 15f 16f 17f1,000
1,500
2,000
2,500
3,000
14
16
18
20
22P&I payment P&I/income

56 | metropolitan Housing Outlook—Autumn 2013
The Conference Board of Canada
This year’s slight listings drop, combined with the
sales uptick, will lift the sales-to-new-listings ratio to
60.6 per cent, the highest since a pre-recession reading
of 62 per cent in 2009, but still signalling a balanced
market. Similar movements in sales and listings during
the medium term are expected to keep the ratio near
60 per cent.
This well-performing housing market is producing
healthy price increases. Last year, Edmonton’s average
resale price rose 2.7 per cent, following a slight 2011
dip. Gains accelerated slightly during the first two quar-
ters of 2013. We expect ongoing strength in the second
half of 2013 to lift the average resale price for the full
year by 3.7 per cent, putting it at $346,580—above the
boom-era peak of $338,653 in 2007. The average price
is expected to rise an even faster 4.6 per cent in 2014,
but hikes will subsequently ease.
NeW HOuSING MarkeT New home demand has also improved against
Edmonton’s healthy economic backdrop. The take-up
of new units rose 16 per cent in 2012. Absorptions
jumped again during the first half of 2013, exceeding
12,600 units at an annual rate during the second quarter
of 2013. This was the most since 2009 and up 18 per
cent from a year earlier. We expect new unit demand
to strengthen further during the second half of 2013
and end the year up 26 per cent from the average 2012
level. But absorptions will essentially plateau at this
level, then ease in the medium term.
While absorptions have been strong, the completion of
new units has been even larger, so the number of com-
pleted and unoccupied units has edged higher. These
inventories are expected to average nearly 1,560 units
this year, but ease slightly in 2014 as absorptions out-
weigh completions. Inventories are forecast to stay
above 1,300 units through the medium term as comple-
tions generally exceed absorptions. This is slightly
high by historical standards, since such stocks averaged
roughly 1,230 units over the previous 20 years.
This solid demand environment lifted housing starts to
12,758 units in 2012, up nearly 40 per cent from the
2011 level. The jump was led by a 66 per cent increase
in starts of multi-family units, although single-detached
activity also rose. A further uptick in singles starts and
another big jump in multi-family construction propelled
total starts to an annualized rate near 16,500 units in the
first half of 2013, the highest two-quarter average on
record. Although this surge is unsustainable, starts will
finish 2013 at 14,000 units, the most since 2007.
Edmonton: Resale Housing Market Indicators
2010 2011 2012 2013f 2014f 2015f 2016f 2017f
unit sales 16,403 16,963 17,642 18,236 18,514 19,037 19,411 19,794–14.3 3.4 4.0 3.4 1.5 2.8 2.0 2.0
Dollar volume sales ($ millions) 5,393 5,523 5,898 6,320 6,713 7,201 7,639 8,064–12.0 2.4 6.8 7.2 6.2 7.3 6.1 5.6
New listings 33,130 31,721 31,408 30,109 30,930 31,734 32,334 32,9707.9 –4.3 –1.0 –4.1 2.7 2.6 1.9 2.0
Sales-to-new-listings ratio (%) 50 53 56 61 60 60 60 60
average price of a resale home ($) 328,803 325,595 334,300 346,581 362,609 378,281 393,529 407,4052.6 –1.0 2.7 3.7 4.6 4.3 4.0 3.5
f = forecastItalics indicate percentage change.Sources: The Conference Board of Canada; Canadian Real Estate Association.

Autumn 2013—metropolitan Housing Outlook | 57
The Conference Board of Canada
For next year, easing starts of single-detached homes
and a significant pullback of multi-family construc-
tion will cut total starts to near 11,700 units. Volumes
will hover near this historically elevated level between
2015 and 2017. Nonetheless, there is some evidence
that Edmonton remains slightly under-built. Even the
2012 construction uptick left the area’s ratio of housing
starts to absolute population growth below its 25-year
average; this will persist throughout the forecast per-
iod, suggesting that housing starts could surprise on
the upside.
Edmonton: New Housing Market Indicators
2010 2011 2012 2013f 2014f 2015f 2016f 2017f
Housing starts 10,004 9,226 12,758 14,006 11,734 11,401 10,973 11,15062.4 –7.8 38.3 9.8 –16.2 –2.8 –3.8 1.6
Singles 6,150 4,957 5,663 6,026 5,904 5,671 5,448 5,33262.2 –19.4 14.2 6.4 –2.0 –4.0 –3.9 –2.1
Multiples 3,854 4,269 7,095 7,979 5,830 5,731 5,525 5,81862.8 10.8 66.2 12.5 –26.9 –1.7 –3.6 5.3
under construction 8,654 8,552 10,164 12,571 11,385 11,563 11,648 11,9411.8 –1.2 18.8 23.7 –9.4 1.6 0.7 2.5
Housing completions 9,443 8,941 10,166 13,114 12,442 11,195 10,915 10,6822.3 –5.3 13.7 29.0 –5.1 –10.0 –2.5 –2.1
Singles 5,433 5,308 5,299 5,554 5,711 5,565 5,382 5,25274.9 –2.3 –0.2 4.8 2.8 –2.6 –3.3 –2.4
Multiples 4,010 3,633 4,867 7,560 6,731 5,630 5,533 5,431–34.5 –9.4 34.0 55.3 –11.0 –16.4 –1.7 –1.9
Newly completed and unabsorbed 1,394 1,550 1,476 1,559 1,511 1,326 1,348 1,415–12.4 11.1 –4.7 5.6 –3.1 –12.3 1.7 5.0
absorptions 9,603 8,835 10,222 12,903 12,769 11,206 10,884 10,5834.6 –8.0 15.7 26.2 –1.0 –12.2 –2.9 –2.8
Months’ supply 1.7 2.1 1.7 1.5 1.4 1.4 1.5 1.6
average price of a new home ($) 375,844 379,327 382,809 387,803 399,334 409,062 418,608 427,950–0.8 0.9 0.9 1.3 3.0 2.4 2.3 2.2
f = forecastItalics indicate percentage change.Sources: The Conference Board of Canada; CMHC Housing Time Series Database.

58 | metropolitan Housing Outlook—Autumn 2013
The Conference Board of Canada
Vancouver’s resale housing market is in recovery following a sharp 2012 correction that cut both transactions and prices significantly. The resale
market is now balanced, and we expect this state to persist through the medium term. This will limit increases in the average resale price, keeping it below its pre-downturn level through 2015. The new home market is reasonably healthy, although builders do hold relatively high stocks of unsold units. Housing starts will dip this year and again in 2014. Economics and demographics are generally supportive: gross domestic product, employment, and the population are all projected to advance throughout the forecast. The strength of offshore housing demand remains a wild card.
eCONOMIC OuTlOOk
Vancouver’s economy is decent. GDP is on track to
rise only 2.2 per cent this year, down from 2.6 per
cent in 2012, but advance 3.1 per cent in 2014 and an
annual 2.9 per cent on average between 2015 and 2017.
Employment gains will also slow to 0.5 per cent in
2013, but accelerate to 2.5 per cent in 2014 and remain
above 1 per cent annually thereafter. This year’s mod-
est job growth will still be enough to help trim the
unemployment rate to a five-year low of 6.5 per cent,
with a dip to 6.2 per cent forecast for 2014. The popula-
tion will continue to rise between 1.5 and 1.7 per cent
annually, just below its 20-year average, throughout the
forecast period.
HOuSING OuTlOOk
exISTING HOuSING MarkeT The correction in Vancouver’s resale market appears
over, but recovery is likely to be modest. Sales are
rising gently, although a significant listings drop
appears equally responsible for recently firming prices.
The market became balanced during the spring and
appears set to remain there through the medium term.
Vancouver’s poor ownership affordability likely results
from years of offshore investment, but the market could
correct again if this money is withdrawn.
Vancouver
Housing Starts(000s)
f = forecastSources: The Conference Board of Canada; CMHC Housing Time Series Database.
2010 11 12f 13f 14f 15f 16f 17f0
5
10
15
20Singles Multiples 20-year average
New Housing Price and Months’ Supply(dollars)
f = forecastSources: The Conference Board of Canada; CMHC Housing Time Series Database.
2010 11 12f 13f 14f 15f 16f 17f500,000550,000600,000650,000700,000750,000
1.01.52.02.53.03.5
Price Months’ supply

Autumn 2013—metropolitan Housing Outlook | 59
The Conference Board of Canada
Sales of existing homes surged in the second quarter
of 2013, finally exceeding their year-earlier level after
six quarterly drops. But volumes are expected to ease
slightly in the second half of 2013 and end the year
down roughly 2 per cent. Still, this is a much better
outcome than the 23 per cent sales decline in 2012.
We expect transactions to rise 2 per cent in 2014 and
moderately thereafter but remain well below their pre-
correction level.
The weak market cut new listings during four of the
latest five quarters; these were off 12 per cent from a
year earlier in the second quarter of 2013. We expect
listings to keep edging lower until late 2014; annual
volumes will be off nearly 15 per cent this year and
another 10 per cent in 2014. Rising sales and falling
listings boosted the sales-to-new-listings ratio to 50 per
cent in the second quarter of 2013 and will continue to
push it higher next year, although it will remain in the
lower end of Vancouver’s balanced market range.
The firming market lifted Vancouver’s average resale
price above its year-earlier level in the second quarter
of 2013, although recent quarterly changes have been
Vancouver: Economic Indicators
2010 2011 2012 2013f 2014f 2015f 2016f 2017f
real GDP at market prices 101,857 105,256 108,038 110,428 113,872 117,360 120,754 124,038(2002 $ millions) 3.2 3.3 2.6 2.2 3.1 3.1 2.9 2.7
Total employment (000s) 1,220 1,251 1,275 1,281 1,313 1,342 1,365 1,3821.3 2.6 1.9 0.5 2.5 2.3 1.7 1.2
unemployment rate (per cent) 7.5 7.3 6.7 6.5 6.2 5.6 5.3 5.1
Personal income per capita ($) 36,133 37,395 38,711 39,207 40,494 41,737 42,817 43,8420.2 3.5 3.5 1.3 3.3 3.1 2.6 2.4
Population (000s) 2,389 2,426 2,464 2,501 2,541 2,584 2,628 2,6732.3 1.6 1.5 1.5 1.6 1.7 1.7 1.7
retail sales ($ millions) 26,827 27,674 28,628 28,963 30,074 31,282 32,395 33,4454.5 3.2 3.4 1.2 3.8 4.0 3.6 3.2
Inflation rate (per cent) 1.7 2.3 1.3 0.4 1.9 2.2 2.0 2.1
f = forecast Italics indicate percentage change.Sources: The Conference Board of Canada; Statistics Canada.
MLS Sales-to-New-Listings Ratio and Price Growth(per cent)
f = forecast; MLS = Multiple Listing ServiceSources: The Conference Board of Canada; Canadian Real Estate Association.
2010 11 12f 13f 14f 15f 16f 17f−10
0
10
20
40
50
60
70
Price growth Sales-to-new-listings ratio
Affordability(left, dollars; right, per cent)
f = forecastNote: Principle and interest payments assume average resale price, 10 per cent down payment, 25-year amoritization, and 5-year fixed mortgage rate.Sources: The Conference Board of Canada; Canadian Real Estate Association.
2010 11 12f 13f 14f 15f 16f 17f2,0002,5003,0003,5004,0004,5005,000
38404244464850
P&I payment P&I/income

60 | metropolitan Housing Outlook—Autumn 2013
The Conference Board of Canada
volatile. Many buyers appear to have taken advantage
of the slower market to snap up pricey single-detached
units; their sales rose briskly over the summer. Their
slightly higher market share has boosted the market’s
average price. Accordingly, we expect this value to end
2013 up 1 per cent, a big improvement from its 6 per
cent drop in 2012. Slightly firmer growth near 2 per
cent is on tap for 2014, and moderate annual gains
thereafter. We do not expect Vancouver’s average price
to regain its 2011 pre-downturn level until 2016.
Falling prices have slightly improved affordability.
Principle and interest charges on the average-priced
resale home are expected to end 2013 unchanged, fol-
lowing a 7.5 per cent drop last year. This year’s bite
will be 41 per cent of average household income.
Although this is down from a high of 46 per cent in
2011, it remains the highest among the cities covered
in this report. The local burden is forecast to remain
stable, at 41 per cent next year, but hit a new high of
46.7 per cent by 2017 as interest rates rise.
NeW HOuSING MarkeT The solidifying recovery in Vancouver’s resale market
is mirrored in its new home market. The absorption
of new dwellings, a proxy for new home demand, is
up significantly from 2011 and was set to average a
solid 17,200 units at an annual rate in the third quarter.
We expect absorptions to remain strong and end 2013
up 8 per cent. Another 4 per cent increase is on tap
for 2014. Despite the higher new-unit take-up, even
stronger completions have pushed the number of com-
pleted and unoccupied dwellings above 4,000 units
this year for the first time since 1998. While high by
recent standards, unsold inventories were significantly
larger in the late 1990s, exceeding 5,000 units in 1995
and 4,000 units in three of the next four years. We
expect further strong absorptions in 2014 to finally out-
weigh completions and trim these vendor backlogs to
3,700 units. These stocks are forecast to fall to roughly
2,400 units by 2017.
Continuing recovery of multi-family construction from
the 2009 downturn lifted total starts above 19,000 units
in 2012, the most since 2008. But multiples have pulled
back this year as unsold stocks have risen. This is out-
weighing a brisk upturn among the relatively small
number of single-detached homes started locally and
will cut total starts 9 per cent to just under 17,400 units.
For 2014, we expect dips in both single and multiple
construction to trim total starts another 5 per cent.
In the medium term, we see starts hovering between
17,500 and 18,000 units. Such volumes are slightly
above the 25-year average of roughly 16,200 units.
Vancouver: Resale Housing Market Indicators
2010 2011 2012 2013f 2014f 2015f 2016f 2017f
unit sales 31,143 32,936 25,445 24,853 25,389 26,616 27,161 27,529–14.1 5.8 –22.7 –2.3 2.2 4.8 2.0 1.4
Dollar volume sales ($ millions) 21,049 25,681 18,576 18,320 19,064 20,480 21,190 21,777–2.0 22.0 –27.7 –1.4 4.1 7.4 3.5 2.8
New listings 59,818 61,305 60,015 51,219 46,314 47,575 48,042 48,9979.1 2.5 –2.1 –14.7 –9.6 2.7 1.0 2.0
Sales-to-new-listings ratio (%) 52 54 42 49 55 56 57 56
average price of a resale home ($) 675,874 779,730 730,063 737,162 750,861 769,468 780,184 791,06414.1 15.4 –6.4 1.0 1.9 2.5 1.4 1.4
f = forecastItalics indicate percentage change.Sources: The Conference Board of Canada; Canadian Real Estate Association.

Autumn 2013—metropolitan Housing Outlook | 61
The Conference Board of Canada
Vancouver’s new home market does not appear hugely
overbuilt. Despite expensive houses, annual popula-
tion growth here has exceeded the national average in
23 of the past 25 years, underpinning steady residen-
tial demand. Moreover, although the ratio of housing
starts to absolute population growth slightly exceeded
its 25-year average in both 2011 and 2012, such an
overshoot was inevitable as Vancouver’s economy, and
housing market, recovered from the 2009 recession.
Easing construction this year and next will leave starts
near demographic requirements.
Vancouver: New Housing Market Indicators
2010 2011 2012 2013f 2014f 2015f 2016f 2017f
Housing starts 15,270 17,868 19,071 17,357 16,536 17,855 17,945 17,54985.2 17.0 6.7 –9.0 –4.7 8.0 0.5 –2.2
Singles 4,603 3,658 3,397 3,864 3,294 3,522 3,549 3,34562.1 –20.5 –7.1 13.8 –14.7 6.9 0.8 –5.7
Multiples 10,667 14,210 15,674 13,493 13,241 14,333 14,396 14,20497.3 33.2 10.3 –13.9 –1.9 8.2 0.4 –1.3
under construction 14,977 18,547 22,263 22,704 21,632 21,708 21,680 21,245–27.2 23.8 20.0 2.0 –4.7 0.3 –0.1 –2.0
Housing completions 16,474 12,919 16,958 18,073 17,339 17,490 18,217 18,072–1.9 –21.6 31.3 6.6 –4.1 0.9 4.2 –0.8
Singles 3,935 3,554 3,585 4,375 3,502 3,524 3,632 3,51417.9 –9.7 0.9 22.0 –19.9 0.6 3.1 –3.3
Multiples 12,539 9,365 13,373 13,698 13,837 13,966 14,585 14,558–6.8 –25.3 42.8 2.4 1.0 0.9 4.4 –0.2
Newly completed and unabsorbed 2,813 3,164 3,603 4,319 3,689 2,966 2,626 2,40228.4 12.5 13.9 19.9 –14.6 –19.6 –11.5 –8.5
absorptions 14,796 13,175 16,315 17,576 18,274 18,035 18,491 18,257–13.9 –11.0 23.8 7.7 4.0 –1.3 2.5 –1.3
Months’ supply 2.3 2.9 2.7 2.9 2.4 2.0 1.7 1.6
average price of a new home ($) 667,719 665,695 662,097 662,452 674,797 686,439 694,796 702,5493.3 –0.3 –0.5 0.1 1.9 1.7 1.2 1.1
f = forecastItalics indicate percentage change.Sources: The Conference Board of Canada; CMHC Housing Time Series Database.

62 | metropolitan Housing Outlook—Autumn 2013
The Conference Board of Canada
V ictoria housing markets continue to suffer from a tepid local economy, which is limiting the city’s appeal to potential newcomers and constraining
income growth. The resale market has recently moved into a balanced position, after a lengthy spell in a buyers’ state. Sales and prices are forecast to end 2013 little changed and grow only modestly in coming years. The new home market is also soft, held back by high inventories of unsold units. Housing starts will fall sharply this year, and rebound only partially in 2014. Ownership affordability has improved as the market has softened, but remains poor compared with most other cities in this report.
eCONOMIC OuTlOOk
Sluggish GDP growth of only 0.1 per cent is forecast
for Victoria in 2013, following a weak 0.3 per cent
increase in 2012. But GDP growth should pick up
to 2.2 per cent in 2014 and remain above 2 per cent
between 2015 and 2017. Last year, employment still
managed to rise 2.2 per cent, a four-year high, but it
is forecast to drop 1.2 per cent this year and gain only
0.7 per cent next year. Still, the unemployment rate
will remain below 6 per cent throughout our forecast,
including a six-year low of 5.2 per cent in 2014. The
weak economy shaved population growth to below
1 per cent in both 2011 and 2012, and advances will
continue to be soft.
HOuSING OuTlOOk
exISTING HOuSING MarkeT A weak economy, tepid population growth, and poor
housing affordability continue to undermine Victoria’s
resale market. The market moved into a balanced pos-
ition during the spring, but remains unsettled. Despite
rising slightly during the spring, sales are on track to
fall for a fourth consecutive year in 2013. Moreover,
this year’s forecast sales volume of 5,300 units is well
below the annual average of above 7,000 units during
the previous decade. Accelerating economic growth and
rising employment will lift sales 2.6 per cent to roughly
5,400 units in 2014. Sales are forecast to increase an
Housing Starts(000s)
f = forecastSources: The Conference Board of Canada; CMHC Housing TimeSeries Database.
2010 11 12 13f 14f 15f 16f 17f0
0.51.01.52.02.5
Singles Multiples 20-year average
New Housing Price and Months’ Supply(dollars)
f = forecastSources: The Conference Board of Canada; CMHC Housing Time Series Database.
2010 11 12 13f 14f 15f 16f 17f250,000
300,000
350,000
400,000
450,000
2
3
4
5
6Price Months’ supply
Victoria

Autumn 2013—metropolitan Housing Outlook | 63
The Conference Board of Canada
average of 3.2 per cent between 2015 and 2017, suffi-
cient to keep the market balanced, but we do not expect
volumes to exceed 6,000 units, even by 2017.
The soft market cut listings 5 per cent in 2012, and
large drops in the first half of 2013 point to a 17 per
cent decline for the year as a while. Another 7 per cent
drop is on tap for 2014, given the muted market recov-
ery, and then gains averaging nearly 3 per cent annually
are expected between 2015 and 2017.
The recent sales uptick, combined with the listing dip,
lifted the sales-to-new-listings ratio to nearly 52 per
cent in the second quarter of 2013. This is the highest
level since 2009 and indicates a balanced market. The
ratio is forecast to keep rising through the end of 2013,
but still average only 50 per cent for the year, since it
was low during the first quarter. The sales advances
and listings declines we expect for 2014 will push
the ratio to roughly 55 per cent, where it will hover
through 2017.
Victoria: Economic Indicators
2010 2011 2012 2013f 2014f 2015f 2016f 2017f
real GDP at market prices 14,760 14,927 14,976 14,995 15,318 15,698 16,068 16,431(2002 $ millions) 1.3 1.1 0.3 0.1 2.2 2.5 2.4 2.3
Total employment (000s) 183 182 186 184 185 188 191 1920.1 –0.7 2.2 –1.2 0.7 1.7 1.2 0.9
unemployment rate (per cent) 6.0 6.2 5.5 5.6 5.2 5.1 4.9 4.7
Personal income per capita ($) 38,344 39,439 40,656 41,167 42,169 43,594 44,915 46,273–0.6 2.9 3.1 1.3 2.4 3.4 3.0 3.0
Population (000s) 359 362 363 365 367 369 372 3741.4 0.7 0.4 0.4 0.6 0.6 0.7 0.7
retail sales ($ millions) 4,068 4,133 4,183 4,159 4,280 4,427 4,561 4,6873.5 1.6 1.2 –0.6 2.9 3.4 3.0 2.8
Inflation rate (per cent) 1.0 2.2 1.0 0.0 1.9 2.2 2.0 2.1
f = forecast Italics indicate percentage change.Sources: The Conference Board of Canada; Statistics Canada.
MLS Sales-to-New-Listings Ratio and Price Growth(per cent)
f = forecast; MLS = Multiple Listing ServiceSources: The Conference Board of Canada; Canadian Real Estate Association.
2010 11 12 13f 14f 15f 16f 17f−4−2
02
46
3540
4550
5560
Price growth Sales-to-new-listings ratio
Affordability(left, dollars; right, per cent)
f = forecastNote: Principle and interest payments assume average resale price, 10 per cent down payment, 25-year amoritization, and 5-year fixed mortgage rate.Sources: The Conference Board of Canada; Canadian Real Estate Association.
2010 11 12 13f 14f 15f 16f 17f1,500
2,000
2,500
3,000
3,500
30
32
34
36
38
P&I payment P&I/income

64 | metropolitan Housing Outlook—Autumn 2013
The Conference Board of Canada
Persistence of a buyers’ market has softened residential
values. Victoria’s average resale price fell 1.3 per cent
in 2011 and 2.8 per cent last year, to a 2012 average of
$484,164. But a strengthening market this year should
produce a tiny price gain. Continued market firm-
ing will produce a 1.4 per cent price advance in 2014
and annual gains of 2 per cent thereafter. The recently
weak pricing has improved poor local affordability.
Principle and interest charges on Victoria’s average
resale home are forecast to drop 1 per cent in 2013,
following decreases of 3 to 4 per cent during the two
previous years. This still means such charges will con-
sume nearly 31 per cent of average household income
in 2013 and 2014, the most among any of the cities
in this report except Vancouver. Rising house prices
and increasing interest rates will lift these costs above
35 per cent by 2017, although this will still be below
their 2007 peak bite of 38 per cent.
NeW HOuSING MarkeT The new home market is also soggy. Demand for new
homes, measured by their absorptions, is on track to fall
for the third year of the past four, with all these drops
by double-digit rates. This year’s 12 per cent decline
would leave annual absorption at 1,400 units, a solid
1,000 units below their 2009 peak. Unsurprisingly,
builder inventories are swelling; the volume of unsold
new homes is forecast to average 600 units in 2013,
an 18-year high and up sharply from roughly 490
units in 2012. But the picture should start to improve
in 2014. Absorptions are forecast to rise gently, while
completions should drop. This will slightly trim builder
stocks that year. Inventories are forecast to drop further
in 2015, while remaining above their 20-year average.
We expect additional modest dips in 2016 and 2017.
Developers remain unsurprisingly cautious in light of
these high inventories. Housing starts are on track to
decline nearly 20 per cent in 2013. The drop will be led
by a 25 per cent drop in starts of multiple-family struc-
tures, which are particularly risky for builders. Single-
detached starts are expected to drop a comparatively
modest 6 per cent. This will put total starts near 1,350
units in 2013, roughly half the peak levels of the previ-
ous decade and well below the average near 1,720 units
during the past 20 years. For 2014, we expect small
increases in both single-detached and multi-family con-
struction to lift total starts to 1,465 units, with the num-
ber of starts hovering at about this level through 2017.
Multiple starts’ market share has soared. Between 2008
and 2012, these made up 61 per cent of total starts,
compared with 46 per cent a decade earlier.
Victoria’s soft population growth is coupled with evi-
dence of slight demographic oversupply. The ratio of
housing starts to absolute population changes exceeded
its historical average by a wide margin in 2012 and
is forecast to be slightly above it again this year. The
ongoing adjustment in the supply of new homes will,
however, bring this ratio back to its historical norm
in 2014.
Victoria: Resale Housing Market Indicators
2010 2011 2012 2013f 2014f 2015f 2016f 2017f
unit sales 6,168 5,773 5,460 5,264 5,403 5,704 5,848 5,940–19.5 –6.4 –5.4 –3.6 2.6 5.6 2.5 1.6
Dollar volume sales ($ millions) 3,113 2,877 2,644 2,560 2,663 2,867 2,998 3,106–14.7 –7.6 –8.1 –3.2 4.0 7.7 4.6 3.6
New listings 13,250 13,428 12,766 10,566 9,880 10,273 10,519 10,72212.8 1.3 –4.9 –17.2 –6.5 4.0 2.4 1.9
Sales-to-new-listings ratio (%) 47 43 43 50 55 56 56 55
average price of a resale home ($) 504,642 498,300 484,164 486,225 492,802 502,600 512,650 522,8926.0 –1.3 –2.8 0.4 1.4 2.0 2.0 2.0
f = forecastItalics indicate percentage change.Sources: The Conference Board of Canada; Canadian Real Estate Association.

Autumn 2013—metropolitan Housing Outlook | 65
The Conference Board of Canada
Victoria: New Housing Market Indicators
2010 2011 2012 2013f 2014f 2015f 2016f 2017f
Housing starts 2,174 1,632 1,663 1,347 1,465 1,544 1,509 1,421112.6 –24.9 1.9 –19.0 8.7 5.4 –2.2 –5.9
Singles 843 609 553 518 562 605 611 57732.3 –27.7 –9.3 –6.3 8.5 7.6 0.9 –5.5
Multiples 1,331 1,023 1,110 829 902 938 899 844245.5 –23.2 8.5 –25.3 8.9 4.0 –4.2 –6.1
under construction 1,917 1,856 1,768 1,573 1,504 1,534 1,515 1,450–8.2 –3.2 –4.7 –11.1 –4.4 2.0 –1.2 –4.3
Housing completions 1,784 1,642 1,591 1,610 1,434 1,520 1,552 1,500–27.6 –8.0 –3.1 1.2 –10.9 6.0 2.1 –3.3
Singles 851 716 570 592 576 605 622 60234.0 –15.9 –20.4 3.8 –2.7 5.1 2.9 –3.2
Multiples 933 926 1,021 1,018 858 916 930 898–49.0 –0.8 10.3 –0.3 –15.7 6.7 1.5 –3.4
Newly completed and unabsorbed 393 455 494 603 595 455 364 304–12.8 15.7 8.6 22.0 –1.2 –23.6 –19.9 –16.4
absorptions 1,811 1,551 1,601 1,409 1,584 1,641 1,628 1,551–24.6 –14.3 3.2 –12.0 12.4 3.6 –0.8 –4.7
Months’ supply 2.6 3.5 3.7 5.1 4.5 3.3 2.7 2.4
average price of a new home ($) 418,664 412,040 400,585 397,915 403,822 414,833 421,115 427,492–2.8 –1.6 –2.8 –0.7 1.5 2.7 1.5 1.5
f = forecastItalics indicate percentage change.Sources: The Conference Board of Canada; CMHC Housing Time Series Database.

66 | metropolitan Housing Outlook—Autumn 2013
The Conference Board of Canada
Terminology used in the Metropolitan Housing Outlook:1
Housing starts—Refers to the beginning of construction
work on a building, usually when the concrete has been
poured for the entire footing around the structure, or at
an equivalent stage where a basement will not be part
of the structure.
Multiple starts—The sum of semi-detached starts, row
starts, and apartment and other non-single-detached
starts. These starts are distributed among five tenures:
homeownership, rental, condominium, co-op, and other.
under construction—Units started but not completed.
Completions—Refers to units where all the proposed
construction work has been performed or, in some cases,
where 90 per cent of construction work has been com-
pleted and the structure is fit for occupancy.
1 Sources: The Conference Board of Canada; Canada Mortgage and Housing Corporation; Canadian Real Estate Association; Quebec Federation of Real Estate Boards.
Newly completed and unabsorbed—Refers to inventories
of newly completed units that remain unoccupied.
absorptions—Newly completed units sold or rented.
Units pre-sold or pre-leased are not included until the
completion stage.
Months’ supply—The number of months needed to
absorb unoccupied units. It is defined as the ratio
between unoccupied units and absorbed units (average
for the last 12 months).
unit sales—The number of existing homes sold on the
Multiple Listing Service (MLS).
New listings—The number of homes listed for sale on the
MLS during the year.
Sales-to-new-listings ratio—The number of homes sold
divided by the number of homes newly listed.
Definitions and Concepts


255 Smyth Road, Ottawa On
K1H 8m7 Canada
tel. 613-526-3280
Fax 613-526-4857
Inquiries 1-866-711-2262
conferenceboard .ca
Insights. Understanding. Impact.