metu-snp: an integrated software system for snp-...
TRANSCRIPT

METU-SNP: An Integrated Software System for SNP-Complex Disease Association Analysis
Gürkan Üstünkar1,2*
1 METU, Informatics Institute, Department of Information Systems, 06531, Ankara, Turkey
, Yeşim Aydın Son3,4
2 Gennovate Corporation, 06531, Ankara, Turkey, http://www.gennovate.com
3 METU, Informatics Institute, Department of Health Informatics, 06531, Ankara, Turkey
4 METU, Bioinformatics Graduate Program, 06531, Ankara, Turkey
Summary
Recently, there has been increasing research to discover genomic biomarkers, haplotypes, and potentially other variables that together contribute to the development of diseases. Single Nucleotide Polymorphisms (SNPs) are the most common form of genomic variations and they can represent an individual’s genetic variability in greatest detail. Genome-wide association studies (GWAS) of SNPs, high-dimensional case-control studies, are among the most promising approaches for identifying disease causing variants. METU-SNP software is a Java based integrated desktop application specifically designed for the prioritization of SNP biomarkers and the discovery of genes and pathways related to diseases via analysis of the GWAS case-control data. Outputs of METU-SNP can easily be utilized for the downstream biomarkers research to allow the prediction and the diagnosis of diseases and other personalized medical approaches. Here, we introduce and describe the system functionality and architecture of the METU-SNP. We believe that the METU-SNP will help researchers with the reliable identification of SNPs that are involved in the etiology of complex diseases, ultimately supporting the development of personalized medicine approaches and targeted drug discoveries.
1 Introduction
Identification of genetic variations that are the underlying causes of complex diseases is one of the current challenges of bioinformatics and genomic medicine, which draws great attention recently. Our understanding of the genetic etiology of human diseases is limited because of the massive number of genetic variations in the human genome and the complex relationships between multiple genes and environmental factors underlying diseases. With the completion of Human Genome Project in 2003, it is now possible to convey research studies to associate genetic variations in the human genome with common and complex diseases. Genome-wide association studies (GWAS) are one of the most widely used types of analysis in which most of the genome is studied for investigating variants. The major study design used in GWAS is the case-control study approach in which allele frequencies in patients are compared to a control group.
The human genome can be represented as an array of 3.3 billion letters from the set of {A, C, G, T} representing nucleotides Adenine, Cytosine, Guanine and Thymine. The nucleotide sequence does not differ across the populations in more than 99% of the positions of the whole genome. However, individuals possess genetic variations in about 1% of their genomic * To whom correspondence should be addressed. Email: [email protected]
Journal of Integrative Bioinformatics, 8(1):187, 2011 http://journal.imbio.de
doi:10.2390/biecoll-jib-2011-187 1
Cop
yrig
ht 2
011
The
Aut
hor(
s). P
ublis
hed
by J
ourn
al o
f Int
egra
tive
Bio
info
rmat
ics.
Th
is a
rticl
e is
lice
nsed
und
er a
Cre
ativ
e C
omm
ons
Attr
ibut
ion-
Non
Com
mer
cial
-NoD
eriv
s 3.
0 U
npor
ted
Lice
nse
(http
://cr
eativ
ecom
mon
s.or
g/lic
ense
s/by
-nc-
nd/3
.0/).

sequences. Among those variations, the most frequently observed are changes at single nucleotide level, called Single Nucleotide Polymorphisms (SNPs, pronounced snips), when occurred in over 1% of a given population. Recent developments in genotyping technologies, public access to whole genome and other genetic information and the start of the International HapMap Project [1],[2] have facilitated the implementation of SNP based GWAS.
Investigating the genetic factors associated with the complex diseases and determining the contribution of multiple genes on a disease phenotype require working with a considerably large number of SNPs and individuals in a typical GWAS setting. Currently, it is infeasible to gather information and perform analysis on all of the SNPs in the human genome that are estimated to be around 30 million1
In order to identify an informative SNP subset it is required to prioritize the SNPs according to well-defined criteria so that biologically more relevant SNPs are not overlooked among statistically significant SNP set. An intelligent way of performing such a prioritization is to develop a scoring mechanism for each SNP that would reflect SNP’s biological and statistical relevance. Such an endeavor requires the employment of integrative approaches by incorporating information from biological databases to determine and rank the SNPs with high statistical association according to their potential for effecting biological functions.
. This problem presents itself at three different levels: (1) the selection of the set of SNPs to be included in case-control based GWAS, (2) the prioritization of thousands of SNPs that are statistically found to be associated with the phenotype, (3) the identification of the smallest set of SNPs (informative SNPs) that can be utilized as a biomarker panel of the phenotype for downstream applications.
This study presents an integrated software application called METU-SNP, which is specifically designed for use in SNP based GWAS. METU-SNP is a java based desktop application, which provides state-of-the-art Analytic Hierarchy Process (AHP) based SNP prioritization and Gene Set Enrichment Analysis frameworks. It is also equipped with machine learning based feature selection schemes for further reducing the data dimension. The METU-SNP database gathers data from major public databases such as dbSNP [3], Entrez Gene [4], KEGG [5] and Gene Ontology [6]. Graphical User Interface (GUI) of METU-SNP offers access to the functionality provided by well-known third party tools utilized for GWAS such as PLINK [7] and BEAGLE [8].
The system architecture, components of the graphical user interface and capabilities of METU-SNP are presented in the following sections along with a case study.
2 System Overview
2.1 Availability
METU-SNP software is publicly accessible at http://metu.edu.tr/~yesim/metu-snp.htm. The website also contains video tutorial and help files. The integrated database is required for prioritization and gene/pathway based functionality and it is offered as an SQL dump file2
In order for a flawless installation and execution of the software, the following requirements should be satisfied for the platform:
.
• Java Runtime Environment 5.0 or above, • MySQL 5.0 or above, • At least 5 GB free disk space,
1 http://www.ncbi.nlm.nih.gov/SNP/snp_summary.cgi 2 Interested users should contact [email protected] for the download link.
Journal of Integrative Bioinformatics, 8(1):187, 2011 http://journal.imbio.de
doi:10.2390/biecoll-jib-2011-187 2
Cop
yrig
ht 2
011
The
Aut
hor(
s). P
ublis
hed
by J
ourn
al o
f Int
egra
tive
Bio
info
rmat
ics.
Th
is a
rticl
e is
lice
nsed
und
er a
Cre
ativ
e C
omm
ons
Attr
ibut
ion-
Non
Com
mer
cial
-NoD
eriv
s 3.
0 U
npor
ted
Lice
nse
(http
://cr
eativ
ecom
mon
s.or
g/lic
ense
s/by
-nc-
nd/3
.0/).

• At least 2GB RAM.
2.2 Functionality
METU-SNP provides the life scientist with an all-in-one tool for the case-control studies of SNP genotyping data from both microarray and next generation sequencing experiments. The raw GWAS data can be processed till an informative SNP subset, which is both statistically and biologically relevant for the phenotype under investigation, is achieved. Significant genes and pathways are also listed as an output at the end of the analysis. METU-SNP GUI is designed to guide the user through a step-by-step analysis process as depicted in Figure 1. GUI consists of 6 tabs corresponding to each steps of the analysis: (1) configuration, (2) preprocess, (3) genome-wide association, (4) SNP prioritization, (5) SNP selection and (6) performance.
Figure 1: METU-SNP GUI.
2.2.1 Configuration
In the configuration step the user defines the mysql database name, user name/ password and the location of the GWAS case-control data files for use in the subsequent analysis steps. Data files should be in the form of pedigree (ped) and map format3
3 http://pngu.mgh.harvard.edu/~purcell/plink/data.shtml
to be compatible with PLINK.
Journal of Integrative Bioinformatics, 8(1):187, 2011 http://journal.imbio.de
doi:10.2390/biecoll-jib-2011-187 3
Cop
yrig
ht 2
011
The
Aut
hor(
s). P
ublis
hed
by J
ourn
al o
f Int
egra
tive
Bio
info
rmat
ics.
Th
is a
rticl
e is
lice
nsed
und
er a
Cre
ativ
e C
omm
ons
Attr
ibut
ion-
Non
Com
mer
cial
-NoD
eriv
s 3.
0 U
npor
ted
Lice
nse
(http
://cr
eativ
ecom
mon
s.or
g/lic
ense
s/by
-nc-
nd/3
.0/).

User is also given the option to define test data for prioritization and selection steps. Separated test sets can be used in k-fold cross validation runs at the performance step.
2.2.2 Preprocess
In the preprocessing step user is able to apply quality control (QC) based filtering and imputation on the raw SNP genotyping data, which usually includes redundant SNPs and individuals that do not satisfy certain thresholds such as minor allele frequency, missingness and Hardy Weinberg equilibrium. A comprehensive guide containing further information on the thresholds is provided on PLINK website4
After specifying QC thresholds, user is given the option to impute the data with high missing rate by utilizing BEAGLE software. A threshold for allelic r2 (default being 0.95) can be specified in order to include only well imputed markers in subsequent analysis. In order to provide an overview for the data after filtration, a set of descriptive statistics files, which are created as output during PLINK based QC analysis is provided.
. The same default values of PLINK (0.05 for minor allele frequency, 0.1 for SNP missingness rate, 0.1 for individual missingness rate and 0.001 for Hardy Weinberg equilibrium) are set for METU-SNP as the most commonly used parameters for GWAS. User is able to change these values easily from the user interface.
2.2.3 Genome-wide Association
Third step in METU-SNP based analysis is the determination of the statistical significance of SNPs by calculating p-values of association. Depending on user’s choice, three different methods can be used to calculate p-values: (1) uncorrected, (2) Bonferroni [9] and (3) False Discovery Rate [10]. The latter two approaches include adjusting for multiple testing. Depending on the threshold set by the user, SNPs are labeled as significant5
Next, a second wave GWAS is performed by calculating the combined p-values as described in [11], to reveal statistically significant (enriched) genes and pathways. Fisher’s combination test is applied to combine p-values of all SNPs within a gene, where the statistics for combining K SNPs is given by
or not in the related database table. Most widely accepted threshold for p-value is 0.05 and it is set as default. However according to the requirements of the analysis, it is possible to specify other threshold values as well.
𝑍𝐹 = −2∑ 𝑙𝑛𝑃𝑖𝐾𝑖=1 ,
which follows 𝜒2𝐾2 distribution. In order to determine the overrepresentation of significantly associated genes among all genes in a pathway, the hypergeometric test (Fisher’s exact test) is used. Assuming that total number of genes is N, the number of genes that are significantly associated with the disease is S and the number of genes in the pathway is m; p-value of observing k-significant genes in the pathway is calculated by:
𝑝 = 1 − ∑�𝑆𝑖��
𝑁−𝑆𝑚−𝑖�
�𝑁𝑚�𝑘𝑖=0 .
4 http://pngu.mgh.harvard.edu/~purcell/plink/thresh.shtml 5 Significance label for SNPs, genes and pathway is used to calculate total score in AHP based prioritization scheme.
Journal of Integrative Bioinformatics, 8(1):187, 2011 http://journal.imbio.de
doi:10.2390/biecoll-jib-2011-187 4
Cop
yrig
ht 2
011
The
Aut
hor(
s). P
ublis
hed
by J
ourn
al o
f Int
egra
tive
Bio
info
rmat
ics.
Th
is a
rticl
e is
lice
nsed
und
er a
Cre
ativ
e C
omm
ons
Attr
ibut
ion-
Non
Com
mer
cial
-NoD
eriv
s 3.
0 U
npor
ted
Lice
nse
(http
://cr
eativ
ecom
mon
s.or
g/lic
ense
s/by
-nc-
nd/3
.0/).

Depending on the calculated statistics, user is able to label genes and pathways as significant. To label a gene as significant three thresholds are provided: (1) combined p-value, (2) min SNP p-value and (3) max SNP p-value. The combined p-value statistics of the genes are determined according to the p-values calculated for each SNP that maps to the particular gene. Here, second and third user defined parameters allow users to determine the enrichment of genes by looking at individual p-values of mapping SNPs instead of the calculated combined p-value. Likewise, to determine if a pathway is significant three user defined parameters are offered: (1) combined p-value, (2) the number of significant genes and (3) the proportion of significant genes. We regard pathways as a combination of genes. Therefore, in addition to the combined p-value it is also possible to determine the enrichment of the pathway by evaluating how many significant genes there are within the pathway or proportion of significant genes over all the genes associated with the pathway. Following this step, three output files are created as explained in Table 1.
Table 1: Output files created at the end of genome wide association analysis.
File Field # Description
snp.txt
1 SNP rs ID (as in dbSNP)
2 p-value (according to the specified type of test)
3 Significance (0 = not significant, 1 = significant)
gene.txt
1 Entrez gene ID
2 p-value (according to the specified threshold)
3 Significance (0 = not significant, 1 = significant)
pathway.txt
1 pathway ID (as in MySQL database)
2 p-value / significant gene info (according to the specified threshold)
3 Significance (0 = not significant, 1 = significant)
2.2.4 SNP Prioritization
SNP prioritization functionality utilizes our novel AHP based prioritization scheme6
. This is an intelligent scoring mechanism that takes statistical and biological information into account for ranking SNPs after GWAS. AHP based prioritization involves forming a multi-hierarchical tree structure in which genomic location, molecular pathway data, disease annotation data and statistical information (GWAS p-value association and gene set enrichment analysis findings) are integrated. Weight scores are calculated for each leaf node, following a pair-wise comparison between nodes in the same level of the tree. In order to calculate the final score, which will guide the ranking of SNPs in the prioritization process, an indicator function Ik(SNPi) is used as follows:
𝐼𝑘(𝑆𝑁𝑃𝑖) = � 1 0� 𝑖𝑓 𝑆𝑁𝑃𝑖 𝑖𝑠 𝑟𝑒𝑙𝑒𝑣𝑎𝑛𝑡 𝑓𝑜𝑟 𝑙𝑒𝑎𝑓 𝑛𝑜𝑑𝑒 𝑘
𝑜𝑡ℎ𝑒𝑟𝑤𝑖𝑠𝑒�
The final score 𝑆(SNP𝑖) can be calculated for a particular SNP by using:
𝑆(SNPi) = ∑ 𝐼𝑘(𝑆𝑁𝑃𝑖)𝑊𝑘𝑛𝑘=1 for i = 1,..., m,
6 Manuscript is submitted to the Journal of Bioinformatics.
Journal of Integrative Bioinformatics, 8(1):187, 2011 http://journal.imbio.de
doi:10.2390/biecoll-jib-2011-187 5
Cop
yrig
ht 2
011
The
Aut
hor(
s). P
ublis
hed
by J
ourn
al o
f Int
egra
tive
Bio
info
rmat
ics.
Th
is a
rticl
e is
lice
nsed
und
er a
Cre
ativ
e C
omm
ons
Attr
ibut
ion-
Non
Com
mer
cial
-NoD
eriv
s 3.
0 U
npor
ted
Lice
nse
(http
://cr
eativ
ecom
mon
s.or
g/lic
ense
s/by
-nc-
nd/3
.0/).
where m denotes the number of SNPs for which AHP scores are calculated and W denotes the weight vector for leaf nodes.
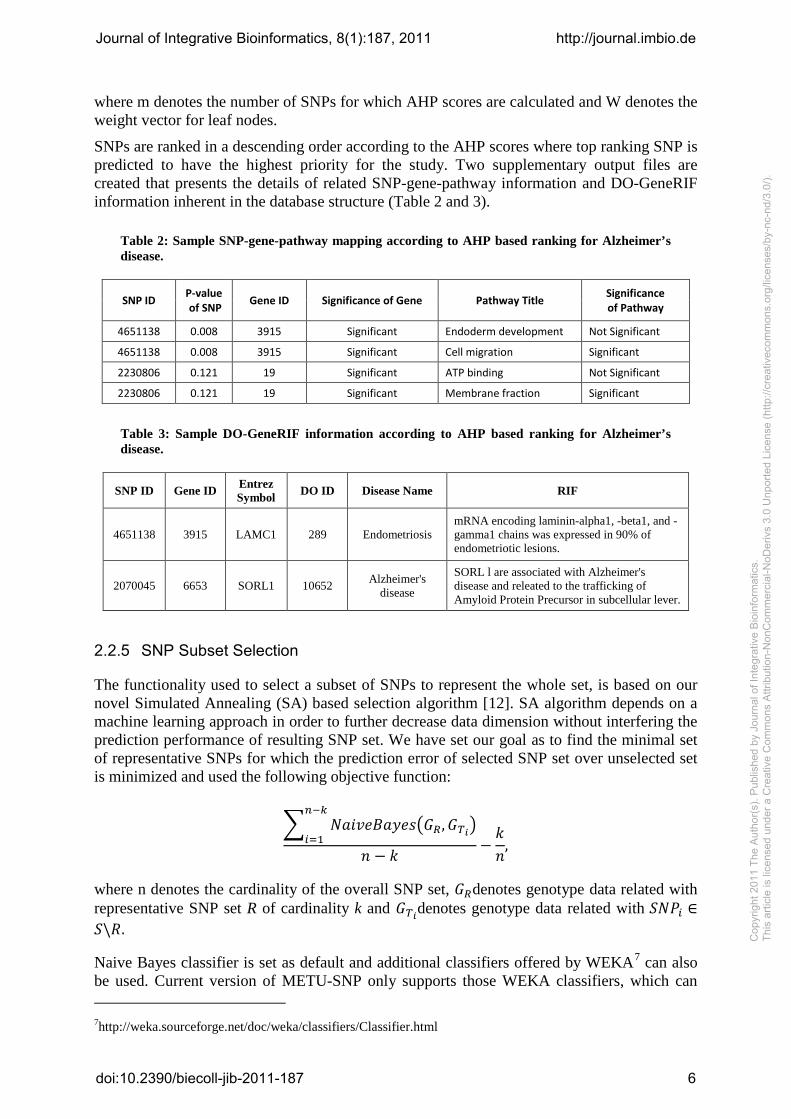
SNPs are ranked in a descending order according to the AHP scores where top ranking SNP is predicted to have the highest priority for the study. Two supplementary output files are created that presents the details of related SNP-gene-pathway information and DO-GeneRIF information inherent in the database structure (Table 2 and 3).
Table 2: Sample SNP-gene-pathway mapping according to AHP based ranking for Alzheimer’s disease.
SNP ID P-value of SNP Gene ID Significance of Gene Pathway Title Significance
of Pathway
4651138 0.008 3915 Significant Endoderm development Not Significant
4651138 0.008 3915 Significant Cell migration Significant
2230806 0.121 19 Significant ATP binding Not Significant
2230806 0.121 19 Significant Membrane fraction Significant
Table 3: Sample DO-GeneRIF information according to AHP based ranking for Alzheimer’s disease.
SNP ID Gene ID Entrez Symbol DO ID Disease Name RIF
4651138 3915 LAMC1 289 Endometriosis mRNA encoding laminin-alpha1, -beta1, and -gamma1 chains was expressed in 90% of endometriotic lesions.
2070045 6653 SORL1 10652 Alzheimer's disease
SORL l are associated with Alzheimer's disease and releated to the trafficking of Amyloid Protein Precursor in subcellular lever.
2.2.5 SNP Subset Selection
The functionality used to select a subset of SNPs to represent the whole set, is based on our novel Simulated Annealing (SA) based selection algorithm [12]. SA algorithm depends on a machine learning approach in order to further decrease data dimension without interfering the prediction performance of resulting SNP set. We have set our goal as to find the minimal set of representative SNPs for which the prediction error of selected SNP set over unselected set is minimized and used the following objective function:
� 𝑁𝑎𝑖𝑣𝑒𝐵𝑎𝑦𝑒𝑠�𝐺𝑅 ,𝐺𝑇𝑖�𝑛−𝑘
𝑖=1𝑛 − 𝑘
−𝑘𝑛
, where n denotes the cardinality of the overall SNP set, 𝐺𝑅denotes genotype data related with representative SNP set R of cardinality k and 𝐺𝑇𝑖denotes genotype data related with 𝑆𝑁𝑃𝑖 ∈𝑆\𝑅. Naive Bayes classifier is set as default and additional classifiers offered by WEKA7
7http://weka.sourceforge.net/doc/weka/classifiers/Classifier.html
can also be used. Current version of METU-SNP only supports those WEKA classifiers, which can
Journal of Integrative Bioinformatics, 8(1):187, 2011 http://journal.imbio.de
doi:10.2390/biecoll-jib-2011-187 6
Cop
yrig
ht 2
011
The
Aut
hor(
s). P
ublis
hed
by J
ourn
al o
f Int
egra
tive
Bio
info
rmat
ics.
Th
is a
rticl
e is
lice
nsed
und
er a
Cre
ativ
e C
omm
ons
Attr
ibut
ion-
Non
Com
mer
cial
-NoD
eriv
s 3.
0 U
npor
ted
Lice
nse
(http
://cr
eativ
ecom
mon
s.or
g/lic
ense
s/by
-nc-
nd/3
.0/).

handle multi-valued nominal attributes. A SNP subset is created as an output, which can be regarded as the minimal set of representative SNPs with competitive prediction accuracy.
2.2.6 Performance
The prediction performance of the resulting SNP subsets after AHP based prioritization and SA based selection steps can be measured in the final step of METU-SNP analysis. WEKA based classifiers supporting multi-valued nominal attributes can be used as supervised learning methods for performance measurement. At the initial configuration step of METU-SNP a test set has to be separated for the performance measures to be calculated.
Additionally, in order to measure the prediction performance of SNP sets created at either prioritization or selection step, METU-SNP creates an output file that contains certain classification measures such as correctly classified instances, incorrectly classified instances, Kappa statistic, mean absolute error, root mean squared error, root relative square error and confusion matrix (Figure 2).
Figure 2: Sample text file that is created after performance measures calculation step.
3 System Architecture
METU-SNP is a Java based desktop application written with Java Swing GUI (Graphical User Interface) architecture using JDBC to interact through mysql databases (Figure 3). The application can be installed and run on a stand-alone computer in which Java Run Time Environment and MySQL database is previously installed.
3.1 Third Party Tools
In a typical GWAS, researcher basically follows a 4 step process: (1) a large number of individuals with disease or another trait of interest alongside with a suitable comparison group is selected, (2) in order to assure high genotyping quality, DNA isolation, genotyping and data review is performed, (3) statistical tests are applied to observe the association between SNPs and disease/trait, (4) significantly associated SNPs are prioritized and a representative SNP subset is selected,(5) Fine mapping to DNA locus and biological interpretation is performed.
Journal of Integrative Bioinformatics, 8(1):187, 2011 http://journal.imbio.de
doi:10.2390/biecoll-jib-2011-187 7
Cop
yrig
ht 2
011
The
Aut
hor(
s). P
ublis
hed
by J
ourn
al o
f Int
egra
tive
Bio
info
rmat
ics.
Th
is a
rticl
e is
lice
nsed
und
er a
Cre
ativ
e C
omm
ons
Attr
ibut
ion-
Non
Com
mer
cial
-NoD
eriv
s 3.
0 U
npor
ted
Lice
nse
(http
://cr
eativ
ecom
mon
s.or
g/lic
ense
s/by
-nc-
nd/3
.0/).

Figure 3: System architecture for METU-SNP.
Many software tools such as PLINK, BEAGLE, SNPTEST [13] and GENABEL [14] have been developed recently that could be utilized for step 2 and step 3. METU-SNP specifically aims to support steps 4 and 5, where SNP prioritization and biological interpretation is automated. So, functionality offered by third party open-wares geared towards step 2 and step 3 is utilized to complement unique functionalities offered by METU-SNP to build an integrated system for GWAS. The logical flow of the METU-SNP system and integration of third party tools is presented in Figure 4.
3.1.1 PLINK
PLINK is an open-source whole genome association analysis toolset that offers immense set of functions for GWAS including: data management, summary statistics for quality control, population stratification detection, basic association testing, copy number variant analysis, meta-analysis, result annotation and reporting. In METU-SNP framework PLINK is used: (1) to divide the genomic data into chromosomal units to comply with BEAGLE format for imputation, (2) to perform quality control based filtering to exclude the SNPs or individuals that do not satisfy user defined thresholds, (3) to determine p-value association statistics, (4) to complete certain data management tasks, such as extracting set of SNPs, individuals etc., which is challenging to due to the size of the data sets with other tools.
PLINK is essentially utilized in two major steps of the analysis process: (1) quality control based filtering and (2) association analysis.
3.1.2 BEAGLE
Imputation is a statistical method to substitute a calculated value for a missing data point and can be used to replace missing/un-genotyped data when percentage of the missing values exceeds a certain threshold specified by the researcher. Lately, imputation is becoming a part of the GWAS. Various methods have been proposed to predict sporadic missing data by imputation [15] and it has been used in the meta-analysis of different diseases and traits [16, 17]. Several software programs have been developed so far to account for the missing data in genetic data sets. Among those are BEAGLE, IMPUTE [13], MACH, fastPHASE [18] and PLINK. We have chosen to integrate BEAGLE’s imputation routine, which is based on
Journal of Integrative Bioinformatics, 8(1):187, 2011 http://journal.imbio.de
doi:10.2390/biecoll-jib-2011-187 8
Cop
yrig
ht 2
011
The
Aut
hor(
s). P
ublis
hed
by J
ourn
al o
f Int
egra
tive
Bio
info
rmat
ics.
Th
is a
rticl
e is
lice
nsed
und
er a
Cre
ativ
e C
omm
ons
Attr
ibut
ion-
Non
Com
mer
cial
-NoD
eriv
s 3.
0 U
npor
ted
Lice
nse
(http
://cr
eativ
ecom
mon
s.or
g/lic
ense
s/by
-nc-
nd/3
.0/).

Hidden Markov Models as it is one of the methods with highest accuracy and reasonable execution time [8].
Figure 4: Logic flow of METU-SNP software system.
3.1.3 WEKA
WEKA is an open source machine learning and data mining tool developed and maintained by University of Waikato, New Zealand. An extensive set of algorithms for pre-processing, classification, regression, clustering and association are included within the WEKA collection. METU-SNP utilizes WEKA for implementing the SA algorithm and evaluating the prediction accuracy of the selected SNP sets after AHP based prioritization and SA based informative SNP selection steps via cross validation.
3.2 METU-SNP Integrated Database
METU-SNP database is MySQL 5 based relational database that incorporates data from major biological databases. Entity-Relationship diagram of the database that presents table details can be found in Figure 5. Our prioritization scheme requires integration of primary public databases because of the need of mappings for: (1) SNP to Gene, (2) Gene to Disease, (3) Gene to Biological Pathway.
3.2.1 SNP Data
Annotations for 11,833,664 SNPs, based on dbSNP build 128, are provided within METU-SNP framework and the details are explained in Table 4.
Journal of Integrative Bioinformatics, 8(1):187, 2011 http://journal.imbio.de
doi:10.2390/biecoll-jib-2011-187 9
Cop
yrig
ht 2
011
The
Aut
hor(
s). P
ublis
hed
by J
ourn
al o
f Int
egra
tive
Bio
info
rmat
ics.
Th
is a
rticl
e is
lice
nsed
und
er a
Cre
ativ
e C
omm
ons
Attr
ibut
ion-
Non
Com
mer
cial
-NoD
eriv
s 3.
0 U
npor
ted
Lice
nse
(http
://cr
eativ
ecom
mon
s.or
g/lic
ense
s/by
-nc-
nd/3
.0/).
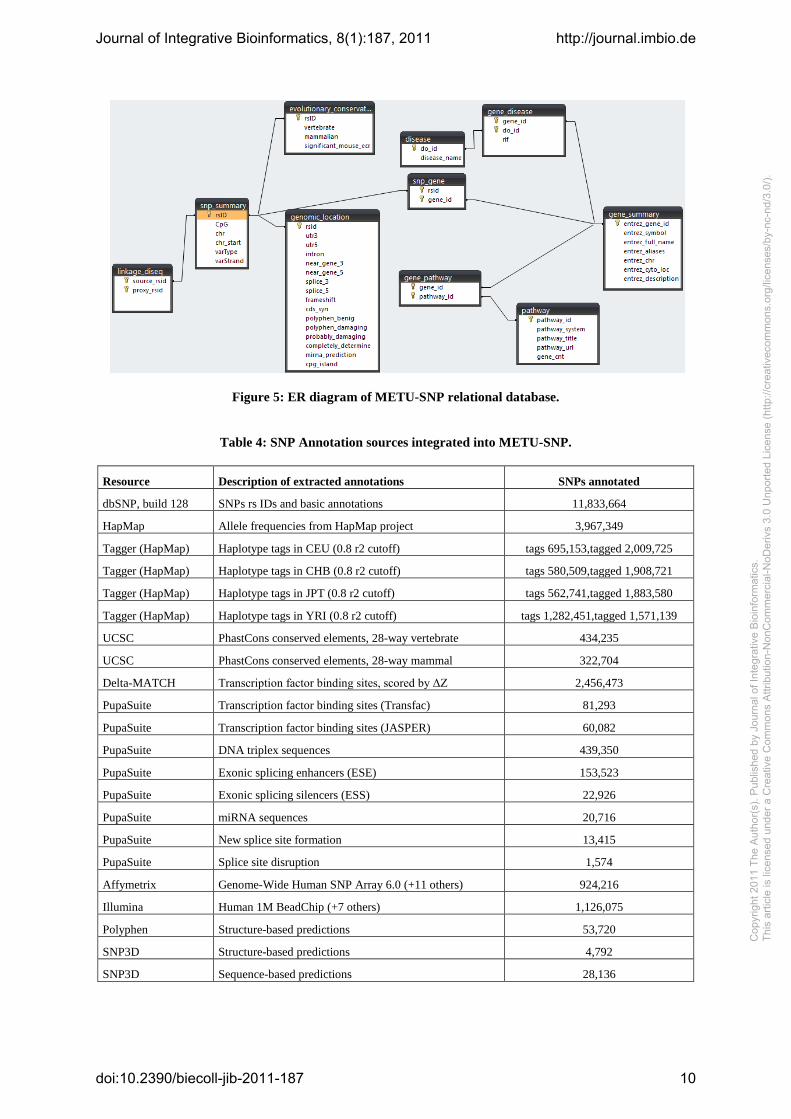
Figure 5: ER diagram of METU-SNP relational database.
Table 4: SNP Annotation sources integrated into METU-SNP.
Resource Description of extracted annotations SNPs annotated
dbSNP, build 128 SNPs rs IDs and basic annotations 11,833,664
HapMap Allele frequencies from HapMap project 3,967,349
Tagger (HapMap) Haplotype tags in CEU (0.8 r2 cutoff) tags 695,153,tagged 2,009,725
Tagger (HapMap) Haplotype tags in CHB (0.8 r2 cutoff) tags 580,509,tagged 1,908,721
Tagger (HapMap) Haplotype tags in JPT (0.8 r2 cutoff) tags 562,741,tagged 1,883,580
Tagger (HapMap) Haplotype tags in YRI (0.8 r2 cutoff) tags 1,282,451,tagged 1,571,139
UCSC PhastCons conserved elements, 28-way vertebrate 434,235
UCSC PhastCons conserved elements, 28-way mammal 322,704
Delta-MATCH Transcription factor binding sites, scored by ΔZ 2,456,473
PupaSuite Transcription factor binding sites (Transfac) 81,293
PupaSuite Transcription factor binding sites (JASPER) 60,082
PupaSuite DNA triplex sequences 439,350
PupaSuite Exonic splicing enhancers (ESE) 153,523
PupaSuite Exonic splicing silencers (ESS) 22,926
PupaSuite miRNA sequences 20,716
PupaSuite New splice site formation 13,415
PupaSuite Splice site disruption 1,574
Affymetrix Genome-Wide Human SNP Array 6.0 (+11 others) 924,216
Illumina Human 1M BeadChip (+7 others) 1,126,075
Polyphen Structure-based predictions 53,720
SNP3D Structure-based predictions 4,792
SNP3D Sequence-based predictions 28,136
Journal of Integrative Bioinformatics, 8(1):187, 2011 http://journal.imbio.de
doi:10.2390/biecoll-jib-2011-187 10
Cop
yrig
ht 2
011
The
Aut
hor(
s). P
ublis
hed
by J
ourn
al o
f Int
egra
tive
Bio
info
rmat
ics.
Th
is a
rticl
e is
lice
nsed
und
er a
Cre
ativ
e C
omm
ons
Attr
ibut
ion-
Non
Com
mer
cial
-NoD
eriv
s 3.
0 U
npor
ted
Lice
nse
(http
://cr
eativ
ecom
mon
s.or
g/lic
ense
s/by
-nc-
nd/3
.0/).

Reference SNP ID (rsID) from dbSNP is used as the primary key for a particular SNP. Basic annotations such as associated gene ID and symbol for all human SNPs are extracted from dbSNP. PupaSuite [19] annotations allow scoring of SNPs based on their function class, overlap with splicing regulatory elements, miRNA target sequences and conserved regions in the genome. An additional table holds the SNP pairs with high Linkage Disequilibrium (coefficient of correlation 𝑟2 ≥ 0.8 in each HapMap population) defining the correlations among SNPs. UCSC [20] provides genomic coordinates of highly conserved elements across multiple species, allowing for the identification of SNPs overlapping with evolutionarily conserved regions of the human genome. Additionally, information related with mouse ECR (Evolutionary Conserved Regions) values originally extracted from ECRBase [21] are integrated into METU-SNP database and used within prioritization scheme.
3.2.2 Gene Data
Gene related information is extracted from NCBI Entrez Gene [22] and Entrez Gene ID is used as the primary key for identifying a particular gene. SNP-Gene associations are extracted from NCBI and dbSNP. 45,379 genes are annotated and relevant information is organized in the database as shown in Table 5.
Table 5: Gene based annotation from NCBI Entrez Gene.
Field Description
Entrez Symbol NCBI Entrez Gene official gene symbol
Entrez Gene ID NCBI Entrez Gene ID
Gene type Gene type: protein-coding, tRNA, etc.
Entrez full name Full name from NCBI Entrez Gene
Chr Chromosome
Start Pos (bp) Start Position in base pairs (NCBI Mapview)
Stop Pos (bp) Stop Position in base pairs (NCBI Mapview)
Size (kb) Size of transcript in kb (NCBI Mapview)
Cytogenetic Pos. Cytogenetic Position
3.2.3 Pathway Data
Gene and pathway information is integrated from major biological repositories. A summary of the integrated resources is presented in Table 6.
Pathway-based analysis of GWA data is emerging as a useful tool for discovery of underlying molecular mechanisms of diseases associated with particular SNP biomarkers. In second wave GWAS, where combined p-value approach is used to identify associated genes and pathways to a phenotype; it is assumed that markers underlying a disease or phenotype are enriched in genes acting within the same pathway.
For each particular pathway suggested, METU-SNP provides the gene IDs within the pathway and an URL link to the listed pathway that would help researcher to reach external information. Table 7 presents an example for the type of information that is held within the database structure.
Journal of Integrative Bioinformatics, 8(1):187, 2011 http://journal.imbio.de
doi:10.2390/biecoll-jib-2011-187 11
Cop
yrig
ht 2
011
The
Aut
hor(
s). P
ublis
hed
by J
ourn
al o
f Int
egra
tive
Bio
info
rmat
ics.
Th
is a
rticl
e is
lice
nsed
und
er a
Cre
ativ
e C
omm
ons
Attr
ibut
ion-
Non
Com
mer
cial
-NoD
eriv
s 3.
0 U
npor
ted
Lice
nse
(http
://cr
eativ
ecom
mon
s.or
g/lic
ense
s/by
-nc-
nd/3
.0/).

Table 6: Biological pathway resources used for annotation.
Resource Description of annotations Number of Pathways Number of Genes
Gene Ontology Molecular Function 2,479 10,644
Gene Ontology Biological Process 3,066 10,793
Gene Ontology Cellular Component 636 6,236
KEGG Pathway/gene associations 177 3,901
WikiPathways Pathway/gene associations 106 3,089
BioCarta Pathway/gene associations 314 1,375
BioCyc Pathway/gene associations 179 452
Table 7: Sample biological pathway information inherent within METU-SNP database.
Pathway System Pathway Title URL Link Entrez Gene IDs
KEGG Ascorbate and aldarate metabolism
http://www.genome.jp/dbget-bin/get_pathway?org_name=hsa&mapno=00053
217,218,219,220, 223,224,501,7358, 55586
BioCarta
Degradation of the RAR and RXR by the proteasome
http://www.biocarta.com/pathfiles/h_rarPathway.asp 5914,1022, 6256
GO Process Single strand break repair
http://www.ebi.ac.uk/ego/QuickGO?mode=display&entry=GO:0000012 3981,7141,7515, 54840
GO Function
1-alkyl-2-Acetylglycerophosphocholine esterase activity
http://www.ebi.ac.uk/ego/QuickGO?mode=display&entry=GO:0003847 5049,5050,5051, 7941
GO Component Gamma-tubulin complex
http://www.ebi.ac.uk/ego/QuickGO?mode=display&entry=GO:0000930 7283,8409,9793, 80184
BioCyc Methionine biosynthesis IV
http://biocyc.org/META/NEW-IMAGE?type=PATHWAY&object=ADENOSYLHOMOCYSCAT-PWY
4548,23743,635
WikiPathways Pentose Phosphate Pathway
http://www.wikipathways.org/index.php/Pathway:Homo_sapiens:Pentose_Phosphate_Pathway
2539,25796,5226, 22934,7086,6888, 6120
3.2.4 Disease Data
We have utilized the GeneRIF-Disease Ontology (DO) mapping approach to construct our gene-disease association tables. It is suggested that GeneRIF-Disease Ontology (DO) mapping performs better than OMIM when the prediction performances are compared [23, 24]. Mapping process is illustrated in Figure 6, where the association between Gene ID: 7040 and DO ID: 2585 is shown.
Journal of Integrative Bioinformatics, 8(1):187, 2011 http://journal.imbio.de
doi:10.2390/biecoll-jib-2011-187 12
Cop
yrig
ht 2
011
The
Aut
hor(
s). P
ublis
hed
by J
ourn
al o
f Int
egra
tive
Bio
info
rmat
ics.
Th
is a
rticl
e is
lice
nsed
und
er a
Cre
ativ
e C
omm
ons
Attr
ibut
ion-
Non
Com
mer
cial
-NoD
eriv
s 3.
0 U
npor
ted
Lice
nse
(http
://cr
eativ
ecom
mon
s.or
g/lic
ense
s/by
-nc-
nd/3
.0/).

We have adopted the mapping format of the relational database at DO-RIF project page of Northwestern University8
. The summary statistics of the annotation data residing in our database is presented in Table 8.
Figure 6: An example DO-GeneRIF mapping.
Table 8: Annotation statistics related with disease data.
Description of Annotations Number of Items
Disease 14,889
Disease with at least one mapping 1,851
Genes with at least one mapping 4,070
Average mappings per disease 14.64
4 Results and Discussions
In order to evaluate the usability and performance of METU-SNP we used two real life GWAS data sets. The first data set was the whole genome association Rheumatoid Arthritis (RA) data from the North American Rheumatoid Arthritis Consortium (NARAC) including 868 cases and 1,194 controls. The NARAC data was used in the Genetic Analysis Workshop 16 (GAW 16) previously. It consists of 501,463 SNP-genotype fields from the Illumina 550K chip. The second data set was whole genome association data for Alzheimer’s disease (AD) from the Alzheimer’s disease Neuroimaging Initiative (ADNI) database. The ADNI data used included 149 AD cases and 182 controls. It consists of 555,850 SNP-genotype fields from the Illumina 610 Quad chip.
METU-SNP based analysis successfully identifies statistically significant SNPs, genes and pathways for the data sets under consideration. The novel AHP based algorithm is implemented and used for the prioritization of SNPs that are both statistically and biologically relevant. Next, the dimension of the SNP set is further decreased by applying machine learning based SA algorithm. Finally, the prediction performance for the resulting SNP sets is calculated and the results are cross-checked with the current literature. 8http://projects.bioinformatics.northwestern.edu/do_rif/
Journal of Integrative Bioinformatics, 8(1):187, 2011 http://journal.imbio.de
doi:10.2390/biecoll-jib-2011-187 13
Cop
yrig
ht 2
011
The
Aut
hor(
s). P
ublis
hed
by J
ourn
al o
f Int
egra
tive
Bio
info
rmat
ics.
Th
is a
rticl
e is
lice
nsed
und
er a
Cre
ativ
e C
omm
ons
Attr
ibut
ion-
Non
Com
mer
cial
-NoD
eriv
s 3.
0 U
npor
ted
Lice
nse
(http
://cr
eativ
ecom
mon
s.or
g/lic
ense
s/by
-nc-
nd/3
.0/).

4.1 Analysis Results
Quality control based filtering is applied by using following thresholds: minor allele frequency = 0.05, SNP missingness rate = 0.1, individual missingness rate = 0.1, Hardy Weinberg Equilibrium = 0.001. Missing markers are handled by imputation and test sets are separated to measure the prediction performance of the prioritized sets for both data sets. After the preprocessing step, the number of SNPs is decreased from 555,850 to 517,003 for the AD data with 112 cases and 121 controls separated for the training set and 22 cases and 27 controls for the test set, and from 501,463 to 473,613 for the RA data with 522 cases and 716 controls for training set and 180 cases and 232 controls for test set.
Following the preprocessing step, the association study is performed and p-values are calculated for individual SNPs. Multiple hypothesis correction using false discovery rate is only applied to RA data as results were too conservative for ALZ data set. Additionally, statistically significant genes and pathways are determined by the combined p-value approach as stated in Section 2.2.3. We used p-value of 0.05 as the threshold of significance for SNPs, genes and pathways. Top 5 significant SNPs, genes and pathways according to p-values are presented in Tables 9, 10 and 11.
Table 9. Top 5 SNPs with the lowest p-values.
RANK Alzheimer's Disease Rheumatoid Arthritis
Chromosome SNP p-value Chromosome SNP p-value
1 17 rs4795895 8.27E-07 6 rs2395175 1.02E-67
2 17 rs1233651 1.27E-06 6 rs660895 7.10E-66
3 17 rs885691 1.27E-06 6 rs2395163 2.04E-52
4 18 rs12457258 1.84E-06 6 rs6910071 1.34E-50
5 17 rs6505403 4.91E-06 6 rs3763309 1.96E-46
Table 10. Top 5 genes with the lowest combined p-values. Given the p-value threshold of 0.05; 2,076 genes are listed as significant for AD and 69 of them are listed as significant for RA.
RANK Alzheimer's Disease Rheumatoid Arthritis
Gene ID Full Name Locus Gene ID Full Name Locus
1 220963 Solute carrier family 16, member 9 (monocarboxylic acid transporter 9)
10q21.2 177 Advanced glycosylation end product-specific receptor
6p21.3
2 10665 Chromosome 6 open reading frame 10 6p21.3 7916 HLA-B associated
transcript 2 6p21.3
3 84679 Solute carrier family 9 (sodium/hydrogen exchanger), member 7
Xp11.3 3122 Major histocompatibility complex, class II, DR alpha
6p21.3
4 83891 Sorting nexin 25 4q35.1 6891 Transporter 2, ATP-binding cassette, sub-family B (MDR/TAP)
6p21.3
5 84182 Family with sequence similarity 188, member B 7p14.3 7148 Tenascin XB 6p21.3
Journal of Integrative Bioinformatics, 8(1):187, 2011 http://journal.imbio.de
doi:10.2390/biecoll-jib-2011-187 14
Cop
yrig
ht 2
011
The
Aut
hor(
s). P
ublis
hed
by J
ourn
al o
f Int
egra
tive
Bio
info
rmat
ics.
Th
is a
rticl
e is
lice
nsed
und
er a
Cre
ativ
e C
omm
ons
Attr
ibut
ion-
Non
Com
mer
cial
-NoD
eriv
s 3.
0 U
npor
ted
Lice
nse
(http
://cr
eativ
ecom
mon
s.or
g/lic
ense
s/by
-nc-
nd/3
.0/).

Table 11. Top 5 pathways with the lowest combined p-values. Given the p-value threshold of 0.05; 256 pathways are listed as significant for AD and 119 of them are listed as significant for RA.
RANK Alzheimer's Disease Rheumatoid Arthritis
Pathway System Pathway Title p-value
Pathway System Pathway Title p-value
1 KEGG 3-Chloroacrylic acid degradation 5.09E-06 GO Function MHC class II
receptor activity 2.16E-19
2 WikiPathways IL-1 NetPath 13 4.19E-04 GO Process
Antigen processing and presentation of peptide or polysaccharide antigen via MHC class II
6.23E-16
3 WikiPathways Ribosomal Proteins 4.3E-04 GO
Component MHC class II protein complex 6.23E-16
4 GO Component Golgi apparatus 4.39E-04 KEGG Antigen processing and presentation
4.79E-15
5 GO Component Cell junction 6.75E-04 WFINFLAM Phagocytosis-Ag presentation 8.23E-13
AHP based prioritization is performed for both RA data and AD data following the association step. For the RA data 7,155 SNPs with p < 0.5 and for the AD data 26.545 SNPs with p < 0.05 are considered for prioritization. In the 5-fold cross validation (CV), Naive Bayes classifier is used as the supervised learning scheme. Following classification measures are used for performance evaluation: (1) Accuracy: (TP + TN) / (P + N), (2) Recall: TP / (TP + FN), (3) Negative Predictive Value (NPV): TN / (TN + FN), (4) Precision: TP / (TP + FP), (5) Specificity: TN / (FP + TN). Here, TP denotes True Positive, TN denotes True Negative, FP denotes False Positive and FN denotes False Negative for a 2x2 confusion matrix.Table 12 presents top 10 SNPs prioritized with the novel AHP algorithm and Table 13 depicts prediction performance of resulting SNP sets.
Table 12. Top 10 SNPs according AHP prioritization of GWAS for AD data and RA data.
RANK Alzheimer's Disease Rheumatoid Arthritis
Chr. SNP P-value P-Value Rank Chr. SNP P-value P-Value Rank
1 1 rs4651138 0.03702 19,320 6 rs2070600 1.18E-11 89
2 11 rs2070045 0.02771 14,429 6 rs2256175 3.37E-4 148
3 1 rs4652769 0.02968 15,460 6 rs3134943 0.001351 248
4 8 rs3779870 0.04915 25,918 6 rs3134940 0.0001395 209
5 8 rs10808738 0.02714 14,117 6 rs3093662 0.0002165 218
6 8 rs4395923 0.02714 14,119 6 rs2256028 0.01838 388
7 11 rs4936637 0.02771 14,428 6 rs2074488 9.82E-8 101
8 1 rs6424883 0.04604 23,915 6 rs1063355 8.27E-05 204
9 1 rs10752893 0.04604 23,920 6 rs9264536 0.3904 5,759
10 X rs1800464 0.03104 16,393 6 rs2395471 0.2843 2,568
Journal of Integrative Bioinformatics, 8(1):187, 2011 http://journal.imbio.de
doi:10.2390/biecoll-jib-2011-187 15
Cop
yrig
ht 2
011
The
Aut
hor(
s). P
ublis
hed
by J
ourn
al o
f Int
egra
tive
Bio
info
rmat
ics.
Th
is a
rticl
e is
lice
nsed
und
er a
Cre
ativ
e C
omm
ons
Attr
ibut
ion-
Non
Com
mer
cial
-NoD
eriv
s 3.
0 U
npor
ted
Lice
nse
(http
://cr
eativ
ecom
mon
s.or
g/lic
ense
s/by
-nc-
nd/3
.0/).

Table 13. 5-fold Cross Validation results for AHP based prioritized list of SNPs over disease trait for AD and RA data.
Alzheimer's Disease Rheumatoid Arthritis
Acc. Rec. NPV Prec. Spec. Acc. Rec. NPV Prec. Spec.
AHP 0.571 0.636 0.636 0.519 0.519 0.786 0.733 0.800 0.767 0.828
In the next step, the dimension of the AD data is reduced from 26,545 to 596 and the RA data is reduced from 7,155 to 481 SNPs by utilizing SA based algorithm while conserving the prediction performance. 5-fold classification of SA based list against WEKA based methods Chi-square and Relief-F is depicted in Table 14, which shows the performance of the SA based selection algorithm against other well-known filtering based attribute selection schemes.
Table 14. 5-fold Cross Validation results for SA based selected list of SNPs over disease trait for AD and RA data.
Alzheimer's Disease Rheumatoid Arthritis
Measure SA-SNP Chi-Square Relief-F SA-SNP Chi-Square Relief-F
Accuracy 0.5306 0.6327 0.4898 0.7160 0.7306 0.7039
Recall 0.5333 0.6667 0.6000 0.6265 0.7108 0.6988
NPV 0.7200 0.8077 0.7143 0.7549 0.7922 0.7768
Precision 0.3333 0.4348 0.3214 0.6541 0.6519 0.6170
Specificity 0.5294 0.6176 0.4412 0.7764 0.7439 0.7073
5 Conclusions and Future Works
Here, we have introduced a java based integrated software system, METU-SNP, which can be effectively used for the GWAS and post-GWAS analysis of case-control based genotyping data for SNP-complex disease association. METU-SNP offers state-of-the-art AHP based SNP prioritization and Gene Set Enrichment Analysis frameworks and integrates well known third party tools such as PLINK and BEAGLE. METU-SNP, as an all-in-one GWAS application, offers a user friendly Graphical User Interface to manage the third party tools and it is equipped with novel functionality to prioritize and filter the most relevant SNPs from a massive initial SNP set.
METU-SNP version 1.0 is a java based desktop application with a MySQL back-end. The database integrates biological data from different major databases such as dbSNP, Entrez Gene, KEGG, Gene Ontology etc. The database structure currently lacks automated update functionality and it is designed to optimize the performance of AHP algorithm. Currently we are developing a new integrated SNP database with automated update functionality to periodically synchronize with the major biological databases. As a next step, METU-SNP functionality will be ported into the web environment, which will be hosted on a dedicated “secure” server within Middle East Technical University (METU) premises. The web based version will help us to reach a wider range of researchers worldwide. Additionally, development of a tool for graphical representation of the outputs and snp-gene-pathway relations, along with increased compatibility with different file formats are expected to be incorporated in the web based version.
Journal of Integrative Bioinformatics, 8(1):187, 2011 http://journal.imbio.de
doi:10.2390/biecoll-jib-2011-187 16
Cop
yrig
ht 2
011
The
Aut
hor(
s). P
ublis
hed
by J
ourn
al o
f Int
egra
tive
Bio
info
rmat
ics.
Th
is a
rticl
e is
lice
nsed
und
er a
Cre
ativ
e C
omm
ons
Attr
ibut
ion-
Non
Com
mer
cial
-NoD
eriv
s 3.
0 U
npor
ted
Lice
nse
(http
://cr
eativ
ecom
mon
s.or
g/lic
ense
s/by
-nc-
nd/3
.0/).

The METU-SNP application provides researchers with a powerful tool that can be effectively used for GWAS of SNP genotyping data for case-control type analysis. We believe that METU-SNP will facilitate the reliable identification of SNPs that are involved in the etiology of complex diseases and ultimately support timely identification of genomic disease biomarkers, and the development of personalized medicine approaches and the targeted drug discoveries.
Acknowledgements
We sincerely thank developers of SNPLogic for helping us with our integrated database structure. We also gratefully acknowledge the support of Genetic Analysis Workshops organization committee and ADNI investigators for sharing the data sets used in this work.
References
[1] The International HapMap Consortium. A haplotype map of the human genome. Nature, 437:1299-1320, 2005.
[2] The International HapMap Consortium. A second generation human haplotype map of over 3.1 million SNPs. Nature, 449:851-861, 2007.
[3] S.T. Sherry, M.H. Ward, M. Kholodov, J. Baker, L. Phan, E.M. Smigielski, and K. Sirotkin. dbSNP: the NCBI database of genetic variation. Nucleic Acids Research, 29:308-311, 2001.
[4] D. Maglott, J. Ostell, K.D. Pruitt, and T. Tatusova. Entrez Gene: gene-centered information at NCBI. Nucleic Acids Research, 33:54-58, 2005.
[5] M. Kanehisa and S. Goto. KEGG: kyoto encyclopedia of genes and genomes. Nucleic Acids Research, 28:27-30, 2000.
[6] C. Mungall et al. The Gene Ontology (GO) database and informatics resource. Nucleic Acids Research, 32:258-261, 2004.
[7] M.J. Daly, P.C. Sham, S. Purcell, B. Neale, K. Todd-Brown, L. Thomas, M.A.R. Ferreira, D. Bender, J. Maller, P. Sklar, and P.I.W. de Bakker. PLINK: a tool set for whole-genome association and population-based linkage analyses. American Journal of Human Genetics, 81:559-575, 2007.
[8] B.L. Browning and S.R. Browning. Efficient Multilocus Association Testing for Whole Genome Association Studies Using Localized Haplotype Clustering. Genetic Epidemiology, 31:365 - 375, 2007.
[9] C. Bonferroni. Teoria statistica delle classi e calcolo delle probabilità. In Pubblicazioni del R Istituto Superiore di Scienze Economiche e Commerciali di Firenze, vol. 8, pp. 3-62, 1936.
[10] Y. Benjamini and Y. Hochberg. Controlling the False Discovery Rate: A Practical and Powerful Approach to Multiple Testing. Journal of the Royal Statistical Society. Series B (Methodological), 57:289-300, 1995.
[11] G. Peng, L. Luo, H. Siu, Y. Zhu, P. Hu, S. Hong, J. Zhao, X. Zhou, J.D. Reveille, L. Jin, C.I. Amos, and M. Xiong. Gene and pathway-based second-wave analysis of genome-wide association studies. European Journal of Human Genetics, 18:111-117, 2010.
Journal of Integrative Bioinformatics, 8(1):187, 2011 http://journal.imbio.de
doi:10.2390/biecoll-jib-2011-187 17
Cop
yrig
ht 2
011
The
Aut
hor(
s). P
ublis
hed
by J
ourn
al o
f Int
egra
tive
Bio
info
rmat
ics.
Th
is a
rticl
e is
lice
nsed
und
er a
Cre
ativ
e C
omm
ons
Attr
ibut
ion-
Non
Com
mer
cial
-NoD
eriv
s 3.
0 U
npor
ted
Lice
nse
(http
://cr
eativ
ecom
mon
s.or
g/lic
ense
s/by
-nc-
nd/3
.0/).

[12] G. Üstünkar, S. Özöğür-Akyüz, G.-W Weber, C.M. Friedrich, and Y. AydınSon. Selection of representative SNP sets for genome-wide association studies: a metaheuristic approach. Optimization Letters, DOI: 10.1007/s11590-011-0419-7.
[13] J. Marchini, B. Howie, S. Myers, G. McVean, and P. Donnelly. A new multipoint method for genome-wide association studies by imputation of genotypes. Nature Genetics, 39:906-913, 2007.
[14] Y.S. Aulchenko, S. Ripke, A. Isaacs, and C.M. van Duijn. GenABEL: an R library for genome-wide association analysis. Bioinformatics, 23:1294 -1296, 2007.
[15] M. Nothnagel, D. Ellinghaus, S. Schreiber, M. Krawczak, and A. Franke. A comprehensive evaluation of SNP genotype imputation. Human Genetics, 125:163-171, 2009.
[16] K. Hao, E. Chudin, J. McElwee, and E.E. Schadt. Accuracy of genome-wide imputation of untyped markers and impacts on statistical power for association studies. BMC Genetics, 10:27, 2009.
[17] P.I. de Bakker, M.A. Ferreira, X. Jia, B.M. Neale, S. Raychaudhuri, and B.F. Voight. Practical aspects of imputation-driven meta-analysis of genome-wide association studies. Human Molecular Genetics, 17:122-128, 2008.
[18] P. Scheet and M. Stephens. A fast and flexible statistical model for large-scale population genotype data: applications to inferring missing genotypes and haplotypic phase. American Journal of Human Genetics, 78:629-644, 2006.
[19] L. Conde, J.M. Vaquerizas, H. Dopazo, L. Arbiza, J. Reumers, F. Rousseau, J. Schymkowitz, and J. Dopazo. PupaSuite: finding functional single nucleotide polymorphisms for large-scale genotyping purposes. Nucleic Acids Research, 34:621-625, 2006.
[20] D. Karolchik, R. Baertsch, M. Diekhans, T.S. Furey, A. Hinrichs, Y.T. Lu, K.M. Roskin, M. Schwartz, C.W. Sugnet, D.J. Thomas, R.J. Weber, D. Haussler, and W.J. Kent. The UCSC Genome Browser Database. Nucleic Acids Research, 31:51-54, 2003.
[21] G. Loots and I. Ovcharenko. ECRbase: database of evolutionary conserved regions, promoters, and transcription factor binding sites in vertebrate genomes. Bioinformatics, 23:122-124, 2007.
[22] D. Maglott, J. Ostell, K.D. Pruitt, and T. Tatusova. Entrez Gene: gene-centered information at NCBI. Nucleic Acids Research, 33:54-58, 2005.
[23] J. Osborne, J. Flatow, M. Holko, S. Lin, W. Kibbe, L. Zhu, M. Danila, G. Feng, and R. Chisholm. Annotating the human genome with Disease Ontology. BMC Genomics, 10:6, 2009.
[24] P. Du, G. Feng, J. Flatow, J. Song, M. Holko, W.A. Kibbe, and S.M. Lin. From disease ontology to disease-ontology lite: statistical methods to adapt a general-purpose ontology for the test of gene-ontology associations. Bioinformatics, 25:63-68, 2009.
Journal of Integrative Bioinformatics, 8(1):187, 2011 http://journal.imbio.de
doi:10.2390/biecoll-jib-2011-187 18
Cop
yrig
ht 2
011
The
Aut
hor(
s). P
ublis
hed
by J
ourn
al o
f Int
egra
tive
Bio
info
rmat
ics.
Th
is a
rticl
e is
lice
nsed
und
er a
Cre
ativ
e C
omm
ons
Attr
ibut
ion-
Non
Com
mer
cial
-NoD
eriv
s 3.
0 U
npor
ted
Lice
nse
(http
://cr
eativ
ecom
mon
s.or
g/lic
ense
s/by
-nc-
nd/3
.0/).