meyu muluke woreda, ethiopia - cmn...2013/12/13 · meyu muluke woreda (district) is one of the 19...
TRANSCRIPT

Meyu Muluke woreda, ETHIOPIA
July 19th to 29th 2013
Inés ZUZA SANTACILIA
2
ACKNOWLEDGEMENTS
International Medical Corps (IMC) and Coverage Monitoring Network extend its deep
gratitude to all those who have contributed to this study including: the authorities in
Meyu Muluke woreda (district) and East Hararghe province (Oromia Region), Ethiopia
and to all the health personnel and village residents for their hospitality and
cooperation. Avery special thanks to the mothers and caregivers of severely acute
malnourished children.
A very special thanks to the IMC team in Harar, to the Nutrition Officer (ALMAZ TASISA)
for his support coordinating the SQUEAC at field level and for his contribution on the
improvement of this report. Thanks you to the IMC team in Addis Ababa; the National
Nutrition Manager-IMC (Beka TESHOME) for his collaboration.
Thank you to the Federal Ministry of Health (MoH) for their zeal, support and
motivation. The East Hararghe Nutrition Focal Person (Mesfin WORKU) for his support
during the Harar training. To the Nutrition Focal Person (Daniel SISAY), the Extended
Program of Immunization Focal Person (Iskender Mohamed), the Nutritional Survey
Field Worker (Abdulahi AHMED) and the TB/HIV Focal Person (Ashenafi DOLEBO) in
Meyu Muluke woreda.
Thank you also to Ezana TESFAYE ZEMO from the Autralian MoH for all his support and
commitment with the SQUEAC.
This study would not have been possible without the hard work and commitment of
everyone involved.
Lastly, thank you to the Office of Foreign Disaster Assistance (OFDA) through GOAL for
financing this project.

3
EXECUTIVE SUMMARY
Meyu Muluke woreda (district) is one of the 19 woredas in East Hararghe province in
the Oromia Zone of Ethiopia. It is composed of approximately 124 villages (divided into
19 kebeles) and an estimated population of 54,496 inhabitants (14.8 % of children
between 6 and 59 months). The Dinkas and Luo tribes are the predominant ethnic
group inhabiting Meyu Muluke woreda. Communities are pastoralist and agro
pastoralist who continue to face food insecurity from re-occurring drought and
subsequent livestock losses.
International Medical Corps (IMC) was running a program to contribute to the
reduction of morbidity and mortality related to acute malnutrition and improves
nutrition practices in three woredas (Meyu Muluke, Kumbi, and Fedis) in East Hararghe
Zone from January to July 2013. IMC has been working in food-insecure woredas of East
Haraghe Zone since 2005, responding to the emergency nutrition needs.
In Ethiopia, the nutrition services are delivered by the MoH. In July 2013 there were 13
OTP sites functioning in the Meyu Muluke woreda. The other six OTPs were having
security problems. There are also three stabilization centres.
Since the beginning of 2012 the MoH has created the Health Development Army
(HDA). It is a team of community-level volunteers engaged in screening and mobilizing
children under 5 and pregnant and lactating women. They can detect cases of a defined
number of diseases (including malnutrition) and refer them to the health facilities.
There is one HDA per 4 households. The Health Extensions Workers are formal
salaried workers within the health system. They provide treatment for Severe Acute
Malnutrition (SAM) as part of a Health Extension Program.
Regarding the nutritional situation, no data of Meyu Muluke woreda is was available
for the previous years. But data from Midega Tolla woreda, the nearest woreda available
data (East Hararge Zone) in November 2012 was available the Global Acute
Malnutrition and SAM rates which were respectively 10.0 % (7.4 -13.3 95% C.I.) and 0.2
% (0.0 -1.3 95% C.I.).
Resume of coverage assessment
The coverage assessment was conducted to evaluate access and coverage of the
Community based Management of Acute Malnutrition programme for children aged 6 to
59 months with SAM. It was conducted between July 19th and 29th 2013 and it was
the first of its kind for the area. It was conducted at the beginning of the rainy season
and the Ramadan.
4
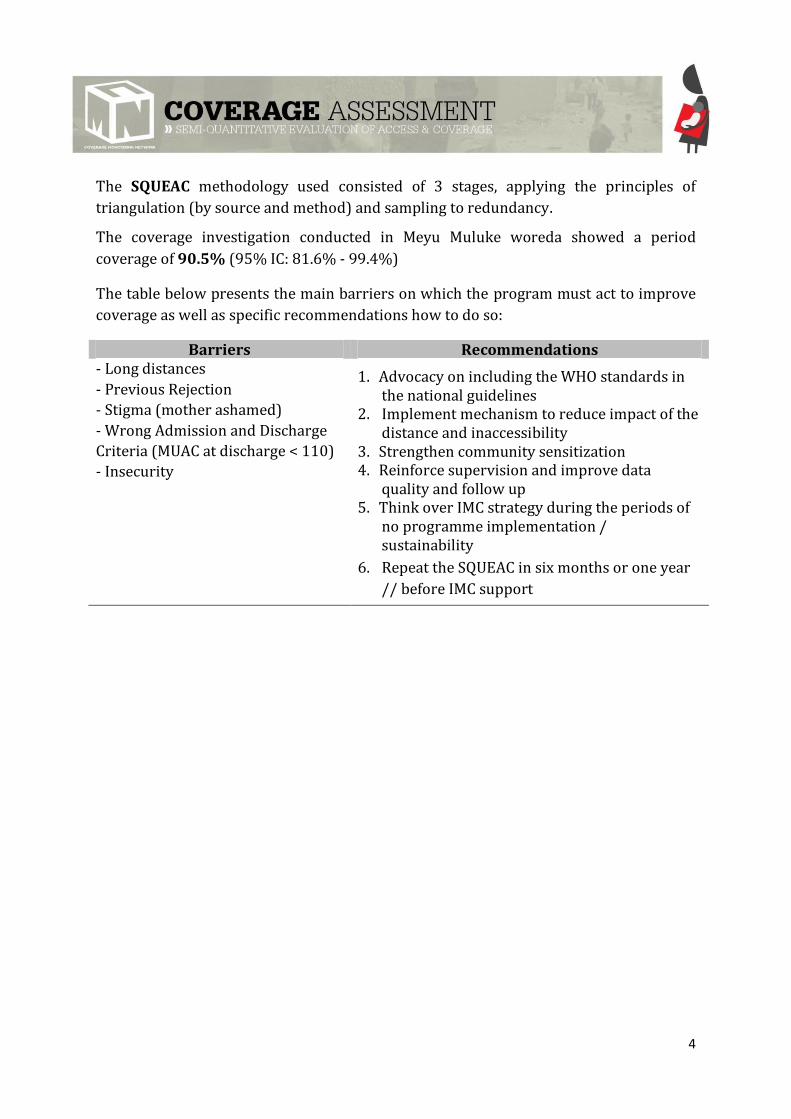
The SQUEAC methodology used consisted of 3 stages, applying the principles of
triangulation (by source and method) and sampling to redundancy.
The coverage investigation conducted in Meyu Muluke woreda showed a period
coverage of 90.5% (95% IC: 81.6% - 99.4%)
The table below presents the main barriers on which the program must act to improve
coverage as well as specific recommendations how to do so:
Barriers Recommendations - Long distances
- Previous Rejection
- Stigma (mother ashamed)
- Wrong Admission and Discharge
Criteria (MUAC at discharge < 110)
- Insecurity
1. Advocacy on including the WHO standards in the national guidelines
2. Implement mechanism to reduce impact of the distance and inaccessibility
3. Strengthen community sensitization 4. Reinforce supervision and improve data
quality and follow up 5. Think over IMC strategy during the periods of
no programme implementation / sustainability
6. Repeat the SQUEAC in six months or one year
// before IMC support
5
CONTENTS
1. INTRODUCTION ......................................................................................................................... 7
1.1 CONTEXT ......................................................................................................................... 7
1.2 International Medical Corps in Meyu Muluke woreda ............................................ 11
2. OBJECTIVES.............................................................................................................................. 13
3. METHODOLOGY ..................................................................................................................... 14
3.1. GENERAL OVERVIEW ................................................................................................... 14
3.2. STAGES ........................................................................................................................... 15
3.3. ORGANIZATION OF THE EVALUATION....................................................................... 20
3.4. LIMITATIONS ................................................................................................................ 21
4. RESULTS ................................................................................................................................. 22
4.1. STAGE 1 .......................................................................................................................... 22
4.1.1. Quantitative data analysis ........................................................................................ 22
4.1.2. Qualitative data analysis ........................................................................................... 30
4.2. STAGE 2 .......................................................................................................................... 31
4.3. STAGE 3 .......................................................................................................................... 33
A. The prior .................................................................................................................... 33
B. The likelihood ........................................................................................................... 34
C. The posterior ............................................................................................................ 35
5. DISCUSION ............................................................................................................................. 38
6. RECOMMENDATIONS .............................................................................................................. 41
Annex 1 : Survey questionnaire for current SAM children NOT in the program ......................... 44
Annex 2: Meyu Muluke wereda SQUEAC plan, July 2013 ............................................................. 45
Annex 3 : SQUEAC Survey team .................................................................................................... 46
Annex 4 : Terminology in Oromifa used to describe malnutrition and RUTF. Meyu Muluke
woreda. Ethiopia. SQUEAC July 2013. ........................................................................................... 47
Annex 5: Weighted BBQ, Meyu Muluke woreda SQUEAC, Ethiopia. July 2013 ............................ 48
6
ABBREVIATIONS
BBQ Barriers, Boosters and Questions
CI Credible Interval
CHD County Health Department
CMAM Community based Management of Acute Malnutrition
CMN Coverage Monitoring Network
CSAS Centric Systematic Area Sampling
EPI Expanded Program on Immunization
FDA Food Distribution Agents
GAM Global Acute Malnutrition
HC Health Centers
HDA Health Development Army
HF Health Facility
HP Health Post
IMC International Medical Corps
INGO International Non-Governmental Organisation
LoS Length of Stay
LP Land Preparation
MAM Moderate Acute Malnutrition
MoH Ministry of Health
MUAC Mid-Upper Arm Circumference
ODPPC Oromia Disaster Prevention and Preparedness Commission
OFDA Office of Foreign Disaster Assistance
OTP Outpatient Therapeutic Programme
RHB Regional Health Bureau
RUTF Ready to Use Therapeutic Food
SAM Severe Acute Malnutrition
SC Stabilization Centre
SFP Supplementary Feeding Program
SSI Semi Structure Interview
SQUEAC Semi Quantitative Evaluation of Access and Coverage
TSFP Targeted Supplementary Feeding Programmes
UNICEF United Nations Children’s Fund
WHO World Health Organisation
7
1. INTRODUCTION
1.1 CONTEXT
4.1.1. Overview of the area
Meyu Muluke woreda (district) is one of the 19 woredas in East Hararghe province in
the Oromia Zone (region with 180 woredas) of Ethiopia.
Meyu Muluke woreda is composed of approximately 124 villages (divided into 19
kebeles) and an estimated population of 54,496 inhabitants1. With 14.8 % of children
between 6 and 59 months (8,087 children). The Dinkas and Luo tribes are the
predominant ethnic group inhabiting in the woreda. The altitude of this woreda ranges
from 500-1700 meters above sea level.
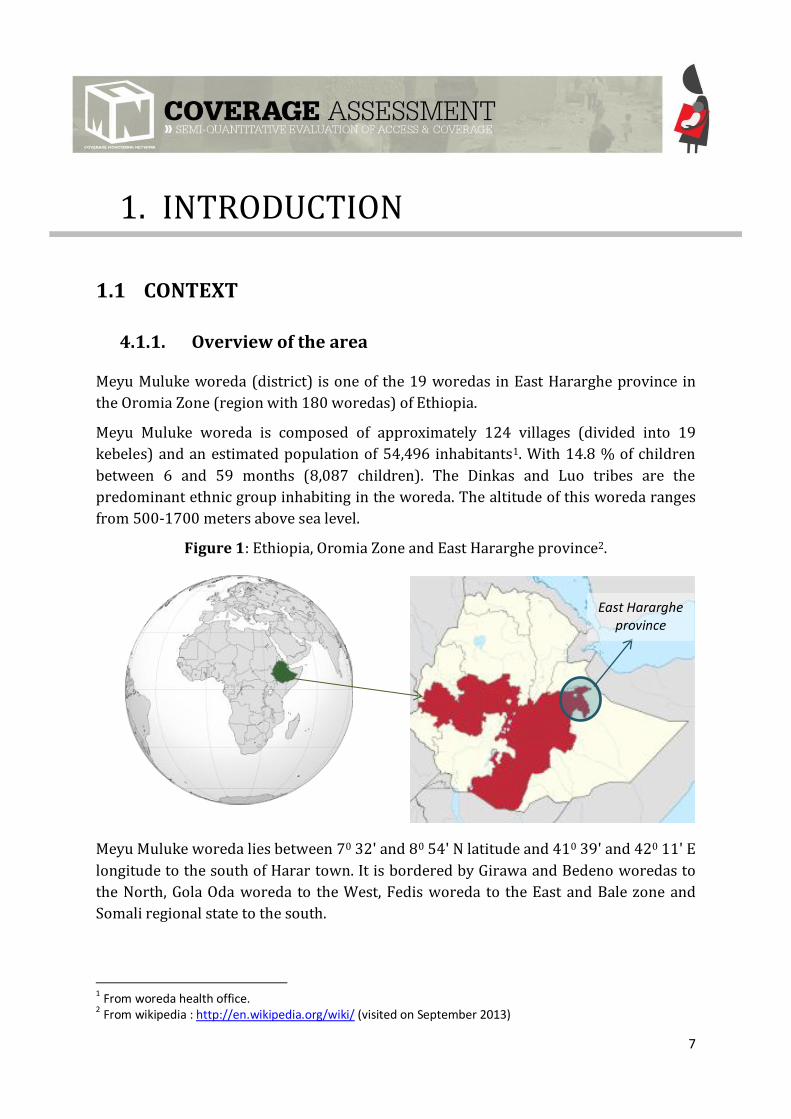
Figure 1: Ethiopia, Oromia Zone and East Hararghe province2.
Meyu Muluke woreda lies between 70 32' and 80 54' N latitude and 410 39' and 420 11' E
longitude to the south of Harar town. It is bordered by Girawa and Bedeno woredas to
the North, Gola Oda woreda to the West, Fedis woreda to the East and Bale zone and
Somali regional state to the south.
1 From woreda health office. 2 From wikipedia : http://en.wikipedia.org/wiki/ (visited on September 2013)
East Hararghe province
8
The woreda has a total area of 4,988.66 Km 2 accounting for about 22.02% of the total
area of East Hararghe Zone. It is located at a distance of 150km from Harar town to the
south direction. There are two rainy seasons in the area, meher (June-September), used
for crop production, pasture and water harvest and the short belg rains (February-
May), mainly used for land preparation, planting of long cycle crops collected after the
meher rains, small scale production, and improving water and pastures.
While central and western parts of Oromia Region generally received normal to above-
normal rains during the kiremt season this year, drought-prone areas in the east
including East Hararghe Zone received insufficient rainfall; inadequate for crop
development.
The communities living in Meyu Muluke woreda are pastoralist and agro pastoralist
who continue to face food insecurity from re-occurring drought and subsequent
livestock losses.
4.1.2. Nutritional situation
Regarding the nutritional situation, International Medical Corps (IMC) in conjunction
with Region’s Oromia Disaster Prevention and Preparedness Commission (ODPPC) has
conducted a Nutrition and retrospective mortality survey (SMART survey3) in Midega
Tolla woreda of East Hararge Zone in November 2012 (post-harvest periods). The
Global Acute Malnutrition (GAM) and Severe Acute Malnutrition (SAM) rates were 10.0
% (7.4 -13.3 95% C.I.) and 0.2 % (0.0 -1.3 95% C.I.).
No national data of Meyu Muluke woreda is available for the previous years.
Currently in Oromia Regional State, with the exception of a few areas (where NGOs
carry out repeated nutrition surveys), there is no nutrition surveillance /no time series
data on nutritional status to inform program planning and management. Just to fill this
gap ODPPC has planned to undertake nutrition surveillances together with (RHB).
There are various ways to implement nutrition surveillance; these include growth
monitoring programs, longitudinal anthropometric data systems, community or
institution-based sentinel sites systems and repeated cross-sectional surveys. For start-
up, the region has conducting six cross-sectional surveys that expected to be repeated
bi-annually with the support of United Nations Children’s Fund (UNICEF) in six woredas.
Midega Tolla is one of the targeted woreda for the above mentioned purposes4.
An OTP coverage assessment using the Centric Systematic Area Sampling (CSAS)
methodology was conducted in November-December 2010 in Babile woreda, Oromia
3 based on NCHS growth reference 1977. 4 IMC and ODPPC. Nutrition and retrospective mortality survey. November 2012.
9
region by IMC. The assessment showed an overall OTP period coverage of 55.3% (95%
CI: 46.2% - 64.3%) and OTP point coverage of 46.0% (95% CI: 38.7% - 53.4%). No
coverage assessment has been done in Meyu Muluke woreda.
4.1.3. Health access in Meyu Muluke woreda
Services are delivered both at Health Posts (HP), which are closer to community level
and deliver primary health care and at Health Centers (HC), which are located within
three kebele of Meyu Muluke woreda (Husse, Alola and Chella kebele).
Since the beginning of 2012 the MoH has created the Health Development Army
(HDA). It is a team of community-level volunteers engaged in screening and mobilizing
children under 5 and pregnant and lactating women. They can detect cases of a defined
number of diseases (including malnutrition) and refer them to the health facilities.
There is one HDA per 4 households. The community has chosen them with the
participation of the MoH. In many cases they have included traditional healers or
traditional birth attendants into this HDA or community base volunteers (community-
level volunteers previously working with IMC). Nevertheless not all of them are trained.
They have attended discussion in HF about some diseases (especially in children).
Mostly of them do not have MUAC tapes. Only the ones that were previously community
base volunteers with IMC have it.
The Health Extensions Workers (HEWs) are formal salaried workers within the
health system (in HP). They provide treatment for SAM as part of a Health Extension
Program containing 16 packages on topics such as hygiene, family health, disease
prevention and control, and health education. Each HEW supervises along of 100-200
HDA.
In Meyu Muluke woreda except insecurity area all kebeles have HP and at each HP there
are two health extensions workers (HEWs), so in Meyu Muluke woreda there are 13 HP
and 3 health centers (HC).
10
4.1.4. Nutrition services5
In Ethiopia, the nutrition services are delivered by the MoH.
In July 2013 initially there were 13 OTP sites functioning in the Meyu Muluke woreda.
Seven OTPs were inaccessible due to security problems (one of them became insecure
during the investigation). Finally only 12 OTP sites were functioning in Meyu Muluke
woreda at the end of the month. There were two HEWs workers per HP. They have
been first health assistants and after one year training became HEW.
There are also three stabilization centres (SC) in Meyu Muluke woreda: Husse SC, Alola
SC and Chella SC
Since 2004, the MoH started to integrate the in-patient and out-patient management of
severe acute malnutrition into hospitals and HC (i.e., at regional and woreda levels). In
2008, the out-patient management of SAM was further decentralized to HP (i.e., at the
kebele level). The objective was to ensure access to and coverage of malnutrition
services by bringing the service closer to the community. It benefits families by
reducing opportunity costs of accessing treatment. It also benefits the health system
through capacity building and acts as the catalyst for strengthening nutrition activities
within health facilities and at the community level, for treatment and prevention of
malnutrition.
The programme is in line with the first component of the National Nutrition Programme
(NNP), with its focus on “Supporting Service Delivery” which includes “Increased Access
for the Management of SAM.”
The Federal MoH Protocol for the management of SAM is from 2007. The admission
criteria are Weigh for Height < 70% (or <-3 Z-score using the WHO-2006 standards),
MUAC < 110 mm with (with length > 65 cm) or presence of bilateral pitting oedema.
In Meyu Muluke woreda the admission criteria is based on national protocol for SAM
management. At HP level the activity implemented by health extension worker where
the admission criteria is MUAC <110mm(with length >65cm) and/or bilateral pitting
oedema. At HC level the activity implemented by nurse or health officer where the
admission criteria is Weigh for Height < 70% (or <-3 Z-score using the WHO-2005
standards), MUAC < 110 mm with (with length > 65 cm) and/ or presence of bilateral
pitting oedema.
UNICEF provides the Ready to Use Therapeutic Food (RUTF) and medicines for SAM
treatment.
5 IMC. Therapeutic Feeding Programme Coverage Assessment Report. Babile Woreda, Oromiya Region, Ethiopia December 2011.
11
For Moderate Acute Malnutrition (MAM) management, International Medical Corps
manages cases of MAM in collaboration with the World Food Program (WFP), DPPC office,
health offices and the community. Supplementary food was provided by the WFP. Based on
discussions with the WFP and DPPC during implementation, International Medical Corps
managed Extended Outreach Service (EOS) beneficiaries (beneficiaries who were identified
by MoH mass screening each three month (Child Health Day (CHD) screening). Including
also non-EOS beneficiaries who were newly identified by International Medical corps
through the Targeted Supplementary Feeding Programmes (TSFP) staff screenings, MAM
beneficiary and children graduated from the OTP. Most of the time delay of SFP food after
screening is commonly due to transportation issue from government. SFP food is distributed
by International Medical Corps SFP staff and Food Distribution Agents (FDA).
1.2 International Medical Corps in Meyu Muluke woreda
International Medical Corps (IMC) was running a program to contribute to the
reduction of morbidity and mortality related to acute malnutrition and improve
nutrition practices in three woredas (Meyu Muluke, Kumbi, and Fedis) in East Hararghe
Zone from January to July 2013.
IMC has been working in food-insecure woredas of East Haraghe Zone since 2005,
responding to the emergency nutrition needs caused by recurring failed seasonal rains,
which have negatively impacted the nutritional well-being, food security, and general
health status of the population.
Between emergency nutrition programs there are usually funding/support gaps.
More recently until October 2012, IMC, with funding from the Office of Foreign Disaster
Assistance (OFDA) through GOAL has been implementing the “Emergency Nutrition
Support Program” in four woredas (Midega Tolla, Meyu Muluke, Kumbi and Gursum) to
respond to the nutrition crisis and reduce the disaster risk for targeted populations
using the community-based management of acute malnutrition (CMAM) approach. This
programme included capacity building of Ethiopian Ministry of Health and other
stakeholders through technical training, medical supply and equipment provision and
nutrition education to improve responsiveness and promote behavioral change during
the programme.
The support from January to July 2013 was composed of the four components of the
CMAM approach including: 1) Targeted Supplementary Feeding Program (TSFP) for
MAM, 2) SFP for MAM pregnant and lactating women and other vulnerable groups, 3)
Outpatient Therapeutic Program (OTP) and Stabilization Centers (SC) for SAM and 4)
community mobilization and outreach activities.

12
At OTP/SC level IMC build the capacity of MoH staff and conduct close supportive
supervision to ensure the quality of the service. UNICEF has provided the RUTF to MoH
and IMC has provided logistical support to transport the RUTF from the zonal
warehouse to woreda stores and from woreda stores to the health facilities.
HEWs and health center staffs have managed the malnourished children at health posts
and health centers.
The emergency nutrition program is implemented in close collaboration with the MoH,
DPPC, UNICEF, WFP as well as other stakeholders.

13
2. OBJECTIVES
Main objective
The main objective of this study was to evaluate access and coverage of the Community
based Management of Acute Malnutrition (CMAM) for children aged 6 to 59 months
with SAM in Meyu Muluke woreda, in East Hararghe province in the Oromia Zone of
Ethiopia, using the Semi-quantitative evaluation of access and coverage (SQUEAC)
methodology.
Specific objectives
- To develop capacity of various stakeholders on undertaking program coverage
assessments using SQUEAC methodology
- To determine baseline coverage for CMAM
- To identify boosters and barriers influencing CMAM program access and
coverage
- To develop feasible recommendations to improve CMAM program access and
coverage
Photo 2 : Stage one training at Harar town (Winta Hotel) for data collection,
Ethiopia.
14
3. METHODOLOGY6
3.1. GENERAL OVERVIEW
The Semi-Quantitative Evaluation of Access and Coverage (SQUEAC) is a coverage
assessment method developed by Valid International, FHI 360/FANTA, UNICEF,
Concern Worldwide, World Vision International, Action Against Hunger, Tufts
University, and Brixton Health.
The methodology is “semi-qualitative” in nature, meaning that it draws from a mixture
of both quantitative data from routine program monitoring activities as well as
qualitative data collected on the field. This mixed methods approach combines data
sources to estimate program coverage and to develop practical measures that can
improve access and coverage.
- Quantitative data came mainly from routine monitoring information that the
program already collected including: admissions, defaulting, recovery, middle
upper arm circumference (MUAC). Routine program data was coupled with
“complementary data” like agriculture, labor, and disease calendars,
anthropometric nutritional surveys, and agricultural and food security
assessments.
- Qualitative data collected came from interviews, focus groups and
questionnaires with various key informants.
Together, the data were triangulated by source and method to formulate hypotheses
about coverage and access. Data triangulation is a powerful technique that helped
validate our findings through cross verification. Hypotheses were then tested with
small-area surveys and small sample surveys. Then, a wide area survey was conducted
in the community to determine the point coverage estimate.
Lastly, the results from the quantitative and qualitative analyses and the wide-area
likelihood survey were combined and the overall global coverage estimate was
calculated using Bayesian statistical techniques.
6 2012. SQUEAC and SLEAC Technical Reference. FANTA. Available at http://www.fantaproject.org/sites/default/files/resources/SQUEAC-SLEAC-Technical-Reference-Oct2012_0.pdf
15
The coverage study was conducted between July 19th and 29th 2013. It was the first
of its kind for the area for SAM. It was conducted at the beginning of the rainy season
and the Ramadan.
The SQUEAC methodology used consisted of 3 stages, applying the principles of
triangulation (by source and method) and sampling to redundancy.
3.2. STAGES
Stage 1: Identification of potential areas of high and low
coverage and access barriers
Identification of potential areas of high and low coverage using routine program data; in
this stage, triangulation of data was done by various sources and methods as
highlighted below.
1. Quantitative data (February– June 2013)
Quantitative, routine program data helped to evaluate the general quality of CMAM
service, to identify admission and performance trends and to determine if the program
adequately responds to need. It also helped point out problems in screening and
admission. Lastly, routine program data analysis provided the first insights into
variation in program performance between OTPs.
Routine program data analysis included the following (for 13 OTP)
- Global (OTP and SC) trends of admission and defaulters over time and compared
to the agricultural calendar, the lean period, child epidemics and diseases,
workload, weather patterns and key events
- Admission: admission by OTP and SC
- OTP and SC program performance indicators over time (recovery, default, death,
non-response).
- Discharged
o Cured: length of stay (LoS) and MUAC at discharge.
- Stock break out data.
Complementary data from children card (for 11 or 12 OTP7)
- MUAC at the time of admission (12 OTP)
- Length of Stay for discharged cured (11 OTP)
7 Mojo weldia OTP area started to have security problems during the SQUEAC in July 2013 and some data could not be obtained. Goro Neyeda OTP data for length of stay could not being colected.
16
- The village lists populations belonging to each OTP and distance to OTP.
Admissions per village
Defaulter: there were no reported defaulters in the period,
Not available
- Admissions and other OTP indicators previous to February 2013.
2. Qualitative data
Qualitative data was collected to investigate program operations, to unravel the
opinions and experiences of personnel involved in CMAM and to identify any potential
barriers to access. The following methods were used: focus groups, semi-structured
interviews, structured interviews, case studies and observation.
Interviews and focus groups were conducted with key informants either directly or
indirectly involved in the CMAM program. These included: women’s and men’s
community, program personnel of IMC, local authorities (not religious leaders due to
the Ramadan period) HDA, HEWs, caregivers of SAM children, health authorities.
Informal caregivers (traditional healers and traditional birth attendants) were not
found because mostly were integrated in the HDA.
The BBQ framework. Throughout the investigation, the data are going to be organized,
analyzed and triangulated using the Barriers, Boosters and Questions (BBQ8) framework.
It is a tool that facilitates iterative data collection that is then categorized into one of
three categories. The various data organized within the BBQ framework, when combined,
will help providing information about where coverage is likely to be satisfactory as well as
where it is likely to be unsatisfactory. Additionally, the BBQ provided information about
likely barriers to services access that exists within the CMAM program.
Stage 2: Confirms the location of areas of high and low coverage
The goal of stage 2 is to test the hypotheses about coverage and access elaborated in
stage 1. These hypotheses usually take the form of identifying areas where the
combined data suggest that coverage is likely to be either high or low. The small-area
surveys method was used to test the hypotheses for CMAM high and low coverage
areas.
8 ‘Barriers’ are negative findings that deter from program coverage and complicate access to service. Conversely, ‘boosters’ contribute to a higher coverage and facilitate access. Lastly, ‘questions,’ are those findings elements to be further investigated, and either become a barrier or booster or remain inconclusive
17
The active and adaptive case-finding methodology was used to find SAM cases. Data
surveys will be analysed using simplified lot quality assurance sampling (LQAS). The
LQAS classification technique analyses data using the following formula:
⌊
⌋
where
the threshold value number of cases found coverage standard
If the number of covered cases found (that is, those cases in the program) is greater
than then then the coverage of the surveyed area is classified as being greater than or
equal to the coverage standard .
If the number of covered cases found (that is, those cases in the program) is less than
then then the coverage of the surveyed area is classified as being less than or equal to
the coverage standard
The threshold chosen is 40%. The Centric Systematic Area Sampling (CSAS) coverage
survey done in Babile woreda in November 24th to 5th of December 2011 by IMC was the
guide to establish this threshold. If the number of covered cases found (that is, those
cases in the program) is less than then then the coverage of the surveyed area is
classified as being less than or equal to the coverage standard .
Stage 3: Wide area survey conducted to estimate overall coverage.
The goal of stage three is to calculate the overall coverage estimate. This is done using a Bayesian
statistical technique called “beta-binomial conjugate analysis.” Conjugate analysis begins with a beta
distributed, probability density called the “prior.” The prior is then combined with a binomial
distributed, likelihood function called the “likelihood.” The likelihood is going to be determined by a
wide-area coverage survey that will be conducted across the entire program catchment area; the
mode of the likelihood was, in fact, the point coverage estimate from the survey. Because the prior and
the likelihood are mathematically expressed in similar ways (as probability distributions) they can be
combined through conjugate analysis, the result of which is the posterior probability density—the
“posterior.” The mode of the posterior is the final coverage estimate.
1. The Prior
The prior was constructed by combining the results from stages 1 and 2, that is: routine program data,
qualitative data and all relevant findings from the small-area and small sample surveys. The prior was
the result of combining two modes:
1) The weighted BBQ : a score from 1 to 5 was attributed to each element. The score reflected
the relative importance or likely effect that the element had on coverage. The coverage
estimate was calculated by the method explained above.
2) The histogram prior : During a participatory working group, the investigation team designed
a histogram representing the prior mode. This was done realistically and democratically. The
mode, minimum and maximum coverage values were chosen credibly.
2. The likelihood
A wide-area “likelihood survey” was conducted over the entire program catchment area to calculate
the coverage estimate.
The active and adaptive case-finding methodology was used to identify the SAM cases.
The case definition used for the coverage survey was defined as “a child matching the admission
criteria of the programme”. The admission criteria of the Ethiopian CMAM programme included
children aged between 6 and 59 months with at least one of the following criteria: 1) a MUAC of <11.0
cm and 2) bilateral pitting oedema
A simple structured interview questionnaire was used to caregivers of non-covered cases for SAM in
Annex 1.
19
The sample size required was calculated by using the following equation:
⌈
. ( )⌉
1. Mode: prior value expressed as a proportion.
2. α et β: shape parameters of the prior.
3. Precision: desired precision. In the present case the precision used was 0.14 (14%).
4. SAM prevalence: 0.5% was chosen after stage 2 results to be the possible prevalence in the
area. Because no available data of Meyu Muluke wereda was available. In the near Midhaga
Tolla woreda of East Hararge Zone in November 2012 the SAM rate was at 0.2 % (0.0 -1.3 95%
C.I.).
5. Average village population: 401 people in Meyu Muluke woreda (based on woreda health office
data)
6. Population between 6 and 59 months : approximately 14.8%
And the minimum number of villages needing to be sampled to achieve the sample size was
calculated using the following equation:
⌈
⌉ X
The number of required villages was randomly selected with ENA for SMART software9 from the list
of accessible villages in Meyu Muluke woreda.
3. Overall Coverage Estimate
The point or period coverage estimate was chosen for SAM coverage. By method of Bayesian beta-
binomial conjugate analysis the prior probability density was combined with the coverage estimate
from the likelihood survey to calculate the mode of posterior probability density.
The Posterior Probability is the estimate of the overall coverage: it represents the synthesis of the
prior probability and likelihood generated by the calculator with Bayes credible interval (CI) of 95%.
Recommendations and Action Plan: A final important step is the development of an action plan that
clearly identifies the actions to be undertaken, indicators, evaluation methods and deadlines.
9Available at: http://www.nutrisurvey.de/ena/ena.html [Accessed: November 2013]
20
3.3. ORGANIZATION OF THE EVALUATION
3.3.1 CMN technical support
The IMC team and the Ethiopian MoH from East Hararghe province received the technical support of
the Coverage Monitoring Network (CMN). The CMN Project is a joint initiative by ACF, Save the
Children, International Medical Corps, Concern Worldwide, Helen Keller International and Valid
International. The programme is funded by ECHO and USAID. This project aims to increase and
improve coverage monitoring of the CMAM programme globally and build capacities of national and
international nutrition professionals; in particular across the West, Central, East & Southern African
countries where the CMAM approach is used to treat acute malnutrition. It also aims to identify,
analyse and share lessons learned to improve the CMAM policy and practice across the areas with a
high prevalence of acute malnutrition.
The technical and methodological support was provided by a Regional Coverage Advisor (RECO) Inés
ZUZA SANTACILIA. During the evaluation CMN support was conducted in three phases:
- 1st phase: remote technical support for the planning and preparation of the evaluation with
the CMN RECO.
- 2nd phase: in field technical support in Meyu Muluke woreda. The CMN RECO was deployed to
support training on the use of the SQUEAC methodology and the implementation of the
evaluation until stage 2.
- 3rd phase: remote support for the completion of the investigation, analysis of results and
report writing.
SQUEAC plan in Annex 2.
3.3.2 Team training, logistic organization and evaluation development
The investigation team (described in Annex 3) was composed of members of IMC from Harar and
Addis Ababa team, MoH staff (from East Hararghe province and Meyu Muluke woreda), one partner
(MoH of Australia) and one nutritional survey field worker recruited for the SQUEAC.
The SQUEAC was conducted in the field by the CMN RECO in collaboration with the Monitoring and
the Harar Nutrition Officer (AIMAZ TASISA).
A two days training in the SQUEAC methodology was made by the CMN RECO in Harar. This training
targeted people that integrated the evaluation team and other people who might be interested in the
methodology. The East Hararghe Nutrition Focal Person from the Ethiopian MoH participated on this
two days training.
After the team was deployed to Meyu Muluke woreda (150km away from Harar) in the mountains.
Some of the investigation team members stayed in the Husse capital of Meyu Muluke woreda while
the RECO and the other members of the investigation team were based in Girawa (70 km from Harar
21
in Meyu Muluke woreda). This was due to the security and the logistic conditions in Meyu Muluke
woreda. During the SQUEAC all the investigation team was also deployed to Girawa (to avoid daily
travel from Meyu Muluke to Girawa)
For the three steps the investigation team was divided in five teams, composed by normally two
people each.
3.4. LIMITATIONS
The evaluation was limited by the following elements:
- The security situation didn’t allow accessing one OTP and its area (of the 13 functioning).
- The mountain roads and bad weather conditions (rain and fog) made the logistical
coordination, communication and deployment of the teams difficult.
- There was no telephone network in Meyu Muluke woreda. In Giraw, the telephone network
had problems (frequent cut-offs) and no internet was available in both areas. The combination
of these factors made impossible to share daily information from all the teams involved in the
SQUEAC. Appointments in Girawa or Meyu Muluke woredas were done for sharing the
information and continue the training. Also the RECO was unable to communicate and give
technical support to the investigation team between the beginnings of stage 2 until the
finalization of the SQUEAC (when the Harar Nutrition Officer was travelling back to Harar).
- Initially technical support from National Nutrition Manager was going to be given for the
investigation team along all the SQUEAC. Finally it could not go more than stage 2.
- No data was available from the IMC programme or the MoH from before February 2013 for the
SQUEAC.
Photo 3: Training on stage two at Girawa woreda.
22
4. RESULTS
4.1. STAGE 1
4.1.1. Quantitative data analysis
a. Needs response : admissions and defaulters trends compared to seasonal and key events
calendar
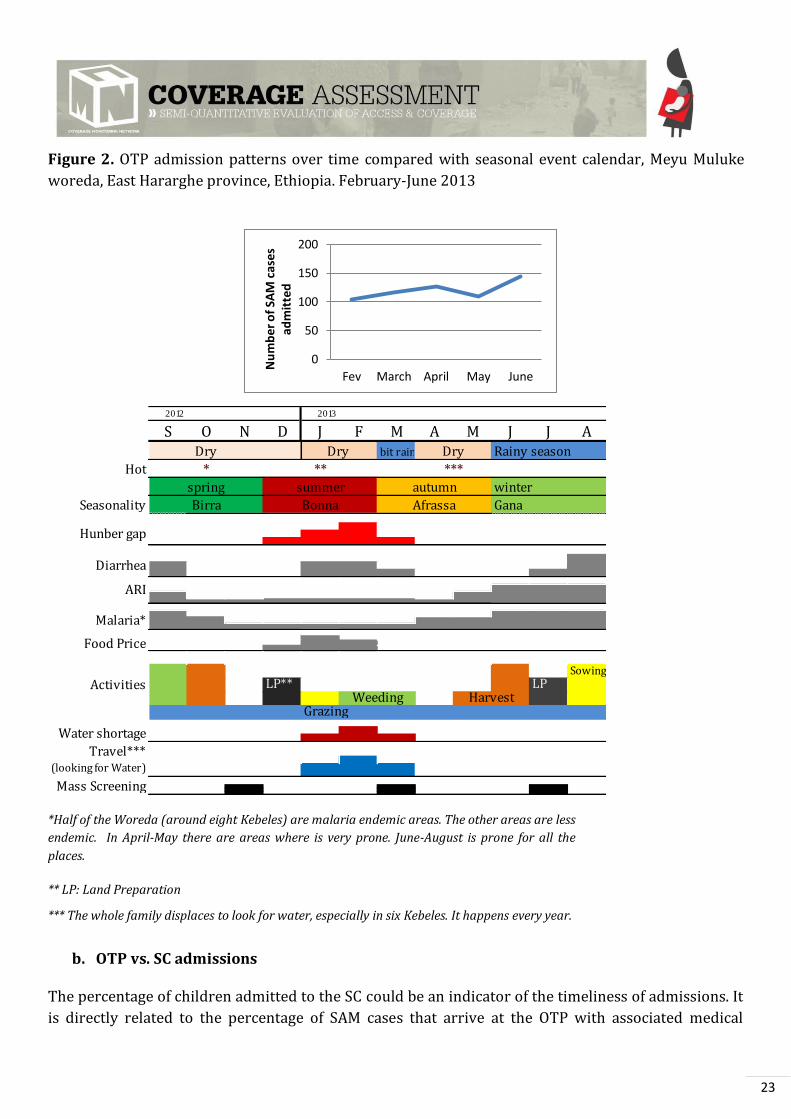
Figure number 2 shows the OTP admission over a 4-month period (February –June 2013). This
graph is aligned with a seasonal and key event calendar developed by the investigation team (weather
patterns, seasonal calendar of human diseases associated with SAM in children, food availability, and
workload). Together these two figures helped evaluate to what extent the program responds to
seasonal needs. There were no defaulters along these months’.
The Ethiopian calendar (Ge'ez Calendar10) starts in from the 29th August. The period showed in
figure 2 corresponds to the Ge’ez calendar 2005 year.
Since January to June 2013, 601 SAM children have been admitted to OTPs with a mean of 120.2
children admitted per month. Zero defaulters were notified during the period. Data quality issues
were detected in one OTP along the register revision in Stage 1.
The SAM admission trends are reflecting few months of the year trends. The hunger gap is from
December to March, with a peak in February. Nevertheless, trends of admissions show the increase in
the number of cases along the 4-month period. Comparison with the trends of admissions in other
period should be necessary to extract reliable conclusion of these data. Normally however, the
combination of prone diarrhea, food prices and hunger gap should make February the peak month for
admissions. However, water shortage and displacement of families looking for water have made OTPs
less accessible for the community.
10 The Ge'ez Calendar is the official calendar in Ethiopia. It is based on the Coptic calendar with a leap day, every four years. The Ethiopian Calendar has twelve months with 30 days each and a thirteenth month called Pagume with five or six days depending on the year.
23
Figure 2. OTP admission patterns over time compared with seasonal event calendar, Meyu Muluke
woreda, East Hararghe province, Ethiopia. February-June 2013
*Half of the Woreda (around eight Kebeles) are malaria endemic areas. The other areas are less
endemic. In April-May there are areas where is very prone. June-August is prone for all the
places.
** LP: Land Preparation
*** The whole family displaces to look for water, especially in six Kebeles. It happens every year.
b. OTP vs. SC admissions
The percentage of children admitted to the SC could be an indicator of the timeliness of admissions. It
is directly related to the percentage of SAM cases that arrive at the OTP with associated medical
0
50
100
150
200
Fev March April May June
Nu
mb
er
of
SAM
cas
es
adm
itte
d
2012 2013
S O N D J F M A M J J Abit rain Rainy season
Hot
winter
Seasonality Gana
SowingLP** LP
Grazing
Travel*** (looking for Water)
Mass Screening
ARI
Malaria*
Hunber gap
Water shortage
Birra
Diarrhea
Food Price
Activities
spring
Dry
autumn
Afrassa
Weeding Harvest
Bonna
summer
*
Dry Dry
** ***

24
complications. Children remaining untreated for long periods with declining nutritional status
develop medical complications and end up needing SC care.
A high percentage of SAM cases with medical complications could often be the product of a late
presentation and uptake of services.
In Meyu Muluke woreda, the proportion of program admissions requiring inpatient care from
February to June 2013 is only 4.8%. This percentage is less than the 5% recommended for established
programs therefore this can indicate early admission of SAM children in OTP services.
Figure 3. OTP admission compared with SC admissions. Meyu Muluke woreda, East Hararghe
province, Ethiopia. February-June 2013
c. Admissions by OTP
Figure 4 shows the number of SAM cases admitted per OTP over the 4-month period (February –June
2013). Alalo OTP is the one that received more cases during the period (161 SAM admissions).
Figure 4 : SAM admissions per OTP site . Meyu Muluke woreda, Oromia region, East Hararghe
province, Ethiopia. February-June 2013.
95.2%
4.8%
Admissions OTP
Admission SC
020406080
100120140160180
Nu
mb
er o
f ca
ses
OTP
25
Alalo OTP is the nearest OTP to the areas that have insecurity problems, in the border (with no OTP
functioning in the area). Go Sodoma OTP however is the one that received the fewer number of cases
(20 SAM admissions). IMC team explained that this can be related to the river passing through the
kebele that is used for irrigation therefore allowing the community to be less food insecure.
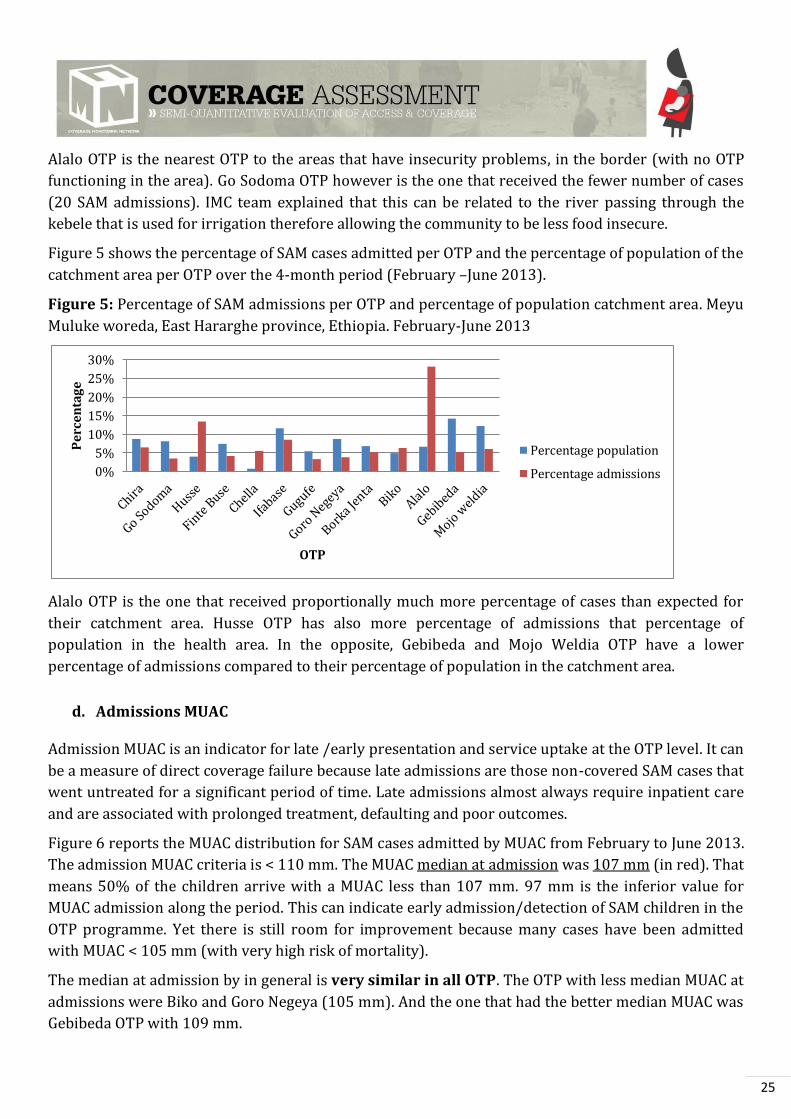
Figure 5 shows the percentage of SAM cases admitted per OTP and the percentage of population of the
catchment area per OTP over the 4-month period (February –June 2013).
Figure 5: Percentage of SAM admissions per OTP and percentage of population catchment area. Meyu
Muluke woreda, East Hararghe province, Ethiopia. February-June 2013
Alalo OTP is the one that received proportionally much more percentage of cases than expected for
their catchment area. Husse OTP has also more percentage of admissions that percentage of
population in the health area. In the opposite, Gebibeda and Mojo Weldia OTP have a lower
percentage of admissions compared to their percentage of population in the catchment area.
d. Admissions MUAC
Admission MUAC is an indicator for late /early presentation and service uptake at the OTP level. It can
be a measure of direct coverage failure because late admissions are those non-covered SAM cases that
went untreated for a significant period of time. Late admissions almost always require inpatient care
and are associated with prolonged treatment, defaulting and poor outcomes.
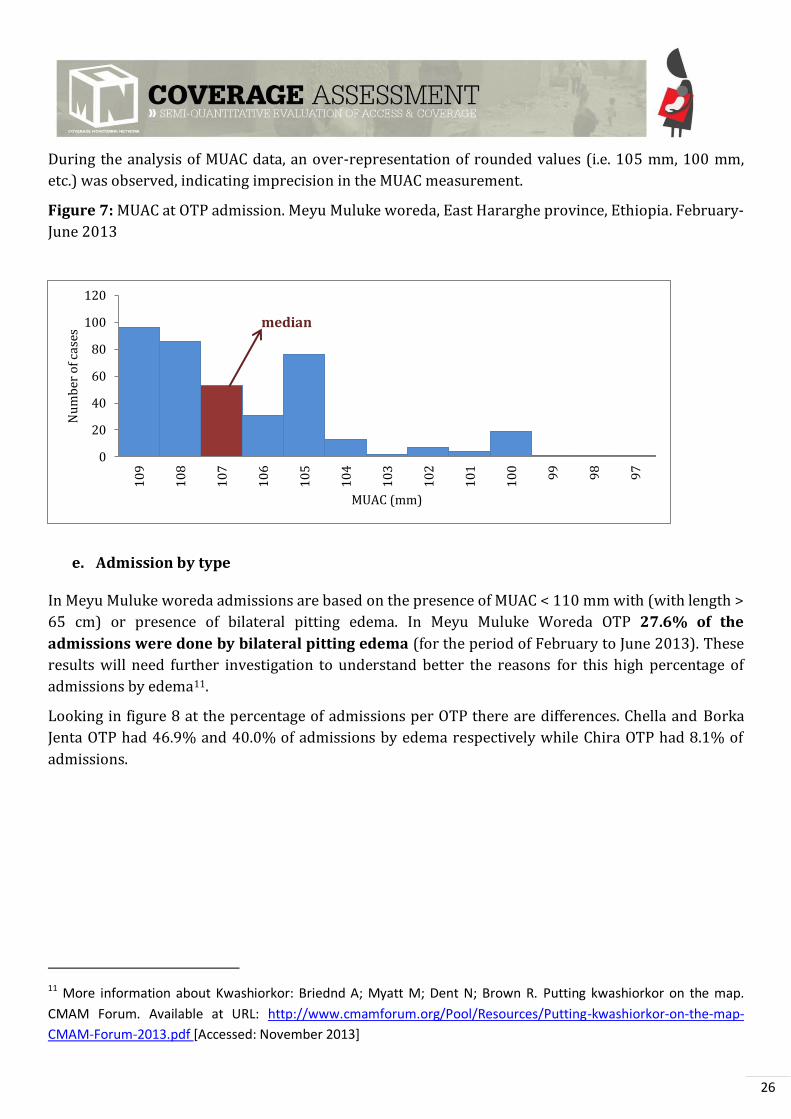
Figure 6 reports the MUAC distribution for SAM cases admitted by MUAC from February to June 2013.
The admission MUAC criteria is < 110 mm. The MUAC median at admission was 107 mm (in red). That
means 50% of the children arrive with a MUAC less than 107 mm. 97 mm is the inferior value for
MUAC admission along the period. This can indicate early admission/detection of SAM children in the
OTP programme. Yet there is still room for improvement because many cases have been admitted
with MUAC < 105 mm (with very high risk of mortality).
The median at admission by in general is very similar in all OTP. The OTP with less median MUAC at
admissions were Biko and Goro Negeya (105 mm). And the one that had the better median MUAC was
Gebibeda OTP with 109 mm.
0%
5%
10%
15%
20%
25%
30%
Pe
rce
nta
ge
OTP
Percentage population
Percentage admissions
26
During the analysis of MUAC data, an over-representation of rounded values (i.e. 105 mm, 100 mm,
etc.) was observed, indicating imprecision in the MUAC measurement.
Figure 7: MUAC at OTP admission. Meyu Muluke woreda, East Hararghe province, Ethiopia. February-
June 2013
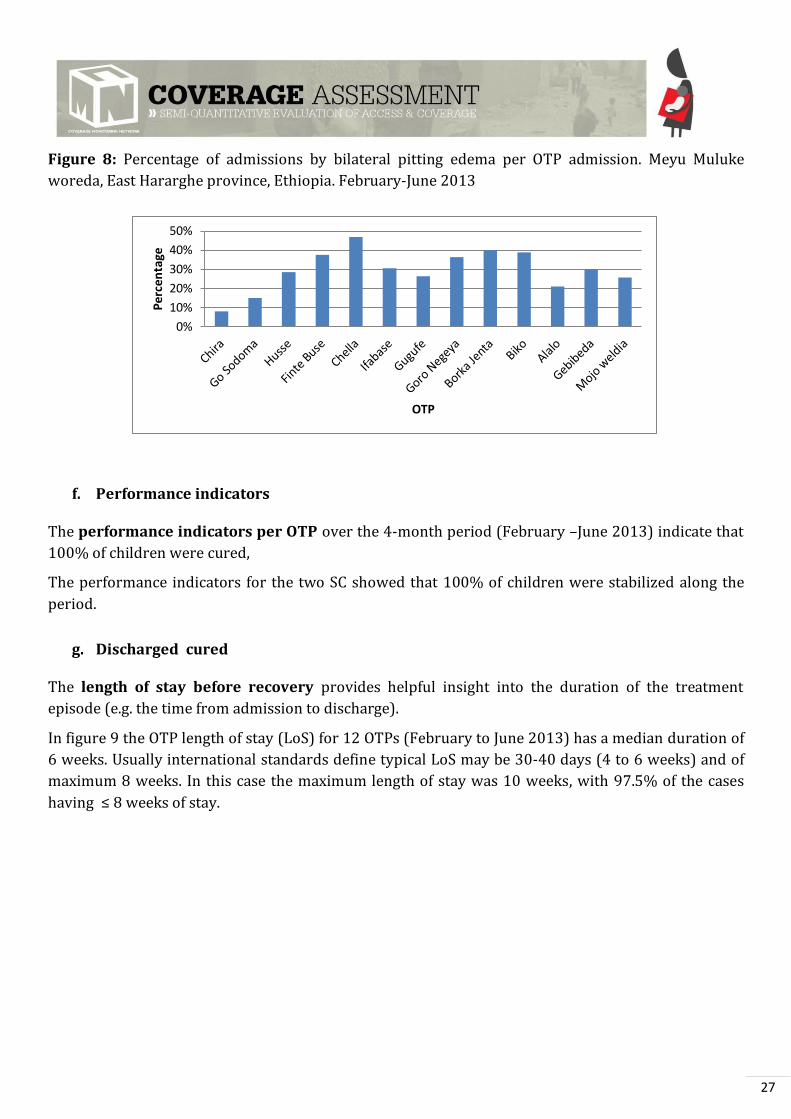
e. Admission by type
In Meyu Muluke woreda admissions are based on the presence of MUAC < 110 mm with (with length >
65 cm) or presence of bilateral pitting edema. In Meyu Muluke Woreda OTP 27.6% of the
admissions were done by bilateral pitting edema (for the period of February to June 2013). These
results will need further investigation to understand better the reasons for this high percentage of
admissions by edema11.
Looking in figure 8 at the percentage of admissions per OTP there are differences. Chella and Borka
Jenta OTP had 46.9% and 40.0% of admissions by edema respectively while Chira OTP had 8.1% of
admissions.
11 More information about Kwashiorkor: Briednd A; Myatt M; Dent N; Brown R. Putting kwashiorkor on the map.
CMAM Forum. Available at URL: http://www.cmamforum.org/Pool/Resources/Putting-kwashiorkor-on-the-map-
CMAM-Forum-2013.pdf [Accessed: November 2013]
0
20
40
60
80
100
120
10
9
10
8
10
7
10
6
10
5
10
4
10
3
10
2
10
1
10
0
99
98
97
Nu
mb
er o
f cas
es
MUAC (mm)
median
27
Figure 8: Percentage of admissions by bilateral pitting edema per OTP admission. Meyu Muluke
woreda, East Hararghe province, Ethiopia. February-June 2013
f. Performance indicators
The performance indicators per OTP over the 4-month period (February –June 2013) indicate that
100% of children were cured,
The performance indicators for the two SC showed that 100% of children were stabilized along the
period.
g. Discharged cured
The length of stay before recovery provides helpful insight into the duration of the treatment
episode (e.g. the time from admission to discharge).
In figure 9 the OTP length of stay (LoS) for 12 OTPs (February to June 2013) has a median duration of
6 weeks. Usually international standards define typical LoS may be 30-40 days (4 to 6 weeks) and of
maximum 8 weeks. In this case the maximum length of stay was 10 weeks, with 97.5% of the cases
having ≤ 8 weeks of stay.
0%
10%
20%
30%
40%
50%
Pe
rce
nta
ge
OTP

28
Figure 9: Length of stay for discharge cured. Meyu Muluke woreda, East Hararghe province, Ethiopia.
February-June 2013
Figure 10 shows the percentage of MUAC at discharged cured under 110 mm (in 12 OTP) for the
period February-June 2013.
In general 13.9% of the discharged cured (65 cases) had MUAC at discharge < 110 mm. From them
41.5% had 109 mm, 29,2% 108 mm and 3.1% 107 mm. This could indicate early discharge of SAM
children from the OTP programme. The reasons for it should be studied to try to avoid this situation.
It can be observed that Borka Jenta had 54.3% of discharged cured with MUAC < 110 mm. Some OTP
had more than 20.0% of the discharged cured with MUAC < 110 mm (Goro Negeya, Ifabase and Gugufe
OTP). While others in almost all cases the discharge criteria were above 110 mm (Goro Sodoma and
Alalo).
Figure 10: Percentage of SAM children discharged cured with MUAC < 110 mm. Meyu Muluke
woreda, East Hararghe province, Ethiopia. February-June 2013
0
20
40
60
80
100
120
1 2 3 4 5 6 7 8 9
10
Nu
mb
er o
f ch
ildre
n
weeks
median
.00%
10.00%
20.00%
30.00%
40.00%
50.00%
60.00%
Pe
rcen
tage
OTP
29
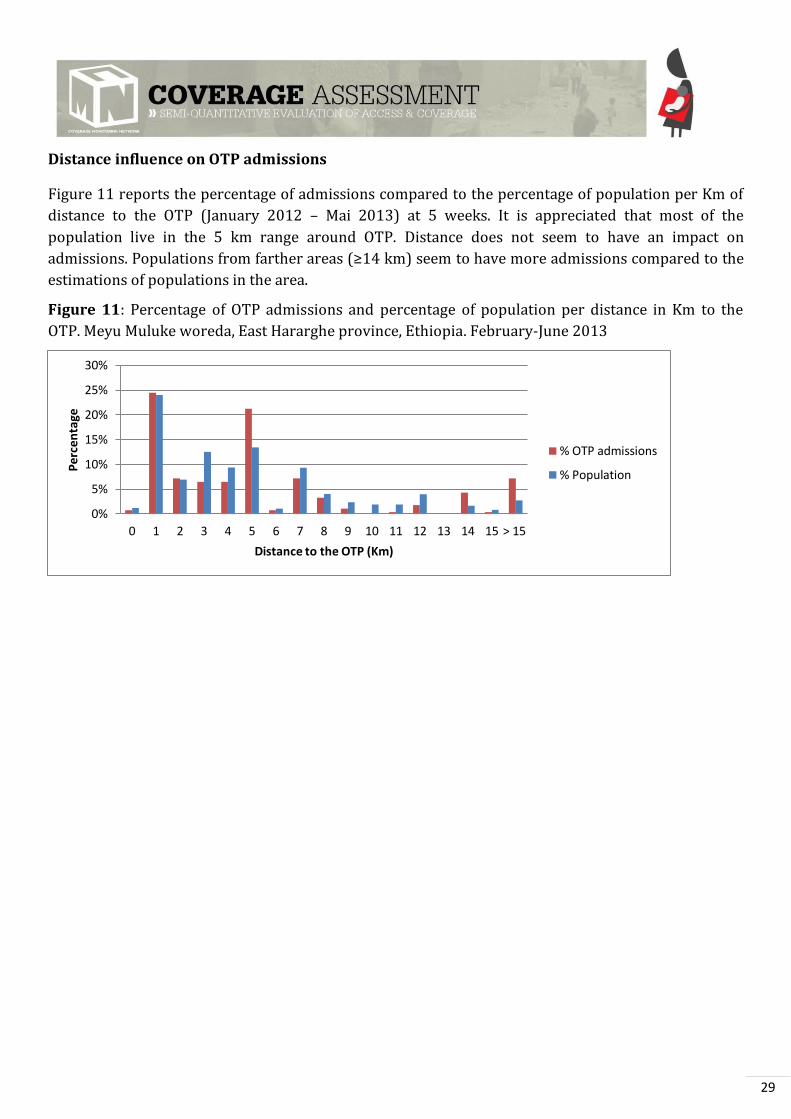
Distance influence on OTP admissions
Figure 11 reports the percentage of admissions compared to the percentage of population per Km of
distance to the OTP (January 2012 – Mai 2013) at 5 weeks. It is appreciated that most of the
population live in the 5 km range around OTP. Distance does not seem to have an impact on
admissions. Populations from farther areas (≥ 4 km) seem to have more admissions compared to the
estimations of populations in the area.
Figure 11: Percentage of OTP admissions and percentage of population per distance in Km to the
OTP. Meyu Muluke woreda, East Hararghe province, Ethiopia. February-June 2013
0%
5%
10%
15%
20%
25%
30%
0 1 2 3 4 5 6 7 8 9 10 11 12 13 14 15 > 15
Per
cen
tage
Distance to the OTP (Km)
% OTP admissions
% Population
30
4.1.2. Qualitative data analysis
The qualitative methods used included focus groups, semi-structured and structured interviews, cases
studies and observations. Doing so revealed boosters and barriers. Interviews and focus groups were
conducted in villages across the Meyu Muluke woreda. Questionnaire guides were adapted and
oriented to facilitate the collection of data pertinent to program coverage and access. The
investigation team also elaborated a list of terminology in the local languages (Annex 4) related to
malnutrition and the RUTF. Qualitative data was triangulated by both method and source.
All findings were indexed daily into the three-pane BBQ framework (complete BBQ can be found in
Annex 5). Table 1 lists the sources and methods used during qualitative data collection. Questions
("Q") that appeared along stage one were analysed and resolved within days.
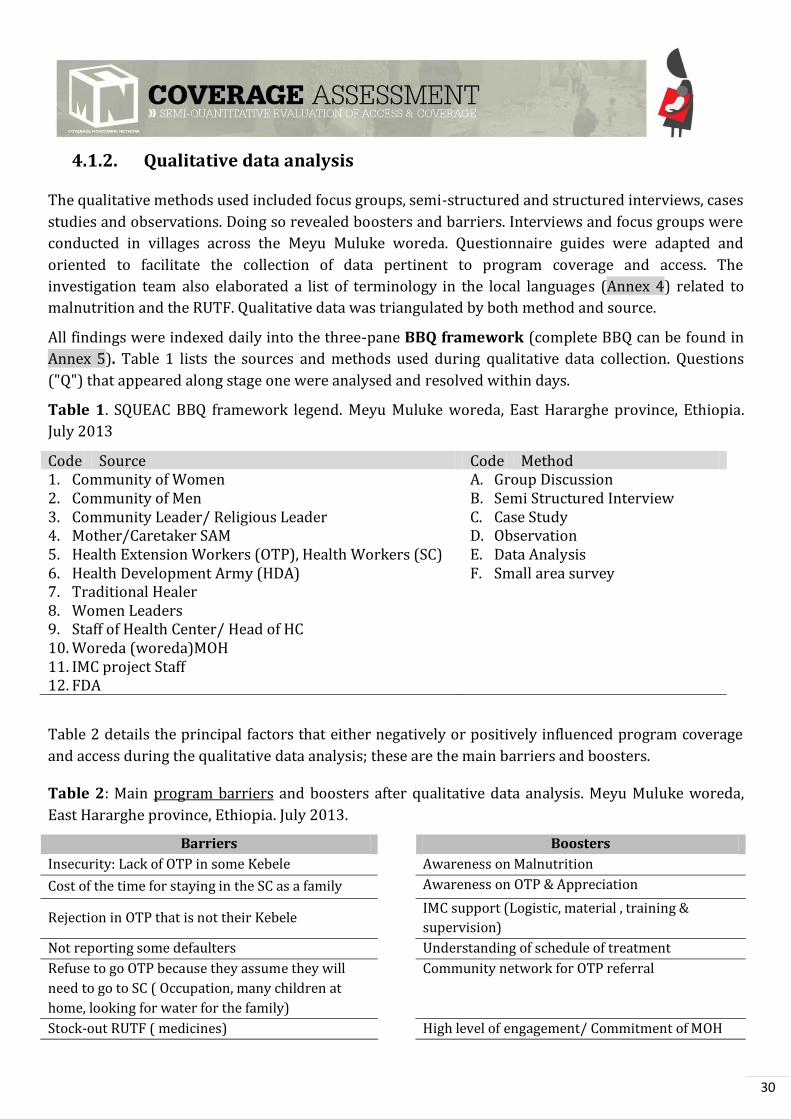
Table 1. SQUEAC BBQ framework legend. Meyu Muluke woreda, East Hararghe province, Ethiopia.
July 2013
Code Source Code Method 1. Community of Women 2. Community of Men 3. Community Leader/ Religious Leader 4. Mother/Caretaker SAM 5. Health Extension Workers (OTP), Health Workers (SC) 6. Health Development Army (HDA) 7. Traditional Healer 8. Women Leaders 9. Staff of Health Center/ Head of HC 10. Woreda (woreda)MOH 11. IMC project Staff 12. FDA
A. Group Discussion B. Semi Structured Interview C. Case Study D. Observation E. Data Analysis F. Small area survey
Table 2 details the principal factors that either negatively or positively influenced program coverage
and access during the qualitative data analysis; these are the main barriers and boosters.
Table 2: Main program barriers and boosters after qualitative data analysis. Meyu Muluke woreda,
East Hararghe province, Ethiopia. July 2013.
Barriers Boosters
Insecurity: Lack of OTP in some Kebele Awareness on Malnutrition
Cost of the time for staying in the SC as a family Awareness on OTP & Appreciation
Rejection in OTP that is not their Kebele IMC support (Logistic, material , training &
supervision)
Not reporting some defaulters Understanding of schedule of treatment
Refuse to go OTP because they assume they will
need to go to SC ( Occupation, many children at
home, looking for water for the family)
Community network for OTP referral
Stock-out RUTF ( medicines) High level of engagement/ Commitment of MOH
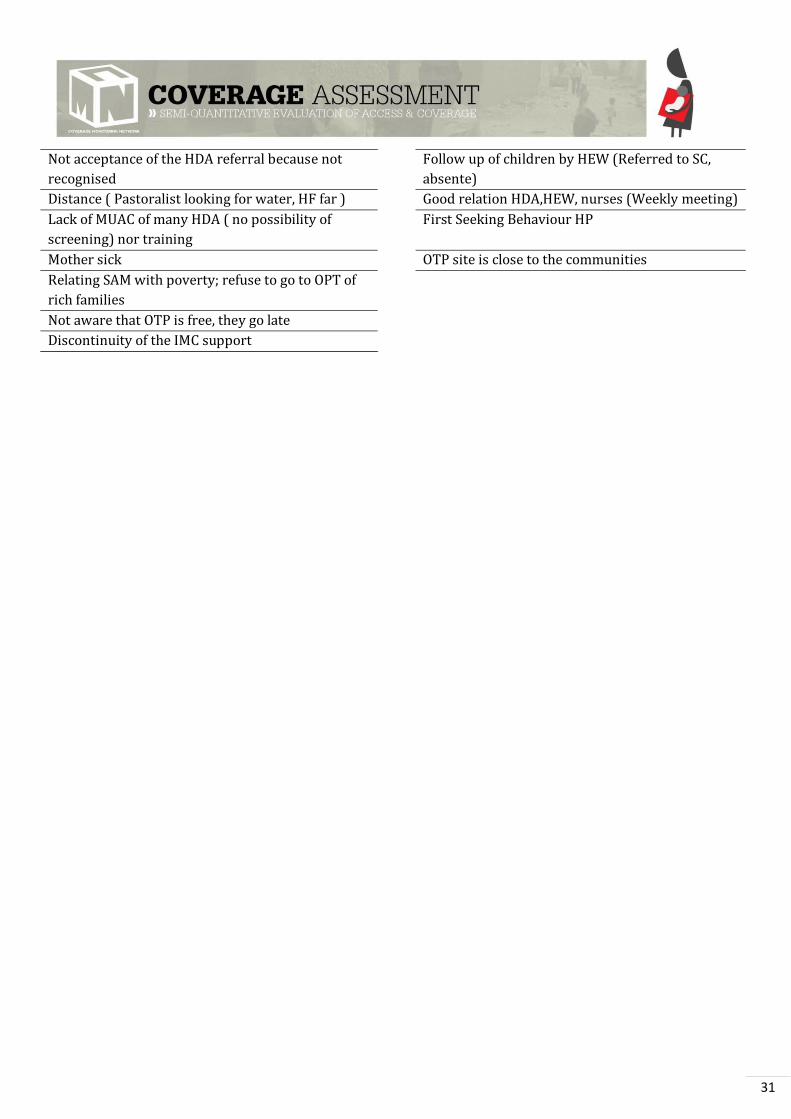
31
Not acceptance of the HDA referral because not
recognised
Follow up of children by HEW (Referred to SC,
absente)
Distance ( Pastoralist looking for water, HF far ) Good relation HDA,HEW, nurses (Weekly meeting)
Lack of MUAC of many HDA ( no possibility of
screening) nor training
First Seeking Behaviour HP
Mother sick OTP site is close to the communities
Relating SAM with poverty; refuse to go to OPT of
rich families
Not aware that OTP is free, they go late
Discontinuity of the IMC support
32
4.2. STAGE 2
This stage confirms the location of areas of high and low coverage and the reasons for coverage failure
identified in Stage 1 using small studies, small surveys, small-area surveys.
The routine program, quantitative and qualitative data collected in stage one, when combined, helped
identify areas within the intervention zone where coverage was likely to be either satisfactory or
unsatisfactory. This information was used to formulate hypotheses about coverage that were tested.
Small-area surveys methodology were used to test this hypotheses.
It was difficult for the team to identify areas of low coverage because areas with insecurity were the
ones identified as low coverage but they were not accessible. Analysis of number of admissions and
discharged cured with MUAC < 110 mm was finally chosen to be the factors for identifying low
coverage area.
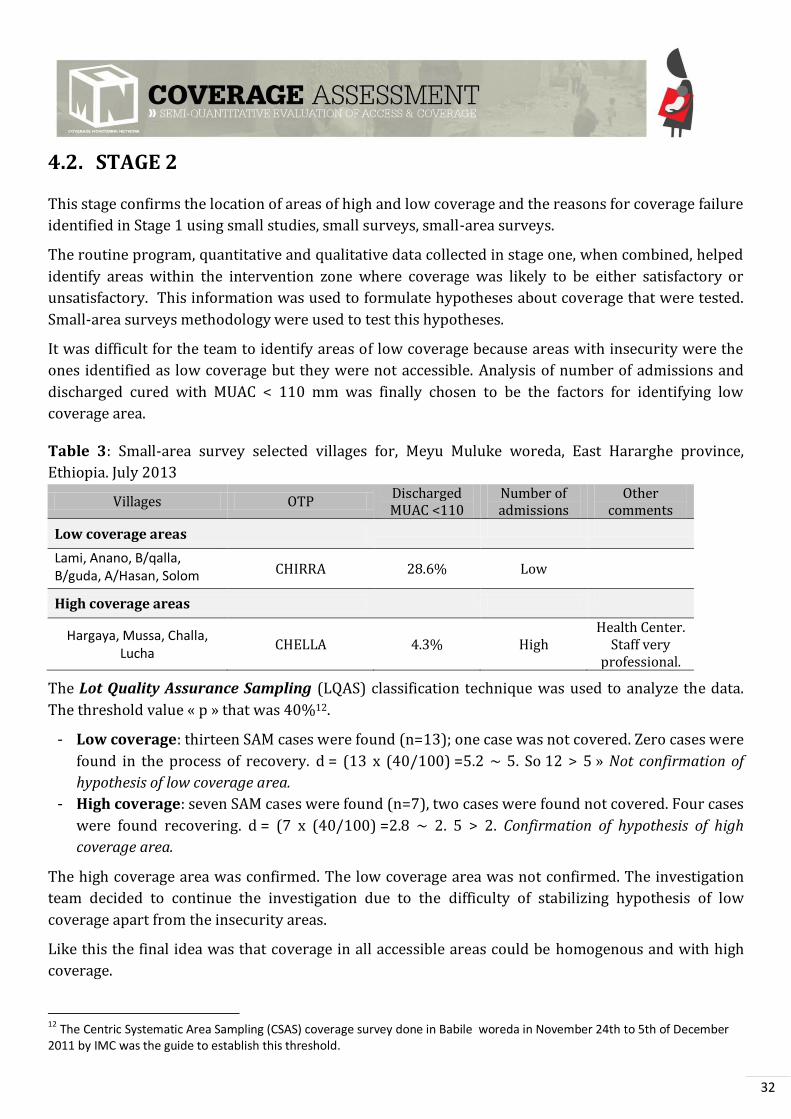
Table 3: Small-area survey selected villages for, Meyu Muluke woreda, East Hararghe province,
Ethiopia. July 2013
Villages OTP Discharged MUAC <110
Number of admissions
Other comments
Low coverage areas
Lami, Anano, B/qalla, B/guda, A/Hasan, Solom CHIRRA 28.6% Low
High coverage areas
Hargaya, Mussa, Challa, Lucha
CHELLA 4.3% High Health Center.
Staff very professional.
The Lot Quality Assurance Sampling (LQAS) classification technique was used to analyze the data.
The threshold value « p » that was 40%12.
- Low coverage: thirteen SAM cases were found (n=13); one case was not covered. Zero cases were
found in the process of recovery. d = (13 x (40/100) =5.2 ~ 5. So 12 > 5 » Not confirmation of
hypothesis of low coverage area.
- High coverage: seven SAM cases were found (n=7), two cases were found not covered. Four cases
were found recovering. d = (7 x (40/100) =2.8 ~ 2. 5 > 2. Confirmation of hypothesis of high
coverage area.
The high coverage area was confirmed. The low coverage area was not confirmed. The investigation
team decided to continue the investigation due to the difficulty of stabilizing hypothesis of low
coverage apart from the insecurity areas.
Like this the final idea was that coverage in all accessible areas could be homogenous and with high
coverage.
12 The Centric Systematic Area Sampling (CSAS) coverage survey done in Babile woreda in November 24th to 5th of December 2011 by IMC was the guide to establish this threshold.
33
4.3. STAGE 3
A. The prior
As explained in the methods, the prior mode for the SAM program was calculated using the mean of
the two coverage estimates: 1. The Weighed BBQ; 2. The histogram. Table 4 details the calculation of
the prior mode.
Table 4: SAM program prior probability mode calculation. Meyu Muluke woreda, East Hararghe
province, Ethiopia. July 2013
Method Boosters Barriers Calculation Résultat
Weighted BB(Q)
(Annex 513) 62 74 (62+ (100-74))/2 44.0%
Histogram N/A 55.5%
Prior mode 49.8%
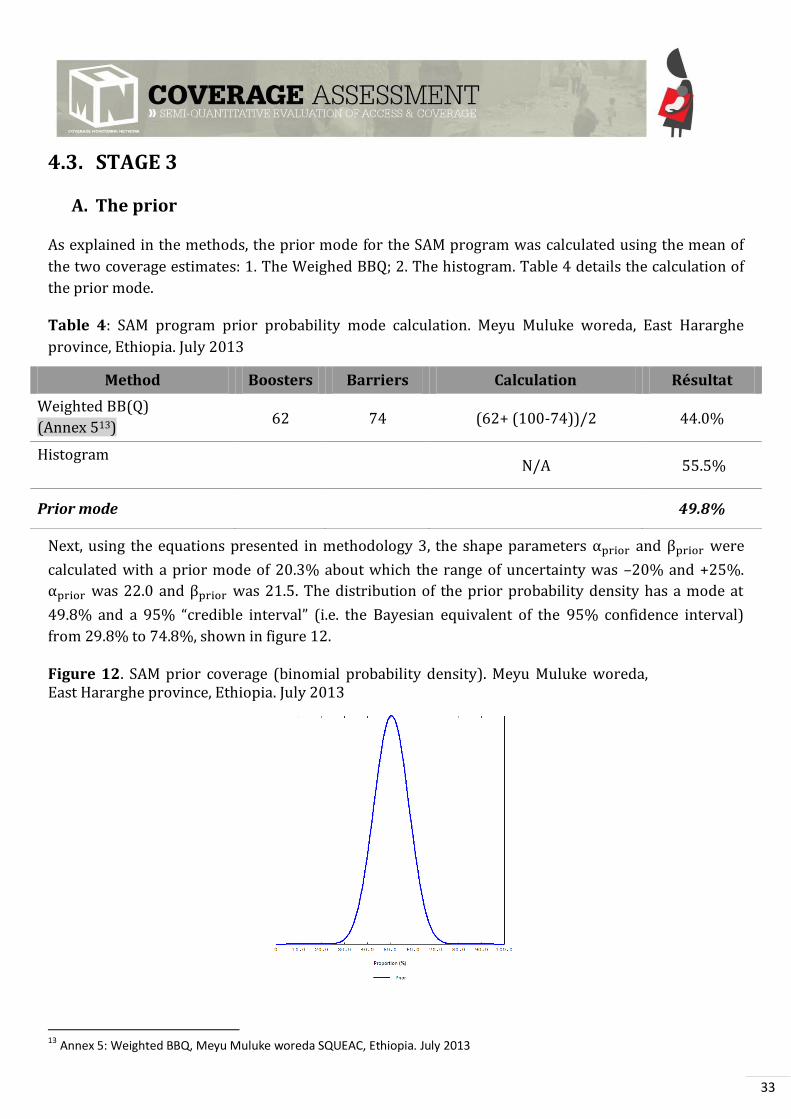
Next, using the equations presented in methodology 3, the shape parameters and were
calculated with a prior mode of 20.3% about which the range of uncertainty was –20% and +25%.
was 22.0 and was 21.5. The distribution of the prior probability density has a mode at
49.8% and a 5% “credible interval” (i.e. the Bayesian equivalent of the 95% confidence interval)
from 29.8% to 74.8%, shown in figure 12.
Figure 12. SAM prior coverage (binomial probability density). Meyu Muluke woreda, East Hararghe province, Ethiopia. July 2013
13
Annex 5: Weighted BBQ, Meyu Muluke woreda SQUEAC, Ethiopia. July 2013

34
Note: During the prior calculation due to a formula mistake the prior was designed as 52.8%. Both prior
results (the one with the mistake and the one presented) were very similar -48.8% vs 52.8%-. Alpha and
beta values were also very close ( 23.2 instead of 22.0 and 20.1 instead of 21.5). It has been
chosen to include in the report the correct prior calculation, which had no repercussion in the likelihood
sampling. All the rest of parameter (precision, selection of the villages) were the same.
B. The likelihood
Sample size
The sample size was calculated using the equation described in methodology (for the “n likelihood”).
In the present program the sample size for the likelihood survey used a precision of 0.14 (14%). The
minimum number of children to be sampled was 7.6 ~ 8 children.
The sample size was then translated into the minimum number of villages needing to be sampled to
achieve the sample size using the equation of “n villages” described in the methodology part.
With an estimated SAM prevalence of 0.5% in Meyu Muluke woreda and an average village population
of 401.0 inhabitants (14.8% of which approximately are between 6 and 59 months), the minimum
number of villages to be sampled was 25.4 (~25). They were randomly selected (described in
methodology).
Active case-finding
The 25 selected villages were divided up among the investigation team. Stage 3 lasted three days.
Villages selected in Stage 2 were taken away from the random selection.
In total, 29 SAM cases were identified. Twenty five of these children were covered and in an OTP. Four
children were non-covered cases. Thirteen recovering cases were found. It is important to note that 5
recovering cases reported a stock break out in their OTP
Table 5: Results of the SAM active case-finding. Meyu Muluke woreda, East Hararghe province,
Ethiopia. July 2013
SAM cases SAM covered
cases
SAM not
covered cases
Recovering
caes
29 25 4 13
A questionnaire was administered to caregivers of the 4 non-covered cases to find out the reason
(Annex 2). Of the 4 caregivers questioned, 100.0% realized their children were malnourished and
were aware of the OTP program, yet they choose not to bring their children to it as explained in figure
13.
35
Figure 13. Barriers to service uptake found by the likelihood survey. Meyu Muluke woreda, East
Hararghe province, Ethiopia. July 2013
None of the four non-covered cases were in the CMAM programme before.
The final precision from the likelihood of the 25 SAM children found was better than planned at 11.7%
and not 14.0% as planned.
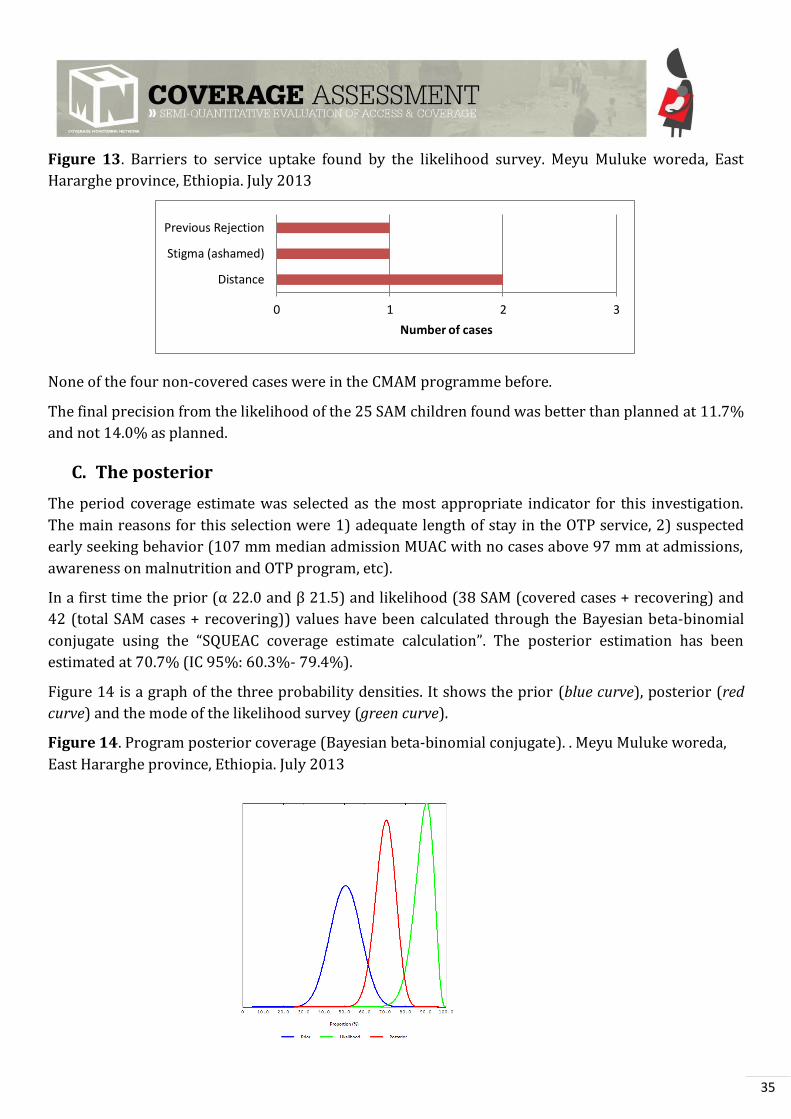
C. The posterior
The period coverage estimate was selected as the most appropriate indicator for this investigation.
The main reasons for this selection were 1) adequate length of stay in the OTP service, 2) suspected
early seeking behavior (107 mm median admission MUAC with no cases above 97 mm at admissions,
awareness on malnutrition and OTP program, etc).
In a first time the prior (α 22.0 and β 1.5) and likelihood (38 SAM (covered cases + recovering) and
42 (total SAM cases + recovering)) values have been calculated through the Bayesian beta-binomial
conjugate using the “SQUEAC coverage estimate calculation”. The posterior estimation has been
estimated at 70.7% (IC 95%: 60.3%- 79.4%).
Figure 14 is a graph of the three probability densities. It shows the prior (blue curve), posterior (red
curve) and the mode of the likelihood survey (green curve).
Figure 14. Program posterior coverage (Bayesian beta-binomial conjugate). . Meyu Muluke woreda,
East Hararghe province, Ethiopia. July 2013
0 1 2 3
Distance
Stigma (ashamed)
Previous Rejection
Number of cases
36
Visually, there is practically no overlap between the distributions of the prior and the likelihood
suggesting a conflict between the prior and likelihood. A z-test revealed that indeed there was a
conflict between the two (z = -4.0 and p = 0.0001), indicating that the combined analysis to calculate
the probability post is not appropriate. Therefore the posterior calculations are not valid and cannot be
considered.
This finding has been analyzed by RECO and Harar Nutrition Officer (SQUEAC field coordinator) and
some reasons have been highlighted:
- In the prior calculation:
o Information coming from areas not assessed in Stage 3 was included: insecurity. There
are 19 Kebeles and 12 had functioning OTP at the moment of the SQUEAC. Seven areas
were not accessible due to security problems (not OTP available in these area and
expected low coverage areas).
o Information about the periods of IMC not supporting the area was also included
(Discontinuity of the IMC support, Stock-out RUTF ( medicines))
- The BBQ doesn’t include the positive information obtained in stage : high coverage expected
in all accessible areas.
- In RECOs opinion, the weighted BBQ give a lot of weight to some barriers that are important
but should not have an impact in coverage to receive punctuations of 4 or 5. No technical
support could however be given during the weighing process because no internet/telephone
network was available.
Other factors could have also influenced this. The ones however identified are those described above.
It is important to remember the objectives of the SQUEAC investigation: to identify boosters and
barriers influencing CMAM program access and coverage to undertake specific action plan and
recommendations. In addition, to develop capacity of stakeholders on undertaking program coverage
assessments using SQUEAC methodology. The SQUEAC investigation in Meyu Muluke woreda has
achieved those goals.
In this situation, if the sample size permits, it is recommended to use only the data of the likelihood
evidence for estimating the posterior coverage. This can be done in two ways:
- Method 1: Using the SQUEAC Bayes calculation using values 1:1 for α and β. This makes prior
curve non informative. Like this 38 and 42 are the values for likelihood curve. Figure 15 shows
this calculation.
37
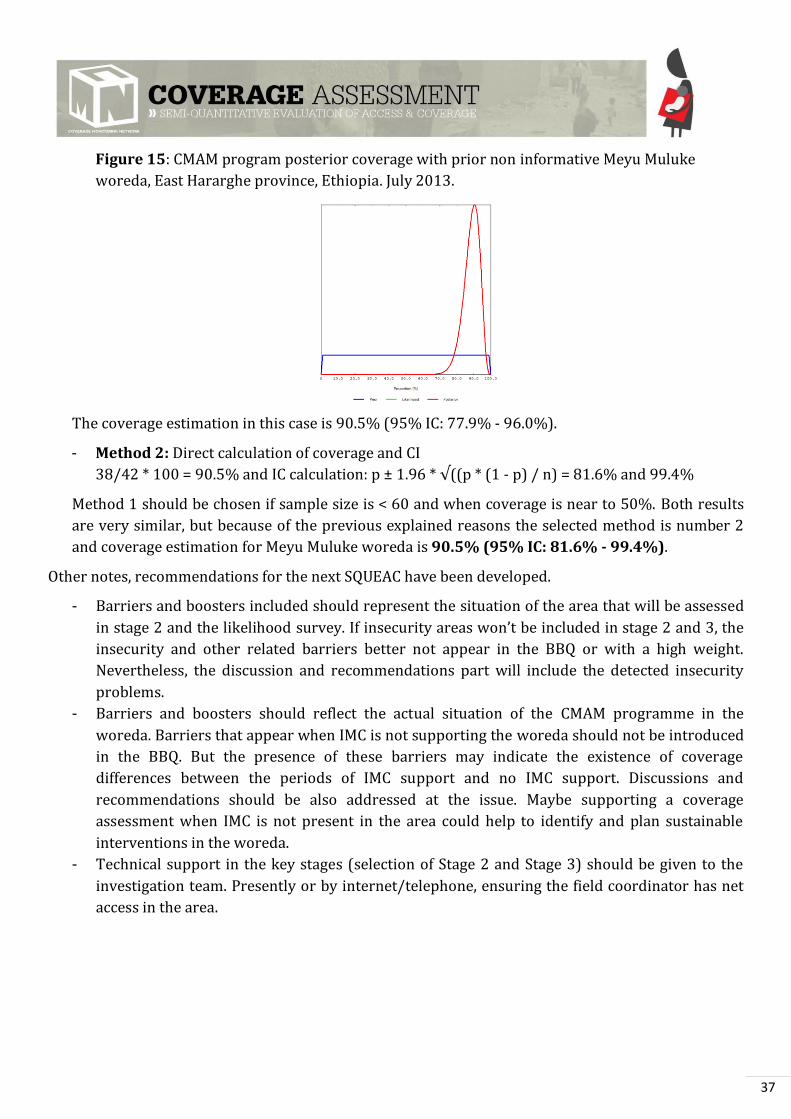
Figure 15: CMAM program posterior coverage with prior non informative Meyu Muluke
woreda, East Hararghe province, Ethiopia. July 2013.
The coverage estimation in this case is 90.5% (95% IC: 77.9% - 96.0%).
- Method 2: Direct calculation of coverage and CI
38/42 * 100 = 90.5% and IC calculation: p ± 1.96 * √((p * (1 - p) / n) = 81.6% and 99.4%
Method 1 should be chosen if sample size is < 60 and when coverage is near to 50%. Both results
are very similar, but because of the previous explained reasons the selected method is number 2
and coverage estimation for Meyu Muluke woreda is 90.5% (95% IC: 81.6% - 99.4%).
Other notes, recommendations for the next SQUEAC have been developed.
- Barriers and boosters included should represent the situation of the area that will be assessed
in stage 2 and the likelihood survey. If insecurity areas won’t be included in stage and 3, the
insecurity and other related barriers better not appear in the BBQ or with a high weight.
Nevertheless, the discussion and recommendations part will include the detected insecurity
problems.
- Barriers and boosters should reflect the actual situation of the CMAM programme in the
woreda. Barriers that appear when IMC is not supporting the woreda should not be introduced
in the BBQ. But the presence of these barriers may indicate the existence of coverage
differences between the periods of IMC support and no IMC support. Discussions and
recommendations should be also addressed at the issue. Maybe supporting a coverage
assessment when IMC is not present in the area could help to identify and plan sustainable
interventions in the woreda.
- Technical support in the key stages (selection of Stage 2 and Stage 3) should be given to the
investigation team. Presently or by internet/telephone, ensuring the field coordinator has net
access in the area.
38
5. DISCUSION
This SQUEAC investigation in Meyu Muluke woreda gave a period coverage estimate of 90.5% (95%
IC: 81.6% - 99.4%) for the accessible areas in the woreda (12 from 19 Kebeles).
A combination of positive factors identified during the SQUEAC allows the coverage and access in the
woreda to be very high:
- Ethiopian MoH commitment:
o National level: the MoH is implementing the innovative approach of the HDA at
community-level that are integrated in the health system strategy (one HDA per 4
households). This strategy allows SAM case detection and community mobilization.
They have also prioritize the inclusion of t traditional healers in the HAD. However
there are still windows for improvement: training, providing MUAC for all, etc.
o Woreda level: engagement of the health managers of the woreda. Active implication on
the CMAM programme and supporting IMC activities in the area (including high level of
participation in the SQUEAC).
o Number of health facilities and health posts per habitant: 1 per approximately 3,000
habitants in the secure areas.
- IMC support: at logistic, material, training & supervision level.
- Positive Awareness on malnutrition and the CMAM program by the community.
On the other side the periods without IMC support in the woreda have been identified by the MoH,
OTP and communities as periods where CMAM work is more difficult. It seems logistics could be the
biggest challenge for the MoH them while IMC is not supporting the area. This involves for example
RUTF transport in the area. As mentioned in limitations the mountain area and the roads situation
makes very difficult the deployment of stocks in the area without IMC support. Maybe advocacy for
making the Meyu Muluke woreda more accessible (road access, electricity) could help (but this is
medium/long term option not easy to do). Other problems for the periods where IMC is not
supporting were related to the decrease in supervision and trainings of the CNW (while IMC works in
the area they seem more engaged and motivated).
Strategies to avoid stock breakouts and other problems (reduced number of supervisions) during the
periods where IMC is not present in the area could be discussed to avoid the decrease in coverage and
quality of attention along these periods. The use of donkey cars (for RUTF transport) has been
proposed by IMC as a possible solution (already two donkeys have been donated to two HC on Meyu
Muluke woreda). Advocacy could be used to inform about the importance of this factors to achieve
high coverage and quality standards.
It would be a importantto have available data of admissions and performance indicators along the
years in the MoH and/or IMC database. IMC could support MoH on doing trends of admissions and
performance indicators. This could help in planning and prevention (for example in emergency
situations).

39
The performance indicators (cured, death, non-responders and defaulters) are all well above their
corresponding SPHERE standards. During stage 1 the investigation team was surprised and skeptical
about the 100% cured rate and stabilization of all OTP and SC cases. Some data quality issues have
been detected in one OTP. Generally though, the quality of data seems to be reflecting the real
situation. A good quality of care appears to be given to the SAM cases. Nevertheless, the discharged
cured with MUAC < 110 mm was a problem detected during the SQUEAC that needs to be addressed.
The number of bilateral pitting edema cases in the woreda appeared to be very high (27.6% of the
total OTP admissions). The investigation team tried to assess if this could be due to a late seeking
behavior or to the malnutrition type in the area etc. The finding suggests that is was more due to the
type of malnutrition in the area. It could be interesting to undertake an investigation of the causal
factors underlying this edema prevalence. A note which was not verified during the SQUEAC but
mentioned during it (IMC team and some members in the community), described some cases of
children with no admission criteria but with some signs of malnutrition (i.e. changes in hair color )
that lately became edema cases without MUAC < 110m. Some of these cases were referred by the
caregivers to the HF/HP but were not admitted initially.
During the SQUEAC it was discussed with IMC the fact that national guidelines are not using the new
WHO standards. The lead investigation of the report suggests revising the strategy and proposes
working on an advocacy strategy to adapt the admission criteria to the WHO 2005 standards (to be
able to reach all SAM children).
Barriers detected in the likelihood survey of stage 3 were distance, previous rejection and stigma.
Distance appeared mostly in the qualitative data collection related to the pastoralist population
looking for water or to distance to the health facility (but not in the quantitative data analyses related
to the village distance and admissions). Some mechanism could be used to reduce the impact of
distance, for example double ration (especially in specific periods of the year where pastoralist
population moves looking for water).
Previous rejection also appeared in stage 1. Some OTPs rejected cases from other areas, and also
some caregivers brought the children to the OTP and “felt” they were rejected. The application of new
WHO standards (which will be able to reach and treat more SAM children) and working on improving
the communication between health staff and caregivers could reduce the impact of “rejection” or
“perception of rejection”.
Stigma that causes shame of the caregiver appeared in one case of non-covered cases of Stage 3. In
stage 1, relating SAM with poverty was identified as a factor that could make caregivers refuse to go to
the OTP. Community sensitization or discussion on the topic could help to reduce this perception.
The biggest problem in the woreda already known by IMC and MoH (not on for the nutritional but for
all health interventions) is insecurity. From 19 woredas, 13 woredas have a functioning HF/HP in
their areas. Measures could be taken to support the HF/OTP in the insecurity borders. For example,
Alalo OTP is receiving many SAM cases from the insecure areas (where no OTP is running). Extra
support can be deployed to this area. The measures could be defined and developed with the
participation of all the key actors of the area (HAD, community, HF/HP staff, MoH and IMC). Also,
40
advocacy for peace keeping in the area could be interesting to facilitate health access of all the
population in the woreda.
41
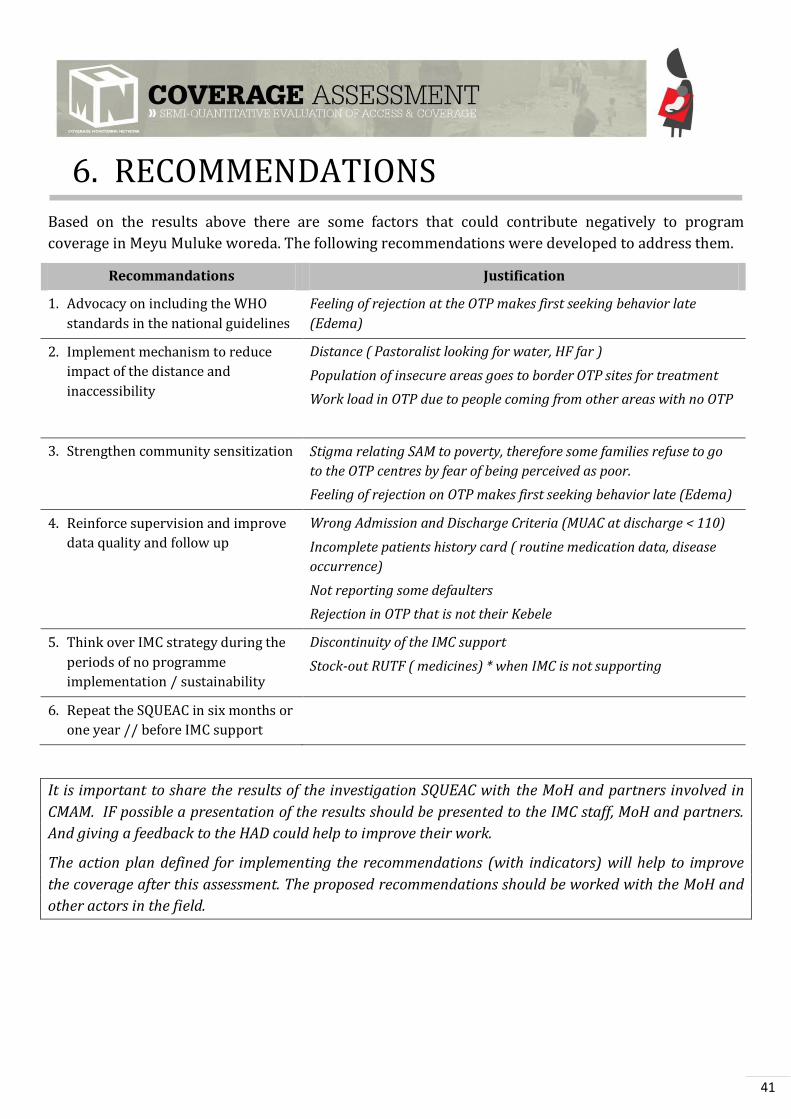
6. RECOMMENDATIONS
Based on the results above there are some factors that could contribute negatively to program
coverage in Meyu Muluke woreda. The following recommendations were developed to address them.
Recommandations Justification
1. Advocacy on including the WHO
standards in the national guidelines
Feeling of rejection at the OTP makes first seeking behavior late
(Edema)
2. Implement mechanism to reduce
impact of the distance and
inaccessibility
Distance ( Pastoralist looking for water, HF far )
Population of insecure areas goes to border OTP sites for treatment
Work load in OTP due to people coming from other areas with no OTP
3. Strengthen community sensitization Stigma relating SAM to poverty, therefore some families refuse to go
to the OTP centres by fear of being perceived as poor.
Feeling of rejection on OTP makes first seeking behavior late (Edema)
4. Reinforce supervision and improve
data quality and follow up
Wrong Admission and Discharge Criteria (MUAC at discharge < 110)
Incomplete patients history card ( routine medication data, disease
occurrence)
Not reporting some defaulters
Rejection in OTP that is not their Kebele
5. Think over IMC strategy during the
periods of no programme
implementation / sustainability
Discontinuity of the IMC support
Stock-out RUTF ( medicines) * when IMC is not supporting
6. Repeat the SQUEAC in six months or
one year // before IMC support
It is important to share the results of the investigation SQUEAC with the MoH and partners involved in
CMAM. IF possible a presentation of the results should be presented to the IMC staff, MoH and partners.
And giving a feedback to the HAD could help to improve their work.
The action plan defined for implementing the recommendations (with indicators) will help to improve
the coverage after this assessment. The proposed recommendations should be worked with the MoH and
other actors in the field.
42
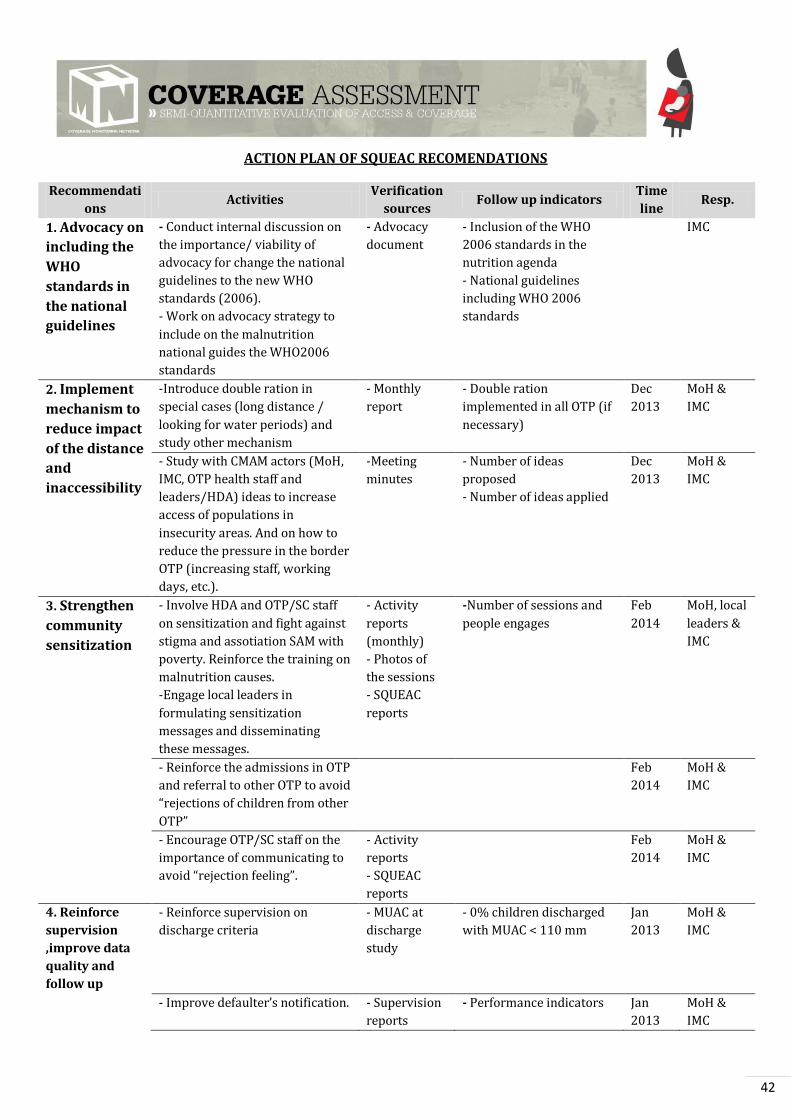
ACTION PLAN OF SQUEAC RECOMENDATIONS
Recommendati
ons Activities
Verification
sources Follow up indicators
Time
line Resp.
1. Advocacy on
including the
WHO
standards in
the national
guidelines
- Conduct internal discussion on
the importance/ viability of
advocacy for change the national
guidelines to the new WHO
standards (2006).
- Work on advocacy strategy to
include on the malnutrition
national guides the WHO2006
standards
- Advocacy
document
- Inclusion of the WHO
2006 standards in the
nutrition agenda
- National guidelines
including WHO 2006
standards
IMC
2. Implement
mechanism to
reduce impact
of the distance
and
inaccessibility
-Introduce double ration in
special cases (long distance /
looking for water periods) and
study other mechanism
- Monthly
report
- Double ration
implemented in all OTP (if
necessary)
Dec
2013
MoH &
IMC
- Study with CMAM actors (MoH,
IMC, OTP health staff and
leaders/HDA) ideas to increase
access of populations in
insecurity areas. And on how to
reduce the pressure in the border
OTP (increasing staff, working
days, etc.).
-Meeting
minutes
- Number of ideas
proposed
- Number of ideas applied
Dec
2013
MoH &
IMC
3. Strengthen
community
sensitization
- Involve HDA and OTP/SC staff
on sensitization and fight against
stigma and assotiation SAM with
poverty. Reinforce the training on
malnutrition causes.
-Engage local leaders in
formulating sensitization
messages and disseminating
these messages.
- Activity
reports
(monthly)
- Photos of
the sessions
- SQUEAC
reports
-Number of sessions and
people engages
Feb
2014
MoH, local
leaders &
IMC
- Reinforce the admissions in OTP
and referral to other OTP to avoid
“rejections of children from other
OTP”
Feb
2014
MoH &
IMC
- Encourage OTP/SC staff on the
importance of communicating to
avoid “rejection feeling”.
- Activity
reports
- SQUEAC
reports
Feb
2014
MoH &
IMC
4. Reinforce
supervision
,improve data
quality and
follow up
- Reinforce supervision on
discharge criteria
- MUAC at
discharge
study
- 0% children discharged
with MUAC < 110 mm
Jan
2013
MoH &
IMC
- Improve defaulter’s notification. - Supervision
reports
- Performance indicators Jan
2013
MoH &
IMC
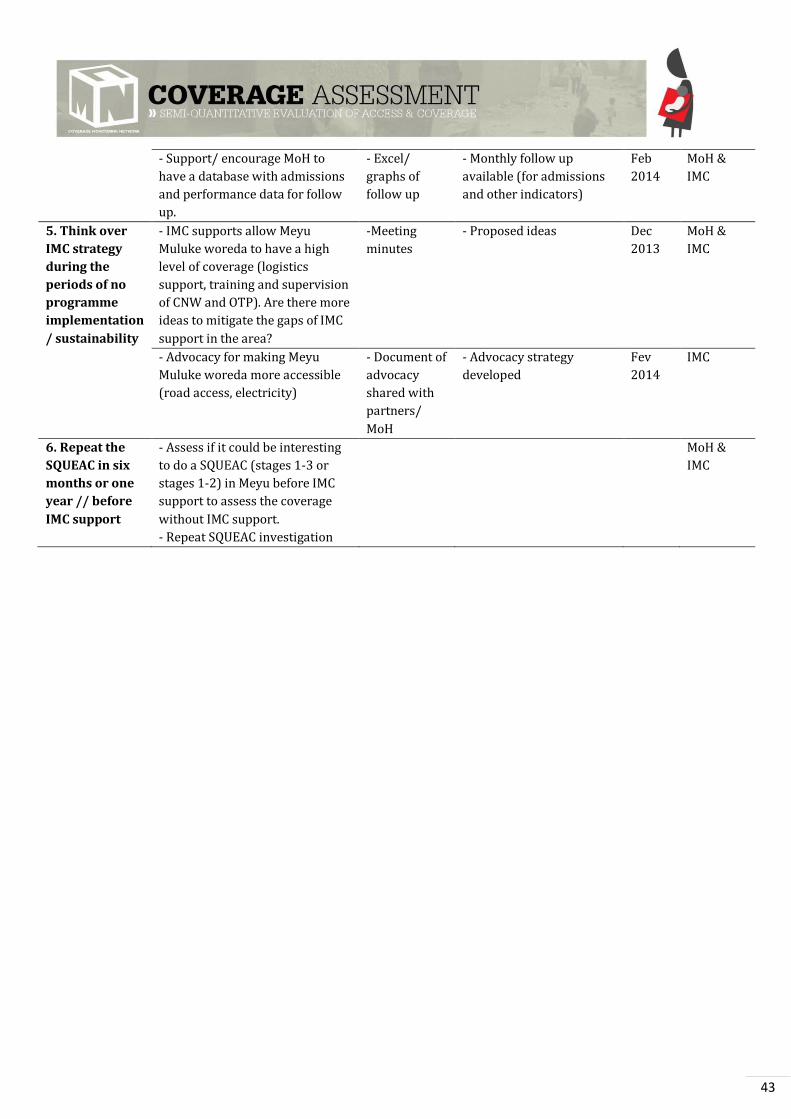
43
- Support/ encourage MoH to
have a database with admissions
and performance data for follow
up.
- Excel/
graphs of
follow up
- Monthly follow up
available (for admissions
and other indicators)
Feb
2014
MoH &
IMC
5. Think over
IMC strategy
during the
periods of no
programme
implementation
/ sustainability
- IMC supports allow Meyu
Muluke woreda to have a high
level of coverage (logistics
support, training and supervision
of CNW and OTP). Are there more
ideas to mitigate the gaps of IMC
support in the area?
-Meeting
minutes
- Proposed ideas Dec
2013
MoH &
IMC
- Advocacy for making Meyu
Muluke woreda more accessible
(road access, electricity)
- Document of
advocacy
shared with
partners/
MoH
- Advocacy strategy
developed
Fev
2014
IMC
6. Repeat the
SQUEAC in six
months or one
year // before
IMC support
- Assess if it could be interesting
to do a SQUEAC (stages 1-3 or
stages 1-2) in Meyu before IMC
support to assess the coverage
without IMC support.
- Repeat SQUEAC investigation
MoH &
IMC

44
Annex 1 : Survey questionnaire for current SAM children NOT in the program
1. DO YOU THINK YOU CHILD IS SICK? ____ if yes: WHICH DISEASE?_________________________________________
2. DO YOU THINK YOUR CHILD IS MALNOURISHED (local word to describe it)?
YES NO (STOP)
3. DO YOU KNOW OF A PROGRAM THAT CAN HELP MALNOURISHED CHILDREN? YES NO (STOP)
If yes, what is the name of the program? _____________________________________________
4. WHY YOUR CHILD IS CURRENTLY NOT ENROLLED IN THE PROGRAM? Do NOT prompt Ask “Anything else?” Several answers are possible Answers Tick Notes
. No time/ Too busy (what is the caretakers’s occupation? _______________)
2. OTP site too far away (how long does it take to walk? _____________)
3. There is no one else who can take care of the other siblings
4. No money for the treatment
5. The child has been previously rejected (When? ___________approximately)
6. Has been to the clinic but the child was not referred (When? ___________ approximately)
7. I do not think the program can help the child (prefer traditional healer, etc.)
8. Waiting time too long
9. Mother feels ashamed or shy about coming
10. Mother sick
11. Spouse does not allow
12. Other reasons (specify) :
5. WAS YOUR CHILD PREVIOUSLY ADMITTED TO THE OTP PROGRAM?
YES NO (→ stop !)
If yes, why is he/ she not enrolled anymore ?
Defaulted : When ? ________________ Why ?____________________________________
Condition improved and discharged by the program : When ? ______________
Discharged while he has not recovered : When ? ______________
Other : _____________________________________________________
Thank the caretaker and give a referral slip. Inform the caretaker of the OTP and date to attend
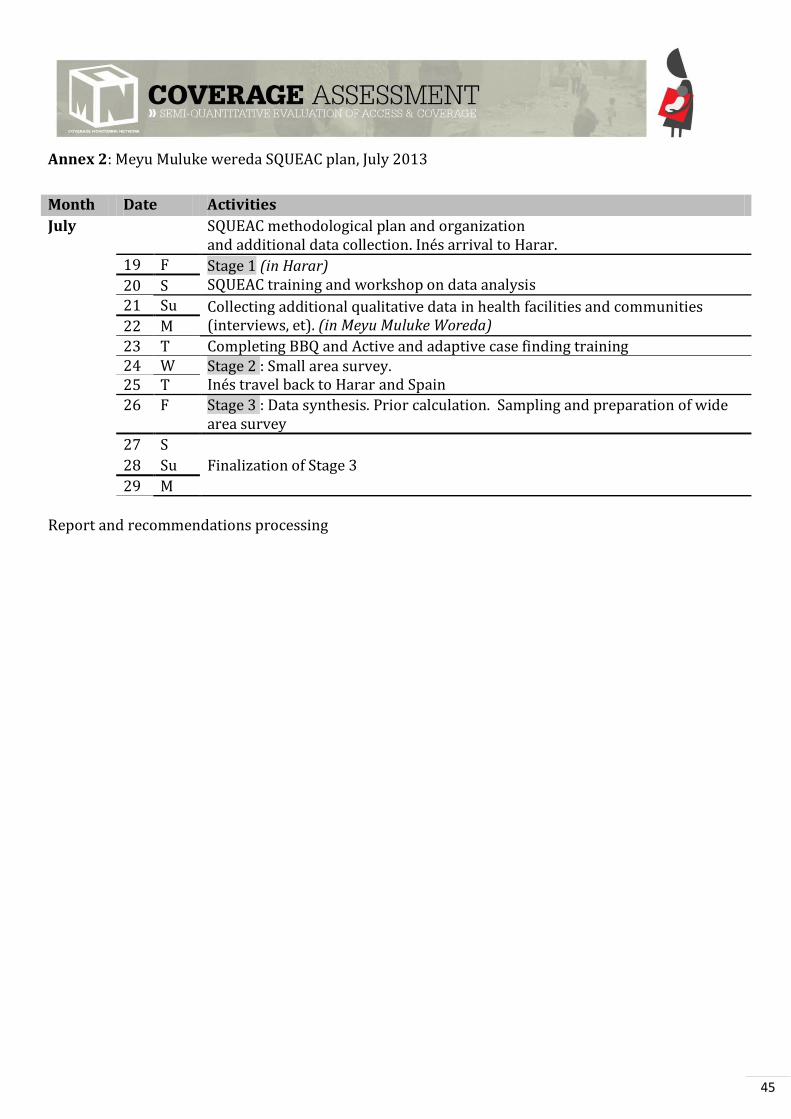
45
Annex 2: Meyu Muluke wereda SQUEAC plan, July 2013
Month Date Activities
July SQUEAC methodological plan and organization and additional data collection. Inés arrival to Harar.
19 F Stage 1 (in Harar) SQUEAC training and workshop on data analysis 20 S
21 Su Collecting additional qualitative data in health facilities and communities (interviews, et). (in Meyu Muluke Woreda) 22 M
23 T Completing BBQ and Active and adaptive case finding training 24 W Stage 2 : Small area survey.
Inés travel back to Harar and Spain 25 T
26 F Stage 3 : Data synthesis. Prior calculation. Sampling and preparation of wide area survey
27 S
Finalization of Stage 3 28 Su
29 M
Report and recommendations processing
46
Annex 3 : SQUEAC Survey team
SQUEAC coordinators (2 women, 100% of women)
INES ZUZA SANTACILIA, Regional Advisor, CMN Project
AIMAZ TASISA, Nutrition Officer, Harar, IMC
Evaluation team (1 women, 9 men, 90% of men)
SHEWANGIZAW MOTUMA, Meyy CMAM supervisor, IMC
DANIEL SISAY, Nutritional Focal Person in Meyu Muluke woreda health office, MoH Ethiopia
ISKENDER MOHAMED, EPI focal person Meyu Muluke woreda health office, MoH Ethiopia
ABDULAHI AHMED, Chella Health Center, MoH Ethiopia
ANEDENET ESHETU, Nutritional Survey Field Worker
ASHENAFI DOLEBO, TBI/HIV focal Person Meyu Muluke woreda health office, MoH Ethiopia
MUSSA ISMAE, Targeted Supplementary Feeding Programmes (TSFP) Team Leader, IMC
BODENA FEDA, T.S.F.P. Team Leader, IMC
MEAZA GARDIE, T.S.F.P. Team Leader, IMC
MISRAC BEKELLE, T.S.F.P. Team Leader, IMC
People involved in the evaluation team that have participated at some stages
(2 men, 100% of men)
BEKA TESHOME, National Nutrition Manager, IMC
EZANA TESFAYE ZEMO, MoH Australia
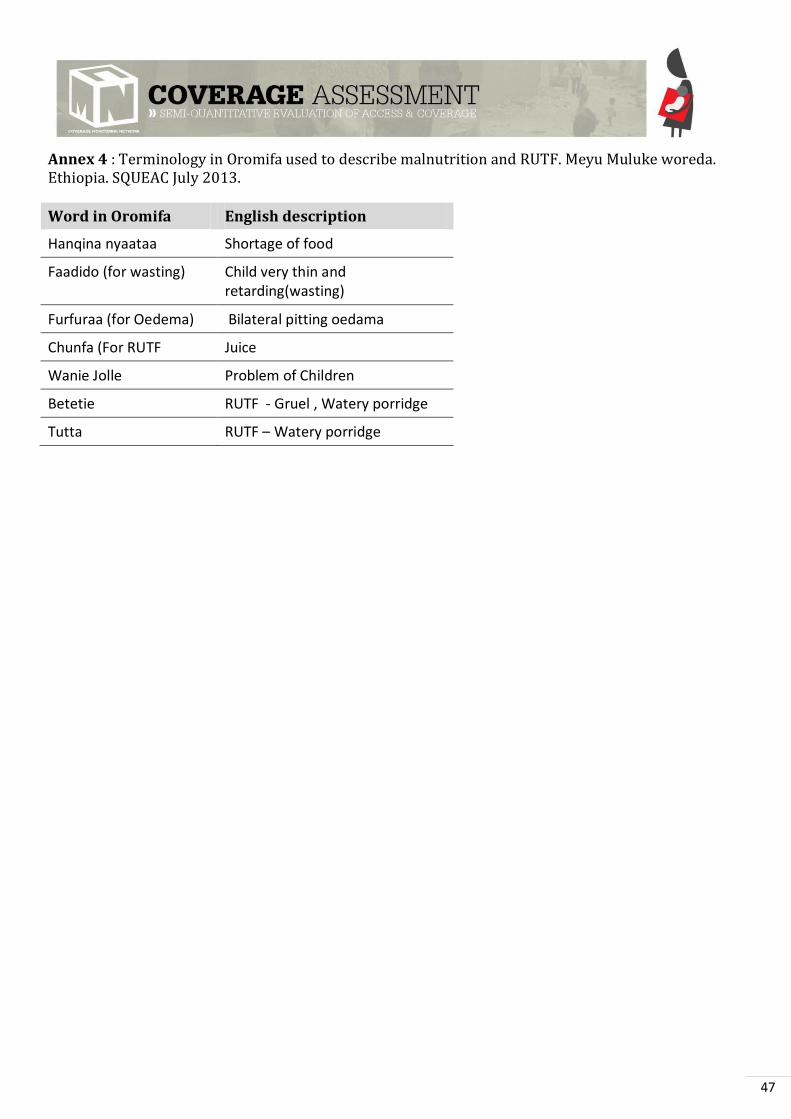
47
Annex 4 : Terminology in Oromifa used to describe malnutrition and RUTF. Meyu Muluke woreda. Ethiopia. SQUEAC July 2013.
Word in Oromifa English description
Hanqina nyaataa Shortage of food
Faadido (for wasting) Child very thin and retarding(wasting)
Furfuraa (for Oedema) Bilateral pitting oedama
Chunfa (For RUTF Juice
Wanie Jolle Problem of Children
Betetie RUTF - Gruel , Watery porridge
Tutta RUTF Watery porridge
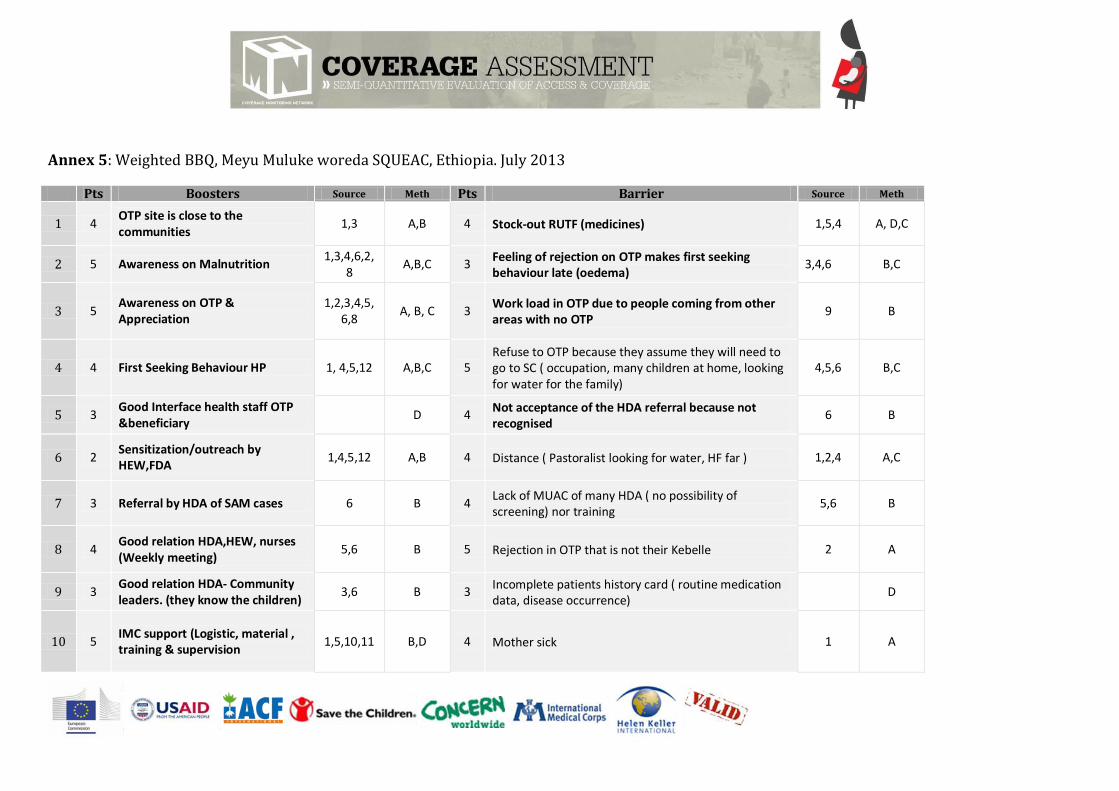
Annex 5: Weighted BBQ, Meyu Muluke woreda SQUEAC, Ethiopia. July 2013
Pts Boosters Source Meth Pts Barrier Source Meth
1 4 OTP site is close to the communities
1,3 A,B 4 Stock-out RUTF (medicines) 1,5,4 A, D,C
2 5 Awareness on Malnutrition 1,3,4,6,2,
8 A,B,C 3
Feeling of rejection on OTP makes first seeking behaviour late (oedema)
3,4,6 B,C
3 5 Awareness on OTP & Appreciation
1,2,3,4,5,6,8
A, B, C 3 Work load in OTP due to people coming from other
areas with no OTP 9 B
4 4 First Seeking Behaviour HP 1, 4,5,12 A,B,C 5 Refuse to OTP because they assume they will need to
go to SC ( occupation, many children at home, looking for water for the family)
4,5,6 B,C
5 3 Good Interface health staff OTP &beneficiary
D 4 Not acceptance of the HDA referral because not
recognised 6 B
6 2 Sensitization/outreach by HEW,FDA
1,4,5,12 A,B 4 Distance ( Pastoralist looking for water, HF far ) 1,2,4 A,C
7 3 Referral by HDA of SAM cases 6 B 4 Lack of MUAC of many HDA ( no possibility of
screening) nor training 5,6 B
8 4 Good relation HDA,HEW, nurses (Weekly meeting)
5,6 B 5 Rejection in OTP that is not their Kebelle 2 A
9 3 Good relation HDA- Community leaders. (they know the children)
3,6 B 3 Incomplete patients history card ( routine medication
data, disease occurrence) D
10 5 IMC support (Logistic, material , training & supervision
1,5,10,11 B,D 4 Mother sick 1 A
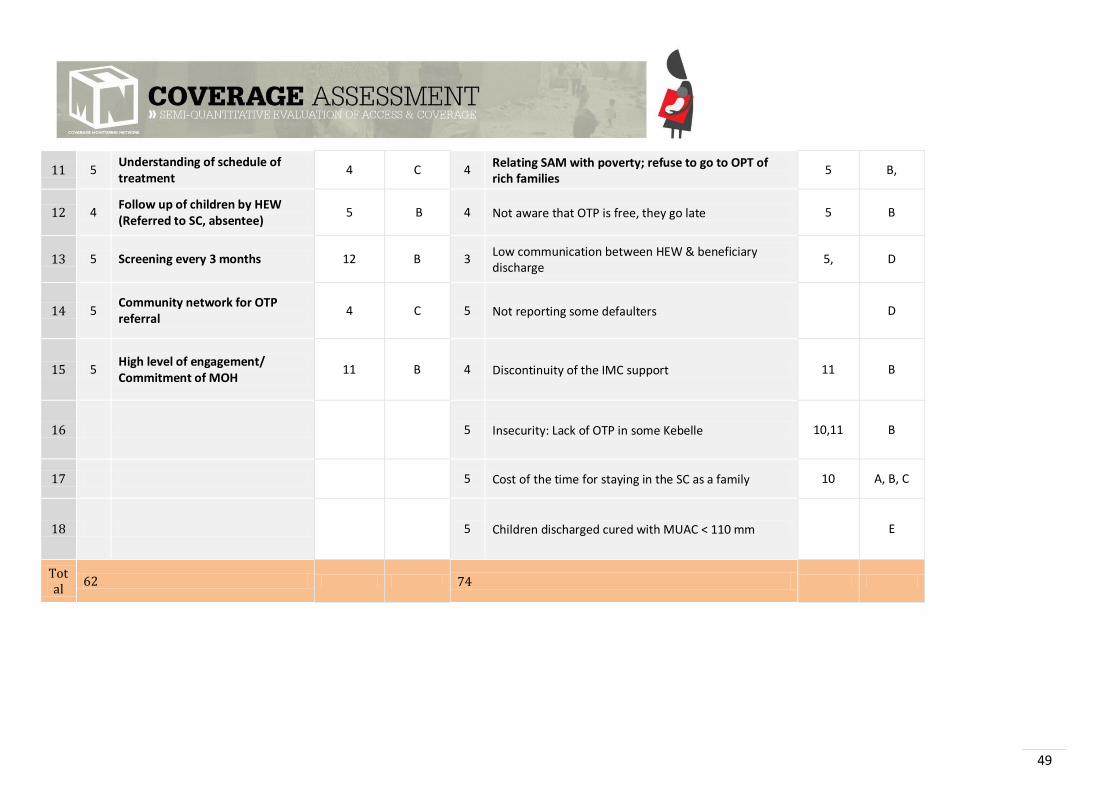
49
11 5 Understanding of schedule of treatment
4 C 4 Relating SAM with poverty; refuse to go to OPT of
rich families 5 B,
12 4 Follow up of children by HEW (Referred to SC, absentee)
5 B 4 Not aware that OTP is free, they go late 5 B
13 5 Screening every 3 months 12 B 3 Low communication between HEW & beneficiary
discharge 5, D
14 5 Community network for OTP referral
4 C 5 Not reporting some defaulters D
15 5 High level of engagement/ Commitment of MOH
11 B 4 Discontinuity of the IMC support 11 B
16 5 Insecurity: Lack of OTP in some Kebelle 10,11 B
17 5 Cost of the time for staying in the SC as a family 10 A, B, C
18 5 Children discharged cured with MUAC < 110 mm E
Total
62 74