mf pointer may issue 89 - ventura1.com pointer may issue 89.pdfft india life stage fofs-40 51.61...
TRANSCRIPT

MF POINTERFor Private Circulation only
Be(a)ware of Ponzi Schemes
Issue - 89 May, 2013
Global Indices
Benchmark Closing 1 Month
(%Change)
Bovespa 55108 4.1
CAC 40 3954 6.6
DAX 8279 7.3
Dow Jones 15118 3.6
FTSE 100 6625 4.4
Hang Seng 23321 7.1
Nikkei 225 14608 10
Shanghai Composite 2247 3
(continued on page 2)
May, 2013 Smart investing starts here 1
Equity Market
Global Equities
• For the month ended 12th May 2013, global equity indices ended in the green amidst hopes of the reviving US economy.
• U.S. equity markets moved higher to close at 15091.68 (Dow Jones) up by 1.7% in April, with only small-cap shares showing weakness. A range of economic reports suggested that the U.S. economy is moving ahead but at a slow pace. U.S. GDP rose by 2.5% in the first three months of the year, driven largely by a pick-up in consumer spending. Unemployment remains high, the housing market shows signs of recovery in many areas, and inflation is subdued. Corporate earnings growth has been relatively good. The general environment has been favorable enough to sustain strong stock market returns.
• The European Central Bank has cut its main interest rate from 0.75% to 0.5% as the bank seeks ways to stimulate growth in the euro zone. The euro zone's recession, the accelerating downturn in Germany, still-tight credit conditions, and falling inflation has supported monetary easing in the euro zone. The euro zone's consumer price growth eased to 1.2% (year on year) in April and remained below the ECB's target, while the jobless rate jumped to 12.1% in March. More interest rate cuts are possible if conditions deteriorate further. The unemployment rate in the euro zone rose to 12.1% in March from 12% a month earlier. The number of people out of work rose by 62,000 because of a weakening economy and fiscal consolidation across the region The FTSE 100 index rose by 3.76% to 6631.80.
• On the commodities front, Brent crude oil prices rose to $103.91 a barrel for the month ended 12th May 2013 thereby reversing the trend followed by it in the last few months. Brent crude settled higher as tensions in the Middle East receded, leaving rising global fuel supplies and faltering demand to weigh on prices.
MF POINTER
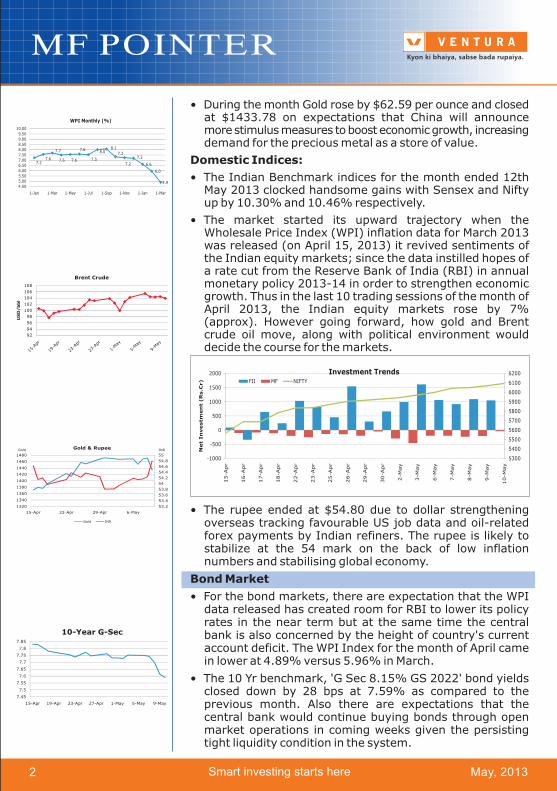
• During the month Gold rose by $62.59 per ounce and closed at $1433.78 on expectations that China will announce more stimulus measures to boost economic growth, increasing demand for the precious metal as a store of value.
Domestic Indices:
• The Indian Benchmark indices for the month ended 12th May 2013 clocked handsome gains with Sensex and Nifty up by 10.30% and 10.46% respectively.
• The market started its upward trajectory when the Wholesale Price Index (WPI) inflation data for March 2013 was released (on April 15, 2013) it revived sentiments of the Indian equity markets; since the data instilled hopes of a rate cut from the Reserve Bank of India (RBI) in annual monetary policy 2013-14 in order to strengthen economic growth. Thus in the last 10 trading sessions of the month of April 2013, the Indian equity markets rose by 7% (approx). However going forward, how gold and Brent crude oil move, along with political environment would decide the course for the markets.
• The rupee ended at $54.80 due to dollar strengthening overseas tracking favourable US job data and oil-related forex payments by Indian refiners. The rupee is likely to stabilize at the 54 mark on the back of low inflation numbers and stabilising global economy.
Bond Market
• For the bond markets, there are expectation that the WPI data released has created room for RBI to lower its policy rates in the near term but at the same time the central bank is also concerned by the height of country's current account deficit. The WPI Index for the month of April came in lower at 4.89% versus 5.96% in March.
• The 10 Yr benchmark, 'G Sec 8.15% GS 2022' bond yields closed down by 28 bps at 7.59% as compared to the previous month. Also there are expectations that the central bank would continue buying bonds through open market operations in coming weeks given the persisting tight liquidity condition in the system.
May, 2013Smart investing starts here2

MF POINTER
May, 2013 Smart investing starts here 3
Top 5/Bottom 5
Equity Schemes
Top Performers Under Performers
Absolute Absolute Scheme Name Returns(1M) Scheme Name Returns(1M)
ICICI Pru FMCG Fund 16.62 Birla SL CEF-Global Prec Metal -15.39
SBI FMCG Fund 16.41 DSPBR World Gold Fund -13.98
GS Bank BeES 14.59 PineBridge World Gold Fund -10.36
UTI Banking Sector Fund 13.75 Franklin Infotech Fund -8.73
Baroda Pioneer Bkg & Fin Serv Fund 13.72 SBI Infotech Fund -7.22
Debt Schemes
Top Performers Under Performers
Annualised AnnualisedScheme Name Returns(1M) Scheme Name Returns(1M)
FT India Life Stage FOFs-40 51.61 Tata FIPF A1 0.90
Templeton India G-Sec-LTP 48.76 Taurus Gilt 5.22
Templeton India G-Sec-PF 47.32 Daiwa Govt Sec Fund-STP 5.50
Templeton India G-Sec-Comp 47.31 GS ST 6.49
Tata Gilt RIP 44.51 Birla SL G-Sec-ST 6.51
* Returns as on 10th May 2013
Category Returns: For the month ended 12th May 2013 a majority of the sector funds gave positive returns. Banking sector gained more than 12%, whereas ELSS, Diversified and Infrastructure rose between 7 to 8%. Gold Funds was the only category that gave negative returns which declined by 7.14%.
* Returns as on 10th May 2013

MF POINTER
May, 2013Smart investing starts here4
A lot has been appearing recently in the news about Ponzi schemes. What is this all about?
Charles Ponzi, the man on whom Ponzi schemes have been named, has been dead for more than 60 years but the legacy of the scheming goes on.
Let us first try and understand what a Ponzi scheme is about.
A Ponzi scheme is a fraudulent investment operation that pays returns to its investors from their own money or the money paid by subsequent investors, rather than from profit earned by the individual or organization running the operation. Thus the payment to first person to exit is paid by the new entrant and so on.
Another characteristic of a Ponzi scheme is that the operators in the scheme influence investors to roll over the profits into the next investment cycle. So the returns remain only on paper. Hence the money remains with the operator and the Ponzi scheme keeps on running.
Charles Ponzi, an Italian immigrant into the US, promised investors in Boston that he would double their money in 90 days. (i.e. 100% return)
The scheme had 40,000 investors who had invested around $ 15 million ($ 174.45 million in today's term) in the scheme. Ponzi kept his investors happy by using money brought in by the new investors to pay off the old investors who wanted to redeem their investment.
Ponzi promised a 100% return to his investors in 90 days. But Sergei Mavrodi has managed to do even better than Ponzi. His scheme MMM India (Mavrodi Mondial Moneybox) is telling investors that their deposits will grow at 100% per month. So if he were true this is how the investment would grow.
Be(a)ware of Ponzi SchemesBe(a)ware of Ponzi Schemes
Deposit Rs. 5000 100% return
Today 15th May 2013 Rs. 5,000
After 1 month 15th June 2013 Rs. 11,003
After 6 months 15th Nov 2013 Rs. 437,401
After 9 months 15th Feb 2014 Rs. 38,53,784
After 1 Year 15th May 2014 Rs. 3,39,54,878
Yes, an investment of Rs. 5000 will grow nearly Rs. 3.4 Crores in 1 year. MMM also came with one more scheme of 10% per week return. These are abnormal returns. We cannot expect these kind of returns in equity market also. Yet many would fall for this lure!
There is a long history of such scams all over the world and unfortunately little lessons seem to have been learnt. Greed has ensured that these schemes thrive across the world and year on year, like the recent Saradha Group scam being the latest.
Let us see some more examples
è Between 1970 and 1984 in Portugal, Dona Branca maintained a scheme that paid 10% monthly interest. In 1988, she was sentenced to 10 years in prison. She always claimed that she was only trying to help the poor, but in her trial it was proven that she had received the equivalent of almost $120 million

MF POINTER
May, 2013 Smart investing starts here 5
è
è
è
In 1899 William "520 Percent" Miller opened for business as the "Franklin Syndicate" in Brooklyn, New York. Miller promised 10% a week interest and exploited some of the main themes of Ponzi schemes such as customers reinvesting the interest they made. He defrauded buyers out of $1 million.
In 1998, Anubhav teak-plantation, was involved in the timeshare, finance, and real estate businesses. These companies were backed by a nationwide infrastructure of 91 offices and over 1,800 employees.
In 2011, Speak Asia Foundation, posing as an e-survey firm, lured investors to fill up the survey and said in turn they would get huge returns, they have found the firm duped investors to the tune of apprx. Rs 2,200 crores.
and so on .….
Why do people invest in these kind of firms? Because we want to make ease and faster money instead of mere 10 to 15% pa return in a fixed income. Whereas these kind of ponzi schemes pay(on paper) 40 to 50% interest. So it is obvious that one will get attracted to these kind of schemes. The obvious question will come in our mind is... to stay away from these kind of schemes first we have to identify them, how to spot these schemes as laymen?
1. High Guaranteed Returns: Any scheme promising abnormally higher returns (higher than risk-free market rate of return) that too with guarantee comes in doubtful category. Most of the people fall prey to these schemes purely because of greed & herd mentality. Greed is our biggest villain while investing. Therefore, anything that shows more than 25% p.a. return deserves to be in the doubtful category. Please note higher returns means higher risk. Take the Gold Sukh case where the promoter promised 150% returns in 18 months. A fixed deposit would take over 10 years (at 9%) to deliver that. Nor did gold deliver such returns in that period.
2. No Risk: If promoters promote the product as no risk product, that is a red signal for you. We cannot expect anything without any risk. There is no free lunch. For eg. A NCD by a real estate company offers interest @ 16% p.a. but HDFC offers fixed deposit @ 9.15% for 3 years. Do we need any explanation to understand which one is risky and which one is safer?
3. High initial investment: As Ponzi schemes seldom have their own capital, they would depend on investors to invest a good sum in the beginning or in a matter of few instalments. Gold Sukh had 3 such plans of Rs 23,000, Rs 1.2 lakh and Rs 6 lakh. That is a large sum for a retail investor. Be wary of committing large sums in schemes outside the ambit of regular organized financial system.
A layman's guide to avoid Ponzi schemes
1. 8-15% returns p.a. for fixed income with guaranteed returns are reasonable. Anything more than 25% pa returns needs thorough investigation and advice of a professional.
2. Ensure that the Company be a public limited and preferably listed on the Stock Exchanges.
3. One should check the past (at least 3-5 years) performance of the company.
4. Registration of company with RBI if it is a NBFC is a must.
5. Ensure that the company has a proper business model.
To conclude, it is very easy to convince a person on a 100% guaranteed return product in 1 year but very difficult to convince someone on a 10% return product in 1 year.

MF POINTER
May, 2013Smart investing starts here6
• The fourth largest sector in the Indian economy is the fast moving consumer goods
(FMCG) Segment. The FMCG sector generated revenues worth US$ 34.8 billion in
2011. The industry expanded at a compound annual rate of 17.3 per cent during the
period 2006-11.
• Spending pattern of the Indian
FMCG market has witnessed a
radical shift.
• Growing young population and
rising disposable incomes clubbed
with brand consciousness has
resulted in the growing appetite for
premium products.
• Rural markets contributes about
33% to the total FMCG market.
• Popular stocks which form part of
the FMCG sector are ITC, Hindustan
Unilever, Marico, United Spirits, Dabur India, Emami etc.
Fast Moving Consumer Goods(FMCG)
Mutual Funds Performance - FMCG
Scheme Name NAV(Rs) 6 M 9 M 1 Yr 3 Yrs 5 Yrs 10 Yrs
SBI FMCG Fund 53.97 12.76 24.12 37.64 31.72 26.62 27.98
ICICI Pru FMCG Fund 114.34 8.95 17.68 29.66 29.39 18.66 30.99
Return (%pa)
Category Averages 1 Yr(Annualized) 3 Yrs(CAGR) 5 Yrs(CAGR)
Equity: FMCG 33.66 30.58 22.64
CNX Nifty 22.16 5.58 3.65
S&P BSE Sensex 21.62 5.08 3.04
• FMCG sector has been consistently outperforming the market indices and has also
emerged as the best performing sector for financial year 2012-13. We believe it would
keep its pace going forward and has the potential to perform well in the coming years
as well. Should consider investing in FMCG Mutual Fund Schemes via the SIP route.

MF POINTER
May, 2013 Smart investing starts here 7
Scheme Name Corpus NAV Annualised % Exit
(` Crs)# (Rs)* 1 W 1 M 3 M 6 M 1 Y Load
(%) (%) (%) (%) (%) (%)
Templeton India Ultra Short Bond Fund 4,375.92 15.48 10.77 9.98 10.24 9.65 10.00 0.00
ICICI Pru Flexible Income Plan-Reg 10,467.07 221.57 9.89 9.40 9.67 9.21 9.42 0.00
Birla SL FRF-Long Term Plan 1,581.67 141.19 11.51 10.69 10.10 9.42 9.87 0.25
Reliance Money Manager Fund 9,052.20 1,620.97 8.94 8.85 9.33 9.01 9.40 0.00
Top Performing Debt Funds
Less than 90 days
Scheme Name Corpus NAV Annualised % Exit
(` Crs)# (Rs)* 1 W 1 M 3 M 6 M 1 Y Load
(%) (%) (%) (%) (%) (%)
IDFC Dynamic Bond Fund-Reg 6,500.89 14.45 36.07 24.20 15.57 17.24 14.55 0.50
ICICI Pru Short Term Plan-Reg 5,356.90 24.44 25.10 18.70 12.99 11.33 10.99 0.50
SBI Short Term Debt Fund 3,420.61 13.75 23.54 17.92 12.74 11.18 11.24 0.25
HDFC Short Term Opportunities Fund 2,267.46 12.92 13.64 14.81 11.72 10.26 10.25 0.50
90-180 Days
Scheme Name Corpus NAV Annualised % Exit
(` Crs)# (Rs)* 1 W 1 M 3 M 6 M 1 Y Load
(%) (%) (%) (%) (%) (%)
UTI ST Income Fund 3,073.12 14.28 18.73 13.65 13.04 12.67 10.32 0.75
Birla SL Dynamic Bond Fund-Ret 15,565.95 20.31 22.42 14.30 12.25 11.62 9.12 0.50
HDFC Income Fund 4,929.82 27.93 34.25 15.86 15.42 13.60 8.77 0.50
180-365 Days
Scheme Name Corpus NAV Annualised % Exit
(` Crs)# (Rs)* 1 W 1 M 3 M 6 M 1 Y Load
(%) (%) (%) (%) (%) (%)
SBI Dynamic Bond 6,556.84 15.23 33.81 16.95 17.43 14.28 11.35 1.00
Birla SL Medium Term Fund 709.15 14.04 15.61 13.55 11.35 11.04 9.53 2.00
IDFC SSIF-Invest-Reg 2,265.54 29.19 24.12 15.22 16.87 14.08 9.12 1.00
UTI Bond Fund 2,738.43 36.28 34.29 16.45 17.78 14.14 10.43 1.00
1Year to 3 years
Scheme Name Corpus NAV Annualised % Exit
(` Crs)# (Rs)* 1 W 1 M 3 M 6 M 1 Y Load
(%) (%) (%) (%) (%) (%)
Birla SL MIP II-Savings 5 285.36 21.57 33.89 13.05 12.50 12.06 9.01 1.00
IDFC MIP-Reg 231.49 13.35 39.12 12.54 15.40 15.96 9.25 1.00
Reliance MIP 3,410.42 26.26 45.75 14.17 12.65 12.86 8.64 1.00
MIP
*Returns for less than 1 year is absolute (in case of MIP, it is annualized) and more than 1 year are compounded annualized as on 10th May 2013#Corpus as on March 2013 as AMFI has mandated for quarterly AUM declaration.
MF POINTER
May, 2013Smart investing starts here8
Corporate Office Address : Website :
A1, Kailash Industrial Complex, Park Site, Off LBS Marg, Vikhroli West, Mumbai - 400 079. Tel: +91-22-6754 7000 • E mail : [email protected] • www.ventura1.com
This document is solely for private circulation only. Mutual funds like securities investments are subject to market risks and other risks. Investors are advised to read the offer document before investing.
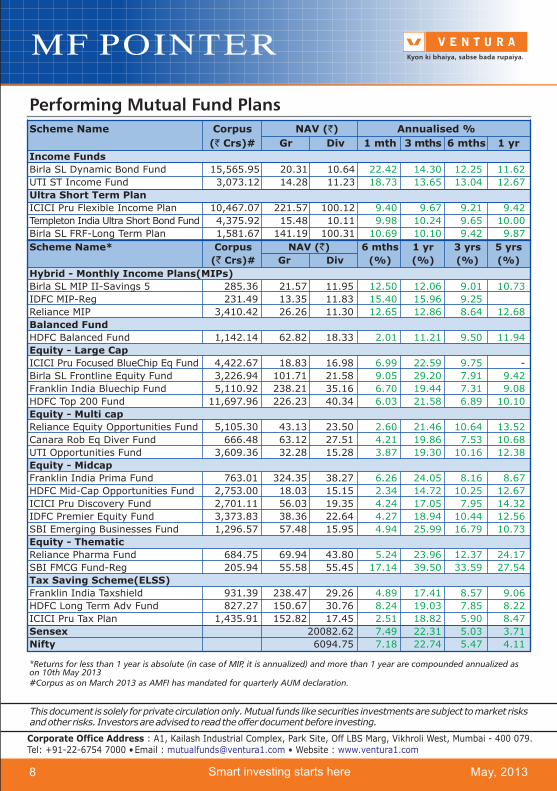
Performing Mutual Fund Plans
Scheme Name Corpus NAV (`) Annualised %
( Crs)# Gr Div 1 mth 3 mths 6 mths 1 yr
Income Funds
Birla SL Dynamic Bond Fund 15,565.95 20.31 10.64
UTI ST Income Fund 3,073.12 14.28 11.23
Ultra Short Term Plan
ICICI Pru Flexible Income Plan 10,467.07 221.57 100.12
Templeton India Ultra Short Bond Fund 4,375.92 15.48 10.11
Birla SL FRF-Long Term Plan 1,581.67 141.19 100.31
`
22.42 14.30 12.25 11.62
18.73 13.65 13.04 12.67
9.40 9.67 9.21 9.42
9.98 10.24 9.65 10.00
10.69 10.10 9.42 9.87
*Returns for less than 1 year is absolute (in case of MIP, it is annualized) and more than 1 year are compounded annualized as on 10th May 2013#Corpus as on March 2013 as AMFI has mandated for quarterly AUM declaration.
Scheme Name* Corpus NAV (`) 6 mths 1 yr 3 yrs 5 yrs
(` Crs)# Gr Div (%) (%) (%) (%)
Hybrid - Monthly Income Plans(MIPs)
Birla SL MIP II-Savings 5 285.36 21.57 11.95
IDFC MIP-Reg 231.49 13.35 11.83
Reliance MIP 3,410.42 26.26 11.30
Balanced Fund
HDFC Balanced Fund 1,142.14 62.82 18.33
Equity - Large Cap
ICICI Pru Focused BlueChip Eq Fund 4,422.67 18.83 16.98
Birla SL Frontline Equity Fund 3,226.94 101.71 21.58
Franklin India Bluechip Fund 5,110.92 238.21 35.16
HDFC Top 200 Fund 11,697.96 226.23 40.34
Equity - Multi cap
Reliance Equity Opportunities Fund 5,105.30 43.13 23.50
Canara Rob Eq Diver Fund 666.48 63.12 27.51
UTI Opportunities Fund 3,609.36 32.28 15.28
Equity - Midcap
Franklin India Prima Fund 763.01 324.35 38.27
HDFC Mid-Cap Opportunities Fund 2,753.00 18.03 15.15
ICICI Pru Discovery Fund 2,701.11 56.03 19.35
IDFC Premier Equity Fund 3,373.83 38.36 22.64
SBI Emerging Businesses Fund 1,296.57 57.48 15.95
Equity - Thematic
Reliance Pharma Fund 684.75 69.94 43.80
SBI FMCG Fund-Reg 205.94 55.58 55.45
Tax Saving Scheme(ELSS)
Franklin India Taxshield 931.39 238.47 29.26
HDFC Long Term Adv Fund 827.27 150.67 30.76
ICICI Pru Tax Plan 1,435.91 152.82 17.45
Sensex 20082.62
Nifty 6094.75
12.50 12.06 9.01 10.73
15.40 15.96 9.25
12.65 12.86 8.64 12.68
2.01 11.21 9.50 11.94
6.99 22.59 9.75
9.05 29.20 7.91 9.42
6.70 19.44 7.31 9.08
6.03 21.58 6.89 10.10
2.60 21.46 10.64 13.52
4.21 19.86 7.53 10.68
3.87 19.30 10.16 12.38
6.26 24.05 8.16 8.67
2.34 14.72 10.25 12.67
4.24 17.05 7.95 14.32
4.27 18.94 10.44 12.56
4.94 25.99 16.79 10.73
5.24 23.96 12.37 24.17
17.14 39.50 33.59 27.54
4.89 17.41 8.57 9.06
8.24 19.03 7.85 8.22
2.51 18.82 5.90 8.47
7.49 22.31 5.03 3.71
7.18 22.74 5.47 4.11
-