mf0001 security analysis
TRANSCRIPT
8/14/2019 MF0001 Security Analysis
http://slidepdf.com/reader/full/mf0001-security-analysis 1/24
ASSIGMENT
MF0001
SECURITY ANALYSIS AND PORTFOLIO MANAGEMENT
SET 1
Question –
1a. What is a Portfolio? Explain the portfolio investment process.
Answer
It is rare to find investors investing their entire savings in a single security. Instead, they
tend to invest in a group of securities. Such a group of securities is called a portfolio.
Most financial experts stress that the in order to minimize risk, an investor should hold a
well-balanced investment portfolio. The investment process describes how an investor must go about making decision with regard to what securities to invest in while
constructing a portfolio, how extensive the investment should be, and when theinvestment should be made. This is a procedure involving the following five steps:
• Set investment policy
• Perform security analysis
• Construct a portfolio
• Revise the portfolio
• Evaluate the performance of portfolio
1. Setting Investment Policy
This initial step determines the investor’s objectives and the amount of his investable
wealth. Since there is a positive relationship between risk and return, the investment
objectives should be stated in terms of both risk and return.
The step concludes with the asset allocation decision: identification of the potential
categories of financial assets for consideration in the portfolio that the investor is going toconstruct. Asset allocation involves dividing an investment portfolio among different
asset categories, such as stocks, bonds and cash.
The asset allocation that works best for an investor at any given point in his life dependslargely on his tome horizon and his ability to tolerate risk
Time Horizon – The time horizon is the expected numbers of months, years, or decadesthat an investor will be investing his money to achieve a particular financial goal. An
investor with a longer time horizon may feel more comfortable with a riskier or more
volatile investment because he can ride out the slow economic cycles and the inevitableups and downs of the markets. By contrast, an investor who is saving for his teen-aged
8/14/2019 MF0001 Security Analysis
http://slidepdf.com/reader/full/mf0001-security-analysis 2/24
daughter’s college education would be less likely to take a large risk because he has a
shorter time horizon.
Risk Tolerance – Risk tolerance is an investor’s ability and willingness to loose some or
all of his original investment in exchange for greater potential returns. An aggressive
investor, or one with a high risk tolerance, is more likely to risk losing money in order toget better results. A conservative investor, or one with low-risk tolerance, tends to favour
investments that will preserve his or her original investment. The conservative investors
keep a “bird in the hand” while aggressive investors seek “two in the bush”.
While setting the investment policy, the investor also selects the portfolio management
styles
Active Management is the process of managing investment portfolios by attempting to
time the market and/or select ‘undervalued ‘ stock to buy and ‘overvalued’ stock to sell
based upon research, investigation and analysis.
Passive Management is the process of managing investment portfolios by trying to
match the performance of index or asset class of securities as closely ass possible byholding all or a representative sample of securities in the index or asset class. This
portfolio management style does not use market timing or stock selection strategies.
2. Performing Securities Analysis
This step is the Security selection decision: within each asset type, identified in the asset
allocation decision, how does an investor select which securities to purchase. Securityanalysis involves examining a number of individual securities with in broad categories of
financial assets identified in the previous step. One purpose of this exercise is to identify
those securities that currently appear to be mispriced. Security analysis is done either using Fundamental or Technical analysis
Fundamental analysis is a method used to evaluate the worth of a security by studying thefinancial data of the issuer. It scrutinizes the issuer’s income and expenses, assets and
liabilities, management, and position in its industry. In other words, it focuses on the
basics of the business.
Technical analysis is a method used to evaluate the worth of a security by studying
market statistics. Unlike fundamental analysis, technical analysis disregards an issuer’s
financial statements. Instead, it relies upon the market trends to ascertain investor sentiment to predict how a security will perform.
3. Portfolio Construction
This step identifies those specific assets in which to invest, as well as determining the
proportion of the investors wealth to put into each one. Here selectively, timing and
diversification issues are addressed. Selectivity refers to security analysis and focuses on
8/14/2019 MF0001 Security Analysis
http://slidepdf.com/reader/full/mf0001-security-analysis 3/24
price movements of individual securities. Timing involves forecasting of price movement
of stocks relative to price movements fixed income securities. Diversification aims at
constructing a portfolio in such a way that the investor’s risk is minimized.
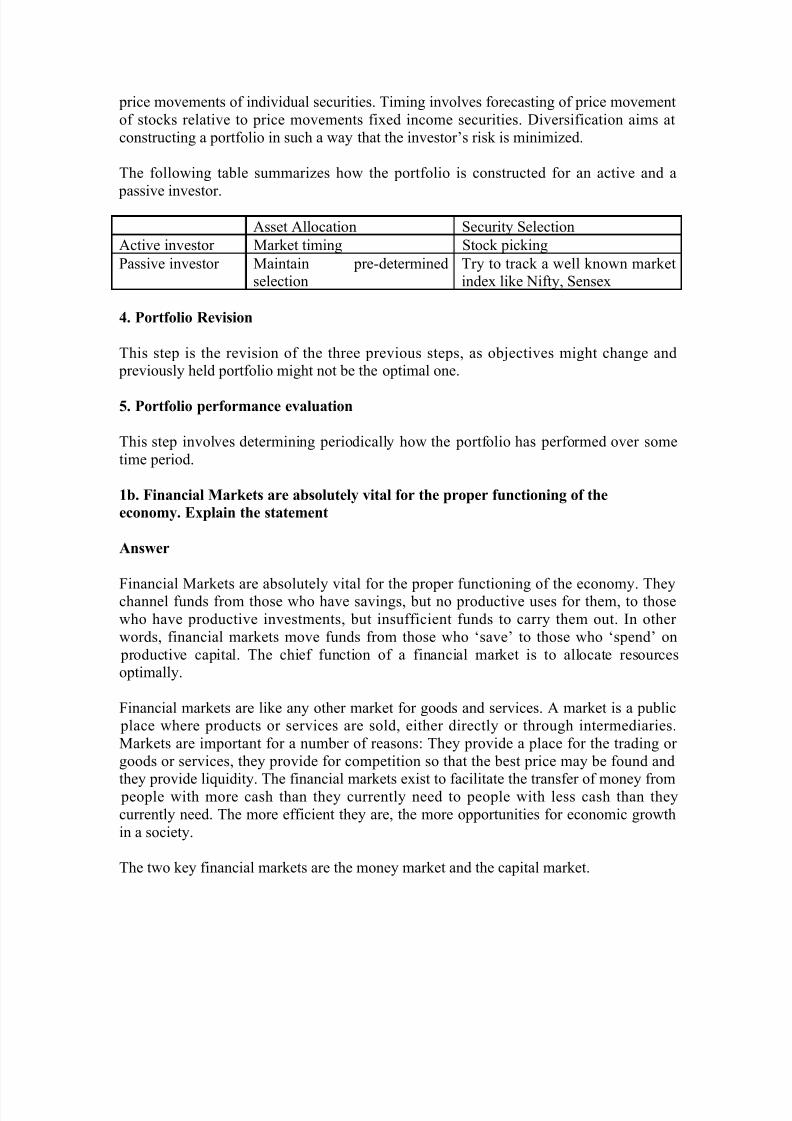
The following table summarizes how the portfolio is constructed for an active and a
passive investor.
Asset Allocation Security Selection
Active investor Market timing Stock picking
Passive investor Maintain pre-determinedselection
Try to track a well known marketindex like Nifty, Sensex
4. Portfolio Revision
This step is the revision of the three previous steps, as objectives might change and previously held portfolio might not be the optimal one.
5. Portfolio performance evaluation
This step involves determining periodically how the portfolio has performed over some
time period.
1b. Financial Markets are absolutely vital for the proper functioning of the
economy. Explain the statement
Answer
Financial Markets are absolutely vital for the proper functioning of the economy. Theychannel funds from those who have savings, but no productive uses for them, to those
who have productive investments, but insufficient funds to carry them out. In other
words, financial markets move funds from those who ‘save’ to those who ‘spend’ on
productive capital. The chief function of a financial market is to allocate resourcesoptimally.
Financial markets are like any other market for goods and services. A market is a public place where products or services are sold, either directly or through intermediaries.
Markets are important for a number of reasons: They provide a place for the trading or
goods or services, they provide for competition so that the best price may be found and
they provide liquidity. The financial markets exist to facilitate the transfer of money from people with more cash than they currently need to people with less cash than they
currently need. The more efficient they are, the more opportunities for economic growth
in a society.
The two key financial markets are the money market and the capital market.

8/14/2019 MF0001 Security Analysis
http://slidepdf.com/reader/full/mf0001-security-analysis 4/24
2a. Explain the features of Capital Market
Answer
The capital markets are the markets in equity and long-term debt, in other words, the
markets for long term capital. In this capital market, the capital funds comprising bothequity and debt are issued are traded. Capital market can be further divided into primary
and secondary markets. In the primary market, securities are offered to public for
subscription for the purpose of raising capital. Secondary market is a market wherealready existing securities are traded amongst investors.
The primary market is the first-sale market. On the equity side, the primary market
includes initial public offerings and right issues: on the fixed income side, it consists of Treasury auctions and original issues of company bonds. The term “placement” refers to
a transaction on the primary market: the issuer is “placing” its securities with investors.
The secondary market, on the other hand, is what happens after that. It is the resale of market, where the securities trade once the securities have been put out among the public.
Secondary market could be either auction or dealer market. An auction market is one inwhich investor trade directly with each other. A dealer market is one where dealers post
bid rates and offer rates at which public investors can trade. While Stock Exchange is the
part of auction market, Over-the-Counter (OTC) is a part of dealer market.
Although corporations do not directly benefit from secondary market transactions, the
managers of a corporation closely monitor the price of the corporation’s stock in
secondary markets. Once reason for this concern involves the cost of raising new fundsfor further business expansion. The price of a company’s stock in the secondary market
influences the amount of funds that can be raised by issuing additional stock in the
primary market. Corporate managers also pay attention to the price of the company’sstock in secondary market because it affects the financial wealth of the corporation’s
owners – the stockholders. If the price of the stock rises, then the stockholders become
wealthier. This is likely to make them happy with the company’s management. Typically,managers own only small amounts of a corporation’s outstanding shares. If the price of
the stock declines, the shareholders become less wealthy and are likely to be unhappy
with management. If enough shareholders become unhappy, they may move to replace
the corporation’s managers. Most corporate managers also receive options to buycompany stock at a selected price, so they are motivated to increase the value of the stock
in the secondary market.
2b. Money market provides the investors a place for parking surplus funds for short
period of time. Elaborate
Answer
The money market exists as a result of the interaction between the suppliers and
demanders of short-term funds (those having a maturity of a year or less). Most money

8/14/2019 MF0001 Security Analysis
http://slidepdf.com/reader/full/mf0001-security-analysis 5/24
market transactions are made in marketable securities which are short-term debt
instruments such as T-bills and commercial paper. The term “money market” is a
misnomer. Money is not actually traded in the money markets. The securities traded inthe money market are short-term with high liquidity and low-risk; therefore they are close
to being money.
Money market provides investors a place for parking surplus funds for short periods of
time. It also provides low-cost source of temporary funds to borrowers like firms,
government and financial intermediaries. The money markets are associated with theissuance and trading of short-term (less than 1 year) debt obligations of large
corporations, financial institutions and governments. Only high-quality entities can
borrow in the money markets. Individual issues are large. Thus the money market is
characterized by low default risk and large denomination of instruments.
3a. Explain the important money market instruments
Answer
The important money market instruments are:
Treasury bill: These are short term obligations issued by the government. At present, the
Government of India issued 4 types of T-Bills i.e. 14 day, 91 day, 182 day and 364 day.
The T-Bills are issued for a minimum amount of Rs. 25,000/- and in multiples of Rs.25,000/-. T-Bills are issued at a discount and redeemed at par.
Call money: These are short-tern funds transferred between financial institutions usuallyfor no more than one day. The call money market is a part of the money market where,
day to day surplus funds, mostly of banks, are traded. The maturity period of call loans
vary from 1 to 14 days. The money that is lent for one day in call money market is alsoknown as ‘overnight money’. In India, call money is lent mainly to even out the short
term mismatches of assets and liabilities and to meet CRR requirement of banks.
Repurchase Agreements: It is an agreement, which involves a sale of a security with an
undertaking to buy-back the same security at a pre-determined price and at a future date.
A party sells Treasury securities, but agrees to buy them back at a certain date (usually 3-14 days after) for a certain price. The transaction is called repo from the seller of the
security whereas the same viewed as reverse repo from the point of the buyer of the
security. Thus, repo agreement is essentially a short-term collateralized loan.
Negotiable Certificates of Deposit (CD): These are bank-issued time deposit that
specifies an interest rate and maturity date, and is negotiable (salable on a secondarymarket). CDs are issued at a discount to face value. The discount rate is freely determined
by the issuing bank considering the prevailing call money rates, treasury bills rate,
maturity of the CD and its relation with the customer, etc. The minimum size for the issue
of CDs is Rs. 5 lakh (face value) and thereafter in multiples of Rs 1 lakh.

8/14/2019 MF0001 Security Analysis
http://slidepdf.com/reader/full/mf0001-security-analysis 6/24
Commercial Paper (CP): These are short-term unsecured promissory notes issued by a
company to raise short-term cash. They mature in no more than 270 days. Only the
largest and creditworthy companies issue these commercial papers. CPs as a source of short-term finance is used by companies as an alternative to bank finance for working
capital. Generally, companies prefer to raise funds through this route when the interest
rate on working capital by banks is higher than the rate at which funds can be raisedthrough CP.
Banker’s Acceptances: These are time drafts payable to a seller of goods, with paymentguaranteed by a bank. Banker’s acceptance is essentially a post-dated check on which a
bank has guaranteed payment. These are commonly used to finance international trade
transactions.
3b. Explain the features and functioning of OTCEI
Answer
Stock exchanges are organized markets for buying and selling securities which include
stocks, bonds, options and futures. Most stock exchanges have specific locations wherethe trades are completed. For the securities to be traded at these exchanges, they must be
listed at these exchanges. Stock exchange transactions involve the activities of brokers
and dealers. These individuals facilitate the buying and selling of financial assets.
Brokers execute trades on behalf of clients and receive commissions and fees in exchangefor matching buyers and sellers. Dealers, on the other hand, buy and sell from their own
portfolios (inventories of securities). Dealers earn income by selling a financial
instrument at a price that is greater than the price paid for the instrument. Some exchange participants perform both roles. These dealer-brokers sometimes act purely as a client’s
agent and at other times buy and sell from their own inventory of financial assets. Stock
exchanges essentially function as secondary markets. By providing investors theopportunity to trade financial instruments, the stock exchanges support the performance
of the primary markets.
In India, the two main exchanges are National Stock Exchange (NSE) and Mumbai
(Bombay) Stock Exchange (BSE). These exchanges are de-mutualised exchanges (it
means that the ownership, management and trading are in separate hands). Mumbai
(Bombay) Stock Exchange Limited (BSE) is the oldest stock exchange in Asia. It wasestablished in 1875. More than 6000 stocks are listed here. National Stock Exchange
(NSE) was promoted by leading Financial Institutions at the behest of the Government of
India and was incorporated in November 1992. There is also an Over the Counter Exchange of India (OTCEI) which allows listing of small and medium-sized companies.
The regulatory agency which overseas the functioning of stock markets is the securities
and Exchange Board of India (SEBI), which is also located in Mumbai.
8/14/2019 MF0001 Security Analysis
http://slidepdf.com/reader/full/mf0001-security-analysis 7/24
4 a Technical analysis is based on the assumption that markets are driven more by
psychological factors than fundamental values. Substantiate.
Answer
Technical analysis is based on the assumption that markets are driven more by psychological factors than fundamental values. Its proponents believe that asset prices
reflect not only the underlying ‘value’ of the assets but also the hopes and fears of those
in the market. They assume that the emotional makeup of investors does not change, thatin a certain set of circumstances, investors will react in a similar manner to how they did
in the past and that the resultant price moves are likely to be the same. Technical analysts
use chart patterns to analyze market movements and to predict security prices. Although
many of these charts have been used for more than 100 years, technical analysis believethem to be relevant even now, as they illustrate patterns in price movements that often
repeat themselves.
Technical analysis can be applied to any security which has historical trading data. Thisincludes stocks, bonds, futures, foreign exchange etc. In this unit, we will give examples
of stocks but remember that the technical analysis can be used for any type of security.
Tools of Technical Analysis
There are many different types of technical traders: some rely on chart patterns, othersuse technical indicators and oscillators, and most use some combination of the two.
Charting: Technical analysts are sometimes called chartists because they study recordsor charts of past stock prices and trading volume, hoping to find patterns they can exploit
to make a profit.
Technical Indicators: Technical analysts also use technical indicators besides charts to
assess prospects for market declines or advances. A technical indicator is a series of data
points that are derived by applying a formula to the price data of a security. Price dataincludes any combination of the open, high, low or close over a period of time.
Technical indicators can be classified in a number of ways. One classification divides
them into three types: sentiment indicators, flow of funds indicators, and market structureindicators.
Sentiment indicators are intended to measure the expectations of various groups of investors, for example, mutual fund investors, and corporate insiders.
Flow of funds indicators are intended to measure the potential for various investor groupsto buy or sell stocks in order to predict the price pressure for those actions.
Market structure indicators monitor price trends and cycles.

8/14/2019 MF0001 Security Analysis
http://slidepdf.com/reader/full/mf0001-security-analysis 8/24
4b. What are technical indicators and how it is useful to a technical analyst?
Answer
A technical indicator is a series of data points that are derived by applying a formula tothe price and/or volume data of a security. Price data can be any combination of the open,
high, low or closing price over a period of time. Some indicators may use only the
closing prices, while others incorporate volume and open interest into their formulae. The price data is entered into the formula and a data point is produced. For example, say the
closing prices of a stock for 3 days are Rs. 41, Rs.43 and Rs43. If a technical indicator is
constructed using the average of the closing prices, then the average of the 3 closing is
one data point (41+43+43)/3=42.33). However, one data point does not offer muchinformation. A series of data points over a period of time is required to enable analysis.
Thus we can have a period moving average as a technical indicator where we drop the
earliest closing price and use the next closing price for calculations. By, creating a time
series of data points, a comparison can then be made between present and past levels.Technical indicators are usually shown in a graphical form above or below a security
price chart for facilitating analysis. Once shown in graphical form, an indicator can then be compared with the corresponding price chart of the security. Some times indicators are
plotted on top of the price plot for a more direct comparison.
Technical indicators measure money flow, trends, volatility and momentum etc. They areused for two main purposes: to confirm price movement and the quality of chart patterns,
and to form buy and sell signals. A technical indicator offers a different perspective from
which to analyze the price action. Some, such as moving averages, are derived fromsimple formulae and they are relatively easy to understand. Others, like stochastic have
complex formulae and require more effort to fully understand and appreciate. Technical
indicators can provide unique perspective on the strength and direction of the underlying price action.
Indicators filter price action with formulae. Therefore they are derivative measures andnot direct reflections of the price action. This should be taken into account when
analyzing the indicators. Any analysis of an indicator should be taken with the price
action in mind. There are two main types of indicators: leading and lagging. A leading
indicator precedes price movements; therefore they are used for predication. A laggingindicator follows price movement and therefore is a confirmation. The main benefit of
leading indicators is that they provide early signaling for entry and exit. Early signals can
forewarn against a potential strength or weakness. Leading indicators can be used intrending markets. In a market that is trending up, the leading indicator helps identify
oversold conditions for buying opportunities. In a market that is trending down, leading
indicators can help identify overbought situations for selling opportunities. Some of themore popular leading indicators include Relative strength Index (RSI) and Stochastic
Oscillator
8/14/2019 MF0001 Security Analysis
http://slidepdf.com/reader/full/mf0001-security-analysis 9/24
Lagging indicators follow the price action and are commonly referred to as trend-
following indicators. Lagging indicators work best when the markets or securities
develop strong trends. They are designed to get traders in and keep them in as long as thetrend in intact. As such, these indicators are not effective in trading or sideways markets.
Some popular trend-following indicators include moving averages and Moving Average
Convergence Divergence (MACD).
Technical indicators are constructed in two ways: those that fall in a bounded range and
those that do not. Technical indicators that are bound within a range are called
oscillators. Oscillators are used as an overbought/oversold indicator. A market is said to
be ‘overbought’ when prices have been trending higher in a relatively steep fashion for
some time, significantly outweighs those on the sidelines or holding ‘short’ positions.
This means that there are fewer participants to jump onto the back of the trend. The
‘oversold’ condition is just the opposite. The market has been trending lower for some
time and is running out of ‘fuel’ for further price declines.
Oscillator indicators move within have a range, say between zero and 100, and signal periods where the security is overbought (near 100) or oversold (near zero). Oscillators
are the most common type of technical indicators. The technical indicators that are not bound within a range also form buy and sell signals and display strength or weakness in
the market, but they can vary in the way they do this.
The two main ways that technical indicators are used to form buy and sell signals isthrough crossovers and divergence. Crossovers occur when either the price moves
through the moving average, or when two different moving averages cross over each
other. Divergence happens when the direction of the price trend and the direction of theindicator trend are moving in the opposite direction. This indicates that the direction of
the price trend is weakening.
Technical indictors provide an extremely useful source of additional information. These
indicators help identify momentum, trends, volatility and various other aspects in a
security to aid in the technical analysis of trends. While some traders just use a singleindicator for buy and sell signals, it is best to use them along with price movement, chart
patterns and other indicators.
A number of technical indicators are in use. Some of the technical indicators arediscussed below for the purpose of illustration of the concept.
Moving average
The moving average is a lagging indicator which is easy to construct and is one of the
most widely used. A moving average, as the name suggests, represents an average of acertain series of data that moves through time. The most common way to calculate the
moving average is to work from the last 10 days of closing prices. Each day, the most
recent close (days 11) is added to the total and the oldest close (day 1) is subtracted. The
new total is then divided by the total number of days (10) and the resultant average
8/14/2019 MF0001 Security Analysis
http://slidepdf.com/reader/full/mf0001-security-analysis 10/24
computed. The purpose of the moving average is to track the progress of a price trend.
The moving average is a smoothing device. By averaging the data, a smoother line is
produced, making it much easier to view the underlying trend. A moving average filtersout random noise and offers a smoother perspective of the price action.
Moving Average Convergence Divergence (MACD)
MACD is a momentum indicator and it is made up of two exponential moving averages.
The MACD plots the difference between a 26-day exponential moving average and a 12-day exponential moving average. A 9-day moving average is generally used as a trigger
line. When the MACD crosses this trigger and goes down it is a bearish signal and when
it crosses it to go above it, it’s bullish signal. This indicator measures short-term
momentum as compared to longer term momentum and signals the current direction of momentum. Traders use the MACD for indicting trend reversals.
Relative Strength Index
The relative strength index (RSI) is another of the well known momentum indicators.
Momentum measures the rate of change of prices by continually taking price differencesfor a fixed time interval. RSI helps to signal overbought and oversold conditions in a
security. RSI is plotted in a range of 0-100. A reading above 70 suggests that a security is
overbought, while a reading below 30 suggests that it is oversold. This indicator helps
traders to identify whether a security’s price has been unreasonably pushed to its currentlevels and whether a reversal may be on the way.
Stochastic Oscillator
The stochastic Oscillator is one of the most recognized momentum indicators. This
indicator provides information about the location of a current closing price in relation tothe period’s high and low prices. The closer the closing price is to the period’s high, the
higher is the buying pressure, and the closer the closing price is to the period’s low, the
move is the selling pressure. The idea behind this indicator is that in an uptrend, the priceshould be closing near the highs of the trading range, signaling upward momentum in the
security. In downtrends, the price should be closing near the lows of the trading range,
signaling downward momentum. The stochastic oscillator is plotted within a range of
zero and 100 and signals overbought conditions above 80 and oversold conditions below20.
8/14/2019 MF0001 Security Analysis
http://slidepdf.com/reader/full/mf0001-security-analysis 11/24
5 a Explain Random Walk Theory
Answer
The efficient market hypothesis is associated with the idea of a “random walk”. Random
walk is a term used to characterize a price series where all subsequent price changesrepresent random deviations from previous prices. The logic of the random walk idea is
that if the flow of information is not hindered and if information is immediately
incorporated and reflected in the stock prices, then it follows that tomorrow’s security price will incorporate tomorrow’s news and security price changes tomorrow will be
independent of the price changes today. Since news by definition is unpredictable and
random the resulting price changes must be unpredictable and random too. Random Walk
theory assert that prices have no memory, therefore past and present prices cannot beused to predict future prices (as implied in technical analysis). Prices move at random,
since new information is random, and adjust to new information as it becomes available.
The adjustment to this new information is so fast that it is impossible to profit from it.
Furthermore, news and events are also random and trying to predict these (fundamentalanalysis) is also useless.
The Random Walk Theory implies that the prices fully reflect all know information, and
even uninformed investors buying a diversified portfolio at the market prices will obtain
a rate as well as that achieved by the experts. In his book “A Random Walk Down Wall
Street”, Burton G. Malkiel states that a blindfold chimpanzee throwing darts at the WallStreet Journal can select a portfolio that would perform as well as the portfolio that is
selected by the experts. The advice to the investors is not to ask a chimpanzee to throw
darts and select a portfolio for them, but to buy and hold a broad-based index fund.
5b Explain event study and bring out its relationship with efficient market
hypothesis.
Answer
Statistical research has shown that stock prices seem to follow a random walk with no
discernible predictable patterns that investors can exploit to their advantage. These
findings are now taken to be evidence of market efficiency, that is, of evidence that
market prices reflect all currently available information. Only new information will movestock prices, and this information is equally likely to be good news or bad news.
Therefore stock prices movements are random.
Random-walk theory usually starts from the assumption that the major security
exchanges are good examples of “efficient” markets. An “efficient” market is defined as
market where there are large numbers of rational profit-maximizers who are activelycompeting with each other, with each one trying to predict future market values of
individual securities. In an efficient market important current information is almost
always freely available to all the market participants.

8/14/2019 MF0001 Security Analysis
http://slidepdf.com/reader/full/mf0001-security-analysis 12/24
In an efficient market, actual prices of individual securities, at any point in time, reflect
the effect of information that is based both on the events that have already taken place
and on the events that the market expects will take place in the future. This is the result of the competing actions of many intelligent market participants. In an efficient market, at
any point of time, the actual price of a security is a good estimate of its intrinsic value. In
an uncertain world the intrinsic value of a security can never be determined exactly.Market participants may disagree on what is the intrinsic value of an individual security.
Such disagreement gives rise to discrepancies between actual prices and intrinsic values.
However, in an efficient market, the actions of the many competing participants cause theactual price of a security to wander randomly about its intrinsic value.
If the differences between actual prices and intrinsic values are systematic rather than
random in nature, as predicted by theory, then intelligent market participants should beable to predict the path by which the actual prices will attempt to take advantage of this
knowledge, they would tend to neutralize such systematic behavior in price series.
Although uncertainty concerning intrinsic values will remain, actual prices of securities
will wander randomly about their intrinsic values.
The intrinsic values will themselves change with time as a result of new informationcoming in. The new information is about factors that may affect a company’s prospects
such as the success of a current R&D program, a change in management, a new tax
imposed on the industry’s products in foreign countries etc. In an efficient market, on an
average, competition between market players will cause the full effects of newinformation on intrinsic value to be reflected “instantaneously” in actual prices. This
“instantaneous adjustment” properly of an efficient market implies that successive price
changes in individual securities will be independent. A market where successive pricechanges in individual securities are independent is, by definition, a random –walk market.
They theory of random walks implies that a series of stock price changes have no
memory-the past history of the series cannot be used to predict the future in anymeaningful way.
The random-walk hypothesis may not be an exact description of the behavior of stock-market prices. However, for practical purposes, the random walk model may be accepted
even though it does not fit the facts exactly. Thus, although successive price changes may
not be strictly independent, the actual amount of dependence may be so small as to be
unimportant.
8/14/2019 MF0001 Security Analysis
http://slidepdf.com/reader/full/mf0001-security-analysis 13/24
6 Case Study:
Akash is an investment consultant with rich experience in equity research and
portfolio management. He was requested by a client to give a presentation on equity
valuation. You as an executive assistant prepare for him the following:
a. Brief explanation of different types of Equity Valuation Models.
Answer
Shareholders “own” a part of the assets of the company and part of the stream of cash
those assets generate. As the company acquires more assets and the stream of cash it
generates gets larger, the value of the business increases. This increase in the value of
the business is what drives up the value of the stock in that business. Following arethe Equity Valuation Models
Dividend Discount Model (DDM) is a widely used approach to value common
stocks. Financial Theory states that the value of any securities is equal to the all futurecash flow that the owner will receive, discounted at an appropriate risk-adjusted rate.
A common stock can be thought of as a right to receive future dividends. A stock’sintrinsic value can therefore be defined as the value of all future dividends discounted
at the appropriate discount rate.
Zero growth of dividends: If the dividends do not grow, we have perpetuity. Thus,simplifying the above equation gives us the share price Po as :
DPo = ---
R
Constant growth model: In reality, investors generally expect the firm (and the
dividends it pays) to grow over time. How do we value a stock when each dividend
differs from the one preceding it?. This called “Gorden Growth Model” after MyronGorden.
b. How is Dividend Discount and Constant Growth Model valued?
Answer
A stock’s intrinsic value can therefore be defined as the value of all future dividendsdiscounted at the appropriate discount rate.
∞ Expected (Dividends)t
Value of Equity (Po) = ∑ -------------------T=1 (1+R)t
In principle, there are an infinite number of dividends. This means that we have to
discount an infinite number of dividends and therefore we cannot compute the price
8/14/2019 MF0001 Security Analysis
http://slidepdf.com/reader/full/mf0001-security-analysis 14/24
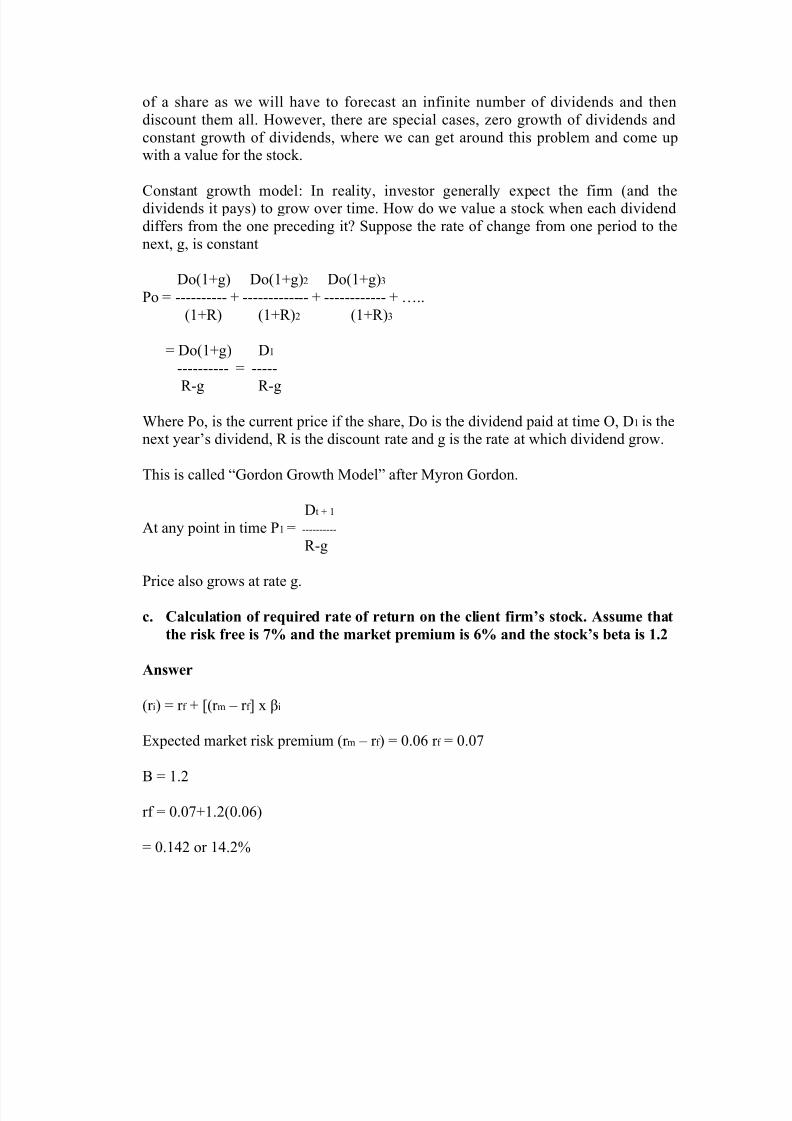
of a share as we will have to forecast an infinite number of dividends and then
discount them all. However, there are special cases, zero growth of dividends and
constant growth of dividends, where we can get around this problem and come upwith a value for the stock.
Constant growth model: In reality, investor generally expect the firm (and thedividends it pays) to grow over time. How do we value a stock when each dividend
differs from the one preceding it? Suppose the rate of change from one period to the
next, g, is constant
Do(1+g) Do(1+g)2 Do(1+g)3
Po = ---------- + ------------- + ------------ + …..
(1+R) (1+R)2 (1+R)3
= Do(1+g) D1
---------- = -----
R-g R-g
Where Po, is the current price if the share, Do is the dividend paid at time O, D 1 is thenext year’s dividend, R is the discount rate and g is the rate at which dividend grow.
This is called “Gordon Growth Model” after Myron Gordon.
Dt + 1
At any point in time P1 = ----------
R-g
Price also grows at rate g.
c. Calculation of required rate of return on the client firm’s stock. Assume that
the risk free is 7% and the market premium is 6% and the stock’s beta is 1.2
Answer
(r i) = r f + [(r m – r f ] x βi
Expected market risk premium (r m – r f ) = 0.06 r f = 0.07
Β = 1.2
rf = 0.07+1.2(0.06)
= 0.142 or 14.2%

8/14/2019 MF0001 Security Analysis
http://slidepdf.com/reader/full/mf0001-security-analysis 15/24
d. Assume that the firm is a constant growth company which paid a dividend of
Rs.5.00 last year and the dividend is expected to grow at the rate of 10%
forever. What is the expected value of the stock a year from now.
Answer
e. If the stock is currently selling for Rs.110.00 what is the expected rate of
return on the stock?
8/14/2019 MF0001 Security Analysis
http://slidepdf.com/reader/full/mf0001-security-analysis 16/24
ASSIGMENT
MF0001
SECURITY ANALYSIS AND PORTFOLIO MANAGEMENT
SET II
1 a. Explain the different types of bonds
Answer
Bonds are debt securities- the bondholder is a creditor of the entity issuing the bond. The
bond holder makes a loan of the face value to the issuer of the bond. The issuer promisesto repay to the lender the principal at maturity date plus periodic coupon interest over
some specified period of time.
Call provisions on Corporate Bonds
The call provision allows the issuer to repurchase the bond at a specified call price beforethe maturity date. If a company issues a bond with a high coupon rate, when market
interest rates are high, and interest rates later fall, the firm might like to retire the high-
coupon debt and issue new bonds at a lower coupon rate to reduce interest payments.
This is called refunding. The call price of a bond is commonly set at an initial level near par value plus one annual coupon payment. The call price falls as time passes, gradually
approaching par value.
Callable bonds typically come with a period of call protection, an initial time during
which the bonds are not callable. Such bonds are referred to as deferred callable bonds.
The option to call the bond is valuable to the firm, allowing it to buy back the bonds andrefinance at lower interest rates when market interest rates fall. From the bondholder’s
perspective, the proceeds then will have to be reinvested in a lower interest rate. To
compensate investors for this risk, callable bonds are issued with higher coupon s and promised yields than non callable bonds.
Convertible Bonds
Convertible bonds give the bondholders an option to exchange each bond for a specified
number of shares of common stock of the firm. The conversion ratio gives the number of
shares for which each bond may be exchanged. Suppose a convertible bond that is issuedat par value of Rs. 1,000 is convertible into 40 shares of a firm’s stock. The current stock
price is Rs. 20 per share, so the option of convert is not profitable now. However, should
the stock price share later rise to Rs. 30, each bond may be converted profitably intoRs.1,200 worth of stock.
The market conversion value is the current value of the shares for which the bonds may
be exchanged. At the Rs. 20 stock price, the bond’s conversion value is Rs. 800. The

8/14/2019 MF0001 Security Analysis
http://slidepdf.com/reader/full/mf0001-security-analysis 17/24
conversion premium is the excess of the bond value over its conversion value. If the bond
is selling currently at Rs. 950, its premium will be Rs. 150.
1b. Consider a Rs.1000 per value bond carrying a coupon rate of 9% and the
maturing after 8 years. The bond is currently selling at Rs.800. What is the YTM of
Bond?
Answer
YTM = I + (F-P)
N
F+P
2
= 90 + (1000-800)
8
------------- = 90 + 25 = 115 = 0.12771000+800 900 900
2
= 12.77 %
Question
2a. Market price of a Rs 1000 par value bond carrying a coupon rate of 14 percent
and maturing after five years Rs.1050. Calculate YTM using approximation method
Answer
b. A financial institution issued deep discount bonds in 1996 which have a face value
of Rs. 2,00,000.00 and a maturity period of 25 years. The bond was issued at Rs.
5300.00 what is the value of this zero coupon bond?
Answer

8/14/2019 MF0001 Security Analysis
http://slidepdf.com/reader/full/mf0001-security-analysis 18/24
3a. Explain Capital Market line.
Answer
The CML says that the expected return on a portfolio is equal to the risk-free rate plus a
risk premium. -
- (r m – r f )
r p = r f +---------------------- σ p
σm
Where, – r f = risk free rate, r m = return on market portfolio, σm = standard deviation of the
return on market portfolio σ p = standard deviation of the return on the portfolio.
Graphically the CML can be draw as below
EF is the efficient Fortier, M is the market portfolio and the line tangent to the efficient
frontier and joining the risk free rate r f with the market portfolio M and going beyond is
the Capital Market Line (CML).
The risk-free rate compensates investors for the time value of money while the risk premium compensates investors for bearing risk. The risk premium is equal to the market
price of risk times the quantity of risk for the portfolio (as measured by the standard
deviation of the portfolio)
(r m – r f )
-------------------- σ p
σm
8/14/2019 MF0001 Security Analysis
http://slidepdf.com/reader/full/mf0001-security-analysis 19/24
The term (r m – r f ) is the expected return of the market beyond the risk-free return. It is a
measure of the reward for holding the risky market portfolio rather than the risk-free
asset. The term σm is the risk of the market portfolio. Thus, the slope of the CML
measures the reward per unit of market risk. It is determines the additional return needed
to compensate for a unit change in risk. It is also called the market price of risk.
The Capital Market Line (CML) leads all investors to invest in the tangency portfolio (M
portfolio) which is the investment decision. The individual investors differ in position on
the CML depending on risk preferences (which leads to the financing decision). Risk
adverse investors will lend part of the portfolio at the risk-free rate(r f ) and invest the
reminder in the market portfolio (points left of M). Aggressive investors would borrow
funds at the risk-free rate and invest everything in the market portfolio (points to the rightof M)
3b. A bond has a face value of Rs. 100 with a coupon rate of 9% payable annually.The number of years to maturity is 5 and the bond is currently selling at Rs. 105.00.
Determine the duration of the bond. Use the approximate formula for calculating
the yield to maturity.
Answer
8/14/2019 MF0001 Security Analysis
http://slidepdf.com/reader/full/mf0001-security-analysis 20/24
4 a. List out the assumptions of CAPM
Answer
• All investors are assumed to follow the mean-variance approach i.e. the risk-
averse investor will ascribe to the methodology of reducing portfolio risk bycombing assets with counterbalancing correlations.
• Assets are infinitely divisible.
• There is a risk-free rate at which an investor may lend or borrow. This risk-free
rate is the same for all investors.
• Taxes & transactions cost are irrelevant.
• All investors have same holding period
• Information is freely and instantly available to all investors.
• Investors have homogeneous expectations i.e. all investors have the same
expectations with respect to the inputs that are used to derive the Markowitz
efficient portfolios: asset returns, variances and correlations.
• Markets are assumed to be perfectly competitive i.e. the number of buyers and
sellers is sufficiently large, and all investors are small enough relative to themarket, so that no individual investor can influence an asset’s price.
Consequently, all investors are price takers, and the market price is determined
where there is equality of supply and demand.
Investors are considered to be homogeneous group: they have the same expectations, the
same one-period horizon, the same risk-free rate and information is freely and instantly
available to all investors. This is am extreme case, but it allows the focus to change fromhow an individual should invest to what would happen to security prices if every one
invested in a similar manner.
Some of these assumptions of CAPM are clearly unrealistic. But relaxing many of these
assumptions would have only minor influence on the model and would not change its
main implications or conclusions. The primary way to judge a theory is to see how well it
explains and helps predict behavior, and not on its assumptions. While CAPM does notcompletely explain the variation in stock returns, it remains the most widely used method
for calculating the cost of capital.
8/14/2019 MF0001 Security Analysis
http://slidepdf.com/reader/full/mf0001-security-analysis 21/24
4b. Explain the relationship between CML and SML
Answer
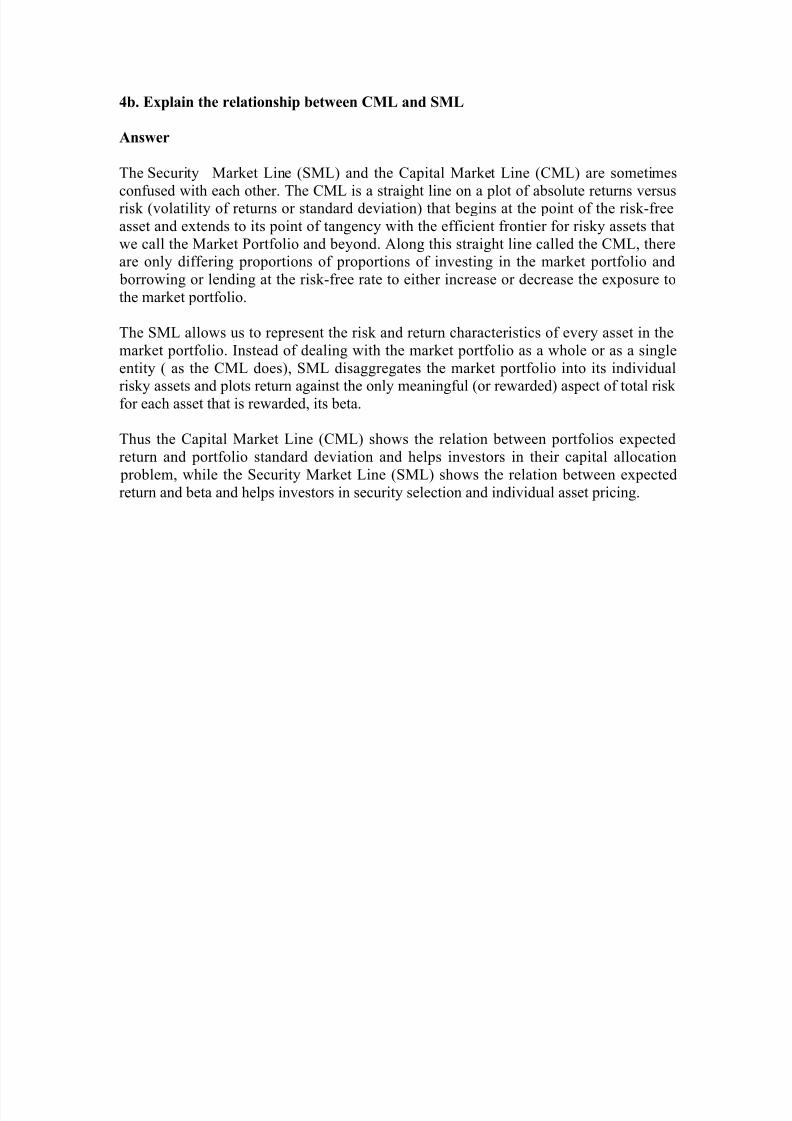
The Security Market Line (SML) and the Capital Market Line (CML) are sometimes
confused with each other. The CML is a straight line on a plot of absolute returns versusrisk (volatility of returns or standard deviation) that begins at the point of the risk-free
asset and extends to its point of tangency with the efficient frontier for risky assets that
we call the Market Portfolio and beyond. Along this straight line called the CML, thereare only differing proportions of proportions of investing in the market portfolio and
borrowing or lending at the risk-free rate to either increase or decrease the exposure to
the market portfolio.
The SML allows us to represent the risk and return characteristics of every asset in the
market portfolio. Instead of dealing with the market portfolio as a whole or as a single
entity ( as the CML does), SML disaggregates the market portfolio into its individual
risky assets and plots return against the only meaningful (or rewarded) aspect of total risk for each asset that is rewarded, its beta.
Thus the Capital Market Line (CML) shows the relation between portfolios expected
return and portfolio standard deviation and helps investors in their capital allocation
problem, while the Security Market Line (SML) shows the relation between expected
return and beta and helps investors in security selection and individual asset pricing.
8/14/2019 MF0001 Security Analysis
http://slidepdf.com/reader/full/mf0001-security-analysis 22/24
5 a. The total risk of a portfolio consist of two parts: Market risk (Systematic) and
Unique risk (unsystematic). Explain
Answer
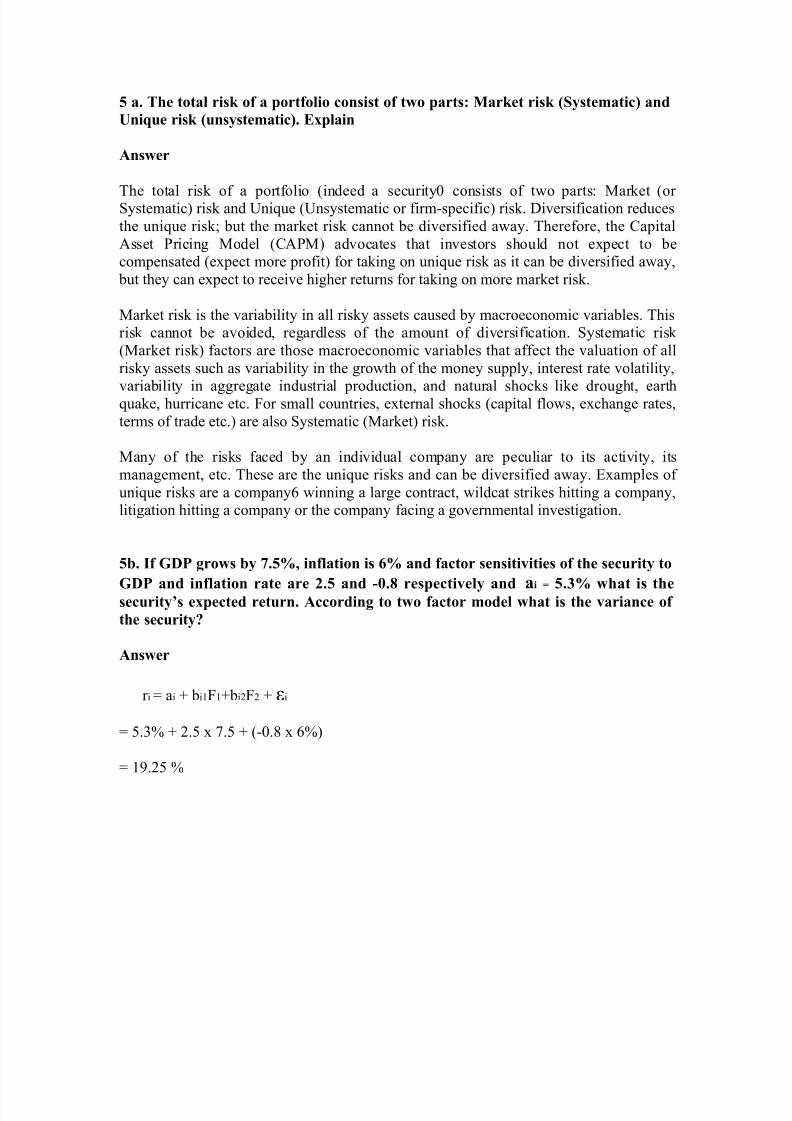
The total risk of a portfolio (indeed a security0 consists of two parts: Market (or Systematic) risk and Unique (Unsystematic or firm-specific) risk. Diversification reduces
the unique risk; but the market risk cannot be diversified away. Therefore, the Capital
Asset Pricing Model (CAPM) advocates that investors should not expect to becompensated (expect more profit) for taking on unique risk as it can be diversified away,
but they can expect to receive higher returns for taking on more market risk.
Market risk is the variability in all risky assets caused by macroeconomic variables. Thisrisk cannot be avoided, regardless of the amount of diversification. Systematic risk
(Market risk) factors are those macroeconomic variables that affect the valuation of all
risky assets such as variability in the growth of the money supply, interest rate volatility,
variability in aggregate industrial production, and natural shocks like drought, earthquake, hurricane etc. For small countries, external shocks (capital flows, exchange rates,
terms of trade etc.) are also Systematic (Market) risk.
Many of the risks faced by an individual company are peculiar to its activity, its
management, etc. These are the unique risks and can be diversified away. Examples of
unique risks are a company6 winning a large contract, wildcat strikes hitting a company,litigation hitting a company or the company facing a governmental investigation.
5b. If GDP grows by 7.5%, inflation is 6% and factor sensitivities of the security to
GDP and inflation rate are 2.5 and -0.8 respectively and ai = 5.3% what is thesecurity’s expected return. According to two factor model what is the variance of
the security?
Answer
r i = ai + bi1F1+bi2F2 + εi
= 5.3% + 2.5 x 7.5 + (-0.8 x 6%)
= 19.25 %
8/14/2019 MF0001 Security Analysis
http://slidepdf.com/reader/full/mf0001-security-analysis 23/24
Case Study
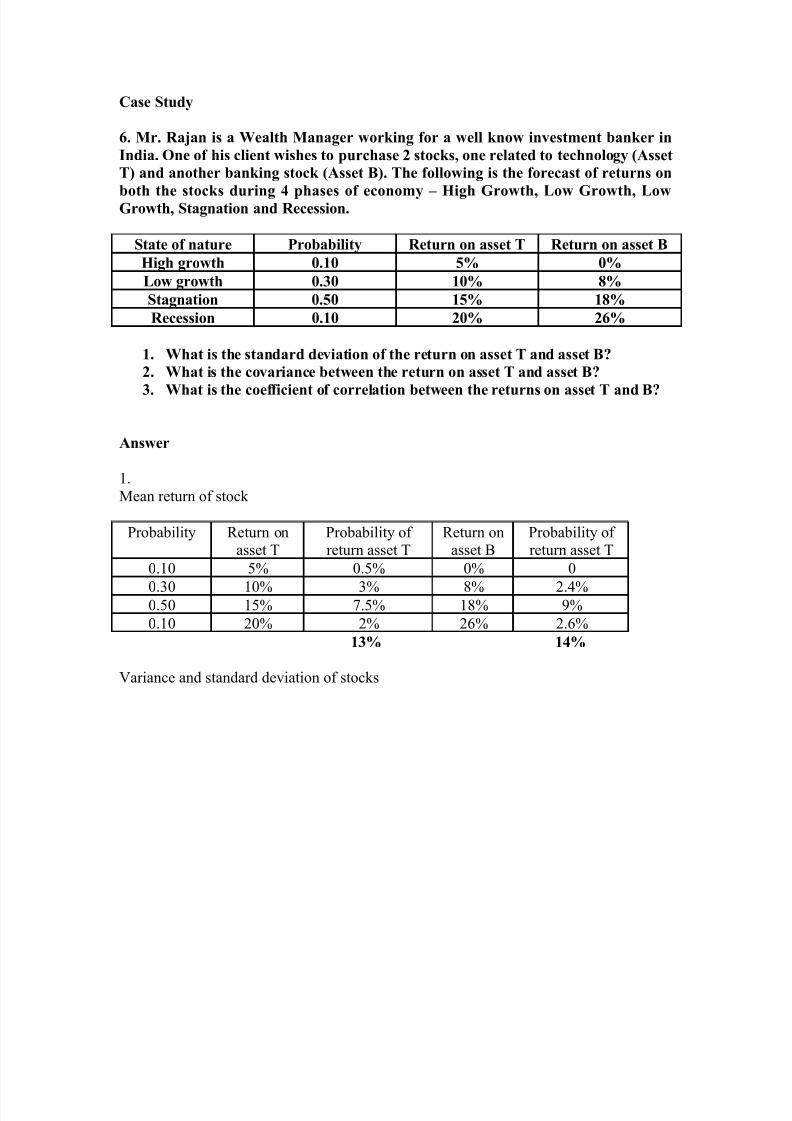
6. Mr. Rajan is a Wealth Manager working for a well know investment banker in
India. One of his client wishes to purchase 2 stocks, one related to technology (Asset
T) and another banking stock (Asset B). The following is the forecast of returns on
both the stocks during 4 phases of economy – High Growth, Low Growth, LowGrowth, Stagnation and Recession.
State of nature Probability Return on asset T Return on asset B
High growth 0.10 5% 0%
Low growth 0.30 10% 8%
Stagnation 0.50 15% 18%
Recession 0.10 20% 26%
1. What is the standard deviation of the return on asset T and asset B?
2. What is the covariance between the return on asset T and asset B?
3. What is the coefficient of correlation between the returns on asset T and B?
Answer
1.
Mean return of stock
Probability Return onasset T
Probability of return asset T
Return onasset B
Probability of return asset T
0.10 5% 0.5% 0% 0
0.30 10% 3% 8% 2.4%0.50 15% 7.5% 18% 9%
0.10 20% 2% 26% 2.6%
13% 14%
Variance and standard deviation of stocks

8/14/2019 MF0001 Security Analysis
http://slidepdf.com/reader/full/mf0001-security-analysis 24/24