mfda 2020 client research report - mutual fund dealers
TRANSCRIPT

CLIENT RESEARCH REPORT 2020
A CONTINUED LOOK INTO MEMBERS, ADVISORS AND CLIENTS

3 PART I: BACKGROUND3 Data Request4 Key Highlights
5 PART II: RESEARCH RESULTS
5 SECTION A: Client Demographics 5 Financial Wealth6 Canadian Households
6 MFDA Member Households
6 Change Since 2016
7 Client Investment Profiles7 Distribution of Client Investment Profiles
9 Cost Data
9 Fee-based Accounts
11 SECTION B: Distribution Models12 MFDA Assets and Households14 Client Age
15 SECTION C: Investment Products15 Investment Funds15 Investment Funds AUA by Fund Load Structure
16 Change in Distribution by Mutual Fund Load Structure
17 Financial Advisory Firms18 Advisors
20 APPENDIX A: PROVINCIAL DATA 20 MFDA Households Across Canada21 MFDA Assets Across Canada 22 MFDA Advisors Across Canada
CONTENTS:

3 MFDA | CLIENT RESEARCH REPORT 2020
While all securities regulators in Canada obtain data and information relating to the activities of the registrants they regulate, the MFDA has undertaken the unprecedented approach of also gathering detailed information relating to clients of MFDA Members. MFDA Members, more than any other securities registrant, provide services to the largest concentration of mass-market households in Canada (i.e. households with less than $100,000 in financial wealth). Protecting vulnerable investors, including seniors and investors with limited financial resources, is a key priority of the MFDA. While access to financial advice is important to all Canadians, it is especially so for those with limited financial resources. This collection of data allows us to monitor access to financial advice and the availability of choice in advisory services. With the aging population and decline in the number of defined benefit plans in Canada, it is imperative that Canadians, particularly mass-market households, continue have access to financial advice and the ability to choose services that meet their needs. Maintaining knowledge and awareness of client circumstances, outcomes, and issues that impact Canadian investors through the use of this data is key to meeting our investor protection mandate.
Data Request
In 2016, the MFDA undertook a client research project requesting that Members provide detailed information on the investments held by their clients.
Given the benefits achieved from the first client research project, MFDA decided to undertake another client research project in 2018 and publish an updated Client Research Report to provide greater transparency and insight into Members, their advisors and their clients as well as identify changes from 2016. MFDA Members were required to provide anonymized information for each client account and each household.
The final aggregated database contains millions of individual pieces of information in respect of:
• 87 Members;
• 16.3 million client accounts;
• 9.1 million households;
• 39.8 million individual investment positions reported in client accounts; and
• Around 60,000 different investment products held by clients.
PART I:BACKGROUND

4MFDA | CLIENT RESEARCH REPORT 2020
Key Highlights
2018 DATA
• Members serve approximately 9.1 million households and 81% of households have $100,000 or less in financial wealth (i.e. mass-market households) with MFDA Members
• Mass-market households own only 4% of the $4.4 trillion in total financial wealth in Canada
• 78% of clients are invested in a balanced or more conservative portfolio
• 86% of all client accounts are registered accounts
• MFDA advisors represent 85% of all securities licensed individuals in Canada who provide advice to retail investors
CHANGES SINCE 2016
in assets administered by MFDA Members
in deferred sales charge (DSC and LL) mutual funds held by clients
in mutual funds in fee-based accounts
in the number of advisors in the Financial Advisory channel
INCREASE8% DECREASE31%
INCREASE53% DECREASE17%

5 MFDA | CLIENT RESEARCH REPORT 2020
SECTION A: Client Demographics
Financial Wealth
Households have been categorized into the following financial wealth segments:
Financial wealth includes cash and investments. MFDA household financial wealth includes cash and investments held with or recorded on the books of MFDA Members.
(A.1) Comparing Canadian Households and the MFDA Client Household Base
PART II:RESEARCH RESULTS
HOUSEHOLD CATEGORY FINANCIAL WEALTH
MASS-MARKET <$100K
MID-MARKET$100K–$250K
$250K–$500K
AFFLUENT $500K+
CANADIAN HOUSEHOLD FINANCIAL WEALTH$4.4 TRILLION
HOUSEHOLDS FINANCIAL WEALTH
MFDA HOUSEHOLDS9.1 MILLION
MFDA HOUSEHOLD FINANCIAL WEALTH$685.1 BILLION
79% 7% 10%4%
81% 12% 5% 2%
86%4% 5%5%
26% 25% 21% 28%
<$100K $100K–$250K $250K–$500K $500K+
CANADIAN HOUSEHOLDS16.2 MILLION

6MFDA | CLIENT RESEARCH REPORT 2020
Canadian Households1
Most households in Canada (79%) are mass-market households who own $100,000 or less in financial wealth. However, mass-market households only own 4% of the $4.4 trillion in financial wealth in Canada. Conversely, affluent households represent only 10% of all households in Canada but own 86% of the $4.4 trillion in financial wealth. Mid-market households represent 11% of all Canadian households and own 10% of total Canadian household financial wealth.
MFDA Member Households
MFDA Members provide advisory services to 9.1 million Canadian households (or 56% of Canadian households) and administer $685.1 billion in financial assets.
Of the 9.1 million households serviced by MFDA members, 81% (or 7.4 million households) are mass-market households with less than $100,000 in MFDA financial wealth. Average household wealth of all MFDA Member clients was approximately $75,000.
While the number of households serviced by MFDA members in the various financial wealth segments appears to be consistent with the Canadian demographic, the amount of assets managed by MFDA Members for each financial wealth segment is significantly different from the Canadian household distribution of financial wealth.
All four financial wealth segments contribute almost equally to the $685 billion in MFDA Member assets under administration (AUA). Affluent households were only 2% of all households serviced by MFDA Members but they contributed almost the same amount (28%) to MFDA Member total AUA as mass-market households (26%). Even though mass-market households only own 4% of total financial wealth in Canada and 26% of total MFDA AUA, in terms of number of households, they were the largest and most significant segment of the Canadian population (79%) and MFDA client base (81%).
The above data demonstrates that mutual fund dealers provide the most accessible advisory service to retail investors in Canada.
Other registrants in the securities industry, such as investment dealers and portfolio managers have minimum account thresholds that generally make them inaccessible to mass-market households and in some cases, mid-market households. The fact that MFDA Members generally do not have minimum account sizes, and the features of the mutual fund product itself, assist in providing mass-market clients access to financial advice and to diversified and professionally managed investments.
Change Since 2016Since 2016, there has been a slight decrease in the percentage of mass-market households and increase in the percentage of affluent households in Canada. Similarly, the percentage of mass-market clients serviced by MFDA Members has slightly decreased and the percentage of midmarket clients slightly increased. Since clients tend to accumulate more financial wealth as they age, this slight shift in client financial wealth can be attributed to an aging population.
1 Investor Economics, 2019 Household Balance Sheet Report—Canada.

7MFDA | CLIENT RESEARCH REPORT 2020
Safety Conservative Income balanced
Neutral balanced
Equity balanced
Growth
Less than 10% equity and more than 50% cash and/or deposit
instruments
Up to 25% equity
>25% to 40% equity
>40% to 55% equity
>55% to 70% equity
>70% to 100% equity
Client Investment Profiles
To account for differences in asset mix, we categorized client portfolios into the six investment profiles outlined below.
Distribution of Client Investment Profiles
(A.2) Distribution of Households by Client Investment Profiles
The majority (65.3%) of households serviced by MFDA Members have a balanced mandate.
Given that almost two thirds of households have a balanced portfolio, we divided the balanced category further into three additional categories based on asset mix. We also analyzed the growth category to determine if it should be further segregated to identify profiles that had more of an aggressive growth mandate. Specifically we looked at portfolios that had 30% or more of assets in sector or specialty funds. The number of aggressive growth profiles was not significant (1.2% of all households) and therefore remain grouped within the growth category.
5.2%7.1%
12.6%
27.3% 25.4%23.4%
Safety Conservative Income balanced
Neutral balanced
Equity balanced
Growth

8 MFDA | CLIENT RESEARCH REPORT 2020
(A.3) Percentage of Households in Each Client Profile by Age
According to the data, clients reach the peak of equity exposure in the 45 - 54 year age range.
After age 55, clients shift from growth and equity balanced profiles to income balanced and, to a lesser extent, neutral balanced profiles. Clients under age 24 had more income balanced and less equity balanced and growth profiles. This may be because clients under 24, who are beginning to earn income and invest, may not have sufficient risk tolerance or risk capacity to withstand a market loss. The number of clients in safety and conservative profiles was relatively consistent across all age categories. Once clients reached age 65, there was an increase in the most conservative investment profiles (safety, conservative, income balanced). However, the majority of clients aged 65 and older still had balanced mandates, particularly neutral balanced portfolios. We note, however, that MFDA Members and their advisors may offer GICs and high interest savings accounts outside the firm and these assets would not be reflected in the above profiles.
SAFETY CONSERVATIVE INCOME BALANCED
NEUTRAL BALANCED
EQUITY BALANCED GROWTH
35.0%
30.0%
25.0%
20.0%
15.0%
10.0%
5.0%
0.0%0-24 25-34 35-44 45-54 55-64 65-74 75+

9MFDA | CLIENT RESEARCH REPORT 2020
Cost Data
(A.4) Average Costs per Client Profile based on MFDA Household Financial Wealth (in basis points)
The cost data reported above includes cost and compensation amounts paid to MFDA Members and does not include other costs of owning an investment fund such as fund management fees and operating costs.2
Account structures and fees can vary which is why we recommend clients work with their advisors to understand what they are paying for and their total cost of investing.
Average cost paid by all households was 83 basis points (bps) or 0.83% of assets.3 72% of all households paid less than 100 bps while 39% of all households paid less than 72 bps. We note however that we calculated average cost percentages using the market value of assets in client accounts at December 31, 2018. Given the market downturn at the end of 2018, the reported percentages may therefore be somewhat inflated.
As indicated in the graph above, cost varied depending on asset allocation and account size. In balanced and growth portfolios, costs converge as portfolio value increases to the point where there is little difference in cost where portfolios exceed $500,000. This cost convergence is because fee-based accounts become more prevalent as portfolio size increases. Fee based accounts are not as cost sensitive towards asset class allocation as accounts generating embedded compensation.
Fee-based Accounts
In fee-based accounts, fees are calculated as a percentage of the value of assets in an account. The fee rate generally declines as the size of the account increases.
The fee-based programs offered by Members vary. In some cases, Members establish a fee schedule that applies to all clients. In other cases, Members allow flexibility to advisors by establishing fees. Minimum account sizes also vary but are generally not offered to clients with accounts less than $100,000 in assets. In fact, 90% of F-class funds were held by households with more than $250,000 in financial wealth.
2 With the exception of fee-based programs holding non-embedded funds. See page 10 for a further explanation of non-embedded fee-based programs. 3 One basis point is equal to 1/100th of 1%, or 0.01%.
15 14 18 16
52
78 79 81 8063
82 87 89 92
58
8089 89 93
62
77 86 86 94
$0–100K $100–$250K $250–$500K $500K+
SAFETY CONSERVATIVE INCOME BALANCED
NEUTRAL BALANCED
EQUITY BALANCED GROWTH

10 MFDA | CLIENT RESEARCH REPORT 2020
In fee-based programs using F-class funds, the fee charged to clients only covers compensation to the dealer and advisor for their advisory services. With F-class funds, the fund management fees paid to the fund manager are included (i.e. embedded) in the fund’s management expense ratio. There are other programs within the MFDA membership where clients are charged one combined fee that includes both advisory fees as well as fund management fees (i.e. non-embedded or “NE” funds). Fee-based programs with non-embedded funds are predominantly offered by Members who are either affiliated with a fund manufacturer or have an exclusive distribution arrangement with a fund manufacturer.
Fee-based programs have become more prevalent within the MFDA membership since 2016.
As can be seen in (C.2) Distribution by Mutual Fund Load Structure, F-class and non-embedded funds have increased by $35 billion or 53% since 2016.
(A.5) Average Cost in Fee-based Accounts based on MFDA Household Financial Wealth
As mentioned previously, costs reported for fee-based programs holding F-class funds include advisory fees. However, costs reported for fee-based programs holding non-embedded funds include advisory and fund management fees.
While fees for both types of programs decrease as portfolio size increases, fees in non-embedded programs decrease at a greater pace. In non-embedded programs the manufacturer and dealer are typically affiliated which provides them with operating efficiencies and greater flexibility in establishing fee rates for both advisory and fund management revenues earned by the corporate group.
Fee-based Programs and Exchange Traded Funds (ETFs)
There has been much discussion in the industry about MFDA Members trading in ETFs. MFDA has seen an increase in the number of Members offering ETFs over the past couple of years. ETFs, however, have only been made available in fee-based programs. Mass-market clients (who represent 81% of the MFDA Member client base) generally do not have access to fee based accounts within the investment industry. Accordingly, we expect there will be an increase in Members offering ETFs to midmarket and affluent clients in the future but it is not clear whether this will be the case for mass-market clients.
F-CLASS NON-EMBEDDED
66.3 63.9 58.6 49.3
133.3114.6 100.7
64.7
$100–$250K $250–$500K $500–$1000K $1000K+

11MFDA | CLIENT RESEARCH REPORT 2020
FINANCIAL ADVISORY FIRMS
These firms almost exclusively employ advisors as agents and the advisors are responsible for developing their own book of business and financing their own business operations. These firms may be affiliated with an insurance carrier, fund manufacturer or completely independent of a product manufacturer. With one exception, all FA firms offer third party funds (or have “open” product shelves).
SECTION B: Distribution ModelsThere are different distribution models that operate within the MFDA membership. They vary by size, nature of employment of their sales force, investment products recommended and affiliation with fund manufacturers or other financial services entities. For the purposes of this Report, we have grouped MFDA Members into the following three categories:
DIRECT SELLERS
These firms are affiliated with fund companies and typically operate as call centres. Advisors are salaried employees of the affiliated fund company and only sell proprietary mutual funds. Advisors generally do not have their own books of business but instead service clients of the fund company.
DEPOSIT-TAKERS
These firms are affiliated with Canadian banks or credit unions. Advisors are generally salaried employees of the affiliated financial institution. Mutual funds are distributed through retail banking or credit union locations. While some deposit-takers do have advisors who are assigned clients and develop a client base, in general, most advisors with deposit-taker firms are not assigned to service specific clients. Rather, the advisors provide service to any client of the bank or credit union as needed.
DISTRIBUTION MODEL NUMBER OF FIRMS
DEPOSIT–TAKER 13
FINANCIAL ADVISORY 66
DIRECT SELLER 8
TOTAL 87

12MFDA | CLIENT RESEARCH REPORT 2020
MFDA Assets and Households
(B.1) MFDA Assets and Households by Distribution Model
The share of AUA, households and advisors for each distribution channel within the MFDA has remained relatively consistent from 2016. Deposit-Takers had the majority of household relationships (70%), AUA (59%) and advisors (64%) within the MFDA membership. Financial Advisory firms serviced 28% of all households but managed 39% of total AUA and employed 36% of all advisors within the membership. Direct sellers represented a relatively small segment of the MFDA membership servicing only 2% of households and managing 2% of membership AUA. Direct sellers predominantly operate on-line or through call centers and employ less than 1% of all MFDA advisors.
When breaking down the data provincially, the market share between the three distribution channels generally follows the national pattern with the exception of Saskatchewan and Manitoba.
Saskatchewan and Manitoba are the only provinces where the Financial Advisory channel has a greater share of assets than the Deposit-Takers firms.
Financial Advisory firms manage 52% of household assets in Saskatchewan and 56% of household assets in Manitoba. Additional segmented data by province can be found in Appendix A.
DEPOSIT–TAKER FINANCIAL ADVISORY DIRECT SELLER
* At January 2, 2019.
AUA
HOUSEHOLDS
ADVISORS
$685 BILLION
$9.1 MILLION
$79,622*
59%
70%
36%
39%
28%
64%
2%
2%

13MFDA | CLIENT RESEARCH REPORT 2020
(B.2) Asset Distribution by MFDA Household Financial Wealth Level
The graph above provides an overview and comparison of the client base within each distribution channel segmented by household wealth. In terms of AUA, affluent clients (>$500k) represented the largest client segment within the Financial Advisory (35%) and Direct Seller (46%) channels. Conversely, mass-market clients (<$100k) represented the largest client segment (31%) in the deposit taker channel. Deposit-Takers do not have the same percentage of mid-market and affluent clients because they may offer services to these clients through other affiliated registrants.
(B.3) Share of Total MFDA Member Households
The graph above provides a breakdown of the number of households serviced by MFDA Members based on household financial wealth and further segmented by distribution channel. Deposit-Takers serviced 72% of all mass-market households within the MFDA membership. Financial Advisory firms also play an important role in providing advisory services to the mass-market segment. While Financial Advisory firms provided services to 26% of all mass-market households, these households only contributed 18% to Financial Advisory firm AUA. Financial Advisory firms’ market share increased in the mid-market and affluent client segments. Deposit-Takers still, however, had the majority of the client relationships in all client wealth segments. Since 2016, Deposit-Takers have slightly increased their share of mid-market clients stemming from growth experienced in their dedicated financial planning businesses.
DEPOSIT–TAKER FINANCIAL ADVISORY DIRECT SELLER
$0–$100K
$100K–$250K
$250K–$500K
$500K+
72% 2%
63%
26%
36%
1%42%
51%
57%
7.4 MILLION
1.1 MILLION
423 THOUSAND
205 THOUSAND
MFDA HOUSEHOLDS
1%
47% 2%
<$100K $250K-$500K$100K-$250K >$500K
DEPOSIT-TAKER $404 BILLION
26%
20%
23%
31%
DIRECT SELLER $12 BILLION
46%22%
17%
15%
FINANCIAL ADVISORY $269 BILLION
35% 18%
24%23%

14 MFDA | CLIENT RESEARCH REPORT 2020
Client Age
(B.4) Household Distribution by Age Group
The age segmentation of the MFDA Member client base is generally aligned with the age segmentation of the Canadian population.
According to the above data, 23% of MFDA Members’ clients were between the ages of 55 and 64 and approaching retirement while 22% of MFDA Members’ clients were 65 years of age or older and potentially in retirement. Further, 18% of clients were 65 years of age or older and had less than $100,000 in financial wealth.
(B.5) Client Age By Distribution Channel
HOUSEHOLD AGE MFDA CANADA*
0-24 2% 5%
25-44 31% 31%
45-54 22% 19%
55-64 23% 18%
65+ 22% 27%
* Source: Strategic Insight (Canada).
HOUSEHOLD AGE DEPOSIT-TAKER FINANCIAL ADVISORY DIRECT SELLER
0-24 2% 2% 2%
25-44 32% 28% 42%
45-54 22% 23% 21%
55-64 23% 24% 18%
65+ 21% 23% 17%
The client base for Deposit-Taker and Financial Advisory firms were similar when it comes to client age. Direct Sellers, however, have a somewhat younger client base than both the Deposit-Taker and Financial Advisory firms. This difference is most likely because Direct Sellers have not been in business as long as the other distribution channels who have been able to establish an older and wealthier client base.

15 MFDA | CLIENT RESEARCH REPORT 2020
SECTION C: Investment Products
Investment Funds
(C.1) Mutual Fund Distribution by Regulatory Channel4
In 2018, Canadian investors held approximately $1.3 trillion in mutual funds5. Clients of MFDA Members held the majority of mutual funds in Canada (50%). Approximately 40% of mutual funds were held by clients of IIROC Members and the remaining 10% were held by clients of either a portfolio manager or exempt market dealer who are directly regulated by the Canadian Securities Administrators (CSA).
$1.3 TRILLION
10%
50%40%IIROC
CSA
MFDA
4 Strategic Insight. Does not include exchange-traded funds. 5 Ibid.
Investment Funds AUA by Load Structure
Explanation of load structures: Mutual fund assets were segmented into the following load structures:
DEFERRED SALES CHARGE
FRONT-END LOAD LOW-LOAD F-CLASS/
NON-EMBEDDED NO-LOAD
POINT OF SALE COMMISSION EMBEDDED CLIENT PAID EMBEDDED NONE NONE
TRAILER FEE EMBEDDED (30–50bps)
EMBEDDED (60–100bps)
EMBEDDED (40–70bps) NONE EMBEDDED
(50–100bps)
COMMENTS Up-front commission
paid by issuer
5–7 year redemption schedule
Commission paid by client at purchase (deducted
from amount invested)
Lower up-front commission paid
by issuer
Shorter redemption schedule
(e.g. 3 years)
No up-front commission
No trailer fee
F: advisory fees are non-embedded but fund management fees are
embedded
NE: fund management fees are also non-embedded
No up-front commission
DSC FEL LL F/NE NL

16MFDA | CLIENT RESEARCH REPORT 2020
Change in Distribution by Mutual Fund Load Structure
(C.2) Distribution by Mutual Fund Load Structure
Investment funds increased from $603 billion to $648 billion from 2016 to 2018.
The most significant change since 2016 was a decline in DSC funds held by clients.
DSC funds decreased by $34 billion or 31% given the general trend within the industry to limit or prohibit their sale.
No load funds are predominantly recommended by Deposit-Taker firms and continue to be the most common type of fund held by MFDA Members representing approximately 53% of all investment fund AUA. While non-embedded and F-class funds comprise only 16% of all investment fund AUA, they experienced the greatest growth since 2016 increasing by 53% or by $35 billion. Front-end load funds also increased by 18% or $19 billion and represent 19% of investment fund AUA. Based on observations from MFDA examinations, funds sold on a front-end basis are generally sold without an initial sales charge.
The above load analysis relates only to investment funds held by MFDA Member clients. Clients also held approximately $1 billion in other investment products with an MFDA Member that were subject to a DSC fee structure (predominantly segregated funds but also principal protected notes). Most advisors that sell segregated funds do so outside the MFDA Member. Where investment products are sold outside the MFDA Member, they would not be reflected on the books and records of the Member or reflected in the above data.
DSC/LL
FEL
F/NE
NL
2016
2018
2016
2018
2016
2018
2016
2018
DSC – $110B LL – $12B
$104B
F – $9B / NE – $57B
$311B
DSC – $76B LL – $8B
$123B
NE – $67BF – $34B
$340B

17 MFDA | CLIENT RESEARCH REPORT 2020
Financial Advisory Firms
(C.3) Load Type Share of Assets by MFDA Household Financial Wealth Level – Financial Advisory Firms
Financial Advisory firms have the most diverse operations and mix of load structures. When looking at the Financial Advisory firm client base, the amount of DSC funds held in client households decreases as the level of financial wealth increases.
Overall, there has been a decrease in DSC funds held by clients in all financial wealth segments as the industry continues to shift
away from them and towards funds without a load.
Mass-market clients continue to have the highest concentration of DSC funds (33%).
Front-end load funds were the most prevalent type of fund for clients regardless of household financial wealth asset levels within the Financial Advisory channel. This shift to front-end load funds is ongoing as our experience indicates that advisors switch 10% of DSC funds annually and the balance of DSC units upon expiration of the DSC redemption schedule to front-end load funds on a no load basis. There have also been shifts from DSC funds into F-class and non-embedded funds with the greatest change experienced by clients in the mid to mass-market segments.
FEL F/NE NLDSC LL
<$100K
$100K–$250K
$250K–$500K
$500K+
33%
22%
17%
11%
55%
61%
56%
45%
4%
4%
4%
6%
8%
14%
3%
7%
15%
27%3%
5%

18MFDA | CLIENT RESEARCH REPORT 2020
Advisors
(C.4) MFDA Share of Advisors in the Canadian Financial Services Landscape
There are 79,622 MFDA advisors across the country to serve investors, which is the largest proportion of securities registered advisors that work with retail clients in Canada. Almost all MFDA advisors are dually employed or licensed with a bank, credit union, or insurance agency. As a result, MFDA advisors are not limited to providing securities related advice but are able to provide financial advice across multiple financial service sectors. In the Financial Advisory channel, insurance advice is an important aspect of the advisory services provided to clients. Advisors’ insurance activity also provides another source of revenue which means that they are not solely reliant on mutual fund activity to finance their business.
6 As at January 2, 2019. 7 Investor Economics Household Balance Sheet Report—Canada, 2019. All numbers are approximate. IIROC advisors only include those in a direct advisory role
with retail clients.
23,7507 40,000755,872 7,8887 6,7857
Total Advisors136,061
MFDA Advisors(79,6226)
Insurance Advisors(71,638)
IIROC Advisors(14,528)

19 MFDA | CLIENT RESEARCH REPORT 2020
(C.5) Advisors by Book Size – Financial Advisory Firms
*excludes households with no advisor code. **based on advisor codes submitted to MFDA.
The number of advisors licensed by Financial Advisory firms decreased by 5,681 or 17% from 2016 to 2019. The majority of these advisors had books of less than $10 million. This decrease is largely a result of Members prohibiting the sale of DSC funds which small book advisors rely on to finance their operations. This illustrates the independent nature of the employment relationship of advisors in the Financial Advisory channel.
(C.6) Asset Load Type by Advisor Book Size – Financial Advisory Firms*
*includes only Financial Advisory firms with open product shelves.
This chart illustrates how advisors manage the load structure within their books of business to finance their operations. While the amount of DSC funds has decreased significantly from 2016 to 2018, DSC funds still make up almost half of the assets of advisors with books of under $2 million. As evidenced in the chart above, as advisors books of business grow, they finance their business through ongoing trailing and fee-based commissions rather than relying on upfront DSC commissions. As book size increases, advisors begin to move to fee-based or unbundled fee products, where they can demonstrate some pricing flexibility to their high-end clients.
FEL F/NE NLDSC LL
BOOK SIZE 2018 ASSETS (MILIIONS)
2018 HOUSEHOLDS*
2018 ADVISORS**
2016 ADVISORS**
CHANGE IN ADVISORS
<$500K $1,388 60,630 8,816 11,959 -3,143
$500K–$2M $5,933 152,956 5,385 7,064 -1,679
$2M–$10M $35,450 570,385 7,123 8,238 -1,115
$10M–$20M $42,115 452,845 2,945 3,099 -154
$20M–$50M $90,070 755,917 2,888 2,706 182
$50M+ $93,975 593,078 1,131 903 228
TOTAL $268,930 2,585,811 28,288 33,969 -5,681
<$2
$2–$10
$10–$20
$20–$50
>$50
48%
33%
23%
14%
8%
37%
49%
55%
57%
51%
4% 6%
9%
16%
12%
17%
22%
3%
2%
4%5%5%
5% 5%9%

20MFDA | CLIENT RESEARCH REPORT 2020
APPENDIX A:PROVINCIAL DATAMFDA Households Across Canada (‘000s)
BC1,222
YK, NT, NU20
AB987 SK
298ON
3,705
QC1,945 ATLANTIC
CANADA526
MB329
21MFDA | CLIENT RESEARCH REPORT 2020
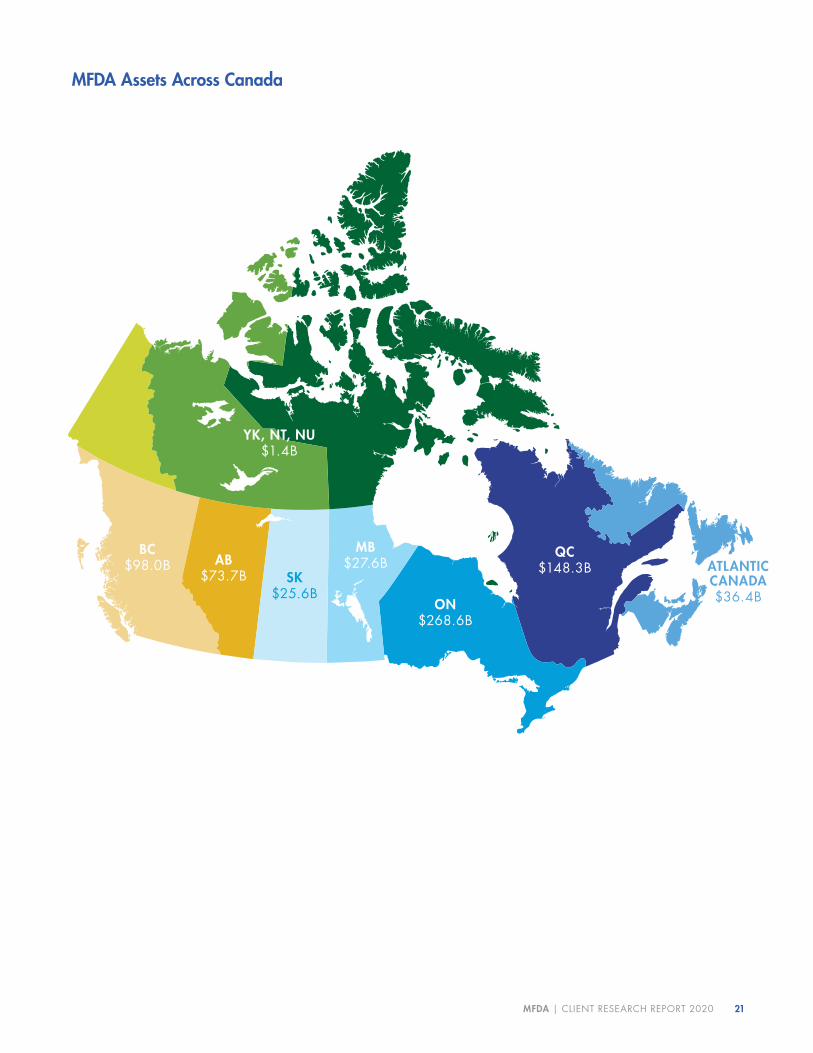
MFDA Assets Across Canada
BC$98.0B
YK, NT, NU$1.4B
AB$73.7B SK
$25.6BON
$268.6B
QC$148.3B
MB$27.6B ATLANTIC
CANADA$36.4B

22MFDA | CLIENT RESEARCH REPORT 2020
MFDA Advisors Across Canada
BC10,764
YK, NT, NU109
AB7,624 SK
2,239ON
33,172
QC19,514
MB2,285 ATLANTIC
CANADA3,915

Disclaimer: This publication is intended to convey information for regulatory discussion purposes only and is not to be used for any other purpose. While the MFDA (the “publisher”) and the parties providing data used in the report (the “data providers”) have taken precautions to determine that the information contained in this publication is reliable, and that the procedures used to summarize and analyze such information are based on acceptable practices and principles in the financial services industry, there is no guarantee that the information or analysis is accurate. The information and the underlying activity addressed in this report are subject to change at any time. The publisher and the data providers make no representation or warranty as to the accuracy, completeness or timeliness of information, analysis or views contained in this publication which are provided only for the purpose stated herein. The publisher and the data providers disclaim all liability of whatsoever kind for any damages or losses incurred as a result of reliance upon or use of this publication or the information, analysis or views contained therein.
121 King Street West, Suite 1000, Toronto, Ontario M5H 3T9
Mutual Fund Dealers Association of CanadaAssociation canadienne des courtiers de fonds mutuels