mgnrega, goi 2012-13 - accountability...
TRANSCRIPT

MGNREGA, GOI 2012-13
The Mahatma Gandhi National Rural
Employment Guarantee Act
(MGNREGA) is the flagship Rural
Development scheme of the
Government of India (GOI).
Using government reported data,
this brief analyses MGNREGA
progress along the following
parameters:
a) Trends in allocations and
expenditures,
b) Trends in employment provided
and wages paid,
c) Trends in assets created, and
d) Coverage.
Cost Share: 90% of funds come from
GOI. Fund release is based on State
proposals and submission of a labour
budget by States (estimating the
anticipated demand for work). At
least 50% of MGNREGA works are to
be executed by the Gram Panchayats.
Complete expenditure data is
publicly available for FY 2010-11.
Highlights
1 GOI allocation for Ministry of Rural`90,435
Development* in FY 2011-13 (in crores)
2 GOI allocation for MGNREGA in`33,000
FY 2011-12 (in crores)
3 GOI release for MGNREGA in FY 2010-11 86%
* This includes allocations for the newly formed Ministry of Drinking Water
and Sanitation which is `14,005 crores.
Accountability Initiative, Centre for Policy Research, Dharam Marg, Chanakyapuri, New Delhi - 110021
Tel: (011) 2611 5273-76, Fax: 2687 2746, Email: [email protected]
www.accountabilityindia.in
Summary and Analysis
1. The Ministry of Rural Development’s (MORD) budget has
increased nearly 3-fold since FY 2006-07. In FY 2012-13,
MORD allocations account for 14% of GOI’s budget. In FY
2012-13, MGNREGA allocations account for 36% of total
MORD budget.
2. In FY 2010-11, GOI spent 75% of its MGNREGA funds. There
are variations across states. Rajasthan spent 56% whereas
Bihar spent 84% of available funds.
3. In FY 2010-11, 257 crore person days of work was provided
across the country. Trends across years show variations in
employment provided. Employment in Rajasthan dipped from
69 person days in FY 2009-10 to 62 person days in FY 2010-
11. Employment generated in Bihar increased from 28 to 34
person days over the same period.
4. Employment generated in states with high Below Poverty Line
(BPL) populations was low compared to states with a low BPL
population. In FY 2010-11, Uttar Pradesh - which accounts
for 20% of the country’s BPL population - generated 13% of
the total MGNREGA employment provided while Andhra
Pradesh and Tamil Nadu, which together account for 8% of
the country's rural BPL households, provided 23% of total
MGNREGA employment.
5. Employment under MGNREGA by income category indicates
that 40% of households accessing MGNREGA fall within the
low-income group, with a monthly per capita income of up
to ̀ 657. 42% of MGNREGA households fall within the middle-
income group with a monthly per capita income up to ̀ 1,058.

Budget Briefs-Rural Development Sector Vol 4 Issue 3 Accountability Initiative
- 2 - February, 2012
Trends in Overall Allocations andExpenditures at GOI level
● Allocations: Allocations for the Ministry ofRural Development (MORD) have increasednearly 3-fold since FY 2006-07. `90,435crores have been allocated to MORD in FY2012-13. This includes allocations to thenewly formed Ministry of Drinking Waterand Sanitation, earlier a department withinthe MORD. This year, the MORD budgetaccounts for 14 percent of total GOIallocations.
● Launched in 2006, the Mahatma GandhiNational Rural Employment Guarantee Act(MGNREGA) is the largest programme runby the ministry, receiving 36 percent of thetotal allocation for rural development inFY 2012-13. `33,000 crores have beenallocated to MGNREGA in FY 2012-13.
Nearly 3-fold increase in allocations for
rural development in the last 6 years.
● Expenditure as a proportion of total funds
available has remained consistent over the
last three financial years. In FY 2009-10,
77 percent of funds available were spent.
This declined marginally to 75 percent in
FY 2010-11.
● Component-wise expenditure: In FY 2010-
11, wages accounted for 65 percent of the
total expenditure on MGNREGA. Materials
accounted for 30 percent. Administrative
costs amounted to 5 percent of the total
expenditure. This corresponds with
MGNREGA norms, which mandate a
minimum 60:40 ratio for labour costs
(wages) to cost of materials for asset
creation.
Trends in Expenditures at the State Level
● There are wide inter-state variations in
spending. Between FY 2009-10 and FY
2010-11, spending improved in Haryana,
Bihar and Madhya Pradesh by 19, 7 and 5
percentage points respectively. For the
same period, expenditure in Rajasthan and
Odisha saw a declined by of 10 percentage
points, each.
In FY 2010-11 Haryana spent 93% of its
funds; while Rajasthan spent 56%.
Source: Union Expenditure Budget, Vol 2. Ministry of RuralDevelopment FY 2005-06 and FY 2012-13 Note: Figures in croresof rupees. Till FY 2011-12, figures are revised estimates. Figuresfor FY 2012-13 are budget estimates.
● MGNREGA is a demand-driven scheme.Every year, states provide details ofanticipated demand for unskilled manualwork and draft a plan for providingemployment to workers. This is submittedto GOI as the Labour Budget.
● The requirement of funds is based onprojections made in this Labour Budget,after taking into account utilisation offunds previously released.
● Expenditure performance: Total fundsavailable for MGNREGA expenditure in agiven year comprises of total releases (GOIand State), based on the Labour Budget andunspent monies from previous years.
Source: Calculated from MGNREGA, Delivery Monitoring Unit
Report, Financial. Available online at: http://164.100.12.7/
Netnrega/mpr_ht/nregampr_dmu.aspx?flag=1&page1=S&month
=Latest&fin_year=2010-2011 Note: Figures are for FY 2009-10
and FY 2010-11.
Budget Briefs-Rural Development Sector Vol 4 Issue 3 Accountability Initiative
February, 2012 - 3 -
● In FY 2009-10, Karnataka spent 82 percent
of available funds. This improved
significantly in FY 2010-11 to 118 percent.
● Component-wise expenditure: There are
variations across states in labour and
material ratios. While states such as Assam
and Bihar spent less than 60 percent of
their funds on wages, Tamil Nadu spent
100 percent.
Implementation Highlights
● Person days of work generated: In FY
2009-10, `37,910 crore was spent on
MGNREGA and 284 crore person days of
work were generated. In FY 2010-11,
expenditure increased marginally to
`39,377 crores, and 257 crores of person
days of employment were generated.
● There is a mismatch between the
anticipated demand for employment by
households in the Labour Budgets and the
actual work generated.
● Tamil Nadu and West Bengal met over 90
percent of their Labour Budget targets.
Karnataka, on the other hand, met only 36
percent of its target.
Karnataka reported high expenditures
under MGNREGA but only met 36% of its
Labour Budget demand.
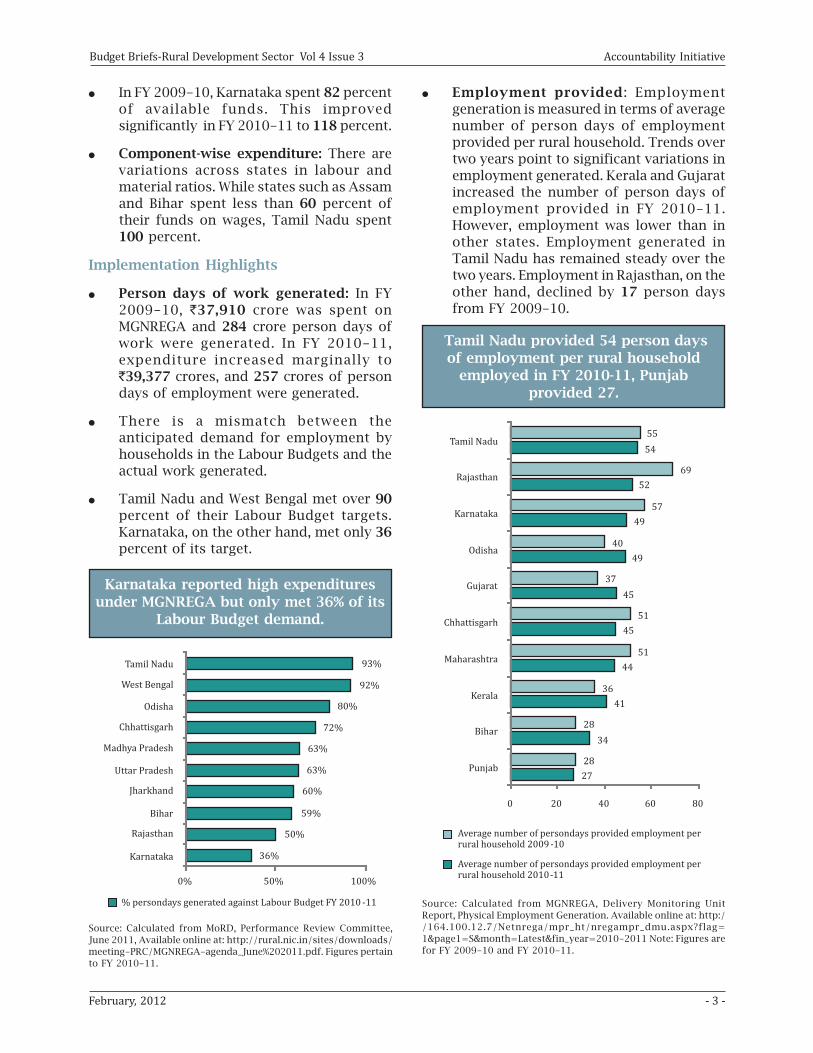
● Employment provided: Employment
generation is measured in terms of average
number of person days of employment
provided per rural household. Trends over
two years point to significant variations in
employment generated. Kerala and Gujarat
increased the number of person days of
employment provided in FY 2010-11.
However, employment was lower than in
other states. Employment generated in
Tamil Nadu has remained steady over the
two years. Employment in Rajasthan, on the
other hand, declined by 17 person days
from FY 2009-10.
Tamil Nadu provided 54 person days
of employment per rural household
employed in FY 2010-11, Punjab
provided 27.
Source: Calculated from MoRD, Performance Review Committee,
June 2011, Available online at: http://rural.nic.in/sites/downloads/
meeting-PRC/MGNREGA-agenda_June%202011.pdf. Figures pertain
to FY 2010-11.
Source: Calculated from MGNREGA, Delivery Monitoring Unit
Report, Physical Employment Generation. Available online at: http:/
/164.100.12.7/Netnrega/mpr_ht/nregampr_dmu.aspx?flag=
1&page1=S&month=Latest&fin_year=2010-2011 Note: Figures are
for FY 2009-10 and FY 2010-11.

Budget Briefs-Rural Development Sector Vol 4 Issue 3 Accountability Initiative
- 4 - February, 2012
● Wages: Average wage paid per person day
of employment increased to `100 in FY
2010-11. This is a 10 percentage point
improvement over the previous year. The
quantum of increase varies by state. Wages
in Karnataka and Maharashtra, for instance,
increased by `58 and `40, respectively. In
contrast, wages in Rajasthan and Odisha,
declined by `12 and `10, respectively.
● GOI is empowered to fix the wage rate for
MGNREGA workers. In January 2011, GOI
issued a notification for revising the
minimum wage for MGNREGA across all
states.
● A comparison of the GOI minimum wage
notification with the average wages paid
per person in FY 2010-11 points to wide
differences in minimum wages paid under
MGNREGA and the GOI notified wage rate.
Rajasthan and Tamil Nadu reported
average daily wage payments of `75 and
`82, respectively. This is significantly below
the notified wage rate of `119. Haryana,
however, paid an average wage of `169 per
person per day. This is much closer to the
notified wage rate of `179.
● Another point of comparison is between
MGNREGA wage rates and the minimum
wages for agricultural unskilled labour in
each state. Median figures were taken for
states with multiple rates for agricultural
unskilled workers.
● Rajasthan, Bihar, Madhya Pradesh, and
Kerala currently pay less than both the
minimum wage rate and the notified wage
rate under MGNREGA.
In FY 2010-11, Rajasthan spent an
average of `75 on wages. In comparison,
the GOI notified wage rate for Rajasthan
stood at `119 and the minimum wage for
agricultural unskilled work was `135.
Source: Calculated from MGNREGA, Delivery Monitoring Unit
Report, Financial. Available online at: http://164.100.12.7/
N e t n r e g a / m p r _ h t / n r e g a m p r _ d m u . a s p x ? f l a g = 1 &
page1=S&month=Latest&fin_year=2010-2011 Note: Figures are for
FY 2008-09 and FY 2009-10. Notified wage rate as on January
2011 is available online at: http://nrega.nic.in/circular/
WageRate_1jan2011.pdf.
● Correlations can be drawn between total
expenditure, wages paid and person days
of employment generated. Rajasthan, a low
spender, also provided low employment at
52 person days per rural household
employed, a significant decline from the
previous year. Its average wage, too, was
relatively low at `75. Similarly, Madhya
Pradesh, also a low spender, provided 50
person days at a wage rate of `98.

Budget Briefs-Rural Development Sector Vol 4 Issue 3 Accountability Initiative
February, 2012 - 5 -
Financial Inclusion
● In May 2008, GOI directed state
governments to pay MGNREGA wages
through banks and post offices rather than
cash payments.
● In FY 2010-11, over 90 percent of wages
in Odisha and Haryana were disbursed
through banks and post offices. On the
other hand, Kerala and Tamil Nadu
prefered cash payments and distributed
only 10 and 2 percent of all wages,
respectively through banks and post office
accounts.
Most states report disbursing wages
through post offices and banks.
Water conservation accounts for 20% of
MGNREGA work.
Source: Calculated from MGNREGA. Reports From MIS 2010-11.
Available online at: http://164.100.12.7/netnrega/state_html/
mis_bank_post_wrt_dmd.aspx?fin_year=2010-2011.
Physical Assets Created
● Several types of works are undertaken
under MGNREGA. These include: water
conservation and water harvesting;
irrigation; flood control and protection;
drought-proofing; horticulture; renovation
of traditional water bodies; land
development and rural connectivity
amongst others. FY 2010-11 saw the
introduction of a new type of work – the
Rajiv Gandhi Sewa Kendra (building
MGNREGA offices at the Gram Panchayat
(GP) and block levels).
Source: Calculated from MGNREGA, Delivery Monitoring Unit
Report, Physical (Asset). Note: Figures are for FY 2009-10. Available
online at: http://nrega.nic.in/Netnrega/mpr_ht/nregampr_dmu.
aspx?fin_year=2009-2010&month=Latest&flag=2&page1=S.
● In FY 2010-11, water conservation and
water harvesting accounted for the largest
share of MGNREGA works at 20 percent.
This was followed by rural connectivity and
provision of irrigation facilities for land
owned by Scheduled Castes (SCs),
Scheduled Tribes (STs) and small and
marginal farmers, at 18 percent each.
● 49 percent of works were completed in FY
2009-10 and 51 percent works were
completed in FY 2010-11.
● However, trends over two years point to
variations in the completion rates of
different MGNREGA works.

Budget Briefs-Rural Development Sector Vol 4 Issue 3 Accountability Initiative
- 6 - February, 2012
51% of MGNREGA works were completed
in FY 2010-11.
wise break-up of completed work reveals
that expenditure on land owned by the
above categories accounted for 44 percent
of total expenditure. The remaining
expenditure was booked in a category
called “Others”. Details of this category
have not been provided in the data source.
Coverage of MGNREGA
● Who accesses the MGNREGA? And to what
extent has the programme provided
livelihood security to India’s poorest? In
this brief we attempt to answer these
questions in two ways. First, at a macro
level, by examining employment levels in
poorer states, with high BPL populations.
This is based on MGNREGA MIS data.
Second, we draw on NSSO data to examine
MGNREGA employment trends across
household income levels.
● Employment levels in states with high BPL
populations: Using Labour Budget
projections of BPL populations, we analyse
the links between high BPL population
states and the number of days of
employment provided per person as a ratio
of total employment generated in the
country. Analysis highlights that Uttar
Pradesh, Bihar, West Bengal and Madhya
Pradesh, which together comprise 59
percent of the total rural BPL population,
account for only 34 percent of the total
employment generated (in person-days).
On the other hand, Andhra Pradesh and
Tamil Nadu, which together account for 8
percent of rural BPL households, provided
23 percent of person days of employment
generated.
Source: Calculated from MGNREGA, Delivery Monitoring Unit
Report, Physical (Asset). Note: Figures pertain to FY 2009-10 and
FY 2010-11. Available online at: http://164.100.12.7/Netnrega/
mpr_ht/nregampr_dmu.aspx?flag=2&page1=S&month=
Latest&fin_year=2010-2011.
● Completion rates for micro irrigation, land
development and renovation of traditional
water bodies have seen an improvement in
FY 2010-11.
● Completion rates for provision of irrigation
facilities on land owned by SCs, STs, small
and marginal farmers, and beneficiaries of
land reforms and the Indira Awaas Yojana
have not improved. Data on the category-

Budget Briefs-Rural Development Sector Vol 4 Issue 3 Accountability Initiative
February, 2012 - 7 -
4 states with nearly 60% of the share of
BPL households accounted for only 34%
of employment generated.
Source: Calculated from MGNREGA, Delivery Monitoring UnitReport, Physical Employment Generation. Available online at: http://164.100.12.7/Netnrega/mpr_ht/nregampr_dmu.aspx?flag=1&page1=S&month=Latest&fin_year=2010-2011. Figures forpercentage of rural BPL households is available from MGNREGA<Labour Budget. Available at: http://164.100.12.7/Netnrega/writereaddata/state_out/lab_budget_1_nt_2012-2013.htmlNote:Figures for rural households pertain to Census 2001 and figuresfor persondays pertain to FY 2010-11.
● Employment provided across income
levels: The 66 th round of the NSSO
highlights that 82 percent of MGNREGA
workers belong to the low (bottom 30
percent with a monthly income of up to
`657) and middle (middle 40 percent with
a monthly income between `657 and
`1,058) income group.
● In poorer states, such as Chhattisgarh, and
Rajasthan, 79 and 77 percent of MGNREGA
participants were drawn from the low and
middle income group. In Bihar and
Jharkhand 86 and 85 percent participants
came from these income groups.
● In Maharashtra and Odisha, more than 50
percent MGNREGA participants belonged
to the low income group.
63% of MGNREGA participants in
Maharashtra were from the lowest
income group.
Source: 66th Round of the National Sample Survey, Employment
and Unemployment Survey. Rural poverty estimates drawn from
Bhalla, S, “The real scandal” Indian Express, 4th February 2012.

Budget Briefs-Rural Development Sector Vol 4 Issue 3 Accountability Initiative
- 8 - February, 2012
Prepared byAvani Kapur, [email protected], Anirvan Chowdhury, [email protected] &
Gayatri Sahgal, [email protected]
Special Thanks: Madhuri Sharma, National Informatics Centre & Rahul Pathak, Centre for Policy Research
This section offers some practical leads to accessing detailed information on the union
government's rural development sector budget. However, reader patience and persistence is
advised as a lot of this information tends to be dense and hidden amongst reams of data.
Data Sources
Union Budget, Expenditure Vol.2www.indiabudget.nic.in
MGNREGA, Monthly Progress Reports, FinancialPerformance under MGNREGA during the yearhttp://nrega.nic.in/netnrega/mpr_ht/stMPR_fin.aspxAccessed on February 17, 2012.
MGNREGA, Monthly Progress Reports ImplementationStatus Reportshttp://nrega.nic.in/netnrega/mpr_ht/nregampr.aspxAccessed on February 17, 2012.
MGNREGA, Monthly Progress Report, DMU Report,http://nrega.nic.in/Netnrega/mpr_ht/nregampr_dmu.aspx?fin_year=2009-2010&month=Latest&flag=2&page1=SAccessed on February 18, 2012.
MGNREGA, MIS, Labour Budget Report, DemandProjection Analysis for individual states. http://164.100.12.7/netnrega/morelabour.asp.Accessed on February 19, 2012.
Ministry of Labour and Employment, Wage Cell,Minimum Wages,http://labour.nic.in/wagecell/welcome.htmlAccessed on February 19, 2012.
Useful Tips
This volume provides total ministry-wise anddepartment-wise allocations, as well asdisaggregated data according to sectors andschemes from 1998-99. The data has both revisedand budget estimates, and should be calculatedaccording to the Major-Head and Sub Major-Head.For rural employment, the head is 2505.
State-wise and year-wise details on openingbalance, releases (GOI and State), fund availabilityand cumulative expenditure on wages, materialsand administration.
State-wise and year-wise details on cumulativenumber of job cards issued, person days in lakhs,number of households which demanded andreceived employment, funds available, centralrelease and total expenditure.
State-wise data on physical assets taken up andcompleted under MGNREGA. Data is available forFY 2008-09 and FY 2009-10.
State-wise Labour Budgets with details on job cardsissued, households provided employment, persondays employment generated, wages and centralfunds received and spent.
Budget Briefs is an attempt to undertake basic analysis on social sector budget data including trends in allocationand expenditure patterns and collate and make accessible budget data sources. Information from this documentmay be reproduced or redistributed for non-commercial purposes in part or in full with due acknowledgement toAccountability Initiative ("AI"). The opinions expressed are those of the author(s). More information on BudgetBriefs can be found at: http://www.accountabilityindia.in/expenditure_track
Note: Data used for analysing MGNREGA is based on Monthly Progress Reports (MPR) available in theDelivery Monitoring Unit Report. Since FY 2011-12, the MIS is the only source of MGNREGA data and eventhe MPR is calculated on the basis of the MIS.