miami-dade county district school boardsherrill f. norman, cpa auditor general report no. 2017-194...
TRANSCRIPT

Sherrill F. Norman, CPA
Auditor General
Report No. 2017-194
March 2017
MIAMI-DADE COUNTY
DISTRICT SCHOOL BOARD
For the Fiscal Year Ended
June 30, 2016
Finan
cial and Fed
eral Single Audit

Board Members and Superintendent
During the 2015-16 fiscal year, Mr. Alberto M. Carvalho served as Superintendent of the Miami-Dade
County Schools and the following individuals served as School Board Members:
District No. Dr. Wilbert “Tee” Holloway 1 Dr. Dorothy Bendross-Mindingall, Vice Chair from 11-17-15 2 Dr. Martin S. Karp 3 Ms. Perla Tabares Hantman, Chair 4 Ms. Susie V. Castillo 5 Ms. Raquel A. Regalado 6 Ms. Lubby Navarro 7Dr. Marta Pérez 8 Dr. Lawrence S. Feldman, 9 Vice Chair to 11-16-15
The Auditor General conducts audits of governmental entities to provide the Legislature, Florida’s citizens, public entity
management, and other stakeholders unbiased, timely, and relevant information for use in promoting government
accountability and stewardship and improving government operations.
The team leader was Kirenia Nieto, CPA, and the audit was supervised by Hector J. Quevedo, CPA.
Please address inquiries regarding this report to Micah E. Rodgers, CPA, Audit Supervisor, by e-mail at
[email protected] or by telephone at (850) 412-2905.
This report and other reports prepared by the Auditor General are available at:
www.myflorida.com/audgen
Printed copies of our reports may be requested by contacting us at:
State of Florida Auditor General
Claude Pepper Building, Suite G74 ∙ 111 West Madison Street ∙ Tallahassee, FL 32399-1450 ∙ (850) 412-2722

MIAMI-DADE COUNTY DISTRICT SCHOOL BOARD
TABLE OF CONTENTS
Page No.
SUMMARY ........................................................................................................................................ i
INDEPENDENT AUDITOR’S REPORT
Report on the Financial Statements .............................................................................................. 1
Other Reporting Required by Government Auditing Standards .................................................... 3
MANAGEMENT’S DISCUSSION AND ANALYSIS ........................................................................... 4
BASIC FINANCIAL STATEMENTS
Statement of Net Position ............................................................................................................. 20
Statement of Activities ................................................................................................................... 22
Balance Sheet – Governmental Funds ......................................................................................... 24
Reconciliation of the Governmental Funds Balance Sheet to the Statement of Net Position .................................................................................................. 26
Statement of Revenues, Expenditures, and Changes in Fund Balances – Governmental Funds ....................................................................................... 28
Reconciliation of the Governmental Funds Statement of Revenues, Expenditures, and Changes in Fund Balances to the Statement of Activities ....................................................................................................... 30
Statement of Net Position – Proprietary Fund ............................................................................... 32
Statement of Revenues, Expenses, and Changes in Fund Net Position – Proprietary Fund ................................................................................................... 33
Statement of Cash Flows – Proprietary Fund ............................................................................... 34
Statement of Fiduciary Net Position – Fiduciary Funds ................................................................ 35
Statement of Changes in Fiduciary Net Position – Fiduciary Fund ............................................... 36
Notes to Financial Statements ...................................................................................................... 37
OTHER REQUIRED SUPPLEMENTARY INFORMATION
Schedule of Revenues, Expenditures, and Changes in Fund Balance – Budget and Actual General Fund ............................................................................................................. 96
Schedule of the District’s Proportionate Share of the Net Pension Liability – Florida Retirement System Pension Plan ................................................................................................ 98
Schedule of District Contributions – Florida Retirement System Pension Plan ............................ 98
Schedule of the District’s Proportionate Share of the Net Pension Liability – Health Insurance Subsidy Pension Plan ................................................................................................. 99
Schedule of District Contributions – Health Insurance Subsidy Pension Plan .............................. 99
Schedule of Changes in the Net Pension Liability and Related Ratios – Supplemental Early Retirement Pension Trust Fund .......................................................................................... 100

MIAMI-DADE COUNTY DISTRICT SCHOOL BOARD
TABLE OF CONTENTS (CONTINUED)
Page No.
OTHER REQUIRED SUPPLEMENTARY INFORMATION (CONTINUED)
Schedule of Investment Returns – Supplemental Early Retirement Pension Trust Fund ............. 101
Schedule of Contributions – Supplemental Early Retirement Pension Trust Fund ....................... 101
Schedule of Funding Progress – Other Postemployment Benefits Plan ....................................... 102
Schedule of Employer Contributions – Other Postemployment Benefits Plan .............................. 102
SCHEDULE OF EXPENDITURES OF FEDERAL AWARDS ............................................................ 104
INDEPENDENT AUDITOR’S REPORT ON INTERNAL CONTROL OVER FINANCIAL REPORTING AND ON COMPLIANCE AND OTHER MATTERS BASED ON AN AUDIT OF FINANCIAL STATEMENTS PERFORMED IN ACCORDANCE WITH GOVERNMENT AUDITING STANDARDS ............................................. 107
INDEPENDENT AUDITOR’S REPORT ON COMPLIANCE FOR EACH MAJOR FEDERAL PROGRAM AND REPORT ON INTERNAL CONTROL OVER COMPLIANCE REQUIRED BY THE UNIFORM GUIDANCE .......................................................... 109
SCHEDULE OF FINDINGS AND QUESTIONED COSTS ................................................................ 112
PRIOR AUDIT FOLLOW-UP ............................................................................................................. 116
SUMMARY SCHEDULE OF PRIOR AUDIT FINDINGS .................................................................... 116
CORRECTIVE ACTION PLAN .......................................................................................................... 117

Report No. 2017-194 March 2017 Page i
SUMMARY
SUMMARY OF REPORT ON FINANCIAL STATEMENTS
Our audit disclosed that the Miami-Dade County District School Board (District’s) basic financial
statements were presented fairly, in all material respects, in accordance with prescribed financial
reporting standards.
SUMMARY OF REPORT ON INTERNAL CONTROL AND COMPLIANCE
Our audit did not identify any deficiencies in internal control over financial reporting that we consider to
be material weaknesses.
The results of our tests disclosed no instances of noncompliance or other matters that are required to be
reported under Government Auditing Standards issued by the Comptroller General of the United States;
however, we noted a certain additional matter as summarized below.
Additional Matter
Finding No. 2016-001: District financial reporting procedures need improvement to ensure consistent,
proper reporting of discretely presented component units.
SUMMARY OF REPORT ON FEDERAL AWARDS
We audited the District’s compliance with applicable Federal awards requirements. The Title I, Career
and Technical Education, English Language Acquisition, Teacher Incentive Fund, Race-to-the-Top,
Refugee and Entrant Assistance, and Head Start programs were audited as major Federal programs.
The results of our audit indicated that the District materially complied with the requirements that could
have a direct and material effect on each of its major Federal programs.
AUDIT OBJECTIVES AND SCOPE
Our audit objectives were to determine whether the School Board and its officers with administrative and
stewardship responsibilities for District operations had:
Presented the District’s basic financial statements in accordance with generally accepted accounting principles;
Established and implemented internal control over financial reporting and compliance with requirements that could have a direct and material effect on the financial statements or on the District’s major Federal programs;
Complied with the various provisions of laws, rules, regulations, contracts, and grant agreements that are material to the financial statements, and those applicable to the District’s major Federal programs; and
Taken corrective actions for Federal awards findings included in the previous audit report.
The scope of this audit included an examination of the District’s basic financial statements and the
accompanying Schedule of Expenditures of Federal Awards as of and for the fiscal year ended
June 30, 2016. We obtained an understanding of the District’s environment, including its internal control,

Report No. 2017-194 Page ii March 2017
and assessed the risk of material misstatement necessary to plan the audit of the basic financial
statements and Federal awards. We also examined various transactions to determine whether they were
executed, in both manner and substance, in accordance with governing provisions of laws, rules,
regulations, contracts, and grant agreements. The results of our operational audit of the District will be
presented in a separate report.
AUDIT METHODOLOGY
We conducted our audit in accordance with auditing standards generally accepted in the United States
of America; applicable standards contained in Government Auditing Standards, issued by the Comptroller
General of the United States; and Title 2 U.S. Code of Federal Regulations Part 200, Uniform
Administrative Requirements, Cost Principles, and Audit Requirements for Federal Awards.

Report No. 2017-194 March 2017 Page 1
Phone: (850) 412-2722 Fax: (850) 488-6975
Sherrill F. Norman, CPA Auditor General
AUDITOR GENERAL STATE OF FLORIDA Claude Denson Pepper Building, Suite G74
111 West Madison Street Tallahassee, Florida 32399-1450
The President of the Senate, the Speaker of the House of Representatives, and the Legislative Auditing Committee
INDEPENDENT AUDITOR’S REPORT
Report on the Financial Statements
We have audited the accompanying financial statements of the governmental activities, the aggregate
discretely presented component units, each major fund, and the aggregate remaining fund information of
the Miami-Dade County District School Board, as of and for the fiscal year ended June 30, 2016, and the
related notes to the financial statements, which collectively comprise the District’s basic financial
statements as listed in the table of contents.
Management’s Responsibility for the Financial Statements
Management is responsible for the preparation and fair presentation of these financial statements in
accordance with accounting principles generally accepted in the United States of America; this includes
the design, implementation, and maintenance of internal control relevant to the preparation and fair
presentation of financial statements that are free from material misstatement, whether due to fraud or
error.
Auditor’s Responsibility
Our responsibility is to express opinions on these financial statements based on our audit. We did not
audit the financial statements of the aggregate discretely presented component units, which represent
100 percent of the transactions and account balances of the aggregate discretely presented component
units’ columns. Those statements were audited by other auditors whose reports have been furnished to
us, and our opinion, insofar as it relates to the amounts included for the aggregate discretely presented
component units, is based solely on the reports of the other auditors. We conducted our audit in
accordance with auditing standards generally accepted in the United States of America and the standards
applicable to financial audits contained in Government Auditing Standards, issued by the Comptroller
General of the United States. Those standards require that we plan and perform the audit to obtain
reasonable assurance about whether the financial statements are free from material misstatement.

Report No. 2017-194 Page 2 March 2017
An audit involves performing procedures to obtain audit evidence about the amounts and disclosures in
the financial statements. The procedures selected depend on the auditor’s judgment, including the
assessment of the risks of material misstatement of the financial statements, whether due to fraud or
error. In making those risk assessments, the auditor considers internal control relevant to the entity’s
preparation and fair presentation of the financial statements in order to design audit procedures that are
appropriate in the circumstances, but not for the purpose of expressing an opinion on the effectiveness
of the entity’s internal control. Accordingly, we express no such opinion. An audit also includes
evaluating the appropriateness of accounting policies used and the reasonableness of significant
accounting estimates made by management, as well as evaluating the overall presentation of the
financial statements.
We believe that the audit evidence we have obtained is sufficient and appropriate to provide a basis for
our audit opinions.
Opinions
In our opinion, based on our audit and the reports of other auditors, the financial statements referred to
above present fairly, in all material respects, the respective financial position of the governmental
activities, the aggregate discretely presented component units, each major fund, and the aggregate
remaining fund information of the Miami-Dade County District School Board, as of June 30, 2016, and
the respective changes in financial position and, where applicable, cash flows thereof for the fiscal year
then ended in accordance with accounting principles generally accepted in the United States of America.
Other Matters
Required Supplementary Information
Accounting principles generally accepted in the United States of America require that MANAGEMENT’S
DISCUSSION AND ANALYSIS, the Schedule of Revenues, Expenditures, and Changes in Fund
Balance – Budget and Actual General Fund, Schedule of the District’s Proportionate Share of the
Net Pension Liability – Florida Retirement System Pension Plan, Schedule of District
Contributions – Florida Retirement System Pension Plan, Schedule of the District’s Proportionate
Share of the Net Pension Liability – Health Insurance Subsidy Pension Plan, Schedule of District
Contributions – Health Insurance Subsidy Pension Plan, Schedule of Changes in the Net Pension
Liability and Related Ratios – Supplemental Early Retirement Pension Trust Fund, Schedule of
Investment Returns – Supplemental Early Retirement Pension Trust Fund, Schedule of
Contributions – Supplemental Early Retirement Pension Trust Fund, Schedule of
Funding Progress – Other Postemployment Benefits Plan, and Schedule of Employer
Contributions – Other Postemployment Benefits Plan, as listed in the table of contents, be presented
to supplement the basic financial statements. Such information, although not a part of the basic financial
statements, is required by the Governmental Accounting Standards Board who considers it to be an
essential part of financial reporting for placing the basic financial statements in an appropriate
operational, economic, or historical context. We have applied certain limited procedures to the required
supplementary information in accordance with auditing standards generally accepted in the United States
of America, which consisted of inquiries of management about the methods of preparing the information
and comparing the information for consistency with management’s responses to our inquiries, the basic

Report No. 2017-194 March 2017 Page 3
financial statements, and other knowledge we obtained during our audit of the basic financial statements.
We do not express an opinion or provide any assurance on the information because the limited
procedures do not provide us with sufficient evidence to express an opinion or provide any assurance.
Supplementary Information
Our audit was conducted for the purpose of forming opinions on the financial statements that collectively
comprise the District’s basic financial statements. The accompanying SCHEDULE OF EXPENDITURES
OF FEDERAL AWARDS, as required by Title 2 U.S. Code of Federal Regulations Part 200, Uniform
Administrative Requirements, Cost Principles, and Audit Requirements for Federal Awards, is presented
for purposes of additional analysis and is not a required part of the basic financial statements.
The accompanying SCHEDULE OF EXPENDITURES OF FEDERAL AWARDS is the responsibility of
management and was derived from and relates directly to the underlying accounting and other records
used to prepare the basic financial statements. Such information has been subjected to the auditing
procedures applied in the audit of the basic financial statements and certain additional procedures,
including comparing and reconciling such information directly to the underlying accounting and other
records used to prepare the basic financial statements or to the basic financial statements themselves,
and other additional procedures in accordance with auditing standards generally accepted in the United
States of America. In our opinion, the accompanying SCHEDULE OF EXPENDITURES OF FEDERAL
AWARDS is fairly stated, in all material respects, in relation to the basic financial statements as a whole.
Other Reporting Required by Government Auditing Standards
In accordance with Government Auditing Standards, we have also issued a report dated March 27, 2017,
on our consideration of the District’s internal control over financial reporting and on our tests of its
compliance with certain provisions of laws, rules, regulations, contracts, and grant agreements and other
matters included under the heading INDEPENDENT AUDITOR’S REPORT ON INTERNAL CONTROL
OVER FINANCIAL REPORTING AND ON COMPLIANCE AND OTHER MATTERS BASED ON AN
AUDIT OF FINANCIAL STATEMENTS PERFORMED IN ACCORDANCE WITH GOVERNMENT
AUDITING STANDARDS. The purpose of that report is to describe the scope of our testing of internal
control over financial reporting and compliance and the results of that testing, and not to provide an
opinion on internal control over financial reporting or on compliance. That report is an integral part of an
audit performed in accordance with Government Auditing Standards in considering the District’s internal
control over financial reporting and compliance.
Respectfully submitted, Sherrill F. Norman, CPA Tallahassee, Florida March 27, 2017

Report No. 2017-194 Page 4 March 2017
MANAGEMENT’S DISCUSSION AND ANALYSIS
The Management’s Discussion and Analysis (MD&A) of the School Board of Miami-Dade County, Florida
(the District), is intended to provide an overview of the District’s financial position and changes in financial
position for the fiscal year ended June 30, 2016.
Since the focus of the MD&A is on current year activities, resulting changes, and currently known facts,
it should be read in conjunction with the District’s financial statements, including the accompanying notes.
Additionally, as a required part of the MD&A, comparative information for the current year and prior year
is presented for financial analysis to enhance the understanding of the District’s financial performance.
FINANCIAL HIGHLIGHTS
At June 30, 2016, the General Fund had a total fund balance of $175.3 million. This fund balance was
comprised of $7.7 million of nonspendable funds, $8.6 million of restricted funds, $38.6 million of
assigned funds, and $120.4 million of unassigned funds.
General Fund fund balance increased by $50.7 million, or 40.7% from the previous year primarily due to
an increase in tax collections, as well as the continued effort to curtail expenditures.
Special revenue funds ended the year with a fund balance of $28.8 million, an increase of $6.6 million or
29.7% from the previous year primarily due to increases in revenues and a slight reduction of costs.
Debt service funds ended the year with a fund balance of $44.1 million, an increase of $3.9 million or
9.6% from the previous year primarily due to increases in the collection of taxes.
Capital projects funds ended the year with a fund balance of $289.8 million, an increase of $75.6 million
or 35.3% from the previous year primarily due to the issuance of $192.7 million in General Obligation
Bonds (GOBs) and the accelerated pace in the implementation of the GOB program.
During the 2015-16 fiscal year, the District refunded several of the outstanding certificates of participation
(COP) bonds that provided significant net present value savings and cash flow savings, which reduced
future debt service by over $52 million. In July 2016, the District issued the third tranche of the GOBs
that provided $200 million of project funds. The School Board also authorized the issuance of the fourth
GOB tranche to be issued at the beginning of the 2016-17 fiscal year to provide funding for the
accelerated project schedule, based on project expenditures and cash flow projections.

Report No. 2017-194 March 2017 Page 5
Moody’s Investors Service and Standard & Poor’s (S&P) rating agencies maintained an assignment of
“A1” and “A” rating, respectively, for the COP outstanding issues, and also affirmed the outstanding GOB
ratings of “Aa3” and “A+”, respectively. Moody’s maintained its stable outlook while S&P changed the
District’s outlook from stable to positive, citing improved financial results for the 2014-15 fiscal year along
with good financial management policies and practices.
USING THIS REPORT
The Annual Financial Report of the District is comprised of different sections. The following graphic is
provided to facilitate the understanding of the format and its components:
Basic Financial Statements
OVERVIEW OF THE FINANCIAL STATEMENTS
The District’s Annual Financial Report consists of a series of financial statements and accompanying
notes with the primary focus being on the District as a whole. The statement of net position and the
statement of activities are government-wide financial statements that provide both short-term and
long-term information about the District’s overall financial position. The fund financial statements report
the District’s operations in more detail by providing information as to how services are financed in the
short-term, as well as the remaining available resources for future spending. Additionally, the fund
financial statements focus on major funds rather than fund types. The proprietary fund statements offer
short-term and long-term financial information about the activities of the District as it relates to the group
health self-insurance program. The remaining statements, the fiduciary funds statements, provide
financial information for those activities in which the District acts solely as a trustee or agent for the benefit
of others. The accompanying notes provide essential information that is not disclosed on the face of the
financial statements. Consequently, the notes are an integral part of the basic financial statements.
Government-wide Financial Statements
The Statement of Net Position and the Statement of Activities – Most of the activities of the District
are reported in these statements, including instruction, instructional support services, operations and
maintenance, school administration, general administration, student transportation, and food service.
Report No. 2017-194 Page 6 March 2017
Additionally, all State and Federal grants, as well as capital and debt financing activities are reported in
these statements.
The statement of net position and the statement of activities present a view of the District’s financial
operations as a whole, reflect all financial transactions, and provide information helpful in determining
whether the District’s financial position has improved or deteriorated as a result of current year’s activities.
The implementation of GASB Statements No. 68 and No. 71 had a significant impact on the reporting of
the District’s liabilities as it relates to pensions and, consequently, a material impact to the District’s net
position. Both of these statements are prepared using the accrual basis of accounting similar to that
used by most private-sector companies. The statement of net position includes assets plus deferred
outflows of resources, and liabilities, less deferred inflows of resources, both short-term and long-term.
The statement of activities reports all of the current year’s revenues and expenses regardless of when
cash is received or paid. The two government-wide statements report the District’s net position and the
changes that resulted from the District’s operations. The relationship between revenues and expenses
indicates the District’s operating results. Over time, increases and decreases in the District’s net position
are an indicator of whether the District’s financial position is improving or deteriorating. However, as a
governmental entity, the District’s activities are not geared towards generating profits as are the activities
of commercial entities. Other factors, such as the safety of schools and quality of education, must be
considered in order to reasonably assess the District’s overall performance, particularly because of the
limited resources available.
Fund Financial Statements
The District’s fund financial statements provide a detailed short-term view of the District’s operations,
focusing on its most significant or “major” funds. Certain funds are required by law while others are
created by legal agreements, such as bond covenants. The District establishes other funds to ensure
and demonstrate compliance with finance-related legal requirements and prudent fiscal management.
The District has three kinds of funds – governmental funds, a proprietary fund, and fiduciary funds.
Governmental Funds - The accounting for most of the District’s basic services is included in the
governmental funds. The measurement focus and basis of accounting continue to be reported using the
modified accrual basis of accounting, which measures inflows and outflows of current financial resources
and the remaining balances at year-end that are available for spending. Furthermore, under this basis
of accounting, changes in net spendable assets normally are recognized only to the extent that they are
expected to have a near-term impact. Inflows of financial resources are recognized only if they are
available to liquidate liabilities of the current period. Similarly, future outflows are typically recognized
only if they represent a depletion of current financial resources. The District’s major governmental funds
are the General Fund, General Obligation School Bonds Funds, and Capital Improvement – Local
Optional Millage Levy (LOML) Funds. The differences in the amounts reported between the fund
statements and the government-wide financial statements are explained in the reconciliations provided
on Pages 26, 30, and 31.
Proprietary Fund - The District maintains an internal service fund as its only proprietary fund. Internal
service funds are an accounting device used to accumulate and allocate costs internally among the
District’s various functions. The District uses the internal service fund to report the activities of the group

Report No. 2017-194 March 2017 Page 7
health self-insurance program. Since these services predominantly benefit governmental rather than
business-type functions, the internal service fund has been included within governmental activities in the
government-wide financial statements. The District’s proprietary fund activity is reported in the statement
of net position, the statement of revenues expenses and changes in net position, and the statement of
cash flows – proprietary fund on Pages 32 through 34.
Fiduciary Funds - The District is the trustee, or fiduciary, for resources held for the benefit of others,
such as the student activities fund and the Pension Trust Fund. The District’s fiduciary activities are
reported in the statement of fiduciary net position on Page 35 and the statement of changes in fiduciary
net position on Page 36. The resources accounted for in these funds are excluded from the
government-wide financial statements because these funds are not available to finance the District’s
operations. Consequently, the District is responsible for ensuring that these resources are used only for
their intended purposes.
Notes to Financial Statements
The notes provide disclosures and additional information that is essential for a full understanding of the
financial information presented in the government-wide and fund financial statements.
Other Information
In addition to the basic financial statements and accompanying notes, this report also presents required
supplementary information beginning on Page 96.
GOVERNMENT-WIDE FINANCIAL ANALYSIS
Statement of Net Position
The following table provides a comparative analysis of the District’s net position for the fiscal years ended
June 30, 2016 and 2015.

Report No. 2017-194 Page 8 March 2017
CONDENSED STATEMENT OF NET POSITION - GOVERNMENTAL ACTIVITIES June 30, 2016 and 2015
($ in millions)
Difference %Increase Increase
Categories 2015/16 2014/15 (Decrease) (Decrease)
Current and Other Assets 881.1$ 728.7$ 152.4$ 20.9%Capital Assets, Net 4,463.4 4,503.8 (40.4) (0.9)%
Total Assets 5,344.5 5,232.5 112.0 2.1%
Deferred Outflows of Resources Accumulated Decrease in Fair Value Hedging Derivatives 30.4 26.6 3.8 14.3% Deferred Loss on Refundings 120.6 55.2 65.4 118.5% Pensions 274.1 199.5 74.6 37.4%
Total Assets and Deferred Outflows of Resources 5,769.6 5,513.8 255.8 4.6%
Current Liabilities 498.0 488.2 9.8 2.0%Long-term Liabilities 4,873.0 4,411.7 461.3 10.5%
Total Liabilities 5,371.0 4,899.9 471.1 9.6%
Deferred Inflows of Resources Pensions 207.1 498.6 (291.5) (58.5)%
Total Liabilities and Deferred Inflows of Resources 5,578.1 5,398.5 179.6 3.3%
Net Position Net Investment in Capital Assets 1,363.0 1,444.1 (81.1) (5.6)% Restricted 111.1 55.3 55.8 100.9% Unrestricted (Deficit) (1,282.6) (1,384.1) 101.5 7.3%
Total Net Position 191.5$ 115.3$ 76.2$ 66.1%
The District’s total assets plus deferred outflows of resources were $5.8 billion and total liabilities and
deferred inflows of resources were $5.6 billion at the end of the current fiscal year.
The District’s net position totaled $191.5 million at June 30, 2016. The largest portion of the District’s net
position, $1.4 billion reflects its investment in capital assets (e.g., land, buildings, furniture, fixtures,
and equipment), net of depreciation and less any outstanding debt used to construct or acquire those
assets. Restricted net position in the amount of $111.1 million is reported separately to show legal
constraints, from debt covenants and enabling legislation. The $(1.3) billion unrestricted deficit in net
position reflects the shortfall the District would face in the event it would have to liquidate all of its
non-capital liabilities, including insurance claims payable, compensated absences, pensions, and other
postemployment benefits at June 30, 2016. Consequently, these long-term considerations have a
significant impact on the resulting net position. A deficit in unrestricted net position should not be

Report No. 2017-194 March 2017 Page 9
considered, solely, as evidence of economic financial difficulties, but rather as a result of different
measurement focuses; long-term compared to short-term perspectives.
Statement of Activities
The following table summarizes the changes in the District’s net position from its activities for the fiscal
years ended June 30, 2016 and 2015.
CHANGES IN NET POSITION - GOVERNMENTAL ACTIVITIES For Fiscal Years Ended June 30, 2016 and 2015
($ in millions) Difference %Increase Increase
2015/16 2014/15 (Decrease) (Decrease)RevenuesProgram Revenues: Charges for Services 49.6$ 50.2$ (0.6)$ (1.2)% Operating Grants and Contributions 152.6 147.0 5.6 3.8% Capital Grants and Contributions 63.2 75.7 (12.5) (16.5)% Total Program Revenues 265.4 272.9 (7.5) (2.7)%General Revenues: Ad Valorem Taxes 1,868.5 1,778.4 90.1 5.1% Grants and Contributions Not Restricted to Specific Programs 1,442.6 1,476.3 (33.7) (2.3)% Investment Earnings 4.3 2.5 1.8 72.0% Miscellaneous 34.8 54.0 (19.2) (35.6)% Total General Revenues 3,350.2 3,311.2 39.0 1.2% Total Revenues 3,615.6 3,584.1 31.5 0.9%
ExpensesInstructional Services 1,986.7 1,954.2 32.5 1.7%Instructional Support Services 286.5 280.0 6.5 2.3%Student Transportation Services 91.4 76.7 14.7 19.2%Operations and Maintenance of Plant 352.4 357.8 (5.4) (1.5)%Food Service 159.2 159.5 (0.3) (0.2)%School Administration 157.4 154.2 3.2 2.1%General Administration 13.3 12.6 0.7 5.6%Business/Central Services 62.8 66.7 (3.9) (5.8)%Administrative Technology Services 3.1 2.8 0.3 10.7%Facilities Acquisition and Construction 100.1 101.0 (0.9) (0.9)%Interest on Long-Term Debt 133.4 137.1 (3.7) (2.7)%Community Services 29.3 30.2 (0.9) (3.0)%Unallocated Depreciation/Amortization 163.8 160.1 3.7 2.3%
Total Expenses 3,539.4 3,492.9 46.5 1.3%
Increase (Decrease) in Net Position 76.2 91.2 (15.0) (16.4)%
Net Position, Beginning 115.3 1,228.6 (1,113.3) (90.6)%Prior Year Restatement - (1,204.5) (1,204.5)
Net Position, Ending 191.5$ 115.3$ 76.2$ 66.1%
The District’s net position increased by $76.2 million or 66.1% from the prior year primarily due to an
increase in the collection of ad valorem taxes during the fiscal year.

Report No. 2017-194 Page 10 March 2017
Governmental Activities
The statement of activities reports gross expenses, offsetting program
revenues and the resulting net expense (cost) by functions for the
current year. The net cost of each of the District’s functions represents
the expenses that must be subsidized by general revenues, including
tax dollars. As reflected in the statement of activities, total expenses
for governmental activities excluding unallocated depreciation
expense totaled $3,375.6 million, of which $265.4 million was financed
by charges for services and other program revenues. The resulting
net costs of $3,110.2 million, excluding unallocated depreciation expense, were financed primarily by
Florida Education Finance Program (FEFP) dollars and property taxes.
The table below presents a comparative analysis of the cost and the net cost of each of the District’s
functions: School Level Services include Instruction, Student Services (counselors, psychologists, and
visiting teachers), Transportation, Custodial and Maintenance (including utilities), School Administration
and Community Services; Instructional Support Services include Curriculum Development and Staff
Training; Business/Central Services include Accounting, Budget, Payroll, Accounts Payable, Cash and
Debt Management, Purchasing, Personnel, Data Processing, Risk Management, and Warehousing;
General Administration; and Facilities Acquisition and Construction.
Net Cost of Governmental Activities
For Fiscal Years Ended June 30, 2016 and 2015
($ in millions)
Difference %Increase Increase
2015/16 2014/15 (Decrease) (Decrease)
Total Cost of Services School Level Services 2,776.4$ 2,732.5$ 43.9$ 1.6% Instructional Support Services 286.5 280.0 6.5 2.3% Business/Central Services 199.3 206.7 (7.4) (3.6)% General Administration 13.3 12.6 0.7 5.6% Facilities Acquisition and Construction 100.1 101.0 (0.9) (0.9)% Total Cost of Services* 3,375.6$ 3,332.8$ 42.8$ 1.3%
Net Cost of Services School Level Services 2,555.4$ 2,510.1$ 45.3$ 1.8% Instructional Support Services 286.5 280.0 6.5 2.3% Business/Central Services 188.7 193.2 (4.5) (2.3)% General Administration 13.3 12.6 0.7 5.6% Facilities Acquisition and Construction 66.3 64.0 2.3 3.6% Net Cost of Services* 3,110.2$ 3,059.9$ 50.3$ 1.6%
*Excluding unallocated depreciation expense.

Report No. 2017-194 March 2017 Page 11
FINANCIAL ANALYSIS OF THE DISTRICT’S FUNDS
As noted earlier, the District uses fund accounting to ensure and demonstrate compliance with
finance-related legal requirements. Financial information is presented separately in the Balance Sheet,
and in the Statement of Revenues, Expenditures, and Changes in Fund Balances for the District’s
major funds: General Fund, General Obligation School Bonds Funds, and Capital Improvement – Local
Optional Millage Levy (LOML) Funds. Financial information for the nonmajor governmental funds is
aggregated and presented in a single column.
GENERAL FUND
The General Fund is the primary operating fund for the District. Presented below is an overall analysis
of the General Fund as compared to the prior year.
CHANGES IN GENERAL FUND ACTIVITY
For Fiscal Years 2015/16 AND 2014/15
($ in thousands)
Difference %Increase Increase
2015/16 2014/15 (Decrease) (Decrease)
CategoriesRevenues 2,675,087$ 2,638,468$ 36,619$ 1.4%Other Financing Sources 154,560 163,253 (8,693) (5.3)%Beginning Fund Balance 124,554 56,532 68,022 120.3% Total 2,954,201$ 2,858,253$ 95,948$ 3.4%
Expenditures 2,763,724$ 2,723,009$ 40,715$ 1.5%Other Financing Uses 15,177 10,690 4,487 42.0%Ending Fund Balance 175,300 124,554 50,746 40.7% Total 2,954,201$ 2,858,253$ 95,948$ 3.4%
The General Fund is the chief operating fund of the District. Overall revenues increased by $36.6 million
or 1.4% from the previous year. The increase is primarily due to an increase in the collection of property
taxes.
Expenditures increased by $40.7 million or 1.5% from the previous year. The increase is primarily
attributed to an increase in fringe benefits, mainly health insurance and other operation costs.
Ending Fund Balance increased by $50.7 million or 40.7% primarily due to the increase in tax collections
and sound financial management.

Report No. 2017-194 Page 12 March 2017
CHANGES IN GENERAL FUND ACTIVITY For Fiscal Years 2015/16 and 2014/15
($ in millions)
Revenues By Source
Revenues - Overall revenues increased by $36.6 million or 1.4% as follows:
REVENUES BY SOURCE For Fiscal Years 2015/16 and 2014/15
($ in thousands)
Difference %Increase Increase
Source 2015/16 2014/15 (Decrease) (Decrease)
Federal 17,802$ 20,799$ (2,997)$ (14.4)%State 1,144,212 1,174,172 (29,960) (2.6)%Local 1,513,073 1,443,497 69,576 4.8%
Total 2,675,087$ 2,638,468$ 36,619$ 1.4%
Federal sources decreased by $(3.0) million or (14.4)% from the prior year. This decrease was primarily
due to a decrease in Medicaid reimbursement.
State sources decreased by $(30.0) million or (2.6)% from the prior year. This decrease was primarily
due to a reduction in FEFP funding.
Local sources increased by $69.6 million or 4.8% from the prior year. This increase is primarily due to
an increase in the collection of taxes as well as a slight increase in investment income and other
miscellaneous revenues.
Expenditures by Function
Expenditures - Overall expenditures increased by $40.7 million or 1.5% as follows:
2,675.1
154.6 124.6
2,763.7
15.2175.3
2,638.5
163.3 56.5
2,723.0
10.7124.6
Revenues Other FinancingSources
Beginning FundBalance
Expenditures Other FinancingUses
Ending FundBalance
2015/16 2014/15

Report No. 2017-194 March 2017 Page 13
EXPENDITURES BY FUNCTION For Fiscal Years 2015/16 and 2014/15
($ in thousands)
Difference %Increase Increase
Functions 2015/16 2014/15 (Decrease) (Decrease)
School LevelServices 2,621,899$ 2,580,182$ 41,717$ 1.6%
Instructional Support Services 60,294 59,372 922 1.6%
Business Services/Central Adm. 65,701 68,937 (3,236) (4.7)%
School Board 7,729 7,273 456 6.3%
General Administration 5,653 5,419 234 4.3%
Facilities and OtherCapital Outlay 2,448 1,826 622 34.1%
Total 2,763,724$ 2,723,009$ 40,715$ 1.5%
Salaries and fringe benefits represent the most significant expenditures of the District specifically as it
relates to school level expenditures. During the 2015-16 fiscal year, the administration continued to
implement cost reduction strategies to meet the financial challenges of revenue losses and increased
costs.
GENERAL OBLIGATION BONDS
On November 6, 2012, Miami-Dade County voters authorized the issuance of $1.2 billion of General
Obligation Bonds (GOBs) for the modernization and construction of public school facilities, including
educational technology upgrades. In the 2015-16 fiscal year, the District issued $192.7 million of
Series 2015 GOBs at a premium which will provide approximately $200 million of project funding. This
is the third issuance in the $1.2 billion series approved by the voters on November 6, 2012. The GOBs
program continues at an accelerated pace with close to 450 projects at various stages of completion.
The 2015-16 fiscal year ended with a total fund balance of $161.9 million.
CAPITAL IMPROVEMENT - LOCAL OPTIONAL MILLAGE LEVY (LOML)
Capital Improvement - Local Optional Millage Levy (LOML) funds constitute the primary source of
revenue in the Capital Budget. The Florida Legislature decreased the maximum allowable millage to be
used for capital purposes from 1.75 mills to 1.50 mills in the 2009-10 fiscal year with the flexibility of
shifting 0.25 mills back from the operating budget. For the 2015-16 fiscal year, the District availed itself
of 0.061 of the 0.25 mills flexibility provided by law. Total fund balance of $64.3 million represents an
increase of $32.0 million or 99% from the previous year. The increase can be attributed primarily to an
increase in the collection of taxes. Of the total fund balance, $46.1 million is restricted for capital projects,
and $18.2 million is nonspendable.

Report No. 2017-194 Page 14 March 2017
BUDGETARY HIGHLIGHTS
Most District operations are funded in the General Fund. The majority of the General Fund revenues are
distributed to the District through the Florida Education Finance Program (FEFP), which uses formulas
to distribute State funds and an amount of local property taxes (i.e., required local effort) established
each year by the Florida Legislature. The purpose is to substantially equalize educational funding among
the 67 school districts in Florida, irrespective of differences in wealth among the districts.
Each school district retains its local property taxes, which are reported as local revenues. However, the
required local effort portion is deducted from the district revenue generated by the State FEFP formulas.
The resulting net revenue is reported as State revenue.
Total General Fund revenues and other financing sources during the 2015-16 fiscal year were
$61.1 million less than the originally adopted budget as follows:
Federal funds were $0.9 million lower than anticipated due primarily to a decrease in the Medicaid reimbursements of $1.3 million, with small increases/decreases in Impact Aid, R.O.T.C., and Other Federal through State.
State funds were $44.4 million less than the originally adopted budget primarily due to the elimination of McKay Scholarships of $42.6 million, an increase in the FEFP funds received due to changes in enrollment of $3.3 million, a statewide proration reducing FEFP by $3.7 million, and miscellaneous small adjustments totaling a decrease of $1.4 million.
Local revenues were $15.5 million lower than the originally adopted budget. The decrease in local revenues from the originally adopted budget is primarily due to reductions in net property taxes of $31.2 million, increases in indirect costs of $1.5 million, increases in Community School Programs of $2.8 million, and increases in other accounts of $11.4 million.
Other Financing Sources decreased $0.2 million due to the decrease in transfers from other funds of $0.4 million and increase in other nonrevenue sources of $0.2 million.
The most significant variance between the budget as originally adopted and the final amended budget is
reflected in Instructional Services expenditures. This variance is mainly due to the fact that most of the

Report No. 2017-194 March 2017 Page 15
District’s budget is originally placed in instructional services as teacher salaries and fringes. During the
2015-16 fiscal year, there was an unusually high amount of teacher positions which remained unfilled
during the year. The rest of the variance in Instructional Services relates to the fact that once the school
year commences, the true needs of each respective school are determined based on actual FTE and
other established allocation processes. Therefore, funds originally budgeted under Instructional Services
are spent under other functions which explains the negative variances seen in the rest of the other
expenditure functions.
The variance between final amended budget and actual expenditures relates to amounts that were
encumbered as of June 30, 2016.
Ending fund balance as of June 30, 2016, was $175.3 million comprised of nonspendable fund balances
totaling $7.7 million, representing inventories and prepaid items, restricted fund balance totaling
$8.6 million in State categorical programs, assigned fund balance of $38.6 million, which included
rebudgets and outstanding purchase orders, and unassigned fund balance totaling $120.4 million.
In the future, the District will continue to review the budget, focusing on maintaining essential educational
services as it anticipates continuing revenue shortfalls and cost increases.
CAPITAL ASSETS AND DEBT ADMINISTRATION
Capital Assets
At June 30, 2016, the District had $4.5 billion invested in different categories of capital assets, net of
accumulated depreciation as shown in the table below.

Report No. 2017-194 Page 16 March 2017
CAPITAL ASSET ACTIVITY At June 30, 2016 and 2015
($ in thousands)
Difference %Increase Increase
Categories 2015/16 2014/15 (Decrease) (Decrease)
Land 353,248$ 353,208$ 40$ 0.0%Land Improvements 257,390 255,090 2,300 0.9%Construction in Progress 89,789 111,498 (21,709) (19.5)%Building and Improvements 3,629,093 3,633,020 (3,927) (0.1)%Furniture, Fixtures, and Equipment 81,914 92,244 (10,330) (11.2)%Computer Software 3,302 7,227 (3,925) (54.3)%Motor Vehicles 48,654 51,539 (2,885) (5.6)%
Total 4,463,390$ 4,503,826$ (40,436)$ (0.9)%
Detailed information reflecting the District’s capital asset balances and activity for the fiscal year ended
June 30, 2016, is provided in Note 4 to the Financial Statements.
CAPITAL ASSET ACTIVITY At June 30, 2016
($ in thousands)
Debt Administration
The following table represents the changes in the District’s outstanding long-term liabilities at fiscal
year-end.

Report No. 2017-194 March 2017 Page 17
CHANGES IN LONG-TERM LIABILITIES At June 30, 2016 and 2015
($ in thousands)
Difference %Increase Increase
Categories 2015/16 2014/15 (Decrease) (Decrease)
Bonds Payable 519,258$ 365,012$ 154,246$ 42.3%Certificates of Participation Payable by the Foundation 2,841,475 2,819,537 21,938 0.8%Derivative Instrument Liability 30,412 26,576 3,836 14.4%Capital Leases 70,785 106,390 (35,605) (33.5)%Insurance Claims Payable 183,026 178,747 4,279 2.4%Retirement Incentive Benefits 1,529 1,522 7 0.5%Compensated Absences Payable 279,713 275,489 4,224 1.5%Other Postemployment Benefits 34,884 26,441 8,443 31.9%Net Pension Liability 1,149,596 839,207 310,389 37.0%Interlocal Construction Contract Agreement - 2,000 (2,000) (100)%
Total 5,110,678$ 4,640,921$ 469,757$ 10.1%
Overall liabilities increased by $469.8 million or 10.1% from the prior year. The most significant increase
is a result of the GASB Statement No. 68 requirement to record pension liabilities and the additional
issuances of GOBs to maintain the accelerated pace of the construction program.
Detailed information relating to changes in long-term liabilities for the fiscal year ended June 30, 2016, is
provided in Note 14 to the Financial Statements.
LONG-TERM LIABILITIES At June 30, 2016
($ in millions)

Report No. 2017-194 Page 18 March 2017
ECONOMIC FACTORS
The State of Florida, by constitution, does not have a State personal income tax and, therefore, the State
operates primarily using sales, gasoline, and corporate income taxes. Despite a slow economic recovery
and continued funding challenges, the District, through prudent fiscal management, maintains a healthy
financial position to provide the quality education deserved by every child.
CONTACTING MANAGEMENT
The District’s financial statements are designed to present citizens, taxpayers, investors, and creditors
with a general overview of the District’s finances and to show the District’s accountability for the money
it receives. Additional information can be requested at:
The School Board of Miami-Dade County School Board Administration Building
Office of the Controller 1450 N.E. 2nd Avenue
Room 664 Miami, Florida 33132
or visit our web site at:
http://www.dadeschools.net

Report No. 2017-194 March 2017 Page 19

Report No. 2017-194 Page 20 March 2017
BASIC FINANCIAL STATEMENTS
Miami-Dade County District School Board Statement of Net Position
June 30, 2016 (amounts expressed in thousands)
ASSETSCurrent Assets:
Cash and Cash Equivalents $ 55,465 $ 109,093 Investments 458,977 - Cash and Investments with Fiscal Agents 398 - Restricted Cash and Investments 25,542 -
Total Cash, Cash Equivalents, and Investments (Note 3) 540,382 109,093
Taxes Receivable, Net (Note 16) 9,223 - Accounts and Interest Receivable 2,157 2,778 Due From Other Governments or Agencies (Note 6) 73,484 32,840 Inventories 8,989 - Prepaid and Other Current Assets 19,307 14,188
Total Current Assets 653,542 158,899
Noncurrent Assets:Restricted Cash and Investments (Note 3) 227,539 -
Capital Assets: (Note 4)Nondepreciable Capital Assets 700,427 29,698 Depreciable Capital Assets 6,335,186 183,799 Less Accumulated Depreciation (2,572,223) (68,748)
Total Capital Assets, Net 4,463,390 144,749
Total Noncurrent Assets 4,690,929 144,749
Total Assets 5,344,471 303,648
DEFERRED OUTFLOWS OF RESOURCESAccumulated Decrease in Fair Value of Hedging
Derivatives 30,412 - Deferred Loss on Refunding of Debt, Net 120,666 - Pensions (Note 17) 274,098 384
TOTAL DEFERRED OUTFLOWS OF RESOURCES 425,176 384
ActivitiesGovernmental
Primary Government
ComponentUnits

Report No. 2017-194 March 2017 Page 21
Miami-Dade County District School Board Statement of Net Position (continued)
June 30, 2016 (amounts expressed in thousands)
LIABILITIESCurrent Liabilities:
Accounts and Contracts Payable and Accrued Expenses $ 53,024 $ 17,194 Accrued Payroll Payable 152,976 4,193 Due to Other Governments or Agencies (Note 6) 4,215 7,990 Unearned Revenue 5,019 1,411 Accrued Interest Payable 34,484 - Retainage Payable on Contracts 10,631 - Current Portion of Long-Term Liabilities (Note 14) 237,684 3,324
Total Current Liabilities 498,033 34,112
Noncurrent Liabilities:Noncurrent Portion of Long-Term Liabilities (Note 14) 3,723,398 111,965 Net Pension Liability 1,149,596 -
Total Noncurrent Liabilities 4,872,994 111,965
TOTAL LIABILITIES 5,371,027 146,077
DEFERRED INFLOWS OF RESOURCESPensions (Note 17) 207,114 346
NET POSITIONNet Investment in Capital Assets 1,362,966 74,316 Restricted for:
State Required Carryover Programs 8,644 - Debt Service 9,870 - Capital Projects 63,111 - Food Service 28,503 - Other Purposes 979 5,323
Unrestricted (Deficit) (1,282,567) 77,970
TOTAL NET POSITION $ 191,506 $ 157,609
Governmental ComponentUnits
Primary Government
Activities
The accompanying notes to financial statements are an integral part of this statement.

Report No. 2017-194 Page 22 March 2017
Miami-Dade County District School Board Statement of Activities
For the Fiscal Year Ended June 30, 2016 (amounts expressed in thousands)
Primary Government
Governmental Activities:Instructional Services $ 1,986,742 $ 32,929 $ - Instructional Support Services 286,463 - - Student Transportation Services 91,403 368 - Operation and Maintenance of Plant 352,393 - 258 School Administration 157,387 - - General Administration 13,297 - - Business/Central Services 62,809 - - Administrative Technology Services 3,104 - - Food Services 159,245 16,297 152,329 Community Services 29,269 - - Facilities Acquisition and Construction 100,121 - - Interest on Long-Term Debt 133,392 - - Unallocated Depreciation/Amortization* (Note 4) 163,770 - -
Total Governmental Activities $ 3,539,395 $ 49,594 $ 152,587
Component Units $ 412,838 $ 9,049 $ 30,971
General Revenues:Taxes: (Note 16) Property Taxes, Levied for Operational Purposes Property Taxes, Levied for Debt Service Property Taxes, Levied for Capital ProjectsGrants and Contributions Not Restricted to Specific ProgramsInvestment EarningsOther
Total General Revenues
Change in Net Position
Net Position - Beginning
Net Position - Ending
* This amount excludes the depreciation/amortization that is included in the direct expenses of the various functions.
Program Revenues
Expenses Servicesfor
Charges Operating
Grants and Contributions
The accompanying notes to financial statements are an integral part of this statement.

Report No. 2017-194 March 2017 Page 23
$ - $ (1,953,813) $ - - (286,463) - - (91,035) -
18,829 (333,306) - - (157,387) - - (13,297) - - (62,809) - - (3,104) - - 9,381 - - (29,269) -
33,775 (66,346) - 10,641 (122,751) -
- (163,770) -
$ 63,245 (3,273,969) -
$ 20,547 - (352,271)
1,435,951 - 49,122 -
383,394 - 1,442,564 366,734
4,323 144 34,785 3,688
3,350,139 370,566
76,170 18,295
115,336 139,314
$ 191,506 $ 157,609
Component Units
Net (Expense) Revenue and Changes in Net Position
Primary Government
ContributionsGrants and
Capital
GovernmentalActivities

Report No. 2017-194 Page 24 March 2017
Miami-Dade County District School Board Balance Sheet – Governmental Funds
June 30, 2016 (amounts expressed in thousands)
ASSETS Cash and Cash Equivalents $ 16,791 $ 4,533 Equity in Pooled Cash and Investments 296,292 179,807 Cash and Investments with Fiscal Agents (Note 12) - - Total Cash, Cash Equivalents, and Investments (Note 3) 313,083 184,340
Taxes Receivable, Net (Note 16) 6,885 - Accounts and Interest Receivable 1,374 267 Due from Other Governments or Agencies (Note 6) 30,368 - Due from Other Funds (Note 5) 8,850 - Inventories 7,068 - Prepaid and Other Assets 1,063 -
TOTAL ASSETS $ 368,691 $ 184,607
LIABILITIESAccounts and Contracts Payable and Accrued Expenditures $ 27,646 $ 13,936 Accrued Payroll and Compensated Absences (Notes 8 and 14) 154,545 - Due to Other Funds (Note 5) - - Due to Other Governments or Agencies (Note 6) 2,066 - Unearned Revenue 375 - Estimated Liability for Insurance Risks (Notes 13 and 18) 2,426 - Retainage Payable on Contracts 9 8,739
Total Liabilities 187,067 22,675
DEFERRED INFLOWS OF RESOURCESUnavailable Revenue 6,324 -
Total Deferred Inflows of Resources 6,324 -
FUND BALANCESNonspendable 7,713 - Restricted 8,644 161,932 Assigned 38,566 - Unassigned 120,377 -
Total Fund Balances 175,300 161,932
TOTAL LIABILITIES, DEFERRED INFLOWS OF RESOURCES,AND FUND BALANCES $ 368,691 $ 184,607
General
GeneralFund Bonds Funds
SchoolObligation
The accompanying notes to financial statements are an integral part of this statement.

Report No. 2017-194 March 2017 Page 25
$ 9,121 $ 19,023 $ 49,468 39,114 102,603 617,816
- 398 398 48,235 122,024 667,682
2,073 265 9,223 69 146 1,856
- 41,891 72,259 - - 8,850 - 1,921 8,989
18,244 - 19,307
$ 68,621 $ 166,247 $ 788,166
$ 1,041 $ 10,064 $ 52,687 - 3,367 157,912 - 8,850 8,850 - 2,149 4,215 - 4,540 4,915 - - 2,426
1,358 525 10,631
2,399 29,495 241,636
1,923 345 8,592
1,923 345 8,592
18,244 1,921 27,878 46,055 133,789 350,420
- 697 39,263 - - 120,377
64,299 136,407 537,938
$ 68,621 $ 166,247 $ 788,166
TotalGovernmental
Funds
CapitalImprovement LOML Funds Funds
GovernmentalNonmajor

Report No. 2017-194 Page 26 March 2017
Miami-Dade County District School Board Reconciliation of the Governmental Funds Balance Sheet
to the Statement of Net Position June 30, 2016
(amounts expressed in thousands)
Total Fund Balances - Governmental Funds $ 537,938
$ 7,035,613 (2,572,223) 4,463,390
8,493
1,324
$ 100,540 (31,487)
69,053
$ (1,642) (34,484) (36,126)
Bonds payable $ (519,258) Capital leases (70,785) Compensated absences (273,319) Retirement incentive benefits (1,345) Other postemployment benefits obligation (34,884) Certificates of participation (2,841,475) Derivative instruments liability (30,412) Net pension liability (1,149,596) Claims Payable (149,554) (5,070,628)
Accumulated decreases in fair value of hedging derivative instruments $ 30,412 Net loss on debt refunding 120,666 Net deferred outflows - pensions 66,984 218,062
Total Net Position - Governmental Activities $ 191,506
Interest payable
Deferred outflows (inflows) of resources are reported in the statement of net position.
Property taxes receivable not collected within 60 days of fiscal year-end are not available soon enoughto pay for the current period's expenditures, and, therefore, are not recorded as revenue in thegovernmental funds.
Amounts reported for governmental activities in the statement of net position are different as a result of:
Receivables due from other governments or agencies are not available soon enough to pay for thecurrent period's expenditures and, therefore, are not recorded as revenue in the governmental funds.
Long-term liabilities are not due and payable in the current period and, therefore, are not reported asliabilities in the governmental funds. Long-term liabilities at year-end consist of the following:
Capital assets used in governmental activities are not financial resources and, therefore, are notreported as assets in the governmental funds.
Capital assetsAccumulated depreciation
An internal service fund is used by the District to charge the costs of health premiums to individualfunds. The assets and liabilities of the internal service fund are included in governmental activities inthe statement of net position.
AssetsLiabilitiesNet Position
Current liabilities which are accrued as a liability in the government-wide statements but are notrecognized in the governmental funds until due:
Benefits payable
The accompanying notes to financial statements are an integral part of this statement.

Report No. 2017-194 March 2017 Page 27
THIS PAGE INTENTIONALLY LEFT BLANK

Report No. 2017-194 Page 28 March 2017
Miami-Dade County District School Board Statement of Revenues, Expenditures, and Changes in
Fund Balances – Governmental Funds For the Fiscal Year Ended June 30, 2016
(amounts expressed in thousands)
Revenues
Local Sources:Ad Valorem Taxes (Note 16) $ 1,441,335 $ - Food Service Sales - - Interest Income 1,995 1,068 Net Increase (Decrease) in Fair Value of Investments (4) 63 Local Grants and Other 69,747 -
Total Local Sources 1,513,073 1,131
State Sources: (Note 15)Florida Education Finance Program 630,034 - Public Education Capital Outlay - - Food Services - - State Grants and Other 514,178 -
Total State Sources 1,144,212 -
Federal Sources:Federal Grants and Other 17,802 - Food Services - -
Total Federal Sources 17,802 -
Total Revenues 2,675,087 1,131
Expenditures:Current:
Instructional Services: Basic Programs 1,473,081 - Exceptional Child Programs 325,032 - Adult and Vocational-Technical Programs 77,073 - Total Instructional Services 1,875,186 -
Instructional Support Services 185,800 - Student Transportation Services 72,443 - Operation and Maintenance of Plant 354,853 - School Administration 160,374 - General Administration 77,808 - Food Services - - Community Services 28,768 -
Capital Outlay 7,498 164,460 Debt Service (Notes 9, 10, 11, and 12):
Principal Retirement 515 - Interest and Fiscal Charges 479 1,421 Total Expenditures 2,763,724 165,881
Excess (Deficiency) of Revenues Over (Under) Expenditures (88,637) (164,750)
Other Financing Sources (Uses)Transfers In (Note 5) 154,330 - Transfers Out (Note 5) (15,177) - Issuance of Debt (Notes 10 and 11) - 192,720 Premium on Issuance of Debt - 8,709 Issuance of Debt for Refunding (Notes 10 and 11) - - Premium on Refunding of Debt - - Payments to Refunded Bond Escrow Agent - - Proceeds from Sale of Capital Assets 95 - Proceeds from Loans and Leases 135 -
Total Other Financing Sources (Uses) 139,383 201,429
Net Change in Fund Balances 50,746 36,679 Fund Balances, Beginning 124,554 125,253
Fund Balances, Ending $ 175,300 $ 161,932
GeneralFund
General Obligation
School Bonds Funds
The accompanying notes to financial statements are an integral part of this statement.

Report No. 2017-194 March 2017 Page 29
$ 384,374 $ 49,001 $ 1,874,710 - 16,297 16,297
407 796 4,266 (1) (1) 57
- 38,696 108,443 384,780 104,789 2,003,773
- - 630,034 - 6,166 6,166 - 2,087 2,087 - 27,963 542,141 - 36,216 1,180,428
- 290,031 307,833 - 139,473 139,473 - 429,504 447,306
384,780 570,509 3,631,507
- 105,987 1,579,068 - 29,226 354,258 - 11,639 88,712 - 146,852 2,022,038
- 100,848 286,648 - 13,304 85,747 - 422 355,275 - 35 160,409 - 9,849 87,657 - 160,062 160,062 - 919 29,687
24,422 53,223 249,603
- 149,412 149,927 98 135,321 137,319
24,520 770,247 3,724,372
360,260 (199,738) (92,865)
- 225,170 379,500 (328,291) (36,032) (379,500)
- 25,000 217,720 - - 8,709 - 842,000 842,000 - 90,203 90,203 - (929,258) (929,258) - - 95 - - 135
(328,291) 217,083 229,604
31,969 17,345 136,739 32,330 119,062 401,199
$ 64,299 $ 136,407 $ 537,938
TotalGovernmental
Funds
Capital Improvement LOML Funds
NonmajorGovernmental
Funds

Report No. 2017-194 Page 30 March 2017
Miami-Dade County District School Board Reconciliation of the Governmental Funds Statement of Revenues, Expenditures,
and Changes in Fund Balances to the Statement of Activities For the Fiscal Year Ended June 30, 2016
(amounts expressed in thousands)
Total Net Change in Fund Balances - Governmental Funds $ 136,739
Prior year revenues recorded this year at the fund level $ (14,736)
8,493 (6,243)
1,092
17,387
55,702
(8,055)
Capital outlay expenditures for the fiscal year $ 160,642 Depreciation expense for the fiscal year (193,024) (32,382)
Proceeds from issuance of General Obligation School Bonds $ (192,720) Premium on issuance of General Obligation School Bonds (8,709) Proceeds from refunding of Certificates of Participation (842,000) Premium on refunding of Certificates of Participation (90,203) Proceeds from Qualified Zone Academy Bonds (25,000) Proceeds from Loans and Leases (135) (1,158,767)
$ (8,443) (4,812)
(42) Decrease in claims payable 881 (12,416)
Amounts reported for governmental activities in the statement of activities are different as a result of:
Revenues that do not provide current financial resources are not recorded in the governmental funds.However, for the government-wide statements, revenues are recorded when earned.
Capital outlay disbursements to purchase or build capital assets are reported as expenditures in thegovernmental funds. In the statement of net position, these costs are capitalized and depreciated overtheir estimated useful lives. In the statement of activities, the depreciation is reflected as an expense forthe period.
The governmental funds only include those liabilities that will be paid with current financial resources.Expenses recorded in the statement of activities exceed the amount recorded in the governmental fundsdue to the different measurement focus used.
Increase in other postemployment benefits liabilityIncrease in compensated absences liabilityIncrease in accrued salaries and benefits
Property taxes not collected within 60 days of fiscal year-end are not considered available and,therefore, are not recorded as revenues in the fund level statements. However, for the government-wide statement's property tax revenues are recorded when there is an enforceable lien. Additionally, thegovernmental funds reflect revenues that correspond to the prior year.
Revenues not recorded this year in the fund level statements
An internal service fund is used by the District to charge the costs of health premiums to individualfunds. The increase in net position of the internal service fund is reported with governmental activities.
are recorded as revenue in the government-wide statements
The changes in net position liability and related deferred inflows and outflows are not reported in thefund statements and the net effect is to increase net position.
The net effect of various miscellaneous transactions involving capital assets (i.e., sales, disposals,recoveries, and donations) is to decrease net position.
Proceeds from issuance of debt instruments are recorded as other financing sources in thegovernmental funds; however, in the government-wide statements they are recorded as additions tolong-term liabilities. Proceeds from debt instruments were as follows:
(continued)

Report No. 2017-194 March 2017 Page 31
Miami-Dade County District School Board Reconciliation of the Governmental Funds Statement of Revenues, Expenditures,
and Changes in Fund Balances to the Statement of Activities (continued) For the Fiscal Year Ended June 30, 2016
(amounts expressed in thousands)
$ 66,590 2,000
Repayment of debt principal for General Obligation Bonds 35,975 35,740
Repayment of debt principal for State Board of Education Bonds 9,622 $ 149,927
929,258
Accrued interest payable $ (34,484)
280 Amortization of premium on Certificates of Participation (COPs) 14,564 Amortization of premium General Obligation School Bonds (GOBs) 1,307
18 Amortization of loss related to Advance Refunding of SBEs (118) Amortization of loss related to Advance Refunding of COPs (9,569)
(44) Prior year accrued interest paid during current fiscal year 31,974 3,928
Total Change in Net Position - Governmental Activities $ 76,170
Repayment to refund debt is reflected as an other financing use in the governmental funds, however,in the statement of net position it is reflected as a reduction of liabilities and does not affect thestatement of activities.
Repayment of debt principal is reflected as an expenditure in the governmental funds; however, inthe statement of net position it is reflected as a reduction of liabilities and does not affect thestatement of activities.
Repayment of debt principal for Certificates of ParticipationRepayment of debt principal for Construction Agreements
Repayment of debt principal for Capital Leases
Amortization of loss related to Advance Refunding of GOBs
Interest on long-term debt differs from the amount reported in the governmental funds. In thegovernmental funds, interest on long-term debt is recorded as an expenditure when due and payable. In the statement of activities, interest is recorded as it accrues. In addition, premiums are amortizedover the life of the debt and are recorded as a decrease to interest expense on the statement ofactivities. Losses incurred as a result of advance refundings are also amortized over the life of thedebt and are recorded as an increase to interest expense on the statement of activities.
Amortization of premium on State Board of Education Capital Outlay Bonds (SBEs)
Amortization of gain related to Advance Refunding of COPs
The accompanying notes to financial statements are an integral part of this statement.

Report No. 2017-194 Page 32 March 2017
Miami-Dade County District School Board Statement of Net Position – Proprietary Fund
June 30, 2016 (amounts expressed in thousands)
ASSETS
Cash and Cash Equivalents $ 20,194 Investments 80,045 Accounts and Interest Receivable 301
TOTAL ASSETS 100,540
LIABILITIES
Accounts Payable 337 Unearned Revenue 104 Estimated Unpaid Health Claims 31,046
TOTAL LIABILITIES 31,487
NET POSITION
Unrestricted 69,053
TOTAL NET POSITION $ 69,053
HealthInsurance
Fund
The accompanying notes to financial statements are an integral part of this statement.

Report No. 2017-194 March 2017 Page 33
Miami-Dade County District School Board Statement of Revenues, Expenses, and Changes in Fund
Net Position – Proprietary Fund For the Fiscal Year Ended June 30, 2016
(amounts expressed in thousands)
OPERATING REVENUES Charges for Services $ 358,383 Other Operating Revenues 5,789 Total Operating Revenues 364,172
OPERATING EXPENSES Salaries 300 Employee Benefits 134 Purchased Services 630 Claims 335,951 Administrative Fees and Other 9,974
Total Operating Expenses 346,989
Operating Income 17,183
NONOPERATING REVENUES Interest Revenue 204
Change in Net Position 17,387 Net Position - Beginning 51,666
Net Position - Ending $ 69,053
FundInsurance
Health
The accompanying notes to financial statements are an integral part of this statement.

Report No. 2017-194 Page 34 March 2017
Miami-Dade County District School Board Statement of Cash Flows – Proprietary Fund
For the Fiscal Year Ended June 30, 2016 (amounts expressed in thousands)
CASH FLOWS FROM OPERATING ACTIVITIES Receipts from Customers and Interfund Services Provided $ 358,408 Payments for Claims (330,786) Payments to Suppliers for Goods and Services (11,542) Payments to Employees (434) Other Receipts 5,560
Net Cash Provided by Operating Activities 21,206
CASH FLOWS FROM INVESTING ACTIVITIES Receipts from Interest 159 Purchase of Investments (45,332)
Net Cash Used by Investing Activities (45,173)
Net Decrease in Cash and Cash Equivalents (23,967)
Cash and Cash Equivalents, Beginning of Year 44,161
Cash and Cash Equivalents, End of Year $ 20,194
Reconciliation of Operating Income to Net Cash Provided by Operating Activities:
Operating Income $ 17,183 Adjustments to Reconcile Operating Income to Net Cash Provided by Operating Activities: Increase in Account Receivable (220) Decrease in Accounts Payable (939) Increase in Unearned Revenues 17 Increase in Estimated Unpaid Health Claims 5,165
Total Adjustments 4,023
Net Cash Provided by Operating Activities $ 21,206
HealthInsurance
Fund
The accompanying notes to financial statements are an integral part of this statement.

Report No. 2017-194 March 2017 Page 35
Miami-Dade County District School Board Statement of Fiduciary Net Position – Fiduciary Funds
June 30, 2016 (amounts expressed in thousands)
ASSETS
Cash and Cash Equivalents $ - $ 6,151 Investments: Bonds - 9,303 Commercial Paper - 5,480 Fixed Income Mutual Funds 8,697 - Equity Mutual Funds 14,496 - Money Market Mutual Funds 966 2,917
Total Cash, Cash Equivalents, and Investments 24,159 23,851
Accounts Receivable - 2,217 Interest Receivable 4 -
TOTAL ASSETS $ 24,163 $ 26,068
LIABILITIES
Accounts Payable $ - $ 38 Due to Other Governments or Agencies - 3,840 Due to Student Organizations - 22,190
TOTAL LIABILITIES - $ 26,068
NET POSITION
Restricted for Pensions 24,163
TOTAL NET POSITION $ 24,163
Trust FundPension
Schools'
Fund
Agency Fund
Internal
The accompanying notes to financial statements are an integral part of this statement.

Report No. 2017-194 Page 36 March 2017
Miami-Dade County District School Board Statement of Changes in Fiduciary Net Position – Fiduciary Fund
For the Fiscal Year Ended June 30, 2016 (amounts expressed in thousands)
ADDITIONS: Employer Contributions (Note 17) $ 1,890 Interest on Investments 589 Net Decrease in the Fair Value of Investments (236) Less Investment Expenses (7)
Total Additions 2,236
DEDUCTIONS: Retirement Benefit Payments 4,098 Trustee Services 125
Total Deductions 4,223
Change in Net Position (1,987)
Net Position Restricted for Pensions at Beginning of Year 26,150
Net Position Restricted for Pensions at End of Year $ 24,163
PensionTrust Fund
The accompanying notes to financial statements are an integral part of this statement.

Report No. 2017-194 March 2017 Page 37
NOTES TO FINANCIAL STATEMENTS
SUMMARY OF SIGNIFICANT ACCOUNTING POLICIES
Reporting Entity
The School Board of Miami-Dade County, Florida (the “School Board,” “Board,” “School District”, or
“District”) is composed of nine members elected from single-member districts within the legal
boundary of Miami-Dade County, Florida (the “County”). The appointed Superintendent of Schools
is the executive officer of the Board. The School Board is part of the State system of public education
under the general direction of the State Board of Education and is financially dependent on State
support. However, the Board is considered a primary government for financial reporting purposes
because it is directly responsible for the operation and control of District schools within the framework
of applicable State law and State Board of Education rules, and it is not considered to be an agency
or component unit of the State of Florida.
The general operating authority of the School Board and the Superintendent is contained in Chapters
1000 through 1013, Florida Statutes. Pursuant to Section 1010.01, Florida Statutes, the
Superintendent of Schools is responsible for keeping records and accounts of all financial
transactions in the manner prescribed by the State Board of Education.
The accompanying financial statements include those of the District (the primary government) and
those of its component units. Component units are legally separate organizations which should be
included in the District’s financial statements because of the nature and significance of their
relationship with the primary government.
The Governmental Accounting Standards Board (GASB) issued Statement No. 61, The Financial
Reporting Entity: Omnibus, an amendment to GASB Statements No. 14 and 34. The Statement
modifies the existing criteria for reporting component units. The Statement provides guidance on the
inclusion of a legally separate entity to be included as a component unit under the misleading to
exclude criterion and the financial accountability concept, which requires that in addition to meeting
the fiscal dependency criterion, a financial benefit or burden relationship be present in order for a
potential component unit to be included in the financial reporting entity.
The Florida Department of Education (FDOE) concluded, based on FDOE’s interpretation of
GASB Statement No. 61, that school districts should report charter schools as discretely presented
component units. This conclusion is based, in part, on FDOE’s interpretation that exclusion of the
charter schools from financial reporting would cause school district financial statements to be
misleading as, pursuant to the Article IX, Section 4 of the State Constitution, charter schools are
public schools and each school district has constitutional responsibility for all public schools within
the school district. As a result, we have included charter school audited financial information for State
reporting purposes. In addition, the District included the Miami-Dade County School Board
Foundation, Inc. and the Foundation for New Education Initiatives, Inc. as component units.

Report No. 2017-194 Page 38 March 2017
Blended Component Unit
The Miami-Dade County School Board Foundation, Inc., a Florida not-for-profit corporation, was
created solely to facilitate financing for the acquisition and construction of District school facilities and
related costs. The members of the School Board serve as the Board of the Foundation; therefore,
the School Board is considered financially accountable for the Foundation. The financial activities of
the Foundation have been blended (reported as if it were part of the District) with those of the District.
Discretely Presented Component Units
The component units’ columns in the government-wide financial statements include the financial data
of the District’s component units that are required to be presented separately. These component
units consist of multiple charter schools and the Foundation for New Education Initiatives, Inc. The
charter schools and the Foundation for New Education Initiatives, Inc. are reported, in the aggregate,
in separate columns in the governmental activities financial statements to emphasize that they are
legally separate from the District.
Charter schools are separate not-for-profit corporations organized pursuant to Chapter 617, Florida
Statutes, the Florida Not For Profit Corporation Act, and Section 1002.33, Florida Statutes. The
District’s charter schools operate under charters approved by the District and are recognized as public
schools within the District. As such, charter schools are funded on the same basis as the District.
Additionally, Section 1002.33, Florida Statutes, states that the School Board shall monitor revenues
and expenditures of the charter schools. Charter schools are funded from public funds based on
membership and can also be eligible for grants in accordance with State and Federal guidelines,
including food service and capital outlay. Additionally, all students enrolled in charter schools are
included in the District’s total enrollment. Charter schools can accept private donations and incur
debt in the operation of the school for which the charter school is responsible.
A total of 126 charter schools were approved to operate during the 2015-16 fiscal year. All of the
charter schools are included as component units of the District or another legal entity. For financial
reporting purposes, 118 of the charter schools are included in the financial statements of the District
as discretely presented component units. The remaining 8 charter schools are not included as they
are part of another legal entity. Based on the Florida Department of Education’s interpretation of
GASB Statement No. 14, as amended in GASB 61, it would be misleading to exclude them from the
District’s financial statements. None of the individual component units are considered to be major;
therefore, they are reported in the aggregate in the District’s financial statements. The audited
financial statements of the individual component units can be obtained by contacting the following
schools:
School School Address Telephone
Number
AcadeMir Charter School Middle (6082) 10601 SW 48 Street
Miami, FL 33165
305-537-6398
AcadeMir Charter School West (0410) 14880 SW 26th Street
Miami, FL 33185
305-485-9911
AcadeMir Preparatory Academy (2002) 5800 SW 135th Ave
Miami, FL 33183
305-485-9911

Report No. 2017-194 March 2017 Page 39
School School Address Telephone
Number
Academy of International Education Charter School (5044)
1080 LaBaron Drive Miami Springs, FL 33166
305-883-3900
Advantage Academy of Math & Science at Summerville
(3026) (a)
11575 SW 243 Street Homestead, FL 33032
305-253-2123
Advantage Academy of Math & Science at Waterstone (3027)
855 Waterstone Way Homestead, FL 33033
305-248-6206
Advantage Academy Santa Fe (3025) 9790 SW 107th Court
Miami, FL 33176
786-228-5309
Alpha Charter of Excellence (ACE) (5410) 1217 SW 4th St.
Miami, FL 33135
305-643-2132
Archimedean Academy (0510) 12425 SW 72nd Street
Miami, FL 33183
305-279-6572
Archimedean Middle Conservatory (6006) 12425 SW 72nd Street
Miami, FL 33183
305-279-6572
Archimedean Upper Conservatory (7265) 12425 SW 72nd Street
Miami, FL 33183
305-279-6572
Beacon College Preparatory (4002) 13400 NW 28th Ave Miami, FL 33054
786-353-6109
Ben Gamla Charter School (5022) 11155 SW 112th Ave
Miami, FL 33176
305-596-6266
Bridgepoint Academy Interamerican (5020) 621 Beacom Boulevard
Miami, FL 33135
305-643-4833
BridgePrep Academy of Arts & Minds (7022) (b)
3138 Commodore Plaza
Miami, FL 33133
305-448-1100
Bridgepoint Academy Greater Miami (2013) 137 NE 19th Street
Miami, FL 33132
786-477-4372
Bridgepoint Academy of Village Green (3034)
4707 SW 127th Ave
Miami, FL 33175
786-477-4380
Bridgepoint Academy (2003)
10700 SW 56th Street
Miami, FL 33165
305-271-3109
Charter High School of the Americas (7080)
970-998 W Flagler Street
Miami, FL 33130
305-325-1001
Coral Reef Montessori Academy Charter School (0070)
10853 SW 216th Street
Cutler Bay, FL 33170
305-255-0064
Doctors Charter School of Miami Shores (6040)
11301 NW Fifth Ave
Miami Shores, FL 33168
305-754-2381
Doral Academy (3030)
2450 NW 97th Ave
Doral, FL 33172
305-597-9999
Doral Academy Charter Middle School (6030)
2601 NW 112th Ave
Doral, FL 33172
305-591-0020

Report No. 2017-194 Page 40 March 2017
School School Address Telephone
Number
Doral Academy High School (7020)
11100 NW 27th Street
Doral, FL 33172
305-597-9950
Doral Academy of Technology (3029)
2601 NW 112th Ave
Doral, FL 33172
305-591-0020
Doral Performing Arts & Entertainment Academy (7009)
11100 NW 27th Street
Doral, FL 33172
305-597-9950
Downtown Doral Charter Elementary School (3002)
8390 NW 53rd Street
Doral, FL 33166
305-569-2223
Downtown Miami Charter School (3600)
305 NW Third Ave
Miami, FL 33128
305-579-2112
Everglades Preparatory Academy (5006)
2251 Mowry Drive
Homestead, FL 33033
786-601-1969
Everglades Preparatory Academy High School (7060)
2251 Mowry Drive
Homestead, FL 33033
786-601-1969
Excelsior Charter Academy (5032)
3490 NW 191st Street
Miami Gardens, FL 33056
786-565-9188
Excelsior Language Academy of Hialeah (5029)
369 E Tenth Street
Hialeah, FL 33010
305-887-9004
Florida International Academy (6010) 13400 NW 28th Ave Opa-Locka, FL 33054 305-685-8190
Green Springs High School Charter (7067) (c) 3555 NW 7th Street Miami, FL 33125 305-720-2996
Highly Inquisitive & Versatile Education (HIVE) Preparatory School (1014)
5855 NW 171st Street Miami, FL 33015 305-231-4888
iMater Academy (5384) 600 W 20th Street Hialeah, FL 33010 305-884-6320
iMater Academy Middle School (6014) 651 W 20th Street Hialeah, FL 33010 305-805-5722
iMater Preparatory Academy High School (7090) 651 W 20th Street Hialeah, FL 33010 305-669-2906
International Studies Charter High School (7007) 2480 SW 8th Street Miami, FL 33135 305-643-2955
International Studies Charter Middle School (6045) 2480 SW 8th Street Miami, FL 33135 305-643-2955
International Studies Virtual Academy (6017) 2480 SW 8th Street Miami, FL 33135 305-643-2955
Integrated Science & Asian Culture Academy (Isaac) (2004)
5876 SW 68th Street South Miami, FL 33143 305-740-0509
Just Arts and Management (JAM) Charter Middle (6083) 2450 NW 97 Ave Doral, FL 33172 305-597-9999

Report No. 2017-194 March 2017 Page 41
School School Address Telephone
Number
Keys Gate Charter High School (7050) 2325 SE 28th Ave Homestead, FL 33035 786-272-9600
Keys Gate Charter School (3610) 2000 & 2355 SE 28th Ave Homestead, FL 33035 305-230-1616
Latin Builder’s Association Construction and Business Management Academy (7066)
13835 NW 97 Ave Hialeah Gardens, FL 33018 305-827-3022
Lincoln-Marti Charter Schools (Hialeah Campus) (5007) 3500 W 84th Street Hialeah, FL 33018 305-827-8080
Lincoln-Marti Charter Schools (International Campus) (5043)
103 East Lucy Street Florida City, FL 33034 305-242-3330
Lincoln-Marti Charter Schools (Little Havana Campus) (5025)
970-984 West Flagler Street Miami, FL 33130 305-325-1001
Mater Academy (0100) 7700 NW 98th Street Hialeah Gardens, FL 33016 305-698-9900
Mater Academy (Miami Beach) (5047) 8625 Byron Ave Miami Beach, FL 33141 305-864-2889
Mater Academy at Mount Sinai (5054) 4300 Alton Road Miami Beach, FL 33140 305-604-1453
Mater Academy Charter High School (7160) 7901 NW 103rd Street Hialeah Gardens, FL 33016 305-828-1886
Mater Academy Charter Middle School (6012) 7901 NW 103rd Street Hialeah Gardens, FL 33016 305-828-1886
Mater Academy East Charter High (7037) 998 SW First Street Miami, FL 33130 305-324-6963
Mater Academy East Charter School (3100) 450 SW Fourth Street Miami, FL 33130 305-324-4667
Mater Academy High School of Int’l Studies (7024) 795 NW 32nd Street Miami, FL 33127 305-634-0445
Mater Academy Lakes High School (7018) 17300 NW 87th Ave Hialeah, FL 33015 305-512-3917
Mater Academy Lakes Middle School (6033) 17300 NW 87th Ave Hialeah, FL 33015 305-512-3917
Mater Academy Middle School of Int’l Studies (6047) 795 NW 32nd Street Miami, FL 33127 305-634-0445
Mater Academy of International Studies (1017) 795 NW 32nd Street Miami, FL 33127 305-634-0445
Mater Brickell Preparatory Academy (5046) 2805 SW 32nd Ave Miami, FL 33133 305-442-4992
Mater East Academy Middle School (6009) 998 SW First Street Miami, FL 33130 305-324-6963
Mater Gardens Academy (0312) 9010 NW 178th Lane Hialeah, FL 33018 305-512-9775

Report No. 2017-194 Page 42 March 2017
School School Address Telephone
Number
Mater Gardens Academy Middle (6042) 9010 NW 178th Lane Hialeah, FL 33018 305-512-9775
Mater Grove Academy (5045) 2805 SW 32nd Ave Miami, FL 33133 305-442-4992
Mater International Academy (3000) 3405 NW 27th Ave Miami, FL 33142 305-638-8016
Mater Performing Arts & Entertainment Academy (7014)
7901 NW 103rd Street Hialeah Gardens, FL 33016 305-828-1886
Mater Virtual Academy Charter Middle High School (6997) 17300 NW 87 Street Hialeah, FL 33015 305-512-3917
Mavericks High of North Miami-Dade (7062)
16150 NE 17th Ave North Miami Beach, FL 33162 786-629-7053
Mavericks High of South Miami-Dade County (7065) 698 N. Homestead Blvd. Homestead, FL 33030 305-909-6307
Miami Arts Charter School (7059) 3900 Biscayne Blvd. Miami, FL 33137 305-763-6257
Miami Children’s Museum Charter School (4000) 980 McArthur Causeway Miami, FL 33132 305-329-3758
Miami Community Charter High School (7058) 18720 SW 352 Street Florida City, FL 33034 305-245-2552
Miami Community Charter Middle School (6048) 18720 SW 352 Street Florida City, FL 33034 305-245-2552
Miami Community Charter School (0102) 101 S. Redland Road Florida City, FL 33034 305-245-2552
North Gardens High School (7068)
4692F NW 183rd Street Miami Gardens, FL 33055 786-528-6308
North Park High School (7069) (d) 3400 NW 135th Street Opa-Locka, FL 33054 305-720-2995
Palm Glades Preparatory Academy (3032) 22655 SW 112th Ave Miami, FL 33170 786-272-2269
Palm Glades Preparatory High School (7032) 22655 SW 112 Ave Miami, FL 33170 786-272-2269
Pinecrest Academy (North Campus) (5048) 10207 West Flagler Street Miami, FL 33174 305-553-9762
Pinecrest Academy (South Campus) (0342) 15130 SW 80th Street Miami, FL 33193 305-386-0800
Pinecrest Academy Charter Middle School (6022) 14901 SW 42nd Street Miami, FL 33185 305-559-8583
Pinecrest Cove Academy (5049) 4101 SW 107th Ave Miami, FL 33165 305-480-2097
Pinecrest Preparatory Academy (0600) 14301 SW 42nd Street Miami, FL 33175 305-207-1027

Report No. 2017-194 March 2017 Page 43
School School Address Telephone
Number
Pinecrest Preparatory Academy Charter High School (7053)
14901 SW 42nd Street Miami, FL 33185 305-559-8583
Ramz Academy K-5 (Miami Campus) (3035) 2609 NW 7th Street Miami, FL 33125 786-445-5697
Renaissance Elementary Charter School (0400) 10651 NW 19th Street Doral, FL 33122 305-591-2225
Renaissance Middle Charter School (6028) 8360 NW 33rd Street Doral, FL 33122 305-728-4622
Richard Allen Leadership Academy (2006) 940 Caliph Street Opa-Locka, FL 33054 786-615-2977
Somerset Academy (0520) 18491 SW 134th Ave Miami, FL 33177 305-969-6074
Somerset Academy (Silver Palms) (0332) 23255 SW 115th Ave Homestead, FL 33032 305-257-3737
Somerset Academy at Silver Palms (4012) 23255 SW 115th Ave Homestead, FL 33032 305-257-3737
Somerset Academy Bay (5062) 9500 SW 97th Ave Miami, FL 33176 305-669-2906
Somerset Academy Bay Middle School (6128) 9500 SW 97th Ave Miami, FL 33176 305-669-2906
Somerset Academy Charter Elementary School (South Homestead) (0339)
300 SE First Drive Homestead, FL 33030 305-254-6108
Somerset Academy Charter High School (7042) 23255 SW 115th Ave Homestead, FL 33032 305-257-3737
Somerset Academy Charter High School (South Campus) (7038)
23255 SW 115th Ave Homestead, FL 33032 305-257-3737
Somerset Academy Charter High School (South Homestead) (7034)
300 SE First Drive Homestead, FL 33030 305-245-6108
Somerset Academy Charter Middle School (6004) 18491 SW 134th Ave Miami, FL 33177 305-969-6074
Somerset Academy Charter Middle School (Country Palms) (6043)
1700 Krome Ave Homestead, FL 33030 305-246-4949
Somerset Academy Charter Middle School (South Homestead) (6013)
300 SE First Drive Homestead, FL 33030 305-245-6108
Somerset Academy Elementary School (South Miami Campus) (2007)
5876 SW 68th Street South Miami, FL 33143 305-740-0509
Somerset Academy Middle Charter School (South Miami Campus) (6053)
5876 SW 68 Street South Miami, FL 33143 305-740-0509
Somerset Arts Academy (2012) 1700 Krome Ave Homestead, FL 33030 305-246-4949
Somerset Grace Academy (5008) (e) 624 Anastasia Ave Coral Gables, FL 33134 305-442-8626
Somerset Oaks Academy (3033) 1700 Krome Ave Homestead, FL 33030 305-246-4949

Report No. 2017-194 Page 44 March 2017
School School Address Telephone
Number
Somerset Preparatory Academy Sunset (5002) 11155 SW 112th Ave Miami, FL 33176 305-242-5696
Somerset Virtual Academy Middle High (6016) 11100 NW 27th Street Doral, FL 33172 305-591-0020
South Florida Autism Charter School (1070) 13835 NW 97th Ave Hialeah, FL 33018 305-823-2700
Sports Leadership and Management (SLAM) Charter MS (6015)
604 NW 12th Ave Miami, FL 33136 305-669-2906
Sports Leadership Academy of Miami CHS (7016) 604 NW 12 Ave Miami, FL 33136 305-324-6963
Stellar Leadership Academy (7015) 7900 NW 27th Ave, F-20 Miami, FL 33147 305-693-2273
Summerville Advantage Academy (0072) 11575 SW 243rd Street Homestead, FL 33032 305-253-2123
The Charter School at Waterstone (1010) 855 Waterstone Way Homestead, FL 33033 305-248-6206
The Seed School of Miami (6018) 15800 NW 42nd Ave Miami Gardens, FL 33054 305-480-6316
Theodore R. & Thelma A. Gibson Charter School (2060) 1698 NW 4th Ave Miami, FL 33136 305-438-0895
True North Classical Academy (1000) 9393 SW 72nd Street Miami, FL 33173 305-985-2360
(a) Currently known as Doral International Academy of Math & Science. (b) Formerly known as Academy of Arts & Minds. (c) Also known as Florida High School for Accelerated Learning (Miami Campus). (d) Also known as South Cutler High School. (e) Formerly known as Somerset Grace Academy.
On January 16, 2008, the Board authorized the establishment of the Foundation for New Education
Initiatives, Inc., a Florida not-for-profit(c)(3) Direct Support Organization (DSO). The DSO was formed
to support academic achievement by receiving, holding, investing, and administering property and
making expenditures for the benefit of public education programs in the District. The DSO is
organized and operated exclusively in accordance with School Board Policy 9215, DSOs, and Section
1001.453, Florida Statutes. The Foundation for New Education Initiatives, Inc. is included in the
financial statements of the District as a discretely presented component unit. The audited financial
statements of the Foundation for New Education Initiatives, Inc. can be obtained at the District’s
administrative offices at 1450 N.E. Second Avenue, Suite 931, Miami, Florida 33132.
Basis of Presentation
The District’s accounting policies conform with accounting principles generally accepted in the United
States applicable to State and local governmental units. Accordingly, the basic financial statements
include both the government-wide and fund financial statements.

Report No. 2017-194 March 2017 Page 45
Government-wide Financial Statements. The statement of net position and the statement of
activities present information about the financial activities of the District as a whole, and its component
units, excluding fiduciary activities. Eliminations have been made from the statements to remove the
“doubling-up” effect of interfund activity.
The statement of activities reports expenses identified by specific functions, offset by program
revenues, resulting in a measurement of “net (expense) revenue” for each of the District’s functions.
Program revenues that are used to offset these expenses include charges for services, such as food
service and tuition fees; operating grants, such as the National School Lunch Program, Federal
grants, and other State allocations; and capital grants specific to capital outlay. In addition, revenues
not classified as program revenues are shown as general revenues, which include Florida Education
Finance Program (FEFP) revenues and other State allocations.
Fund Financial Statements. The fund financial statements provide information about the District’s
funds, including proprietary and fiduciary funds. Separate statements for governmental, proprietary,
and fiduciary funds are presented. The emphasis of the fund financial statements is on the major
funds which are presented in a separate column with all nonmajor funds aggregated in a single
column.
The District reports the following major governmental funds:
General Fund is the District’s primary operating fund and accounts for all financial resources of the
District, except those required to be accounted for in another fund.
General Obligation School Bonds (GOB) Funds account for and report on resources from the
issuance of GOBs approved by the Miami-Dade County voters on November 6, 2012, for the
modernization, construction, expansion, or otherwise improvement of school buildings, including
technology upgrades.
Capital Improvement – Local Optional Millage Levy (LOML) Funds account for and report on funds
levied by the School District, as authorized by Section 1011.71, Florida Statutes, mainly for capital
outlay purposes.
Additionally, the District reports separately the following proprietary and fiduciary fund types:
Internal Service Fund accounts for and reports on the activities of the District’s group health
self-insurance program.
Agency Fund – Schools’ Internal Fund accounts for resources of the schools’ Internal Fund which is
used to administer monies collected at the schools in connection with school, student athletics, class,
and club activities.
Pension Trust Fund accounts for resources used to finance the District’s Supplemental Early
Retirement Plan.
Measurement Focus and Basis of Accounting
The accounting and financial reporting treatment applied to a fund is determined by its measurement
focus. The basis of accounting refers to when revenues and expenditures or expenses are

Report No. 2017-194 Page 46 March 2017
recognized in the accounts and reported in the financial statements. Basis of accounting relates to
the timing of the measurement made, regardless of the measurement focus applied.
The government-wide financial statements are reported using the economic resources measurement
focus and the accrual basis of accounting. Revenues are recorded when earned and expenses are
recorded when the liability is incurred, regardless of the timing of related cash flows. Revenues from
non-exchange transactions are reported in accordance with GASB Statement No. 33, Accounting and
Financial Reporting for Nonexchange Transactions, as amended by GASB Statement No. 36,
Recipient Reporting for Certain Shared Nonexchange Revenues, which include, taxes, grants, and
donations. On the accrual basis, revenue from property taxes is recognized in the fiscal year for
which the taxes are levied. Revenues from grants and donations are recognized in the fiscal year in
which all eligibility requirements have been satisfied.
Governmental fund financial statements are reported using the current financial resources
measurement focus and the modified accrual basis of accounting. Under the modified accrual basis
of accounting, revenues are recognized when susceptible to accrual, that is, when they become
measurable and available. “Measurable” means the amount of the transaction can be determined;
“available” means collectible within the current period or soon thereafter to be used to pay liabilities
of the current period.
Property taxes, when levied for, and intergovernmental revenues when eligibility requirements have
been met, are the significant revenue sources considered susceptible to accrual. The School Board
considers property taxes, when levied for, as available if they are collected within 60 days after fiscal
year-end. A one-year availability period is used for revenue recognition for all other governmental
fund revenues. Charges for services and fees are recognized when cash is collected as amounts
are not measurable. Under the modified accrual basis of accounting, expenditures are generally
recognized when the related fund liability is incurred. The principal exceptions to this general rule
are: (1) interest on general long-term debt is recognized as expenditures when due/paid, and
(2) expenditures related to liabilities reported as general long-term obligations are recognized when
due, such as compensated absences, other postemployment benefits, pensions, claims payables,
bonds, loans, and leases.
The proprietary fund is accounted for in accordance with GASB Statement No. 62, Codification of
Accounting and Financial Reporting Guidance Contained in Pre-November 30, 1989 FASB and
AICPA Pronouncements. During the 2009-10 fiscal year, the District established an internal service
fund to account for the group health self-insurance program. The internal service fund financial
statements are reported using the economic resources measurement focus and the accrual basis of
accounting.
Proprietary funds distinguish operating revenues and expenses from non-operating items. The
principal operating revenues of the District’s internal service fund for self-insurance are charges
to the District’s other funds for health insurance. The principal operating expenses include claims,
administrative expenses, and fees. All revenues and expenses not meeting these definitions are
reported as non-operating revenues and expenses.

Report No. 2017-194 March 2017 Page 47
The pension trust fund is reported using the economic resources measurement focus and the accrual
basis of accounting. With this measurement focus, all assets and deferred outflows and all liabilities
and deferred inflows associated with the operation of the funds are included on the statement of
fiduciary net position. The statement of changes in fiduciary net position presents additions and
deductions in fund equity (total net position).
The agency fund has no measurement focus but utilizes the accrual basis of accounting for reporting
its assets and liabilities.
Charter schools are accounted for as governmental organizations and follow the same accounting
model as the District’s governmental activities.
The Foundation for New Education Initiatives, Inc. uses the economic resources measurement focus
and accrual basis of accounting whereby revenues are recognized when earned and expenses are
recognized when incurred, and follows FASB standards of accounting and financial reporting for
not-for-profit organizations.
New Pronouncements – Adopted and Unadopted
The GASB issued Statement No. 72, Fair Value Measurement and Application, in February 2015.
This Statement is effective for fiscal years beginning after June 15, 2015. The District adopted GASB
Statement No. 72 in the current fiscal year financial statements. The adoption of GASB Statement
No. 72 is reflected in Notes 3, 10, and 11.
The GASB issued Statement No. 75, Accounting and Financial Reporting for Postemployment Benefit
Other Than Pensions, in June 2015. This Statement is effective for fiscal years beginning after
June 15, 2017. The adoption of GASB 75 will have a material impact on the District’s financial
position or results of operations.
The GASB issued Statement No. 76, The Hierarchy of Generally Accepted Accounting Principles for
State and Local Governments, in June 2015. The requirements of this Statement are effective for
reporting periods beginning after June 15, 2015. The District adopted GASB Statement No. 76 in the
current fiscal year financial statements. The adoption of GASB Statement No. 76 did not impact the
District’s financial position or results of operations.
The GASB issued Statement No. 77, Tax Abatement Disclosures, in August 2015. The requirements
of this Statement are effective for financial statements for periods beginning after December 15, 2015.
The GASB issued Statement No. 78, Pensions Provided through Certain Multiple-Employer Defined
Benefit Pensions Plans, in December 2015. The requirements of this Statement are effective for
reporting periods beginning after December 15, 2015.
The GASB issued Statement No. 82, Pension Issues - an amendment of GASB Statements No. 67,
No. 68, and No. 73, in March 2016. The requirements of this Statement are effective for reporting
periods beginning after June 15, 2016, except for the requirements of this Statement for the selection
of assumptions in a circumstance in which an employer’s pension liability is measured as of a date
other than the employer’s most recent fiscal year-end. In that circumstance, the requirements for the

Report No. 2017-194 Page 48 March 2017
selection of assumptions are effective for that employer in the first reporting period in which the
measurement date of the pension liability is on or after June 15, 2017.
Except as otherwise indicated, the impact on the District’s financial position or results of operations
has not yet been determined for the unadopted standards.
Cash, Cash Equivalents, and Investments
The District maintains an accounting system in which substantially all general School Board cash,
investments, and accrued interest are recorded and maintained in a separate group of accounts.
Investment income is allocated based on the proportionate balances of each fund’s equity in pooled
cash and investments. The cash and investment pool is available for all funds, except the State
Board of Education Bonds, certificates of participation, and other debt related funds requiring
separate accounts.
Cash deposits are held by banks qualified as public depositories under Florida law. All deposits are
insured by Federal depository insurance and/or collateralized with securities held in Florida’s multiple
financial institution collateral pool as required by Chapter 280, Florida Statutes. Cash and cash
equivalents are considered to be cash on hand, demand deposits, non-marketable time deposits with
maturities of three months or less when purchased, and money market/saving accounts.
Investments are categorized according to the fair value hierarchy established by GASB
Statement No. 72. Investments include United States (U.S.) agency and Treasury obligations,
commercial paper, and money market mutual funds. Guaranteed investment contracts are recorded
at the amount specified by the contracts at each year-end. Pension Trust Fund investments are
recorded at fair value based on quoted market prices and include money market funds and fixed
income/equity mutual funds.
Inventories
Inventories consist of expendable supplies held for consumption in the course of the District’s
operations. Inventories are stated at cost, principally on a weighted average cost basis. Commodities
from the U.S. Department of Agriculture are stated at their fair value as determined at the time of
donation by the Florida Department of Agriculture and Consumer Services. Commodities inventory
is accounted for using the “purchases” method that expenses inventory when acquired, and
inventories on hand at fiscal year-end are reported as an asset and nonspendable fund balance, net
of amounts in accounts payable. Non-commodity inventory is accounted for under the consumption
method and, as such, is recorded as an expenditure when used. Since inventories of commodities
also involve purpose restrictions, they are presented as restricted in the government-wide statement
of net position.
Due from Other Governments or Agencies
Amounts due to the District by other governments or agencies relate to grants or programs for which
the services have been provided to students of the District.

Report No. 2017-194 March 2017 Page 49
Other Assets
Other assets consist mainly of prepaid expenses which are payments for goods or services that have
not been consumed or used at year-end. The expenditure will be recorded when the asset is used.
Accordingly, prepaid expenses are equally offset by a nonspendable fund balance classification.
Net Position
Net position reports all financial and capital resources of the District, as well as assets/deferred
outflows of resources and liabilities/deferred inflows of resources. Net position is displayed in three
components:
Net Investment in Capital Assets - reports capital assets, net of accumulated depreciation, and reduced by the outstanding balances of any debt that is attributable to the acquisition, construction, or improvement of capital assets.
Restricted Net Position - reports amounts that are restricted to specific purposes either by: (a) constraints placed on the use of resources by creditors, grantors, contributors, or laws or regulations of other governments, or (b) imposed by law through constitutional provisions or enabling legislation.
Unrestricted Net Position (Deficit) - this amount represents the accumulated results of all past year’s operations not included in the above two components. The deficit in net position is due to its non-capital long-term liabilities, such as insurance claims payable, compensated absences, pensions, and other postemployment benefits.
When both restricted and unrestricted resources are available for a specific purpose, it is the District’s
policy to use restricted assets first, until exhausted, before using unrestricted resources.
Capital Assets
Capital assets, which include land, land improvements, construction in progress, buildings, building
improvements, furniture, fixtures, and equipment, computer software, and motor vehicles are reported
in the statement of net position in the government-wide statements. The District’s capitalization
thresholds are $1,000 or greater for furniture, fixtures, and equipment and $50,000 for building
improvements, additions, and other capital outlays that significantly extend the useful life of an asset.
Other costs incurred for repairs and maintenance are expensed as incurred. Assets are recorded at
historical cost. Assets purchased under capital leases are recorded at cost, which approximates fair
value at acquisition date and does not exceed the present value of future minimum lease payments.
Donated assets are recorded at the acquisition value at the time of receipt.
Certain costs incurred in connection with the development of internal use software are capitalized
and amortized in accordance with GASB Statement No. 51, Accounting and Financial Reporting for
Intangible Assets, and are reflected in the government-wide financial statements.
Capital assets are depreciated using the straight-line method over the following estimated useful lives:
Description Estimated Useful Lives
Buildings and Improvements 20 - 50 years
Furniture, Fixtures, and Equipment 5 - 20 years
Vehicles 7 - 18 years
Computer Software 5 years

Report No. 2017-194 Page 50 March 2017
When capital assets are sold or disposed of, the related cost and accumulated depreciation are
removed from the accounts, and the resulting gain or loss is recorded in the government-wide
statements. Proceeds received from the sale or disposal of capital assets are recorded as other
financing sources in the governmental funds.
Long-Term Obligations
The government-wide financial statements report long-term liabilities or obligations that are expected
to be paid in the future. Long-term liabilities reported include bonds payable, certificates of
participation payable, derivative instrument liabilities, capital leases payable, self-insurance estimated
claims payable, retirement incentive benefits, compensated absences, other postemployment
benefits, and net pension liability. Bond premiums are amortized over the life of the debt using the
effective-interest method.
In the fund financial statements, debt premiums and discounts are recognized in the period the related
debt is issued. Proceeds, premiums, and discounts are reported as other financing sources and
uses. Principal payments and issuance costs are reported as debt service expenditures.
Risk Management
The District is self-insured for portions of its general and automobile liability insurance and workers’
compensation. Claim activity (expenditures for general and automobile liability and workers’
compensation) is recorded in the general fund as payments become due each period. The
estimated liability for self-insured risks represents an estimate of the amount to be paid on claims
reported and on claims incurred but not reported (See Note 13). For the governmental funds, in the
fund financial statements, the liability for self-insured risks is considered long-term and, therefore, is
not a fund liability (except for any amounts due and payable at year-end) and represents a reconciling
item between the governmental fund level and government-wide presentations.
The District provides medical and health coverage benefits for its employees and eligible dependents.
The District has a self-insured plan, with individual as well as aggregate stop loss coverage, to protect
the District against catastrophic claims in a calendar year. The District accounts for self-insured
health insurance activity in an internal service fund established for this purpose. In the proprietary
fund financial statements, the liability for self-insured health risks is recorded under the accrual basis
of accounting.
State and Federal Revenue Sources
Revenues from State sources for current operations are primarily from the Florida Education Finance
Program (FEFP), administered by the Florida Department of Education (FDOE), under the provisions
of Section 1011.62, Florida Statutes. The District files reports on full-time equivalent (FTE) student
membership with the FDOE. The FDOE accumulates information from these reports and calculates
the allocation of FEFP funds to the District. Such revenues are recognized as revenues consistent
with our policy in Note 1C. After review and verification of FTE reports and supporting documentation,
the FDOE may adjust subsequent fiscal period allocations of FEFP funding for prior year errors
disclosed by its reviews, as well as to prevent Statewide allocations from exceeding the amount

Report No. 2017-194 March 2017 Page 51
authorized by the Legislature. Normally, such adjustments are treated as adjustments of revenue in
the year the adjustment is made by the FDOE.
The District receives revenue from the State and Federal agencies to administer certain educational
programs. Revenues earmarked for these programs are expended only for the program for which
the money is provided and require that the money not expended as of the close of the fiscal year be
carried forward into the following fiscal year to be expended for the same educational programs.
Revenue is recognized when all eligibility requirements have been met.
The State allocates gross receipt taxes, generally known as Public Education Capital Outlay (PECO)
money, to the District on an annual basis for capital and other projects. The District is authorized to
expend these funds only upon applying for and receiving an encumbrance authorization from the
FDOE.
Property Taxes – Revenue Recognition
In the government-wide financial statements, property tax revenue is recognized in the fiscal year
when levied for. The receivable is recorded net of an estimated uncollectible amount, which is based
on past collection experience. In the fund financial statements, property tax revenue is recognized
when they are measurable and available. Taxes collected by the Miami-Dade County Tax Collector
and received by the District within 60 days subsequent to fiscal year-end are considered to be
available and recognized as revenue.
Unearned Revenues
The unearned revenues relate to the lease of Educational Broadband Service (EBS) licenses that are
amortized on a straight-line basis over the life of the lease agreement, and other lease payments
received in advance that are being amortized over the applicable lease term.
Use of Estimates
The preparation of financial statements in conformity with accounting principles generally accepted
in the United States requires management to make estimates and assumptions that affect the
reported amounts of assets/deferred outflows, liabilities/deferred inflows, disclosure of contingent
assets and liabilities at the date of the financial statements, and reported amounts of revenues and
expenditures during the reporting period. Actual results could differ from those estimates.
Deferred Outflows/Inflows of Resources
In addition to assets, the statement of net position reports a separate section for deferred outflows of
resources. This separate financial statement section, deferred outflows of resources, represents a
consumption of net position that applies to future periods and so will not be recognized as an outflow
of resources (expenses) until that time. The District currently reports the accumulated decrease in
fair value of hedging derivatives, the net deferred loss on refunding of debt, and deferred outflows
related to pensions in this category.
In addition to liabilities, the statement of net position and the governmental funds balance sheet report
a separate section for deferred inflows of resources. This separate financial statement section,
deferred inflows of resources, represents an acquisition of net position that applies to future periods

Report No. 2017-194 Page 52 March 2017
and so will not be recognized as an inflow of resources (revenue) until that time. The District currently
reports deferred inflows related to pensions in the government-wide statements and unavailable
revenue primarily related to taxes in the governmental funds.
Fund Balances
GASB Statement No. 54, Fund Balance Reporting and Governmental Fund Type Definitions,
establishes accounting and financial reporting standards for governmental funds. It establishes
criteria for classifying fund balances into specifically defined classifications and clarifies definitions for
governmental fund types. Fund balances for governmental funds are reported in classifications that
comprise a hierarchy based primarily on the extent to which the government is bound to honor
constraints on the uses of those resources.
GASB Statement No. 54 requires the fund balance to be properly reported within one of the fund
balance categories listed below:
Nonspendable – Fund balance amounts that cannot be spent because they are not expected to
be converted to cash or they are legally or contractually required to be maintained intact.
Examples of this classification are prepaid items, inventories, and the principal of an endowment
fund.
Spendable Fund Balance
Restricted – Fund balance amounts on which constraints have been placed by creditors, grantors, contributors, laws or regulations of other governments, constitutional provisions, or enabling legislation.
Committed – Fund balance amounts that can only be used for specific purposes pursuant to constraints imposed by the formal action (Board Resolution) of the highest level of decision-making authority (the School Board). The amounts cannot be used for any other purpose unless the School Board removes or changes the specified use by taking the same formal action (Board Resolution) it employed to commit the amounts.
Assigned – Fund balance amounts intended to be used for specific purposes but are neither restricted nor committed. Assigned amounts include those that have been set aside for a specific purpose by actions of the School Board or Superintendent as stated in School Board Policy 6220.01 - Fund Balance Reserve.
Unassigned – Includes residual positive fund balance within the General Fund which has not been classified within the other above mentioned categories. Unassigned fund balance may also include negative balances for any governmental fund if expenditures exceed amounts restricted, committed, or assigned for those specific purposes.
Pensions
In the government-wide statement of net position, liabilities are recognized for the District’s
proportionate share of each pension plan’s net pension liability. For purposes of measuring the net
pension liability, deferred outflows of resources and deferred inflows of resources related to pensions,
and pension expense, information about the fiduciary net position of the Florida Retirement System
(FRS), Health Insurance Subsidy (HIS) deferred benefit plans, and the Supplementary Early
Retirement Plan (SERP) additions to/deductions from both Plans fiduciary net position have been
determined on the same basis as they are reported by the Plans and are recorded in the

Report No. 2017-194 March 2017 Page 53
government-wide financial statements. For this purpose, benefit payments (including refunds of
employee contributions) are recognized when due and payable in accordance with the benefit terms.
Investments are reported at fair value.
BUDGETS COMPLIANCE AND ACCOUNTABILITY
Legal Compliance
The annual budget is submitted to the Florida Commissioner of Education by major functional levels
such as instructional, instructional support, general administration, maintenance of plant, etc.
Expenditures may not exceed appropriations without prior approval of the School Board in the
General Fund and special revenue funds at the function level. Budgetary control is exercised at the
fund level for all other funds.
Section 1013.61, Florida Statutes, requires that the capital outlay budget designate the proposed
capital outlay expenditures by project for the year from all fund sources. Accordingly, annual budgets
for the capital projects funds are adopted on a combined basis only.
Budgeted amounts may be amended by resolution of the Board at any Board meeting prior to the
due date for the Annual Financial Report (State Report). General Fund budgetary disclosure
reflects the final budget including all amendments approved at the School Board meeting of
September 7, 2016, for the fiscal year ended June 30, 2016.
Appropriations lapse at fiscal year-end, except for unexpended appropriations of State educational
grants, outstanding purchase orders, contracts, and certain available balances. These balances are
reflected at year-end either as restricted or assigned fund balance and are re-appropriated in the new
fiscal year.
Encumbrance accounting is employed in governmental funds. Encumbrances (e.g., purchase orders,
contracts) outstanding at year-end are reported as restricted or assigned fund balance and do not
constitute expenditures or liabilities because the commitments will be reappropriated and honored
during the subsequent year.
Comparison of Budget to Actual Results
The budgets for each of the governmental funds are accounted for on the modified accrual basis of
accounting.
CASH, CASH EQUIVALENTS, AND INVESTMENTS
Deposits and Investments
The District’s surplus funds are invested directly by the District’s Office of Treasury Management.
The District’s State Board of Education (SBE) bond proceeds are held and administered by the SBE
with any related investments made by the State Board of Administration. As authorized under State
Statutes, the School Board has adopted Board Policy 6144 - Investments as its formal investment
policy for all surplus funds, including the Supplemental Early Retirement Funds that are part of Board
Policy 6535 - Supplemental Early Retirement Plan. Board Policy 6144 - Investments policies permit

Report No. 2017-194 Page 54 March 2017
the following investments and are structured to place the highest priority on the safety of principal and
liquidity of funds:
Time Deposits – School Board and State approved designated depository
U.S. Government direct obligations
Revolving Repurchase Agreements or similar investment vehicles for the investment of funds awaiting clearance with financial institutions
Commercial Paper rated A1/P1/F1 or better
Bankers Acceptances with the 100 largest banks in the world
State Board of Administration Local Government Investment Pool
Obligations of the Federal Farm Credit Bank
Obligations of the Federal Home Loan Bank
Obligations of the Federal Home Loan Mortgage Corporation
Obligations of the Federal National Mortgage Association
Obligations guaranteed by the Government National Mortgage Association
Securities of any investment company of investment trust registered under the Investment Company Act of 1940, 15 U.S.C.
Corporate or Taxable Government Bonds rated investment grade
Equity/Fixed Income Securities including index and actively managed mutual funds
Guaranteed Investment Contracts (GIC) as allowed by bond/lease purchase covenants
The School Board has implemented GASB Statement No. 72, Fair Value Measurement and
Application, issued in February 2015 by categorizing its investments according to the fair value
hierarchy established by this Statement. The hierarchy is based on the valuation input used to
measure the fair value of the asset with Level 1 assets being those where quoted prices in an active
market for identical assets can be readily obtained and Level 2 assets valued using a matrix pricing
technique of quoted prices for similar assets or liabilities in active markets.
As of June 30, 2016, the School Board investments were all categorized as follows (in thousands):

Report No. 2017-194 March 2017 Page 55
Amount Level 1 Level 2
Weighted Average Maturity (Years)
Debt SecuritiesCommercial Paper 204,508$ -$ 204,508$ 0.18State Board of Education - Bond Proceeds* 398 - 398 U.S. Government Agency 341,640 - 341,640 0.24
U.S. Treasury Strip 14,593 14,593 - 11.41 Total Debt Securities 561,139 14,593 546,546 0.45
Mutual Funds SecuritiesEquity Securities 13,033 13,033 - Fixed Income Mutual Funds 9,741 9,741 - Real Estate Investment Trust (REIT) 1,293 - 1,293 Total Mutual Funds Securities 24,067 22,774 1,293
Total Investments 585,206 37,367$ 547,839$
Guaranteed Investment Contract (GIC) 8,819 3.09Money Market Mutual Funds 146,093 0.09Cash and Cash Equivalents 75,813
Total Cash, Cash Equivalents, and Investments 815,931$
Investment Type
*Bond proceeds held and administered by the SBE, and weighted average maturity information is not available.
At June 30, 2016, $237.6 million in cash and investments relate to unspent debt proceeds pertaining
to various financings including general obligation bonds, certificates of participation, and master
equipment lease which are restricted assets whose use is limited to projects primarily related to the
acquisition and construction of school facilities and equipment as authorized by Board resolutions
and debt covenants.
The total cash, cash equivalents, and investments of $815.9 million at June 30, 2016, was comprised
of $667.7 million in Governmental Funds, $100.2 million in the Proprietary Fund - Health Insurance
Fund, $24.2 million in Fiduciary Funds - Pension Trust Fund, and $23.8 million in Fiduciary
Funds - Agency Fund (Schools’ Internal Fund).
The School Board currently has two GICs associated with its Qualified Zone Academy Bonds
(QZABs). These contracts total approximately $8.82 million, with internal rates of return ranging from
3.53% to 4.25% and maturity dates from December 2018 through December 2022.
Interest Rate Risk: In accordance with its investment policies under Board Policy 6144 Investments,
the School Board manages its exposure to declines in fair values by substantially limiting the weighted
average maturity on all investments to 1 year or less. U.S. Government agency securities include
$15.8 million in callable bonds that are assumed to be called on the next call date and, as such, the
weighted average maturity reflects the call date as the maturity date for these securities. The
calculated weighted average maturity for all callable U.S. Government agency securities is 89 days.
Credit Risk: In accordance with Board Policy 6144 - Investments, the School Board manages its
exposure to credit risk by limiting investments to the highest rated government backed securities such

Report No. 2017-194 Page 56 March 2017
as Government agencies and Treasury notes. The policy also requires commercial paper to be rated
A-1 or better and money market mutual funds to be rated AAAm.
AmountsInvestment Type Rating* (in thousands)
Commercial Paper A-1 1.68% 12,447$ Commercial Paper A-1+ 25.95% 192,061 Federal Farm Credit Bank Agency AA+ 20.29% 150,136 Federal Home Loan Bank Agency AA+ 17.78% 131,563 Federal Home Loan Mortgage Corporation Agency AA+ 7.42% 54,939 Federal National Mortgage Association AA+ 0.68% 5,002 Guaranteed Investment Contract Not Rated 1.19% 8,819 Money Market Mutual Funds AAAm 19.74% 146,093 State Board of Education - Bond Proceeds Not Rated 0.05% 398 Institutional Mutual Funds Not Rated 3.25% 24,067 U.S. Treasury Strip AAA 1.97% 14,593
Percentage ofInvestments
*Standards & Poor’s ratings as of June 30, 2016.
Concentration of Credit Risk: Concentration of credit risk is the risk of loss attributed to the
magnitude of investments in a single issuer. In accordance with Board Policy 6144 - Investments,
the District permits investments of up to 7.5% of the total portfolio in commercial paper with a single
issuer and 60% in total, 30% in Federal Farm Credit Bank, 30% in Federal Home Loan Bank, 30% in
Federal Home Loan Mortgage Corporation, 30% in Federal National Mortgage Association, 10% in
time deposits with a single issuer, and unlimited U.S. Treasury notes as well as U.S. Government
obligations and money market mutual funds. The above listed concentration percentages are based
on the total investments excluding all cash equivalent investments such as time deposits, although
the District’s policy permits investments concentration maximum threshold percentages to be
calculated including all cash equivalent investments. All the commercial paper held as of
June 30, 2016, met the maximum 7.5% thresholds per issuer.
Custodial Credit Risk: Custodial credit risk is the risk of losses due to the failure of a counterparty
that is in possession of investment or collateral securities. All securities in accordance with the
District’s investment policy under Board Policy 6144 - Investments, with the exception of time deposits
and guaranteed investment contracts, are held by a third party custodian in an account separate and
apart from the assets of the custodian and are designated as assets of the District.
Cash/Deposits
The District’s cash deposits include money market savings accounts, demand deposits, and petty
cash. All bank balances of the District are fully insured or collateralized as required by Chapter 280,
Florida Statutes. At June 30, 2016, the deposits’ book balances were $75,813 (in thousands).

Report No. 2017-194 March 2017 Page 57
CAPITAL ASSETS
Capital asset balances and activity for the fiscal year ended June 30, 2016, are as follows (in thousands):
Balance Additions/ Deletions/ BalanceJuly 1, 2015 Transfers Transfers June 30, 2016
NondepreciableCapital Assets:
Land 353,208$ 40$ -$ 353,248$ Land Improvements 255,090 2,300 - 257,390 Construction in Progress 111,498 147,174 168,883 89,789 Total Nondepreciable Capital Assets 719,796 149,514 168,883 700,427
DepreciableCapital Assets:
Buildings andImprovements 5,652,007 157,108 9,332 5,799,783
Furniture, Fixtures, andEquipment 326,964 10,087 17,653 319,398
Computer Software 83,362 992 - 84,354 Motor Vehicles 127,083 4,800 232 131,651 Total Depreciable
Capital Assets 6,189,416 172,987 27,217 6,335,186
Less AccumulatedDepreciation/Amortization for:
Buildings and Improvements 2,018,987 161,024 9,321 2,170,690 Furniture, Fixtures, and
Equipment 234,720 19,519 16,755 237,484 Computer Software 76,135 4,917 - 81,052 Motor Vehicles 75,544 7,564 111 82,997 Total Accumulated
Depreciation/Amortization 2,405,386 193,024 26,187 2,572,223
Net Capital Assets 4,503,826$ 129,477$ 169,913$ 4,463,390$
For fiscal year ended June 30, 2016, depreciation/amortization by function is as follows (in thousands):
Function Amount
Instructional Services 1,774$ Instructional Support Services 1,368 Student Transportation Services 6,361 Operation and Maintenance of Plant 1,117 School Administration 133 General Administration 10 Business/Central Services 190 Administrative Technology Services 1 Food Services 1,247 Community Services 86 Facilities Acquisition and Construction 16,967 Unallocated 163,770
Total Depreciation/Amortization 193,024$

Report No. 2017-194 Page 58 March 2017
Construction in progress as of June 30, 2016, is comprised of the following (in thousands):
IncurredLocation to Date
Elementary Schools 51,045$ Middle Schools 8,642 Senior High Schools 27,556 Special Schools 2,539 Administration/Other 7
Total 89,789$
As part of its capital outlay program, the District has entered into various construction contracts. At
June 30, 2016, the District had construction commitments of approximately $144.3 million.
INTERFUND RECEIVABLES, PAYABLES, AND TRANSFERS
Interfund receivables and payables consisted of the following balances as of June 30, 2016
(in thousands):
Due from Due to
Other Funds Other Funds
Major Fund: 8,850$ -$
General
Nonmajor Funds - 8,850
Total Governmental Funds 8,850$ 8,850$
Interfund receivables and payables are short-term balances that represent reimbursements between
funds for payments made by one fund on behalf of another fund.
A summary of transfers for the fiscal year ended June 30, 2016, is as follows (in thousands):
General NonmajorFund Funds Total
Transfers from:
Major Funds: General -$ 15,177$ 15,177$ Capital Improvement LOML 136,117 192,174 328,291 Nonmajor Funds 18,213 17,819 36,032
Total Governmental Funds 154,330$ 225,170$ 379,500$
Transfers to
Transfers to the General Fund relate primarily to funding for the maintenance, renovation, and/or repair
of school facilities, pursuant to Section 1011.71, Florida Statutes. Transfers to nonmajor funds relate
primarily to amounts transferred to make debt service payments.

Report No. 2017-194 March 2017 Page 59
DUE FROM/TO OTHER GOVERNMENTS OR AGENCIES
Due from other governments or agencies at June 30, 2016, are as follows (in thousands):
Nonmajor Total TotalGeneral Governmental Governmental Government-
Fund Funds Funds wide
Federal: Medicaid Federal 10,357$ -$ 10,357$ 10,357$ Food Service Reimbursement - 22,675 22,675 22,675 Early Head Start/ Head Start - 3,966 3,966 3,966 Miscellaneous Federal 347 981 1,328 1,328
State: IDEA - 1,874 1,874 1,874 Title I - 2,116 2,116 2,116 Title II - 1,310 1,310 1,310 SAVES - 1,131 1,131 1,131 Voluntary Prekindergarten Programs 2,885 - 2,885 4,110 Miscellaneous State 224 2,128 2,352 2,352
Local: Miscellaneous Local 5,437 157 5,594 5,594 Miami-Dade County - 5,553 5,553 5,553 Clearwire Educational Broadband Service 8,678 - 8,678 8,678 Driver's Education Program 2,440 - 2,440 2,440
Total 30,368$ 41,891$ 72,259$ 73,484$
Due to other governments or agencies at June 30, 2016, are as follows (in thousands):
Nonmajor Total TotalGeneral Governmental Governmental Government-
Fund Funds Funds wide
Federal: Miscellaneous Federal -$ 43$ 43$ 43$
Local: Charter Schools 2,066 - 2,066 2,066 Miscellaneous Local - 2,106 2,106 2,106
Total 2,066$ 2,149$ 4,215$ 4,215$

Report No. 2017-194 Page 60 March 2017
SHORT-TERM DEBT
Short-term debt activity for the fiscal year ended June 30, 2016, is as follows (in thousands):
Balance BalanceJuly 1, 2015 Additions Deletions June 30, 2016
-$ 305,000$ 305,000$ -$
Tax Anticipation Note (TAN), Series2015, issued on July 28, 2015,effective yield of 0.17%, with amaturity date of February 25, 2016.
Proceeds from the TAN were used as a working capital reserve in the General Fund as permitted under
State and Federal tax laws.
COMPENSATED ABSENCES
The District’s employee vacation and sick leave policies provide for the granting of a specific number of
days of vacation based on years of service governed by applicable labor contracts and one day of sick
leave with pay per each month of employment. Active employees, excluding administrators, may request
payment of 80% of their unused sick leave which has accumulated during the fiscal year, provided they
have not used more than three sick/personal days during that time and have a remaining balance, after
payment, of 21 days. These policies also provide for paying most employees unused vacation up to
60 days upon termination, and up to 100% of unused sick leave after 13 years of service; 50% after
10 years; 45% after 6 years; 40% after 3 years; and 35% during the first 3 years of qualified service upon
retirement, death, or resignation. Vacation accrual is limited to 60 days for 12-month active employees.
The School Board approved the adoption of the Miami-Dade County Public Schools Terminal Leave
Retirement Program (TLRP) at its May 14, 2003, Board meeting. The TLRP Program consists of a
tax-favored retirement plan, which allows the Board to direct accrued annual (vacation) leave or terminal
sick leave (accrued sick days) for employees who are separating from service as a result of retirement,
or entering into or continuing Deferred Retirement Option Program (DROP), to a tax-sheltered annuity
program, or other qualified plan, in lieu of a taxable cash payment to the employee, upon separation from
service.
The program is mandatory as a result of Board action which became effective on May 15, 2003, for all
personnel (except AFSCME employees) who will have their annual (vacation) leave and terminal sick
leave automatically contributed to either the Board’s Tax Sheltered Annuity 403(b) or 401(a) Programs.
Contributions into this program will not be subject to either Federal Income Tax (estimated 27%) or Social
Security Tax (FICA) of 7.65%. Any amount of accrued terminal leave in excess of the amounts authorized
by the Internal Revenue Service will be paid out to the retiring employee and will be subject to applicable
taxes.
The current portion (the amount expected to be liquidated with current available resources) of the
accumulated vested vacation and anticipated sick leave payments is recorded in the General Fund and
is included in accrued payroll and compensated absences. The liabilities recorded include provisions for
the employer’s portion of pension contributions, FICA, and other fringe benefits due on the vested

Report No. 2017-194 March 2017 Page 61
vacation and sick leave balances as applicable. At June 30, 2016, the accrued liability for compensated
absences in the General Fund was $6.6 million.
GASB Statement No. 16, Accounting for Compensated Absences, requires governmental agencies to
record as a liability the vested and future rights to sick and/or vacation leave. Accordingly, the probability
of partially vested employees becoming fully vested and actual past termination payment experience was
considered in the determination of this liability.
The statement of net position reflects both the current and long-term portions of compensated absences
including retirement incentive benefits. At June 30, 2016, the current and long-term portions were
$12,727 and $268,515 respectively (in thousands).
CAPITAL LEASES
The District has entered into various capital lease agreements for the acquisition of certain property,
vehicles, and equipment which are stated at acquisition cost and reported as capital assets. At
June 30, 2016, the cost of leased equipment recorded as capital assets was $183.1 million, with
accumulated depreciation of $135.9 million, for a net book value of $47.2 million. Additionally,
$1.5 million of unspent proceeds relating to master equipment lease agreements is accounted for as
restricted cash and investments at June 30, 2016.
The following is a summary of the future minimum lease payments, under capital leases together with
the present value of the minimum lease payments as of June 30, 2016 (in thousands):
Other Master Lease Fiscal Year Leases Equipment Total
2017 459$ 18,970$ 19,429$ 2018 255 15,873 16,128 2019 182 15,860 16,042 2020 134 12,326 12,460 2021 14 5,304 5,318 2022 - 2023 - 4,571 4,571
1,044 72,904 73,948 Less AmountRepresenting Interest* 77 3,086 3,163
Present Value of Minimum Lease Payments 967$ 69,818$ 70,785$
*The amount representing interest was calculated using imputed rates ranging from 0% to 16.01%.
LONG-TERM BONDS PAYABLE
State Board of Education Capital Outlay Bonds
Capital Outlay Bonds are issued by the State Board of Education (SBE) on behalf of the District and are
generally referred to as “SBE Bonds.” The bonds mature serially and are secured by a portion of the
District’s State revenues derived from the sale of automobile license plates. Principal and interest
payments, investment of debt service fund resources, and compliance with reserve requirements are
administered by the SBE and the State Board of Administration. At June 30, 2016, amounts withheld

Report No. 2017-194 Page 62 March 2017
and in the custody of the State totaled $398 thousand and are included as cash and investments with
fiscal agent in the statement of net position.
General Obligation Bonds
On March 8, 1988, pursuant to Sections 1010.40 through 1010.54, Florida Statutes, voter residents of
the County approved a referendum authorizing the School Board to issue General Obligation School
Bonds in an aggregate amount not exceeding $980 million, to be issued as required. The proceeds from
the bonds were used to pay for the construction of new educational facilities and improving existing
educational facilities. As of June 30, 2016, no bonds remain to be issued. Principal and interest on the
bonds are paid from ad valorem school district taxes on all taxable real and personal property, excluding
homestead exemption as required by Florida law, without limitation as to rate or amount.
On November 6, 2012, pursuant to Sections 1010.40 through 1010.54, Florida Statutes, voter residents
of the County approved a referendum authorizing the School Board to issue additional General Obligation
School Bonds in an aggregate amount not to exceed $1.2 billion. The proceeds from the bonds are to
be used to pay for modernizing, constructing, enlarging, or otherwise improving school buildings,
including educational technology upgrades.
As of June 30, 2016, three separate bond series have been issued pursuant to this referendum. The
General Obligation Bond Series 2013 and 2014A were sold on July 10, 2013. The General Obligation
Bond Series 2013, for $190 million, was issued on July 24, 2013, and the General Obligation Bond Series
2014A, for $96.5 million, negotiated on a forward settle basis, was issued on February 11, 2014. The
General Obligation Bond Series 2015, for $192.7 million, was sold on July 21, 2015, and issued on
August 12, 2015.
Principal and interest on these and any future bond issues will be paid from ad valorem school district
taxes on all taxable real and personal property, excluding homestead exemption as required by Florida
Law, without limitation as to rate or amount.
A summary of bonds payable as of June 30, 2016, is as follows (in thousands):

Report No. 2017-194 March 2017 Page 63
Authorized
Issued
Outstanding
SBE Capital Outlay Bonds – Series 2008A, due in varying annual payments through January 1, 2028, with interest rates ranging from 3.25% to 5%. Interest is payable semi-annually on January and July 1. Bonds are callable on January 1, 2018, at par plus 1% premium, and thereafter at par. $ 8,425
$ 8,425
$ 6,415
SBE Capital Outlay Bonds – Series 2009A Refunding, due in varying annual payments through January 1, 2019, with interest rates ranging from 2% to 5%. Interest is payable semi-annually on January and July 1. Bonds are callable on January 1, through December 31, 2019, at par plus 1% premium, and thereafter at par. $ 1,710
$ 1,710
$ 540
SBE Capital Outlay Bonds – Series 2009A New Portion, due in varying annual payments through January 1, 2029, with interest rates ranging from 2% to 5%. Interest is payable semi-annually on January and July 1. Bonds are callable on January 1, through December 31, 2019, at par plus 1% premium, and thereafter at par. $ 1,355
$ 1,355
$ 1,060
SBE Capital Outlay Bonds – Series 2010A Refunding, due in varying annual payments through January 1, 2022, with interest rates ranging from 4% to 5%. Interest is payable semi-annually on January and July 1. Bonds are callable on January 1, through December 31, 2020, at par. A portion of the proceeds was used to refund SBE Capital Outlay Bonds Series 2001A and 2002A to achieve debt service savings. $ 1,440
$ 1,440
$ 960
SBE Capital Outlay Bonds – Series 2010A New Portion, due in varying annual payments through January 1, 2030, with interest rates ranging from 3% to 5%. Interest is payable semi-annually on January and July 1. Bonds are callable on January 1, through December 31, 2020, at par. $ 640
$ 640
$ 505
SBE Capital Outlay Bonds – Series 2011A Refunding, due in varying annual payments through January 1, 2023, with interest rates ranging from 3% to 5%. Interest is payable semi-annually on January and July 1. Bonds are callable on January 1, through December 31, 2021, at par. A portion of the proceeds was used to refund SBE Capital Outlay Bonds Series 2003A to achieve debt service savings. $ 725
$ 725
$ 575
SBE Capital Outlay Bonds – Series 2014A Refunding, due in varying annual payments through July 1, 2024, with interest rates ranging from 2% to 5%. Interest is payable semi-annually on January and July 1. Bonds are callable on January 1, through December 31, 2024, at par. A portion of the proceeds was used to refund SBE Capital Outlay Bonds Series 2004A to achieve debt service savings. $ 2,963
$ 2,963
$ 2,501
SBE Capital Outlay Bonds – Series 2014B Refunding, due in varying annual payments through January 1, 2020, with interest rates ranging from 2% to 5%. Interest is payable semi-annually on January and July 1. A portion of the proceeds was used to refund SBE Capital Outlay Bonds Series 2005A and 2005B to achieve debt service savings. $ 12,527
$ 12,527
$ 3,758

Report No. 2017-194 Page 64 March 2017
Authorized
Issued
Outstanding
General Obligation Refunding School Bonds, Series 1997, consisting of serial bonds due in varying serial payments through February 15, 2017. Interest, at a rate of 5%, is payable February 15 and August 15. Bonds maturing on February 15, 2008, and thereafter were called on November 1, 2006, at the redemption price of 101%. The bonds were remarketed at the same maturity dates, rates, and issue date at a true interest cost of 3.83%. The sale resulted in the same cash flow as prior debt service. $ 86,785
$ 86,785
$
10,910
General Obligation School Bonds, Series 2013, consisting of serial and term bonds, due in varying payments through March 15, 2043. Interest with rates ranging from 4% to 5% is payable March 15 and September 15. True interest cost is 4.54%. Bonds maturing on March 15, 2024, and thereafter are callable.
First in a series not to exceed
$1,200,000
$ 190,005
$ 183,730
General Obligation School Bonds, Series 2014A, consisting of serial and term bonds, due in varying payments through March 15, 2044. Interest, at a rate of 5%, is payable March 15 and September 15. True interest cost is 4.68%. Bonds maturing on March 15, 2025, and thereafter are callable.
Second in a series not to exceed
$1,200,000
$ 96,475
$ 94,925
General Obligation School Bonds, Series 2015, consisting of serial and term bonds, due in varying payments through March 15, 2045. Interest with rates ranging from 3.5% to 5% is payable March 15 and September 15. True interest cost is 3.8973%. Bonds maturing in March 2026 and thereafter, with the exception of the bond maturing on March 15, 2030, are callable.
Third in a series not to exceed
$1,200,000
$ 192,720
$ 190,395
Total Long-Term Bonds Payable
$ 496,274
Several of the SBE long-term bonds are callable prior to maturity during the years 2019 through 2024.
The General Obligation Bond and SBE debt service requirements to maturity, assuming none of the SBE
bonds are called prior to their scheduled maturity date, are as follows (in thousands):
Year TotalEnding Debt Service June 30 Principal Interest Requirements
2017 23,497$ 23,489$ 46,986$ 2018 9,997 22,316 32,313 2019 10,276 21,816 32,092 2020 10,617 21,305 31,922 2021 11,165 20,776 31,941 2022-2026 63,162 95,038 158,200 2027-2031 75,960 78,267 154,227 2032-2036 92,685 59,458 152,143 2037-2041 116,405 35,925 152,330 2042-2046 82,510 8,066 90,576
Total 496,274$ 386,456$ 882,730$

Report No. 2017-194 March 2017 Page 65
OBLIGATIONS UNDER LEASE PURCHASE AGREEMENTS – CERTIFICATES OF
PARTICIPATION, QUALIFIED ZONE ACADEMY BONDS, QUALIFIED SCHOOL
CONSTRUCTION BONDS AND BUILD AMERICA BONDS
On August 1, 1994, the District entered into a Lease Purchase Agreement, with the Dade County School
Board Foundation, Inc., (the “Foundation”) a Florida not-for-profit corporation and blended component
unit of the District, to finance the acquisition and construction of new schools and appurtenant equipment
and other property (the “Facilities”) to be operated by the District. The members of the School Board
serve as the Board of Directors of the Foundation. The Foundation was formed by the School Board
solely for the purpose of acting as the lessor of the Facilities, with the District as lessee. The School
Board, as lessor, entered into Ground Leases with the Foundation for the Facilities’ sites and all
improvements. In conjunction therewith, certificates of participation, (the “Certificates”) were issued to
third parties, evidencing undivided proportionate interests in basic lease payments to be made by the
District, as lessee, pursuant to the Lease Purchase Agreement. Fee title to the Facilities and the Facilities
sites is in the name of the District. The District is responsible for operation, maintenance, use, occupancy,
upkeep and insurance of the Facilities.
The Foundation leases the Facilities to the District under the Lease Purchase Agreement, which are
automatically renewable annually through May 1, 2037, unless terminated, in accordance with the
provisions of the Lease Purchase Agreements, as a result of default or the failure of the School Board to
appropriate funds to make lease payments in its final official budget. The remedies on default or upon
an event of non-appropriation include the surrender of the Facilities by the District and its re-letting for
the remaining Ground Lease term, or the voluntary sale of the Facilities by the School Board, in either
case with the proceeds to be applied against the School Board’s obligations under the Lease Purchase
Agreements.
The Certificates are not separate legal obligations of the School Board, but represent undivided interests
in lease payments to be made from appropriated funds budgeted annually by the School Board for such
purpose from current or other funds authorized by law and regulations of the Florida Department of
Education, including the local optional millage levy. However, neither the School Board, the District, the
State of Florida, nor any political subdivision thereof, are obligated to pay, except from appropriated
funds, any sums due under the Lease Purchase Agreement from any source of taxation. The full faith
and credit of the School Board and the District is not pledged for payment of such sums due under the
Lease Purchase Agreement and such sums do not constitute an indebtedness of the School Board or
the District within the meaning of any constitutional or statutory provision or limitation. The District plans
to make the Series 2006C, 2006D, 2012B-1, 2012B-2, and 2014B lease payments from the impact fees
collected on new residential construction by Miami-Dade County and remitted to the School Board, and
from the Local Optional Millage Levy.
Basic lease payments are deposited with the Trustee semi-annually. For accounting purposes, due to
the consolidation of the Foundation within the financial statements, basic lease payments are reflected
as debt service expenditures when payable to Certificate holders. A trust fund was established with the
Trustee to facilitate payments in accordance with the Lease Purchase Agreements and the Trust
Agreements. Various accounts are maintained by the Trustee in accordance with the Trust Indenture.
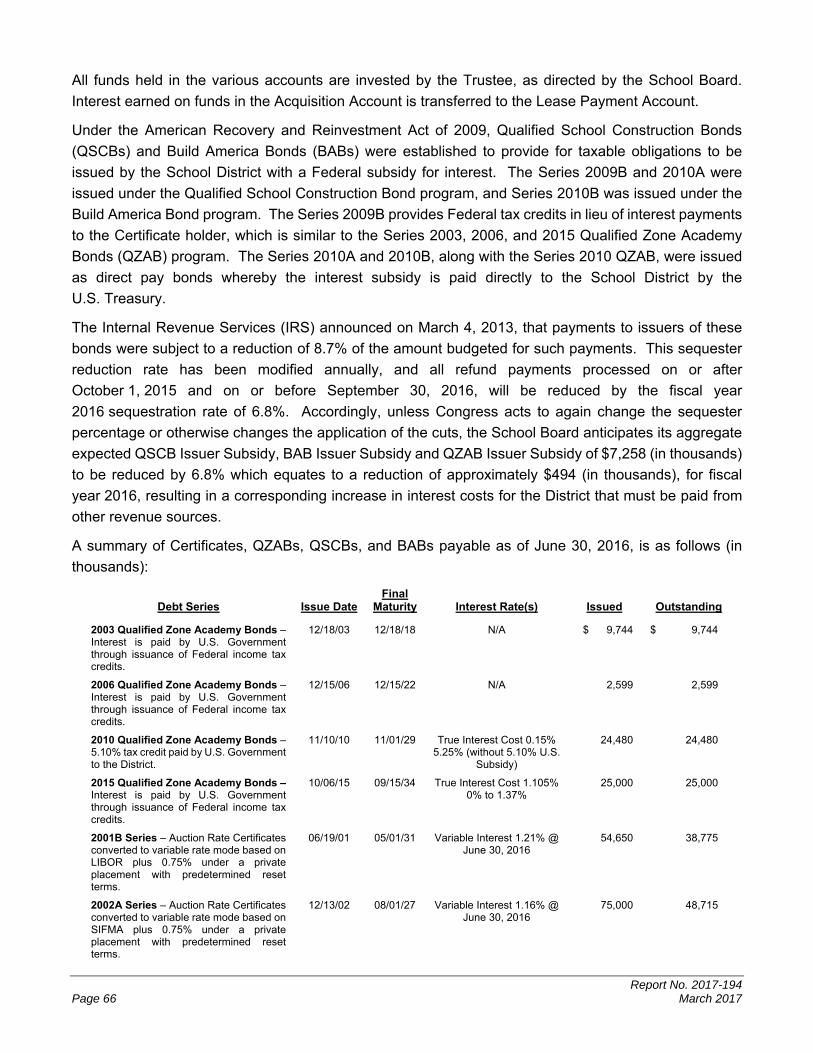
Report No. 2017-194 Page 66 March 2017
All funds held in the various accounts are invested by the Trustee, as directed by the School Board.
Interest earned on funds in the Acquisition Account is transferred to the Lease Payment Account.
Under the American Recovery and Reinvestment Act of 2009, Qualified School Construction Bonds
(QSCBs) and Build America Bonds (BABs) were established to provide for taxable obligations to be
issued by the School District with a Federal subsidy for interest. The Series 2009B and 2010A were
issued under the Qualified School Construction Bond program, and Series 2010B was issued under the
Build America Bond program. The Series 2009B provides Federal tax credits in lieu of interest payments
to the Certificate holder, which is similar to the Series 2003, 2006, and 2015 Qualified Zone Academy
Bonds (QZAB) program. The Series 2010A and 2010B, along with the Series 2010 QZAB, were issued
as direct pay bonds whereby the interest subsidy is paid directly to the School District by the
U.S. Treasury.
The Internal Revenue Services (IRS) announced on March 4, 2013, that payments to issuers of these
bonds were subject to a reduction of 8.7% of the amount budgeted for such payments. This sequester
reduction rate has been modified annually, and all refund payments processed on or after
October 1, 2015 and on or before September 30, 2016, will be reduced by the fiscal year
2016 sequestration rate of 6.8%. Accordingly, unless Congress acts to again change the sequester
percentage or otherwise changes the application of the cuts, the School Board anticipates its aggregate
expected QSCB Issuer Subsidy, BAB Issuer Subsidy and QZAB Issuer Subsidy of $7,258 (in thousands)
to be reduced by 6.8% which equates to a reduction of approximately $494 (in thousands), for fiscal
year 2016, resulting in a corresponding increase in interest costs for the District that must be paid from
other revenue sources.
A summary of Certificates, QZABs, QSCBs, and BABs payable as of June 30, 2016, is as follows (in
thousands):
Debt Series Issue Date
Final Maturity Interest Rate(s)
Issued Outstanding
2003 Qualified Zone Academy Bonds – Interest is paid by U.S. Government through issuance of Federal income tax credits.
12/18/03 12/18/18 N/A $ 9,744 $ 9,744
2006 Qualified Zone Academy Bonds – Interest is paid by U.S. Government through issuance of Federal income tax credits.
12/15/06
12/15/22
N/A
2,599
2,599
2010 Qualified Zone Academy Bonds – 5.10% tax credit paid by U.S. Government to the District.
11/10/10 11/01/29 True Interest Cost 0.15% 5.25% (without 5.10% U.S.
Subsidy)
24,480 24,480
2015 Qualified Zone Academy Bonds – Interest is paid by U.S. Government through issuance of Federal income tax credits.
10/06/15 09/15/34 True Interest Cost 1.105% 0% to 1.37%
25,000 25,000
2001B Series – Auction Rate Certificates converted to variable rate mode based on LIBOR plus 0.75% under a private placement with predetermined reset terms.
06/19/01
05/01/31
Variable Interest 1.21% @ June 30, 2016
54,650
38,775
2002A Series – Auction Rate Certificates converted to variable rate mode based on SIFMA plus 0.75% under a private placement with predetermined reset terms.
12/13/02 08/01/27 Variable Interest 1.16% @ June 30, 2016
75,000 48,715
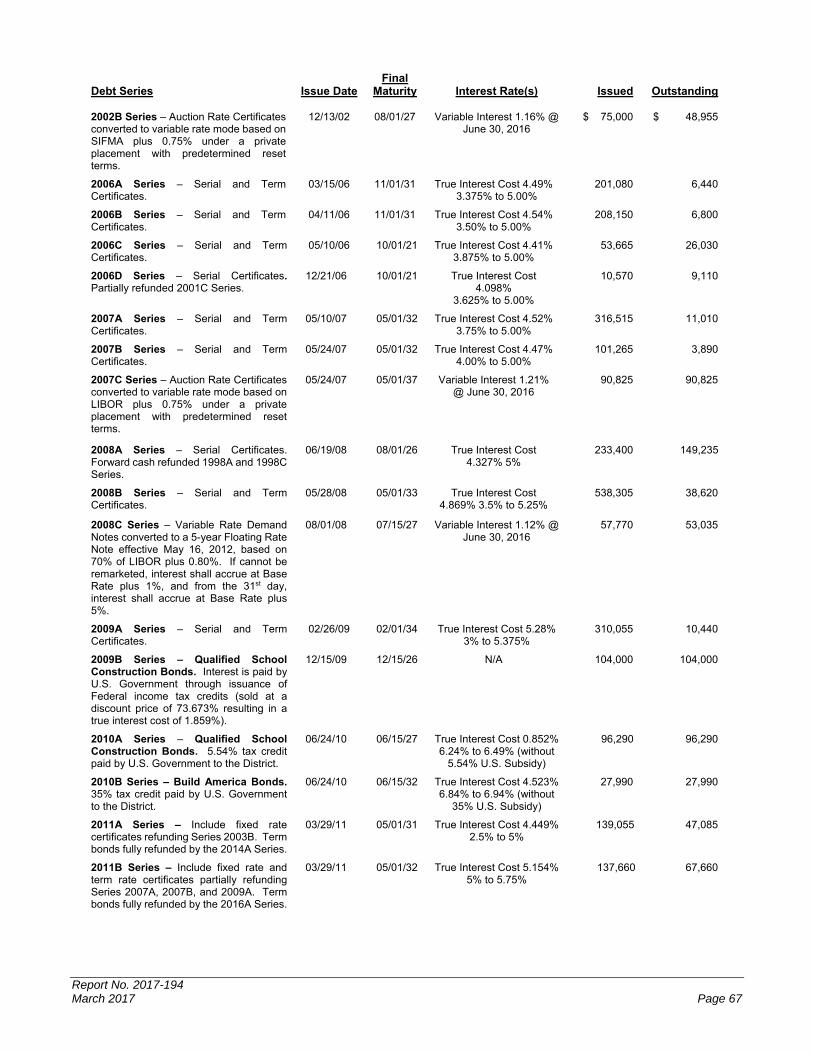
Report No. 2017-194 March 2017 Page 67
Debt Series Issue Date
Final Maturity Interest Rate(s)
Issued Outstanding
2002B Series – Auction Rate Certificates converted to variable rate mode based on SIFMA plus 0.75% under a private placement with predetermined reset terms.
12/13/02 08/01/27 Variable Interest 1.16% @ June 30, 2016
$ 75,000 $ 48,955
2006A Series – Serial and Term Certificates.
03/15/06 11/01/31 True Interest Cost 4.49% 3.375% to 5.00%
201,080 6,440
2006B Series – Serial and Term Certificates.
04/11/06 11/01/31 True Interest Cost 4.54% 3.50% to 5.00%
208,150 6,800
2006C Series – Serial and Term Certificates.
05/10/06 10/01/21 True Interest Cost 4.41% 3.875% to 5.00%
53,665 26,030
2006D Series – Serial Certificates. Partially refunded 2001C Series.
12/21/06 10/01/21 True Interest Cost 4.098%
3.625% to 5.00%
10,570 9,110
2007A Series – Serial and Term Certificates.
05/10/07
05/01/32
True Interest Cost 4.52% 3.75% to 5.00%
316,515
11,010
2007B Series – Serial and Term Certificates.
05/24/07
05/01/32
True Interest Cost 4.47% 4.00% to 5.00%
101,265
3,890
2007C Series – Auction Rate Certificates converted to variable rate mode based on LIBOR plus 0.75% under a private placement with predetermined reset terms.
05/24/07
05/01/37
Variable Interest 1.21% @ June 30, 2016
90,825 90,825
2008A Series – Serial Certificates. Forward cash refunded 1998A and 1998C Series.
06/19/08 08/01/26 True Interest Cost 4.327% 5%
233,400 149,235
2008B Series – Serial and Term Certificates.
05/28/08
05/01/33
True Interest Cost 4.869% 3.5% to 5.25%
538,305
38,620
2008C Series – Variable Rate Demand Notes converted to a 5-year Floating Rate Note effective May 16, 2012, based on 70% of LIBOR plus 0.80%. If cannot be remarketed, interest shall accrue at Base Rate plus 1%, and from the 31st day, interest shall accrue at Base Rate plus 5%.
08/01/08
07/15/27
Variable Interest 1.12% @ June 30, 2016
57,770
53,035
2009A Series – Serial and Term Certificates.
02/26/09 02/01/34 True Interest Cost 5.28% 3% to 5.375%
310,055 10,440
2009B Series – Qualified School Construction Bonds. Interest is paid by U.S. Government through issuance of Federal income tax credits (sold at a discount price of 73.673% resulting in a true interest cost of 1.859%).
12/15/09 12/15/26 N/A 104,000 104,000
2010A Series – Qualified School Construction Bonds. 5.54% tax credit paid by U.S. Government to the District.
06/24/10
06/15/27
True Interest Cost 0.852% 6.24% to 6.49% (without
5.54% U.S. Subsidy)
96,290
96,290
2010B Series – Build America Bonds. 35% tax credit paid by U.S. Government to the District.
06/24/10
06/15/32
True Interest Cost 4.523% 6.84% to 6.94% (without
35% U.S. Subsidy)
27,990 27,990
2011A Series – Include fixed rate certificates refunding Series 2003B. Term bonds fully refunded by the 2014A Series.
03/29/11 05/01/31 True Interest Cost 4.449% 2.5% to 5%
139,055 47,085
2011B Series – Include fixed rate and term rate certificates partially refunding Series 2007A, 2007B, and 2009A. Term bonds fully refunded by the 2016A Series.
03/29/11 05/01/32 True Interest Cost 5.154% 5% to 5.75%
137,660 67,660

Report No. 2017-194 Page 68 March 2017
Debt Series
Issue Date
Final Maturity Interest Rate(s)
Issued Outstanding
2012A Series – Include fixed rate and term rate certificates partially refunding Series 2003D ($148,850). Term Bonds fully refunded by the 2016B Series.
07/05/12 08/01/29 True Interest Cost 3.606% 2% to 5%
$ 149,365 $ 83,390
2012B-1 Series – Serial Certificates. Partially refunded 2004A ($15,575).
07/05/12 10/01/20 True Interest Cost 2.814% 5%
13,765 13,765
2012B-2 Series – Serial Certificates. Partially refunded 2005A ($16,725).
07/05/12 04/01/20 True Interest Cost 2.379% 4%
15,655 12,260
2013A Series – Serial Certificate. Partially refunded 2006A ($15,335), 2006B ($12,470), 2007A ($9,525), 2007B ($2,075), and 2008B ($30,320).
05/01/13 05/01/32 True Interest Cost 4.199% 5%
68,230 68,230
2013B Series – Serial Certificates. Fully refunded 2003D ($2,110) and partially refunded 2009A ($6,395).
05/01/13 02/01/30 True Interest Cost 4.097% 5%
8,160 8,160
2014A Series – Term Rate Certificates fully refunding the 2011A Term Rate Certificates. The bonds have a mandatory 10-year soft put on 5/1/2024 at 100%. If cannot be remarketed, interest shall accrue at 11% per year.
03/11/14 05/01/31 True Interest Cost 4.056% 5%
70,980 70,980
2014B Series - Serial Certificates. Fully refunded on a forward refunding basis the 2004A.
07/03/14 10/01/18 True Interest Cost 1.410% 1.41%
38,130 28,880
2014C Series – Serial Certificates. 06/30/14 05/1/24 True Interest Cost 2.210% 4,085 3,385 2014D Series – Serial Certificates. Partially refunding 2006A ($146,565) and 2006B ($151,230).
11/20/14 11/01/31 True Interest Cost 3.053% 4% to 5%
276,995 276,995
2015A Series – Serial Certificates. Partially refunding 2007A ($249,470) and 2007B ($76,740).
01/21/15 05/01/32 True Interest Cost 3.166% 5%
306,820 306,820
2015B Series – Serial and Term Certificates partially refunding 2008B ($230,370) with a gross savings of $13,235 and a net present value savings of $11,839.
07/30/15 05/01/28 True Interest Cost 3.162% 1% to 5%
239,630 234,950
2015C Series – Serial Certificates partially refunding 2008B ($34,265) with a gross savings of $2,322 and a net present value savings of $1,971.
07/31/15 05/01/25 True Interest Cost 3.095% 5%
33,565 33,565
2015D Series – Serial Certificates partially refunding 2008B ($110,715) and 2009A ($241,560) with a gross savings of $27,029 and a net present value savings of $19,705.
12/16/15 02/01/34 True Interest Cost 3.456% 3.5% to 5%
345,890 345,890
2016A Series – Serial Certificates fully refunding 2011B Term Rate Certificates ($70,000) with a gross savings of $7,200, and a net present value savings of $5,012.
02/03/16 05/01/32 True Interest Cost 4.265% 5%
66,425 66,425

Report No. 2017-194 March 2017 Page 69
Debt Series
Issue Date
FinalMaturity Interest Rate(s)
Issued Outstanding
2016B Series – Serial Certificates fully refunding 2012A Term Rate Certificates ($58,780) with a gross savings of $632, and a net present value savings of $625.
02/03/16 08/01/27 True Interest Cost 3.351% 5%
$ 55,995 $ 55,995
2016C Series – Serial Certificates partially refunding 2008B ($90,695) and 2009A ($8,575) with a gross savings of $9,943, and a net present value savings of $7,256.
04/07/16 02/01/33 True Interest Cost 3.329% 3.25% to 5%
100,495 100,495
$ 4,687,253 $ 2,656,913
At June 30, 2016, the following in substance defeased Certificates remain outstanding:
Amount
Defeased Outstanding
Certificates ($ in thousands)
2006A 146,565$
2006B 151,230
2007A 249,470
2007B 76,740
2008B 466,045
2009A 250,135
Debt service requirements for obligations under lease purchase agreements to maturity, assuming the
obligations will be remarketed based on the specified soft put dates disclosed below, are as follows
(in thousands): Year Ending
June 30
Principal
Interest**** Total Debt Service
Requirements*
2017*** $ 117,274 $ 102,261 $ 219,535
2018 126,458 98,609 225,067
2019 138,702 94,357 233,059
2020 135,172 89,674 224,846
2021 141,852 84,643 226,495
2022 - 2026** 749,173 353,102 1,102,275
2027 - 2031 919,667 187,152 1,106,819
2032 - 2036 308,715 17,449 326,164 2037 - 2038 19,900 203 20,103
Total $ 2,656,913 $ 1,027,450 $ 3,684,363
* The schedule above reflects required annual payments to the sinking funds for the retirement of the debt,and are not considered reduction of principal until the year of maturity. The total outstanding balance for the QZABs as of year-end is $61,823 (in thousands).
** Series 2014A has a 10 year soft put on May 1, 2024, of $71 million. If the District is unable to remarket the debt, the interest rate on the COP will increase to 11%.
*** Requirements for 2017 include a 5-year floating rate note for COP Series 2008C, effective May 16, 2012,based on 70% of LIBOR plus 0.80%. The District intends to remarket in full; however, if it cannot beremarketed, interest shall accrue at base rate plus 1%, and from the 31st day, interest shall accrue atbase rate plus 5%.
**** Interest rates on several obligations are variable. The rates for such obligations range from 1.16 - 1.21%.

Report No. 2017-194 Page 70 March 2017
Hedging Derivative Instruments
Objectives: The District entered into pay-fixed interest rate forward swaps (referred to herein collectively
as “Swaps”) in order to lower its cost of capital and protect against rising interest rates. The Swaps are
classified as cash flow hedges on the District’s floating rate debt and were executed to manage its mix
of fixed and floating rate exposure in its on-going borrowing program.
In February 2015, the GASB issued Statement No. 72, Fair Value Measurement and Application, which
addresses the accounting and financial reporting issues related to fair value measurements, including
non-performance risk. The Statement is effective for reporting periods beginning after June 15, 2015,
and the District adopted GASB Statement No. 72 for the fiscal year ended June 30, 2016.
The following Swaps had changes in fair value totaling $(3,836) (in thousands) classified as an increase
of deferred outflow of resources. All expected Swap cash flows have been calculated using the
zero-coupon method by an independent party. This method calculates the future net settlement
payments required by the Swaps, assuming that the current forward rates implied by the yield curve are
the market’s best estimate of future spot interest rates. The income approach is then used to obtain the
fair value of the Swaps using a rate of return that takes into account the relative risk of nonperformance
associated with the cash flows and the time value of money. The observability of inputs used to perform
the measurement results in the Swap fair values being categorized as level 2.
The fair values calculated in the chart below were computed as required by GASB Statement No. 72.
Counterparty
Notional
Amount
Outstanding
Effective
Date
Termination
Date
Associated
Certificates
Fixed
Payable
Swap
Rate
Variable
Receivable
Swap Rate
Counterparty
Credit Rating
at June 30,
2016*
Fair Value at
June 30, 2016
Royal Bank of
Canada
$48,715,000 04-01-
2007
08-01-2027 COP 2002A 3.821% 70% 1Mo
LIBOR
Aa3/AA-/AA $ (8,712,991)
Royal Bank of
Canada
$48,955,000 04-01-
2007
08-01-2027 COP 2002B 3.821% 70% 1Mo
LIBOR
Aa3/AA-/AA (8,666,542)
Royal Bank of
Canada
$53,035,000 03-08-
2012
07-15-2027 COP 2008C 3.909% 70% 1Mo
LIBOR
Aa3/AA-/AA (13,032,832)
*Moody’s/S&P/FITCH Total $ (30,412,365)
Using rates as of June 30, 2016, debt service requirements for variable rate debt and net Swap payments,
assuming current interest rates remain the same, are as follows (in thousands):

Report No. 2017-194 March 2017 Page 71
Hedging Total DebtDerivative Total Service
Fiscal Year Principal Interest Instruments, Net Interest Requirement
2017 8,330$ 1,648$ 5,122$ 6,770$ 15,100$ 2018 7,990 1,567 4,805 6,372 14,362 2019 8,610 1,465 4,370 5,835 14,445 2020 8,855 1,362 4,186 5,548 14,403 2021 9,290 1,248 3,861 5,109 14,399 2022-2026 61,675 4,316 13,567 17,883 79,558 2027-2028 45,955 490 1,629 2,119 48,074
Total 150,705$ 12,096$ 37,540$ 49,636$ 200,341$
Risk Disclosures:
Credit Risk. The Swaps rely upon the performance of the third parties who serve as Swap counterparties,
and as a result the District is exposed to credit risk, or the risk that a Swap counterparty fails to perform
according to its contractual obligations. The appropriate measurement of this risk at the reporting date
is the fair value of the Swaps, as shown in the columns labeled Fair Value in the table above. To mitigate
credit risk, the District maintains strict credit standards for Swap counterparties.
The current Swap counterparty has ratings in double-A category or better. To further mitigate
counterparty credit risk, the District’s Swap documents require counterparties to post collateral for the
District’s benefit if they are downgraded below Aa3 by Moody’s and below AA- by Standard & Poor’s, if
the swap values exceed specified thresholds. Collateral is to be in the form of U.S. Treasuries or agency
securities held by a third party custodian. Currently, the Swaps have not been in an asset position
requiring the posting of collateral and are currently not exposed to credit risk. There is no master netting
arrangement on the outstanding Swaps.
Interest Rate Risk. The Swaps are intended to protect the District against changes in floating interest
rates. If floating rates rise, the District’s payment on the variable rate bonds should increase but should
be offset by the variable rate payments it receives under the Swaps.
Basis Risk. The District’s Swaps expose the District to basis risk should the relationship between the
floating rates the District will receive on the swaps (70% of LIBOR) fall short of the variable rate on the
associated bonds, and the expected savings may not be realized. As of June 30, 2016, the variable rate
was 0.41% on both the 2002A and 2002B Certificates, while the LIBOR rate was 0.46% on the
2002A Certificates and 0.45% on the 2002B Certificates. The District received 0.33% (70%) on the
2002A Certificates, and 0.32% (70%) on the 2002B Certificates. As of June 30, 2016, the
2008C Certificates variable rate was 0.31%, while the LIBOR rate was 0.44%, and the District received
0.31% (70%).
Termination Risk. The District’s Swap agreements do not contain any out-of-the-ordinary termination
events that would expose it to significant termination risk. In keeping with market standards, the District
or the counterparty may terminate each Swap if the other party fails to perform under the terms of the
contract. In addition, the swap documents allow either party to terminate in the event of a significant loss
of creditworthiness. If at the time an early termination of the Swap was declared and the Swap had a

Report No. 2017-194 Page 72 March 2017
negative value, the District would be liable to the counterparty for a payment equal to the fair value of
such Swap. The District views such events to be remote in the case of the current counterparty which is
rated Aa3/AA-. On March 8, 2012, the District replaced the Merrill Lynch Capital Markets (MLCS) Swap
associated with the 2008C Certificates due to an Additional Termination Event, which occurred when
MLCS guarantor, Merrill Lynch & Co. was downgraded by Moody’s to below A3. The District’s Swap
agreements provide the optional right of the District to replace the Swap with a new creditworthy
counterparty when an Additional Termination Event occurs.
DEBT SERVICE
The amount available for debt service consists of resources from the debt service funds legally required
to be used for debt service until the related debt is extinguished (in thousands).
Fund Categories Balance
Restricted for Payment of State Board of Education and Capital Outlay Bonds 398$ Restricted for Payment of District Bond Funds 19,731 Restricted for Certificates of Participation 14,521 ARRA Economic Stimulus Debt Service 9,459
Total Available in Debt Service Funds 44,109$
All certificates of participation lease payments and all other amounts required to be paid by the School
Board under the various series under the Master Lease and all other leases are made from legally
available funds appropriated for such purpose by the School Board. The substantive portion for these
payments is provided by the Local Optional Millage Levy on ad valorem property. Separate lease
payment accounts are established for each series of Certificates issued under the Trust Agreement.
Lease payments are due under the Master Lease on an all-or-none basis and are payable on a parity
basis solely from legally available funds appropriated by the School Board for such purpose. Such
payments are normally transferred to the Trustee 15 days before lease payments are due.
ESTIMATED LIABILITY ON INSURANCE RISKS AND PENDING CLAIMS
The District is exposed to various risks of loss related to torts; theft of, damage to, and destruction of
assets; administrative errors and omissions; injuries to employees, students and guests; as well as
natural disasters. The District is self-insured for portions of its general and automobile liability insurance,
workers’ compensation, and health insurance. Losses involving automobile and general liability claims
are limited (generally) by provisions of Section 768.28, Florida Statutes. Claims brought against the
District are handled by a contracted third-party administrator. The District purchases commercial
insurance for other risks including property and other miscellaneous risks as follows:

Report No. 2017-194 March 2017 Page 73
Type
Risk Retention/ Deductible
Coverage After Retention/Deductible
Workers’ Compensation
$1,500,000 Statutory/$3,000,000
General, Fleet Liability, and Errors and Omissions
$200,000/$300,000 $500,000 per occurrence, $3,250,000 annual aggregate
Property
$100,000,000 per occurrence for hurricanes; $1,000,000 per incident for all other perils
$300,000,000 per occurrence/annual aggregate for all perils including windstorms, earthquakes, and floods
$100,000 for each act of terrorism
$50,000,000 annual aggregate
Zero deductible Storm Parametric Index Wind Speed Property Insurance
$10,000,000 limit per occurrence, $20,000,000 aggregate
Accordingly, liabilities for certain retained risks are reported when it is probable that a loss has occurred
and the amount of the loss can be reasonably estimated. The District’s estimated liability for self-insured
losses relating to the casualty program consisting of general liability, automobile liability, professional
liability/errors and omissions, and workers’ compensation claims was determined by an independent
actuarial valuation performed as of June 30, 2016. Liabilities, as determined by the actuary, include an
amount for claims that have been incurred but not reported (IBNR). Claims liabilities are calculated
considering the effects of inflation, recent claim settlement trends including frequency and amount of
pay-outs and other economic and social factors. The portion of the liability that is due and payable at
June 30, 2016, is recorded in the General Fund, and the remaining portion is recorded in the
government-wide financial statements. Liabilities for incurred losses to be settled by fixed or reasonably
determinable payments over a long period of time are reported at their present value using an expected
future investment yield of 2.5%.
The School Board authorized the purchase of individual stop loss coverage for its self-insured health
program effective January 1, 2016, from Cigna, with an attachment point of $1,000,000 per claimant.
The School Board approved a set of premium equivalent rates, based upon actuarial projections of claims
including IBNR claims for the calendar year, provided by the School Board’s employee benefits consulting
firms of AON Hewitt and Cigna. The calendar year 2016 monthly rates for the three offered Open Access
Programs (OAP) are $692 (OAP 10), $656 (OAP 20) and $655 (Local Plus). The Board’s contribution
for employee only coverage is limited to the $655 (Local Plus); therefore, employees who choose the
OAP 10 or OAP 20 are subject to a monthly cost share based upon their salary band. Effective
January 1, 2010, the cost of dependent healthcare coverage became banded by salary tiers which was
renewed for January 1, 2016.
The School Board continues to offer an opt out provision for employees who can provide proof of
insurance coverage. Employees who opt out receive a monthly adjustment to gross compensation of
$100/month.
The District’s estimated liability for health insurance claim payments was determined by an independent
actuarial valuation performed as of June 30, 2016.

Report No. 2017-194 Page 74 March 2017
There were no losses which exceeded coverage in fiscal years ended June 30, 2014, 2015, and 2016.
A total estimated liability amount of $183 million was actuarially determined to cover reported and
unreported claims payable at June 30, 2016. It is estimated that of the current portion, $65.9 million is
due within 1 year. The remaining $117.1 million will be due in future years.
Current Long-TermPortion Portion Total
Workers' Compensation 28,909$ 103,400$ 132,309$ General and Occupational Liability 4,759 11,425 16,184 Fleet Liability 1,209 2,278 3,487 Group Health 31,046 - 31,046
Total 65,923$ 117,103$ 183,026$
Estimated Liability For Pending Claims (in thousands)
Changes in the balance of claims liabilities for the years ended June 30, 2015, and 2016, are as follows
(in thousands):
Current YearClaims and
Balance Changes in Claim BalanceJuly 1, 2014 Estimates Payments June 30, 2015
Workers' Compensation 127,199$ 41,782$ (34,312)$ 134,669$ General and Occupational Liability 14,741 2,552 (2,413) 14,880 Fleet Liability 4,413 1,050 (2,146) 3,317 Group Health 32,807 302,973 (309,899) 25,881
Total 179,160$ 348,357$ (348,770)$ 178,747$
Current YearClaims and
Balance Changes in Claim BalanceJuly 1, 2015 Estimates Payments June 30, 2016
Workers' Compensation 134,669$ 27,983$ (30,343)$ 132,309$ General and Occupational Liability 14,880 3,613 (2,309) 16,184 Fleet Liability 3,317 1,134 (964) 3,487 Group Health 25,881 335,951 (330,786) 31,046
Total 178,747$ 368,681$ (364,402)$ 183,026$

Report No. 2017-194 March 2017 Page 75
CHANGES IN LONG-TERM LIABILITIES
Long-term liability balances and activity for the year ended June 30, 2016, are as follows (in thousands):
Balance
July 1, 2015
Additions
Deductions
Balance
June 30, 2016
Amounts Due Within One Year
Bonds Payable $ 365,012 $ 201,429 * $ (47,183) $ 519,258 ** $ 23,497 Certificates of Participation
Payable, net
2,819,537
957,203 ***
(935,265)
2,841,475
****
117,273
Derivative Instrument Liabilities
26,576
3,836
-
30,412
-
Capital Leases Payable 106,390 135 (35,740) 70,785 18,264
Self-Insurance Estimated Claims Payable
178,747
368,681
(364,402)
183,026
65,923
Retirement Incentive Benefits
1,522
7
-
1,529
184
Compensated Absences 275,489 28,628 (24,404) 279,713 12,543
Other Postemployment Benefits
26,441
8,443
-
34,884
-
Net Pension Liability 839,207 725,548 (415,159) 1,149,596 -
Interlocal Construction Contract Agreement
2,000
-
(2,000)
-
-
Total $ 4,640,921 $ 2,293,910 $ (1,824,153) $ 5,110,678 $ 237,684
*
Includes premium on refunding of debt of $8,709.
** Includes unamortized premium in the amount of $22,984.
*** Includes premium on refunding of debt of $90,203.
**** Amount is $184,562 more than the principal balance of $2,656,913 in Note 11, the difference represents the net unamortized premium on outstanding debt issues.
Payments for insurance claims (other than health insurance claims that are paid from the internal service
fund), retirement incentive benefits, compensated absences, and other postemployment benefits are paid
from the General Fund. Capital leases are primarily paid from the capital projects funds.

Report No. 2017-194 Page 76 March 2017
STATE REVENUE SOURCES
A major source of the District’s revenue is received from the State of Florida, which provided 33% of total
revenues in the 2015-16 fiscal year. The following is a schedule of State revenue sources and amounts
(in thousands):
Sources Amount
Florida Education Finance Program 630,034$ Categorical Educational Programs 427,007 Workforce Development 79,272 Charter School Capital Outlay Funding 12,663 Capital Outlay and Debt Service (CO&DS) Withheld for SBE/COBI Bonds 10,640 Public Education Capital Outlay (PECO) 6,166 CO&DS Distributed 4,066 Food Service Supplement 2,087 Full Service Schools 751 Workforce Education Performance Incentive 236 CO&DS Withheld for Administrative Expense 225 State License Tax 205 Interest on Undistributed CO&DS 45 SBE/COBI Bond Interest 2 Miscellaneous 7,029
Total 1,180,428$
PROPERTY TAXES
The Board is authorized by State law to levy property taxes for District school operations, capital
improvements, and debt service. Property taxes consist of ad valorem taxes on real and personal
property within the District. Property taxes are assessed by the Miami-Dade County Property Appraiser
and are collected by the Miami-Dade County Tax Collector.
Property values are assessed as of January 1 of each year. Taxes are levied after the millage rate is
certified in September of each year. Tax bills are mailed in October and taxes are payable between
November 1 of the year assessed and March 31 of the following year at discounts of up to 4% for early
payment.
Taxes become delinquent on April 1 of the year following the year levied for. State law provides for
enforcement of collection of real property taxes. First, interest-bearing tax certificates are sold at public
auction to recover delinquent taxes. Finally, if the tax certificates are not paid with accrued interest by
the property owner, the purchaser of the tax certificate is entitled to take possession of the property.
Accordingly, substantially all of the taxes assessed for calendar year 2015 have been recognized for the
fiscal year ended June 30, 2016.
The State Constitution limits the levying of non-voted taxes by the School Board to 10 mills ($10 per
thousand of assessed valuation). State law prescribes on an annual basis the upper limit of non-voted
property tax millage that may be levied. For the 2015-16 fiscal year, 7.413 mills were levied. The total

Report No. 2017-194 March 2017 Page 77
adjusted assessed value for the calendar year 2015, of which the 2015-16 fiscal year levy was based,
was approximately $262.1 billion.
State law prescribes that the District budgets 96% of the current year’s tax levy. However, actual property
taxes collected and reflected in the table below totaled 94% of taxes levied, including collections from
prior years’ tax levies but excluding tax redemptions. The Miami-Dade County Tax Collector is not
required by law to make an accounting to the District of the difference between taxes levied and taxes
collected.
The following is a summary of millages and taxes levied on the 2015 tax roll for the 2015-16 fiscal year
(dollar amounts in thousands):
Millages Levied Collected Uncollected (Net)GENERAL FUNDNonvoted School Tax: Required Local Effort 5.165 1,353,888$ 1,272,128$ 81,760$ Discretionary Local Effort 0.687 180,082 169,207 10,875
5.852 1,533,970$ 1,441,335$ 92,635$
CAPITAL PROJECT FUNDSNonvoted Tax: Local Capital Improvements 1.561 409,181$ 384,374$ 24,807$
DEBT SERVICE FUNDSVoted Tax: Debt Service - General Obligation Bonds 0.199 52,163$ 49,001$ 3,162$
Taxes
Taxes reported in the governmental funds, as reflected above, include an accrual only for taxes collected
within 60 days after the fiscal year-end. In the government-wide financial statements, the District bases
the estimates of taxes receivable and uncollectible taxes on historical experience. For the 2015-16 fiscal
year, the District considered $40.3 million or 2.1% of levied taxes as uncollectible.
RETIREMENT BENEFITS
The School Board provides retirement benefits to its employees through the Florida Retirement System
(FRS and HIS), the Supplemental Early Retirement Plan (SERP), and a Deferred Retirement Option
Program (DROP), as well as State-approved other postemployment benefits (OPEB) in the form of
subsidized health insurance premiums.
Florida Retirement System
The School Board participates in the Florida Retirement System (FRS). The FRS was created in Chapter
121, Florida Statutes, to provide a defined benefit pension plan for participating public employees. The
FRS was amended in 1998 to add DROP under the defined benefit plan and amended in 2000 to provide
a defined contribution plan alternative to the defined benefit plan for FRS members effective July 1, 2002.
This integrated defined contribution pension plan is the FRS Investment Plan. Chapter 112, Florida
Statutes, established the Retiree Health Insurance Subsidy (HIS) Program, a cost-sharing

Report No. 2017-194 Page 78 March 2017
multiple-employer defined benefit pension plan, to assist retired members of any State-administered
retirement system in paying the costs of health insurance.
Essentially all regular employees of the District are eligible to enroll as members of the State-administered
FRS. Provisions relating to the FRS are established by Chapters 121 and 122, Florida Statutes; Chapter
112, Part IV, Florida Statutes; Chapter 238, Florida Statutes; and FRS Rules, Chapter 60S, Florida
Administrative Code; wherein eligibility, contributions, and benefits are defined and described in detail.
Such provisions may be amended at any time by further action from the Florida Legislature. The FRS is
a single retirement system administered by the Florida Department of Management Services, Division of
Retirement, and consists of the two cost-sharing, multiple-employer defined benefit plans and other
nonintegrated programs. A comprehensive annual financial report of the FRS, which includes its financial
statements, required supplementary information, actuarial report, and other relevant information, is
available from the Florida Department of Management Services’ Web site (www.dms.myflorida.com).
The District’s pension expense for FRS and HIS totaled $72.8 million for the fiscal year ended
June 30, 2016.
At June 30, 2016, the District reported a payable of $24 million for the outstanding amount of employer
and employee contributions to the FRS and HIS Plans required for the fiscal year ended June 30, 2016.
FRS Pension Plan
Plan Description. The FRS Pension Plan (Plan) is a cost-sharing multiple-employer defined benefit
pension plan, with DROP for eligible employees. The general classes of membership are as follows:
Regular Class – Members of the FRS who do not qualify for membership in the other classes.
Elected County Officers Class – Members who hold specified elective offices in local government.
Senior Management Service Class – Members in senior management level positions.
Special Risk Class – Members who are employed as law enforcement officers and meet the
criteria to qualify for this class.
Employees enrolled in the Plan prior to July 1, 2011, vest at 6 years of creditable service, and employees
enrolled in the Plan on or after July 1, 2011, vest at 8 years of creditable service. All vested members,
enrolled prior to July 1, 2011, are eligible for normal retirement benefits at age 62 or at any age after
30 years of service (except for members classified as special risk who are eligible for normal retirement
benefits at age 55 or at any age after 25 years of service). All members enrolled in the Plan on or after
July 1, 2011, once vested, are eligible for normal retirement benefits at age 65 or any time after 33 years
of creditable service (except for members classified as special risk who are eligible for normal retirement
benefits at age 60 or at any age after 30 years of service). Members of the Plan may include up to
4 years of credit for military service toward creditable service.
The Plan also includes an early retirement provision; however, there is a benefit reduction for each year
a member retires before his or her normal retirement date. The Plan provides retirement, disability, death
benefits, and annual cost-of-living adjustments to eligible participants.
DROP, subject to provisions of Section 121.091, Florida Statutes, permits employees eligible for normal
retirement under the Plan to defer receipt of monthly benefit payments while continuing employment with

Report No. 2017-194 March 2017 Page 79
an FRS employer. An employee may participate in DROP for a period not to exceed 60 months after
electing to participate, except that certain instructional personnel may participate for up to 96 months.
During the period of DROP participation, deferred monthly benefits are held in the FRS Trust Fund and
accrue interest. The net pension liability does not include amounts for DROP participants, as these
members are considered retired and are not accruing additional pension benefits.
Benefits Provided. Benefits under the Plan are computed on the basis of age and/or years of service,
average final compensation, and service credit. Credit for each year of service is expressed as a
percentage of the average final compensation. For members initially enrolled before July 1, 2011, the
average final compensation is the average of the 5 highest fiscal years’ earnings; for members initially
enrolled on or after July 1, 2011, the average final compensation is the average of the 8 highest fiscal
years’ earnings. The total percentage value of the benefit received is determined by calculating the total
value of all service, which is based on the retirement class to which the member belonged when the
service credit was earned. Members are eligible for in-line-of-duty or regular disability and survivors’
benefits. The following chart shows the percentage value for each year of service credit earned:
Class, Initial Enrollment, and Retirement Age/Years of Service % Value
Regular Class members initially enrolled before July 1, 2011 Retirement up to age 62 or up to 30 years of service 1.60 Retirement at age 63 or with 31 years of service 1.63 Retirement at age 64 or with 32 years of service 1.65 Retirement at age 65 or with 33 or more years of service 1.68
Regular Class members initially enrolled on or after July 1, 2011 Retirement up to age 65 or up to 33 years of service 1.60 Retirement at age 66 or with 34 years of service 1.63 Retirement at age 67 or with 35 years of service 1.65 Retirement at age 68 or with 36 or more years of service 1.68
Elected County Officers Class 3.00
Senior Management Service Class 2.00
Special Risk Regular Class Service from December 1, 1970 through September 30, 1974 2.00 Service on and after October 1, 1974 3.00
As provided in Section 121.101, Florida Statutes, if the member is initially enrolled in the FRS before
July 1, 2011, and all service credit was accrued before July 1, 2011, the annual cost-of-living adjustment
is 3% per year. If the member is initially enrolled before July 1, 2011, and has service credit on or after
July 1, 2011, there is an individually calculated cost-of-living adjustment. The annual cost-of-living
adjustment is a proportion of 3% determined by dividing the sum of the pre-July 2011 service credit by
the total service credit at retirement multiplied by 3%. Plan members initially enrolled on or after
July 1, 2011, will not have a cost-of-living adjustment after retirement.
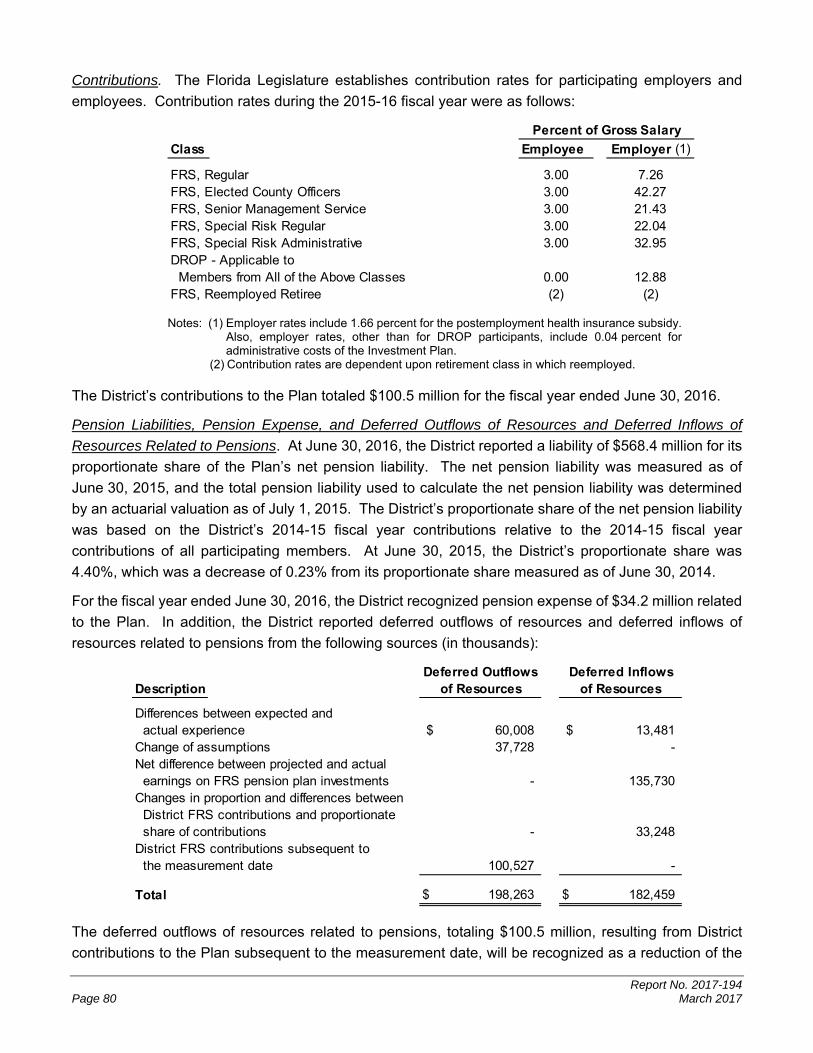
Report No. 2017-194 Page 80 March 2017
Contributions. The Florida Legislature establishes contribution rates for participating employers and
employees. Contribution rates during the 2015-16 fiscal year were as follows:
Class Employee Employer (1)
FRS, Regular 3.00 7.26FRS, Elected County Officers 3.00 42.27FRS, Senior Management Service 3.00 21.43FRS, Special Risk Regular 3.00 22.04FRS, Special Risk Administrative 3.00 32.95DROP - Applicable to Members from All of the Above Classes 0.00 12.88FRS, Reemployed Retiree (2) (2)
Percent of Gross Salary
Notes: (1) Employer rates include 1.66 percent for the postemployment health insurance subsidy.
Also, employer rates, other than for DROP participants, include 0.04 percent for administrative costs of the Investment Plan.
(2) Contribution rates are dependent upon retirement class in which reemployed.
The District’s contributions to the Plan totaled $100.5 million for the fiscal year ended June 30, 2016.
Pension Liabilities, Pension Expense, and Deferred Outflows of Resources and Deferred Inflows of
Resources Related to Pensions. At June 30, 2016, the District reported a liability of $568.4 million for its
proportionate share of the Plan’s net pension liability. The net pension liability was measured as of
June 30, 2015, and the total pension liability used to calculate the net pension liability was determined
by an actuarial valuation as of July 1, 2015. The District’s proportionate share of the net pension liability
was based on the District’s 2014-15 fiscal year contributions relative to the 2014-15 fiscal year
contributions of all participating members. At June 30, 2015, the District’s proportionate share was
4.40%, which was a decrease of 0.23% from its proportionate share measured as of June 30, 2014.
For the fiscal year ended June 30, 2016, the District recognized pension expense of $34.2 million related
to the Plan. In addition, the District reported deferred outflows of resources and deferred inflows of
resources related to pensions from the following sources (in thousands):
Description
Differences between expected and actual experience $ 60,008 $ 13,481 Change of assumptions 37,728 - Net difference between projected and actual earnings on FRS pension plan investments - 135,730 Changes in proportion and differences between District FRS contributions and proportionate share of contributions - 33,248 District FRS contributions subsequent to the measurement date 100,527 -
Total $ 198,263 $ 182,459
Deferred Outflowsof Resources
Deferred Inflowsof Resources
The deferred outflows of resources related to pensions, totaling $100.5 million, resulting from District
contributions to the Plan subsequent to the measurement date, will be recognized as a reduction of the

Report No. 2017-194 March 2017 Page 81
net pension liability in the fiscal year ended June 30, 2017. Other amounts reported as deferred outflows
of resources and deferred inflows of resources related to pensions will be recognized in pension expense
as follows (in thousands):
Outflows/(Inflows), Net
2017 $ (51,358.3) 2018 (51,358.3) 2019 (51,358.3) 2020 60,622.9 2021 7,061.7 Thereafter 1,667.5
Total $ (84,722.8)
Deferred
Fiscal Year Ending June 30
Actuarial Assumptions. The total pension liability in the July 1, 2015, actuarial valuation was determined
using the following actuarial assumptions, applied to all periods included in the measurement:
Inflation 2.60 percentSalary increases 3.25 percent, average, including inflationInvestment rate of return 7.65 percent, net of pension plan investment expense,
including inflation
Mortality rates were based on the Generational RP-2000 with Projection Scale BB with adjustments for
mortality improvements based on Scale AA.
The actuarial assumptions used in the July 1, 2015, valuation were based on the results of an actuarial
experience study for the period July 1, 2008, through June 30, 2013.
The long-term expected rate of return on pension plan investments is not based on historical returns, but
instead is based on a forward-looking capital market economic model. The allocation policy’s description
of each asset class was used to map the target allocation to the asset classes shown below. Each asset
class assumption is based on a consistent set of underlying assumptions, and includes an adjustment
for the inflation assumption. The target allocation and best estimates of arithmetic and geometric real
rates of return for each major asset class are summarized in the following table:

Report No. 2017-194 Page 82 March 2017
CompoundAnnual Annual
Target Arithmetic (Geometric) StandardAsset Class Allocation (1) Return Return Deviation
Cash 1% 3.2% 3.1% 1.7%Fixed Income 18% 4.8% 4.7% 4.7%Global Equity 53% 8.5% 7.2% 17.7%Real Estate (Property) 10% 6.8% 6.2% 12.0%Private Equity 6% 11.9% 8.2% 30.0%Strategic Investments 12% 6.7% 6.1% 11.4%
Total 100%
Assumed Inflation - Mean 2.6% 1.9%
Note: (1) As outlined in the Plan’s investment policy.
Discount Rate. The discount rate used to measure the total pension liability was 7.65%. The Plan’s
fiduciary net position was projected to be available to make all projected future benefit payments of
current active and inactive employees. Therefore, the discount rate for calculating the total pension
liability is equal to the long-term expected rate of return.
Sensitivity of the District’s Proportionate Share of the Net Pension Liability to Changes in the Discount
Rate. The following presents the District’s proportionate share of the net pension liability calculated using
the discount rate of 7.65%, as well as what the District’s proportionate share of the net pension liability
would be if it were calculated using a discount rate that is 1 percentage point lower (6.65%) or
1 percentage point higher (8.65%) than the current rate (in thousands):
1% Current 1%Decrease Discount Rate Increase
(6.65%) (7.65%) (8.65%)
District's proportionate share of the net pension liability (asset) 1,472,909$ 568,422$ (184,260)$
Pension Plan Fiduciary Net Position. Detailed information about the Plan’s fiduciary net position is
available in the separately issued FRS Pension Plan and Other State Administered Systems
Comprehensive Annual Financial Report.
HIS Pension Plan
Plan Description. The HIS Pension Plan (HIS Plan) is a cost-sharing multiple-employer defined benefit
pension plan established under Section 112.363, Florida Statutes, and may be amended by the Florida
Legislature at any time. The benefit is a monthly payment to assist retirees of State-administered
retirement systems in paying their health insurance costs and is administered by the Florida Department
of Management Services, Division of Retirement.
Benefits Provided. For the fiscal year ended June 30, 2016, eligible retirees and beneficiaries received
a monthly HIS payment of $5 for each year of creditable service completed at the time of retirement, with
a minimum HIS payment of $30 and a maximum HIS payment of $150 per month, pursuant to

Report No. 2017-194 March 2017 Page 83
Section 112.363, Florida Statutes. To be eligible to receive a HIS Plan benefit, a retiree under a
State-administered retirement system must provide proof of health insurance coverage, which may
include Federal Medicare.
Contributions. The HIS Plan is funded by required contributions from FRS participating employers as set
by the Florida Legislature. Employer contributions are a percentage of gross compensation for all active
FRS members. For the fiscal year ended June 30, 2016, the contribution rate was 1.66% of payroll
pursuant to Section 112.363, Florida Statutes. The District contributed 100% of its statutorily required
contributions for the current and preceding 3 years. HIS Plan contributions are deposited in a separate
trust fund from which payments are authorized. HIS Plan benefits are not guaranteed and are subject to
annual legislative appropriation. In the event the legislative appropriation or available funds fail to provide
full subsidy benefits to all participants, benefits may be reduced or canceled.
The District’s contributions to the HIS Plan totaled $28.2 million for the fiscal year ended June 30, 2016.
Pension Liabilities, Pension Expense, and Deferred Outflows of Resources and Deferred Inflows of
Resources Related to Pensions. At June 30, 2015, the District reported a net pension liability of
$568.7 million for its proportionate share of the HIS Plan’s net pension liability. The net pension liability
was measured as of June 30, 2015, and the total pension liability used to calculate the net pension liability
was determined by an actuarial valuation as of July 1, 2015. The District’s proportionate share of the net
pension liability was based on the District’s 2014-15 fiscal year contributions relative to the total
2014-15 fiscal year contributions of all participating members. At June 30, 2015, the District’s
proportionate share was 5.58%, which was a decrease of 0.25% from its proportionate share measured
as of June 30, 2014.
For the fiscal year ended June 30, 2016, the District recognized the HIS Plan pension expense of
$38.6 million related to the HIS Plan. In addition, the District reported deferred outflows of resources and
deferred inflows of resources related to pensions from the following sources (in thousands):
Deferred Outflows Deferred InflowsDescription of Resources of Resources
Change of assumptions 44,740$ -$ Net difference between projected and actual earnings on HIS pension plan investments 308 - Changes in proportion and differences between District HIS contributions and proportionate share of HIS contributions - 22,928 District contributions subsequent to the measurement date 28,170 -
Total 73,218$ 22,928$
The deferred outflows of resources related to pensions, totaling $28.2 million, resulting from District
contributions to the HIS Plan subsequent to the measurement date, will be recognized as a reduction of
the net pension liability in the fiscal year ending June 30, 2017. Other amounts reported as deferred
outflows of resources and deferred inflows of resources related to pensions will be recognized in pension
expense as follows (in thousands):

Report No. 2017-194 Page 84 March 2017
Fiscal Year Ending June 30
2017 $ 3,992.70 2018 3,992.70 2019 3,992.70 2020 3,930.20 2021 3,900.10 Thereafter 2,312.20
Total $ 22,120.60
(Inflows), Net
DeferredOutflows/
Actuarial Assumptions. The total pension liability in the July 1, 2015, actuarial valuation was determined
using the following actuarial assumptions, applied to all periods included in the measurement:
Inflation 2.60 percentSalary increases 3.25 percent, average, including inflationMunicipal bond rate 3.80 percent
Mortality rates were based on the Generational RP-2000 with Projected Scale BB.
While an experience study had not been completed for the HIS Plan, the actuarial assumptions that
determined the total pension liability for the HIS Plan were based on certain results of the most recent
experience study for the FRS Plan.
Discount Rate. The discount rate used to measure the total pension liability was 3.8%. In general, the
discount rate for calculating the total pension liability is equal to the single rate equivalent to discounting
at the long-term expected rate of return for benefit payments prior to the projected depletion date.
Because the HIS benefit is essentially funded on a pay-as-you-go basis, the depletion date is considered
to be immediate, and the single equivalent discount rate is equal to the municipal bond rate selected by
the HIS Plan sponsor. The Bond Buyer General Obligation 20-Bond Municipal Bond Index was adopted
as the applicable municipal bond index.
Sensitivity of the District’s Proportionate Share of the Net Pension Liability to Changes in the Discount
Rate. The following presents the District’s proportionate share of the net pension liability calculated using
the discount rate of 3.8%, as well as what the District’s proportionate share of the net pension liability
would be if it were calculated using a discount rate that is 1 percentage point lower (2.8%) or
1 percentage point higher (4.8%) than the current rate (in thousands):
1% Current 1%Decrease Discount Rate Increase
(2.8%) (3.8%) (4.8%)
District's proportionate share of the net pension liability 647,985$ 568,680$ 502,552$
Pension Plan Fiduciary Net Position. Detailed information about the HIS Plan’s fiduciary net position is
available in the separately issued FRS Pension Plan and Other State Administered Systems
Comprehensive Annual Financial Report.

Report No. 2017-194 March 2017 Page 85
FRS – Defined Contribution Pension Plan
The District contributes to the FRS Investment Plan (Investment Plan) a defined contribution pension
plan, for its eligible employees electing to participate in the Investment Plan. The Investment Plan is
administered by the State Board of Administration (SBA), and is reported in the SBA’s annual financial
statements and in the State of Florida Comprehensive Annual Financial Report.
As provided in Section 121.4501, Florida Statutes, eligible FRS members may elect to participate in the
Investment Plan in lieu of the FRS defined benefit plan. District employees participating in DROP are
not eligible to participate in the Investment Plan. Employer and employee contributions, including
amounts contributed to individual member’s accounts, are defined by law, but the ultimate benefit
depends in part on the performance of investment funds. Services retirement benefits are based upon
the value of the member’s account upon retirement. Benefit terms, including contribution requirements,
for the Investment Plan are established and may be amended by the Florida Legislature. The Investment
Plan is funded with the same employer and employee contribution rates that are based on salary and
membership class (Regular Class, Elected County Officers, etc.), as the FRS defined benefit plan.
Contributions are directed to individual member accounts, and the individual members allocate
contributions and account balances among various approved investment choices. Costs of administering
the Investment Plan, including the FRS Financial Guidance Program, are funded through an employer
contribution of 0.04% of payroll and by forfeited benefits of plan members. Allocations to the Investment
Plan members’ accounts during the 2015-16 fiscal year were as follows:
Percent ofGross
Class Compensation
FRS, Regular 6.30FRS, Elected County Officers 11.34FRS, Senior Management Service 7.67FRS, Special Risk Regular 14.00
For all membership classes, employees are immediately vested in their own contributions and are vested
after 1 year of service for employer contributions and investment earnings, regardless of membership
class. If an accumulated benefit obligation for service credit originally earned under the FRS Pension
Plan is transferred to the Investment Plan, the member must have the years of service required for FRS
Pension Plan vesting (including the service credit represented by the transferred funds) to be vested for
these funds and the earnings on the funds. Nonvested employer contributions are placed in a suspense
account for up to 5 years. If the employee returns to FRS-covered employment within the 5-year period,
the employee will regain control over their account. If the employee does not return within the 5-year
period, the employee will forfeit the accumulated account balance. For the fiscal year ended
June 30, 2016, the information for the amount of forfeitures was unavailable from the SBA; however,
management believes that these amounts, if any, would be immaterial to the District.
After termination and applying to receive benefits, the member may rollover vested funds to another
qualified plan, structure a periodic payment under the Investment Plan, receive a lump-sum distribution,
leave the funds invested for future distribution, or any combination of these options. Disability coverage
is provided; the member may either transfer the account balance to the FRS Pension Plan when approved

Report No. 2017-194 Page 86 March 2017
for disability retirement to receive guaranteed lifetime monthly benefits under the FRS Pension Plan, or
remain in the Investment Plan and rely upon that account balance for retirement income.
The District’s Investment Plan pension expense totaled $12.5 million for the fiscal year ended
June 30, 2016.
Supplemental Early Retirement Plan
Plan Description. In addition to participating in the FRS Plan, the School Board established an early
retirement plan on July 1, 1984. The plan is a single employer, non-contributory defined benefit plan
administered by an independent trustee, and investments are managed by the District through a third
party asset manager.
Benefits Provided. The Plan was established in order to supplement an early retiree’s benefits by the
amount of reduction imposed by the FRS. The Plan provides supplemental income for those employees
who retired between the ages of 55 and 61 and who had completed at least 25 years, but not more than
28 years of creditable service. Payments under the Plan are equal to the difference in monthly retirement
income for the participant under the FRS between the retirement benefit based on average final
compensation, as defined above, and creditable service as of the member’s early retirement date and
the early retirement benefit under the FRS. Benefits are subject to an annual 3% cost of living adjustment.
These benefit provisions and all other requirements are established by Section 1012.685, Florida
Statutes.
At June 30, 2016, the total number of retirees and beneficiaries of deceased retirees currently receiving
benefits is 521, averaging $652 per month. The School Board closed the Supplemental Early Retirement
Plan (the “Plan”) to new employees on July 1, 2000, with no additional employees vesting after
July 1, 2003.
The Plan is included as a Pension Trust Fund in the accompanying financial statements. Separate
stand-alone statements are not issued for the Plan.
Contributions. The School Board provides for actuarially determined periodic contributions sufficient to
pay the benefits provided by this Plan when they become due. Plan members do not contribute to the
Plan. Total contributions to the Plan for the 2015-16 fiscal year of $2,276 (in thousands) were made in
accordance with actuarially determined requirements computed through an actuarial valuation performed
as of July 1, 2015.
Net Pension Liability. The District’s net pension liability was measured as of July 1, 2015, and the total
pension liability used to calculate the net pension liability was determined by an actuarial valuation as of
that date.
The following table represents the components of the net pension liability of the District at
June 30, 2016 (in thousands):
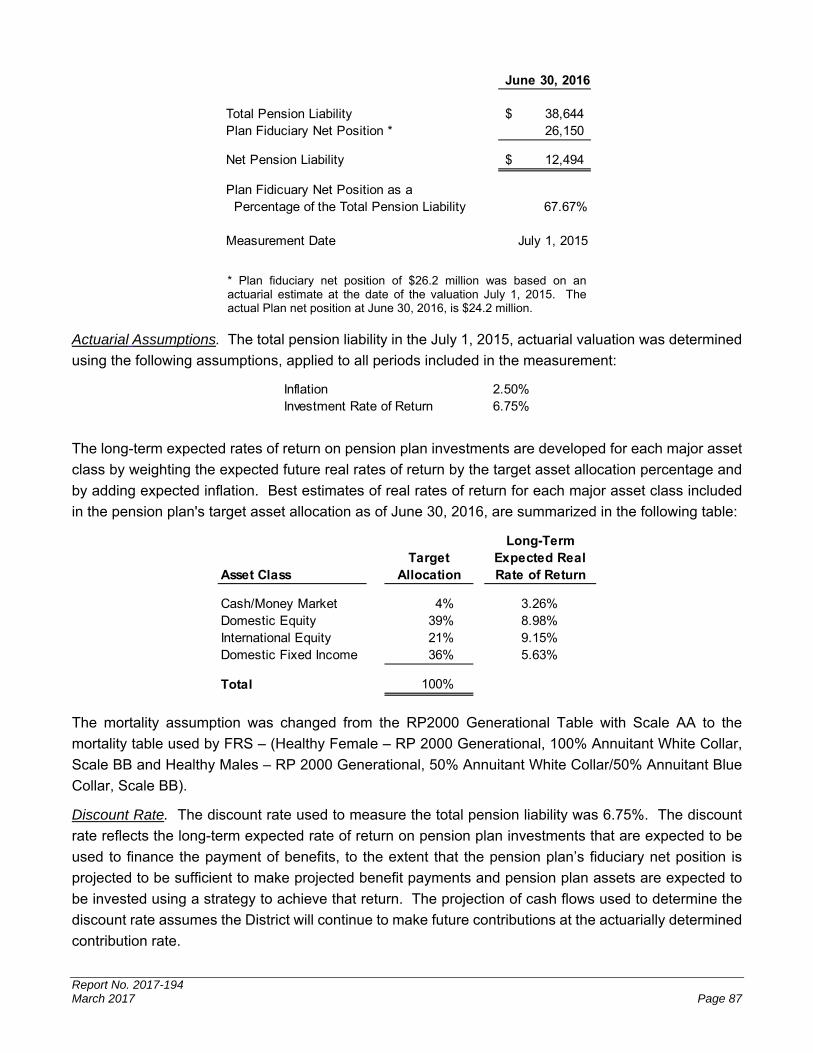
Report No. 2017-194 March 2017 Page 87
June 30, 2016
Total Pension Liability 38,644$ Plan Fiduciary Net Position * 26,150
Net Pension Liability 12,494$
Plan Fidicuary Net Position as a Percentage of the Total Pension Liability 67.67%
Measurement Date July 1, 2015
* Plan fiduciary net position of $26.2 million was based on an actuarial estimate at the date of the valuation July 1, 2015. The actual Plan net position at June 30, 2016, is $24.2 million.
Actuarial Assumptions. The total pension liability in the July 1, 2015, actuarial valuation was determined
using the following assumptions, applied to all periods included in the measurement:
Inflation 2.50%Investment Rate of Return 6.75%
The long-term expected rates of return on pension plan investments are developed for each major asset
class by weighting the expected future real rates of return by the target asset allocation percentage and
by adding expected inflation. Best estimates of real rates of return for each major asset class included
in the pension plan's target asset allocation as of June 30, 2016, are summarized in the following table:
Asset Class
Cash/Money Market 4% 3.26%Domestic Equity 39% 8.98%International Equity 21% 9.15%Domestic Fixed Income 36% 5.63%
Total 100%
TargetAllocation
Long-TermExpected RealRate of Return
The mortality assumption was changed from the RP2000 Generational Table with Scale AA to the
mortality table used by FRS – (Healthy Female – RP 2000 Generational, 100% Annuitant White Collar,
Scale BB and Healthy Males – RP 2000 Generational, 50% Annuitant White Collar/50% Annuitant Blue
Collar, Scale BB).
Discount Rate. The discount rate used to measure the total pension liability was 6.75%. The discount
rate reflects the long-term expected rate of return on pension plan investments that are expected to be
used to finance the payment of benefits, to the extent that the pension plan’s fiduciary net position is
projected to be sufficient to make projected benefit payments and pension plan assets are expected to
be invested using a strategy to achieve that return. The projection of cash flows used to determine the
discount rate assumes the District will continue to make future contributions at the actuarially determined
contribution rate.

Report No. 2017-194 Page 88 March 2017
Changes in Net Pension Liability
Total Pension Plan Fiduciary Net PensionLiability Net Position Liability
(a) (b) (a) - (b)
Balances at June 30, 2015 38,593$ 27,195$ 11,398$
Changes for the year:Interest 2,467 - 2,467 Differences between expected
and actual experience (969) - (969) Change of Assumption 2,651 - 2,651 Contributions - employer - 2,276 (2,276) Net investment income - 864 (864) Benefit payments, including refunds of employee contributions (4,098) (4,098) - Administrative expense - (87) 87
Net Changes 51 (1,045) 1,096
Balances at June 30, 2016 38,644$ 26,150$ 12,494$
Increase (Decrease)
(amounts expressed in thousands)
Sensitivity. The following table illustrates the impact of interest rate sensitivity on the net pension liability
for fiscal year ended June 30, 2016 (in thousands):
1% Decrease Current Rate 1% Increase(5.75%) (6.75%) (7.75%)
Net Pension Liability 15,348$ 12,494$ 10,214$
Pension Expense and Deferred Outflows of Resources and Deferred Inflows of Resources Related to
Pensions. For the year ended June 30, 2016, the District recognized pension expense of $2,071 (in
thousands). In addition, the District reported deferred outflows of resources and deferred inflows of
resources related to pensions from the following sources:
Deferred Outflows/Inflows. The following table illustrates the deferred inflows and outflows under GASB
Statement No. 68 as of June 30, 2016 (in thousands):
Deferred Outflows Deferred InflowsDescription of Resources of Resources
Net difference between projected and actual earnings on Pension Plan investments 726$ 1,727$ District contributions subsequent to the measurement date 1,891 -
Total 2,617$ 1,727$
Amounts reported as deferred outflows of resources and deferred inflows of resources related to
pensions will be recognized in pension expense as follows:

Report No. 2017-194 March 2017 Page 89
AmountFiscal Year Ended June 30 (in thousands)
2017 (394.4)$ 2018 (394.4) 2019 (394.4) 2020 181.4
Total (1,001.8)$
Other Postemployment Benefits
As authorized by the Board, employees who retire in the first year of their eligibility under the FRS Plan
can receive up to $1,200 per year as reimbursement for health insurance cost paid until they reach
65 years of age or until they become eligible for Medicare or Social Security disability. In October 2016,
approximately 236 retirees will receive an estimated $184 thousand in premium reimbursements for the
year ended June 30, 2016.
From 1991 through 2005, the District offered retirement incentive programs in an effort to reduce salary
costs. The programs include enhanced insurance benefits up to the Board’s annual monthly contribution
and payments of accrued sick leave at an enhanced rate. Enhanced insurance benefits offered to eligible
employees, as defined under the provisions of each program, consist of health and term life insurance
subsidies for up to 10 years. Expenditures for the retirement incentive program are recognized in the
General Fund each year on a pay-as-you-go basis. The estimated liability for retirees receiving benefits
of approximately $1.5 million is fully accrued and included in the government-wide financial statements.
The District implemented GASB Statement No. 45, Accounting and Financial Reporting by Employers for
Postemployment Benefits Other than Pensions, for certain postemployment healthcare benefits provided
by the District for the fiscal year ended June 30, 2008.
Plan Description. Effective January 1, 2010, the District changed from a fully-insured health program
to a self-insured program for eligible employees and retirees. The Plan operates as a single employer
defined benefit plan. Employees who participate in and satisfy the vesting, disability, early or normal
retirement provision of FRS may be eligible for Other Postemployment Benefits (OPEB). Retirees and
their dependents are permitted to remain covered under the District’s respective medical plans as long
as they pay the premium charged for the plan and coverage elected. This conforms to the minimum
required of Florida governmental employers per Section 112.08, Florida Statutes.
The State of Florida prohibits the District from separately rating retirees and active employees. The
District therefore charges both groups an equal, blended rate premium. Although both groups are
charged the same blended rate premium, accounting standards require the actuarial amounts presented
above to be calculated using age adjusted premiums approximating claims costs for retirees separate
from active employees. The use of age adjusted premiums results in the addition of an implicit rate
subsidy into the actuarial accrued liability.
Funding Policy. The District is not required by law or contractual agreement to provide funding for OPEB
other than the pay-as-you-go amount necessary to provide current benefits to retirees and eligible
dependents. Currently, the District’s OPEB benefits are unfunded. That is, there is not a separate trust

Report No. 2017-194 Page 90 March 2017
fund or equivalent arrangement into which the District would make contributions to advance-fund the
obligation, as it does for its pension plan, FRS. Therefore, the ultimate subsidies which are provided over
time are directly financed by general assets of the District, which are invested in short-term fixed income
instruments.
Consequently, in accordance with GASB Statement No. 45, the interest discount rate used to calculate
the present value and costs of the OPEB must be the long-range expected return on such short-term
fixed income instruments. The District selected an interest discount rate of 4.5% for this purpose. In
addition to the interest discount rate, the other significant actuarial assumption used is the healthcare
cost trend rate and participation assumptions. The valuation used a healthcare trend rate of 7.75%
grading down by 0.5% annually to an ultimate rate of 4.50%, and the inflation rate used is 2.5%. The
participation assumption of 30% is the assumed percentage of future retirees that participate and enroll
in the health plan. The unfunded actuarial accrued liability is being amortized over the period of 30 years
on an open basis. It is calculated assuming a level percentage of projected payroll.
Annual OPEB and Net OPEB Obligation. The District’s annual OPEB cost (expense) is calculated
based on the annual required contribution (ARC) of the employer, an amount that was actuarially
determined by using the entry age actuarial cost method (one of the actual cost methods in accordance
with GASB Statement No. 45), with an amortization of the Unfunded Actuarial Accrued Liability as a level
percent of projected payroll.
The following table shows the District’s OPEB cost for the fiscal year ended June 30, 2016 (in thousands):
Annual Required Contribution (ARC) 16,997$ Interest on Net OPEB Obligation 1,190 Adjustment to ARC (1,010)
Annual OPEB Cost (Expense) 17,177 Employer Contributions (8,734)
Increase in Net OPEB Obligation 8,443 Net OPEB Oblication at Beginning of Year 26,441
Net OPEB Obligation at End of Year 34,884$
Actuarial Methods and Assumptions. Calculations of benefits for financial reporting purposes are
based on the substantive plan (the plan as understood by the employer and plan members) and include
the types of benefits provided at the time of each valuation and the historical pattern of sharing of benefit
costs between the employer and plan members to that point. The actuarial methods and assumptions
used are designed to reduce short-term volatility in actuarial accrued liabilities and the actuarial value of
assets, consistent with the long-term perspective of the calculations.
The District’s annual OPEB cost, the percentage of annual OPEB cost contributed to the plan, and the
net OPEB obligations for June 30, 2016, were as follows (in thousands):

Report No. 2017-194 March 2017 Page 91
Fiscal Annual Amount Net OPEBYear OPEB Cost Contributed Obligation2013 10,391$ 14,145$ 136.1% 14,099 2014 15,385 9,508 61.8% 19,976 2015 15,951 9,486 59.5% 26,441 2016 17,177 8,734 50.8% 34,884
Percentage ofAnnual OPEB
Cost Contributed
Funded status and funding progress as of June 30, 2016, are as follows (in thousands):
Actuarial Accrued Liability (AAL) (a) 207,362$ Actuarial Value of Plan Assets (b) -
Unfunded Actuarial Accrued Liability (UAAL) (c) 207,362$ Funded Ratio (b/a) 0%Covered Payroll (Active Members) 1,719,598$ UAAL as a Percentage of Covered Payroll (c/d) 12.1%
The schedule of funding progress is presented as Required Supplementary Information (RSI) following
the notes to the financial statements and presents multi-year trend information about whether the actual
value of plan assets is increasing or decreasing over time relative to the accrued actuarial liability for
benefits over time.
COMMITMENTS AND CONTINGENCIES
Commitments
As part of its capital outlay program, the District has entered into various construction commitments
totaling approximately $144.3 million as of June 30, 2016 (See Note 4).
The District leases certain facilities and equipment under various cancelable, operating lease
agreements with lease terms not extending beyond 1 year. The total lease rent expense for the fiscal
year ended June 30, 2016, under these leases was approximately $7.1 million.
Contingencies
Florida Education Finance Program and Federal, State and Local Grants
The School Board receives funding from the State of Florida under the Florida Education Finance
Program (FEFP), which is based in part on a computation of the number of full-time equivalent (FTE)
students attending different instructional programs. The accuracy of FTE student data submitted by
individual schools and used in the FEFP computations is subject to audit by the State and, if found to
be in error, could result in refunds to the State or in decreases to future funding allocations.
Additionally, the School Board participates in a number of Federal, State, and local grants which are
subject to financial and compliance audits. It is the opinion of management that the amount of
revenue, if any, which may be remitted back to the State due to errors in the FTE student data or the
amount of grant expenditures which may be disallowed by grantor agencies would not be material to
the financial position of the District.

Report No. 2017-194 Page 92 March 2017
Litigation
The School Board is a defendant in numerous lawsuits as of June 30, 2016. In the opinion of
management, the District’s estimated aggregate liability, with respect to probable losses, has been
provided for in the estimated claim liability accrual in the accompanying financial statements, after
giving consideration to the District’s related insurance coverage, as well as the Florida statutory
limitations of governmental liability on uninsured risks. It is the opinion of management and District’s
legal counsel that the amount of losses resulting, if any, from the above-mentioned litigation in excess
of the amount accrued as of June 30, 2016, would not be material to the financial position of the
District.
FUND BALANCES
In accordance with GASB Statement No. 54, Fund Balance Reporting and Governmental Fund Type
Definitions, the District reports its fund balance in the following categories:
Nonspendable – The District has $19.3 million in prepaid items and $8.6 million in inventories that
are considered nonspendable.
Restricted – The District reported restricted fund balances totaling $350.4 million comprised of
$8.7 million of State required carryover programs, $26.5 million in food service, $0.3 million in
miscellaneous special revenue, $44.1 million in debt services, and $270.8 million in capital projects.
Committed – The District did not have any committed fund balances at June 30, 2016.
Assigned – The District has assigned fund balances totaling $39.3 million comprised of $15.2 million
for rebudgets and obligations, $23.4 million for outstanding encumbrances for goods and services,
and $0.7 million for capital projects.
Unassigned – The portion of fund balance that is the residual classification for the General Fund.
This balance represents balance amounts that have not been restricted, committed, or assigned for
specific purposes. The unassigned fund balance for the General Fund is $120.4 million.
Committed amounts would be reduced first, followed by assigned amounts, and then unassigned
amounts when expenditures are incurred for purposes for which amounts in any of those unrestricted
fund balance classifications could be used.
Board Policy 6220.01 delineates fund balance reserve policies to target 5.5% of the combined assigned
and unassigned fund balance, as a percentage of total General Fund revenues at fiscal year-end. At
June 30, 2016, the combined assigned and unassigned General Fund fund balance totaled $158.9 million
or 6.95% of General Fund revenues net of charter schools’ revenues.
Below is a table of fund balance categories and classifications for the fiscal year ended June 30, 2016,
for the Districts’ governmental funds (in thousands):

Report No. 2017-194 March 2017 Page 93
General OtherObligation Capital Governmental
General School Improvement FundsFund Bonds Funds LOML Nonmajor* Total
FUND BALANCESNonspendable: Inventory 6,650$ -$ -$ 1,921$ 8,571$ Prepaid Amounts 1,063 - 18,244 - 19,307
Restricted: State Required Carryover 8,644 - - - 8,644 Special Revenue: Food Service - - - 26,582 26,582 Miscellaneous - - - 266 266 Debt Service - - - 44,109 44,109 Capital Projects - 161,932 46,055 62,832 270,819
Assigned: Rebudgets and Obligations 15,172 - - - 15,172 Encumbrances 23,394 - - - 23,394 Capital Projects - - - 697 697
Unassigned 120,377 - - - 120,377
Total Fund Balance 175,300$ 161,932$ 64,299$ 136,407$ 537,938$
*Aggregates all of the District’s nonmajor fund balances.
SUBSEQUENT EVENTS
Tax Anticipation Notes
On July 28, 2016, the District issued $290 million in Tax Anticipation Notes (“the Notes”) with an effective
yield of 0.445%. The Notes were issued to pay operating expenditures incurred prior to the receipt of the
ad valorem taxes levied and collected for operating purposes for the fiscal year commencing July 1, 2016.
The Notes matured on February 23, 2017.
General Obligation Bond
On August 18, 2016, the District issued $200 million of Series 2016 Government Obligation Bonds at a
premium, which will provide approximately $241.5 million of project funding, with a true interest cost of
3.41%. This is the fourth issuance in the $1.2 billion series approved by County voter residents on
November 6, 2012.
Equipment Lease
On September 7, 2016, the District authorized the execution of additional schedules to the Master Lease
Purchase Agreement with Banc of America Public Capital Corp. for a total of $78.9 million to be issued
in several tranches as needed to purchase digital devices and related equipment as part of the 21st
Century Schools Technology Upgrade and Digital Convergence Initiative. The first tranche totaling
$27.9 million was issued as Schedule of Property No. 13 on September 29, 2016, at a true interest cost

Report No. 2017-194 Page 94 March 2017
of 1.30% for a period of approximately 5 years. Additional tranches will be issued as needed in
subsequent fiscal years.
Certificates of Participation
On January 10, 2017, the District successfully remarketed $50.7 million par value of Certificates of
Participation Series 2008C, replacing the previous floating rate mode certificates for the same amount
that were scheduled to expire on May 15, 2017. This remarketing will result in interest rate savings of
approximately $493,000 over the five-year term.

Report No. 2017-194 March 2017 Page 95
THIS PAGE INTENTIONALLY LEFT BLANK

Report No. 2017-194 Page 96 March 2017
OTHER REQUIRED SUPPLEMENTARY INFORMATION
Miami-Dade County District School Board Schedule of Revenues, Expenditures, and Changes in Fund Balance – Budget and Actual
General Fund For the Fiscal Year Ended June 30, 2016
(amounts expressed in thousands)
Revenues
Local:Ad Valorem Taxes $ 1,472,611 $ 1,441,335 $ 1,441,335 $ - Interest Income 1,093 1,995 1,995 - Net Increase (Decrease) in Fair Value of Investments - (4) (4) - Local Grants and Others 54,874 69,747 69,747 - Total Local Revenues 1,528,578 1,513,073 1,513,073 -
State Sources:Florida Education Finance Program 677,806 630,034 630,034 - State Grants and Other 510,792 514,178 514,178 - Total State Sources 1,188,598 1,144,212 1,144,212 -
Federal Sources:Federal Direct 2,015 1,795 1,795 - Federal Through State and Local 16,729 16,007 16,007 - Total Federal Sources 18,744 17,802 17,802 -
Total Revenues 2,735,920 2,675,087 2,675,087 -
Expenditures
Current:Instructional Services 1,982,833 1,880,737 1,875,186 5,551 Instructional Support Services: Pupil Personnel Services 96,638 108,023 108,000 23 Instructional Media Services 28,706 17,862 17,704 158 Instruction and Curriculum Development Service 24,590 25,169 24,394 775 Instructional Staff Training Services 1,680 3,610 3,587 23 Instruction-Related Technology 33,102 32,200 32,115 85 Total Instructional Support Services 184,716 186,864 185,800 1,064
Student Transportation Services 68,365 73,057 72,443 614
Operation and Maintenance of Plant: Operation of Plant 269,074 272,046 264,936 7,110 Maintenance of Plant 91,294 92,409 89,917 2,492 Total Operation and Maintenance of Plant 360,368 364,455 354,853 9,602
School Adminstration 179,200 160,705 160,374 331
General Administration: Central Services 58,221 52,667 51,470 1,197 Board of Education 7,598 7,862 7,677 185 General Administration 4,837 5,654 5,645 9 Administrative Technology Services 2,301 3,196 3,125 71 Fiscal Services 12,401 10,372 9,891 481 Total General Administration 85,358 79,751 77,808 1,943
OriginallyAdopted Budget
Final
Basis
Budget asAmended Amended
With FinalVariance
ActualGAAP
Budget
(Continued)

Report No. 2017-194 March 2017 Page 97
Expenditures: (Continued)
Community Services $ 28,950 $ 28,862 $ 28,768 $ 94
Capital Outlay 1,751 11,693 7,498 4,195
Debt Services: Principal Retirement 515 515 515 - Interest and Fiscal Charges - 479 479 -
Total Debt Services 515 994 994 -
Total Expenditures 2,892,056 2,787,118 2,763,724 23,394
Excess (deficiency of Revenues Over (Under) Expenditures (156,136) (112,031) (88,637) (23,394)
Other Financing Sources (Uses): Transfers In 154,800 154,330 154,330 - Transfers Out (15,180) (15,177) (15,177) - Proceeds from Sale of Capital Assets - 95 95 - Proceeds From Loans/Leases - 135 135 -
Total Other Financing Sources (Uses) 139,620 139,383 139,383 -
Net Change in Fund Balances $ (16,516) $ 27,352 50,746 $ 23,394
Fund Balances, Beginning 124,554
Fund Balances, Ending $ 175,300
BudgetAmendedWith FinalVariance
ActualGAAPOriginally
Adopted Budget
Final
Basis
Budget asAmended

Report No. 2017-194 Page 98 March 2017
Schedule of the District’s Proportionate Share of the Net Pension Liability –
Florida Retirement System Pension Plan (amounts expressed in thousands)
2013 2014 2015District's proportion of the FRS net pension liability 4.656% 4.633% 4.400%
District's proportionate share of the FRS net pension liability 801,597$ 282,715$ 568,422$
District's covered-employee payroll 1,743,078$ 1,765,382$ 1,717,736$
District's proportionate share of the FRS net pension liability as a percentage of its covered-employee payroll 45.99% 16.01% 33.09%
FRS Plan fiduciary net position as a percentage of the total pension liability 88.54% 96.09% 92.00%
Note: The amounts presented for each fiscal year were determined as of June 30. GASB Statement No. 68 requires the schedule to show information for 10 years. Additional years will be displayed as they become available.
Schedule of District Contributions – Florida Retirement System Pension Plan
(amounts expressed in thousands)
2014 2015 2016Contractually required FRS contribution $ 101,495 $ 107,295 $ 100,527
FRS contributions in relation to the contractually required contribution (101,495) (107,295) (100,527)
FRS contribution deficiency (excess) -$ -$ -$
District's covered-employee payroll 1,765,382$ 1,717,736$ 1,719,598$
FRS contributions as a percentage of covered-employee payroll 5.75% 6.25% 5.85%
Note: The amounts presented for each fiscal year were determined as of June 30. GASB Statement No. 68 requires the schedule to show information for 10 years. Additional years will be displayed as they become available.

Report No. 2017-194 March 2017 Page 99
Schedule of the District’s Proportionate Share of the Net Pension Liability –
Health Insurance Subsidy Pension Plan (amounts expressed in thousands)
2013 2014 2015District's proportion of the HIS net pension liability 5.881% 5.830% 5.576%
District's proportionate share of the HIS net pension liability 512,051$ 545,094$ 568,680$
District's covered-employee payroll 1,743,078$ 1,765,382$ 1,717,736$
District's proportionate share of the HIS net pension liability as a percentage of its covered-employee payroll 29.38% 30.88% 33.11%
HIS Plan fiduciary net position as a percentage of the total pension liability 1.78% 0.99% 0.50%
Note: The amounts presented for each fiscal year were determined as of June 30. GASB Statement No. 68 requires the schedule to show information for 10 years. Additional years will be displayed as they become available. The municipal bond rate used to determine total pension liability decreased from 4.29% to 3.8%.
Schedule of District Contributions – Health Insurance Subsidy Pension Plan
(amounts expressed in thousands)
2014 2015 2016Contractually required HIS contribution $ 19,971 $ 21,316 $ 28,170
HIS contributions in relation to the contractually required contribution (19,971) (21,316) (28,170)
HIS contribution deficiency (excess) -$ -$ -$
District's covered-employee payroll 1,765,382$ 1,717,736$ 1,719,598$
HIS contributions as a percentage of covered-employee payroll 1.13% 1.24% 1.64%
Note: The amounts presented for each fiscal year were determined as of June 30. GASB Statement No. 68 requires the schedule to show information for 10 years. Additional years will be displayed as they become available.
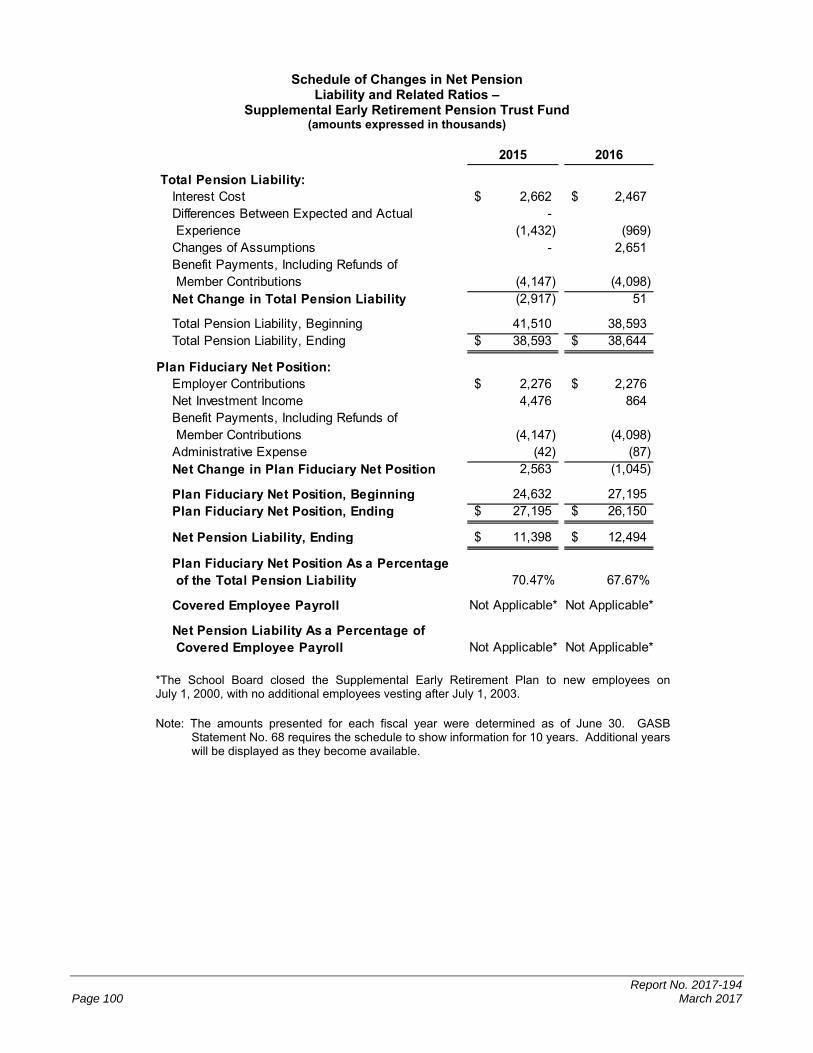
Report No. 2017-194 Page 100 March 2017
Schedule of Changes in Net Pension Liability and Related Ratios –
Supplemental Early Retirement Pension Trust Fund (amounts expressed in thousands)
2015 2016
Total Pension Liability:Interest Cost 2,662$ 2,467$ Differences Between Expected and Actual - Experience (1,432) (969) Changes of Assumptions - 2,651 Benefit Payments, Including Refunds of Member Contributions (4,147) (4,098) Net Change in Total Pension Liability (2,917) 51
Total Pension Liability, Beginning 41,510 38,593 Total Pension Liability, Ending 38,593$ 38,644$
Plan Fiduciary Net Position:Employer Contributions 2,276$ 2,276$ Net Investment Income 4,476 864 Benefit Payments, Including Refunds of Member Contributions (4,147) (4,098) Administrative Expense (42) (87) Net Change in Plan Fiduciary Net Position 2,563 (1,045)
Plan Fiduciary Net Position, Beginning 24,632 27,195 Plan Fiduciary Net Position, Ending 27,195$ 26,150$
Net Pension Liability, Ending 11,398$ 12,494$
Plan Fiduciary Net Position As a Percentage of the Total Pension Liability 70.47% 67.67%
Covered Employee Payroll Not Applicable* Not Applicable*
Net Pension Liability As a Percentage of Covered Employee Payroll Not Applicable* Not Applicable*
*The School Board closed the Supplemental Early Retirement Plan to new employees on July 1, 2000, with no additional employees vesting after July 1, 2003.
Note: The amounts presented for each fiscal year were determined as of June 30. GASB Statement No. 68 requires the schedule to show information for 10 years. Additional years will be displayed as they become available.

Report No. 2017-194 March 2017 Page 101
Schedule of Investment Returns – Supplemental Early Retirement Pension Trust Fund
2006 2007 2008 2009 2010 2011 2012 2013 2014 2015
Annual Money-Weighted Rate of Return, Net of Investment Expense 7.53% 14.85% (6.16)% (15.06)% 8.60% 14.10% 2.39% 13.37% 18.53% 3.29%
The annual money-weighted rate of return, net of investment expense information for 2016 was not available.
Schedule of Contributions –
Supplemental Early Retirement Pension Trust Fund (amounts expressed in thousands)
Notes to Schedule:
Valuation Date: July 1, 2015
Methods and Assumptions Used to Determine Contribution Rates:
Actuarial Cost Method Entry Age Normal Asset Valuation Method Fair Value Cost of Living Increase 3% Investment Rate of Return 6.75%, Net of Pension Plan Investment Expense, Including Inflation Retirement Age None Mortality rates were based on the mortality rates used by the FRS – (Healthy Female – RP 2000 Generational, 100% Annuitant White Collar, Scale BB and Healthy Males – RP 2000 Generational, 50% Annuitant White Collar/50% Annuitant Blue Collar, Scale BB).
*The School Board closed the Supplemental Early Retirement Plan to new employees on July 1, 2000, with no additional employees vesting after July 1, 2003.
GASB Statement No. 68 requires the schedule to show information for 10 years. Additional years will be displayed as they become available.
2013 2014 2015
Actuarially Determined Contribution 1,942$ 2,276$ 2,276$ Contributions in Relation to the Actuarially Determined Contribution (1,942) (2,276) (2,276) Contributions Deficiency (Excess) -$ -$ -$
Covered-Employee Payroll Not Applicable* Not Applicable* Not Applicable*
Contributions as a Percentage of Covered- Employee Payroll Not Applicable* Not Applicable* Not Applicable*

Report No. 2017-194 Page 102 March 2017
Schedule of Funding Progress – Other Postemployment Benefits (amounts expressed in thousands)
Actuarial Actuarial Actuarial Annual UAAL asValuation Accrued Value of Unfunded Percentage Covered Percentage
Date Liability (AAL) Plan Assets AAL (UAAL) Funded Payroll of Payroll
10/1/2006 322,766$ -$ 322,766$ 0.00% 1,619,403$ 19.93%6/30/2009 322,766 - 322,766 0.00% 1,734,316 18.61%6/30/2010 89,069 - 89,069 0.00% 1,822,042 4.89%6/30/2011 86,600 - 86,600 0.00% 1,823,966 4.75%6/30/2012 153,759 - 153,759 0.00% 1,715,231 8.96%6/30/2013 152,835 - 152,835 0.00% 1,709,167 8.94%6/30/2014 193,240 - 193,240 0.00% 1,521,809 12.70%6/30/2015 200,340 - 200,340 0.00% 1,717,736 11.66%6/30/2016 207,362 - 207,362 0.00% 1,719,598 12.10%
Schedule of Employer Contributions – Other Postemployment Benefits (amounts expressed in thousands)
Annual Required PercentageFiscal Contribution Amount of Net OPEBYear (ARC) Contributed Contribution Obligation
2011 5,934$ 10,313$ 173.8% 19,171$ 2012 10,127 11,576 114.31% 17,853 2013 10,270 14,145 137.73% 14,099 2014 15,289 9,508 62.2% 19,976 2015 15,815 9,486 60% 26,441 2016 16,997 8,734 51.4% 34,884

Report No. 2017-194 March 2017 Page 103
THIS PAGE INTENTIONALLY LEFT BLANK

Report No. 2017-194 Page 104 March 2017
SCHEDULE OF EXPENDITURES OF FEDERAL AWARDS
Miami-Dade County District School Board Schedule of Expenditures of Federal Awards
For the Fiscal Year Ended June 30, 2016
Catalog of Pass - AmountFederal Domestic Through Provided
Assistance Grantor Amount of toFederal Grantor/Pass-Through Grantor/Program Title Number Number Expenditures Subrecipients
United States Department of Agriculture:Indirect:
Child Nutrition Cluster:Florida Department of Agriculture and Consumer Services:
School Breakfast Program 10.553 15002, 16002 $ 25,926,162 $ - National School Lunch Program 10.555 15001, 15003, 16001, 16003 105,332,814 - Summer Food Service Program for Children 10.559 15006, 15007, 16006, 16007 2,016,296 -
Total Child Nutrition Cluster 133,275,272 -
Florida Department of Health:Child and Adult Care Food Program 10.558 I-1591, I-1592, I-790, A-4091 16,184,279 -
Florida Department of Agriculture and Consumer Services:Healthier US School Challenge: Smarter Lunchrooms 10.543 None 88,500 - Child Nutrition Discretionary Grants Limited Availability 10.579 15013 67,492 - Fresh Fruit and Vegetable Program 10.582 15004, 16004 809,652 -
Total United States Department of Agriculture 150,425,195 -
United States Department of Justice:Direct:
National Institute of Justice Research, Evaluation, and Development Project Grants 16.560 N/A 1,033,287 - Public Safety Partnership and Community Policing Grants 16.710 N/A 350,120 - Total Direct 1,383,407 -
Indirect:Close Up Foundation:
Juvenile Mentoring Program 16.726 None 76,192 - Florida Department of Law Enforcement:
Edward Byrne Memorial Justice Assistance Grant Program 16.738 2015-JAGC-DADE-17-R3-244 60,005 - Total Indirect 136,197 -
Total United States Department of Justice 1,519,604 -
United States Department of Transportation:Indirect:
Florida Department of Transportation Highway Safety:State and Community Highway Safety 20.600 436603-1-14-01 2,465 -
National Endowment of the Arts:Direct:
Promotion of the Arts - Grants to Organizations and Individuals 45.024 N/A 20,061 -
United States Department of Education:Direct:
Student Financial Assistance Cluster:Federal Supplemental Educational Opportunity Grants 84.007 N/A 157,886 - Federal Pell Grant Program 84.063 N/A 5,098,321 -
Total Student Financial Assistance Cluster 5,256,207 -
Impact Aid 84.041 N/A 26,021 - Magnet Schools Assistance 84.165 N/A 1,963,703 - Safe and Drug-Free Schools and Communities - National Programs 84.184 N/A 581,747 - Fund for the Improvement of Education 84.215 N/A 737,425 - Arts in Education 84.351 N/A 15,327 - School Leadership 84.363 N/A 315,414 - Teacher Incentive Fund 84.374 N/A 5,680,388 - School Improvement Grants 84.377 N/A 701,630 - ARRA - State Fiscal Stabilization Fund (SFSF) - Investing in
Innovation (i3) Fund, Recovery Act 84.396 N/A 15,481 - Race to the Top - District Grants 84.416 N/A 3,848,940 -
Total Direct 19,142,283 -
(continued)

Report No. 2017-194 March 2017 Page 105
Miami-Dade County District School Board Schedule of Expenditures of Federal Awards (continued)
For the Fiscal Year Ended June 30, 2016
Catalog of Pass - AmountFederal Domestic Through Provided
Assistance Grantor Amount of toFederal Grantor/Pass-Through Grantor/Program Title Number Number Expenditures Subrecipients
Indirect:Special Education Cluster:
Special Education - Grants to States: 84.027Florida Department of Education 262, 263 $ 71,036,060 $ 134,135 University of South Florida None 7,500 -
Total Special Education - Grants to States 84.027 71,043,560 134,135 Florida Department of Education:
Special Education - Preschool Grants 84.173 266, 267 1,365,478 -
Total Special Education Cluster 72,409,038 134,135
Education Research, Development and Dissemination: 84.305The Pennsylvania State University 5261-MDCPS-IES-0047 23,562 - University of Miami 663221 55,659 -
Total Education Research, Development and Dissemination 84.305 79,221 -
Florida Department of Education:Adult Education - Basic Grants to States 84.002 191, 193 4,761,635 - Title I Grants to Local Educational Agencies 84.010 212, 223, 226 128,791,032 7,636,825 Migrant Education - State Grant Program 84.011 217 1,131,524 - Career and Technical Education - Basic Grants to States 84.048 161 5,233,472 - Education for Homeless Children and Youth 84.196 127 128,200 - Charter Schools 84.282 298 1,127,230 1,102,538 Twenty-First Century Community Learning Centers 84.287 244 2,065,010 424,572 Special Education - State Personnel Development 84.323 ORSP-12041-26576-MD 42,133 - English Language Acquisition State Grants 84.365 102, 104 12,017,268 137,019 Improving Teacher Quality State Grants 84.367 224 11,474,256 - ARRA - State Fiscal Stabilization Fund (SFSF) -
Race-to-the-Top Incentive Grants, Recovery Act 84.395 RS511 585,360 -
Total Indirect 239,845,379 9,435,089
Total United States Department of Education 258,987,662 9,435,089
United States Department of Health and Human Services:Direct:
Affordable Care Act (ACA) Grants for School-BasedHealth Center Capital Expenditures 93.501 N/A 234,535 -
Cooperative Agreements to Support Comprehensive School Health Programs to Prevent the Spread of HIV and Other
Important Health Problems 93.938 N/A 342,040 - Youth @ Work - Talking Safety 93.Unknown N/A 9,442 -
Total Direct 586,017 -
Indirect:Florida Department of Health:
Environmental Public Health and Emergency Response 93.070 None 3,900 - Florida Department of Children and Families:
Refugee and Entrant Assistance - State Administered Programs 93.566 XK040 3,132,663 -
Miami Dade Board of County Commissioners:Head Start 93.600 None 14,702,814 -
Florida Developmental Disabilities Council, Incorporated:Developmental Disabilities Basic Support and
Advocacy Grants 93.630 945CD15 100,908 - University of South Florida:
Children's Health Insurance Program 93.767 6414-1078-00-D 552 -
Total Indirect 17,940,837 -
Total United States Department of Health and Human Services 18,526,854 -
(continued)
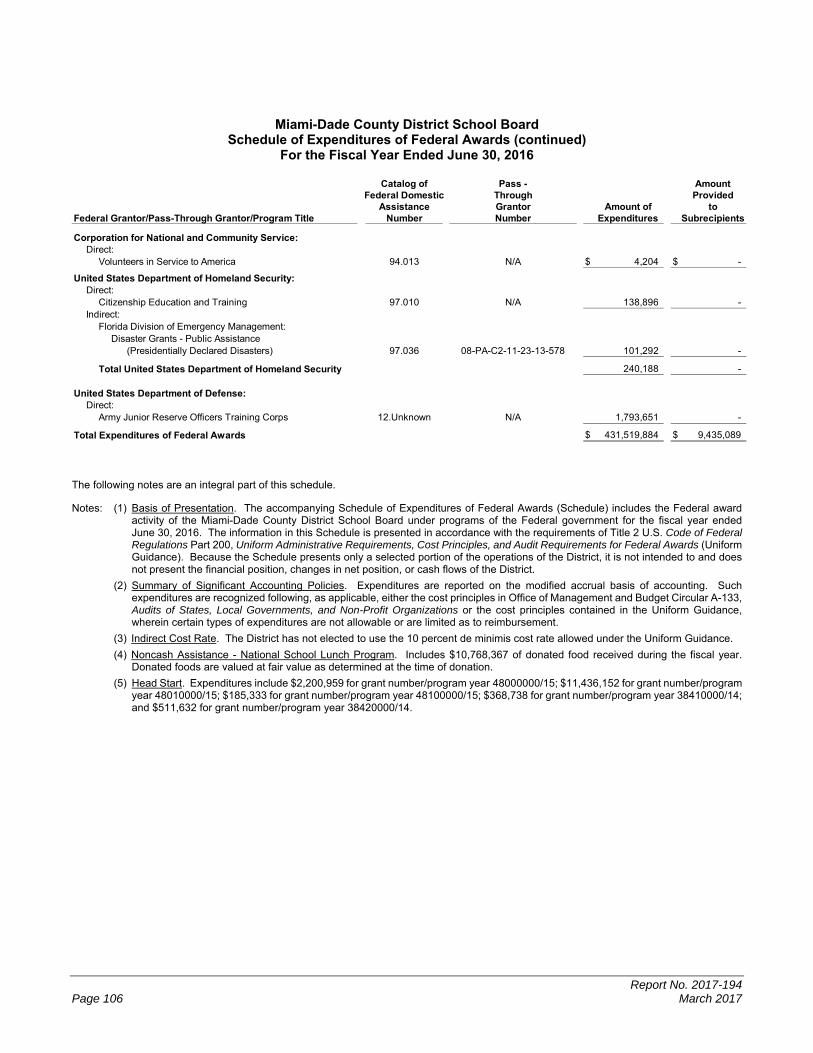
Report No. 2017-194 Page 106 March 2017
Miami-Dade County District School Board Schedule of Expenditures of Federal Awards (continued)
For the Fiscal Year Ended June 30, 2016
Catalog of Pass - AmountFederal Domestic Through Provided
Assistance Grantor Amount of toFederal Grantor/Pass-Through Grantor/Program Title Number Number Expenditures Subrecipients
Corporation for National and Community Service:Direct:
Volunteers in Service to America 94.013 N/A $ 4,204 $ -
United States Department of Homeland Security:Direct:
Citizenship Education and Training 97.010 N/A 138,896 - Indirect:
Florida Division of Emergency Management:Disaster Grants - Public Assistance
(Presidentially Declared Disasters) 97.036 08-PA-C2-11-23-13-578 101,292 -
Total United States Department of Homeland Security 240,188 -
United States Department of Defense:Direct:
Army Junior Reserve Officers Training Corps 12.Unknown N/A 1,793,651 -
Total Expenditures of Federal Awards $ 431,519,884 $ 9,435,089
The following notes are an integral part of this schedule.
Notes: (1) Basis of Presentation. The accompanying Schedule of Expenditures of Federal Awards (Schedule) includes the Federal award activity of the Miami-Dade County District School Board under programs of the Federal government for the fiscal year ended June 30, 2016. The information in this Schedule is presented in accordance with the requirements of Title 2 U.S. Code of Federal Regulations Part 200, Uniform Administrative Requirements, Cost Principles, and Audit Requirements for Federal Awards (Uniform Guidance). Because the Schedule presents only a selected portion of the operations of the District, it is not intended to and does not present the financial position, changes in net position, or cash flows of the District.
(2) Summary of Significant Accounting Policies. Expenditures are reported on the modified accrual basis of accounting. Such expenditures are recognized following, as applicable, either the cost principles in Office of Management and Budget Circular A-133, Audits of States, Local Governments, and Non-Profit Organizations or the cost principles contained in the Uniform Guidance, wherein certain types of expenditures are not allowable or are limited as to reimbursement.
(3) Indirect Cost Rate. The District has not elected to use the 10 percent de minimis cost rate allowed under the Uniform Guidance.
(4) Noncash Assistance - National School Lunch Program. Includes $10,768,367 of donated food received during the fiscal year. Donated foods are valued at fair value as determined at the time of donation.
(5) Head Start. Expenditures include $2,200,959 for grant number/program year 48000000/15; $11,436,152 for grant number/program year 48010000/15; $185,333 for grant number/program year 48100000/15; $368,738 for grant number/program year 38410000/14; and $511,632 for grant number/program year 38420000/14.

Report No. 2017-194 March 2017 Page 107
Phone: (850) 412-2722 Fax: (850) 488-6975
Sherrill F. Norman, CPA Auditor General
AUDITOR GENERAL STATE OF FLORIDA Claude Denson Pepper Building, Suite G74
111 West Madison Street Tallahassee, Florida 32399-1450
The President of the Senate, the Speaker of the House of Representatives, and the Legislative Auditing Committee
INDEPENDENT AUDITOR’S REPORT ON INTERNAL CONTROL OVER
FINANCIAL REPORTING AND ON COMPLIANCE AND OTHER MATTERS
BASED ON AN AUDIT OF FINANCIAL STATEMENTS PERFORMED
IN ACCORDANCE WITH GOVERNMENT AUDITING STANDARDS
We have audited, in accordance with auditing standards generally accepted in the United States of
America and the standards applicable to financial audits contained in Government Auditing Standards
issued by the Comptroller General of the United States, the financial statements of the governmental
activities, the aggregate discretely presented component units, each major fund, and the aggregate
remaining fund information of the Miami-Dade County District School Board, as of and for the fiscal year
ended June 30, 2016, and the related notes to the financial statements, which collectively comprise the
District’s basic financial statements, and have issued our report thereon dated March 27, 2017, included
under the heading INDEPENDENT AUDITOR’S REPORT. Our report includes a reference to other
auditors who audited the financial statements of the aggregate discretely presented component units, as
described in our report on the District’s financial statements. This report does not include the results of
the other auditors’ testing of internal control over financial reporting or compliance and other matters that
are reported on separately by those auditors.
Internal Control Over Financial Reporting
In planning and performing our audit of the financial statements, we considered the District’s internal
control over financial reporting (internal control) to determine audit procedures that are appropriate in the
circumstances for the purpose of expressing our opinions on the financial statements, but not for the
purpose of expressing an opinion on the effectiveness of the District’s internal control. Accordingly, we
do not express an opinion on the effectiveness of the District’s internal control.
A deficiency in internal control exists when the design or operation of a control does not allow
management or employees, in the normal course of performing their assigned functions, to prevent, or
detect and correct, misstatements on a timely basis. A material weakness is a deficiency, or a
combination of deficiencies, in internal control such that there is a reasonable possibility that a material

Report No. 2017-194 Page 108 March 2017
misstatement of the District’s financial statements will not be prevented, or detected and corrected on a
timely basis. A significant deficiency is a deficiency, or a combination of deficiencies, in internal control
that is less severe than a material weakness, yet important enough to merit attention by those charged
with governance.
Our consideration of internal control was for the limited purpose described in the first paragraph of this
section and was not designed to identify all deficiencies in internal control that might be material
weaknesses or significant deficiencies. Given these limitations, during our audit we did not identify any
deficiencies in internal control that we consider to be material weaknesses. However, material
weaknesses may exist that have not been identified.
Compliance and Other Matters
As part of obtaining reasonable assurance about whether the District’s financial statements are free from
material misstatement, we performed tests of its compliance with certain provisions of laws, rules,
regulations, contracts, and grant agreements, noncompliance with which could have a direct and material
effect on the determination of financial statement amounts. However, providing an opinion on compliance
with those provisions was not an objective of our audit and, accordingly, we do not express such an
opinion. The results of our tests disclosed no instances of noncompliance or other matters that are
required to be reported under Government Auditing Standards.
We noted a certain additional matter that is discussed in Finding 2016-001 in the accompanying
SCHEDULE OF FINDINGS AND QUESTIONED COSTS. The results of our operational audit of the
District will be presented in a separate report.
District’s Response to Finding
The District’s response to the finding identified in our audit is included as District Response in
Finding No. 2016-001 and in the CORRECTIVE ACTION PLAN. The District’s response was not
subjected to the auditing procedures applied in the audit of the financial statements and, accordingly, we
express no opinion on it.
Purpose of this Report
The purpose of this report is solely to describe the scope of our testing of internal control and compliance
and the results of that testing, and not to provide an opinion on the effectiveness of the District’s internal
control or on compliance. This report is an integral part of an audit performed in accordance with
Government Auditing Standards in considering the District’s internal control and compliance.
Accordingly, this communication is not suitable for any other purpose.
Respectfully submitted, Sherrill F. Norman, CPA Tallahassee, Florida March 27, 2017

Report No. 2017-194 March 2017 Page 109
Phone: (850) 412-2722 Fax: (850) 488-6975
Sherrill F. Norman, CPA Auditor General
AUDITOR GENERAL STATE OF FLORIDA Claude Denson Pepper Building, Suite G74
111 West Madison Street Tallahassee, Florida 32399-1450
The President of the Senate, the Speaker of the House of Representatives, and the Legislative Auditing Committee
INDEPENDENT AUDITOR’S REPORT ON COMPLIANCE FOR EACH MAJOR
FEDERAL PROGRAM AND REPORT ON INTERNAL CONTROL OVER COMPLIANCE
REQUIRED BY THE UNIFORM GUIDANCE
Report on Compliance for Each Major Federal Program
We have audited the Miami-Dade County District School Board’s compliance with the types of
compliance requirements described in the OMB Compliance Supplement that could have a direct and
material effect on each of the District’s major Federal programs for the fiscal year ended June 30, 2016.
The District’s major Federal programs are identified in the SUMMARY OF AUDITOR’S RESULTS
section of the accompanying SCHEDULE OF FINDINGS AND QUESTIONED COSTS.
The District’s basic financial statements include the operations of The Downtown Miami Charter
School, Inc.; Miami Community Charter School, Inc.; and The Charter School at Waterstone, Inc. (charter
schools) as part of the aggregate discretely presented component units on the accompanying basic
financial statements. Each of the charter schools expended in excess of $750,000 in Federal awards for
the fiscal year ended June 30, 2016. Our audit, described below, did not include the operations of the
charter schools because, pursuant to Section 218.39(1), Florida Statutes, the charter schools engaged
other auditors to perform the audits in accordance with Uniform Guidance.
Management’s Responsibility
Management is responsible for compliance with Federal statutes, regulations, and the terms and
conditions of its Federal awards applicable to its Federal programs.
Auditor’s Responsibility
Our responsibility is to express an opinion on compliance for each of the District’s major Federal programs
based on our audit of the types of compliance requirements referred to above. We conducted our audit
of compliance in accordance with auditing standards generally accepted in the United States of America;
the standards applicable to financial audits contained in Government Auditing Standards, issued by the
Comptroller General of the United States; and the audit requirements of Title 2 U.S. Code of Federal

Report No. 2017-194 Page 110 March 2017
Regulations Part 200, Uniform Administrative Requirements, Cost Principles, and Audit Requirements
for Federal Awards (Uniform Guidance). Those standards and the Uniform Guidance require that we
plan and perform the audit to obtain reasonable assurance about whether noncompliance with the types
of compliance requirements referred to above that could have a direct and material effect on a major
Federal program occurred. An audit includes examining, on a test basis, evidence about the District’s
compliance with those requirements and performing such other procedures as we considered necessary
in the circumstances.
We believe that our audit provides a reasonable basis for our opinion on compliance for each major
Federal program. However, our audit does not provide a legal determination of the District’s compliance.
Opinion on Each Major Federal Program
In our opinion, the District complied, in all material respects, with the types of compliance requirements
referred to above that could have a direct and material effect on each of its major Federal programs for
the fiscal year ended June 30, 2016.
Report on Internal Control Over Compliance
District management is responsible for establishing and maintaining effective internal control over
compliance with the types of compliance requirements referred to above. In planning and performing our
audit of compliance, we considered the District’s internal control over compliance with the types of
requirements that could have a direct and material effect on each major Federal program to determine
the auditing procedures that are appropriate in the circumstances for the purpose of expressing an
opinion on compliance for each major Federal program and to test and report on internal control over
compliance in accordance with the Uniform Guidance, but not for the purpose of expressing an opinion
on the effectiveness of internal control over compliance. Accordingly, we do not express an opinion on
the effectiveness of the District’s internal control over compliance.
A deficiency in internal control over compliance exists when the design or operation of a control over
compliance does not allow management or employees, in the normal course of performing their assigned
functions, to prevent, or detect and correct, noncompliance with a type of compliance requirement of a
Federal program on a timely basis. A material weakness in internal control over compliance is a
deficiency, or a combination of deficiencies, in internal control over compliance, such that there is a
reasonable possibility that material noncompliance with a type of compliance requirement of a Federal
program will not be prevented, or detected and corrected, on a timely basis. A significant deficiency in
internal control over compliance is a deficiency, or a combination of deficiencies, in internal control over
compliance with a type of compliance requirement of a Federal program that is less severe than a material
weakness in internal control over compliance, yet important enough to merit attention by those charged
with governance.
Our consideration of internal control over compliance was for the limited purpose described in the first
paragraph of this section and was not designed to identify all deficiencies in internal control over
compliance that might be material weaknesses or significant deficiencies. We did not identify any
deficiencies in internal control over compliance that we consider to be material weaknesses. However,
material weaknesses may exist that have not been identified.

Report No. 2017-194 March 2017 Page 111
The purpose of this report on internal control over compliance is solely to describe the scope of our testing
of internal control over compliance and the results of that testing based on the requirements of
the Uniform Guidance. Accordingly, this report is not suitable for any other purpose.
Respectfully submitted, Sherrill F. Norman, CPA Tallahassee, Florida March 27, 2017

Report No. 2017-194 Page 112 March 2017
SCHEDULE OF FINDINGS AND QUESTIONED COSTS
SUMMARY OF AUDITOR’S RESULTS
Financial Statements
Type of auditor’s report issued on whether the financial statements audited were prepared in accordance with GAAP: Unmodified
Internal control over financial reporting:
Material weakness(es) identified? No
Significant deficiency(ies) identified? None reported
Noncompliance material to financial statements noted? No Federal Awards
Internal control over major Federal programs:
Material weakness(es) identified? No
Significant deficiency(ies) identified? None reported
Type of auditor’s report issued on compliance for major Federal programs:
Unmodified
Any audit findings disclosed that are required to be reported in accordance with 2 CFR 200.516(a)? No
Identification of major programs:
CFDA Numbers: Name of Federal Program or Cluster: 84.010 Title I Grants to Local Educational Agencies 84.048 Career and Technical Education – Basic Grants to States 84.365 English Language Acquisition State Grants 84.374 Teacher Incentive Fund 84.416 Race-to-the-Top – District Grants 93.566 Refugee and Entrant Assistance – State Administered Program 93.600 Head Start
Dollar threshold used to distinguish between type A and type B programs: $3,000,000
Auditee qualified as low risk auditee? Yes

Report No. 2017-194 March 2017 Page 113
ADDITIONAL MATTER
FINANCIAL REPORTING
Finding Number 2016-001 Opinion Unit Aggregate Discretely Presented Component Units
Financial Statements Account Titles Various
Adjustment Amounts Not Applicable
Prior Year Finding Not Applicable Finding District financial reporting procedures need improvement to ensure consistent,
proper reporting of charter schools as discretely presented component units.
Criteria State Board of Education (SBE) Rule 6A-1.0071, Florida Administrative Code, and related instructions from the Florida Department of Education (FDOE) prescribe the exhibits and schedules that should be prepared as part of the District’s annual financial report (AFR). Section 1010.01, Florida Statutes, requires that these exhibits and schedules be prepared in accordance with generally accepted accounting principles (GAAP).
GAAP provides that the financial reporting entity consists of the primary government and its component units. GAAP further defines component units as legally separate organizations for which the primary government is financially accountable and other organizations for which the nature and significance of their relationship with the primary government are such that exclusion would cause the reporting entity’s financial statements to be misleading.
In October 2012 and January 2014, the FDOE provided guidance directing school districts to report charter schools as discretely presented component units (DPCUs), unless the charter schools were reported as component units of other governmental entities in accordance with GAAP. In addition, in November 2013, the FDOE General Counsel concluded that excluding the charter schools from financial reporting would cause the districts’ financial statements to be misleading as, pursuant to the Article IX, Section 4 of the State Constitution, charter schools are public schools and each school district has constitutional responsibility for all public schools within the school district.
Condition Pursuant to guidance from the FDOE, the District was responsible for reporting 119 charter schools as DPCUs on the District’s financial statements for the 2013-14 and 2014-15 fiscal years, and 118 charter schools as DPCUs on the District’s financial statements for the 2015-16 fiscal year. Although the District appropriately reported the charter schools as DPCUs on the AFRs presented for audit for the 2013-14, 2014-15, and 2015-16 fiscal years, the District did not report the charter schools as DPCUs on the District’s Comprehensive Annual Financial Reports (CAFRs) for those fiscal years.
Cause In response to our inquiries, District personnel indicated that the District implemented Governmental Accounting Standards Board (GASB) Statement No. 61 for the 2012-13 fiscal year, and determined that charter schools did not meet the criterion to be considered component units because:
Charter schools, although financially dependent, are not fiscally dependent on the District. District personnel indicated that their understanding is corroborated by GASB question and answer guidance which provides, in part, that the charter school would be fiscally dependent on the sponsoring district if the charter school could not levy taxes without the approval of the sponsoring district. However, the District’s charter schools have no tax levy

Report No. 2017-194 Page 114 March 2017
of its own that would be subject to the approval of the District. Instead, the District provides funding for the charter school, in part, through its own levy, which places a financial burden on the District, but is not an indication of fiscal dependency.
Charter schools are not fiscally dependent on the District and a financial benefit/ burden relationship does not exists as: o The District is not entitled to or can otherwise access the charter school’s
resources. o The District is not legally obligated or can otherwise assume the
obligations to finance the deficits of, or provide financial support to the charter schools.
o The District is not obligated in some manner for the debt of charter schools, as Section 1002.33, Florida Statutes, explicitly precludes the District from being responsible for any and all liabilities of a charter school.
Charter schools are not misleading to exclude from the District financial statements because charter schools do not meet all GASB requirements of the “Misleading to Exclude” provisions as follows:
The District does not have the ability to access the economic resources received or held by a charter school. Charter schools are separate legal entities with independent boards.
The District is not legally entitled and cannot otherwise access the charter school resources unless the charter schools are closed.
Notwithstanding this response, the District’s inconsistent financial reporting of the charter schools is contrary to the FDOE’s conclusion that charter schools are component units of their respective school districts, unless the charter schools were reported as component units of other governmental entities in accordance with GAAP.
Effect Excluding charter schools as DPCUs from school district financial statements may cause financial statement users to misunderstand the reporting entity’s financial activities and incorrectly assess the reporting entity’s financial position. In addition, inconsistent financial reporting of charter schools between the various financial reports (AFR and CAFR) does not provide for comparable financial statements.
For the 2015-16 fiscal year, the financial activities of the 118 charter schools comprise 100 percent of the respective deferred outflows of resources, liabilities, deferred inflows of resources, and expenses; 99 percent of the respective assets and revenues; and 98 percent of net position for the financial activities reported for aggregate DPCUs.
Recommendation The District should improve financial reporting procedures to ensure consistent, proper reporting of DPCUs on the District’s financial statements.
District Response Management does not agree with the finding. The Governmental Accounting Standards Board (GASB) issued Statement No. 61 The Financial Reporting Entity: Omnibus, an amendment of GASB Statements No. 14 and No. 34 in November 2010. The Statement modified existing requirements for the assessment of potential component units in determining what should be included in the financial reporting entity. The District has been consistent in the application of GASB Statement No. 61 since its adoption.
The District implemented GASB Statement No. 61 for the fiscal year ended June 30, 2013. As part of the implementation of that GASB pronouncement we thoroughly reviewed GASB Statements No. 14, 39 and 61, the GASB Codification of Governmental Accounting and Financial Reporting Standards, the GASB Comprehensive Implementation Guide and consulted with the District’s independent auditors. Specifically, GASB 61, paragraph 6, states that, in addition

Report No. 2017-194 March 2017 Page 115
to meeting the fiscal dependency requirement, there also needs to be a financial benefit or burden relationship present. The pronouncement cites that an organization has a financial benefit or burden relationship with the primary government if any of the following conditions exists:
The primary government is legally entitled to or can otherwise access the organization’s resources or assets;
The primary government is legally obligated or has otherwise assumed the obligations to finance the deficits of, or provide financial support to the organization; or
The primary government is obligated in some manner for the debt of the organization.
Based on the aforementioned requirements, Management believes the District as primary government does not meet any of the criterion. In fact, statutory law precludes the District from the above requirements. Consequently, we have concluded that the charter schools are not deemed to be component units and therefore were excluded from the Comprehensive Annual Financial Reports for the fiscal years ended June 30, 2013, 2014, 2015 and 2016. The District has received an unmodified opinion from our independent auditors since the first year of implementation.
Management reviews and assesses all applicable GASB pronouncements along with technical guidance issued by the Florida Department of Education to ensure District’s compliance. State requirements determined to be non-GAAP issued by the Florida Department of Education are reported in the unaudited Annual Financial Report and the Audited Comprehensive Annual Financial Report is then adjusted to comply with GAAP.
The Auditor General’s finding fails to cite the specific departure from Generally Accepted Accounting Principles (GAAP) and also fails to cite where the District’s assessment is inconsistent with GASB Statements Nos. 14, 39 and 61 in the District’s conclusion that charter schools do not meet the criteria to qualify as component units. Instead the finding cites requirements from the Florida Department of Education with which the District is in compliance by including the charter schools in the state required unaudited Annual Financial Reports.
Estimated Corrective Action Date
Not applicable
District Contact and Telephone Number
Judith M. Marte, Chief Financial Officer (305) 995-1225
Auditor’s Remarks The District’s response indicates that the Auditor General fails to cite the specific departure from GAAP or where the District’s assessment is inconsistent with the GASB statements that charter schools do not meet the criteria to qualify as component units. Notwithstanding this response, the District is required to follow SBE rules and related FDOE guidance for financial reporting. In addition, the FDOE considered the GASB requirements and concluded that excluding the charter schools from financial reporting would cause the districts’ financial statements to be misleading as, pursuant to the Article IX, Section 4 of the State Constitution, charter schools are public schools and each school district has constitutional responsibility for all public schools within the school district. As inconsistent financial reporting of charter schools from year to year does not provide for comparable financial statements and is contrary to the FDOE’s conclusion that excluding the charter schools from school district financial reporting would cause the District’s financial statements to be misleading, we continue to recommend that the District ensure consistent, proper reporting of DPCUs on the District’s financial statements.

Report No. 2017-194 Page 116 March 2017
PRIOR AUDIT FOLLOW-UP
The District had taken corrective actions for the Federal Awards findings included in the previous audit
report.
SUMMARY SCHEDULE OF PRIOR AUDIT FINDINGS
Listed below is the District's summary of the status of prior audit findings required to be reported under
2 CFR 200.511:
Program/Area Brief Description Status Comments
RSM US LLP Fully corrected.
(2015-001)
RSM US LLP Fully corrected.
(2015-002)
Audit Report No.(Finding No.)
In May 2016, District management developed new reporting templates to assist technical colleges/specialized centers with the submission of Enrollment Status Reports per established policies and mandates. As of February 2017, templates were modified to reflect the accurate reporting of student enrollment status.
The credit balances due to recipients of SFA program funds were not disbursed to the student or parent within 14 days after the credit balance occurred.
Changes in student enrollment information were not reported to the Department of Education.
Student Financial Assistance Cluster (CFDA Nos. 84.007 and 84.063)
Student Financial Assistance Cluster (CFDA Nos. 84.007 and 84.063)
District management has established and implemented internal controls and protocol for all schools participating in the Federal Student Aid program when monitoring student credit balances to ensure timely disbursement of student funds.

Report No. 2017-194 March 2017 Page 117
CORRECTIVE ACTION PLAN
Miami-Dade County District School Board Management’s Corrective Action Plan
For the Fiscal Year Ended June 30, 2016
Finding Number: 2016-001
Planned Corrective Action: See District Response in the finding.
Anticipated Completion Date: Not applicable
Responsible Contact Person: Judith M. Marte, Chief Financial Officer