miami-dade county · miami-dade county real estate market ... an index equal to 100 means the...
TRANSCRIPT

Real Estate Market Report, 2015:Q1 Miami-Dade County
Real Estate Market Report, 2015:Q1
Department of Regulatory & Economic Resources Research & Economic Analysis Section
Residential Real Estate
Single-Family Home Sales: First quarter 2015 sales of existing single-family homes reflected a double digit year-over-year increase compared to 2014:Q1 sales. Seasonally adjusted sales data from the Miami Association of Realtors has the 2015 first quarter sales at 10 percent greater than the same quarter the previous year. Total quarterly sales amounted to 3,526.
The median price of existing single- family homes sold in the first quarter increased 8 percent, reaching $247,500. This is an improved year-over-year growth rate
but not as vigorous as 2013 when sales increased, on average, 19 percent.
Residential Real Estate First Quarter 2015 Highlights
• Sales of existing single family homes in the first quarter topped over 3,500, an increase of 10 percent over the first quarter of 2014. The median sales price in the quarter was up 8 percent from the previous year to $247,500.
• Sales of condos and townhouses in 2015:Q1 declined 2 percent from the first quarter of 2014 but still reached nearly 4,000, while the median sales price increased 5 percent to $196,500.
• The Case-Shiller Aggregate Home Price index in 2015:Q1 increased nearly 9 percent from the first quarter of 2014.
• Miami’s cash buyers represent more than twice the national average. • Miami-Dade foreclosure filings were down 39 percent over the fourth quarter of last year
1
Real Estate Market Report 2015:Q1
Real Estate Market Report, 2015:Q1
Department of Regulatory & Economic Resources Research & Economic Analysis Section
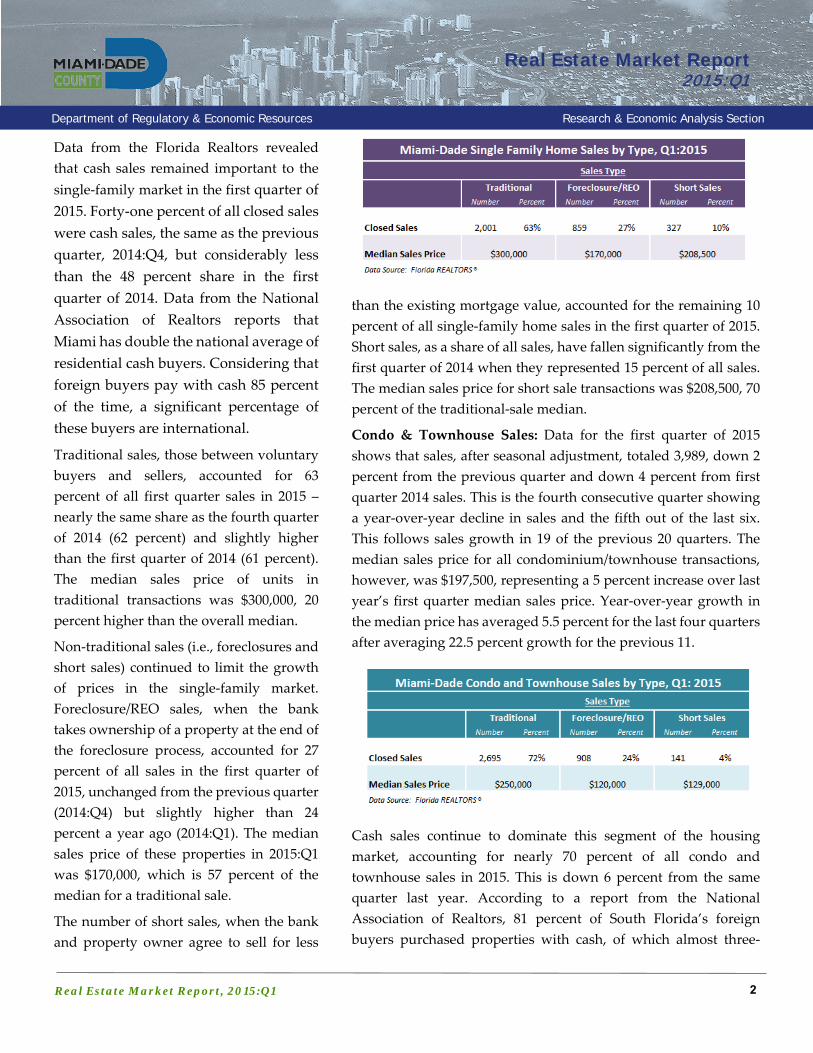
Data from the Florida Realtors revealed that cash sales remained important to the single-family market in the first quarter of 2015. Forty-one percent of all closed sales were cash sales, the same as the previous quarter, 2014:Q4, but considerably less than the 48 percent share in the first quarter of 2014. Data from the National Association of Realtors reports that Miami has double the national average of residential cash buyers. Considering that foreign buyers pay with cash 85 percent of the time, a significant percentage of these buyers are international.
Traditional sales, those between voluntary buyers and sellers, accounted for 63 percent of all first quarter sales in 2015 – nearly the same share as the fourth quarter of 2014 (62 percent) and slightly higher than the first quarter of 2014 (61 percent). The median sales price of units in traditional transactions was $300,000, 20 percent higher than the overall median.
Non-traditional sales (i.e., foreclosures and short sales) continued to limit the growth of prices in the single-family market. Foreclosure/REO sales, when the bank takes ownership of a property at the end of the foreclosure process, accounted for 27 percent of all sales in the first quarter of 2015, unchanged from the previous quarter (2014:Q4) but slightly higher than 24 percent a year ago (2014:Q1). The median sales price of these properties in 2015:Q1 was $170,000, which is 57 percent of the median for a traditional sale.
The number of short sales, when the bank and property owner agree to sell for less
than the existing mortgage value, accounted for the remaining 10 percent of all single-family home sales in the first quarter of 2015. Short sales, as a share of all sales, have fallen significantly from the first quarter of 2014 when they represented 15 percent of all sales. The median sales price for short sale transactions was $208,500, 70 percent of the traditional-sale median.
Condo & Townhouse Sales: Data for the first quarter of 2015 shows that sales, after seasonal adjustment, totaled 3,989, down 2 percent from the previous quarter and down 4 percent from first quarter 2014 sales. This is the fourth consecutive quarter showing a year-over-year decline in sales and the fifth out of the last six. This follows sales growth in 19 of the previous 20 quarters. The median sales price for all condominium/townhouse transactions, however, was $197,500, representing a 5 percent increase over last year’s first quarter median sales price. Year-over-year growth in the median price has averaged 5.5 percent for the last four quarters after averaging 22.5 percent growth for the previous 11.
Cash sales continue to dominate this segment of the housing market, accounting for nearly 70 percent of all condo and townhouse sales in 2015. This is down 6 percent from the same quarter last year. According to a report from the National Association of Realtors, 81 percent of South Florida’s foreign buyers purchased properties with cash, of which almost three-
2

Real Estate Market Report 2015:Q1
Real Estate Market Report, 2015:Q1
Department of Regulatory & Economic Resources Research & Economic Analysis Section
quarters purchased a condo or townhouse. Thus, the high ratio of cash sales in Miami-Dade, about twice the national average, coupled with the high percent of foreign buyers, further indicates the continued appeal of the local market to these buyers.
Traditional arms-length sales continue to account for the greatest share of total condo and townhouse sales, 72 percent in 2015:Q1. The median transaction price for traditional sales was $250,000 in that quarter. Foreclosure/REO’s accounted for 24 percent of all condo/townhouse sales in the quarter compared to 23 percent in the same quarter of the previous year. The median sales price was less than half that of a traditional sale, at $120,000, the same as Q4:2014 and 6 percent greater than a year ago. Short sales in the condo/townhouse market accounted for less than 4 percent of all sales in the first quarter of 2015 compared to 9 percent in the first quarter of the prior year. The 2015:Q1 median price of short sales was $129,000, 52 percent of the traditional sales median. The foregoing data illustrates a housing market that is experiencing a slow-down in growth. One source, Zillow, projects a modest 1.6 percent annual growth rate in valuations over the next 12 months.
The Standard & Poor’s (S&P)/Case-Shiller Housing Price Index: The Case Shiller (CS) Index compares the sales of the same single-family homes of similar size and style in a particular geographic market over time in order to estimate price changes in the housing stock (excluding new construction and condos or homes that
have undergone substantial remodeling). The CS Index provides a more accurate estimate of the changes in values of the existing housing stock over time compared to the median transaction price available from current sales, which is an indicator only of recent sales prices.
The CS Index separates the Miami-Fort Lauderdale existing single-family residential market into three value tiers. The lowest tier, values of less than $208,000, saw the price index grow in 2015:Q1 by 14.1 percent above a year earlier to 199.2. This means that a home in this value range is worth almost double (99.2 percent more) than in the base date of January 2000 when the index was set at 100. The index for the highest tier, homes valued at $341,000 and above, increased 7 percent in 2015:Q1 from a year earlier to 193.3. The middle tier index, values between $208,000 and $341,000, had grown 9.8 percent from the first quarter of 2014 to 199.2. Overall, the aggregate index in the first quarter of 2015 for all single-family homes in the market grew 8.7 percent from the same quarter of the previous year to 196.8.
Distress: There were 1,636 foreclosure fillings with the Clerk of the Courts in Miami-Dade in the first quarter of 2015; down 18.5 percent from the previous quarter (2014:Q4) and 39 percent less than a year ago (2014:Q1). This seems to indicate that the housing foreclosure crisis is winding down. However, Zillow Real Estate Research estimates that in 2015:Q1, 19.5 percent of Miami-Dade mortgages were greater than the home’s market value
3

Real Estate Market Report 2015:Q1
Real Estate Market Report, 2015:Q1
Department of Regulatory & Economic Resources Research & Economic Analysis Section
(underwater), down from 28 percent in the first quarter of 2014. The average negative equity value for those underwater homes in 2015:Q1 was $102,411 per home, one percent better than the previous year ($103,566 in 2014:Q1). Furthermore, in the first quarter of 2015, an additional 12 percent of houses with a mortgage were in the 80 to 100 percent loan-to-value ratio, considered near negative equity. This puts Miami-Dade in the bottom quartile of large counties nationally, but indicates a significant improvement over 2013:Q4 figures when Miami-Dade was in the lowest 10 percent.
The map on the page 5 shows, by zip code, the percent of homes that were underwater in 2015:Q2.
Housing Affordability: The National Association of Realtors (NAR) publishes a “Housing Affordability Index” that estimates whether a “typical family” (one earning the median income) could qualify for a mortgage loan for a “typical home” (one valued at the median price). The formula factors in the income of a typical family relative to the typical cost of a home mortgage (including price and interest rate). An index equal to 100 means the typical family has exactly enough income to qualify for a mortgage on the typical home. An index greater than 100 means the family has more than enough income to qualify. In other words, the index rises when homes become more affordable. Using local data and the same
methodology, an index has been calculated for Miami-Dade County.
Since the first quarter of 2012, increases in housing prices and interest rates with flat to small decreases in household income has made homeownership less affordable for many residents. In the first quarter of 2012, the average affordability index for Miami-Dade was 159.8, but by the first quarter of 2015 that number declined to 108.3. Nationally the trend has been very similar, however, home ownership has been consistently more affordable. The average national index averaged 196 for all of 2012 and dropped to 177 by the first quarter of 2015.
4

9
8
7
12
4
11
5
1
2
6
3
10
13
SW 8TH ST
FLOR
IDA
TPKE
EXT
SW 72ND ST
NW 27TH AVE
SW 88TH ST
SW 216 TH ST
SW 17
7TH
AVE
SW 184 TH ST
SW 56TH ST
BISC
AYNE
BLV
D
SW 137TH AVE
SW 152 ND ST
NW 7TH AVE
NW 3 6TH ST
W FLAGLER STSR
826
EXT
I 195SW
67TH AVE
SW 40TH ST
SW 232 ND ST
COLLINS AVE
W OKEE CHOBEE RD
SW 117TH AVE
NW 1 2TH ST
SR 9
SW 264 TH ST
SR 874 EXT
SW 248 TH ST
SW 200 TH ST
SW 57TH AVE
I 75 EX T
SW 24TH ST
SW 16
7TH
AVE
NW 22ND AVE
SW 127TH AVE
ALTON RD
SW 19
7TH
AVE
NW 7 TH ST
SW 10
7TH
AVE
NW 1 83RD ST
N MIAM
I AVE
NW 1 35TH S T
W 4T
H AV
E
SW 104 TH ST
SW 15
7TH
AVE
NE 2ND AVE
NW 1
07TH
AVE
NW 1 99TH S T
E 4TH AVEE 8TH AVE
NW 5 8TH ST NW 12TH AVE
N KROME AVE
KROME AVE
NW 9
7TH
AVE
NW 37TH AVE
NE 6TH AVE
OLD CU
TLER
RD
SW 14
7TH
AVE
SR 8 78
SW 97TH AVE
NW 32ND AVE
SW 168 TH ST
NW 17TH AVE
W 12
TH AV
E
SW 11
2TH
AVE
SW 280 TH ST
SW 268 TH ST
NW 57TH AVE
I 95 E
XPY
NW 67TH AVE
SW 42ND ST
PALM AVE
SW 87
TH AV
ENW
87T
H AV
E
W 68TH ST NW 119 TH ST
SW 7TH ST
SR 9 34GRANADA BLVD
NW 1 86TH S T
NW 7
2ND
AVE
NW 2 0TH ST
SW 360 TH ST
SW 344 TH ST
NW 9 5TH ST
SW 77TH AVE
S DIXIE HWY
SW 27TH AVE
W D
IXIE
HW
Y
NW 2
ND AV
E
NW 2 15TH S T
SW 37TH AVE
SW 22ND AVE
SW 288 TH ST
SR 8 36 EXT
S MIAMI AVE
CARIBBEAN BLVD
SW 120 TH ST
SW 328 TH ST
HARD
ING
AVE
SW 160 TH ST
SW 392 ND ST
E 49TH ST
NE 1 25TH ST
SW 112TH ST
96TH ST
NW 9 0TH ST
SW 136 TH ST
NE 15TH AVE
SW 42ND AVE
E 65TH ST
CRAN
DON
BLVD
NE 2 15TH ST
PINE
TRE
E DR
SW 376 TH ST
I 95 EX T
NW 1 38TH S T
SW 18
7TH
AVE
NE 8 TH ST
OCEA
N BL
VDSW 186 TH ST
W PALM DR
KENNEDY CS WY
NW 1 03RD STNW 1 06TH S T
NW 2 1ST ST
NW 1
37TH
AVE
SW 21
7TH
AVE
NW 7 4TH ST
SE 12
TH AV
E
E PALM DR
SW 312 TH ST
NW 2 15TH S T
SW 312 TH ST
SW 328 TH ST
NE 2
ND AV
E
SW 37TH AVE
SW 200 TH ST
SW 280 TH ST
SW 12
7TH
AVE
SR 8
26 E
XT
SW 344 TH ST
SW 13
7TH
AVE
NW 87TH AVE
NW 22ND AVE
SW 12
7TH
AVE
NE 6TH AVE
SW 88TH ST
OLD
CUTL
ER RD
KROM
E AV
E
SW 157TH AVE
SW 87TH AVE
I 95 E
XPY
SW 328 TH ST
Percent of Homes with Negative Equity (Underwater)
Ü
Negative Equity by Zip CodePercent of Ho mes with a M ortgag e th at are U nd erwater:
4% - 14%
15% - 19%
20% - 27%
28% - 40%
Zip C odes with N o D ata
Commission District
Da ta Sou rce : Zillow Rea l Esta te Re sea rch , Neg ative Eq uity Dat a,201 5:Q 1.
Countywide Rate = 19%
Miami-Dade CountyDepartment of Regulator y and E conomic Resourc es
Planning Researc h and Econom ic AnalysisJuly 2015
0 2 41Miles

..... .....
Department of Regulatory Economic Resources ....
Research & Economic Analysis Section .
Miami-Dade Existing Home Sales Housing Affordability* (based on Single Family Home Sales)
2014:Q4 2014:Q1 2014:Q4 2014:Q1Single Family Sales 3,526 -0.2% 10.2% Miami-Dade County
Med. Sales Price $247,500 0.3% 8.1% Affordability Index 108.3 1.8% -1.0%Condo Sales 3,989 -2.2% -3.6% US
Med. Sales Price $197,500 4.0% 5.2% Affordability Index 177.3 5.5% 1.6%Data Source: FloridaRealtors.org
Housing Price Indices & Comparisons (2000=100)
2014:Q4 2014:Q1 30-Year Fixed Mortgage RatesMiami MSA Chg from Low Tier (< $207,745) 199.2 2.7% 14.1% 2014:Q1 Middle Tier 199.2 3.4% 9.8% Miami-Dade 4.05 4.22 -0.29 High Tier (> $341,337) 193.3 2.6% 7.0% US 4.09 4.21 -0.31
Aggregate Index 196.8 2.9% 8.7% Data Source: HSH Associates, Inc.
Building Permits (Units)
2014:Q4 2014:Q12014:4Q 2014:1Q Miami-Dade County
Miami HPI 203.4 0.5% 11.3% 3 Mo. Trailing Avg 670 15.8% -15.1%Broward HPI 193.8 1.9% 9.3% USFlorida HPI 168.4 1.6% 9.3% Units (000s) 85.8 -7.5% 2.2%
* Existing homes paired sales, seasonally adjusted. Data Source: US Census Bureau.
Houses with Mortgages in Negative Equity
2014:4Q 2014:1Q For additional information visit our website at:Miami-Dade 19.5% -1.6% -8.4% http://www.miamidade.gov/business/economic-development.asp
United States 15.4% -1.5% -3.4%
Data Sources: Zillow. Released Aug 2015
177.6
Federal Housing Finance Agency**
2015:Q1
% Change from
Miami-Dade County Housing Market
2015:1Q
2015:Q1
2015:Q1
Note: All numbers are seasonally adjusted unless otherwise indicated.
2015:1Q
2014:Q4
** All transactions quarterly index, not seasonally adjusted. Data Source: Standard & Poors; Federal Housing Finance Agency
2015:Q1
Case-Shiller*
Data Source: National Association of Realtors; EDIT.* The index is a ratio of monthly median income over the P & I payment on a 30 yr fixed rate mortgage. A higher index means more affordable.
2015:Q1
US 20 City Composite Index
% Change from
% Change from% Change from
% Change from % Change from
4.8%2.9%
300
600
900
1,200
1,500
1,800
2,100
$0
$50
$100
$150
$200
$250
$300
Sale
s
($ in
'000
s)
Existing Homes Sales: Seasonally Adjusted Sales and Median Price
SF Sales (Rt Axis) Condo Sales (Rt Axis)SF Median Price Condo Median Price
Data Source: Florida Realtors.
25
75
125
175
225 U.S Miami-Dade
Housing Affordability Index*

Real Estate Market Report 2015:Q1
Real Estate Market Report, 2015:Q1
Department of Regulatory & Economic Resources Research & Economic Analysis Section
Office: Conditions in the office market continued to show improvement in the first quarter of 2015. Lease rates (excluding concessions) increased 0.24 percent from the fourth quarter of 2014, and year-over-year, nearly 2 percent. Thus, by 2015:Q1, the average lease rate was $29.73 per square foot.
Vacancy rates continued to decline in the first quarter of 2015, to 11.7 percent, from 15 percent at the 2011 peak. The percent of office space available for lease declined as well to 14 percent in the first quarter from a peak of 17 percent in the third quarter of 2010. The percentage of space that is vacant and available for lease has been declining but there remains a significant amount of office space that, although occupied, is being marketed as available for rent. This gap between space available for lease and
vacant can be considered a risk gap. Not wanting to be caught with a lot of vacant space in a soft market, property owners aggressively market occupied space to prospective new tenants. On the demand side, tenants may hold off renewing leases as their needs change with economic conditions or they look for more favorable lease
Commercial Real Estate First Quarter 2015 Highlights
• The office market vacancy rate declined 140 basis points to 11.7 percent in the first quarter of 2015 from the first quarter a year earlier (2014). The average lease rate for office space in 2015:Q1 increased slightly to $29.73/SF from $29.23/SF in the first quarter of last year.
• The industrial vacancy rate decreased to 5.3 percent in the first quarter compared to a year ago (5.9 percent) and lease rates have gradually, yet consistently, increased to $9.12/SF -- a 25 percent increase from 2011:Q1 when leases averaged $7.31/SF.
• Construction of industrial space in Miami-Dade has slowed but continues to grow with almost 787,000 square feet of new industrial space under construction in 2015:Q1.
• Retail vacancy rates in shopping centers in 2015:Q1 declined from a year earlier to 3.7 percent. Lease rates barely increased 1 percent in the first quarter to $26.04/SF from $25.85/SF one year ago. A total of 600,000 SF of new space remains under construction with 272,000 SF delivered in the first quarter.
• The vacancy rate for stand-alone retail has remained flat for the last three quarters, at 3.2 percent in 2015:Q1. Since the recovery began lease rates have increased 64 percent to $37.96/SF from a low of $23.21/SF in 2011:Q1.
7

Real Estate Market Report 2015:Q1
Real Estate Market Report, 2015:Q1
Department of Regulatory & Economic Resources Research & Economic Analysis Section
terms. These actions by owners and tenants increase this available-to-vacant spread when market conditions are soft and decrease the spread as the market tightens. In 2015:Q1 the gap between available and vacant office space in Miami-Dade was 2.4 percent, down from a peak of nearly 3 percent in the first quarter of 2013, which suggests a market that is growing tighter.
In addition to the improvements in vacancy rates and leasing terms, construction of office space has also shown continued improvement. Back in the third quarter of 2007, office construction peaked at 5.2 million square feet (SF) but declined 5 years later to 205,000 square feet in 2013:Q1. Now, in the first quarter of 2015, we see office construction has rebounded with 926,000 SF under construction.
Industrial: Industrial lease rates have gradually increased to reflect a nearly 25 percent increase from the bottom of the market in the first quarter of 2011 to $9.12 per square foot in the first quarter of 2015. This occurred even with the delivery of over 2.6 million SF of new industrial space in the last year, including nearly 787,000 SF that was added in 2015:Q1 alone. The vacancy rate in industrial space has declined since the peak in 2009:Q4 at 10 percent down to 5.3 percent in 2015:Q1. The percentage of space available for lease dropped over that same time-frame from 12.8 percent to 8.1 percent. The “risk gap” between the available space and vacant space has declined from a high 4 percent in 2011:Q1, to 2.8 percent in 2015:Q1, signaling a tightening market with reduced construction activity.
Industrial square footage under construction fell from 2.8 million square feet in 2006:Q3 to 188,300 SF in 2011:Q3. Since then, however, local construction of industrial space rebounded through the second quarter of 2014 with nearly 2 million SF still under construction, but has settled down to less than 787,000 SF in the first quarter of 2015.
Retail: Lease rates in shopping centers have bounced around in recent years, bottoming out in 2011:Q1 at $23.43/SF before growing rapidly through 2012:Q3 with lease rates up 17 percent to
8

Real Estate Market Report 2015:Q1
Real Estate Market Report, 2015:Q1
Department of Regulatory & Economic Resources Research & Economic Analysis Section
$27.30/SF. Following a soft 2013 where lease rates dipped to $24.73/SF, it did recover modestly by the fourth quarter of 2014 to $26.74/SF before dipping to $26.04/SF in the first quarter of 2015. These swings in lease rates occurred while new space delivered to the market increased almost 200 percent between the third and fourth quarters of 2014 and exactly doubled between 2014:Q4 and 2015:Q1. Vacancy peaked at 5.5 percent in 2010:Q1 before dropping to 3.9 percent by 2012:Q4 where it has essentially remained since. As of 2015:Q1, the rate stood at 3.7 percent.
Lease rates for stand-alone retail (not in shopping centers) dropped to $23.21/SF by 2011:Q1 but then rebounded steadily, increasing 64 percent to $37.96/SF by 2015:Q1. The vacancy rate peaked in 2009:Q3 at 4 percent where it remained until 2014:Q1. Since then it has dropped to 3.2 percent where it has remained through 2015:Q1.
Both retail categories have experienced significant new space being delivered to the market over the last year and this may limit the ability of lease rates to continue to rise as fast as they have been.
Construction of shopping center space peaked at 2.7 million SF in the first quarter 2008. Consistently in the years that followed, construction has declined such that from 2010 to 2012 only nominal shopping center construction took place.
New construction then picked up again in 2013 and by 2014:Q2, nearly 900,000 SF were under construction, and by 2015:Q1 600,000 SF were still under construction. Construction of stand-alone retail space peaked at 1.3 million SF in the third quarter of 2008, with very little construction from 2010 to the end of 2012. Construction then reached 1.3 million SF by 2013:Q3 and has since dropped to 570,000 SF as of the first quarter of 2015.
9

I
...
Department of Regulatory Economic Resources, Research and Economic Analysis.......
Miami-Dade County Commercial Real Estate
20152Q 3Q 4Q 1Q 2Q 3Q 4Q 1Q
Rentable Building Area (SF) 100,072 99,366 100,164 99,823 99,759 99,725 99,755 99,755 99,768 99,215Vacancy Rate 14.1% 14.3% 14.1% 13.6% 13.3% 13.1% 12.7% 12.4% 12.2% 11.7%Available % 16.4% 16.3% 16.1% 15.9% 15.5% 15.2% 14.5% 14.3% 14.6% 14.1%Net Absorption (SF) 880 149 (436) 234 270 111 420 278 252 4RBA Deliveries (SF) 302 221 35 23 0 0 80 0 41 57Average Lease Rate (/fs) $28.44 $29.11 $28.60 $28.50 $29.14 $29.23 $29.52 $29.55 $29.66 $29.73
20152Q 3Q 4Q 1Q 2Q 3Q 4Q 1Q
Rentable Building Area (SF) 227,689 228,774 228,607 228,868 229,103 229,129 229,744 230,653 230,869 231,659Vacancy Rate 6.8% 6.3% 6.5% 6.1% 6.1% 5.9% 5.6% 5.8% 5.5% 5.3%Available % 10.3% 9.5% 9.3% 9.6% 8.9% 8.5% 8.6% 8.5% 8.2% 8.1%Net Absorption (SF) 1,716 2,221 190 1,204 278 498 1,247 454 856 1,211RBA Deliveries (SF) 486 1,844 214 382 319 180 689 914 217 790Average Lease Rate (nnn) $7.99 $8.39 $8.49 $8.73 $8.19 $8.43 $8.50 $8.89 $8.96 $9.12
Indu
stria
lO
ffic
e
Square Feet (SF) are in '000s
Square Feet (SF) are in '000s
20132012
2012 2013
2013 2014
2013 2014
14.4
%
14.3
%
13.9
%
13.8
%
13.7
%
14.1
%
13.6
%
13.3
%
13.1
%
12.7
%
12.4
%
12.2
%
11.7
%$22.00
$23.00
$24.00
$25.00
$26.00
$27.00
$28.00
$29.00
$30.00
$31.00
$32.00
Q1 Q2 Q3 Q4 Q1 Q2 Q3 Q4 Q1 Q2 Q3 Q4 Q1
Vacancy Rates
Avg Lease Rates
Data Source: Costar
Miami-Dade Office Market Vacancy & Lease Rates
2012 2013 2014 '15
608 K
586 K668 K
926 K
516 K
205 K
435 K
-750
-500
-250
0
250
500
750
1,000
Q1 Q2 Q3 Q4 Q1 Q2 Q3 Q4 Q1 Q2 Q3 Q4 Q1
Thou
sand
s of S
F
Net Absorption
Deliveries
Under Construction
Miami-Dade Office Market Absorptions & Deliveries
Data Source: Costar2012 2013 2014 '15
7.1%
6.6%
6.8%
6.5%
6.6%
6.5%
6.1%
6.1%
5.9%
5.6%
5.8%
5.5%
5.3%
$0.00
$1.00
$2.00
$3.00
$4.00
$5.00
$6.00
$7.00
$8.00
$9.00
$10.00
Q1 Q2 Q3 Q4 Q1 Q2 Q3 Q4 Q1 Q2 Q3 Q4 Q1
Vacancy Rates
Avg Lease Rates
Data Source: Costar
Miami-Dade Industrial Market Vacancy & Lease Rates
2012 2013 2014 '15
1,970 K
1,166 K
787 K
1,227 K
949 K
1,709 K
-500
-250
0
250
500
750
1,000
1,250
1,500
1,750
2,000
2,250
Q1 Q2 Q3 Q4 Q1 Q2 Q3 Q4 Q1 Q2 Q3 Q4 Q1
Thou
sand
s of S
F
Net Absorptions Deliveries Under Construction
Miami-Dade Industrial Market Absorptions & Deliveries
Data Source: Costar2012 2013 2014 '15
10

I
...
Department of Regulatory Economic Resources, Research and Economic Analysis.......
Miami-Dade County Commercial Real Estate (Cont'd)
20152Q 3Q 4Q 1Q 2Q 3Q 4Q 1Q
Rentable Building Area (SF) 66,247 66,408 66,415 66,429 66,429 66,429 66,429 66,477 66,620 66,818Vacancy Rate 4.1% 4.1% 4.0% 4.1% 4.0% 4.0% 3.9% 4.0% 3.7% 3.7%Available % 5.8% 5.7% 5.6% 5.8% 5.6% 5.6% 5.4% 5.1% 5.0% 5.1%Net Absorption (SF) 562 23 75 (68) 89 8 74 (1) 288 221RBA Deliveries (SF) 237 71 48 13 0 12 0 48 136 272Average Lease Rate (nnn) $26.74 $25.42 $25.16 $24.73 $25.33 $25.85 $26.27 $26.55 $26.74 $26.04
20152Q 3Q 4Q 1Q 2Q 3Q 4Q 1Q
Rentable Building Area (SF) 57,919 57,796 57,775 57,746 57,833 57,876 57,695 58,164 58,259 58,508Vacancy Rate 3.8% 3.8% 3.7% 3.9% 3.7% 3.9% 3.4% 3.3% 3.2% 3.2%Available % 5.1% 5.1% 5.0% 5.2% 5.0% 4.7% 4.7% 4.5% 4.4% 4.5%Net Absorption (SF) (442) 90 (19) (148) 230 (102) 153 495 157 223RBA Deliveries (SF) 508 481 86 20 247 159 137 512 101 303Average Lease Rate (nnn) $28.10 $32.76 $31.62 $33.63 $34.04 $34.28 $34.81 $35.51 $37.54 $37.96Re
tail
Not
-Ctr
s
2012 2013
Reta
il Ce
nter
s
2012 2013
Square Feet (SF) are in '000s
Square Feet (SF) are in '000s 2013 2014
2013 2014
4.2%
4.3%
4.1%
3.9%
4.1%
4.0%
4.1%
4.0%
4.0%
3.9%
4.0%
3.7%
3.7%
$18.00
$19.00
$20.00
$21.00
$22.00
$23.00
$24.00
$25.00
$26.00
$27.00
$28.00
Q1 Q2 Q3 Q4 Q1 Q2 Q3 Q4 Q1 Q2 Q3 Q4 Q1
Vacancy Rates
Avg Lease Rates
Data Source: Costar
Miami-Dade Retail in Centers - Vacancy & Lease Rates
2012 2013 2014 '15
521 K
925 K
603 K
59 K
615 K
-200
-100
0
100
200
300
400
500
600
700
800
900
1,000
Q1 Q2 Q3 Q4 Q1 Q2 Q3 Q4 Q1 Q2 Q3 Q4 Q1
Thou
sand
s of S
F
Net Absorptions
Deliveries
Under Construction
Miami-Dade Retail in Centers - Absorptions & Deliveries
Data Source: Costar2012 2013 2014 '15
3.8%
3.8%
3.8%
3.9%
3.8%
3.7% 3.9%
3.7% 3.9%
3.4%
3.3%
3.2%
3.2%
$15.00
$17.00
$19.00
$21.00
$23.00
$25.00
$27.00
$29.00
$31.00
$33.00
$35.00
$37.00
$39.00
$41.00
Q1 Q2 Q3 Q4 Q1 Q2 Q3 Q4 Q1 Q2 Q3 Q4 Q1
Vacancy Rates
Avg Lease Rates
Data Source: Costar
Miami-Dade Retail Not in Ctrs - Vacancy & Lease Rates
2012 2013 2014 '15
1,292 K
570 K
277 K
1,307 K
-400
-200
0
200
400
600
800
1,000
1,200
1,400
Q1 Q2 Q3 Q4 Q1 Q2 Q3 Q4 Q1 Q2 Q3 Q4 Q1
Thou
sand
s of S
F
Net Absorptions
Deliveries
Under Construction
Miami-Dade Retail Not in Ctrs - Absorptions & Deliveries
Data Source: Costar2012 2013 2014 '15
11