michael s. dinniman john m. klinck center for coastal physical oceanography
DESCRIPTION
Modeling flow over steep topography with strong stratification:. The circulation around Astoria canyon. Michael S. Dinniman John M. Klinck Center for Coastal Physical Oceanography Old Dominion University. Acknowledgements. - PowerPoint PPT PresentationTRANSCRIPT
Michael S. DinnimanJohn M. Klinck
Center for Coastal Physical OceanographyOld Dominion University
Modeling flow over steep topographywith strong stratification:
The circulation around Astoria canyon
Acknowledgements
Much of this work was done in collaboration with Susan Allen at the University of British Columbia and Barbara Hickey at the University of Washington
Hernan Arango at Rutgers University provided us with the Beta 1.0 release of ROMS
The Office of Computing and Communications Services at ODU provided the 64-processor Sun HPC 10000 that the larger simulations were run on
Nancy Kachel at the University of Washington created the digitized version of the NOAA bathymetry charts
CCPO provided computer facilities and support
U.S. National Science Foundation provided financial support
Outline
Astoria Canyon: Bathymetry and Observations Model Description Model Results
– Possible Causes of Discrepancies Conclusions
Introduction
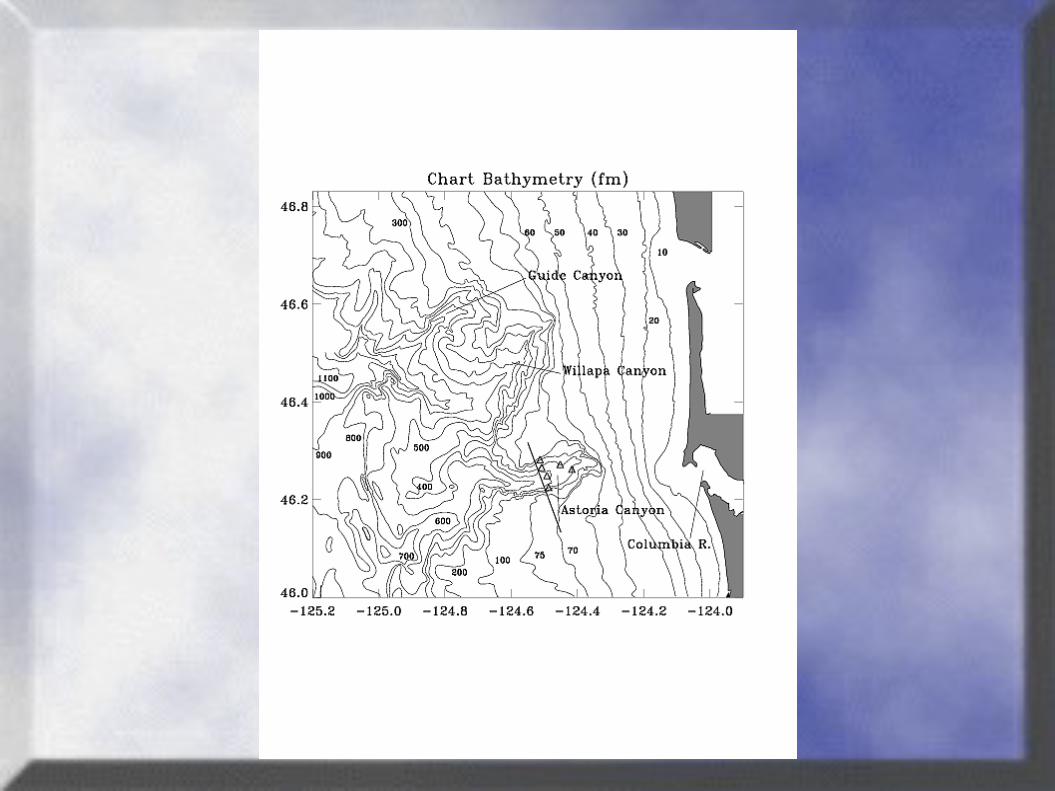
Submarine canyons along continental shelf edges are important topographical features that can have large impacts on coastal processes
These canyons make strong test cases for numerical circulation models due to the combination of steep bathymetry and strong stratification (e.g. Haidvogel and Beckmann, 1998)
Observations in Astoria canyon in summer 1983 (Hickey, 1997) provide a good opportunity for experimentation
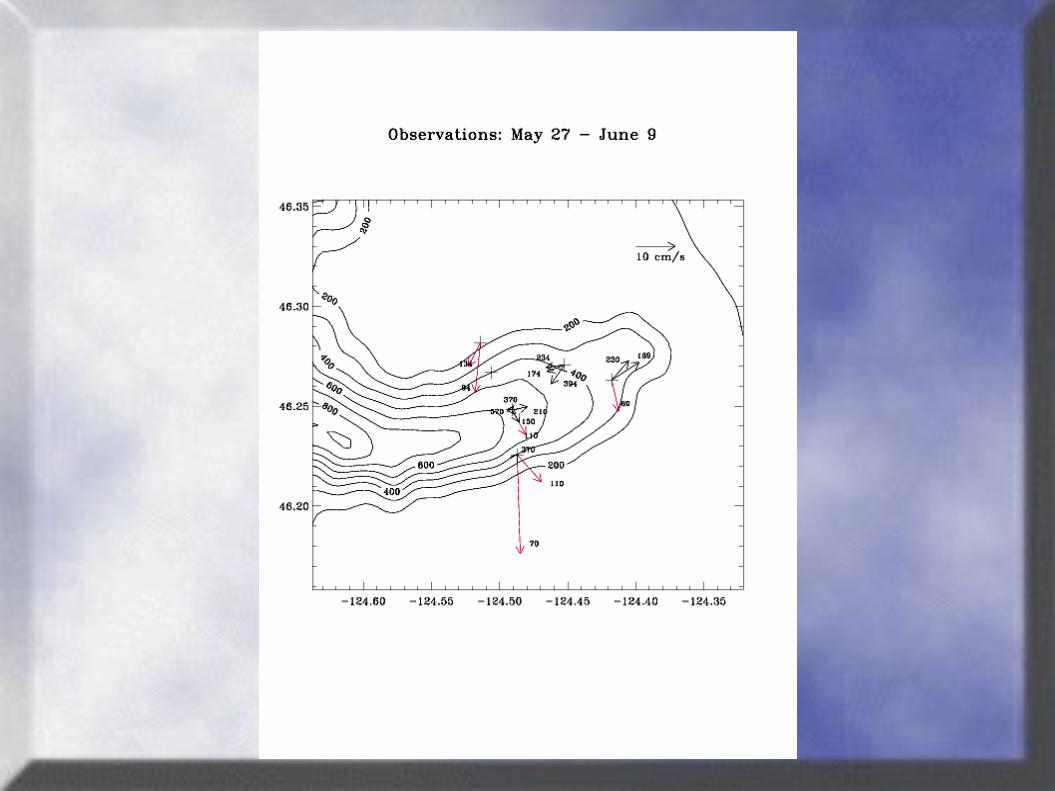
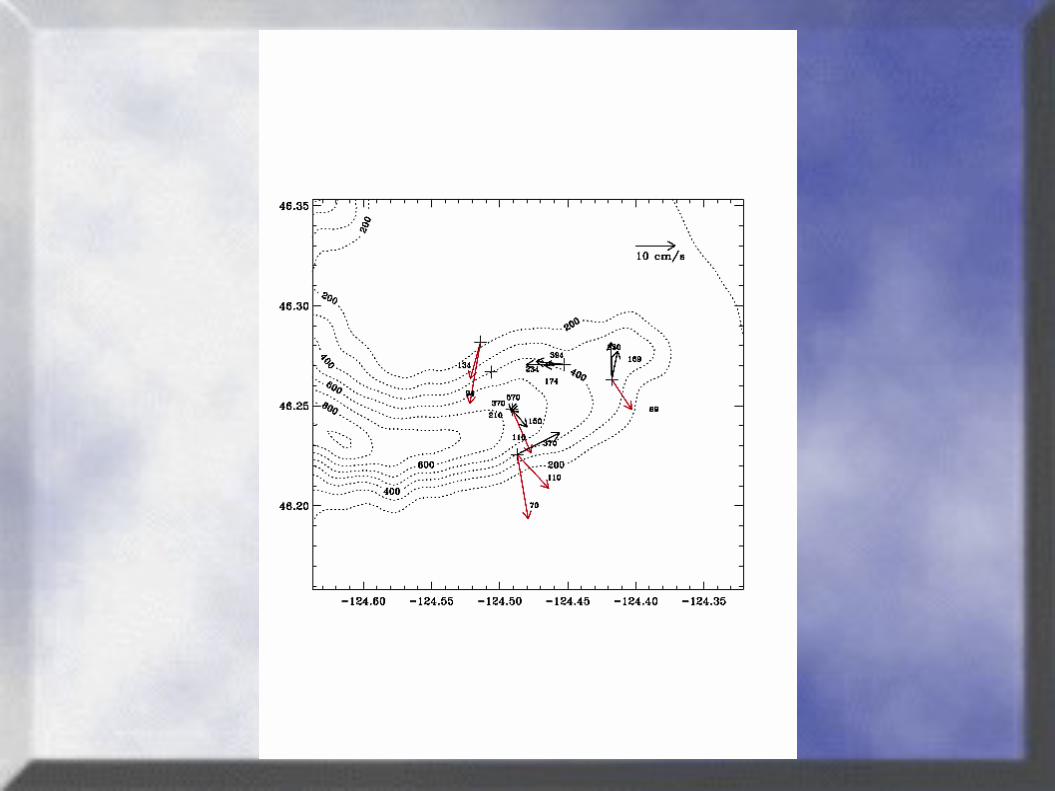
Observations
Mooring array deployed along and across the canyon from May to August 1983
Some moorings were lost and others damaged and prematurely returned: Time series range in duration from two weeks to three months
Current meters on all moorings and the uppermost float a minimum depth of 65m from the surface
Hydrographic data were obtained at the beginning and end of the deployment of the fixed instrument array and consist of several transects of CTD measurements taken across the canyon
Local wind data were not available
Astoria Model Description
Rutgers/UCLA Regional Ocean Model System (ROMS)
– Parallel primitive equation model derived from the serial S-Coordinate Rutgers University Model (SCRUM)
– Free surface and vertical s (terrain-following) coordinate Domain: U.S. West Coast centered on Astoria and Willapa
Canyons; 83km (lon) x 100km (lat)
Resolution: ~ 300m (lon) x 420m (lat) horizontal; 24 depth levels
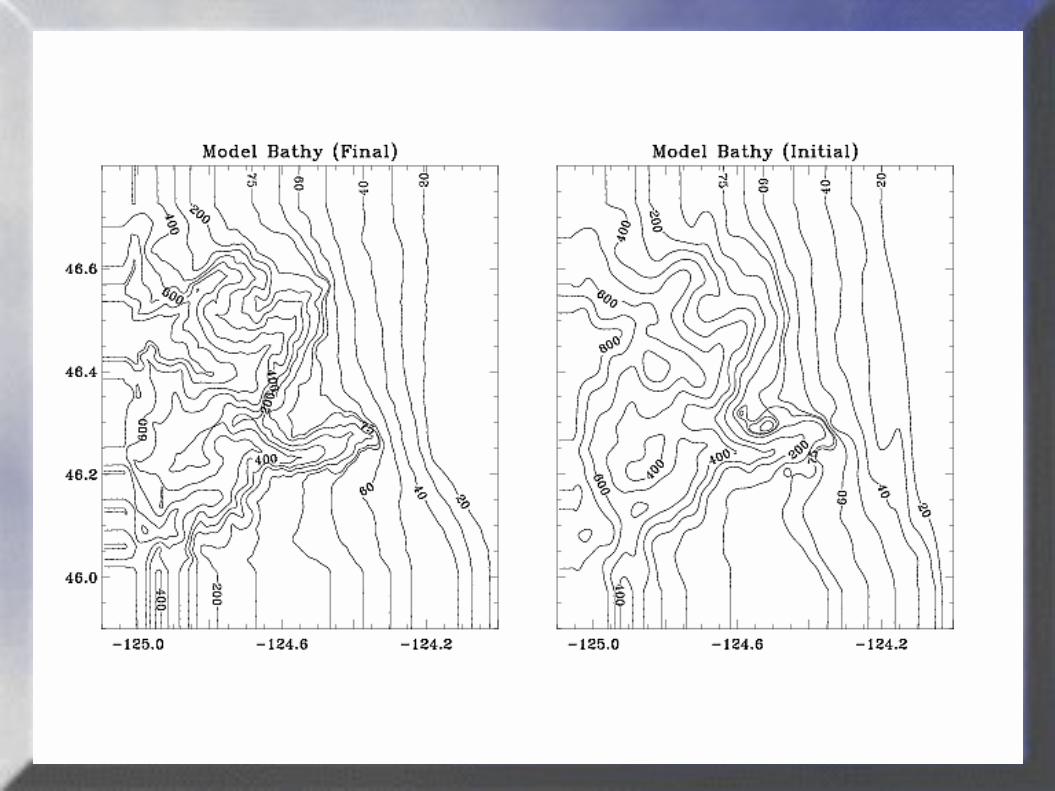
Bathymetry: Gridded field derived from digitized NOAA bathymetry charts
Model Description (cont.)
Initial Stratification: Analytical approximation to a hydrographic section (T and S) obtained near Astoria canyon in May 1983. Full non-linear equation of state used
Laplacian mixing on geopotential surfaces (very weak for momentum) and KPP vertical mixing scheme
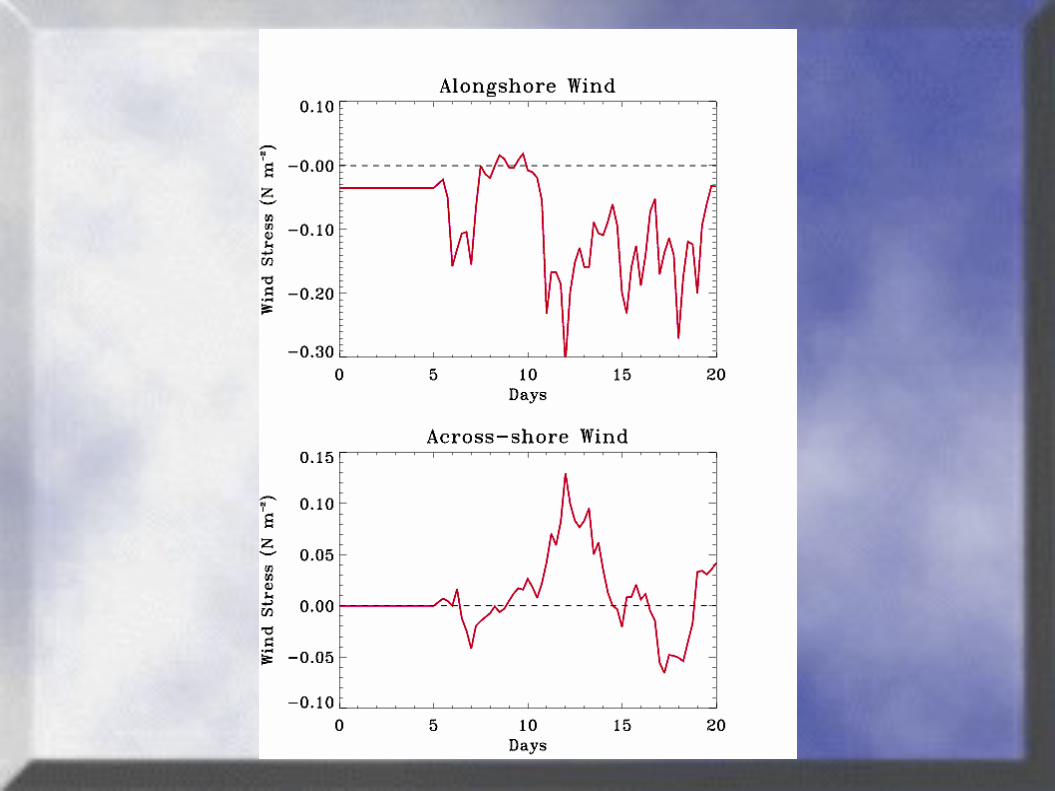
Forcing:
– Wind Stress: Applied as a body force over the top three layers of the model (concentrated towards the surface). Realistic upwelling event from FNMOC wind stress
– Quadratic bottom stress
– Heat and fresh water flux: Set to zero
Model Description (cont.)
Boundary Conditions
– Zero gradient condition for West open boundary; free slip for East closed boundary
– North/South open boundaries: Used "Modified" Orlanski radiation scheme on all quantities (except 2D normal flow)
– 2D normal flow: Separated the barotropic flow into "free" and "forced" components and used the Flather radiation scheme on the free component (e.g. Palma and Matano, 2000).
Pressure Gradient Error: Checked by running simulation with zero wind stress
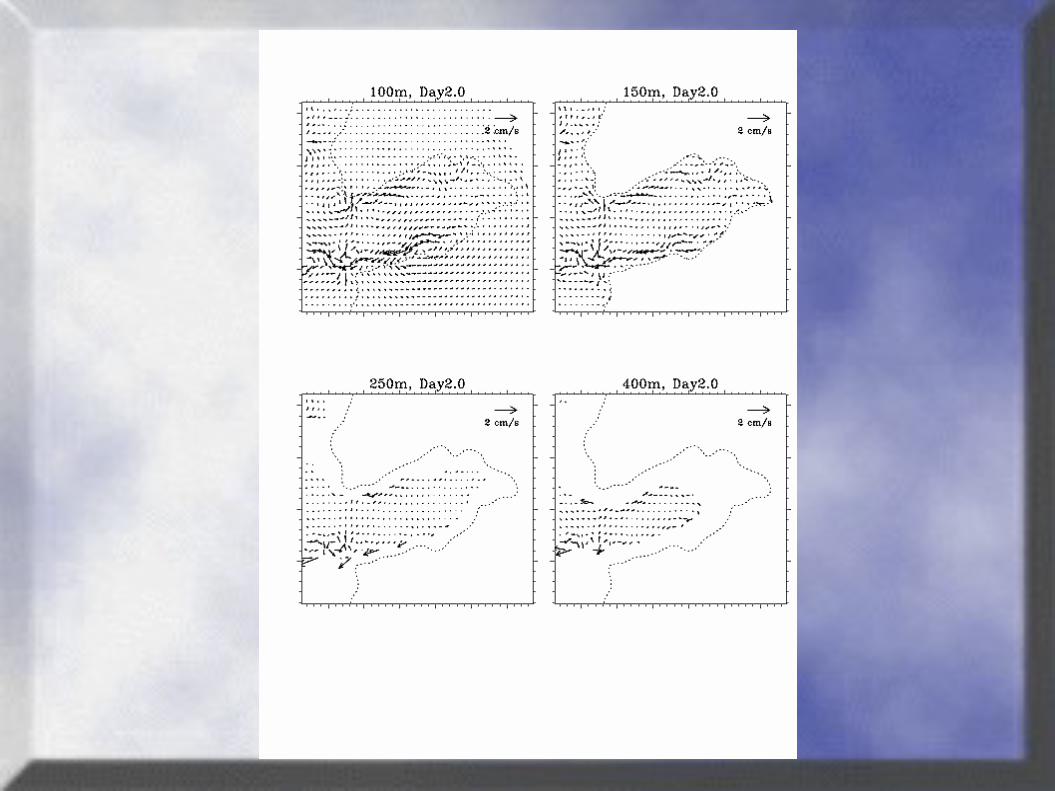
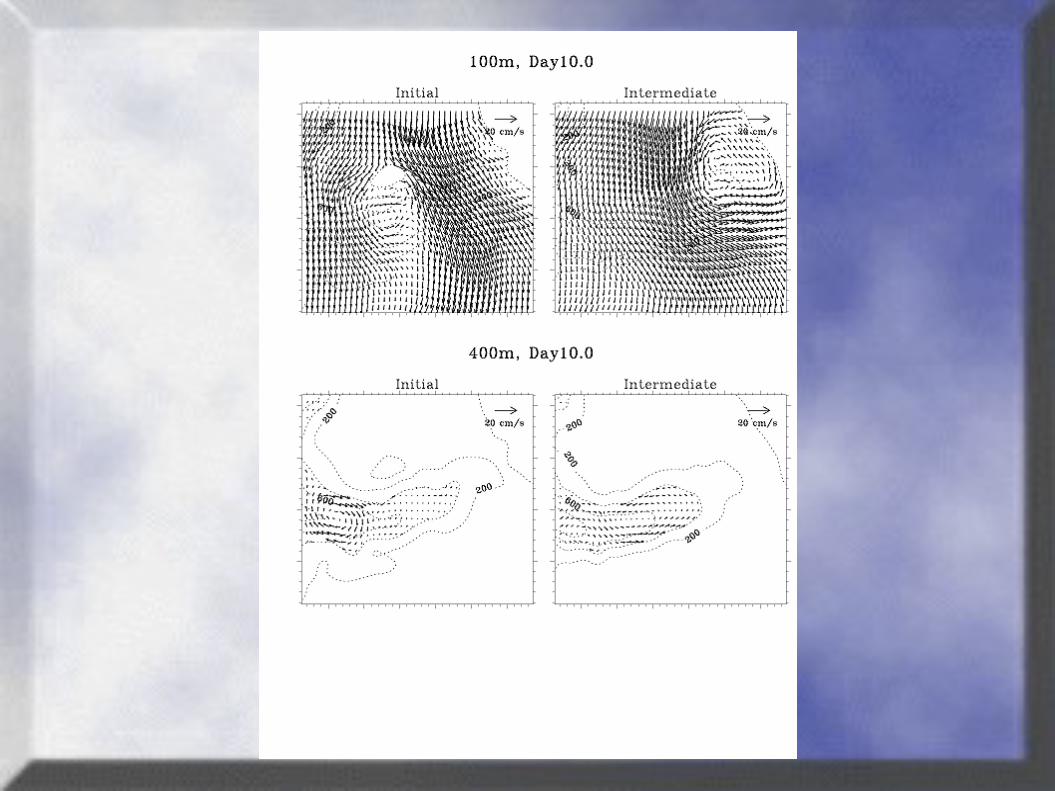
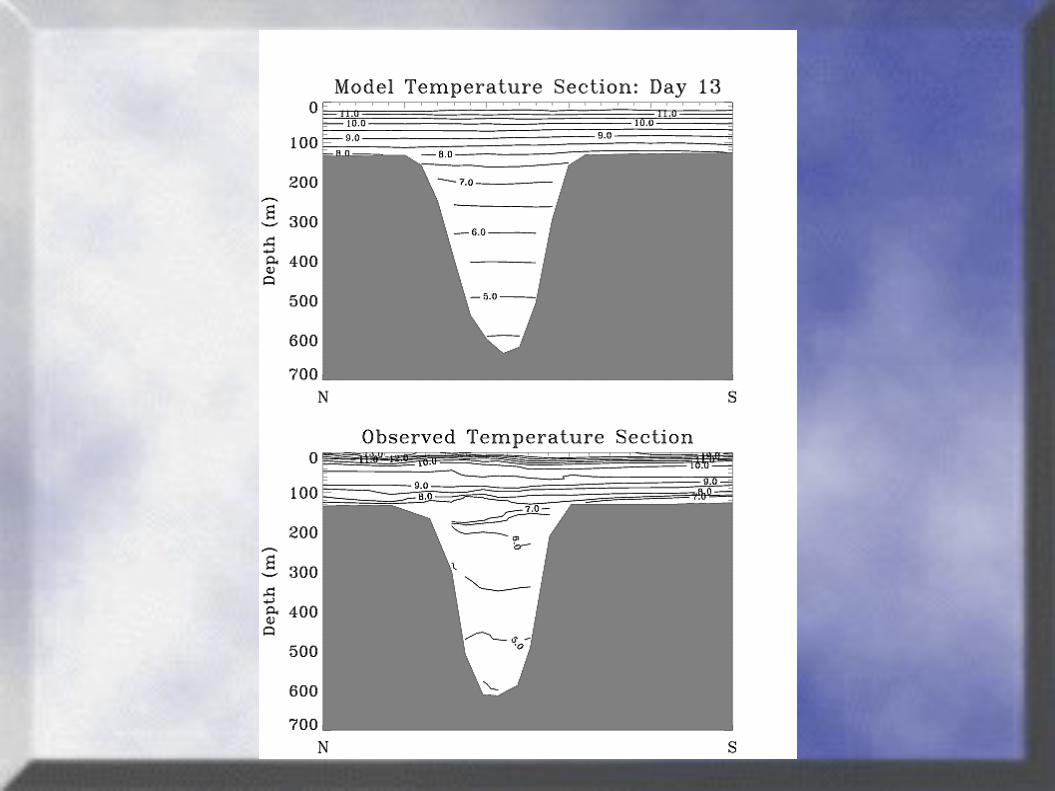
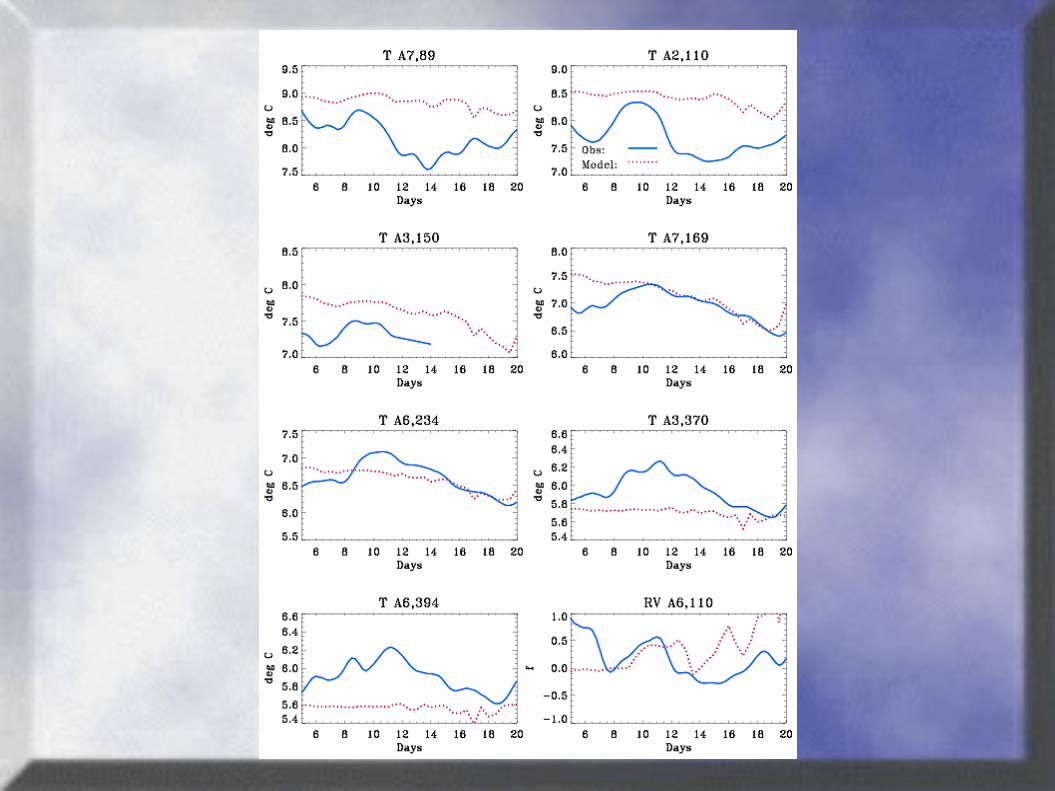
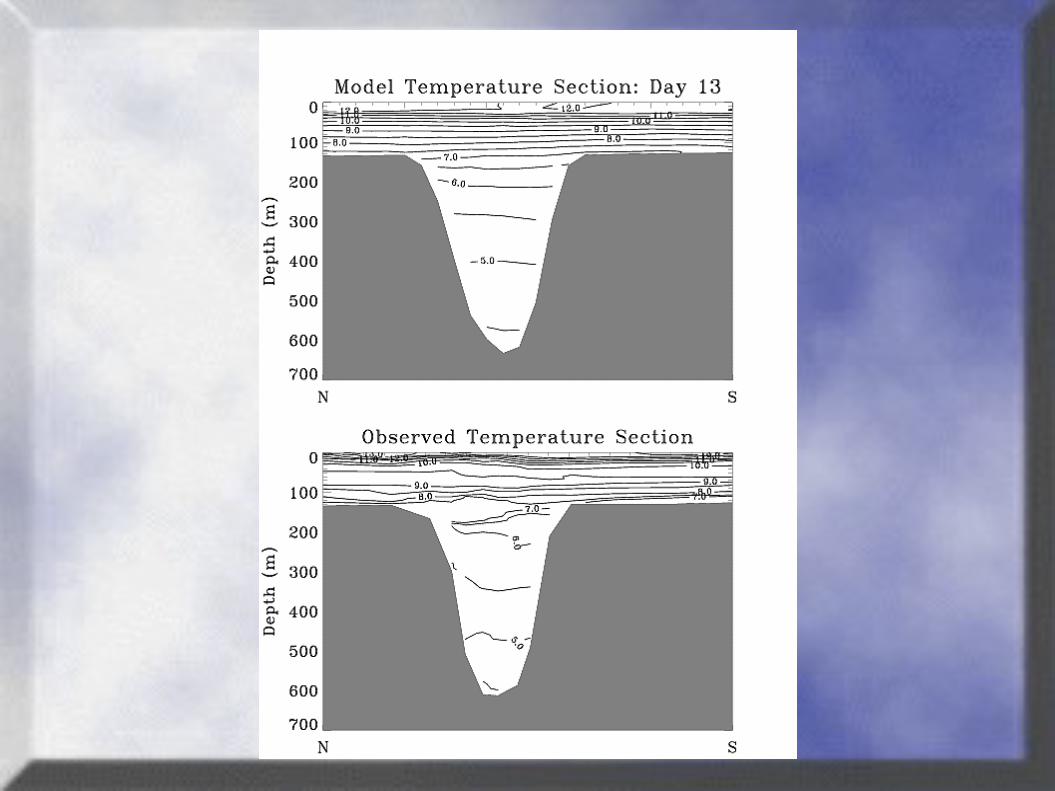
Model Results
Mean horizontal flow reproduces the observations fairly well
Model upwelling does not match the observed upwelling– Too weak and the isopycnals do not relax when the
upwelling winds weaken
Possible Causes of Model Discrepancies
Wind stress problems (curl and magnitude)
Dissipation
Missing undercurrent
Incorrect initial stratification
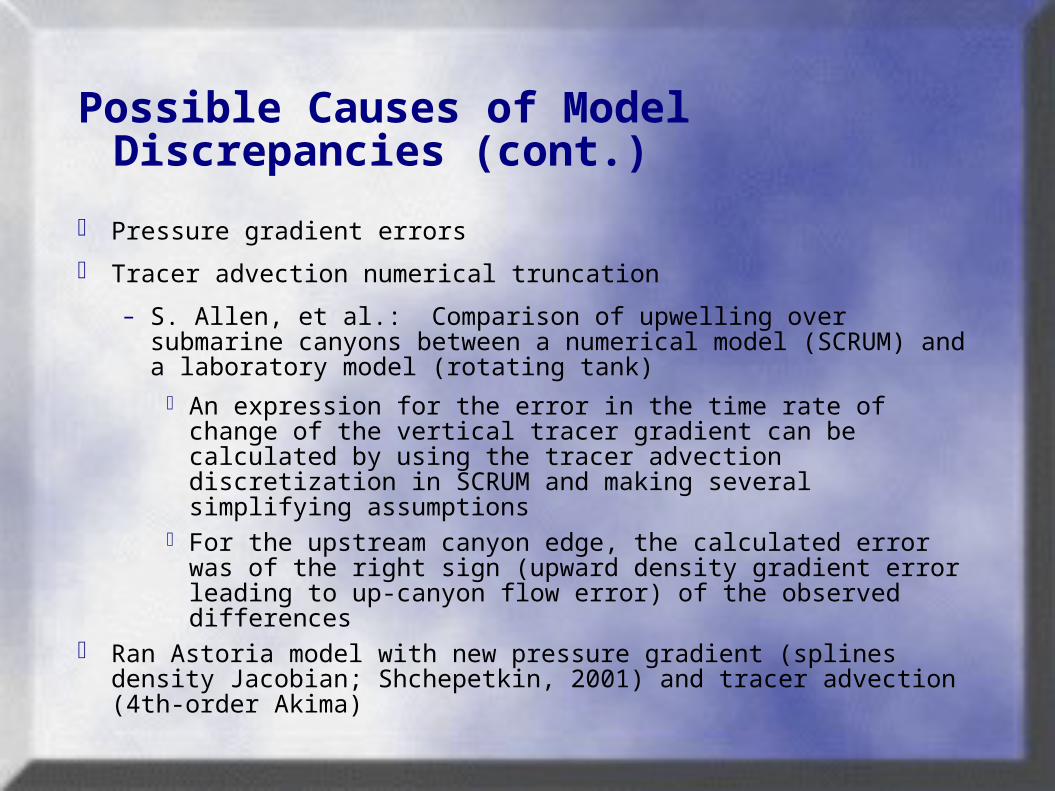
Pressure gradient errors
Tracer advection numerical truncation
– S. Allen, et al.: Comparison of upwelling over submarine canyons between a numerical model (SCRUM) and a laboratory model (rotating tank)
An expression for the error in the time rate of change of the vertical tracer gradient can be calculated by using the tracer advection discretization in SCRUM and making several simplifying assumptions
For the upstream canyon edge, the calculated error was of the right sign (upward density gradient error leading to up-canyon flow error) of the observed differences
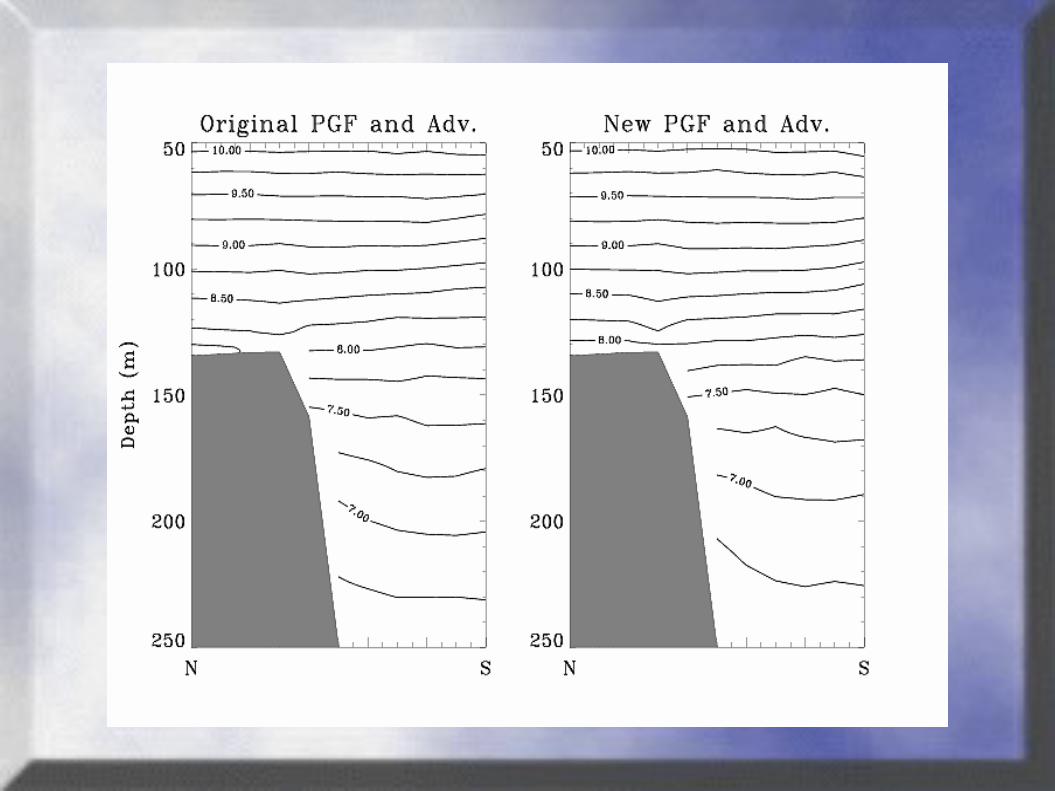
Ran Astoria model with new pressure gradient (splines density Jacobian; Shchepetkin, 2001) and tracer advection (4th-order Akima)
Possible Causes of Model Discrepancies (cont.)
Conclusions
It is important to accurately represent the bathymetry when trying to match observations in areas of steep topography
The mean circulation in the Astoria realistic wind simulation matches the observations moderately well
The model is vertically stiff (isopycnals are relatively immobile) compared to the observations. However, the response can be improved somewhat by modifying the initial stratification and changing numerical pressure gradient and tracer advection schemes
Much work remains to be done on understanding the model / observation differences
Question for the audience: Has anyone else run a fine resolution model and seen a similar stiffness in the isopycnals and, if so, were you able to improve the response?