michigan comprehensive statewide needs...
TRANSCRIPT
MICHIGAN COMPREHENSIVE
STATEWIDE NEEDS ASSESSMENT
MCSNA Committee Members
Leamon Jones, Michigan Commission for the Blind
Debbie Huntley, Michigan Rehabilitation Services
Valarie Barnum-Yarger, Michigan Statewide Independent Living Council
Marlene Malloy, Michigan Rehabilitations Council
Garrett Pazur, Michigan Rehabilitation Services
Carol Bergquist, Michigan Rehabilitations Council
Thomas Jones, Michigan Rehabilitation Services
Carrie Kremsreiter, Michigan Rehabilitation Services
Virginia Thielsen, Project Excellence
Sukyeong Pi, Project Excellence
PPRROOJJEECCTT EEXXCCEELLLLEENNCCEE
MMIICCHHIIGGAANN SSTTAATTEE UUNNIIVVEERRSSIITTYY
i
TABLE OF CONTENTS
Table of Contents i
Introduction ii
Summary Of Key Findings
v
Section I: Michigan Disability Statistics I-1 to I-25
Section II: RSA-911 Data (MRS & MCB) & RSA-704 (MiSILC) II-1 to II-27
Section III: Staff Survey Summary Findings: MRS, MCB, MiSILC & CROs III-1 to III-13
Section IV: Key Informant Interviews: Qualitative Analyses Report IV-1 to IV-17
Section V: Customer Satisfaction with Services (MRS & MiSILC) V-1 to V-13
ii
MICHIGAN COMPREHENSIVE STATEWIDE NEEDS ASSESSMENT
INTRODUCTION
The Rehabilitation Act of 1973, as amended, mandates that state Vocational Rehabilitation (VR)
agencies and State Rehabilitation Councils (SRCs) jointly conduct a Comprehensive Statewide
Needs Assessment (CSNA) every three years. The Rehabilitation Act requires the CSNA to
describe, at a minimum, the rehabilitation needs of individuals with disabilities residing within
the State, particularly the vocational rehabilitation needs of:
Individuals with the most significant disabilities, including their need for supported
employment services
Individuals with disabilities who are minorities
Individuals with disabilities who have been unserved or underserved by the VR programs
Individuals with disabilities served through other components of the statewide workforce
investment system, for example those served by Michigan Works!
In addition, the MCSNA must include an assessment of the need to establish, develop, or
improve community rehabilitation programs within the State.
Interagency Collaborative Planning Committee
In prior years, the Michigan Comprehensive Statewide Needs Assessment (MSCNA) was jointly
conducted by Michigan Department of Energy, Labor and Economic Growth -Michigan
Rehabilitations Services (MRS), Michigan Commission for the Blind (MCB) and the Michigan
Rehabilitation Council (MRC). The data collection, analyses and report focused only on the
vocational rehabilitation needs of Michigan’s residents with disabilities. MRS and MCB are
required to include and address key findings from the triennial MCSNA in their State Plans. In
addition, key findings from the MCSNA are used by MRC to inform their state plans and to
ensure that the vocational rehabilitation needs of Michigan residents are being met.
For the 2011 MSCNA, it was decided that needs assessment data would also be collected and
reported for Michigan Statewide Independent Living Council (MiSILC). The Michigan
Disability Network is composed of 15 federally recognized Centers for Independent Living
(CILs). All 15 centers are private non-profit organizations that are locally controlled. At least
51% the board and staff of each CIL are individuals with disabilities. In addition to the four
basic core services identified within the Rehabilitation Act, each center works within its
respective community to coordinate services and strives to avoid duplication through multi-level
interactions and collaborations.
In accordance with federal regulations 34 CFR364.27 none of the planned services provided
through the State Plan for Independent Living (SPIL) goals and objectives are duplicated with
Special Education Services, Vocational Rehabilitation Services, Developmental Disabilities
Services, Public Health, Community Mental Health, local housing boards or public
transportation services, Veterans Administration programs, Medicare Services, Medicaid
Services, state social services programs or MCB’s Older Blind Program. The emphasis
underscoring all MiSILC activities is to encourage each CIL to serve their catchment areas more
effectively with the funding currently available and to avoid duplication of services as funding
iii
revenues increase. Michigan’s individual CILs do not presently set service priorities. Each
funded center must provide all state and federally mandated services and each center has a
diversity plan to bring it into alignment with its service priorities. Service priorities beyond this
minimum are determined by each community based on local needs, as determined by their board
of directors.
An interagency CSNA committee was formed in June 2010 that included members of each
agency. Project Excellence: A Program Evaluation Partnership (PE) staff provided consultation
services to the committee and was responsible for data collection, analyses and the development
of the draft report. The primary resource used to guide the work of the committee was newly
published (May 2010) RSA VR Needs Assessment Guide. In addition, a comprehensive literature
review was conducted by PE staff, and the committee also reviewed the last two MCSNA reports
and collected and reviewed recent CSNA reports from other state agencies. The committee then
developed the project plan which included the specific project goals, research questions, data
collection methods and a reporting and dissemination plan.
Definitions of Unserved and Underserved
The definitions used to determine if a population of people with disabilities is unserved or
underserved by the public vocational rehabilitation (VR) agencies are:
Unserved – any category of individuals with disabilities (of working age, interested in
working) in the state’s population that are not receiving VR services from MCB/MRS.
Underserved – the percentage of those served by MCB/MRS is less than the percentage
of the group in the general population.
The definitions used to determine if a population of people with disabilities is unserved or
underserved by the Centers for Independent Living (CILs) in Michigan are:
Unserved – any category of individuals with disabilities in the state’s population that are
not receiving IL services.
Underserved – the percentage of people with disabilities served by CILs is less than the
percentage of the group in the general population.
MCSNA Goals for 2011
In addition to the federally mandated requirements stated above for the vocational rehabilitation
programs, the MCSNA specific goals for this year included the identification of:
the potential unmet service needs of older Michigan residents who are blind or have low
vision
the potential unmet needs of transition age youth and
the independent living needs of Michigan residents.
iv
Data Collection and Reporting Methods
Early in the discussions, the committee recognized that a significant limitation of the prior
MCSNA projects was that the information was collected and reported only at the state level and
therefore had limited use at the local level. In addition, because the national population survey
data collected self-reported disability specific data based on a limited number of functional
limitations (e.g., the American Community Survey), it was difficult to identify specific groups by
disability, race/ethnicity and location in the state that were potentially unserved or underserved.
The third limitation was that data collected at the state level did not address the adequacy or
sufficiency of the vocational rehabilitation or independent living needs of people with disabilities
at the local level. As a result, the information about these populations was largely anecdotal.
Finally, the committee determined that there was a need to develop a system to track changes in
service needs at the local level over time.
In order to address these issues, the committee decided to revise the data collection and reporting
methods for the 2011 project. The RSA VR Needs Assessment Guide provided examples of a
wide array of methods for collecting and reporting CSNA data. The committee used the Guide to
revise the CSNA protocol to address both the federally mandated requirements for a CSNA as
well as the district/regional need to collect and track the service needs people with disabilities at
the district local level. It was decided that the revised protocol would include both quantitative
and qualitative data collection methods and that a ‘rolling’ data collection and reporting process
would be used.
This report includes the state level data collected to meet the federally required mandates and to
inform the state plans of the four collaborating organizations. The specific data collection
methods used included a review of extant data (e.g., RSA 911 data, American Community
Survey data, Special Education data, etc.), Key Informant interviews, and a series of surveys
conducted with MRS, MCB and MiSILC staff as well as the directors of MARO member
community rehabilitation Organizations. In addition, electronic surveys were developed to
collect needs assessment information from Michigan residents with disabilities and family and
friends of people with disabilities. In FY 2012, targeted focus groups of Michigan residents with
disabilities that have been identified as potentially underserved populations will be conducted
throughout the state. In addition, a needs assessment report will be developed for each
geographical district/region in Michigan.
Report layout
There are a total of six sections in the report. The first section, the Summary of Key Findings,
prioritizes the needs of Michigan residents with disabilities based on the data collected, analyzed
and reported in the remaining five sections. Each section of the report was designed to be a
standalone document that can be disseminated as appropriate.
v
SUMMARY OF KEY FINDINGS
With the inclusion of MiSILC in the Michigan Comprehensive Statewide Needs Assessment
(MSNCA) process this year, the scope of information and data collected about the needs of
Michigan residents with disabilities was extended beyond the vocational rehabilitation related
needs of Michigan residents with disabilities to include the independent living and community
based needs of people with disabilities. Although this added information does provide a more
comprehensive picture of the needs of Michigan’s residents with disabilities, it also illustrates
that the needs are extensive, multifaceted and complex. In addition, as illustrated in the Key
Informant Interview section of this report, people have a wide variety of opinions about the
needs of Michigan residents with disabilities and how those needs should be addressed, based on
their personal and professional perspectives. In order to prioritize possible unserved and
underserved populations and unmet needs, Project Excellence completed a cross-walk of all data
to identify the populations and needs that were most frequently cited.
Unserved Populations
Based on analyses the American Community Survey (ACS) report, IDEA data (Section I), RSA
911 data for MRS and MCB (Section II), and Key Informant interview findings (Section IV)
there are no categories of people with disabilities that are not receiving VR services by MRS or
MCB in Michigan.
MiSILC Data and Recommendations:
In relation to CIL services, there are 16 counties that are not formally affiliated with a CIL. The
16 counties which compose the catchment area are not a part of any federally recognized service
area and are not being served with Part C funds although they are tentatively associated with a
CIL. MiSILC’s data indicated that only about 22% of Michigan’s total residents are in areas the
CILs have the capacity to serve, 37% are in areas that are under served and 41% in areas that are
classified as unserved.
Recommendations:
Continuation of the IL strategic alliance initiative (between, MRS, MRC, SILC, CILs).
This collaborative is working to transform service delivery systems into a holistic
approach for the employment and independence of individuals with disabilities served by
MRS.
Continued inclusion of mandated partners with everyone being seen as equal regardless
of size or funding involved. All voices are equal; value honesty, integrity and respect.
Continued usage and possible expansion of the CIL networks CFAL system. Need to
assure consistent compressive state wide data.
SILC and the CIL’s need to fully operationalize a statewide consumer satisfaction survey
system which meets local CIL and SILC statewide needs.
vi
Underserved Populations with Severe Disabilities
Michigan Residents with Mental Illness
Michigan adult residents with mental illness who need mental health services and supported
employment services were the number one population identified to be underserved across
multiple data collection methods at both the state and local levels. Although the proportion of
Michigan residents with mental illness served by MRS has remained relatively stable over the
last three years, Key Informants and agency staff (MRS, MCB and CIL) reported that the
availability of services from Community Mental Health (CMH) has continued to diminish across
the state over the last five years. The primary issue identified was the on-going reduction in
CMH funding over the last five years as Michigan continues to struggle with a failing economy
and high unemployment. As a result, it was reported that CMH does not have the resources
necessary to provide mental health services and/or supported employment services to individuals
with severe diagnoses unless the person presents as a risk to self or others. In addition, MRS staff
(48.7%), MCB staff (45.5%) and CIL staff (44.7%) indicated that ‘Affordable Mental Health
Services’ in their service areas were unavailable and/or insufficient to meet the needs of people
with disabilities in their communities.
Recommendations:
Although MRS, MCB and CILS do not provide mental health services directly to consumers, the
availability, or lack thereof, of these essential supportive mental health services impacts the
ability of a customer with a significant mental health disability to secure and maintain
employment and maintain a safe, independent living environment.
MRS, MCB, MRC and MiSILC need to advocate at the state level on behalf of
Michigan’s residents with mental illness and the Michigan Department of Community
Health for increased funding for mental health services.
In order to increase the availability of supported employment (SE) services for this
population, MRS and MCB may need to increase and/or develop alternative SE service
options at the local level via contracts with Community Rehabilitation Programs (CRPs).
Autism Spectrum Disorder (ASD)
Youth with ASD are the primary emerging population that both Key Informants and MRS and
CIL staff indicated are either currently or soon will be an underserved population. Although the
number of youth with ASD applying for MRS services has been slowly but steadily increasing,
the 2009 IDEA data indicates that adult agencies should be prepared for those numbers to begin
to drastically increase annually over the course of the next three years as higher numbers of
students begin to reach age 14 to 16. Concern was expressed at all levels about the job readiness
preparation this group will have as they exit school, the preparedness of the adult vocational
rehabilitation agency staff to provide services to this population and the availability of supported
employment services for this population.
Although the IDEA data indicates that the number of students with autism is increasing annually,
it does not does not provide information about level of severity. There are, however, two data
findings that can be cautiously viewed as possible indicators of the post-secondary needs of this
vii
population. First, approximately 82% of students diagnosed with autism graduate from high
school with a diploma. This suggests that many of these students may have the capacity to
complete post-secondary training or secure employment following high school. The second
indicator is that the data shows there has been in a slow but steady increase in the number of
students with autism continuing to receive special education services after their peers have
graduated. In 2004, there were 219 students with autism age 20 or older still in school as
compared to 585 students in the same age bracket in 2009. This finding suggests that these
students may require more intensive adult services, including supported employment services,
than their peers who graduated with a high school diploma prior to age 20.
Recommendations:
Training programs should be developed for MRS, MCB and CIL staff to ensure that they
have the knowledge and skills necessary to provide appropriate and effective vocational
rehabilitation and independent living services for transition age youth and young adults
with Autism Spectrum Disorder.
MRS, MCB, MRC and MiSILC need to advocate at the state level on the behalf of
Michigan’s students with ASD and the Michigan Department of Community Health for
increased funding for supported employment services for this population.
Given the high graduation rate for this population, there is a strong possibility that the
primary services needed may be in the areas of career exploration services such as job
shadowing experiences, job related ‘soft skills’ (e.g., social skills and work readiness)
and independent living skills. MRS, MCB and MiSILC should work collaboratively to
ensure that CILs and/or CRPs at the local level have the necessary programs specifically
designed to meet the unique needs of this population.
Minority Residents with Disabilities
Three minority populations were identified by multiple quantitative and/or qualitative data as
being underserved by MRS in relation to their proportion in the population: Hispanic/Latino
residents specifically in the mid- and southwestern section of Michigan; Native Americans in the
Upper Peninsula and Northern Michigan; and Asian or Pacific Islanders specifically Arab and
Arab Americans and Hmong residents in southeastern part of the state. As illustrated in Section
II, African American residents apply for MRS services at higher rates than their proportion in the
population, but are statistically less likely to be determined eligible for services. White and Asian
customers are statistically more likely to close with an employment outcome while Native
Americans were least likely to have a successful outcome.
In comparison to the 2008 American Community Survey[1]
report (21% of Michigan residents
with disabilities as being African American), African Americans are not considered underserved
in MRS (28%). As for Hispanic/Latino as an ethnicity group, 2.8% of MRS closed cases in 2009
were Hispanic/Latino (2.5% in 2008; 2.4% in 2007). Compared to the 2008 ACS report (3% of
[1]
Erickson, W., Lee, C., & von Schrader, S. (2010). 2008 Disability Status Report: Michigan. Ithaca, NY: Cornell
University Rehabilitation Research and Training Center on Disability Demographics and Statistics. Retrieved from
http://www.ilr.cornell.edu/edi/disabilitystatistics/StatusReports/2008-PDF/2008-
StatusReport_SD.pdf?CFID=1990386&CFTOKEN=22939085&jsessionid=f03085526e78790
a762c2c6d52362e3c1a74.
viii
Hispanic/Latino), this ethnic group appears to be underserved, but the magnitude is minimal and
the proportion of Hispanic/Latino MRS customers has been increasing each year. Asian/Asian
Americans, however, appeared somewhat underserved (0.6%) by MRS when compared to the
ACS report (0.9%). Despite a very small difference in percentage points (0.3%), this finding
represents a 30% difference in the proportion of customers served compared to their proportion
in the population (0.3% / 0.9%). Furthermore, it is noteworthy that Michigan has the second
largest Hmong and Arab/Arab American populations in the country. Although the self-reported
disability rate (4.3%) for Asian/Asian Americans is the lowest rate among all the racial/ethnic
groups, there is a strong possibility that due to cultural attitudes about disability, this may be an
artificially low estimate.
Recommendations:
The current outreach and service delivery models MRS has in place to increase the
number of Hispanic/Latino residents that are served by MRS appear to be having a
positive impact and should continue.
Community outreach programs designed to meet the specific needs of Hmong and
Arab/Arab Americans with disabilities should be developed and/or enhanced by MRS,
MCB and local CILs.
o Outreach materials should be available in local offices and on-line in both Arabic
and Hmong.
o Community leaders should be approached to provide staff training about the Arab
and Hmong cultures and how disability is perceived within each culture.
o A list of translators that are trusted by each community should be developed and
shared by all agencies.
o MRC may want to consider recruiting Hmong and Arab/Arab Americans with
disabilities for the MRC board.
Because the race/ethnicity data fields in the AWARE case management system mirror
those required by RSA, there is currently no way to identify specific the service rates for
specific race ethnicity groups such as Hmong or Arab/Arab American customers. It is
recommended that the modification of the race/ethnicity categories to be more
representative of Michigan’s diverse population be given top priority on the list for future
revisions to AWARE.
Since the number of some minority groups served by MCB was so small, statistical analysis
could not be conducted, however, it can be said that African American customers appear to be
underserved as compared to White customers. In addition, both key informants and staff survey
qualitative data indicated that Native Americans are also an underserved population. Similarly,
because of the issues some CILs experienced when converting to the new data collection and
reporting software, Project Excellence is unable to determine if there are any racial or ethnic
minority groups unserved or underserved by CILs in Michigan.
ix
Recommendations:
MCB should increase and/or modify current outreach efforts in urban areas to ensure that
African American residents who are blind or have low vision are aware of the range and
availability of the services provided by MCB.
In order to improve outreach and services to Native Americans who are blind or have low
vision, MCB should work collaboratively with tribal leaders to identify the specific needs
and a service delivery model to address the needs on or near the reservations in Northern
Michigan and the Upper Peninsula.
MiSILC should work with the local CILs to identify underserved populations and to
develop outreach plans and service models to meet the unique needs of each community.
Age Related Underserved Population
Older Michigan Residents who are Blind or have Low Vision and VR Services
There has been a slow but notable decrease in the proportion of older customers receiving
vocational rehabiliation services from MCB during the past three years (5.3% in 2009; 6.0% in
2008; 11.3% in 2007). The need for improved services for this population was also identified in
the Key Informant and staff survey qualitative data. These combined findings suggest that older
blind and low vision customers are an underserved population at MCB.
Recommendation:
MCB need to increase outreach efforts to older Michigan residents who are blind or have
low vision. These efforts could include providing medical doctors, ophthalmologists who
specialize in low vision and gerontologists with information and brochures.
Older Michigan Residents with Physical Disabilities and CIL
According to the 2009 ACS data, 36.9% of all non-institutionalized people with disabilities in
Michigan are age 65 and older. CIL staff identified senior citizens transitioning home from
nursing homes and those with physical disabilities as an emerging population as the baby boomer
generation hits retirement age. They reported an increased demand from seniors for personal
attendant services, income, housing, and training in the use of assistive technology.
Recommendation:
CILs need to increase outreach efforts to older Michigan residents who may not be aware
of the services available at and provided by CILs. These efforts could include providing
medical doctors, gerontologists, hospital social workers and case managers and nursing
home administrators with information and brochures about the services available to older
Michigan residents with disabilities.
Transition Youth
A considerable number of MRS and CIL staff and several Key Informants identified transition
age youth with severe disabilities as a potentially (re)emerging underserved population. Staff
x
indicated a great deal of concern in terms of how the newly implemented Michigan Merit
Curriculum will impact the graduation rates, dropout rates and the employability of all students
with disabilities.
Recommendation:
Because this is the first year of implementation, there is no data to indicate the impact of
the Michigan Merit Curriculum (MMC) will have on the graduation rates of Michigan
students with disabilities. It is recommended that each agency use this year as a baseline
to determine potential impact the MMC has on the number of students referred for
services with a Certificate of Completion, what effect the change in graduation
requirements has on the employability of these students and the types of services these
students need to secure employment and/or attend a community college or post-
secondary vocational training program.
Service Needs of Michigan Citizens with Disabilities
Staff from MRS, MCB, and CILs responded to questions about the availability and sufficiency of
45 services for persons with disabilities in their service area. Directors (or their designees) of
MARO member Community Rehabilitation Organizations were asked to assess the availability
and sufficiency of 10 community based services and report whether or not their agency provided
any of the remaining 35 remaining vocational and other services. Data were organized for each
service so that we could determine the proportion of respondents from each organization who
indicated that a service was ‘Available and Sufficient’ or ‘Not Available and/or Not Sufficient.’
For the purposes of this report a criterion of 30% of the staff reporting that the service was ‘Not
Available and/or Not Sufficient’ indicated a statewide need.
Services Provided by Community Rehabilitation Organizations (CRO)
The majority MRS, MCB and CIL staff reported that most vocational rehabilitation related
services provided by CROs and other vendors were at least somewhat available and sufficient.
Over 30% of MCB and CIL staff indicated that there was a need for on the job supports and post
employment services in the areas they provide services. These findings are consistent with the
services the CRO survey participants identified that they do or don’t provide.
Recommendation:
Because, as reported in the 2008 MSCNA report, 85% of the CROs in Michigan provide
services in a limited geographical area, findings at the state level have little
generalizability at the local level. For this reason, the 2011 MSCNA committee decided
that the CRO related service needs data collected in 2011 will be analyzed and reported
for each geographic region/district in 2012.
Services Provided by Other Workforce Investment Act (WIA) System
Interestingly, there were no comments or recommendations from Key Informants, MRS, MCB,
and CIL staff or CRO directors about services provided to people with disabilities by Michigan
xi
Works! The extant data (i.e., WIA State Annual Report, Wagner-Peyser Act data) indicated that
non vocational rehabilitation WIA related programs (e.g., Michigan Works!) are providing
services to a very limited population of people with disabilities in Michigan. This finding may
indicate that people with disabilities are not disclosing their disability status to Michigan Works!
when they are applying for services and/or that Michigan Works is underserving Michigan
residents with disabilities.
Recommendation:
It is recommended that MRS continue to be a visible and available resource to
Michigan’s residents with disabilities by continuing to have an MRS counselor assigned
to each MI Works! office.
Community Based Service Needs
The staff member responses from all three agencies indicated that the greatest unmet needs for
people with disabilities across the state are community-based services (e.g., affordable mental
health services, affordable medical care, affordable legal services, and language translators) that
are not provided directly by the responding organizations. These services, however, are critical in
light of the differentially high rate of poverty felt in the disability community.
Recommendation:
CIL, MRC, MCB and MRS staff need to continue their advocacy efforts, at both the state
and local levels, to increase access for people with disabilities to affordable, accessible
community based services
Interagency Communication at the Local Level
We observed a pattern of responses from staff regarding service availability and sufficiency that
seemed to indicate a differential awareness of the services provided by the other organizations
surveyed. For example, staff from MCB rated the need for services for persons who are blind or
have low vision as ‘available and sufficient’ at a much higher rate than staff from MRS and the
CILs. Also, CIL staff rated independent living services as ‘Available and Sufficient’ at a higher
rate than MRS and MCB staff. While these differences may be considered local phenomena, an
alternate explanation might be that staff are unaware of services that are provided by or familiar
to the staff of other organizations.
Recommendation:
It may be beneficial to reinstate opportunities for staff from MRS, MCB and CILs to
meet to at least annually to share information about the services each agency provides as
well as information about services provided by other agencies in their service areas.
Customer Satisfaction
The overall customer satisfaction rates for MRS customers (80.6%) in 2009 and for CIL
consumers (80%) in 2010 indicate that the majority of customers served by these agencies were
satisfied or very satisfied with the services they received.
xii
CONCLUSION
For the 2011 MCSNA, MRS, MCB, MRC and MiSILC worked collaboratively to identify the
vocational rehabilitation, independent living and community based needs of Michigan residents
with disabilities. Data were collected and analyses were conducted on quantitative and
qualitative information gathered from extant data sources, staff surveys, and Key Informant
interviews with the intent to identify populations of persons with disabilities that are unserved or
underserved in Michigan, as well as services that are not available and/or not sufficient to meet
the needs of residents. According to the CSNA definition, there are no groups of persons
considered to be unserved. A few populations were identified as underserved, including: adults
with mental illness, individuals with Autism Spectrum Disorder, individuals from specified
racial and ethnic communities, older Blind individuals, older residents with physical disabilities,
and transition youth. Services that are not available and/or not sufficient were highlighted,
particularly in the area of affordable and accessible community based services.
Recommendations have been provided for all four participating organizations.
STATEWIDE COMPREHENSIVE
NEEDS ASSESSMENT
SECTION I
MICHIGAN DISABILITY STATISTICS
PPRROOJJEECCTT EEXXCCEELLLLEENNCCEE
MMIICCHHIIGGAANN SSTTAATTEE UUNNIIVVEERRSSIITTYY
I-1
TABLE OF CONTENTS
Table of Contents I-1
National Household Surveys I-2
American Community Survey (ACS) I-2
Survey of Income and Program Participation (SIPP) I-7
Behavioral Risk Factors Surveillance Survey (BRFSS) I-11
Current Population Survey (CPS) I-13
Social Security Administration Programs I-16
Social Security Income (SSI) I-16
Social Security Disability Insurance (SSDI) I-17
Special Education I-18
Transition Youth under IDEA-Part B I-18
Transition Youth under Section 504 I-20
Employment Services (1): Workforce Investment System I-21
Employment Services (2): State-Federal Vocational Rehabilitation Services I-24
I-2
MICHIGAN DISABILITY STATISTICS
National Household Surveys
American Community Survey (ACS)
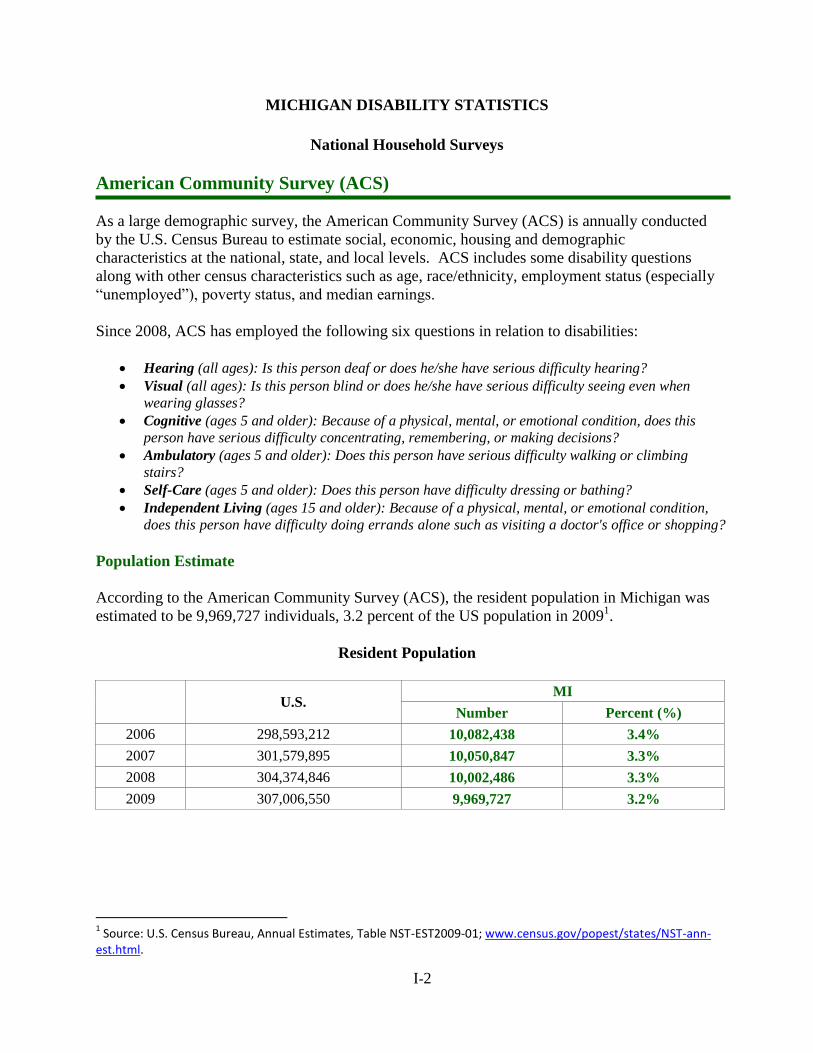
As a large demographic survey, the American Community Survey (ACS) is annually conducted
by the U.S. Census Bureau to estimate social, economic, housing and demographic
characteristics at the national, state, and local levels. ACS includes some disability questions
along with other census characteristics such as age, race/ethnicity, employment status (especially
―unemployed‖), poverty status, and median earnings.
Since 2008, ACS has employed the following six questions in relation to disabilities:
Hearing (all ages): Is this person deaf or does he/she have serious difficulty hearing?
Visual (all ages): Is this person blind or does he/she have serious difficulty seeing even when
wearing glasses?
Cognitive (ages 5 and older): Because of a physical, mental, or emotional condition, does this
person have serious difficulty concentrating, remembering, or making decisions?
Ambulatory (ages 5 and older): Does this person have serious difficulty walking or climbing
stairs?
Self-Care (ages 5 and older): Does this person have difficulty dressing or bathing?
Independent Living (ages 15 and older): Because of a physical, mental, or emotional condition,
does this person have difficulty doing errands alone such as visiting a doctor's office or shopping?
Population Estimate
According to the American Community Survey (ACS), the resident population in Michigan was
estimated to be 9,969,727 individuals, 3.2 percent of the US population in 20091.
Resident Population
U.S.
MI
Number Percent (%)
2006 298,593,212 10,082,438 3.4%
2007 301,579,895 10,050,847 3.3%
2008 304,374,846 10,002,486 3.3%
2009 307,006,550 9,969,727 3.2%
1 Source: U.S. Census Bureau, Annual Estimates, Table NST-EST2009-01; www.census.gov/popest/states/NST-ann-
est.html.
I-3
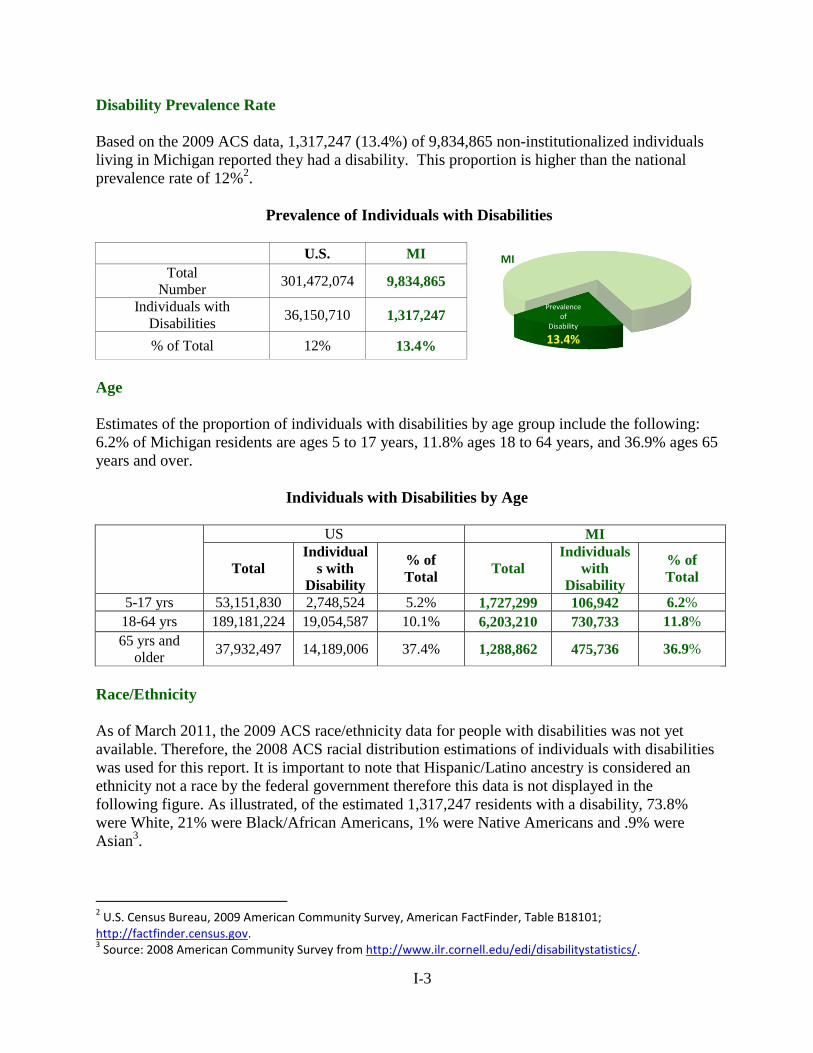
Disability Prevalence Rate
Based on the 2009 ACS data, 1,317,247 (13.4%) of 9,834,865 non-institutionalized individuals
living in Michigan reported they had a disability. This proportion is higher than the national
prevalence rate of 12%2.
Prevalence of Individuals with Disabilities
U.S. MI
Total
Number 301,472,074 9,834,865
Individuals with
Disabilities 36,150,710 1,317,247
% of Total 12% 13.4%
Age
Estimates of the proportion of individuals with disabilities by age group include the following:
6.2% of Michigan residents are ages 5 to 17 years, 11.8% ages 18 to 64 years, and 36.9% ages 65
years and over.
Individuals with Disabilities by Age
US MI
Total
Individual
s with
Disability
% of
Total Total
Individuals
with
Disability
% of
Total
5-17 yrs 53,151,830 2,748,524 5.2% 1,727,299 106,942 6.2%
18-64 yrs 189,181,224 19,054,587 10.1% 6,203,210 730,733 11.8%
65 yrs and
older 37,932,497 14,189,006 37.4% 1,288,862 475,736 36.9%
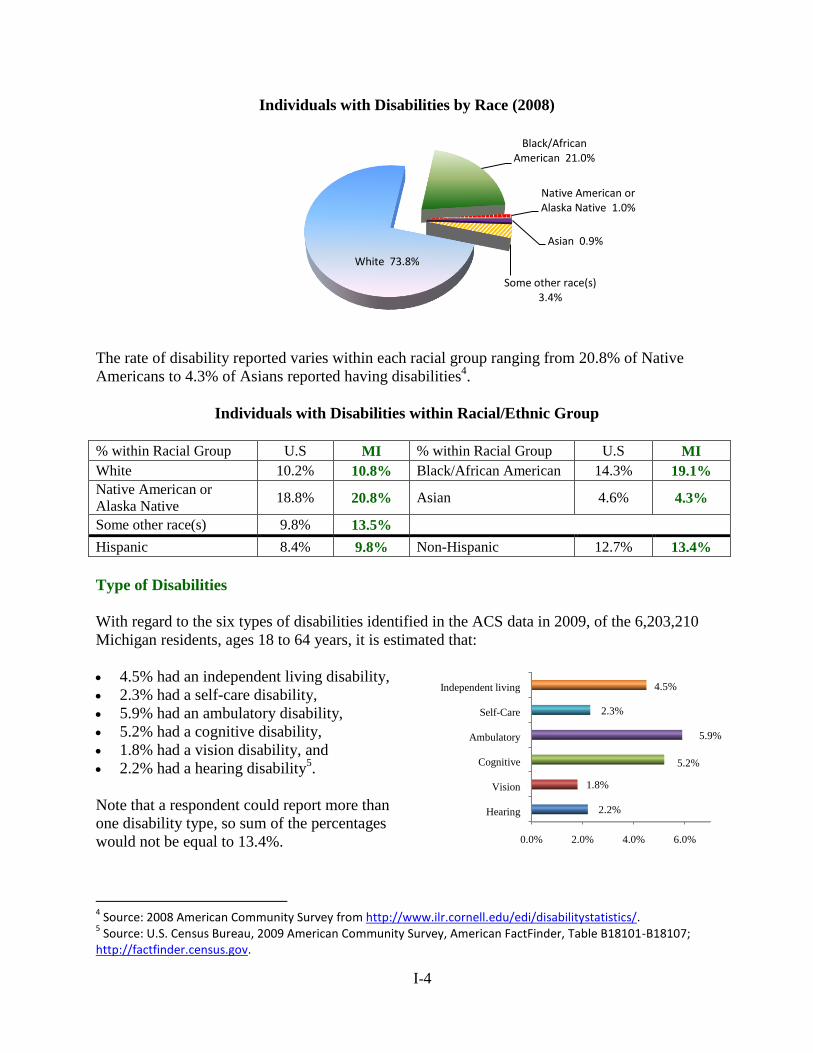
Race/Ethnicity
As of March 2011, the 2009 ACS race/ethnicity data for people with disabilities was not yet
available. Therefore, the 2008 ACS racial distribution estimations of individuals with disabilities
was used for this report. It is important to note that Hispanic/Latino ancestry is considered an
ethnicity not a race by the federal government therefore this data is not displayed in the
following figure. As illustrated, of the estimated 1,317,247 residents with a disability, 73.8%
were White, 21% were Black/African Americans, 1% were Native Americans and .9% were
Asian3.
2 U.S. Census Bureau, 2009 American Community Survey, American FactFinder, Table B18101;
http://factfinder.census.gov. 3 Source: 2008 American Community Survey from http://www.ilr.cornell.edu/edi/disabilitystatistics/.
Prevalence of
Disability
13.4%
MI
I-4
Individuals with Disabilities by Race (2008)
The rate of disability reported varies within each racial group ranging from 20.8% of Native
Americans to 4.3% of Asians reported having disabilities4.
Individuals with Disabilities within Racial/Ethnic Group
% within Racial Group U.S MI % within Racial Group U.S MI
White 10.2% 10.8% Black/African American 14.3% 19.1%
Native American or
Alaska Native 18.8% 20.8% Asian 4.6% 4.3%
Some other race(s) 9.8% 13.5%
Hispanic 8.4% 9.8% Non-Hispanic 12.7% 13.4%
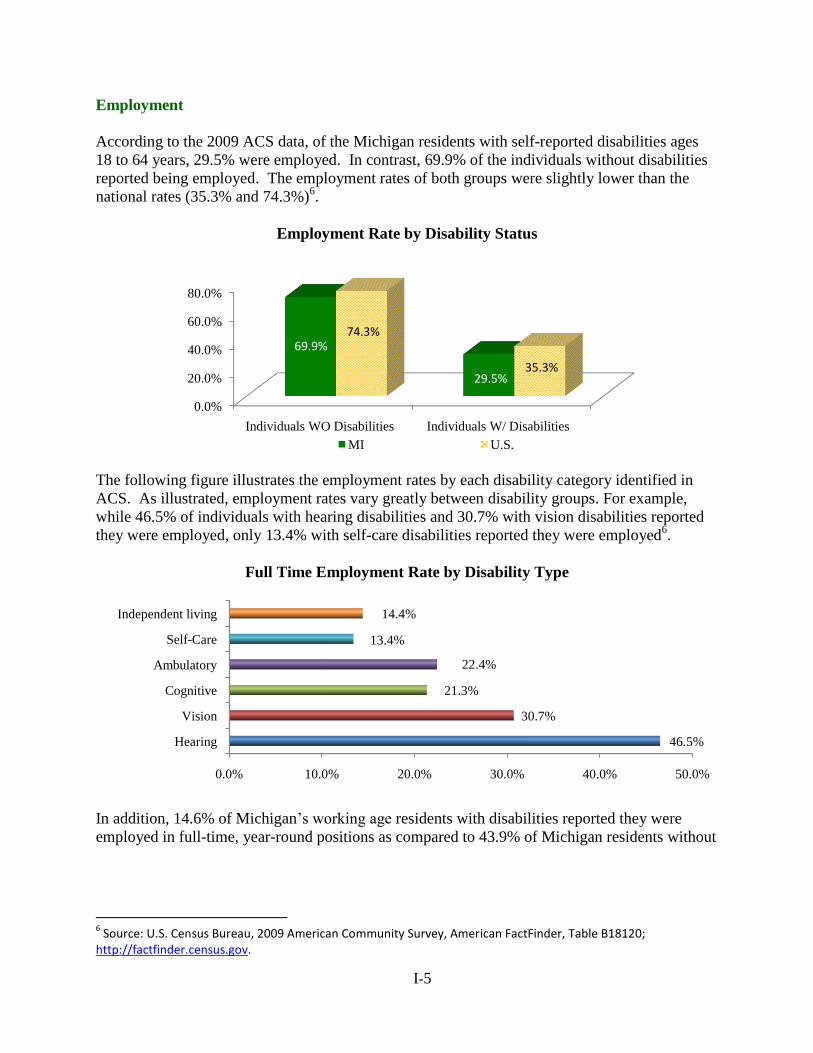
Type of Disabilities
With regard to the six types of disabilities identified in the ACS data in 2009, of the 6,203,210
Michigan residents, ages 18 to 64 years, it is estimated that:
4.5% had an independent living disability,
2.3% had a self-care disability,
5.9% had an ambulatory disability,
5.2% had a cognitive disability,
1.8% had a vision disability, and
2.2% had a hearing disability5.
Note that a respondent could report more than
one disability type, so sum of the percentages
would not be equal to 13.4%.
4 Source: 2008 American Community Survey from http://www.ilr.cornell.edu/edi/disabilitystatistics/.
5 Source: U.S. Census Bureau, 2009 American Community Survey, American FactFinder, Table B18101-B18107;
http://factfinder.census.gov.
Black/African American 21.0%
Native American or Alaska Native 1.0%
Asian 0.9%
Some other race(s) 3.4%
White 73.8%
0.0% 2.0% 4.0% 6.0%
Hearing
Vision
Cognitive
Ambulatory
Self-Care
Independent living
2.2%
1.8%
5.2%
5.9%
2.3%
4.5%
I-5
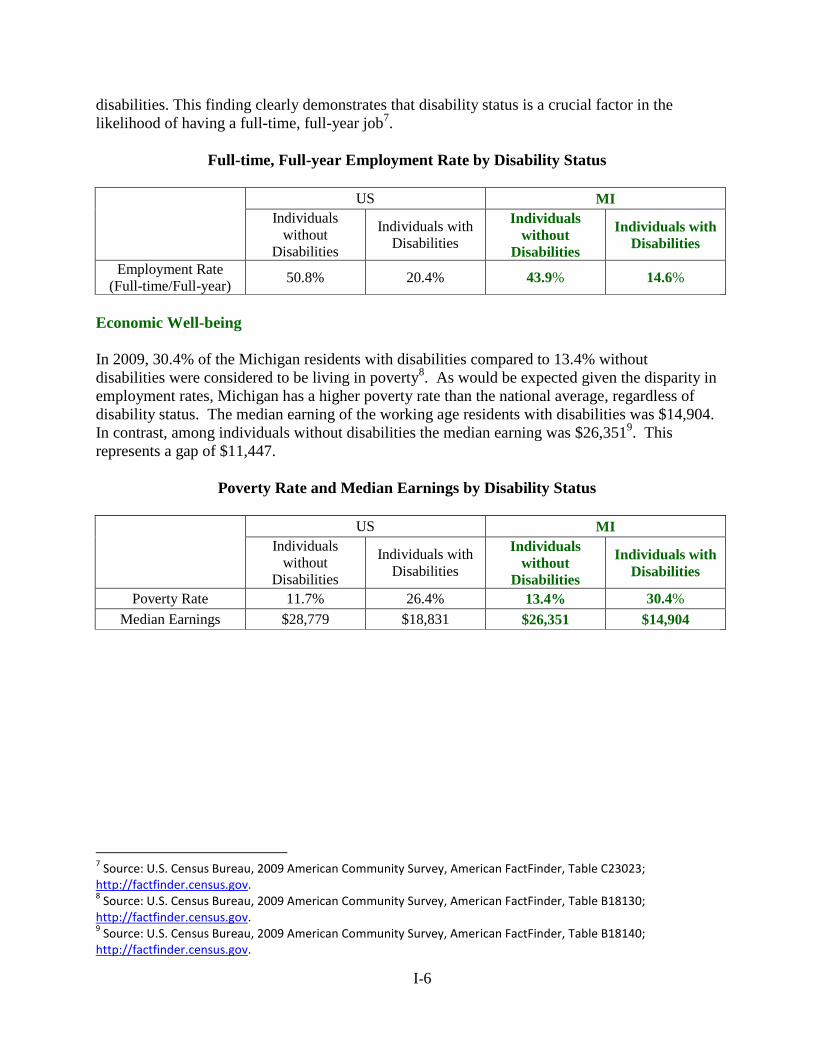
Employment
According to the 2009 ACS data, of the Michigan residents with self-reported disabilities ages
18 to 64 years, 29.5% were employed. In contrast, 69.9% of the individuals without disabilities
reported being employed. The employment rates of both groups were slightly lower than the
national rates (35.3% and 74.3%)6.
Employment Rate by Disability Status
The following figure illustrates the employment rates by each disability category identified in
ACS. As illustrated, employment rates vary greatly between disability groups. For example,
while 46.5% of individuals with hearing disabilities and 30.7% with vision disabilities reported
they were employed, only 13.4% with self-care disabilities reported they were employed6.
Full Time Employment Rate by Disability Type
In addition, 14.6% of Michigan’s working age residents with disabilities reported they were
employed in full-time, year-round positions as compared to 43.9% of Michigan residents without
6 Source: U.S. Census Bureau, 2009 American Community Survey, American FactFinder, Table B18120;
http://factfinder.census.gov.
0.0%
20.0%
40.0%
60.0%
80.0%
Individuals WO Disabilities Individuals W/ Disabilities
69.9%
29.5%
74.3%
35.3%
MI U.S.
0.0% 10.0% 20.0% 30.0% 40.0% 50.0%
Hearing
Vision
Cognitive
Ambulatory
Self-Care
Independent living
46.5%
30.7%
21.3%
22.4%
13.4%
14.4%
I-6
disabilities. This finding clearly demonstrates that disability status is a crucial factor in the
likelihood of having a full-time, full-year job7.
Full-time, Full-year Employment Rate by Disability Status
US MI
Individuals
without
Disabilities
Individuals with
Disabilities
Individuals
without
Disabilities
Individuals with
Disabilities
Employment Rate
(Full-time/Full-year) 50.8% 20.4% 43.9% 14.6%
Economic Well-being
In 2009, 30.4% of the Michigan residents with disabilities compared to 13.4% without
disabilities were considered to be living in poverty8. As would be expected given the disparity in
employment rates, Michigan has a higher poverty rate than the national average, regardless of
disability status. The median earning of the working age residents with disabilities was $14,904.
In contrast, among individuals without disabilities the median earning was $26,3519. This
represents a gap of $11,447.
Poverty Rate and Median Earnings by Disability Status
US MI
Individuals
without
Disabilities
Individuals with
Disabilities
Individuals
without
Disabilities
Individuals with
Disabilities
Poverty Rate 11.7% 26.4% 13.4% 30.4%
Median Earnings $28,779 $18,831 $26,351 $14,904
7 Source: U.S. Census Bureau, 2009 American Community Survey, American FactFinder, Table C23023;
http://factfinder.census.gov. 8 Source: U.S. Census Bureau, 2009 American Community Survey, American FactFinder, Table B18130;
http://factfinder.census.gov. 9 Source: U.S. Census Bureau, 2009 American Community Survey, American FactFinder, Table B18140;
http://factfinder.census.gov.
I-7
Survey of Income and Program Participation (SIPP)
The Survey of Income and Program Participation (SIPP), conducted by the Demographic
Statistical Methods Division of the United States Census Bureau, is designed to estimate
information about the income of individuals and households and the participation of these people
in income transfer programs. In addition to the core questions, the SIPP includes a topical
module focused on the ability of respondents to perform functional activities, instrumental
activities of daily living and the presence of a work disability. The benefit of this data is that it is
collected continuously and is much more specific in identifying disability related factors than the
American Community Survey (ACS) data. The major limitations of the SIPP are the small
sample size of the survey, the inability to easily correlate the SIPP disability categories to the
American Community Survey (ACS) categories and the limited reliability of the estimates below
the regional level. In addition, the disability related data is not released as frequently as the ACS
data. Because the state level data was unavailable, this section briefly reviews the relevant data
to individuals with disabilities at the national level10
.
There are 13 disability related questions and four additional questions for the level of severity.
Thirteen types of disabilities are as follows:
Used a wheelchair, a cane, crutches, or a walker
Had difficulty performing one or more functional activities (seeing, hearing, speaking, lifting/carrying,
using stairs, walking, or grasping small objects)
Had difficulty with one or more activities of daily living (ADLs), which includes getting around inside
the home, getting in or out of bed or a chair, bathing, dressing, eating, and toileting
Had difficulty with one or more instrumental activities of daily living (IADLs), which includes going
outside the home, keeping track of money and bills, preparing meals, doing light housework, taking
prescription medicines in the right amount at the right time, and using the telephone
Learning disability or some other type of mental or emotional condition
Mental retardation or another developmental disability, or Alzheimer's disease
Had any other mental or emotional condition that seriously interfered with everyday activities
Had a condition that limited the ability to work around the house or made it difficult to remain
employed
Autism, cerebral palsy, mental retardation, or another developmental disability
Had difficulty performing one or more functional activities (seeing, hearing, speaking, walking,
running, or taking part in sports)
Developmental delay
Difficulty walking, running, or playing
Difficulty moving arms or legs
Disability Prevalence Rate
The 2005 Survey of Income and Program Participation (SIPP) report estimated 54.4 million
(18.7%) people with any form of disabilities and 35.0 million (12.0%) people with severe
disabilities of the 291.1 million non-institutionalized
civilian in the U.S.
10
Source: Brault, M. (Dec. 2008). Americans with Disabilities: 2005, U.S. Census Bureau. Retrieved from http://www.census.gov/prod/2008pubs/p70-117.pdf.
Prevalence of
Disability
18.7%
I-8
Age
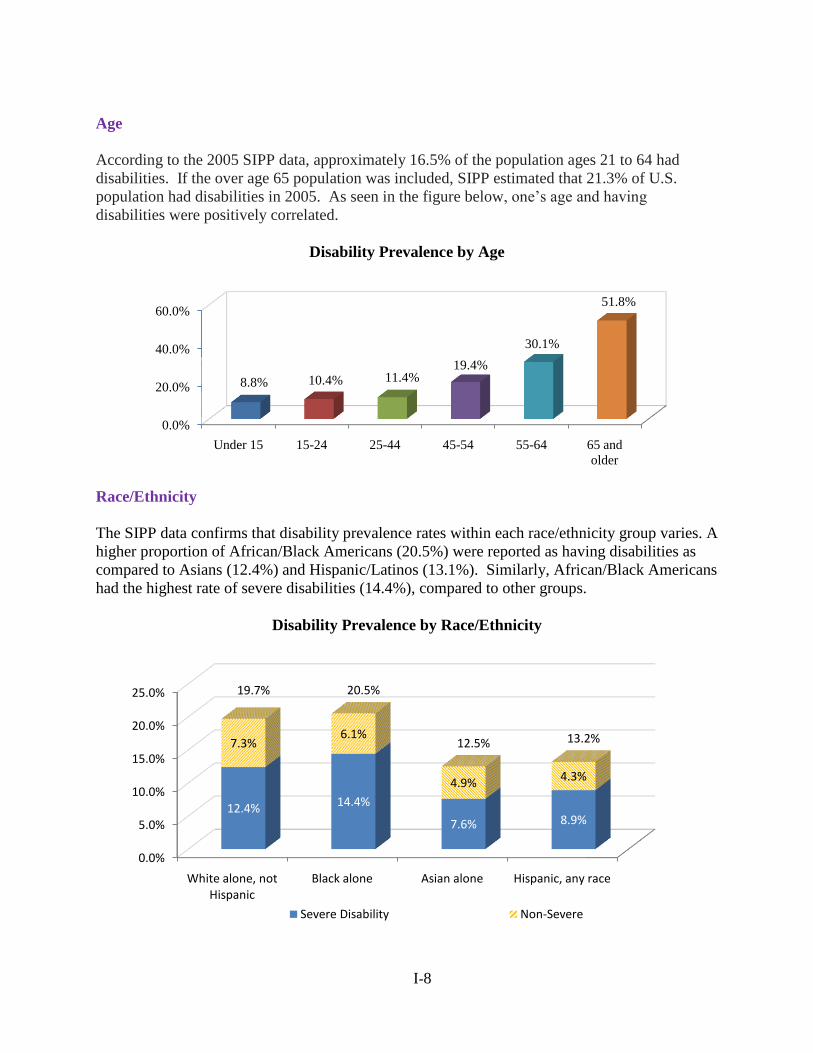
According to the 2005 SIPP data, approximately 16.5% of the population ages 21 to 64 had
disabilities. If the over age 65 population was included, SIPP estimated that 21.3% of U.S.
population had disabilities in 2005. As seen in the figure below, one’s age and having
disabilities were positively correlated.
Disability Prevalence by Age
Race/Ethnicity
The SIPP data confirms that disability prevalence rates within each race/ethnicity group varies. A
higher proportion of African/Black Americans (20.5%) were reported as having disabilities as
compared to Asians (12.4%) and Hispanic/Latinos (13.1%). Similarly, African/Black Americans
had the highest rate of severe disabilities (14.4%), compared to other groups.
Disability Prevalence by Race/Ethnicity
0.0%
20.0%
40.0%
60.0%
Under 15 15-24 25-44 45-54 55-64 65 and
older
8.8% 10.4% 11.4%19.4%
30.1%
51.8%
0.0%
5.0%
10.0%
15.0%
20.0%
25.0%
White alone, not Hispanic
Black alone Asian alone Hispanic, any race
12.4% 14.4%
7.6% 8.9%
7.3%6.1%
4.9% 4.3%
19.7% 20.5%
12.5% 13.2%
Severe Disability Non-Severe
I-9
Type of Disabilities (Functional Limitations)
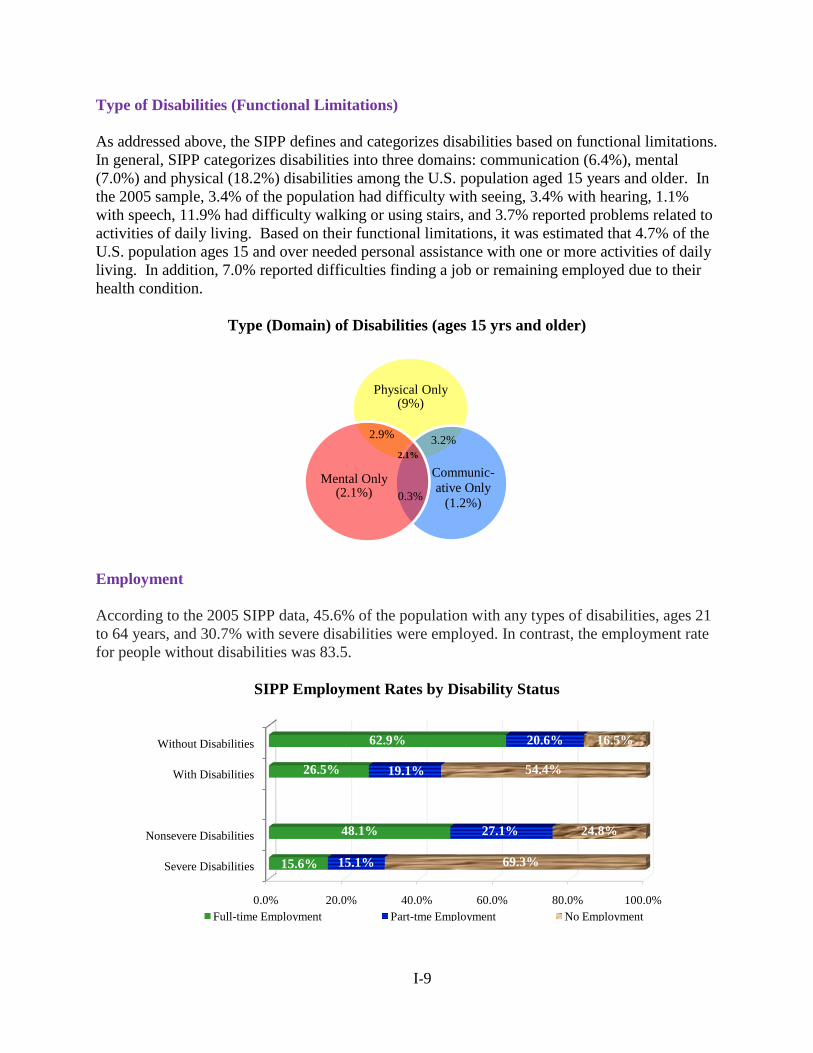
As addressed above, the SIPP defines and categorizes disabilities based on functional limitations.
In general, SIPP categorizes disabilities into three domains: communication (6.4%), mental
(7.0%) and physical (18.2%) disabilities among the U.S. population aged 15 years and older. In
the 2005 sample, 3.4% of the population had difficulty with seeing, 3.4% with hearing, 1.1%
with speech, 11.9% had difficulty walking or using stairs, and 3.7% reported problems related to
activities of daily living. Based on their functional limitations, it was estimated that 4.7% of the
U.S. population ages 15 and over needed personal assistance with one or more activities of daily
living. In addition, 7.0% reported difficulties finding a job or remaining employed due to their
health condition.
Type (Domain) of Disabilities (ages 15 yrs and older)
Employment
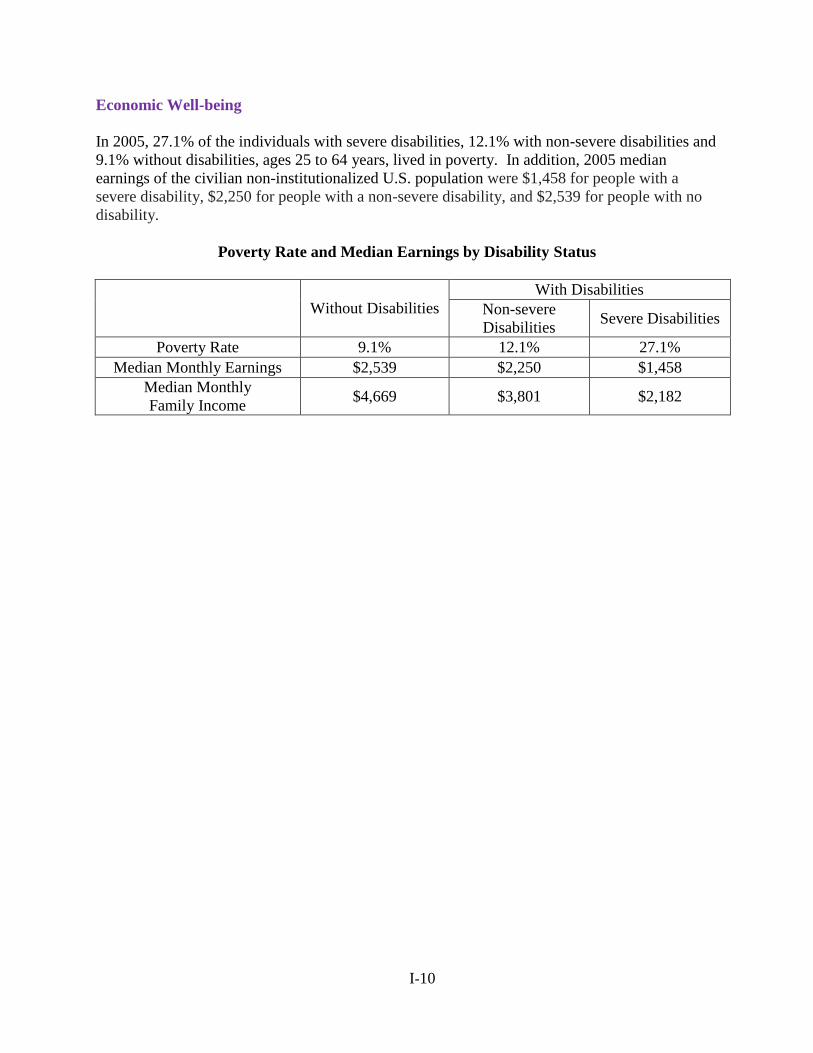
According to the 2005 SIPP data, 45.6% of the population with any types of disabilities, ages 21
to 64 years, and 30.7% with severe disabilities were employed. In contrast, the employment rate
for people without disabilities was 83.5.
SIPP Employment Rates by Disability Status
Physical Only (9%)
Communic-
ative Only
(1.2%)
Mental Only (2.1%)
0.0% 20.0% 40.0% 60.0% 80.0% 100.0%
Severe Disabilities
Nonsevere Disabilities
With Disabilities
Without Disabilities
15.6%
48.1%
26.5%
62.9%
15.1%
27.1%
19.1%
20.6%
69.3%
24.8%
54.4%
16.5%
Full-time Employment Part-tme Employment No Employment
2.9% 3.2%
0.3%
2.1%
I-10
Economic Well-being
In 2005, 27.1% of the individuals with severe disabilities, 12.1% with non-severe disabilities and
9.1% without disabilities, ages 25 to 64 years, lived in poverty. In addition, 2005 median
earnings of the civilian non-institutionalized U.S. population were $1,458 for people with a
severe disability, $2,250 for people with a non-severe disability, and $2,539 for people with no
disability.
Poverty Rate and Median Earnings by Disability Status
Without Disabilities
With Disabilities
Non-severe
Disabilities Severe Disabilities
Poverty Rate 9.1% 12.1% 27.1%
Median Monthly Earnings $2,539 $2,250 $1,458
Median Monthly
Family Income $4,669 $3,801 $2,182
I-11
Behavioral Risk Factors Surveillance Survey (BRFSS)
The Behavioral Risk Factors Surveillance Survey (BRFSS), the state based system of health
surveys, is to collect information on health risk behaviors, preventive health practices, and health
care access primarily related to chronic disease and injury. Each year, the state health
departments conduct this cross-sectional telephone-based survey with technical and
methodological assistance provided by the U.S. Centers for Disease Control and Prevention
(CDC). The survey findings are often used to monitor risk behaviors and identify emerging
health problems, especially for people ages 18 and above, from which public health policies and
programs are developed and evaluated11
.
As the health related survey, BRFSS includes two questions in the core section to identify the
population with disabilities. Two questions focus on whether one has general activity limitations
and needs special equipment for their current health problem. The actual questions are as follows:
Are you limited in any way in any activities because of physical, mental, or emotional problems?
Do you now have any health problem that requires you to use special equipment, such as a cane, a wheel chair, a special bed, or a special telephone?
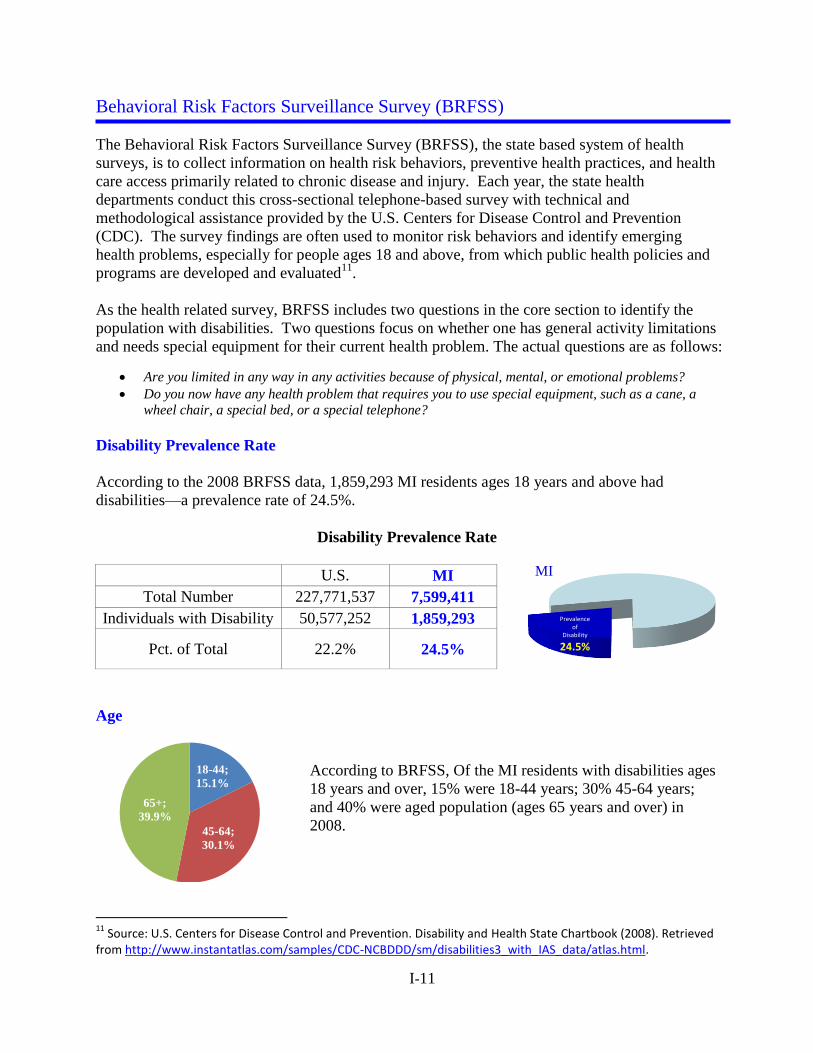
Disability Prevalence Rate
According to the 2008 BRFSS data, 1,859,293 MI residents ages 18 years and above had
disabilities—a prevalence rate of 24.5%.
Disability Prevalence Rate
U.S. MI
Total Number 227,771,537 7,599,411
Individuals with Disability 50,577,252 1,859,293
Pct. of Total 22.2% 24.5%
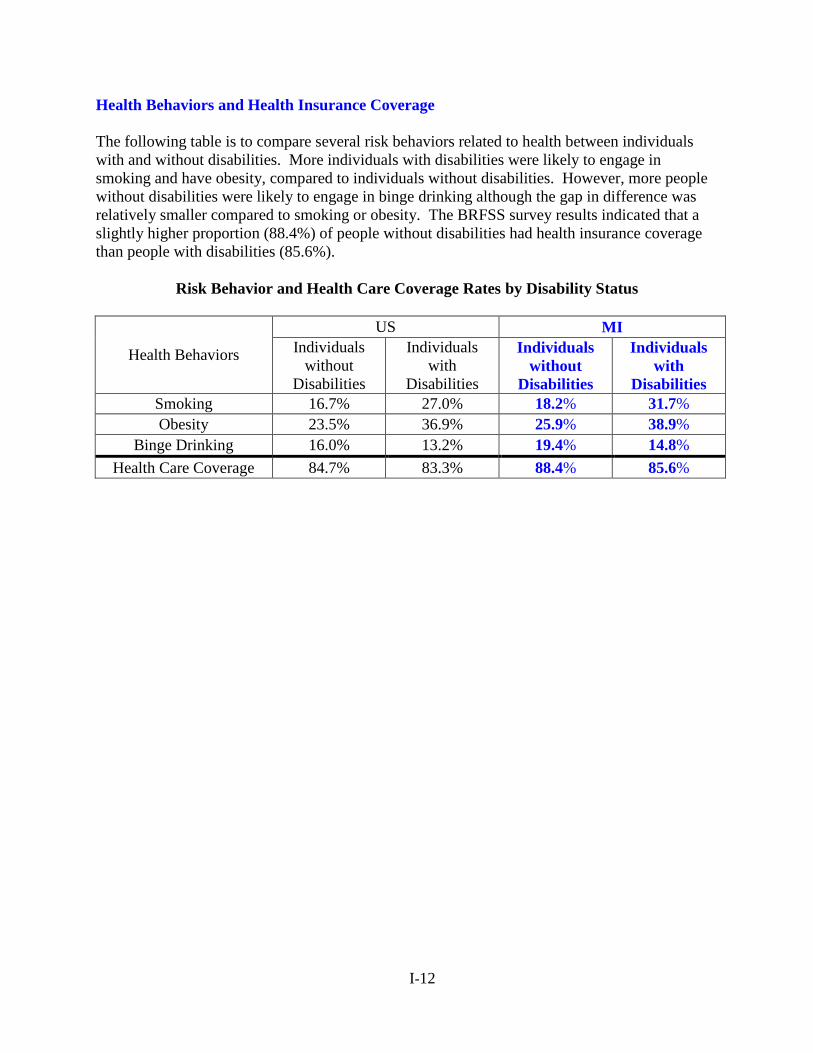
Age
According to BRFSS, Of the MI residents with disabilities ages
18 years and over, 15% were 18-44 years; 30% 45-64 years;
and 40% were aged population (ages 65 years and over) in
2008.
11
Source: U.S. Centers for Disease Control and Prevention. Disability and Health State Chartbook (2008). Retrieved from http://www.instantatlas.com/samples/CDC-NCBDDD/sm/disabilities3_with_IAS_data/atlas.html.
Prevalence of
Disability
24.5%
18-44;
15.1%
45-64;
30.1%
65+;
39.9%
MI
I-12
Health Behaviors and Health Insurance Coverage
The following table is to compare several risk behaviors related to health between individuals
with and without disabilities. More individuals with disabilities were likely to engage in
smoking and have obesity, compared to individuals without disabilities. However, more people
without disabilities were likely to engage in binge drinking although the gap in difference was
relatively smaller compared to smoking or obesity. The BRFSS survey results indicated that a
slightly higher proportion (88.4%) of people without disabilities had health insurance coverage
than people with disabilities (85.6%).
Risk Behavior and Health Care Coverage Rates by Disability Status
Health Behaviors
US MI
Individuals
without
Disabilities
Individuals
with
Disabilities
Individuals
without
Disabilities
Individuals
with
Disabilities
Smoking 16.7% 27.0% 18.2% 31.7%
Obesity 23.5% 36.9% 25.9% 38.9%
Binge Drinking 16.0% 13.2% 19.4% 14.8%
Health Care Coverage 84.7% 83.3% 88.4% 85.6%
I-13
Current Population Survey (CPS)
The Current Population Survey (CPS) is the primary source of information on the labor force
characteristics of the U.S. population, jointly conducted by the U.S. Bureau of the Census and
the Bureau of Labor Statistics. The CPS is used to compute the federal government’s official
monthly statistics on total employment and unemployment, focusing on those ages 16 and over.
The CPS currently uses the ACS questions to estimate employment, unemployment, earnings,
and hours of work (among other measures) for those who have a disability.
First, the CPS Annual Social and Economic Supplement (ASEC)12
, a one yearly additional
questionnaire that collects information on topics such as income and noncash benefits, was
reviewed. Since the measure only specifies people with limitations in work, it artificially lowers
the employment rate when used to describe the population of people with any form of disability.
Many people with non-work related disabilities are employed. The CPS-ASEC asks the
following work limitation question:
"Does anyone in this household have a health problem or disability which prevents them from
working or which limits the kind or amount of work they can do? [If so,] who is that? Anyone
else?"
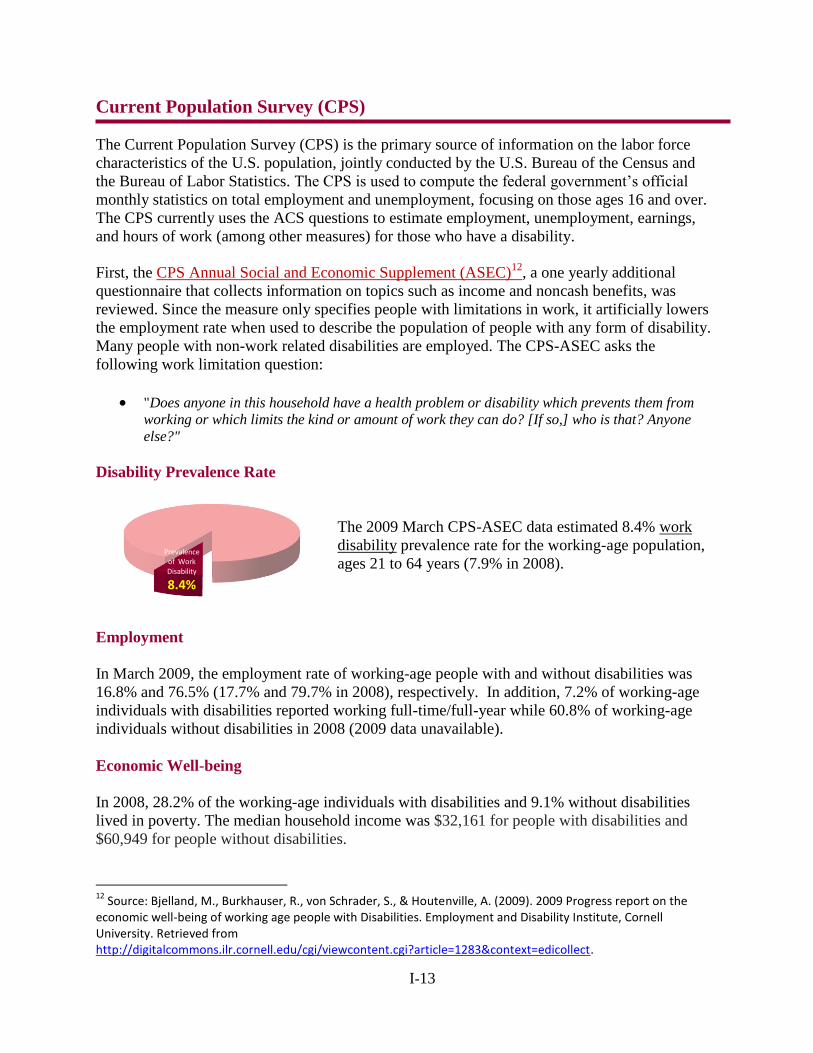
Disability Prevalence Rate
The 2009 March CPS-ASEC data estimated 8.4% work
disability prevalence rate for the working-age population,
ages 21 to 64 years (7.9% in 2008).
Employment
In March 2009, the employment rate of working-age people with and without disabilities was
16.8% and 76.5% (17.7% and 79.7% in 2008), respectively. In addition, 7.2% of working-age
individuals with disabilities reported working full-time/full-year while 60.8% of working-age
individuals without disabilities in 2008 (2009 data unavailable).
Economic Well-being
In 2008, 28.2% of the working-age individuals with disabilities and 9.1% without disabilities
lived in poverty. The median household income was $32,161 for people with disabilities and
$60,949 for people without disabilities.
12
Source: Bjelland, M., Burkhauser, R., von Schrader, S., & Houtenville, A. (2009). 2009 Progress report on the economic well-being of working age people with Disabilities. Employment and Disability Institute, Cornell University. Retrieved from http://digitalcommons.ilr.cornell.edu/cgi/viewcontent.cgi?article=1283&context=edicollect.
Prevalence of WorkDisability
8.4%
I-14
Poverty Rate and Median Household Income by Disability Status
With Disabilities Without Disabilities
Poverty Rate 9.4% 28.2%
Median Household Income $32,161 $60,949
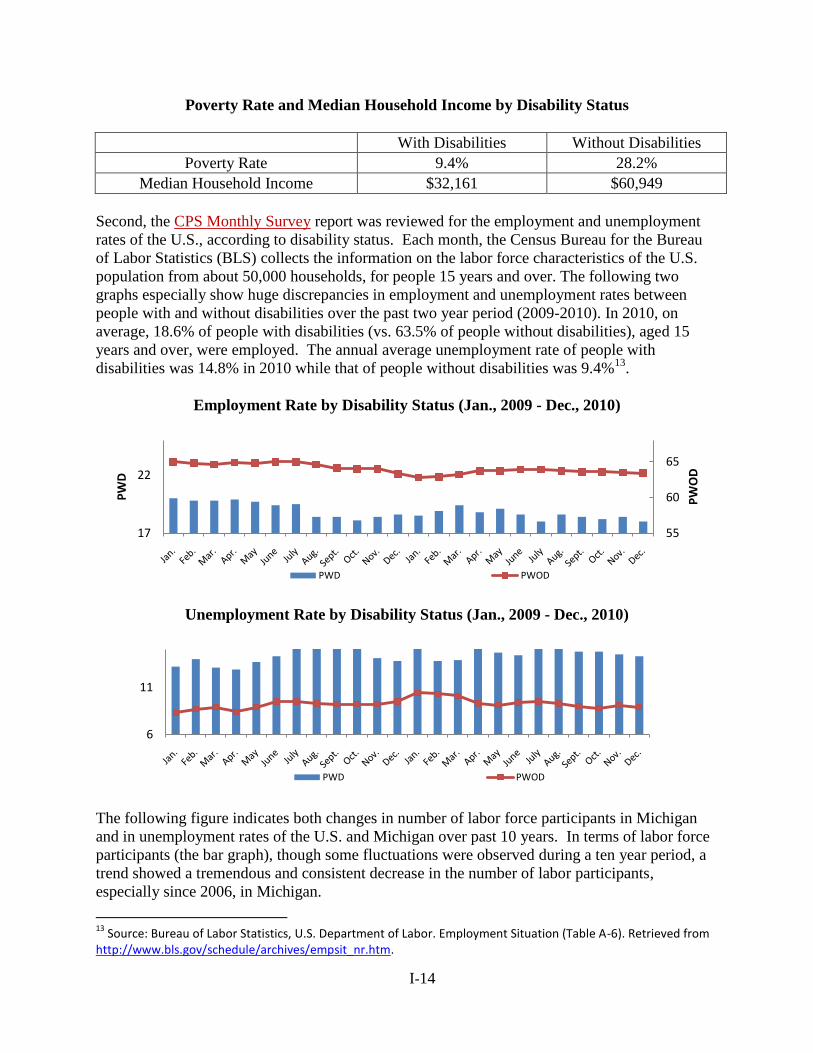
Second, the CPS Monthly Survey report was reviewed for the employment and unemployment
rates of the U.S., according to disability status. Each month, the Census Bureau for the Bureau
of Labor Statistics (BLS) collects the information on the labor force characteristics of the U.S.
population from about 50,000 households, for people 15 years and over. The following two
graphs especially show huge discrepancies in employment and unemployment rates between
people with and without disabilities over the past two year period (2009-2010). In 2010, on
average, 18.6% of people with disabilities (vs. 63.5% of people without disabilities), aged 15
years and over, were employed. The annual average unemployment rate of people with
disabilities was 14.8% in 2010 while that of people without disabilities was 9.4%13
.
Employment Rate by Disability Status (Jan., 2009 - Dec., 2010)
Unemployment Rate by Disability Status (Jan., 2009 - Dec., 2010)
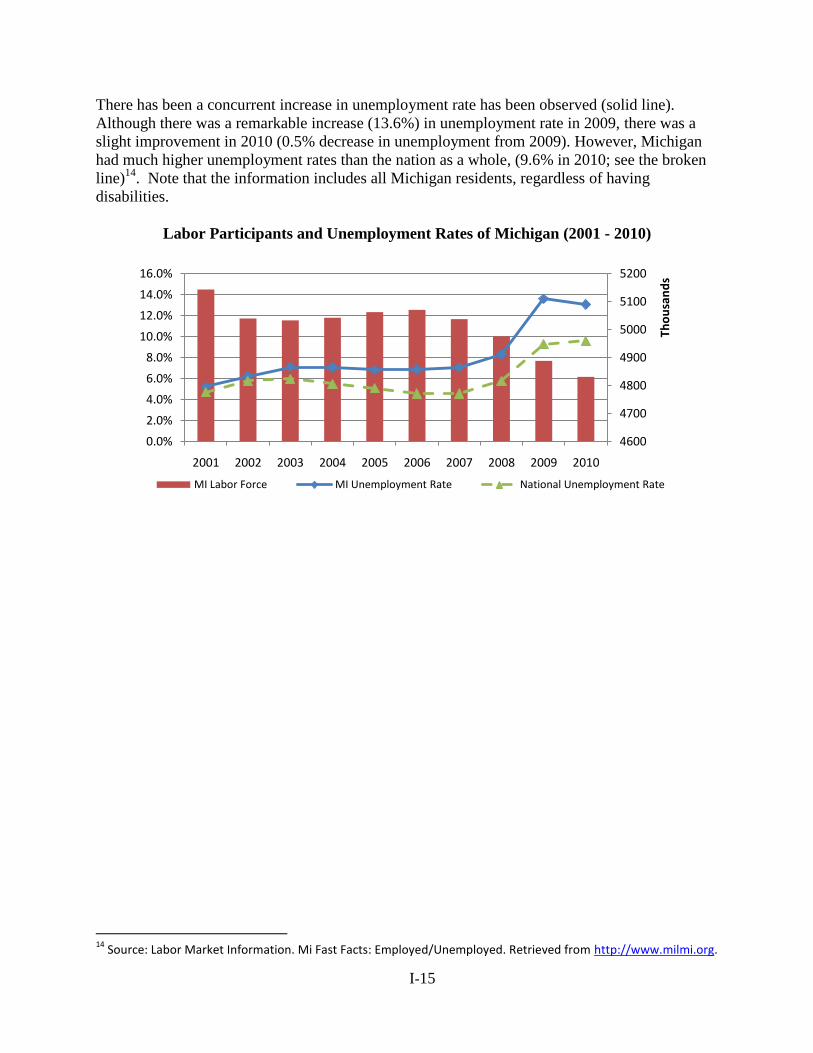
The following figure indicates both changes in number of labor force participants in Michigan
and in unemployment rates of the U.S. and Michigan over past 10 years. In terms of labor force
participants (the bar graph), though some fluctuations were observed during a ten year period, a
trend showed a tremendous and consistent decrease in the number of labor participants,
especially since 2006, in Michigan.
13
Source: Bureau of Labor Statistics, U.S. Department of Labor. Employment Situation (Table A-6). Retrieved from http://www.bls.gov/schedule/archives/empsit_nr.htm.
55
60
65
17
22
PW
OD
PW
D
PWD PWOD
6
11
PWD PWOD
I-15
There has been a concurrent increase in unemployment rate has been observed (solid line).
Although there was a remarkable increase (13.6%) in unemployment rate in 2009, there was a
slight improvement in 2010 (0.5% decrease in unemployment from 2009). However, Michigan
had much higher unemployment rates than the nation as a whole, (9.6% in 2010; see the broken
line)14
. Note that the information includes all Michigan residents, regardless of having
disabilities.
Labor Participants and Unemployment Rates of Michigan (2001 - 2010)
14
Source: Labor Market Information. Mi Fast Facts: Employed/Unemployed. Retrieved from http://www.milmi.org.
4600
4700
4800
4900
5000
5100
5200
0.0%
2.0%
4.0%
6.0%
8.0%
10.0%
12.0%
14.0%
16.0%
2001 2002 2003 2004 2005 2006 2007 2008 2009 2010
Tho
usa
nd
s
MI Labor Force MI Unemployment Rate National Unemployment Rate
I-16
SOCIAL SECURITY ADMINISTRATION PROGRAMS
Social Security Administration defines disabilities in a different way from other disability
program. Disability under Social Security is based on one’s inability to work.
Supplemental Security Income (SSI)
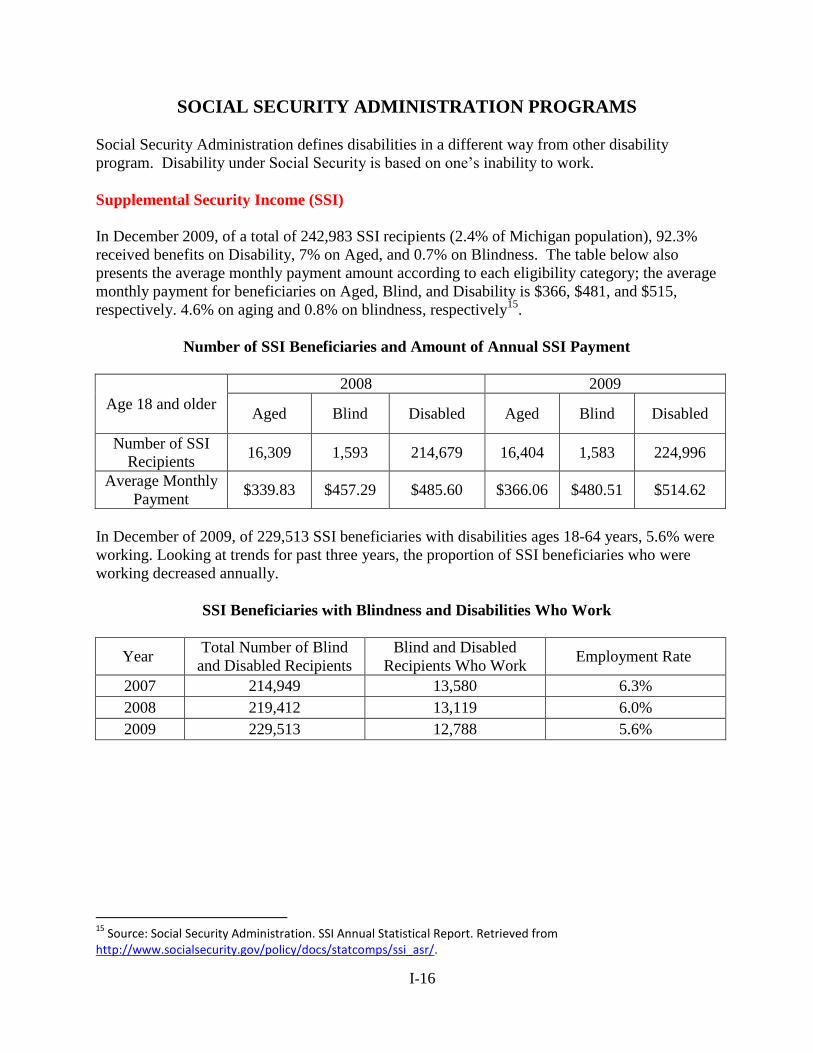
In December 2009, of a total of 242,983 SSI recipients (2.4% of Michigan population), 92.3%
received benefits on Disability, 7% on Aged, and 0.7% on Blindness. The table below also
presents the average monthly payment amount according to each eligibility category; the average
monthly payment for beneficiaries on Aged, Blind, and Disability is $366, $481, and $515,
respectively. 4.6% on aging and 0.8% on blindness, respectively15
.
Number of SSI Beneficiaries and Amount of Annual SSI Payment
Age 18 and older
2008 2009
Aged Blind Disabled Aged Blind Disabled
Number of SSI
Recipients 16,309 1,593 214,679 16,404 1,583 224,996
Average Monthly
Payment $339.83 $457.29 $485.60 $366.06 $480.51 $514.62
In December of 2009, of 229,513 SSI beneficiaries with disabilities ages 18-64 years, 5.6% were
working. Looking at trends for past three years, the proportion of SSI beneficiaries who were
working decreased annually.
SSI Beneficiaries with Blindness and Disabilities Who Work
Year Total Number of Blind
and Disabled Recipients
Blind and Disabled
Recipients Who Work Employment Rate
2007 214,949 13,580 6.3%
2008 219,412 13,119 6.0%
2009 229,513 12,788 5.6%
15
Source: Social Security Administration. SSI Annual Statistical Report. Retrieved from http://www.socialsecurity.gov/policy/docs/statcomps/ssi_asr/.
I-17
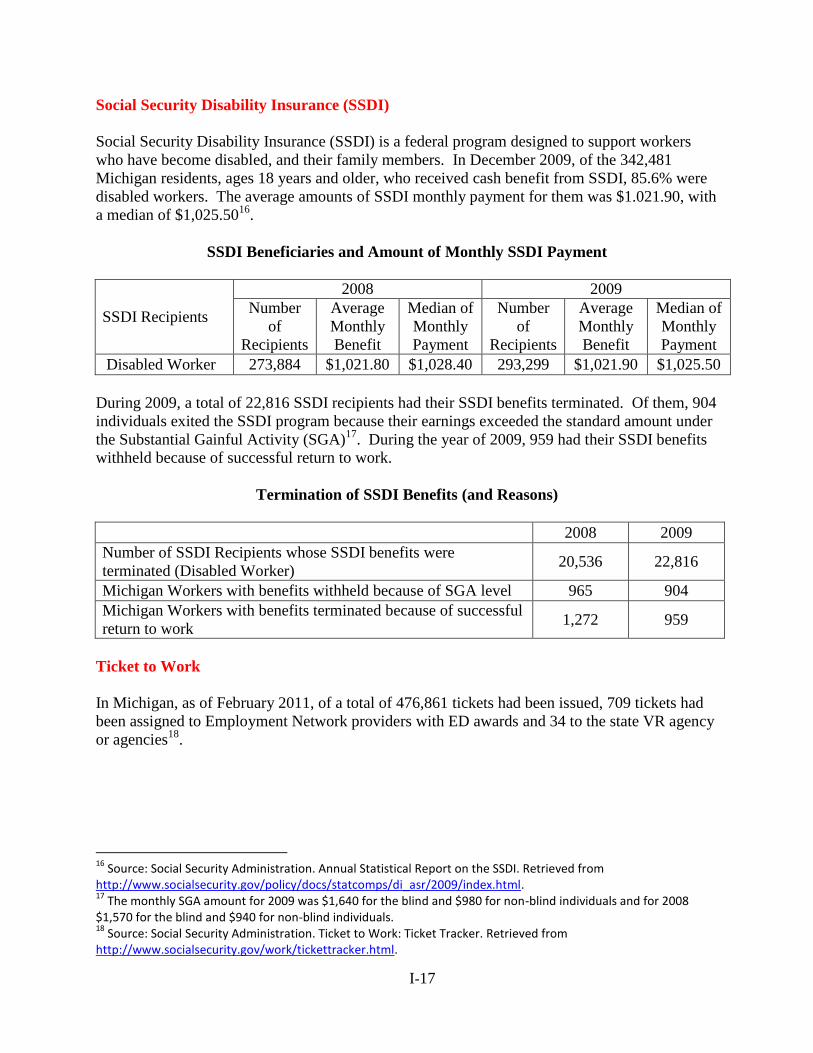
Social Security Disability Insurance (SSDI)
Social Security Disability Insurance (SSDI) is a federal program designed to support workers
who have become disabled, and their family members. In December 2009, of the 342,481
Michigan residents, ages 18 years and older, who received cash benefit from SSDI, 85.6% were
disabled workers. The average amounts of SSDI monthly payment for them was $1.021.90, with
a median of $1,025.5016
.
SSDI Beneficiaries and Amount of Monthly SSDI Payment
SSDI Recipients
2008 2009
Number
of
Recipients
Average
Monthly
Benefit
Median of
Monthly
Payment
Number
of
Recipients
Average
Monthly
Benefit
Median of
Monthly
Payment
Disabled Worker 273,884 $1,021.80 $1,028.40 293,299 $1,021.90 $1,025.50
During 2009, a total of 22,816 SSDI recipients had their SSDI benefits terminated. Of them, 904
individuals exited the SSDI program because their earnings exceeded the standard amount under
the Substantial Gainful Activity (SGA)17
. During the year of 2009, 959 had their SSDI benefits
withheld because of successful return to work.
Termination of SSDI Benefits (and Reasons)
2008 2009
Number of SSDI Recipients whose SSDI benefits were
terminated (Disabled Worker) 20,536 22,816
Michigan Workers with benefits withheld because of SGA level 965 904
Michigan Workers with benefits terminated because of successful
return to work 1,272 959
Ticket to Work
In Michigan, as of February 2011, of a total of 476,861 tickets had been issued, 709 tickets had
been assigned to Employment Network providers with ED awards and 34 to the state VR agency
or agencies18
.
16
Source: Social Security Administration. Annual Statistical Report on the SSDI. Retrieved from http://www.socialsecurity.gov/policy/docs/statcomps/di_asr/2009/index.html. 17
The monthly SGA amount for 2009 was $1,640 for the blind and $980 for non-blind individuals and for 2008 $1,570 for the blind and $940 for non-blind individuals. 18
Source: Social Security Administration. Ticket to Work: Ticket Tracker. Retrieved from http://www.socialsecurity.gov/work/tickettracker.html.
I-18
SPECIAL EDUCATION
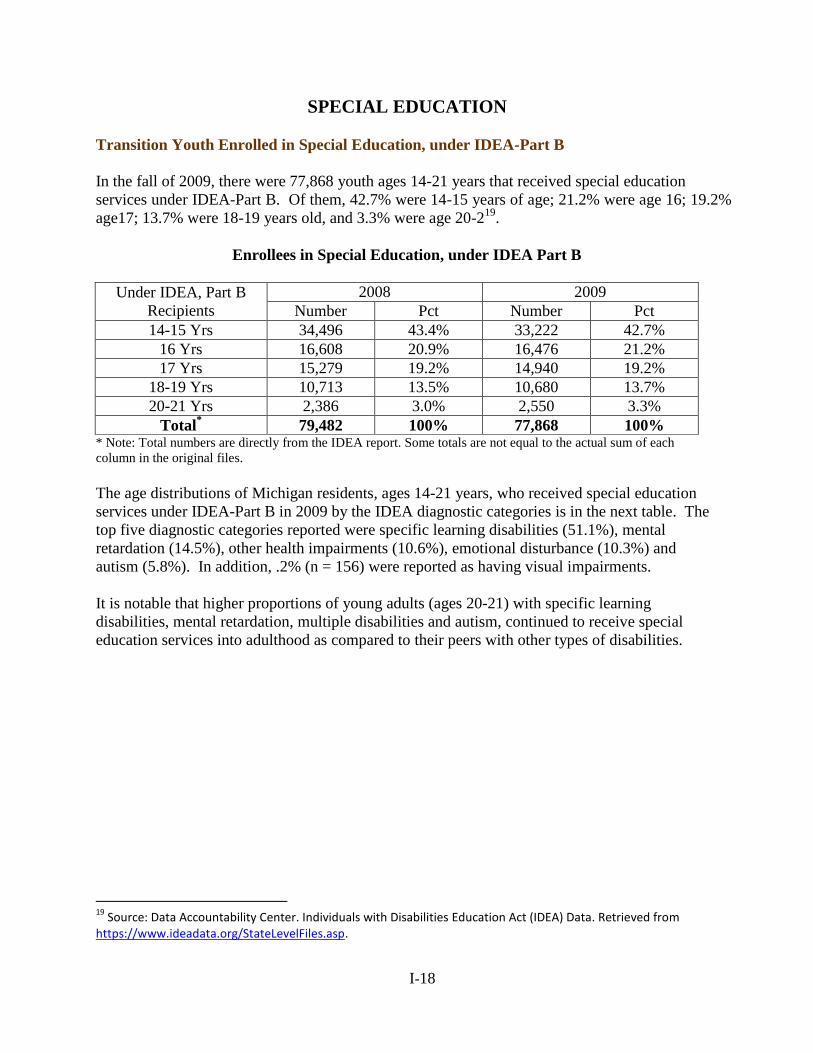
Transition Youth Enrolled in Special Education, under IDEA-Part B
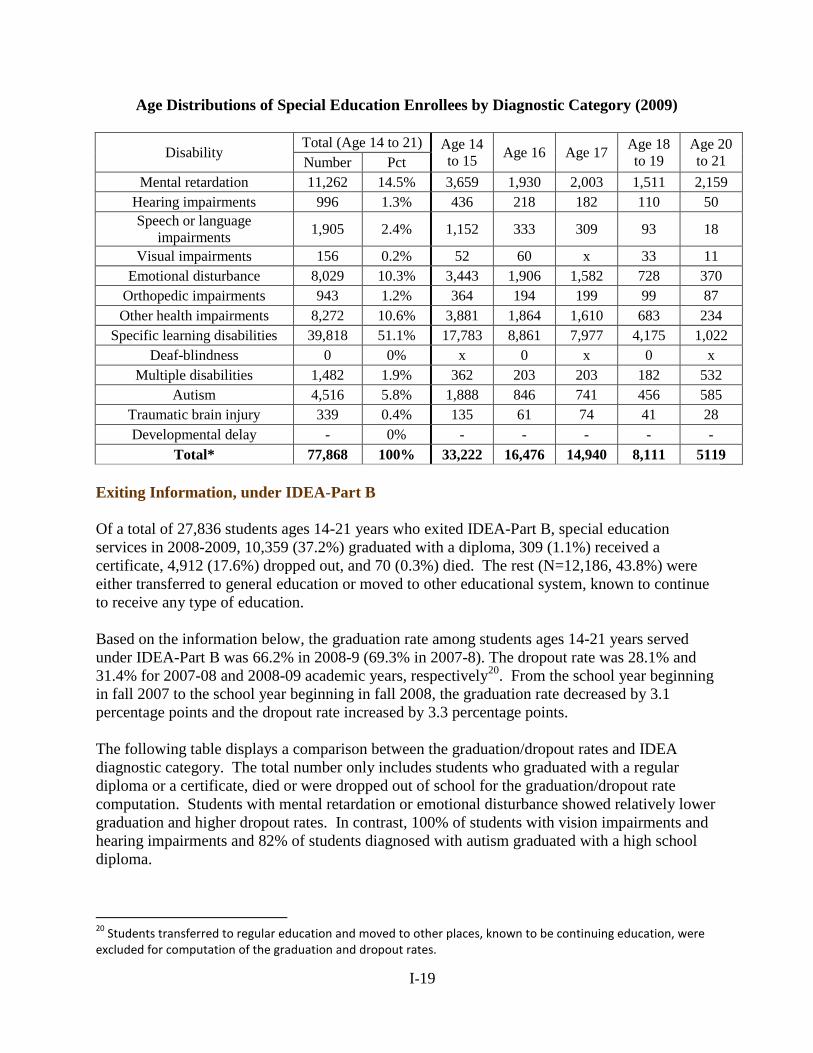
In the fall of 2009, there were 77,868 youth ages 14-21 years that received special education
services under IDEA-Part B. Of them, 42.7% were 14-15 years of age; 21.2% were age 16; 19.2%
age17; 13.7% were 18-19 years old, and 3.3% were age 20-219
.
Enrollees in Special Education, under IDEA Part B
Under IDEA, Part B
Recipients
2008 2009
Number Pct Number Pct
14-15 Yrs 34,496 43.4% 33,222 42.7%
16 Yrs 16,608 20.9% 16,476 21.2%
17 Yrs 15,279 19.2% 14,940 19.2%
18-19 Yrs 10,713 13.5% 10,680 13.7%
20-21 Yrs 2,386 3.0% 2,550 3.3%
Total* 79,482 100% 77,868 100%
* Note: Total numbers are directly from the IDEA report. Some totals are not equal to the actual sum of each
column in the original files.
The age distributions of Michigan residents, ages 14-21 years, who received special education
services under IDEA-Part B in 2009 by the IDEA diagnostic categories is in the next table. The
top five diagnostic categories reported were specific learning disabilities (51.1%), mental
retardation (14.5%), other health impairments (10.6%), emotional disturbance (10.3%) and
autism (5.8%). In addition, .2% (n = 156) were reported as having visual impairments.
It is notable that higher proportions of young adults (ages 20-21) with specific learning
disabilities, mental retardation, multiple disabilities and autism, continued to receive special
education services into adulthood as compared to their peers with other types of disabilities.
19
Source: Data Accountability Center. Individuals with Disabilities Education Act (IDEA) Data. Retrieved from https://www.ideadata.org/StateLevelFiles.asp.
I-19
Age Distributions of Special Education Enrollees by Diagnostic Category (2009)
Disability Total (Age 14 to 21) Age 14
to 15 Age 16 Age 17
Age 18
to 19
Age 20
to 21 Number Pct
Mental retardation 11,262 14.5% 3,659 1,930 2,003 1,511 2,159
Hearing impairments 996 1.3% 436 218 182 110 50
Speech or language
impairments 1,905 2.4% 1,152 333 309 93 18
Visual impairments 156 0.2% 52 60 x 33 11
Emotional disturbance 8,029 10.3% 3,443 1,906 1,582 728 370
Orthopedic impairments 943 1.2% 364 194 199 99 87
Other health impairments 8,272 10.6% 3,881 1,864 1,610 683 234
Specific learning disabilities 39,818 51.1% 17,783 8,861 7,977 4,175 1,022
Deaf-blindness 0 0% x 0 x 0 x
Multiple disabilities 1,482 1.9% 362 203 203 182 532
Autism 4,516 5.8% 1,888 846 741 456 585
Traumatic brain injury 339 0.4% 135 61 74 41 28
Developmental delay - 0% - - - - -
Total* 77,868 100% 33,222 16,476 14,940 8,111 5119
Exiting Information, under IDEA-Part B
Of a total of 27,836 students ages 14-21 years who exited IDEA-Part B, special education
services in 2008-2009, 10,359 (37.2%) graduated with a diploma, 309 (1.1%) received a
certificate, 4,912 (17.6%) dropped out, and 70 (0.3%) died. The rest (N=12,186, 43.8%) were
either transferred to general education or moved to other educational system, known to continue
to receive any type of education.
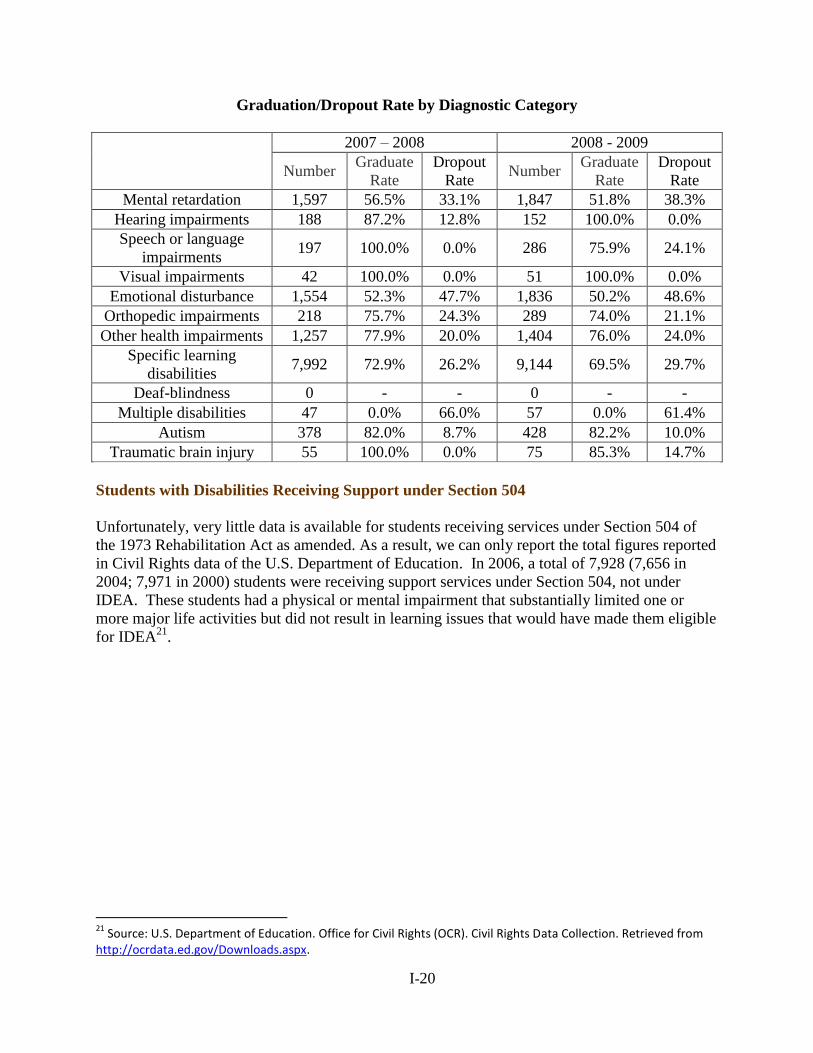
Based on the information below, the graduation rate among students ages 14-21 years served
under IDEA-Part B was 66.2% in 2008-9 (69.3% in 2007-8). The dropout rate was 28.1% and
31.4% for 2007-08 and 2008-09 academic years, respectively20
. From the school year beginning
in fall 2007 to the school year beginning in fall 2008, the graduation rate decreased by 3.1
percentage points and the dropout rate increased by 3.3 percentage points.
The following table displays a comparison between the graduation/dropout rates and IDEA
diagnostic category. The total number only includes students who graduated with a regular
diploma or a certificate, died or were dropped out of school for the graduation/dropout rate
computation. Students with mental retardation or emotional disturbance showed relatively lower
graduation and higher dropout rates. In contrast, 100% of students with vision impairments and
hearing impairments and 82% of students diagnosed with autism graduated with a high school
diploma.
20
Students transferred to regular education and moved to other places, known to be continuing education, were excluded for computation of the graduation and dropout rates.
I-20
Graduation/Dropout Rate by Diagnostic Category
2007 – 2008 2008 - 2009
Number Graduate
Rate
Dropout
Rate Number
Graduate
Rate
Dropout
Rate
Mental retardation 1,597 56.5% 33.1% 1,847 51.8% 38.3%
Hearing impairments 188 87.2% 12.8% 152 100.0% 0.0%
Speech or language
impairments 197 100.0% 0.0% 286 75.9% 24.1%
Visual impairments 42 100.0% 0.0% 51 100.0% 0.0%
Emotional disturbance 1,554 52.3% 47.7% 1,836 50.2% 48.6%
Orthopedic impairments 218 75.7% 24.3% 289 74.0% 21.1%
Other health impairments 1,257 77.9% 20.0% 1,404 76.0% 24.0%
Specific learning
disabilities 7,992 72.9% 26.2% 9,144 69.5% 29.7%
Deaf-blindness 0 - - 0 - -
Multiple disabilities 47 0.0% 66.0% 57 0.0% 61.4%
Autism 378 82.0% 8.7% 428 82.2% 10.0%
Traumatic brain injury 55 100.0% 0.0% 75 85.3% 14.7%
Students with Disabilities Receiving Support under Section 504
Unfortunately, very little data is available for students receiving services under Section 504 of
the 1973 Rehabilitation Act as amended. As a result, we can only report the total figures reported
in Civil Rights data of the U.S. Department of Education. In 2006, a total of 7,928 (7,656 in
2004; 7,971 in 2000) students were receiving support services under Section 504, not under
IDEA. These students had a physical or mental impairment that substantially limited one or
more major life activities but did not result in learning issues that would have made them eligible
for IDEA21
.
21
Source: U.S. Department of Education. Office for Civil Rights (OCR). Civil Rights Data Collection. Retrieved from http://ocrdata.ed.gov/Downloads.aspx.
I-21
EMPLOYMENT SERVICES (1):
Workforce Investment System (MICHIGAN WORKS!)
This section describes the outcome data of the workforce investment system that provides
employment services to individuals with disabilities who may not be aware of, qualify for, or
desire the state Vocational Rehabilitation (VR) services which is designed to provide services
primarily to individuals with the most significant disabilities. The Workforce Investment Act
(WIA) created a new comprehensive workforce investment system that was designed to alter the
way employment and training services are delivered.
Employment Services Funded by Wagner-Peyser Act
As part of the One-Stop services delivery system, Wagner-Peyser employment services focuses
on providing a variety of employment-related labor exchange services including job search
assistance, job referral, and placement assistance for job seekers, re-employment services to
unemployment insurance claimants, and recruitment services to employers with job openings
(Government Accountability Office, 2007).
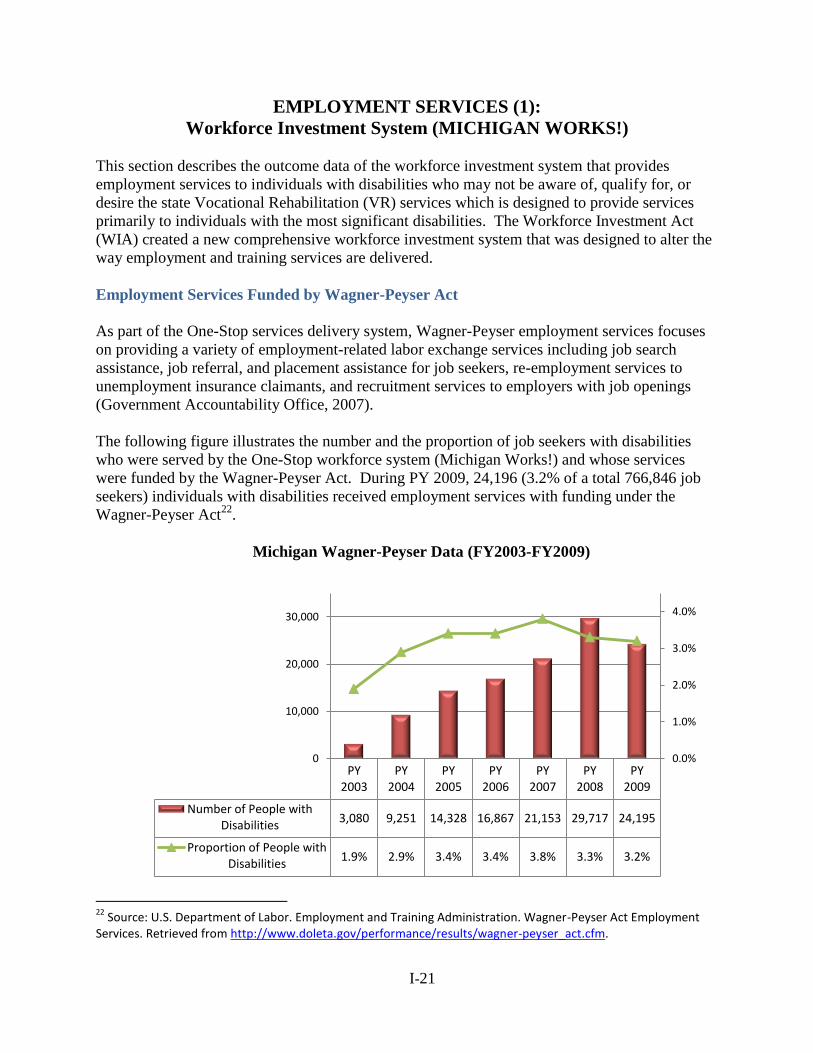
The following figure illustrates the number and the proportion of job seekers with disabilities
who were served by the One-Stop workforce system (Michigan Works!) and whose services
were funded by the Wagner-Peyser Act. During PY 2009, 24,196 (3.2% of a total 766,846 job
seekers) individuals with disabilities received employment services with funding under the
Wagner-Peyser Act22
.
Michigan Wagner-Peyser Data (FY2003-FY2009)
22
Source: U.S. Department of Labor. Employment and Training Administration. Wagner-Peyser Act Employment Services. Retrieved from http://www.doleta.gov/performance/results/wagner-peyser_act.cfm.
PY 2003
PY 2004
PY 2005
PY 2006
PY 2007
PY 2008
PY 2009
Number of People with Disabilities
3,080 9,251 14,328 16,867 21,153 29,717 24,195
Proportion of People with Disabilities
1.9% 2.9% 3.4% 3.4% 3.8% 3.3% 3.2%
0.0%
1.0%
2.0%
3.0%
4.0%
0
10,000
20,000
30,000
I-22
Employment Services Funded by Workforce Investment Act
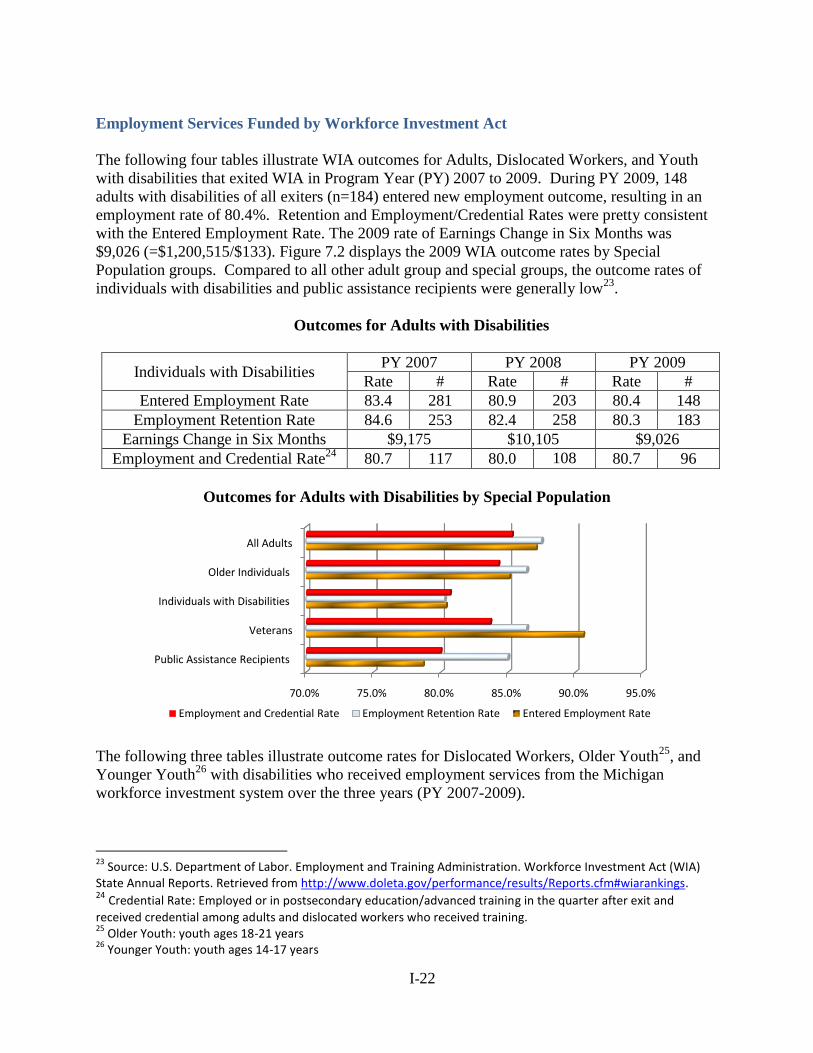
The following four tables illustrate WIA outcomes for Adults, Dislocated Workers, and Youth
with disabilities that exited WIA in Program Year (PY) 2007 to 2009. During PY 2009, 148
adults with disabilities of all exiters (n=184) entered new employment outcome, resulting in an
employment rate of 80.4%. Retention and Employment/Credential Rates were pretty consistent
with the Entered Employment Rate. The 2009 rate of Earnings Change in Six Months was
$9,026 (=$1,200,515/$133). Figure 7.2 displays the 2009 WIA outcome rates by Special
Population groups. Compared to all other adult group and special groups, the outcome rates of
individuals with disabilities and public assistance recipients were generally low23
.
Outcomes for Adults with Disabilities
Individuals with Disabilities PY 2007 PY 2008 PY 2009
Rate # Rate # Rate #
Entered Employment Rate 83.4 281 80.9 203 80.4 148
Employment Retention Rate 84.6 253 82.4 258 80.3 183
Earnings Change in Six Months $9,175 $10,105 $9,026
Employment and Credential Rate24
80.7 117 80.0 108 80.7 96
Outcomes for Adults with Disabilities by Special Population
The following three tables illustrate outcome rates for Dislocated Workers, Older Youth25
, and
Younger Youth26
with disabilities who received employment services from the Michigan
workforce investment system over the three years (PY 2007-2009).
23
Source: U.S. Department of Labor. Employment and Training Administration. Workforce Investment Act (WIA) State Annual Reports. Retrieved from http://www.doleta.gov/performance/results/Reports.cfm#wiarankings. 24 Credential Rate: Employed or in postsecondary education/advanced training in the quarter after exit and
received credential among adults and dislocated workers who received training. 25
Older Youth: youth ages 18-21 years 26
Younger Youth: youth ages 14-17 years
70.0% 75.0% 80.0% 85.0% 90.0% 95.0%
Public Assistance Recipients
Veterans
Individuals with Disabilities
Older Individuals
All Adults
Employment and Credential Rate Employment Retention Rate Entered Employment Rate
I-23
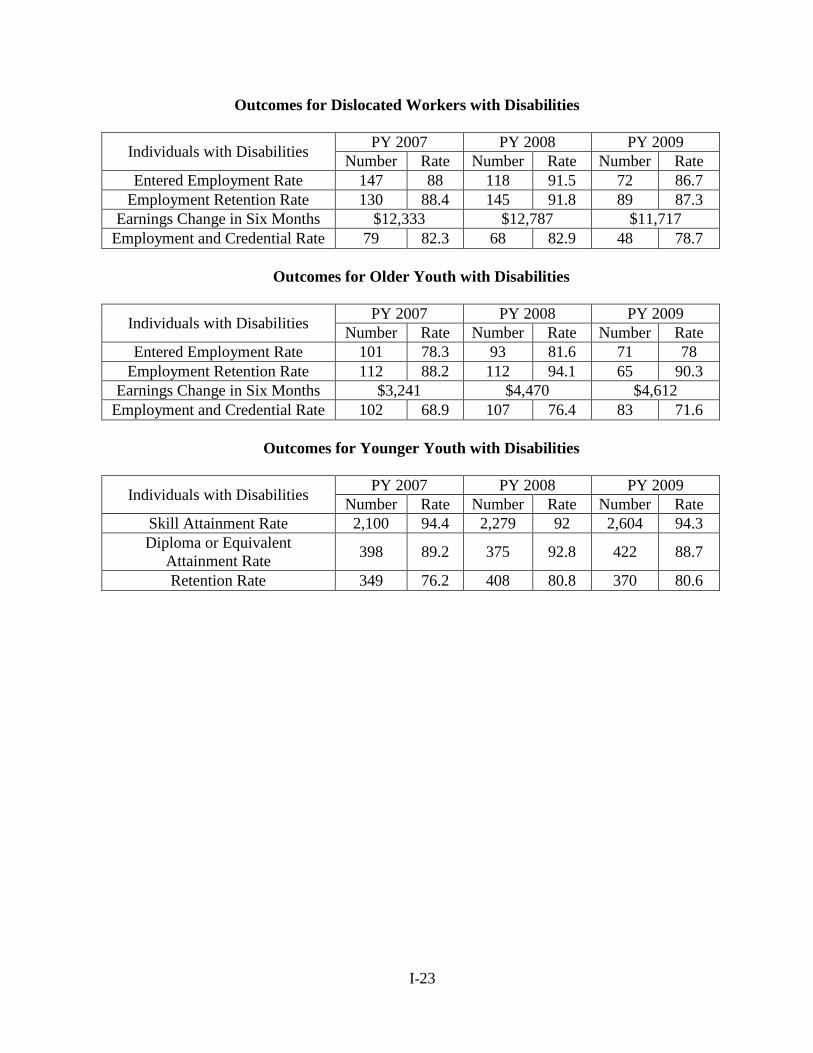
Outcomes for Dislocated Workers with Disabilities
Individuals with Disabilities PY 2007 PY 2008 PY 2009
Number Rate Number Rate Number Rate
Entered Employment Rate 147 88 118 91.5 72 86.7
Employment Retention Rate 130 88.4 145 91.8 89 87.3
Earnings Change in Six Months $12,333 $12,787 $11,717
Employment and Credential Rate 79 82.3 68 82.9 48 78.7
Outcomes for Older Youth with Disabilities
Individuals with Disabilities PY 2007 PY 2008 PY 2009
Number Rate Number Rate Number Rate
Entered Employment Rate 101 78.3 93 81.6 71 78
Employment Retention Rate 112 88.2 112 94.1 65 90.3
Earnings Change in Six Months $3,241 $4,470 $4,612
Employment and Credential Rate 102 68.9 107 76.4 83 71.6
Outcomes for Younger Youth with Disabilities
Individuals with Disabilities PY 2007 PY 2008 PY 2009
Number Rate Number Rate Number Rate
Skill Attainment Rate 2,100 94.4 2,279 92 2,604 94.3
Diploma or Equivalent
Attainment Rate 398 89.2 375 92.8 422 88.7
Retention Rate 349 76.2 408 80.8 370 80.6
I-24
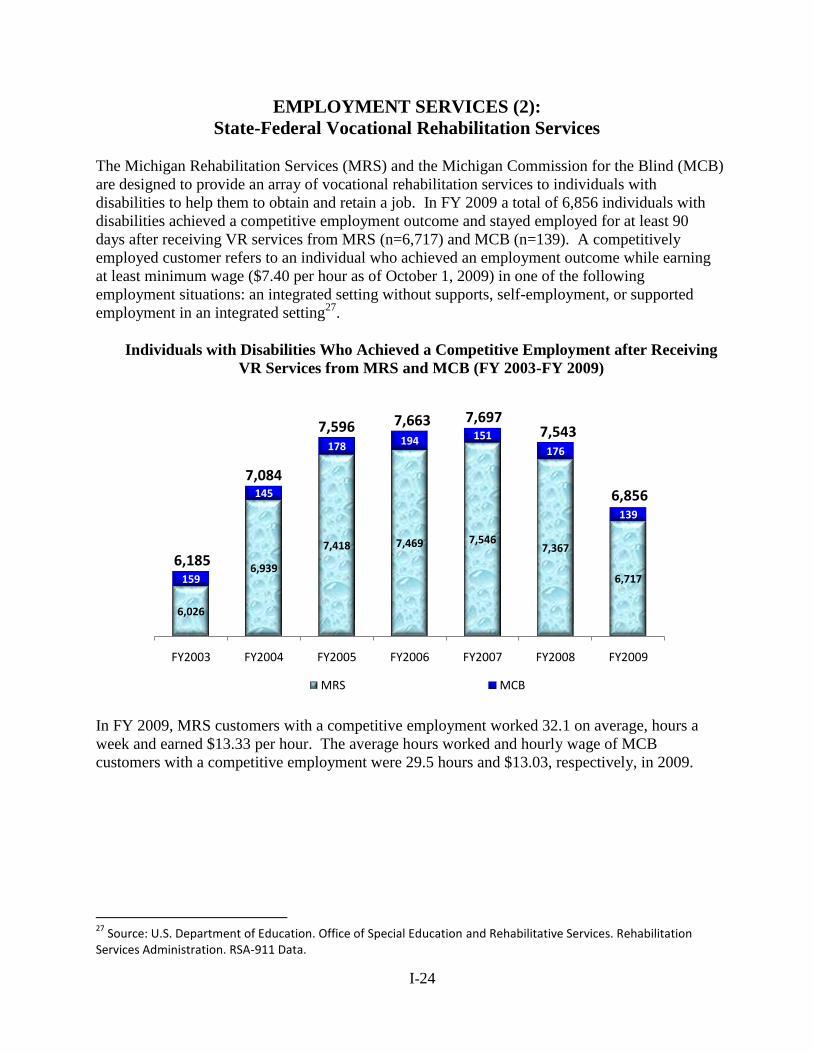
EMPLOYMENT SERVICES (2):
State-Federal Vocational Rehabilitation Services
The Michigan Rehabilitation Services (MRS) and the Michigan Commission for the Blind (MCB)
are designed to provide an array of vocational rehabilitation services to individuals with
disabilities to help them to obtain and retain a job. In FY 2009 a total of 6,856 individuals with
disabilities achieved a competitive employment outcome and stayed employed for at least 90
days after receiving VR services from MRS (n=6,717) and MCB (n=139). A competitively
employed customer refers to an individual who achieved an employment outcome while earning
at least minimum wage ($7.40 per hour as of October 1, 2009) in one of the following
employment situations: an integrated setting without supports, self-employment, or supported
employment in an integrated setting27
.
Individuals with Disabilities Who Achieved a Competitive Employment after Receiving
VR Services from MRS and MCB (FY 2003-FY 2009)
In FY 2009, MRS customers with a competitive employment worked 32.1 on average, hours a
week and earned $13.33 per hour. The average hours worked and hourly wage of MCB
customers with a competitive employment were 29.5 hours and $13.03, respectively, in 2009.
27
Source: U.S. Department of Education. Office of Special Education and Rehabilitative Services. Rehabilitation Services Administration. RSA-911 Data.
6,026
6,939
7,418 7,469 7,5467,367
6,717159
145
178 194 151
176
139
6,185
7,084
7,596 7,663 7,6977,543
6,856
FY2003 FY2004 FY2005 FY2006 FY2007 FY2008 FY2009
MRS MCB
I-25
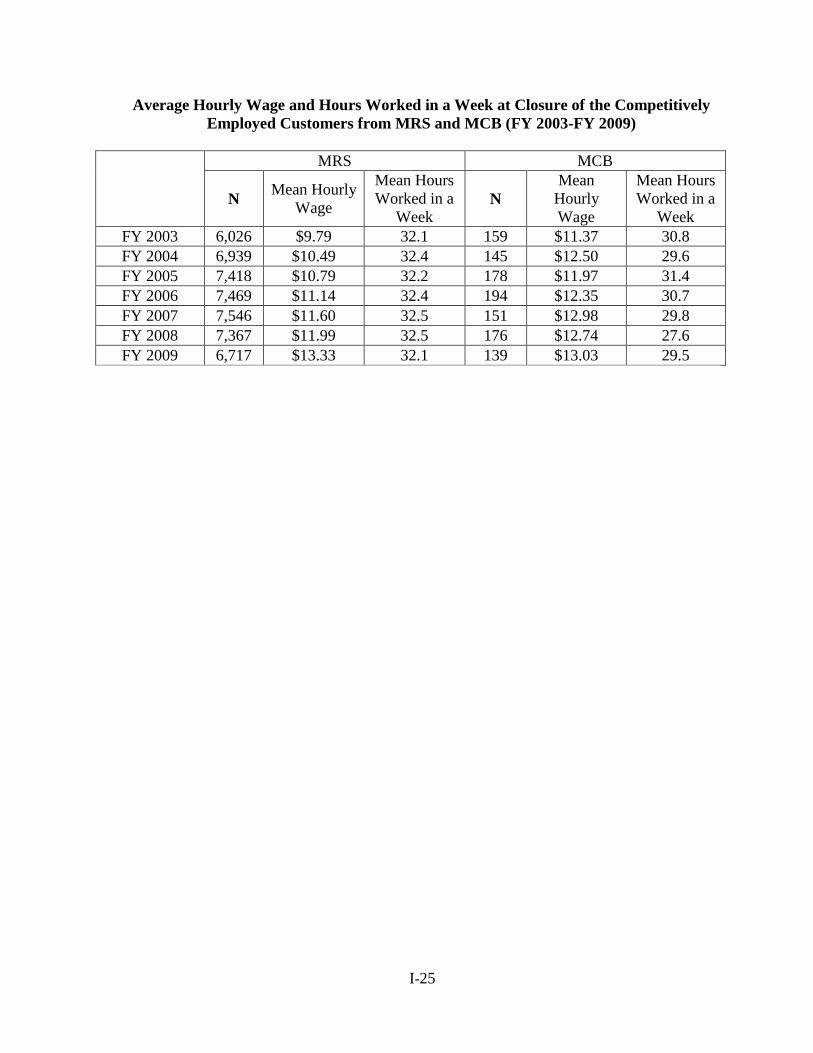
Average Hourly Wage and Hours Worked in a Week at Closure of the Competitively
Employed Customers from MRS and MCB (FY 2003-FY 2009)
MRS MCB
N Mean Hourly
Wage
Mean Hours
Worked in a
Week N
Mean
Hourly
Wage
Mean Hours
Worked in a
Week
FY 2003 6,026 $9.79 32.1 159 $11.37 30.8
FY 2004 6,939 $10.49 32.4 145 $12.50 29.6
FY 2005 7,418 $10.79 32.2 178 $11.97 31.4
FY 2006 7,469 $11.14 32.4 194 $12.35 30.7
FY 2007 7,546 $11.60 32.5 151 $12.98 29.8
FY 2008 7,367 $11.99 32.5 176 $12.74 27.6
FY 2009 6,717 $13.33 32.1 139 $13.03 29.5
STATEWIDE COMPREHENSIVE
NEEDS ASSESSMENT
SECTION II
RSA-911 DATA (MRS & MCB)
&
RSA-704 (MiSILC)
PROJECT EXCELLENCE
MICHIGAN STATE UNIVERSITY
II- 1
TABLE OF CONTENTS
Michigan Rehabilitation Services (MRS) II-2
MRS Customers at a Glance II-2
VR Process and Outcomes II-4
Factors Related to VR Process and VR Outcomes II-5
Further Investigation for Special Population II-10
Michigan Commission for the Blind (MCB) II-13
MCB Customers at a Glance II-13
VR Process and Outcomes II-14
Factors Related to VR Process and VR Outcomes II-14
Centers for Independent Living in Michigan II-19
CIL Consumers with a Consumer Service Record II-19
IL Service Provided II-20
Goals Related to Increased Independence in Significant Life Areas II-21
Community Activities II-23
Appendix II-a: Individual Characteristics of MRS Customers and VR
Outcomes
II-24
Appendix II-b: Individual Characteristics of MCB Customers and VR
Outcomes
II-26
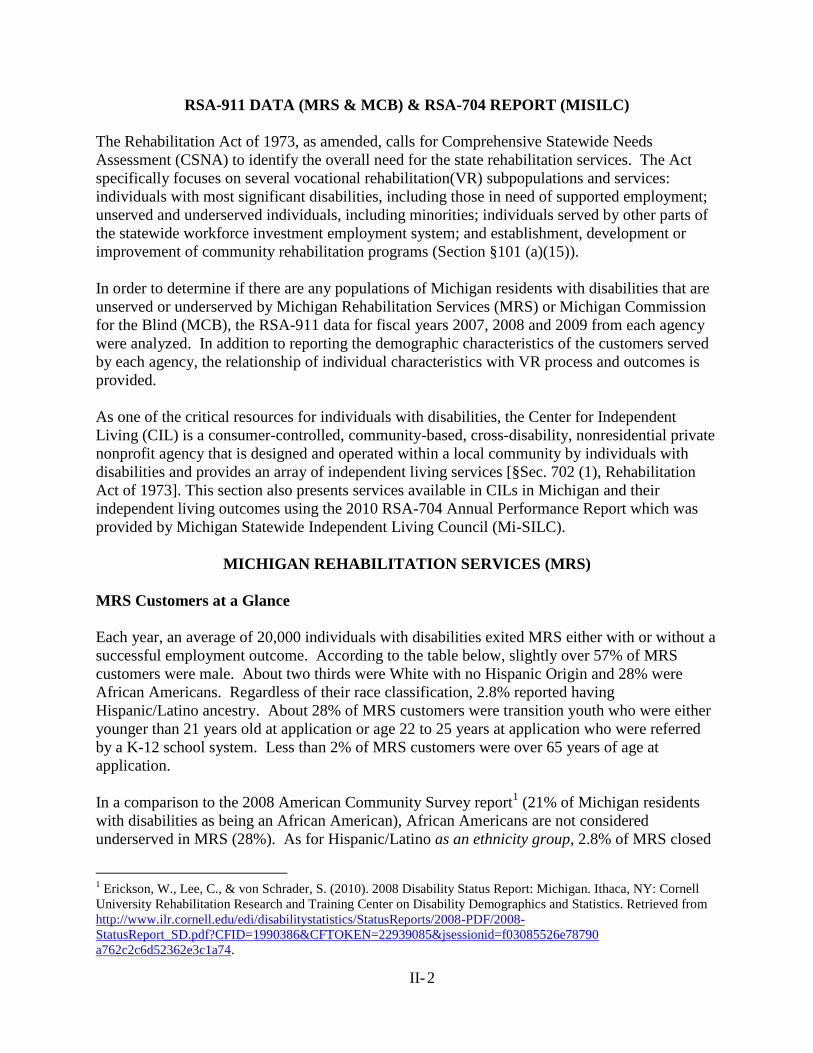
II- 2
RSA-911 DATA (MRS & MCB) & RSA-704 REPORT (MISILC)
The Rehabilitation Act of 1973, as amended, calls for Comprehensive Statewide Needs
Assessment (CSNA) to identify the overall need for the state rehabilitation services. The Act
specifically focuses on several vocational rehabilitation(VR) subpopulations and services:
individuals with most significant disabilities, including those in need of supported employment;
unserved and underserved individuals, including minorities; individuals served by other parts of
the statewide workforce investment employment system; and establishment, development or
improvement of community rehabilitation programs (Section §101 (a)(15)).
In order to determine if there are any populations of Michigan residents with disabilities that are
unserved or underserved by Michigan Rehabilitation Services (MRS) or Michigan Commission
for the Blind (MCB), the RSA-911 data for fiscal years 2007, 2008 and 2009 from each agency
were analyzed. In addition to reporting the demographic characteristics of the customers served
by each agency, the relationship of individual characteristics with VR process and outcomes is
provided.
As one of the critical resources for individuals with disabilities, the Center for Independent
Living (CIL) is a consumer-controlled, community-based, cross-disability, nonresidential private
nonprofit agency that is designed and operated within a local community by individuals with
disabilities and provides an array of independent living services [§Sec. 702 (1), Rehabilitation
Act of 1973]. This section also presents services available in CILs in Michigan and their
independent living outcomes using the 2010 RSA-704 Annual Performance Report which was
provided by Michigan Statewide Independent Living Council (Mi-SILC).
MICHIGAN REHABILITATION SERVICES (MRS)
MRS Customers at a Glance
Each year, an average of 20,000 individuals with disabilities exited MRS either with or without a
successful employment outcome. According to the table below, slightly over 57% of MRS
customers were male. About two thirds were White with no Hispanic Origin and 28% were
African Americans. Regardless of their race classification, 2.8% reported having
Hispanic/Latino ancestry. About 28% of MRS customers were transition youth who were either
younger than 21 years old at application or age 22 to 25 years at application who were referred
by a K-12 school system. Less than 2% of MRS customers were over 65 years of age at
application.
In a comparison to the 2008 American Community Survey report1 (21% of Michigan residents
with disabilities as being an African American), African Americans are not considered
underserved in MRS (28%). As for Hispanic/Latino as an ethnicity group, 2.8% of MRS closed
1 Erickson, W., Lee, C., & von Schrader, S. (2010). 2008 Disability Status Report: Michigan. Ithaca, NY: Cornell
University Rehabilitation Research and Training Center on Disability Demographics and Statistics. Retrieved from
http://www.ilr.cornell.edu/edi/disabilitystatistics/StatusReports/2008-PDF/2008-
StatusReport_SD.pdf?CFID=1990386&CFTOKEN=22939085&jsessionid=f03085526e78790
a762c2c6d52362e3c1a74.
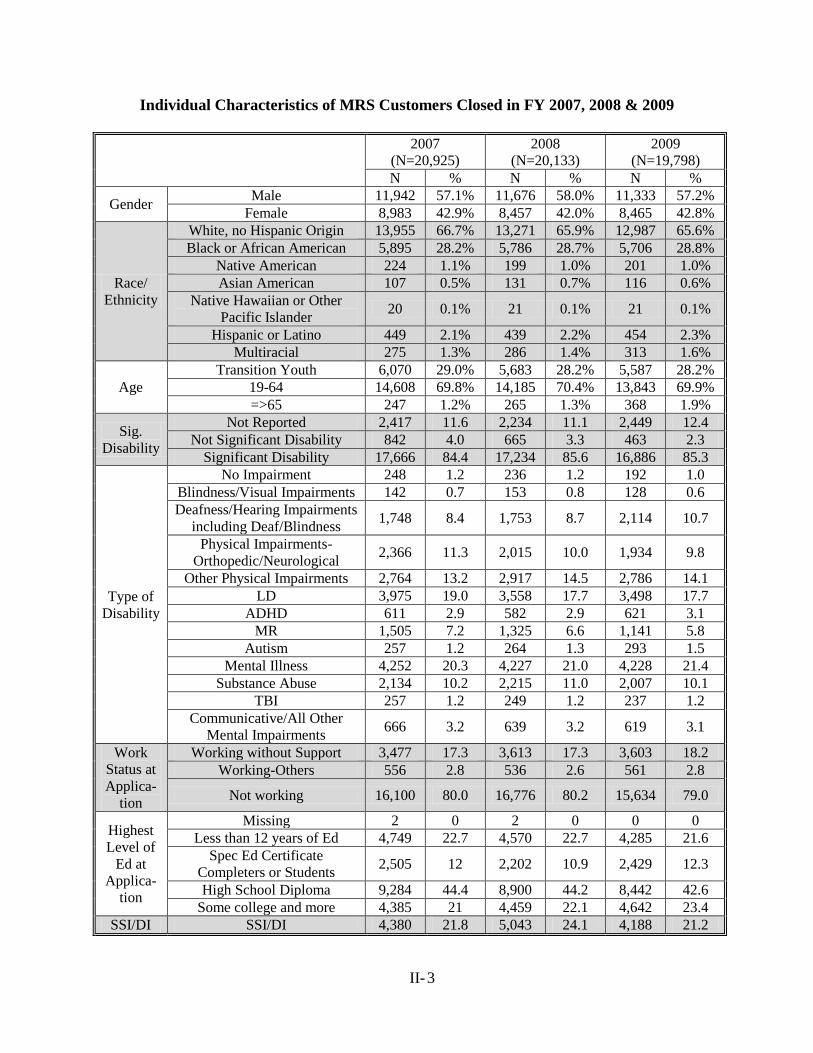
II- 3
Individual Characteristics of MRS Customers Closed in FY 2007, 2008 & 2009
2007
(N=20,925)
2008
(N=20,133)
2009
(N=19,798)
N % N % N %
Gender Male 11,942 57.1% 11,676 58.0% 11,333 57.2%
Female 8,983 42.9% 8,457 42.0% 8,465 42.8%
Race/
Ethnicity
White, no Hispanic Origin 13,955 66.7% 13,271 65.9% 12,987 65.6%
Black or African American 5,895 28.2% 5,786 28.7% 5,706 28.8%
Native American 224 1.1% 199 1.0% 201 1.0%
Asian American 107 0.5% 131 0.7% 116 0.6%
Native Hawaiian or Other
Pacific Islander 20 0.1% 21 0.1% 21 0.1%
Hispanic or Latino 449 2.1% 439 2.2% 454 2.3%
Multiracial 275 1.3% 286 1.4% 313 1.6%
Age
Transition Youth 6,070 29.0% 5,683 28.2% 5,587 28.2%
19-64 14,608 69.8% 14,185 70.4% 13,843 69.9%
=>65 247 1.2% 265 1.3% 368 1.9%
Sig.
Disability
Not Reported 2,417 11.6 2,234 11.1 2,449 12.4
Not Significant Disability 842 4.0 665 3.3 463 2.3
Significant Disability 17,666 84.4 17,234 85.6 16,886 85.3
Type of
Disability
No Impairment 248 1.2 236 1.2 192 1.0
Blindness/Visual Impairments 142 0.7 153 0.8 128 0.6
Deafness/Hearing Impairments
including Deaf/Blindness 1,748 8.4 1,753 8.7 2,114 10.7
Physical Impairments-
Orthopedic/Neurological 2,366 11.3 2,015 10.0 1,934 9.8
Other Physical Impairments 2,764 13.2 2,917 14.5 2,786 14.1
LD 3,975 19.0 3,558 17.7 3,498 17.7
ADHD 611 2.9 582 2.9 621 3.1
MR 1,505 7.2 1,325 6.6 1,141 5.8
Autism 257 1.2 264 1.3 293 1.5
Mental Illness 4,252 20.3 4,227 21.0 4,228 21.4
Substance Abuse 2,134 10.2 2,215 11.0 2,007 10.1
TBI 257 1.2 249 1.2 237 1.2
Communicative/All Other
Mental Impairments 666 3.2 639 3.2 619 3.1
Work
Status at
Applica-
tion
Working without Support 3,477 17.3 3,613 17.3 3,603 18.2
Working-Others 556 2.8 536 2.6 561 2.8
Not working 16,100 80.0 16,776 80.2 15,634 79.0
Highest
Level of
Ed at
Applica-
tion
Missing 2 0 2 0 0 0
Less than 12 years of Ed 4,749 22.7 4,570 22.7 4,285 21.6
Spec Ed Certificate
Completers or Students 2,505 12 2,202 10.9 2,429 12.3
High School Diploma 9,284 44.4 8,900 44.2 8,442 42.6
Some college and more 4,385 21 4,459 22.1 4,642 23.4
SSI/DI SSI/DI 4,380 21.8 5,043 24.1 4,188 21.2
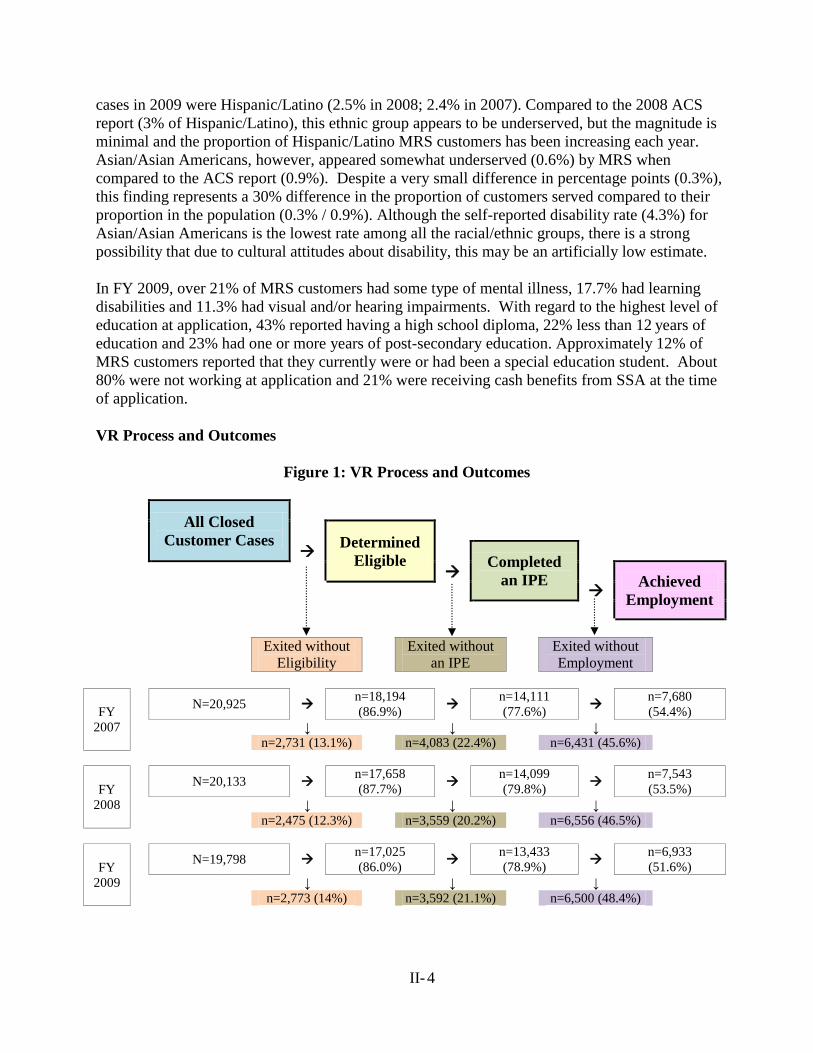
II- 4
cases in 2009 were Hispanic/Latino (2.5% in 2008; 2.4% in 2007). Compared to the 2008 ACS
report (3% of Hispanic/Latino), this ethnic group appears to be underserved, but the magnitude is
minimal and the proportion of Hispanic/Latino MRS customers has been increasing each year.
Asian/Asian Americans, however, appeared somewhat underserved (0.6%) by MRS when
compared to the ACS report (0.9%). Despite a very small difference in percentage points (0.3%),
this finding represents a 30% difference in the proportion of customers served compared to their
proportion in the population (0.3% / 0.9%). Although the self-reported disability rate (4.3%) for
Asian/Asian Americans is the lowest rate among all the racial/ethnic groups, there is a strong
possibility that due to cultural attitudes about disability, this may be an artificially low estimate.
In FY 2009, over 21% of MRS customers had some type of mental illness, 17.7% had learning
disabilities and 11.3% had visual and/or hearing impairments. With regard to the highest level of
education at application, 43% reported having a high school diploma, 22% less than 12 years of
education and 23% had one or more years of post-secondary education. Approximately 12% of
MRS customers reported that they currently were or had been a special education student. About
80% were not working at application and 21% were receiving cash benefits from SSA at the time
of application.
VR Process and Outcomes
Figure 1: VR Process and Outcomes
All Closed
Customer Cases
Determined
Eligible
Completed
an IPE
Achieved
Employment
Exited without
Eligibility
Exited without
an IPE
Exited without
Employment
FY
2007
N=20,925 n=18,194
(86.9%)
n=14,111
(77.6%)
n=7,680
(54.4%)
↓ ↓ ↓
n=2,731 (13.1%) n=4,083 (22.4%) n=6,431 (45.6%)
FY
2008
N=20,133 n=17,658
(87.7%)
n=14,099
(79.8%)
n=7,543
(53.5%)
↓ ↓ ↓
n=2,475 (12.3%) n=3,559 (20.2%) n=6,556 (46.5%)
FY
2009
N=19,798 n=17,025
(86.0%)
n=13,433
(78.9%)
n=6,933
(51.6%)
↓ ↓ ↓
n=2,773 (14%) n=3,592 (21.1%) n=6,500 (48.4%)
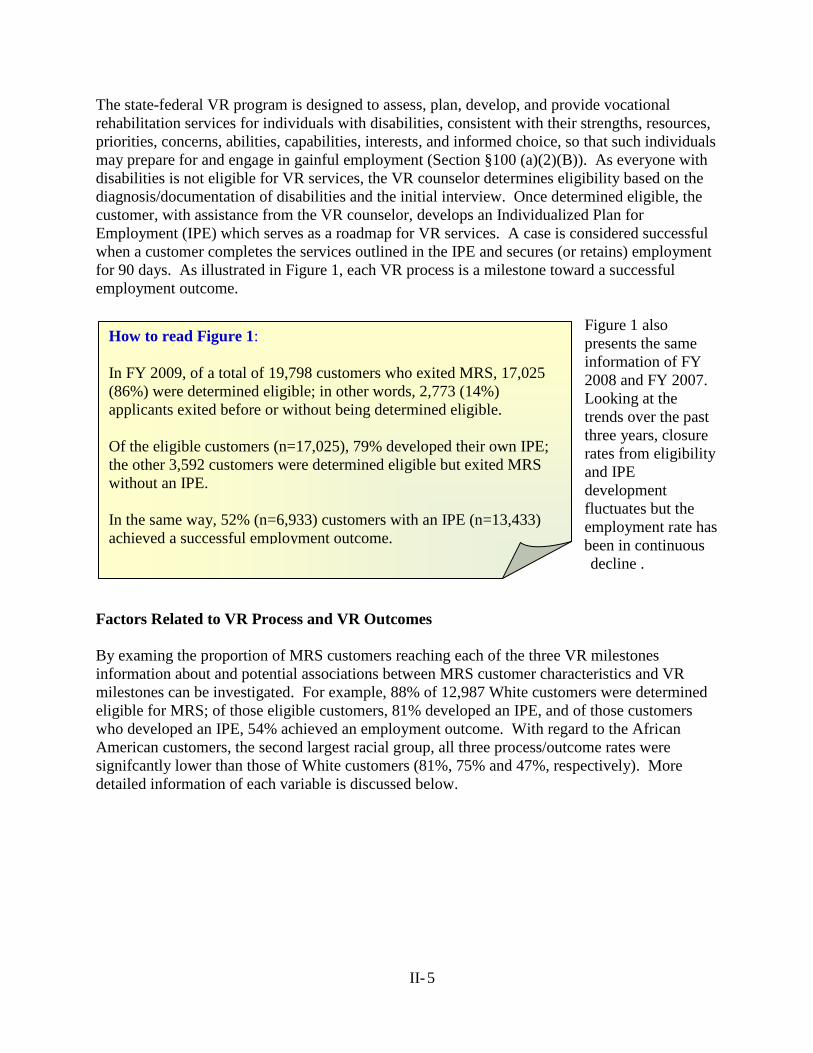
II- 5
How to read Figure 1:
In FY 2009, of a total of 19,798 customers who exited MRS, 17,025
(86%) were determined eligible; in other words, 2,773 (14%)
applicants exited before or without being determined eligible.
Of the eligible customers (n=17,025), 79% developed their own IPE;
the other 3,592 customers were determined eligible but exited MRS
without an IPE.
In the same way, 52% (n=6,933) customers with an IPE (n=13,433)
achieved a successful employment outcome.
The state-federal VR program is designed to assess, plan, develop, and provide vocational
rehabilitation services for individuals with disabilities, consistent with their strengths, resources,
priorities, concerns, abilities, capabilities, interests, and informed choice, so that such individuals
may prepare for and engage in gainful employment (Section §100 (a)(2)(B)). As everyone with
disabilities is not eligible for VR services, the VR counselor determines eligibility based on the
diagnosis/documentation of disabilities and the initial interview. Once determined eligible, the
customer, with assistance from the VR counselor, develops an Individualized Plan for
Employment (IPE) which serves as a roadmap for VR services. A case is considered successful
when a customer completes the services outlined in the IPE and secures (or retains) employment
for 90 days. As illustrated in Figure 1, each VR process is a milestone toward a successful
employment outcome.
Figure 1 also
presents the same
information of FY
2008 and FY 2007.
Looking at the
trends over the past
three years, closure
rates from eligibility
and IPE
development
fluctuates but the
employment rate has
been in continuous
decline .
Factors Related to VR Process and VR Outcomes
By examing the proportion of MRS customers reaching each of the three VR milestones
information about and potential associations between MRS customer characteristics and VR
milestones can be investigated. For example, 88% of 12,987 White customers were determined
eligible for MRS; of those eligible customers, 81% developed an IPE, and of those customers
who developed an IPE, 54% achieved an employment outcome. With regard to the African
American customers, the second largest racial group, all three process/outcome rates were
signifcantly lower than those of White customers (81%, 75% and 47%, respectively). More
detailed information of each variable is discussed below.
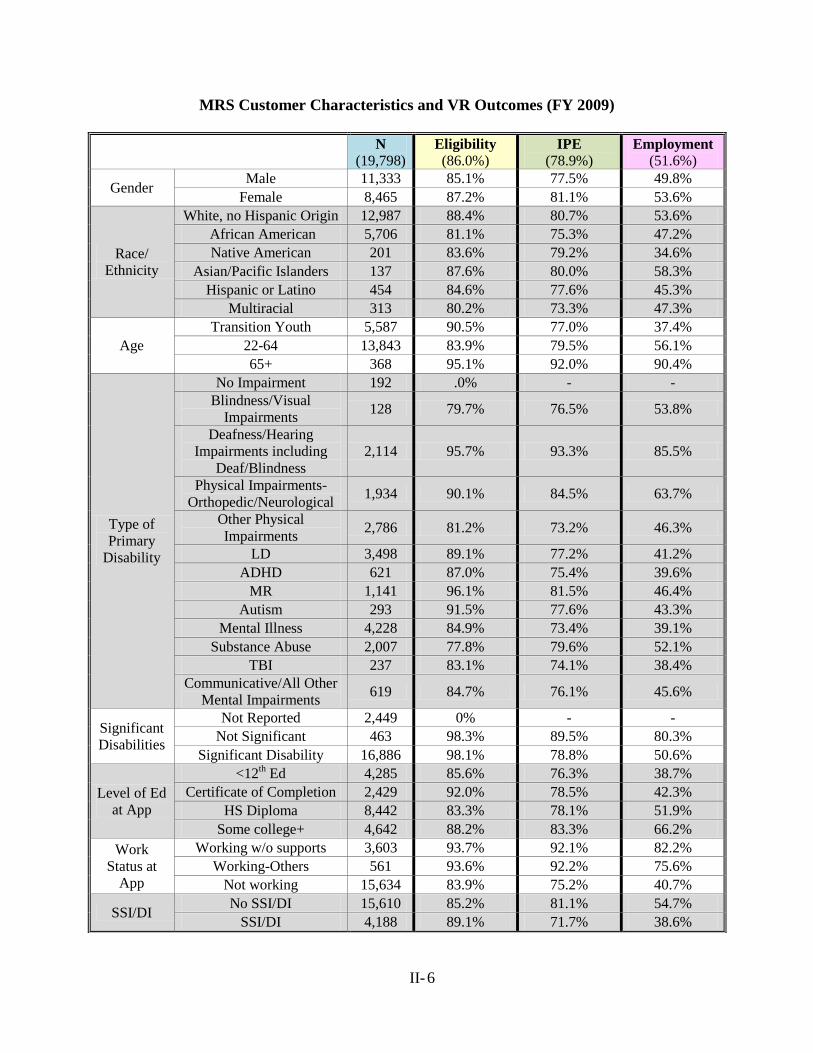
II- 6
MRS Customer Characteristics and VR Outcomes (FY 2009)
N
(19,798) Eligibility
(86.0%) IPE
(78.9%) Employment
(51.6%)
Gender Male 11,333 85.1% 77.5% 49.8%
Female 8,465 87.2% 81.1% 53.6%
Race/
Ethnicity
White, no Hispanic Origin 12,987 88.4% 80.7% 53.6%
African American 5,706 81.1% 75.3% 47.2%
Native American 201 83.6% 79.2% 34.6%
Asian/Pacific Islanders 137 87.6% 80.0% 58.3%
Hispanic or Latino 454 84.6% 77.6% 45.3%
Multiracial 313 80.2% 73.3% 47.3%
Age
Transition Youth 5,587 90.5% 77.0% 37.4%
22-64 13,843 83.9% 79.5% 56.1%
65+ 368 95.1% 92.0% 90.4%
Type of
Primary
Disability
No Impairment 192 .0% - -
Blindness/Visual
Impairments 128 79.7% 76.5% 53.8%
Deafness/Hearing
Impairments including
Deaf/Blindness
2,114 95.7% 93.3% 85.5%
Physical Impairments-
Orthopedic/Neurological 1,934 90.1% 84.5% 63.7%
Other Physical
Impairments 2,786 81.2% 73.2% 46.3%
LD 3,498 89.1% 77.2% 41.2%
ADHD 621 87.0% 75.4% 39.6%
MR 1,141 96.1% 81.5% 46.4%
Autism 293 91.5% 77.6% 43.3%
Mental Illness 4,228 84.9% 73.4% 39.1%
Substance Abuse 2,007 77.8% 79.6% 52.1%
TBI 237 83.1% 74.1% 38.4%
Communicative/All Other
Mental Impairments 619 84.7% 76.1% 45.6%
Significant
Disabilities
Not Reported 2,449 0% - -
Not Significant 463 98.3% 89.5% 80.3%
Significant Disability 16,886 98.1% 78.8% 50.6%
Level of Ed
at App
<12th Ed 4,285 85.6% 76.3% 38.7%
Certificate of Completion 2,429 92.0% 78.5% 42.3%
HS Diploma 8,442 83.3% 78.1% 51.9%
Some college+ 4,642 88.2% 83.3% 66.2%
Work
Status at
App
Working w/o supports 3,603 93.7% 92.1% 82.2%
Working-Others 561 93.6% 92.2% 75.6%
Not working 15,634 83.9% 75.2% 40.7%
SSI/DI No SSI/DI 15,610 85.2% 81.1% 54.7%
SSI/DI 4,188 89.1% 71.7% 38.6%
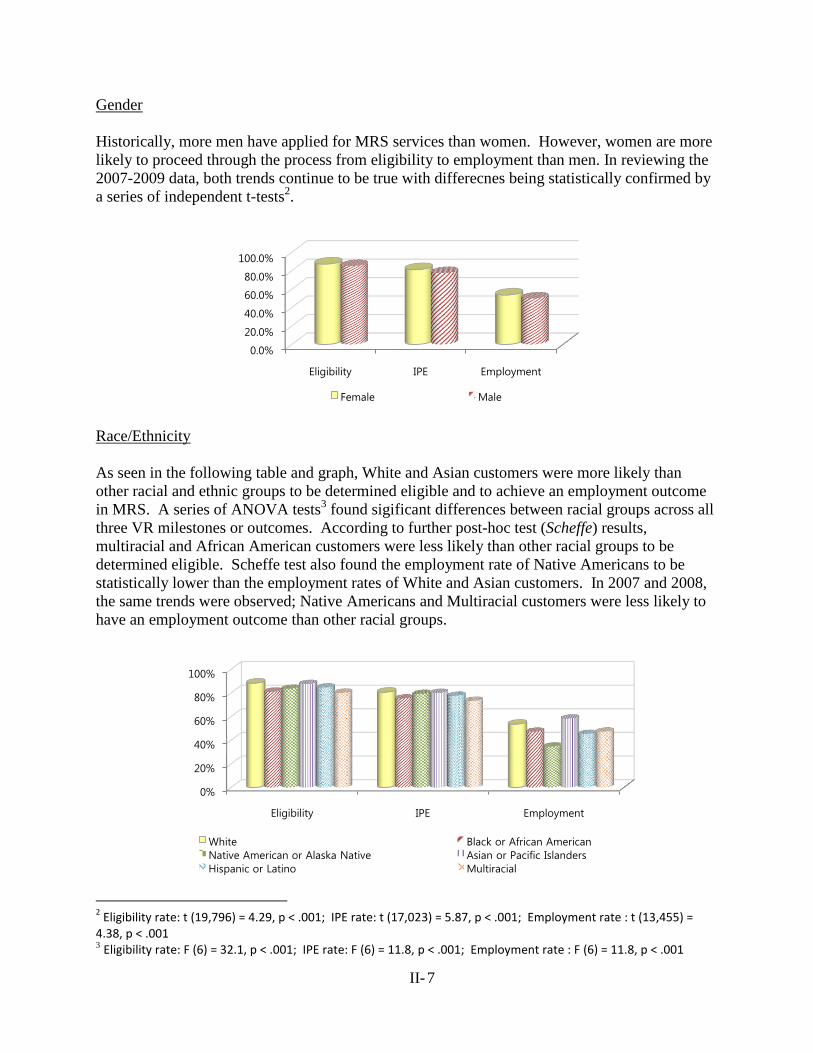
II- 7
Gender
Historically, more men have applied for MRS services than women. However, women are more
likely to proceed through the process from eligibility to employment than men. In reviewing the
2007-2009 data, both trends continue to be true with differecnes being statistically confirmed by
a series of independent t-tests2.
Race/Ethnicity
As seen in the following table and graph, White and Asian customers were more likely than
other racial and ethnic groups to be determined eligible and to achieve an employment outcome
in MRS. A series of ANOVA tests3 found sigificant differences between racial groups across all
three VR milestones or outcomes. According to further post-hoc test (Scheffe) results,
multiracial and African American customers were less likely than other racial groups to be
determined eligible. Scheffe test also found the employment rate of Native Americans to be
statistically lower than the employment rates of White and Asian customers. In 2007 and 2008,
the same trends were observed; Native Americans and Multiracial customers were less likely to
have an employment outcome than other racial groups.
2 Eligibility rate: t (19,796) = 4.29, p < .001; IPE rate: t (17,023) = 5.87, p < .001; Employment rate : t (13,455) =
4.38, p < .001 3 Eligibility rate: F (6) = 32.1, p < .001; IPE rate: F (6) = 11.8, p < .001; Employment rate : F (6) = 11.8, p < .001
0.0%
20.0%
40.0%
60.0%
80.0%
100.0%
Eligibility IPE Employment
Female Male
0%
20%
40%
60%
80%
100%
Eligibility IPE Employment
White Black or African American
Native American or Alaska Native Asian or Pacific Islanders
Hispanic or Latino Multiracial
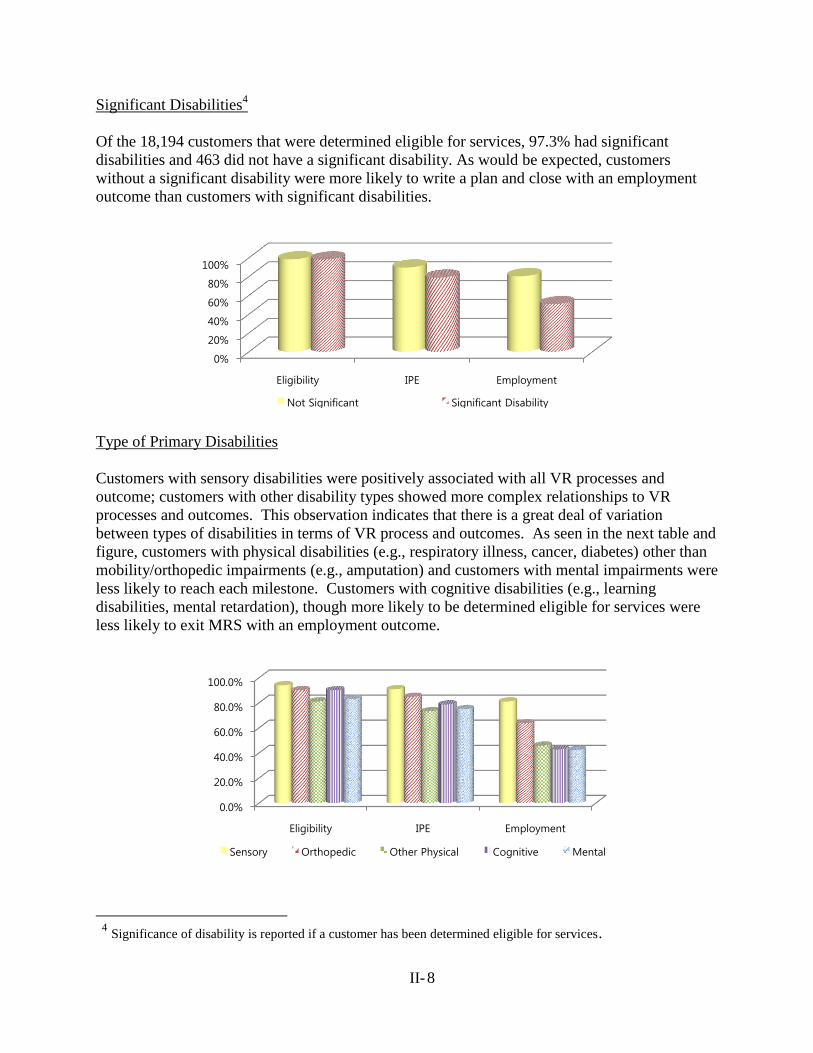
II- 8
Significant Disabilities4
Of the 18,194 customers that were determined eligible for services, 97.3% had significant
disabilities and 463 did not have a significant disability. As would be expected, customers
without a significant disability were more likely to write a plan and close with an employment
outcome than customers with significant disabilities.
Type of Primary Disabilities
Customers with sensory disabilities were positively associated with all VR processes and
outcome; customers with other disability types showed more complex relationships to VR
processes and outcomes. This observation indicates that there is a great deal of variation
between types of disabilities in terms of VR process and outcomes. As seen in the next table and
figure, customers with physical disabilities (e.g., respiratory illness, cancer, diabetes) other than
mobility/orthopedic impairments (e.g., amputation) and customers with mental impairments were
less likely to reach each milestone. Customers with cognitive disabilities (e.g., learning
disabilities, mental retardation), though more likely to be determined eligible for services were
less likely to exit MRS with an employment outcome.
4 Significance of disability is reported if a customer has been determined eligible for services.
0%
20%
40%
60%
80%
100%
Eligibility IPE Employment
Not Significant Significant Disability
0.0%
20.0%
40.0%
60.0%
80.0%
100.0%
Eligibility IPE Employment
Sensory Orthopedic Other Physical Cognitive Mental
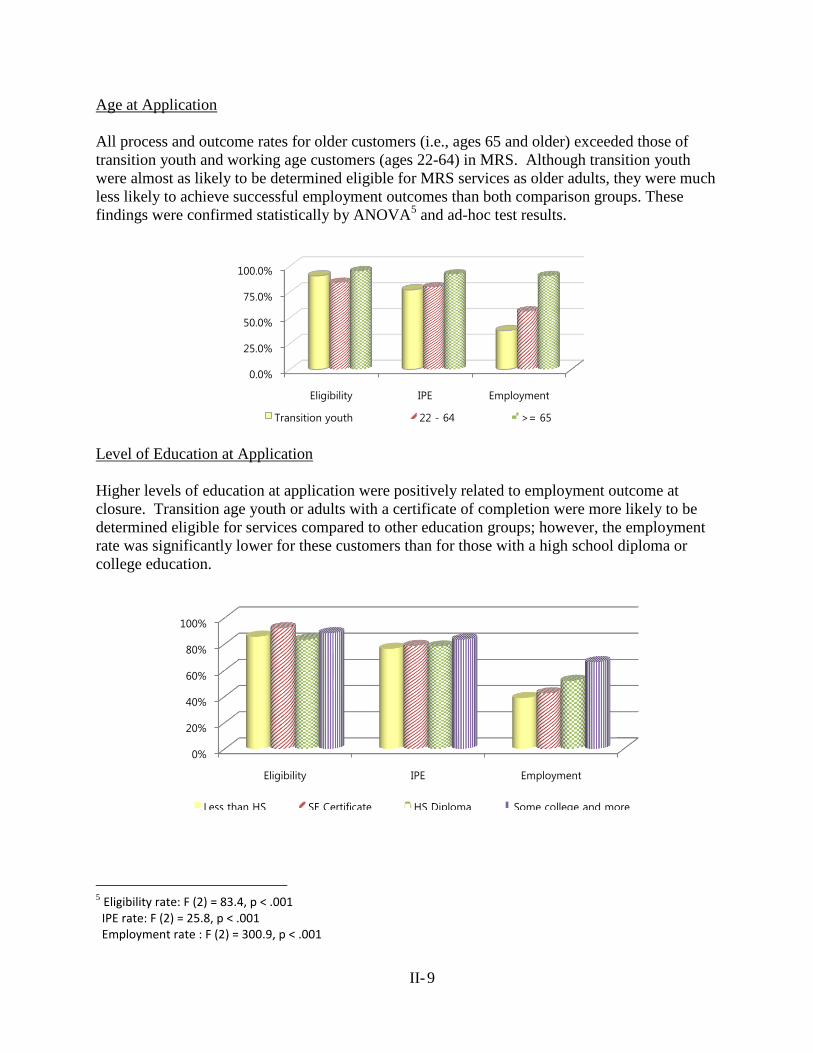
II- 9
Age at Application
All process and outcome rates for older customers (i.e., ages 65 and older) exceeded those of
transition youth and working age customers (ages 22-64) in MRS. Although transition youth
were almost as likely to be determined eligible for MRS services as older adults, they were much
less likely to achieve successful employment outcomes than both comparison groups. These
findings were confirmed statistically by ANOVA5 and ad-hoc test results.
Level of Education at Application
Higher levels of education at application were positively related to employment outcome at
closure. Transition age youth or adults with a certificate of completion were more likely to be
determined eligible for services compared to other education groups; however, the employment
rate was significantly lower for these customers than for those with a high school diploma or
college education.
5 Eligibility rate: F (2) = 83.4, p < .001 IPE rate: F (2) = 25.8, p < .001 Employment rate : F (2) = 300.9, p < .001
0.0%
25.0%
50.0%
75.0%
100.0%
Eligibility IPE Employment
Transition youth 22 - 64 >= 65
0%
20%
40%
60%
80%
100%
Eligibility IPE Employment
Less than HS SE Certificate HS Diploma Some college and more
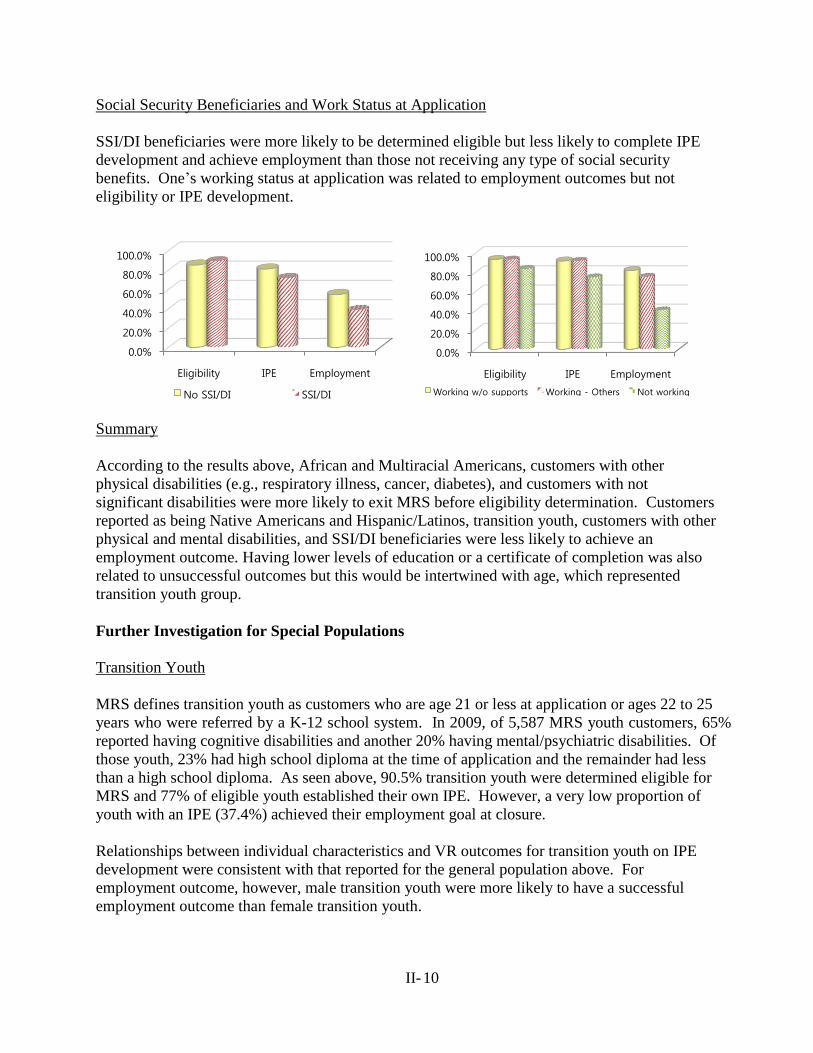
II- 10
Social Security Beneficiaries and Work Status at Application
SSI/DI beneficiaries were more likely to be determined eligible but less likely to complete IPE
development and achieve employment than those not receiving any type of social security
benefits. One’s working status at application was related to employment outcomes but not
eligibility or IPE development.
Summary
According to the results above, African and Multiracial Americans, customers with other
physical disabilities (e.g., respiratory illness, cancer, diabetes), and customers with not
significant disabilities were more likely to exit MRS before eligibility determination. Customers
reported as being Native Americans and Hispanic/Latinos, transition youth, customers with other
physical and mental disabilities, and SSI/DI beneficiaries were less likely to achieve an
employment outcome. Having lower levels of education or a certificate of completion was also
related to unsuccessful outcomes but this would be intertwined with age, which represented
transition youth group.
Further Investigation for Special Populations
Transition Youth
MRS defines transition youth as customers who are age 21 or less at application or ages 22 to 25
years who were referred by a K-12 school system. In 2009, of 5,587 MRS youth customers, 65%
reported having cognitive disabilities and another 20% having mental/psychiatric disabilities. Of
those youth, 23% had high school diploma at the time of application and the remainder had less
than a high school diploma. As seen above, 90.5% transition youth were determined eligible for
MRS and 77% of eligible youth established their own IPE. However, a very low proportion of
youth with an IPE (37.4%) achieved their employment goal at closure.
Relationships between individual characteristics and VR outcomes for transition youth on IPE
development were consistent with that reported for the general population above. For
employment outcome, however, male transition youth were more likely to have a successful
employment outcome than female transition youth.
0.0%
20.0%
40.0%
60.0%
80.0%
100.0%
Eligibility IPE Employment
No SSI/DI SSI/DI
0.0%
20.0%
40.0%
60.0%
80.0%
100.0%
Eligibility IPE Employment
Working w/o supports Working - Others Not working
II- 11
Supported Employment Customers
Receiving supported employment services through MRS indicates that the customer was
determined eligible and that an IPE that included supported employment services was developed.
Thus, looking at rates of eligibility and IPE development is meaningless. In 2009, 761 customers
specified an employment outcome/ vocational goal in a supported employment setting in their
IPE. The majority of these customers had either mental illness (40%) or mental retardation (40%)
as the primary disability reported. An additional 3.3% of these customers were reported as
having autism as their primary disability and the remaining 17% had a wide array of other
disabilities. The majority (54.1%; n = 412) of the customers who received supported
employment services exited MRS with an employment outcome. A comparison of employment
outcomes of this group to customers without a supported employment plan (51.4%) shows a
slightly higher proportion of supported employment customers were closed with an employment
outcome.
Customers with received a supported employment goal were more likely to receive Job
Placement Assistance (52.6%) and On the Job Supports (58.5%) services than their counterparts.
Further, 60% of the customers who had a supported employment plan and 76% who received Job
Placement and On the Job Supports services achieved successful VR outcomes. In relation to the
primary disabilities of customers with a supported employment goal, 68% of the customers with
autism, 62.7% of the customers with mental retardation and 51.5% of the customers with mental
illness achieved an employment outcome.
Of 412 customers who had supported employment written into their IPE and achieved an
employment outcome, 386 (93.7%) were working in an integrated setting with support and 339
(87.8%) of them were competitively employed. The top three occupations that supported
employment customers had at the time of closure were Building and Grounds Cleaning and
Maintenance (42%), Food Preparation and Serving Related (20%) and Production (11%)
occupations.
Type of Disabilities Using Primary Disability Cause
In order to further investigate the associations between types of disabilities and VR outcomes,
the following table shows rates of VR processes and outcomes broken down by primary cause of
impairment. Results indicated that customers with mental illnesses (e.g., Schizophrenia) or
developmental disabilities (e.g., LD, ADHD) were less likely to achieve a successful VR
outcome compared to other groups.
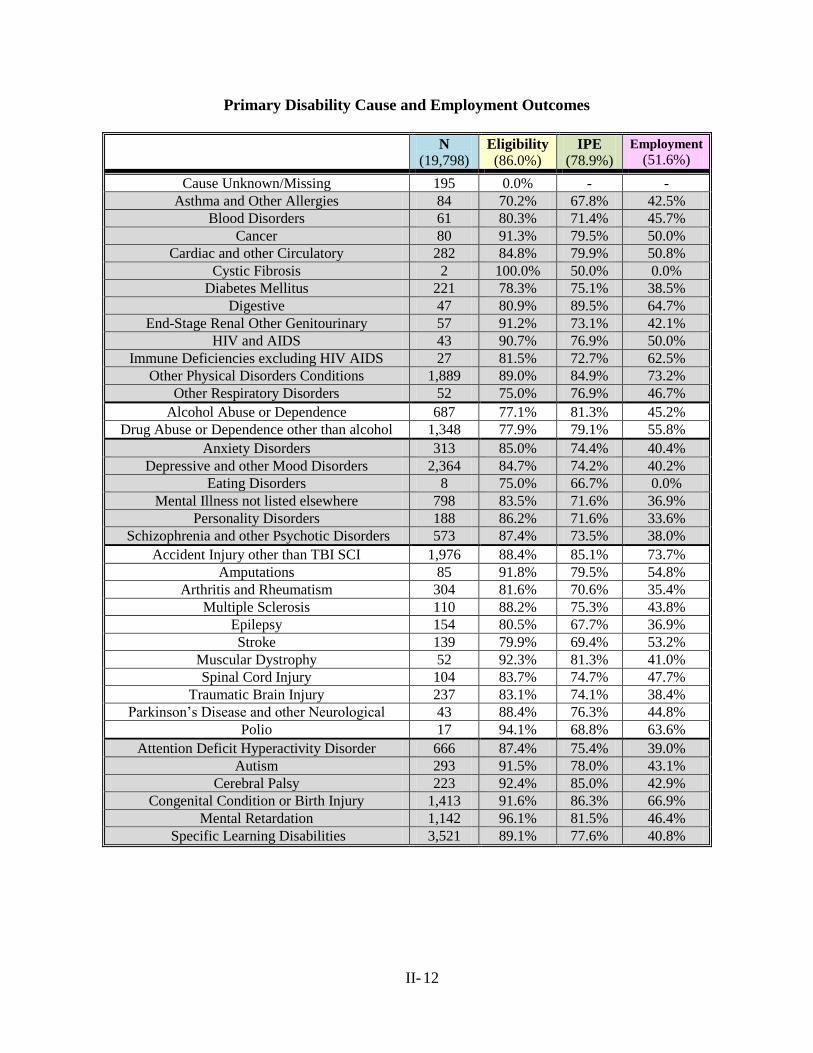
II- 12
Primary Disability Cause and Employment Outcomes
N
(19,798) Eligibility
(86.0%) IPE
(78.9%)
Employment
(51.6%)
Cause Unknown/Missing 195 0.0% - -
Asthma and Other Allergies 84 70.2% 67.8% 42.5%
Blood Disorders 61 80.3% 71.4% 45.7%
Cancer 80 91.3% 79.5% 50.0%
Cardiac and other Circulatory 282 84.8% 79.9% 50.8%
Cystic Fibrosis 2 100.0% 50.0% 0.0%
Diabetes Mellitus 221 78.3% 75.1% 38.5%
Digestive 47 80.9% 89.5% 64.7%
End-Stage Renal Other Genitourinary 57 91.2% 73.1% 42.1%
HIV and AIDS 43 90.7% 76.9% 50.0%
Immune Deficiencies excluding HIV AIDS 27 81.5% 72.7% 62.5%
Other Physical Disorders Conditions 1,889 89.0% 84.9% 73.2%
Other Respiratory Disorders 52 75.0% 76.9% 46.7%
Alcohol Abuse or Dependence 687 77.1% 81.3% 45.2%
Drug Abuse or Dependence other than alcohol 1,348 77.9% 79.1% 55.8%
Anxiety Disorders 313 85.0% 74.4% 40.4%
Depressive and other Mood Disorders 2,364 84.7% 74.2% 40.2%
Eating Disorders 8 75.0% 66.7% 0.0%
Mental Illness not listed elsewhere 798 83.5% 71.6% 36.9%
Personality Disorders 188 86.2% 71.6% 33.6%
Schizophrenia and other Psychotic Disorders 573 87.4% 73.5% 38.0%
Accident Injury other than TBI SCI 1,976 88.4% 85.1% 73.7%
Amputations 85 91.8% 79.5% 54.8%
Arthritis and Rheumatism 304 81.6% 70.6% 35.4%
Multiple Sclerosis 110 88.2% 75.3% 43.8%
Epilepsy 154 80.5% 67.7% 36.9%
Stroke 139 79.9% 69.4% 53.2%
Muscular Dystrophy 52 92.3% 81.3% 41.0%
Spinal Cord Injury 104 83.7% 74.7% 47.7%
Traumatic Brain Injury 237 83.1% 74.1% 38.4%
Parkinson’s Disease and other Neurological 43 88.4% 76.3% 44.8%
Polio 17 94.1% 68.8% 63.6%
Attention Deficit Hyperactivity Disorder 666 87.4% 75.4% 39.0%
Autism 293 91.5% 78.0% 43.1%
Cerebral Palsy 223 92.4% 85.0% 42.9%
Congenital Condition or Birth Injury 1,413 91.6% 86.3% 66.9%
Mental Retardation 1,142 96.1% 81.5% 46.4%
Specific Learning Disabilities 3,521 89.1% 77.6% 40.8%
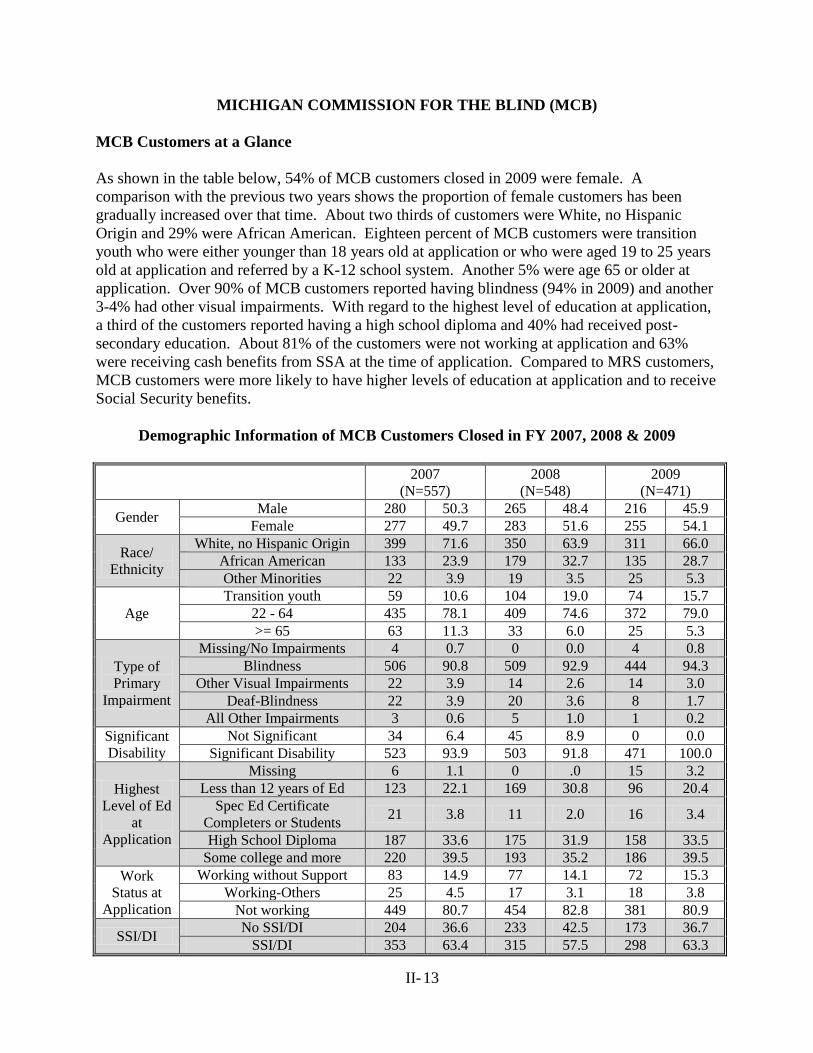
II- 13
MICHIGAN COMMISSION FOR THE BLIND (MCB)
MCB Customers at a Glance
As shown in the table below, 54% of MCB customers closed in 2009 were female. A
comparison with the previous two years shows the proportion of female customers has been
gradually increased over that time. About two thirds of customers were White, no Hispanic
Origin and 29% were African American. Eighteen percent of MCB customers were transition
youth who were either younger than 18 years old at application or who were aged 19 to 25 years
old at application and referred by a K-12 school system. Another 5% were age 65 or older at
application. Over 90% of MCB customers reported having blindness (94% in 2009) and another
3-4% had other visual impairments. With regard to the highest level of education at application,
a third of the customers reported having a high school diploma and 40% had received post-
secondary education. About 81% of the customers were not working at application and 63%
were receiving cash benefits from SSA at the time of application. Compared to MRS customers,
MCB customers were more likely to have higher levels of education at application and to receive
Social Security benefits.
Demographic Information of MCB Customers Closed in FY 2007, 2008 & 2009
2007
(N=557) 2008
(N=548) 2009
(N=471)
Gender Male 280 50.3 265 48.4 216 45.9
Female 277 49.7 283 51.6 255 54.1
Race/
Ethnicity
White, no Hispanic Origin 399 71.6 350 63.9 311 66.0 African American 133 23.9 179 32.7 135 28.7 Other Minorities 22 3.9 19 3.5 25 5.3
Age Transition youth 59 10.6 104 19.0 74 15.7
22 - 64 435 78.1 409 74.6 372 79.0 >= 65 63 11.3 33 6.0 25 5.3
Type of
Primary
Impairment
Missing/No Impairments 4 0.7 0 0.0 4 0.8 Blindness 506 90.8 509 92.9 444 94.3
Other Visual Impairments 22 3.9 14 2.6 14 3.0 Deaf-Blindness 22 3.9 20 3.6 8 1.7
All Other Impairments 3 0.6 5 1.0 1 0.2 Significant
Disability Not Significant 34 6.4 45 8.9 0 0.0
Significant Disability 523 93.9 503 91.8 471 100.0
Highest
Level of Ed
at
Application
Missing 6 1.1 0 .0 15 3.2 Less than 12 years of Ed 123 22.1 169 30.8 96 20.4
Spec Ed Certificate
Completers or Students 21 3.8 11 2.0 16 3.4
High School Diploma 187 33.6 175 31.9 158 33.5 Some college and more 220 39.5 193 35.2 186 39.5
Work
Status at
Application
Working without Support 83 14.9 77 14.1 72 15.3 Working-Others 25 4.5 17 3.1 18 3.8
Not working 449 80.7 454 82.8 381 80.9
SSI/DI No SSI/DI 204 36.6 233 42.5 173 36.7
SSI/DI 353 63.4 315 57.5 298 63.3
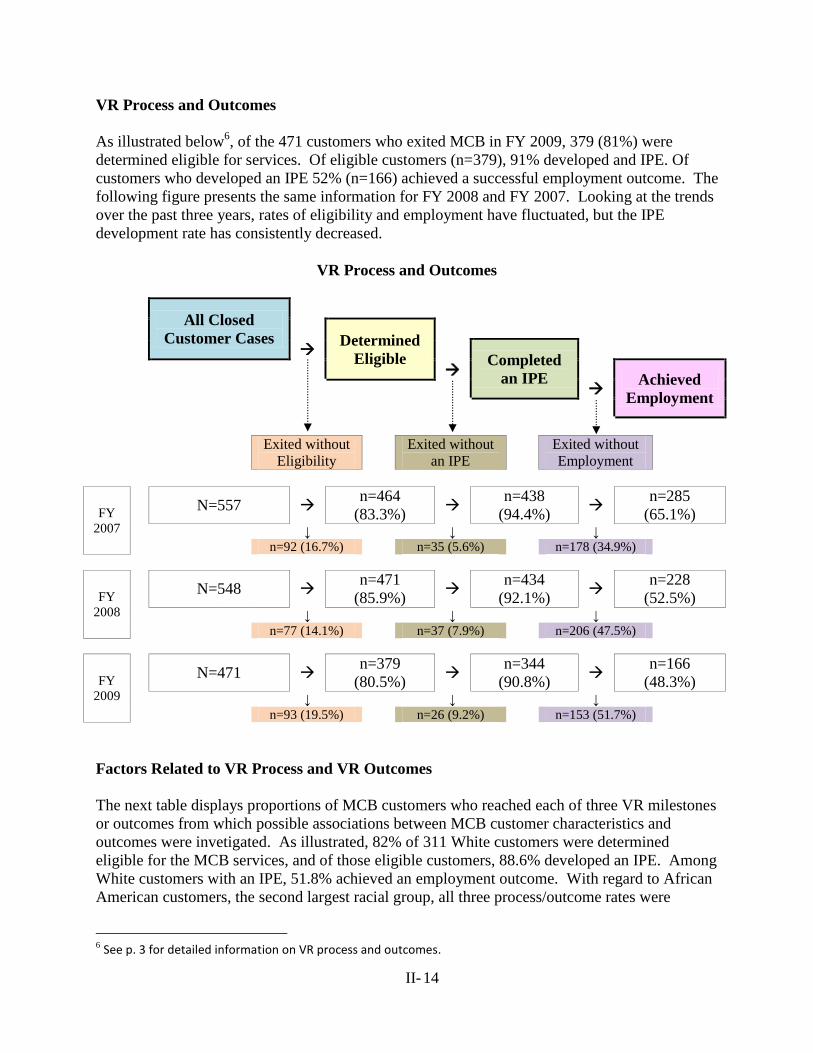
II- 14
VR Process and Outcomes
As illustrated below6, of the 471 customers who exited MCB in FY 2009, 379 (81%) were
determined eligible for services. Of eligible customers (n=379), 91% developed and IPE. Of
customers who developed an IPE 52% (n=166) achieved a successful employment outcome. The
following figure presents the same information for FY 2008 and FY 2007. Looking at the trends
over the past three years, rates of eligibility and employment have fluctuated, but the IPE
development rate has consistently decreased.
VR Process and Outcomes
All Closed
Customer Cases
Determined
Eligible
Completed
an IPE
Achieved
Employment
Exited without
Eligibility
Exited without
an IPE
Exited without
Employment
FY
2007
N=557 n=464
(83.3%)
n=438
(94.4%)
n=285
(65.1%) ↓ ↓ ↓
n=92 (16.7%) n=35 (5.6%) n=178 (34.9%)
FY
2008
N=548 n=471
(85.9%)
n=434
(92.1%)
n=228
(52.5%) ↓ ↓ ↓
n=77 (14.1%) n=37 (7.9%) n=206 (47.5%)
FY
2009
N=471 n=379
(80.5%)
n=344
(90.8%)
n=166
(48.3%) ↓ ↓ ↓
n=93 (19.5%) n=26 (9.2%) n=153 (51.7%)
Factors Related to VR Process and VR Outcomes
The next table displays proportions of MCB customers who reached each of three VR milestones
or outcomes from which possible associations between MCB customer characteristics and
outcomes were invetigated. As illustrated, 82% of 311 White customers were determined
eligible for the MCB services, and of those eligible customers, 88.6% developed an IPE. Among
White customers with an IPE, 51.8% achieved an employment outcome. With regard to African
American customers, the second largest racial group, all three process/outcome rates were
6 See p. 3 for detailed information on VR process and outcomes.
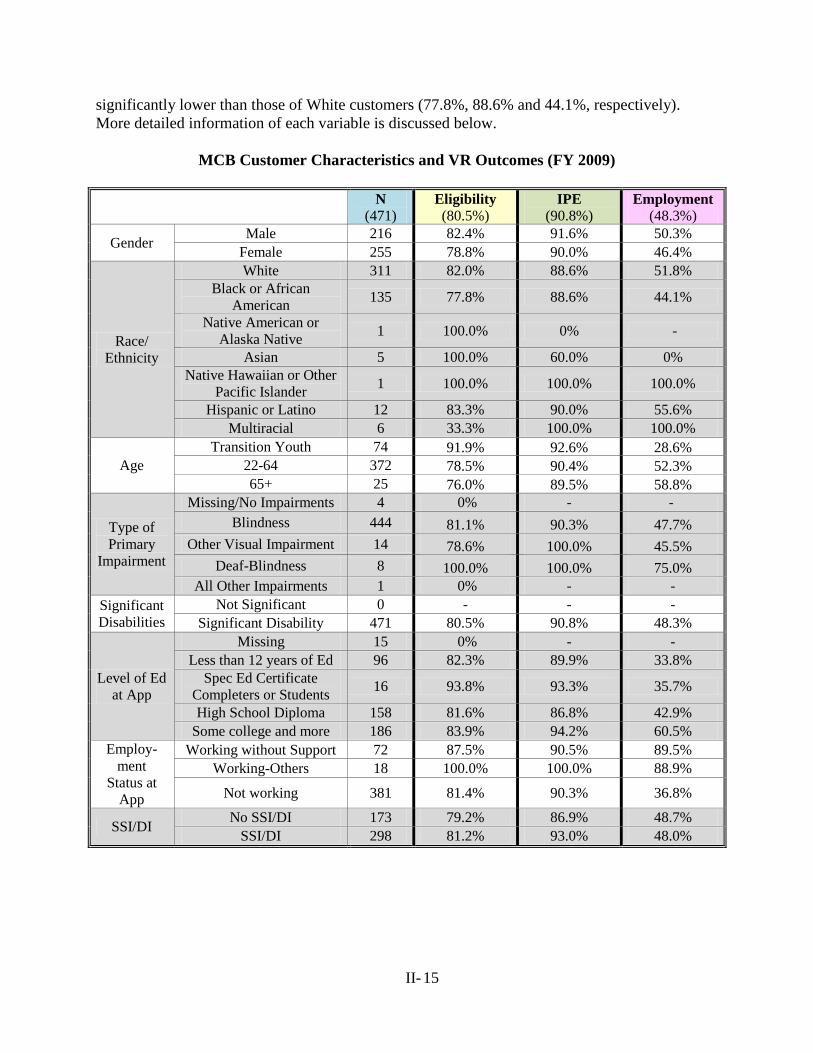
II- 15
significantly lower than those of White customers (77.8%, 88.6% and 44.1%, respectively).
More detailed information of each variable is discussed below.
MCB Customer Characteristics and VR Outcomes (FY 2009)
N
(471) Eligibility
(80.5%) IPE
(90.8%) Employment
(48.3%)
Gender Male 216 82.4% 91.6% 50.3%
Female 255 78.8% 90.0% 46.4%
Race/
Ethnicity
White 311 82.0% 88.6% 51.8%
Black or African
American 135 77.8% 88.6% 44.1%
Native American or
Alaska Native 1 100.0% 0% -
Asian 5 100.0% 60.0% 0%
Native Hawaiian or Other
Pacific Islander 1 100.0% 100.0% 100.0%
Hispanic or Latino 12 83.3% 90.0% 55.6%
Multiracial 6 33.3% 100.0% 100.0%
Age
Transition Youth 74 91.9% 92.6% 28.6%
22-64 372 78.5% 90.4% 52.3%
65+ 25 76.0% 89.5% 58.8%
Type of
Primary
Impairment
Missing/No Impairments 4 0% - -
Blindness 444 81.1% 90.3% 47.7%
Other Visual Impairment 14 78.6% 100.0% 45.5%
Deaf-Blindness 8 100.0% 100.0% 75.0%
All Other Impairments 1 0% - -
Significant
Disabilities
Not Significant 0 - - -
Significant Disability 471 80.5% 90.8% 48.3%
Level of Ed
at App
Missing 15 0% - -
Less than 12 years of Ed 96 82.3% 89.9% 33.8%
Spec Ed Certificate
Completers or Students 16 93.8% 93.3% 35.7%
High School Diploma 158 81.6% 86.8% 42.9%
Some college and more 186 83.9% 94.2% 60.5%
Employ-
ment
Status at
App
Working without Support 72 87.5% 90.5% 89.5%
Working-Others 18 100.0% 100.0% 88.9%
Not working 381 81.4% 90.3% 36.8%
SSI/DI No SSI/DI 173 79.2% 86.9% 48.7%
SSI/DI 298 81.2% 93.0% 48.0%
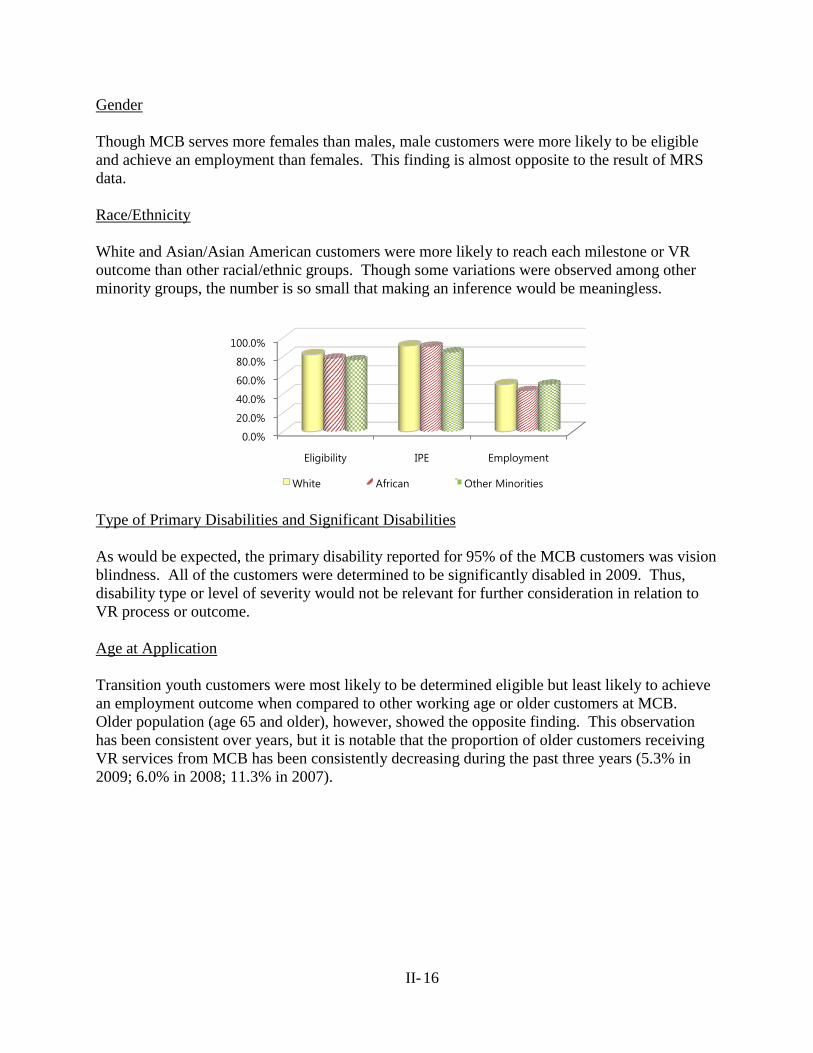
II- 16
Gender
Though MCB serves more females than males, male customers were more likely to be eligible
and achieve an employment than females. This finding is almost opposite to the result of MRS
data.
Race/Ethnicity
White and Asian/Asian American customers were more likely to reach each milestone or VR
outcome than other racial/ethnic groups. Though some variations were observed among other
minority groups, the number is so small that making an inference would be meaningless.
Type of Primary Disabilities and Significant Disabilities
As would be expected, the primary disability reported for 95% of the MCB customers was vision
blindness. All of the customers were determined to be significantly disabled in 2009. Thus,
disability type or level of severity would not be relevant for further consideration in relation to
VR process or outcome.
Age at Application
Transition youth customers were most likely to be determined eligible but least likely to achieve
an employment outcome when compared to other working age or older customers at MCB.
Older population (age 65 and older), however, showed the opposite finding. This observation
has been consistent over years, but it is notable that the proportion of older customers receiving
VR services from MCB has been consistently decreasing during the past three years (5.3% in
2009; 6.0% in 2008; 11.3% in 2007).
0.0%
20.0%
40.0%
60.0%
80.0%
100.0%
Eligibility IPE Employment
White African Other Minorities
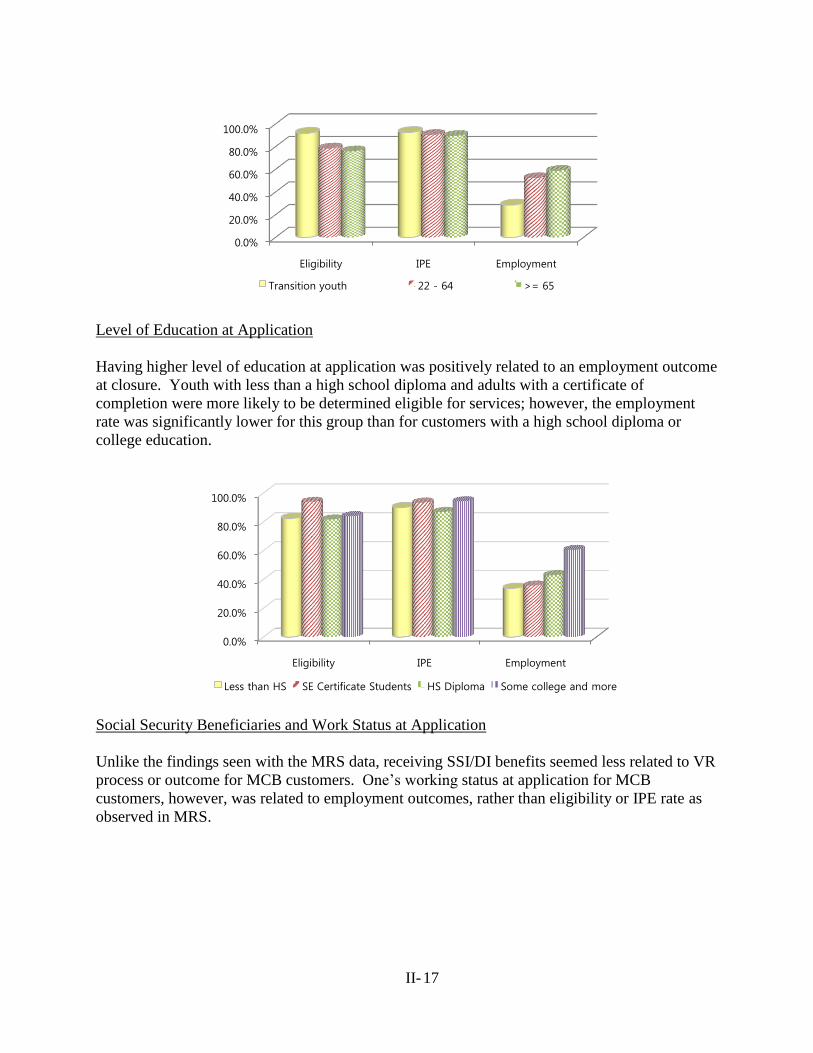
II- 17
Level of Education at Application
Having higher level of education at application was positively related to an employment outcome
at closure. Youth with less than a high school diploma and adults with a certificate of
completion were more likely to be determined eligible for services; however, the employment
rate was significantly lower for this group than for customers with a high school diploma or
college education.
Social Security Beneficiaries and Work Status at Application
Unlike the findings seen with the MRS data, receiving SSI/DI benefits seemed less related to VR
process or outcome for MCB customers. One’s working status at application for MCB
customers, however, was related to employment outcomes, rather than eligibility or IPE rate as
observed in MRS.
0.0%
20.0%
40.0%
60.0%
80.0%
100.0%
Eligibility IPE Employment
Transition youth 22 - 64 >= 65
0.0%
20.0%
40.0%
60.0%
80.0%
100.0%
Eligibility IPE Employment
Less than HS SE Certificate Students HS Diploma Some college and more
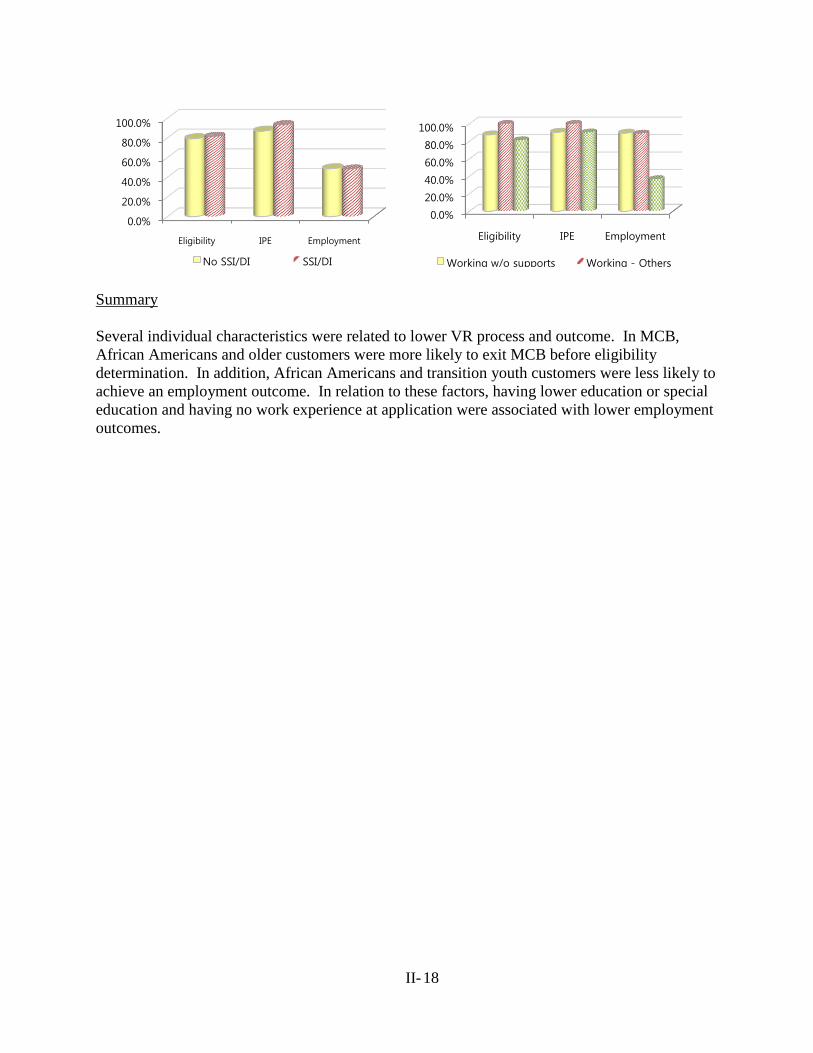
II- 18
Summary
Several individual characteristics were related to lower VR process and outcome. In MCB,
African Americans and older customers were more likely to exit MCB before eligibility
determination. In addition, African Americans and transition youth customers were less likely to
achieve an employment outcome. In relation to these factors, having lower education or special
education and having no work experience at application were associated with lower employment
outcomes.
0.0%
20.0%
40.0%
60.0%
80.0%
100.0%
Eligibility IPE Employment
No SSI/DI SSI/DI
0.0%
20.0%
40.0%
60.0%
80.0%
100.0%
Eligibility IPE Employment
Working w/o supports Working - Others
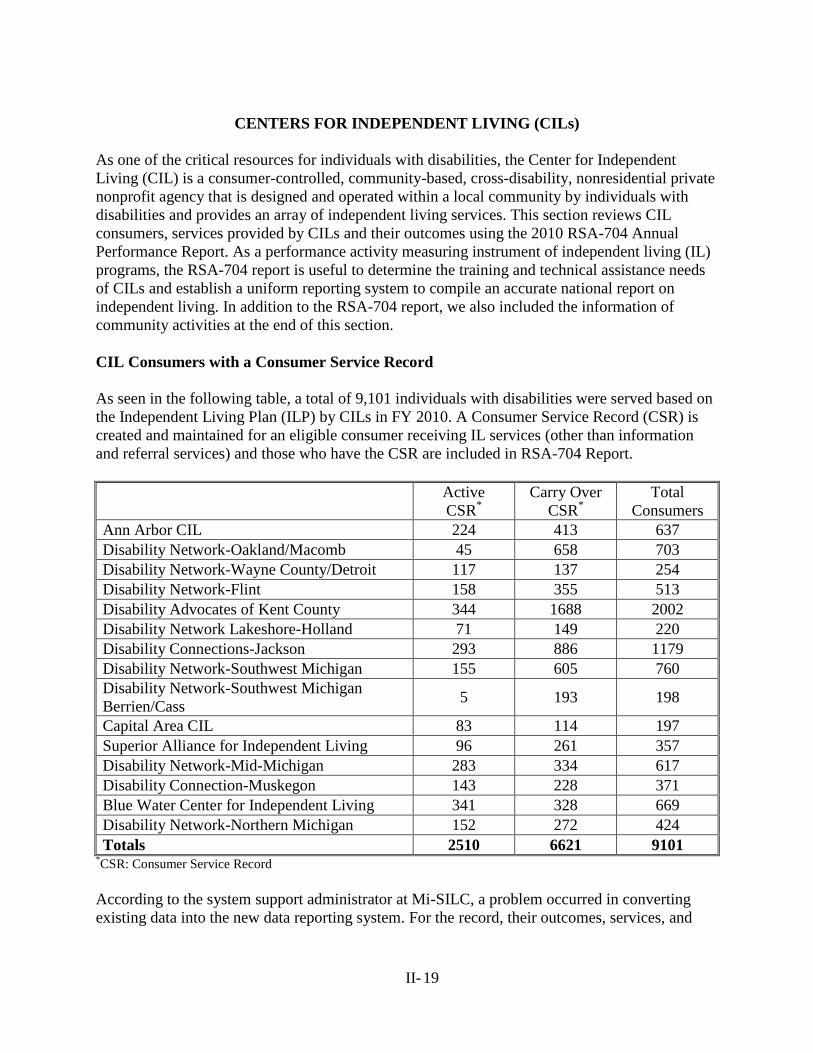
II- 19
CENTERS FOR INDEPENDENT LIVING (CILs)
As one of the critical resources for individuals with disabilities, the Center for Independent
Living (CIL) is a consumer-controlled, community-based, cross-disability, nonresidential private
nonprofit agency that is designed and operated within a local community by individuals with
disabilities and provides an array of independent living services. This section reviews CIL
consumers, services provided by CILs and their outcomes using the 2010 RSA-704 Annual
Performance Report. As a performance activity measuring instrument of independent living (IL)
programs, the RSA-704 report is useful to determine the training and technical assistance needs
of CILs and establish a uniform reporting system to compile an accurate national report on
independent living. In addition to the RSA-704 report, we also included the information of
community activities at the end of this section.
CIL Consumers with a Consumer Service Record
As seen in the following table, a total of 9,101 individuals with disabilities were served based on
the Independent Living Plan (ILP) by CILs in FY 2010. A Consumer Service Record (CSR) is
created and maintained for an eligible consumer receiving IL services (other than information
and referral services) and those who have the CSR are included in RSA-704 Report.
Active
CSR*
Carry Over
CSR*
Total
Consumers
Ann Arbor CIL 224 413 637
Disability Network-Oakland/Macomb 45 658 703
Disability Network-Wayne County/Detroit 117 137 254
Disability Network-Flint 158 355 513
Disability Advocates of Kent County 344 1688 2002
Disability Network Lakeshore-Holland 71 149 220
Disability Connections-Jackson 293 886 1179
Disability Network-Southwest Michigan 155 605 760
Disability Network-Southwest Michigan
Berrien/Cass 5 193 198
Capital Area CIL 83 114 197
Superior Alliance for Independent Living 96 261 357
Disability Network-Mid-Michigan 283 334 617
Disability Connection-Muskegon 143 228 371
Blue Water Center for Independent Living 341 328 669
Disability Network-Northern Michigan 152 272 424
Totals 2510 6621 9101 *CSR: Consumer Service Record
According to the system support administrator at Mi-SILC, a problem occurred in converting
existing data into the new data reporting system. For the record, their outcomes, services, and
II- 20
community activity data were accurate, but the demographic counts were incorrect. Therefore,
this report does not include further consumer demographic information of the CIL consumers.
IL Services Provided
A variety of services are provided by CIL to individuals with disabilities. The following table
lists 23 types of services and the numbers of consumers who requested and who received each
type of services. Note that an IL consumer can request the same type of services multiple times
so the numbers here indicate the number of services requested or received, not the number of
consumers who requested or received each service. For example, a total of 18,184 I&R services
were requested by all 9,101 consumers who had a CSR during FY 2010.
Most frequently requested services, apart from I&R services, were Vocational services (n=2,632),
IL skills/Life skills training (n=2,134), and Housing, home modification and shelter services
(n=1,951). Most services that had been requested were provided to consumers, but only 71.3% of
consumers who had requested transportation services received the services.
Number of
Services
Requested
Consumers Receiving
Services
Number Percent
Information and Referral Services 18,184 17,995 99 %
Vocational Services 2,632 2,576 97.9%
IL Skills Training and Life Skills Training 2,134 2,134 100%
Housing, Home Modifications, and Shelter
Services 1,951 1,916 98.2%
Advocacy/Legal Services 1,635 1,633 99.9%
Assistive Technology 1,609 1,596 99.2%
Youth/Transition Services 1,228 1,228 100%
Other Services 1,072 1,061 99%
Transportation Services 850 606 71.3%
Counseling and Related Services 695 695 100%
Physical Restoration Services 570 570 100%
Peer Counseling Services 531 531 100%
Personal Assistance Services 443 441 99.5%
Recreational Services 290 289 99.7%
Communication Services 126 126 100%
Family Services 119 119 100%
Mental Restoration Services 104 104 100%
Children’s Services 80 80 100%
Mobility Training 39 39 100%
Rehabilitation Technology Services 33 33 100%
Preventive Services 16 16 100%
Therapeutic Treatment 6 6 100%
Prostheses, Orthotics, and Other Appliances 4 4 100%
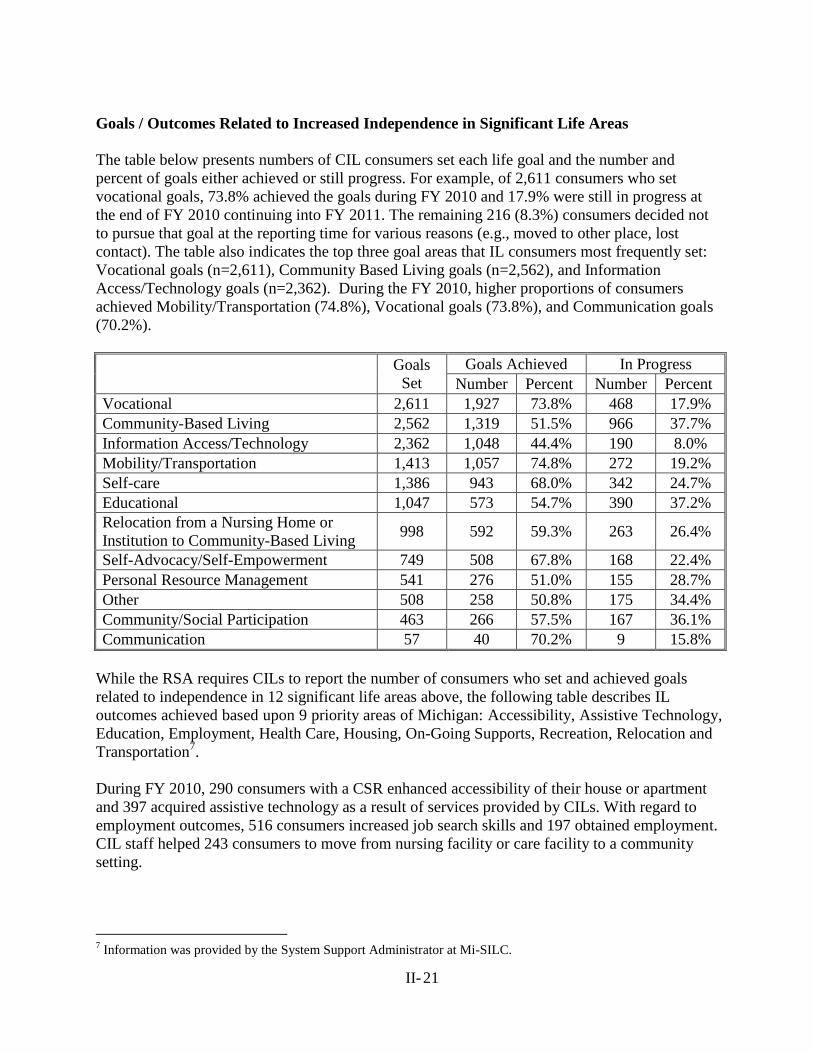
II- 21
Goals / Outcomes Related to Increased Independence in Significant Life Areas
The table below presents numbers of CIL consumers set each life goal and the number and
percent of goals either achieved or still progress. For example, of 2,611 consumers who set
vocational goals, 73.8% achieved the goals during FY 2010 and 17.9% were still in progress at
the end of FY 2010 continuing into FY 2011. The remaining 216 (8.3%) consumers decided not
to pursue that goal at the reporting time for various reasons (e.g., moved to other place, lost
contact). The table also indicates the top three goal areas that IL consumers most frequently set:
Vocational goals (n=2,611), Community Based Living goals (n=2,562), and Information
Access/Technology goals (n=2,362). During the FY 2010, higher proportions of consumers
achieved Mobility/Transportation (74.8%), Vocational goals (73.8%), and Communication goals
(70.2%).
Goals
Set
Goals Achieved In Progress
Number Percent Number Percent
Vocational 2,611 1,927 73.8% 468 17.9%
Community-Based Living 2,562 1,319 51.5% 966 37.7%
Information Access/Technology 2,362 1,048 44.4% 190 8.0%
Mobility/Transportation 1,413 1,057 74.8% 272 19.2%
Self-care 1,386 943 68.0% 342 24.7%
Educational 1,047 573 54.7% 390 37.2%
Relocation from a Nursing Home or
Institution to Community-Based Living 998 592 59.3% 263 26.4%
Self-Advocacy/Self-Empowerment 749 508 67.8% 168 22.4%
Personal Resource Management 541 276 51.0% 155 28.7%
Other 508 258 50.8% 175 34.4%
Community/Social Participation 463 266 57.5% 167 36.1%
Communication 57 40 70.2% 9 15.8%
While the RSA requires CILs to report the number of consumers who set and achieved goals
related to independence in 12 significant life areas above, the following table describes IL
outcomes achieved based upon 9 priority areas of Michigan: Accessibility, Assistive Technology,
Education, Employment, Health Care, Housing, On-Going Supports, Recreation, Relocation and
Transportation7.
During FY 2010, 290 consumers with a CSR enhanced accessibility of their house or apartment
and 397 acquired assistive technology as a result of services provided by CILs. With regard to
employment outcomes, 516 consumers increased job search skills and 197 obtained employment.
CIL staff helped 243 consumers to move from nursing facility or care facility to a community
setting.
7 Information was provided by the System Support Administrator at Mi-SILC.
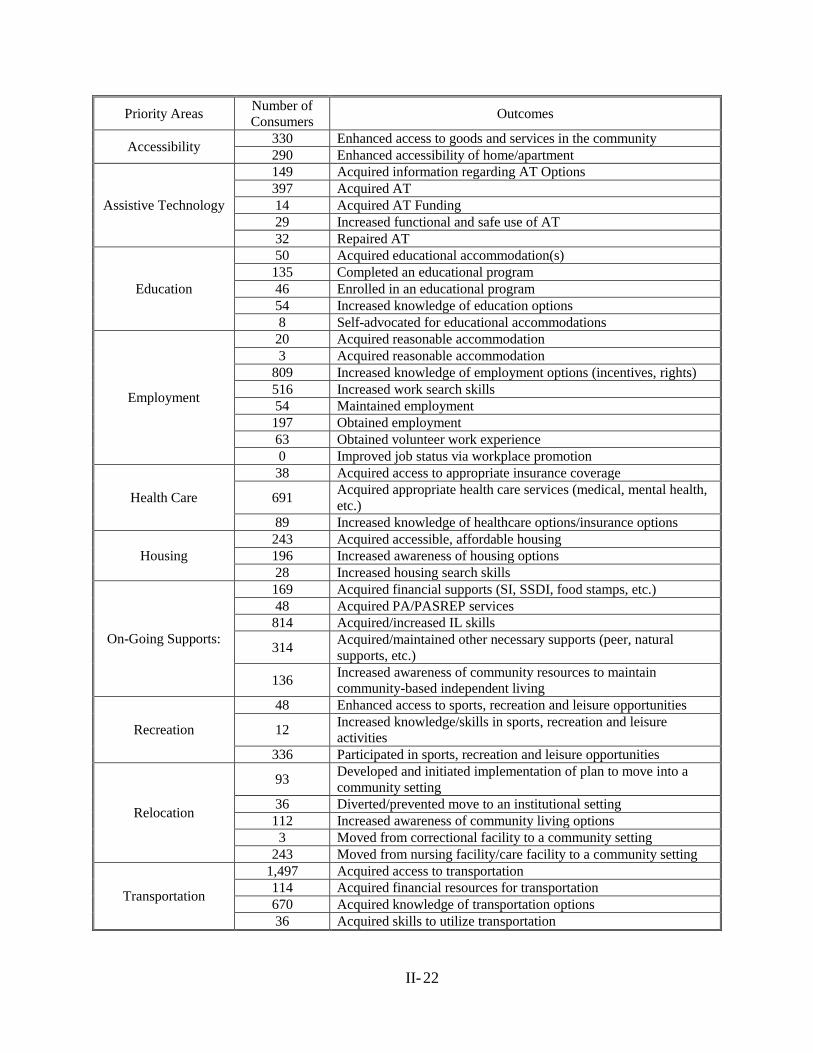
II- 22
Priority Areas Number of
Consumers Outcomes
Accessibility 330 Enhanced access to goods and services in the community
290 Enhanced accessibility of home/apartment
Assistive Technology
149 Acquired information regarding AT Options
397 Acquired AT
14 Acquired AT Funding
29 Increased functional and safe use of AT
32 Repaired AT
Education
50 Acquired educational accommodation(s)
135 Completed an educational program
46 Enrolled in an educational program
54 Increased knowledge of education options
8 Self-advocated for educational accommodations
Employment
20 Acquired reasonable accommodation
3 Acquired reasonable accommodation
809 Increased knowledge of employment options (incentives, rights)
516 Increased work search skills
54 Maintained employment
197 Obtained employment
63 Obtained volunteer work experience
0 Improved job status via workplace promotion
Health Care
38 Acquired access to appropriate insurance coverage
691 Acquired appropriate health care services (medical, mental health,
etc.)
89 Increased knowledge of healthcare options/insurance options
Housing
243 Acquired accessible, affordable housing
196 Increased awareness of housing options
28 Increased housing search skills
On-Going Supports:
169 Acquired financial supports (SI, SSDI, food stamps, etc.)
48 Acquired PA/PASREP services
814 Acquired/increased IL skills
314 Acquired/maintained other necessary supports (peer, natural
supports, etc.)
136 Increased awareness of community resources to maintain
community-based independent living
Recreation
48 Enhanced access to sports, recreation and leisure opportunities
12 Increased knowledge/skills in sports, recreation and leisure
activities
336 Participated in sports, recreation and leisure opportunities
Relocation
93 Developed and initiated implementation of plan to move into a
community setting
36 Diverted/prevented move to an institutional setting
112 Increased awareness of community living options
3 Moved from correctional facility to a community setting
243 Moved from nursing facility/care facility to a community setting
Transportation
1,497 Acquired access to transportation
114 Acquired financial resources for transportation
670 Acquired knowledge of transportation options
36 Acquired skills to utilize transportation
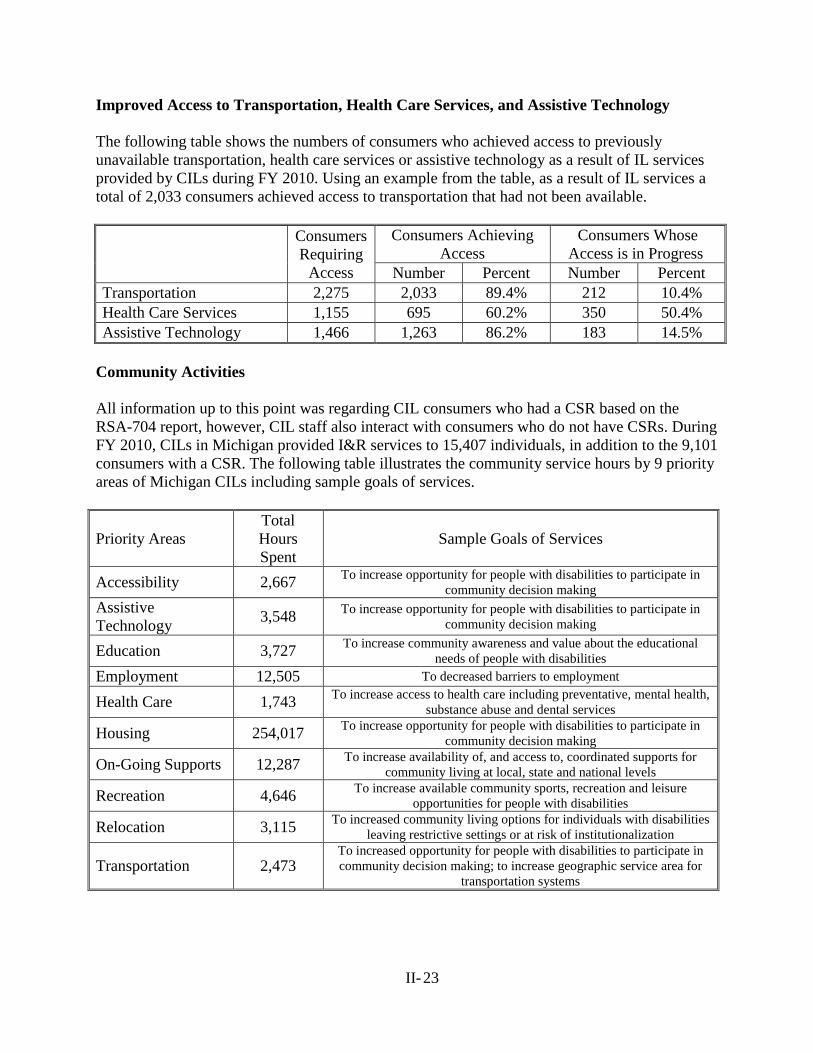
II- 23
Improved Access to Transportation, Health Care Services, and Assistive Technology
The following table shows the numbers of consumers who achieved access to previously
unavailable transportation, health care services or assistive technology as a result of IL services
provided by CILs during FY 2010. Using an example from the table, as a result of IL services a
total of 2,033 consumers achieved access to transportation that had not been available.
Consumers
Requiring
Access
Consumers Achieving
Access
Consumers Whose
Access is in Progress
Number Percent Number Percent
Transportation 2,275 2,033 89.4% 212 10.4%
Health Care Services 1,155 695 60.2% 350 50.4%
Assistive Technology 1,466 1,263 86.2% 183 14.5%
Community Activities
All information up to this point was regarding CIL consumers who had a CSR based on the
RSA-704 report, however, CIL staff also interact with consumers who do not have CSRs. During
FY 2010, CILs in Michigan provided I&R services to 15,407 individuals, in addition to the 9,101
consumers with a CSR. The following table illustrates the community service hours by 9 priority
areas of Michigan CILs including sample goals of services.
Priority Areas
Total
Hours
Spent
Sample Goals of Services
Accessibility 2,667 To increase opportunity for people with disabilities to participate in
community decision making
Assistive
Technology 3,548
To increase opportunity for people with disabilities to participate in
community decision making
Education 3,727 To increase community awareness and value about the educational
needs of people with disabilities
Employment 12,505 To decreased barriers to employment
Health Care 1,743 To increase access to health care including preventative, mental health,
substance abuse and dental services
Housing 254,017 To increase opportunity for people with disabilities to participate in
community decision making
On-Going Supports 12,287 To increase availability of, and access to, coordinated supports for
community living at local, state and national levels
Recreation 4,646 To increase available community sports, recreation and leisure
opportunities for people with disabilities
Relocation 3,115 To increased community living options for individuals with disabilities
leaving restrictive settings or at risk of institutionalization
Transportation 2,473 To increased opportunity for people with disabilities to participate in
community decision making; to increase geographic service area for
transportation systems
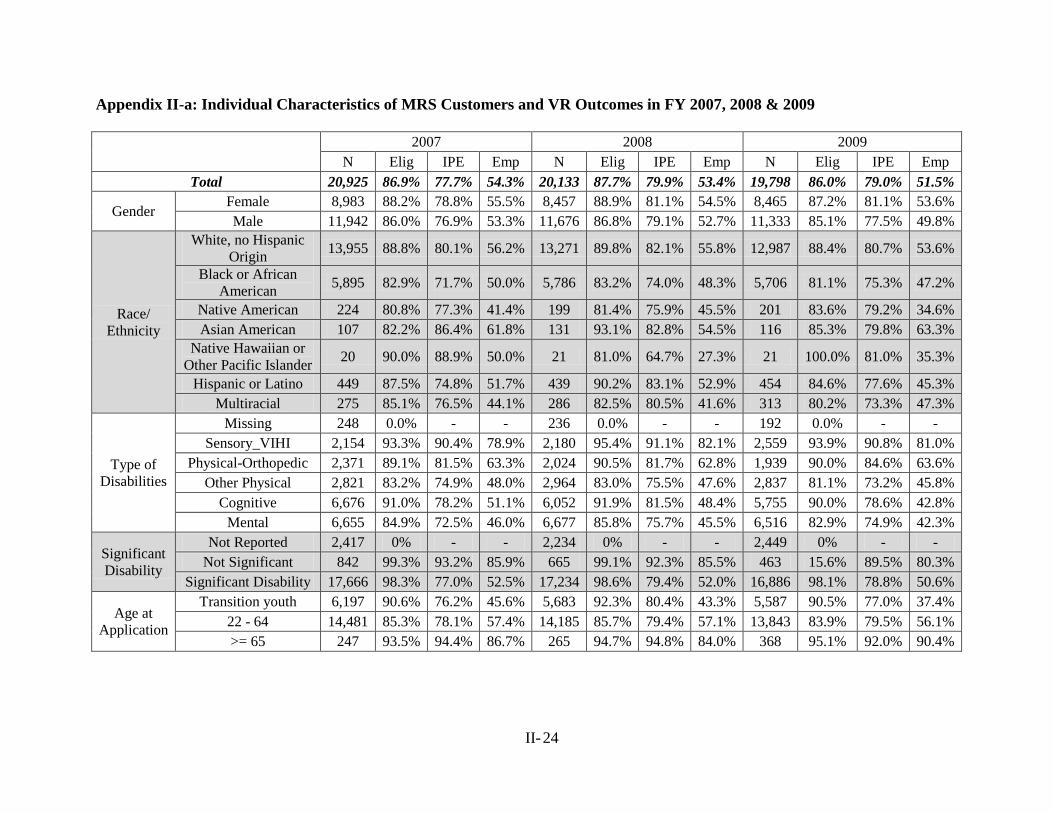
II- 24
Appendix II-a: Individual Characteristics of MRS Customers and VR Outcomes in FY 2007, 2008 & 2009
2007 2008 2009
N Elig IPE Emp N Elig IPE Emp N Elig IPE Emp
Total 20,925 86.9% 77.7% 54.3% 20,133 87.7% 79.9% 53.4% 19,798 86.0% 79.0% 51.5%
Gender Female 8,983 88.2% 78.8% 55.5% 8,457 88.9% 81.1% 54.5% 8,465 87.2% 81.1% 53.6%
Male 11,942 86.0% 76.9% 53.3% 11,676 86.8% 79.1% 52.7% 11,333 85.1% 77.5% 49.8%
Race/ Ethnicity
White, no Hispanic
Origin 13,955 88.8% 80.1% 56.2% 13,271 89.8% 82.1% 55.8% 12,987 88.4% 80.7% 53.6%
Black or African
American 5,895 82.9% 71.7% 50.0% 5,786 83.2% 74.0% 48.3% 5,706 81.1% 75.3% 47.2%
Native American 224 80.8% 77.3% 41.4% 199 81.4% 75.9% 45.5% 201 83.6% 79.2% 34.6%
Asian American 107 82.2% 86.4% 61.8% 131 93.1% 82.8% 54.5% 116 85.3% 79.8% 63.3%
Native Hawaiian or
Other Pacific Islander 20 90.0% 88.9% 50.0% 21 81.0% 64.7% 27.3% 21 100.0% 81.0% 35.3%
Hispanic or Latino 449 87.5% 74.8% 51.7% 439 90.2% 83.1% 52.9% 454 84.6% 77.6% 45.3%
Multiracial 275 85.1% 76.5% 44.1% 286 82.5% 80.5% 41.6% 313 80.2% 73.3% 47.3%
Type of
Disabilities
Missing 248 0.0% - - 236 0.0% - - 192 0.0% - -
Sensory_VIHI 2,154 93.3% 90.4% 78.9% 2,180 95.4% 91.1% 82.1% 2,559 93.9% 90.8% 81.0%
Physical-Orthopedic 2,371 89.1% 81.5% 63.3% 2,024 90.5% 81.7% 62.8% 1,939 90.0% 84.6% 63.6%
Other Physical 2,821 83.2% 74.9% 48.0% 2,964 83.0% 75.5% 47.6% 2,837 81.1% 73.2% 45.8%
Cognitive 6,676 91.0% 78.2% 51.1% 6,052 91.9% 81.5% 48.4% 5,755 90.0% 78.6% 42.8%
Mental 6,655 84.9% 72.5% 46.0% 6,677 85.8% 75.7% 45.5% 6,516 82.9% 74.9% 42.3%
Significant
Disability
Not Reported 2,417 0% - - 2,234 0% - - 2,449 0% - -
Not Significant 842 99.3% 93.2% 85.9% 665 99.1% 92.3% 85.5% 463 15.6% 89.5% 80.3%
Significant Disability 17,666 98.3% 77.0% 52.5% 17,234 98.6% 79.4% 52.0% 16,886 98.1% 78.8% 50.6%
Age at
Application
Transition youth 6,197 90.6% 76.2% 45.6% 5,683 92.3% 80.4% 43.3% 5,587 90.5% 77.0% 37.4%
22 - 64 14,481 85.3% 78.1% 57.4% 14,185 85.7% 79.4% 57.1% 13,843 83.9% 79.5% 56.1%
>= 65 247 93.5% 94.4% 86.7% 265 94.7% 94.8% 84.0% 368 95.1% 92.0% 90.4%
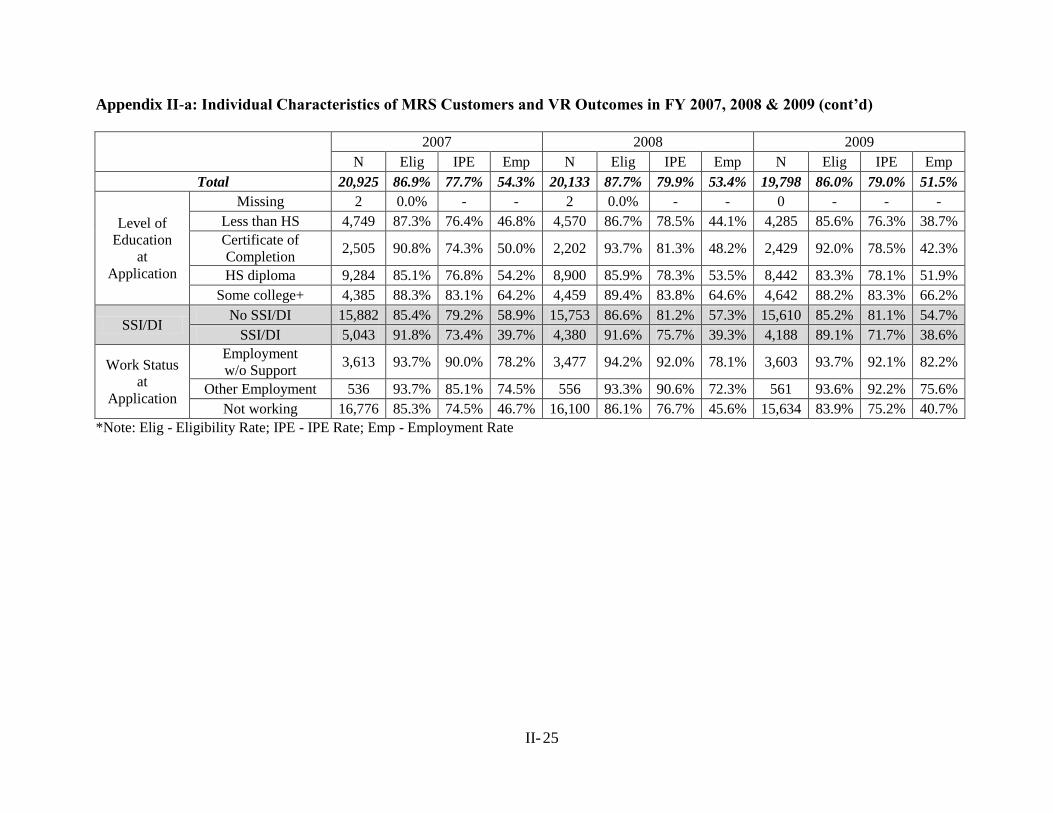
II- 25
Appendix II-a: Individual Characteristics of MRS Customers and VR Outcomes in FY 2007, 2008 & 2009 (cont’d)
2007 2008 2009
N Elig IPE Emp N Elig IPE Emp N Elig IPE Emp
Total 20,925 86.9% 77.7% 54.3% 20,133 87.7% 79.9% 53.4% 19,798 86.0% 79.0% 51.5%
Level of Education
at
Application
Missing 2 0.0% - - 2 0.0% - - 0 - - -
Less than HS 4,749 87.3% 76.4% 46.8% 4,570 86.7% 78.5% 44.1% 4,285 85.6% 76.3% 38.7%
Certificate of
Completion 2,505 90.8% 74.3% 50.0% 2,202 93.7% 81.3% 48.2% 2,429 92.0% 78.5% 42.3%
HS diploma 9,284 85.1% 76.8% 54.2% 8,900 85.9% 78.3% 53.5% 8,442 83.3% 78.1% 51.9%
Some college+ 4,385 88.3% 83.1% 64.2% 4,459 89.4% 83.8% 64.6% 4,642 88.2% 83.3% 66.2%
SSI/DI No SSI/DI 15,882 85.4% 79.2% 58.9% 15,753 86.6% 81.2% 57.3% 15,610 85.2% 81.1% 54.7%
SSI/DI 5,043 91.8% 73.4% 39.7% 4,380 91.6% 75.7% 39.3% 4,188 89.1% 71.7% 38.6%
Work Status
at
Application
Employment w/o Support
3,613 93.7% 90.0% 78.2% 3,477 94.2% 92.0% 78.1% 3,603 93.7% 92.1% 82.2%
Other Employment 536 93.7% 85.1% 74.5% 556 93.3% 90.6% 72.3% 561 93.6% 92.2% 75.6%
Not working 16,776 85.3% 74.5% 46.7% 16,100 86.1% 76.7% 45.6% 15,634 83.9% 75.2% 40.7%
*Note: Elig - Eligibility Rate; IPE - IPE Rate; Emp - Employment Rate
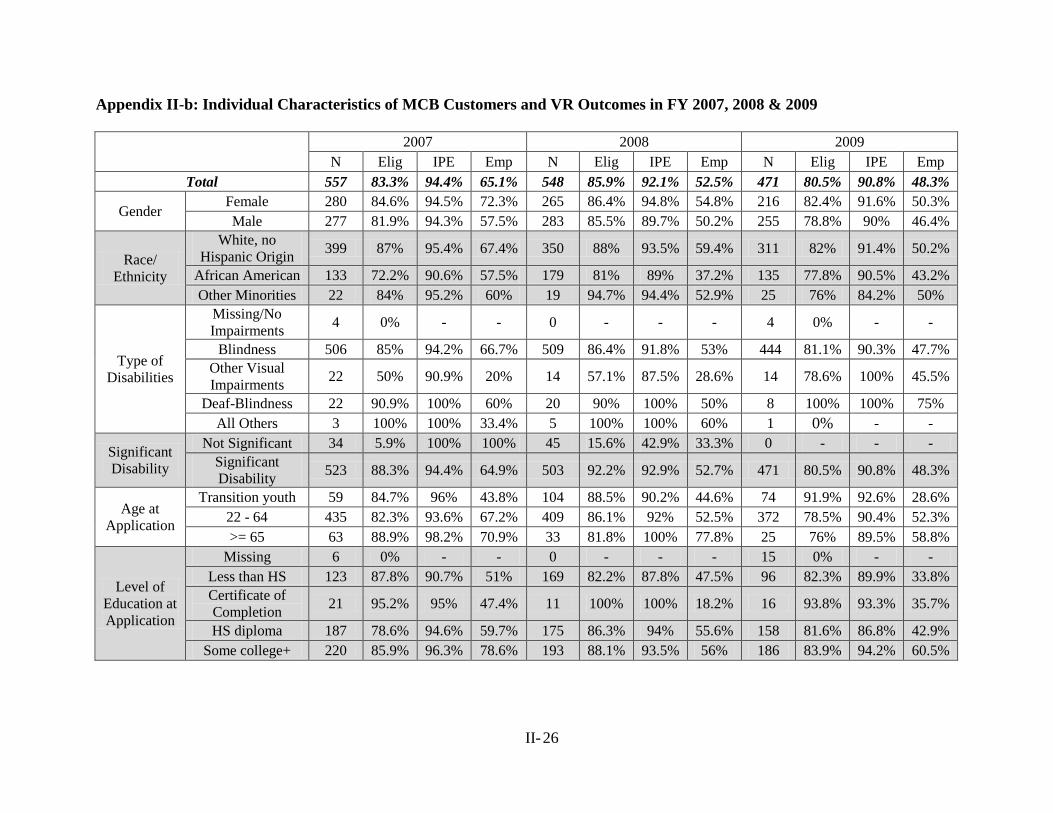
II- 26
Appendix II-b: Individual Characteristics of MCB Customers and VR Outcomes in FY 2007, 2008 & 2009
2007 2008 2009
N Elig IPE Emp N Elig IPE Emp N Elig IPE Emp
Total 557 83.3% 94.4% 65.1% 548 85.9% 92.1% 52.5% 471 80.5% 90.8% 48.3%
Gender Female 280 84.6% 94.5% 72.3% 265 86.4% 94.8% 54.8% 216 82.4% 91.6% 50.3%
Male 277 81.9% 94.3% 57.5% 283 85.5% 89.7% 50.2% 255 78.8% 90% 46.4%
Race/ Ethnicity
White, no
Hispanic Origin 399 87% 95.4% 67.4% 350 88% 93.5% 59.4% 311 82% 91.4% 50.2%
African American 133 72.2% 90.6% 57.5% 179 81% 89% 37.2% 135 77.8% 90.5% 43.2%
Other Minorities 22 84% 95.2% 60% 19 94.7% 94.4% 52.9% 25 76% 84.2% 50%
Type of
Disabilities
Missing/No
Impairments 4 0% - - 0 - - - 4 0% - -
Blindness 506 85% 94.2% 66.7% 509 86.4% 91.8% 53% 444 81.1% 90.3% 47.7%
Other Visual
Impairments 22 50% 90.9% 20% 14 57.1% 87.5% 28.6% 14 78.6% 100% 45.5%
Deaf-Blindness 22 90.9% 100% 60% 20 90% 100% 50% 8 100% 100% 75%
All Others 3 100% 100% 33.4% 5 100% 100% 60% 1 0% - -
Significant
Disability
Not Significant 34 5.9% 100% 100% 45 15.6% 42.9% 33.3% 0 - - -
Significant
Disability 523 88.3% 94.4% 64.9% 503 92.2% 92.9% 52.7% 471 80.5% 90.8% 48.3%
Age at
Application
Transition youth 59 84.7% 96% 43.8% 104 88.5% 90.2% 44.6% 74 91.9% 92.6% 28.6%
22 - 64 435 82.3% 93.6% 67.2% 409 86.1% 92% 52.5% 372 78.5% 90.4% 52.3%
>= 65 63 88.9% 98.2% 70.9% 33 81.8% 100% 77.8% 25 76% 89.5% 58.8%
Level of
Education at
Application
Missing 6 0% - - 0 - - - 15 0% - -
Less than HS 123 87.8% 90.7% 51% 169 82.2% 87.8% 47.5% 96 82.3% 89.9% 33.8%
Certificate of
Completion 21 95.2% 95% 47.4% 11 100% 100% 18.2% 16 93.8% 93.3% 35.7%
HS diploma 187 78.6% 94.6% 59.7% 175 86.3% 94% 55.6% 158 81.6% 86.8% 42.9%
Some college+ 220 85.9% 96.3% 78.6% 193 88.1% 93.5% 56% 186 83.9% 94.2% 60.5%
STATEWIDE COMPREHENSIVE
NEEDS ASSESSMENT
SECTION III
STAFF SURVEY SUMMARY FINDINGS
(MRS, MCB, MiSILC & CROs)
PROJECT EXCELLENCE
MICHIGAN STATE UNIVERSITY
III-1
TABLE OF CONTENTS
Staff Survey Results III-2
Key Service Findings across Organizations (MRS, MCB& CIL) III-4
Key Findings within Organizations (MRS, MCB& CIL) III-6
Community Rehabilitation Organizations (CROs) III-8
Key Findings from Qualitative Data III-10
Underserved Populations III-10
Key Service Needs III-11
Summary of Findings III-13
III-2
STAFF SURVEY SUMMARY FINDINGS: MRS, MCB, MSILC & CROS
Beginning in the first planning session for the 2011 Michigan Comprehensive Statewide Needs
Assessment (MCSNA) project, the interagency committee identified a need for a data collection
method to collect quantitative and qualitative needs assessment data at the local level. The
rationale was that although prior MCSNA reports met the federally mandated requirements for a
triennial needs assessment and were very informative at the state level, they had little meaning or
impact at the local level. The goal was established to develop a survey instrument that could,
with minimal modification, be utilized to collect local needs assessment related information
from vocational rehabilitation agency staff, centers for independent living staff, community
rehabilitation organization directors, people with disabilities and family and friends of people
with disabilities. The data collected could then be used to describe statewide needs for the
MCSNA report as well district/region specific information for agency manager‟s and partners.
In addition, changes over time at both the state and local level could then be tracked more
efficiently and effectively.
Instrument Development
Prior to developing the survey, MCSNA committee members conducted an extensive review of
the professional literature, requested and reviewed survey instruments from other states and
reviewed the recommendations in the RSA The VR Needs Assessment Guide. Team members
then developed the quantitative and qualitative survey items. The core survey questions that
addressed unserved or underserved populations and the availability and sufficiency of services
were then piloted and revised as needed. A total of seven survey instruments were developed to
meet the specific data collection needs for each agency and constituency. Although the core
survey questions were included in each survey, there are different individual and agency
characteristics questions as well as different scales and/or order of the core items in each survey.
For example, MRS, MCB and CIL staff members were asked to rate each of the 45 service areas
on two Likert-type scales: one for availability and one for sufficiency. The survey designed for
the CRO directors contained the same scales for the 10 community general services items, but
only asked to indicate which of the remaining 35 services their agency provided for people with
disabilities. Finally, a “MCSNA Frequently Asked Questions” document that described the
federally mandated CSNA requirements, the purpose of the survey, confidentiality and
participants rights, how the data would be reported etc., was also developed.
Data Collection Protocol
Project Excellence staff developed an electronic survey format using Qualtrics Survey Software
as the primary method to collect data from Michigan Rehabilitation Services (MRS) staff,
Michigan Commission for the Blind (MCB) staff, Centers for Independent Living (CIL) staff and
community rehabilitation organization directors who were MARO members. Multiple
individuals from each organization elected to complete the survey using alternative format
options such as entering the requested information directly into an email or a Word document
file and sending it to the designated Project Excellence staff member or completing a phone
III-3
interview with a Project Excellence staff member. Data were collected over a two week period in
February 2011.
Survey Results
Unfortunately, the planned launch of the persons with disabilities surveys and the family and
friends surveys were unexpectedly delayed. Although preliminary data has been collected, the
data collected from these groups are not included in this report; instead, it will be submitted as a
supplemental report once the data collection is completed.
Response Rates
The staff survey response rates varied by organization and district. In addition, many of the
survey responses were missing a significant amount of data. For example, some participants
elected to answer only a few of the quantitative questions but provided extensive qualitative
information. Others only answered the quantitative questions. After reviewing the response rates
for each survey, criterion was established to determine if a survey was „usable‟ for analyses. All
qualitative data was determined to be usable. For the quantitative data, at least 20 of the 45
service variables had to have a response on the availability Likert-type scale to be considered
usable.
A total of 666 MRS staff members were surveyed, and 263 (39.5%) answered at least a few
questions. Among them, 210 (31.5%) surveys were determined (based on the quantitative and/or
qualitative usability criterion) to be usable. A total of 129 MCB staff were surveyed, 45
responded (34.8%) and 40 surveys were determined to be usable (31%). A total of 268 (12
emails were returned as undeliverable) CIL staff were surveyed and 45 (16.8%) elected to
complete at least a few survey questions. After applying the usability criterion 40 (14.9%)
surveys were determined to be usable. It should be noted that analyses of the job title and site
variables for each organization confirmed that the participants responded across all job titles and
represented every office/region in the state including MCTI and MCB-TC.
Although the overall response rate for the MARO members‟ survey was 51.7%, due to extensive
missing data, the usable survey rate was 34%. The missing data in the majority of the surveys
were the questions that pertained to the organization specific questions. Therefore, we cannot
determine if the community rehabilitation organizations that responded are from throughout the
state or are centrally located.
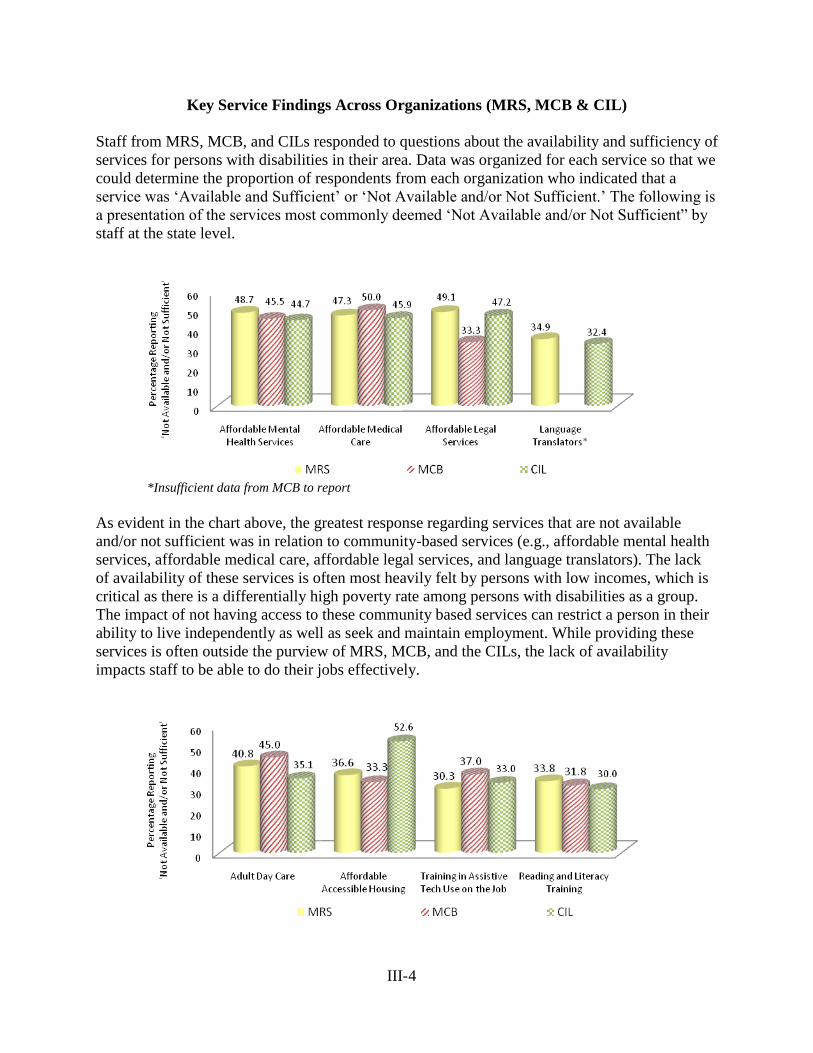
III-4
Key Service Findings Across Organizations (MRS, MCB & CIL)
Staff from MRS, MCB, and CILs responded to questions about the availability and sufficiency of
services for persons with disabilities in their area. Data was organized for each service so that we
could determine the proportion of respondents from each organization who indicated that a
service was „Available and Sufficient‟ or „Not Available and/or Not Sufficient.‟ The following is
a presentation of the services most commonly deemed „Not Available and/or Not Sufficient” by
staff at the state level.
*Insufficient data from MCB to report
As evident in the chart above, the greatest response regarding services that are not available
and/or not sufficient was in relation to community-based services (e.g., affordable mental health
services, affordable medical care, affordable legal services, and language translators). The lack
of availability of these services is often most heavily felt by persons with low incomes, which is
critical as there is a differentially high poverty rate among persons with disabilities as a group.
The impact of not having access to these community based services can restrict a person in their
ability to live independently as well as seek and maintain employment. While providing these
services is often outside the purview of MRS, MCB, and the CILs, the lack of availability
impacts staff to be able to do their jobs effectively.
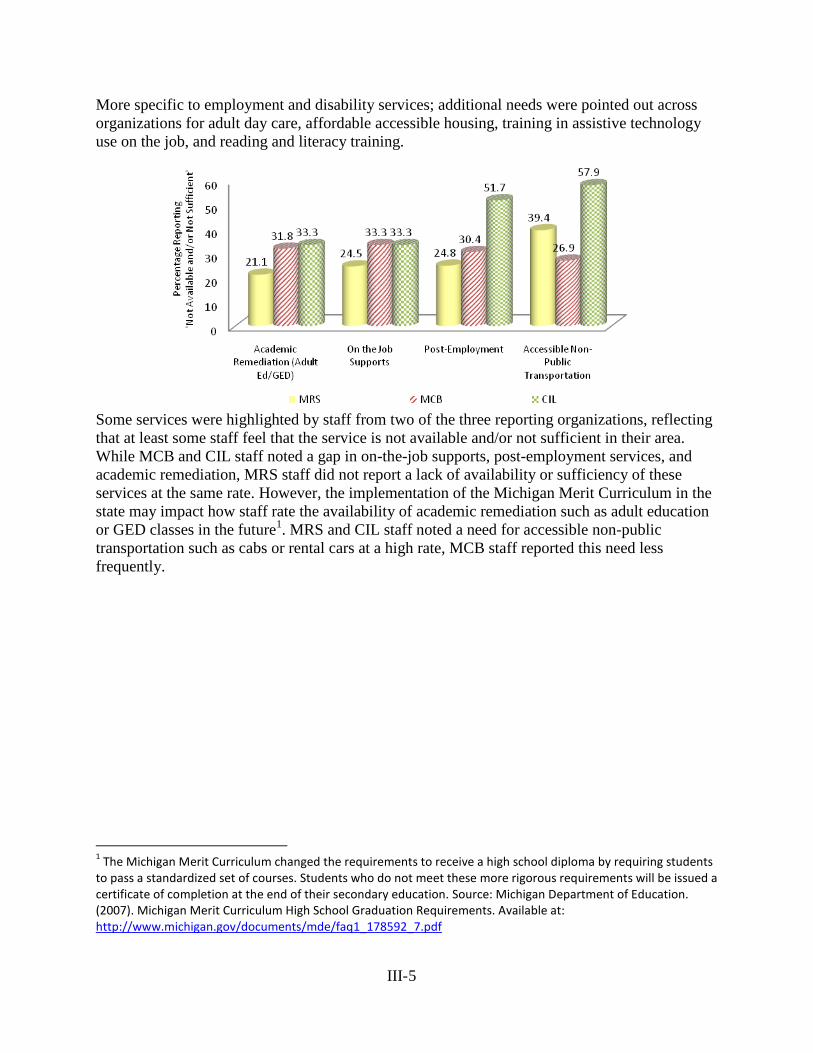
III-5
More specific to employment and disability services; additional needs were pointed out across
organizations for adult day care, affordable accessible housing, training in assistive technology
use on the job, and reading and literacy training.
Some services were highlighted by staff from two of the three reporting organizations, reflecting
that at least some staff feel that the service is not available and/or not sufficient in their area.
While MCB and CIL staff noted a gap in on-the-job supports, post-employment services, and
academic remediation, MRS staff did not report a lack of availability or sufficiency of these
services at the same rate. However, the implementation of the Michigan Merit Curriculum in the
state may impact how staff rate the availability of academic remediation such as adult education
or GED classes in the future1. MRS and CIL staff noted a need for accessible non-public
transportation such as cabs or rental cars at a high rate, MCB staff reported this need less
frequently.
1 The Michigan Merit Curriculum changed the requirements to receive a high school diploma by requiring students
to pass a standardized set of courses. Students who do not meet these more rigorous requirements will be issued a certificate of completion at the end of their secondary education. Source: Michigan Department of Education. (2007). Michigan Merit Curriculum High School Graduation Requirements. Available at: http://www.michigan.gov/documents/mde/faq1_178592_7.pdf
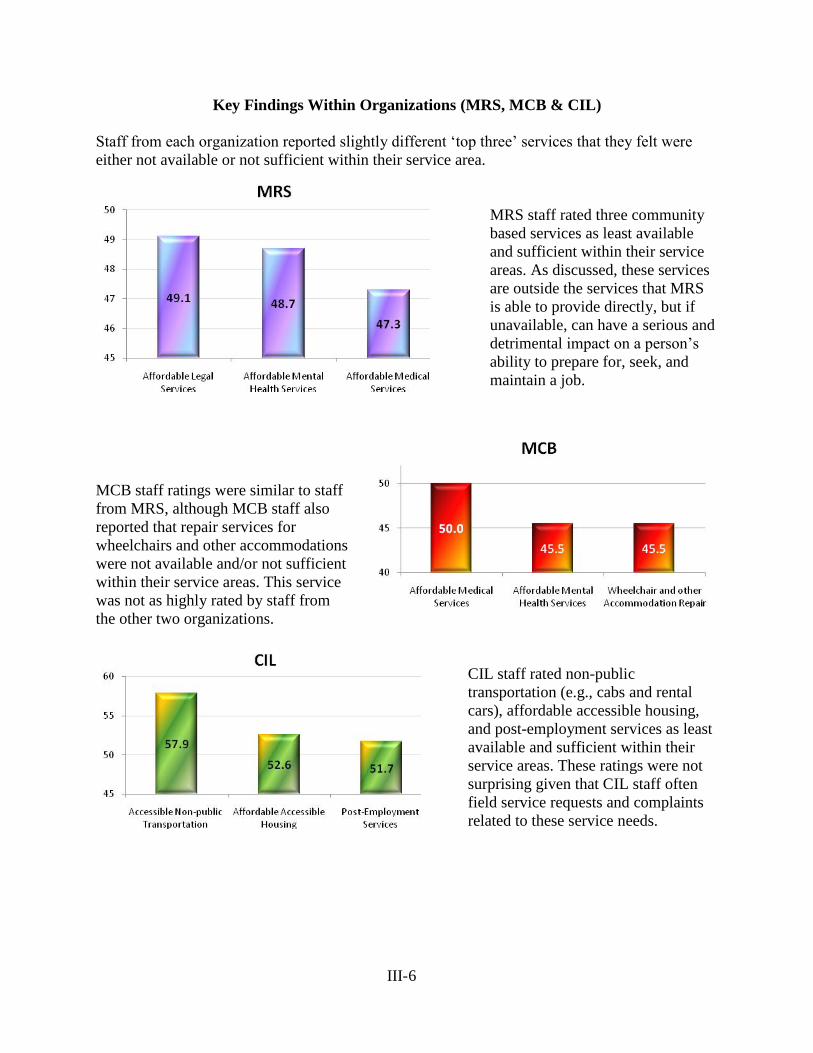
III-6
Key Findings Within Organizations (MRS, MCB & CIL)
Staff from each organization reported slightly different „top three‟ services that they felt were
either not available or not sufficient within their service area.
MRS staff rated three community
based services as least available
and sufficient within their service
areas. As discussed, these services
are outside the services that MRS
is able to provide directly, but if
unavailable, can have a serious and
detrimental impact on a person‟s
ability to prepare for, seek, and
maintain a job.
MCB staff ratings were similar to staff
from MRS, although MCB staff also
reported that repair services for
wheelchairs and other accommodations
were not available and/or not sufficient
within their service areas. This service
was not as highly rated by staff from
the other two organizations.
CIL staff rated non-public
transportation (e.g., cabs and rental
cars), affordable accessible housing,
and post-employment services as least
available and sufficient within their
service areas. These ratings were not
surprising given that CIL staff often
field service requests and complaints
related to these service needs.
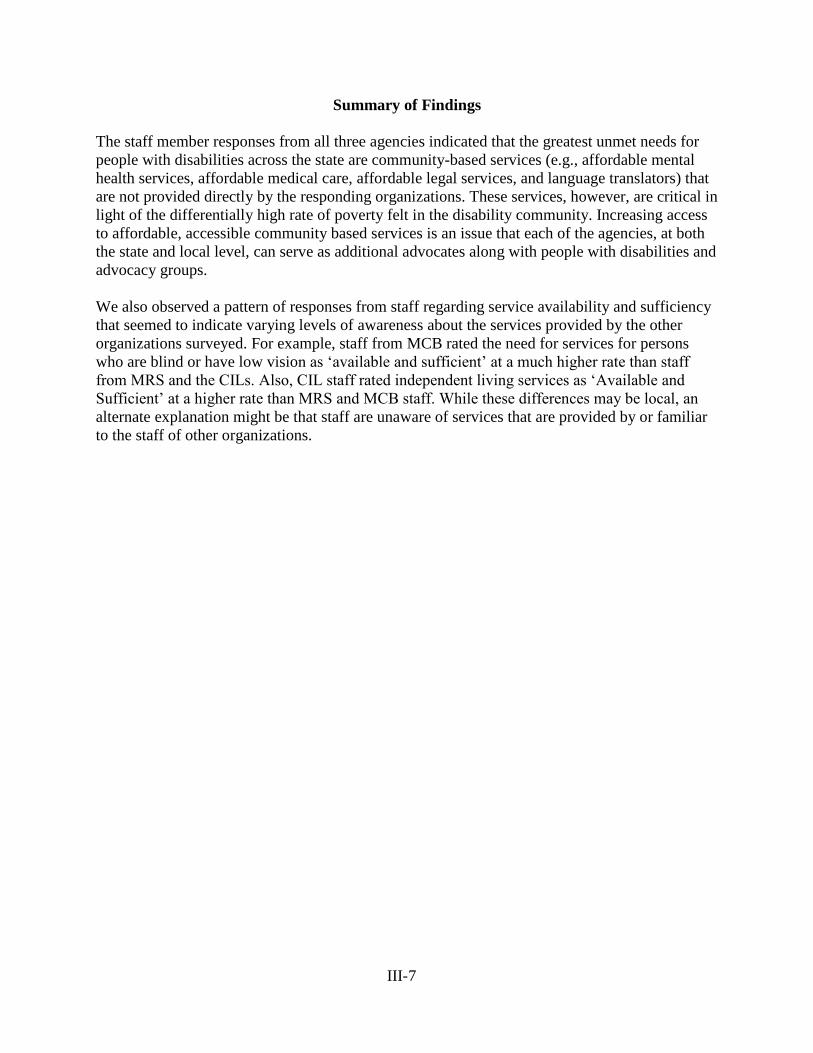
III-7
Summary of Findings
The staff member responses from all three agencies indicated that the greatest unmet needs for
people with disabilities across the state are community-based services (e.g., affordable mental
health services, affordable medical care, affordable legal services, and language translators) that
are not provided directly by the responding organizations. These services, however, are critical in
light of the differentially high rate of poverty felt in the disability community. Increasing access
to affordable, accessible community based services is an issue that each of the agencies, at both
the state and local level, can serve as additional advocates along with people with disabilities and
advocacy groups.
We also observed a pattern of responses from staff regarding service availability and sufficiency
that seemed to indicate varying levels of awareness about the services provided by the other
organizations surveyed. For example, staff from MCB rated the need for services for persons
who are blind or have low vision as „available and sufficient‟ at a much higher rate than staff
from MRS and the CILs. Also, CIL staff rated independent living services as „Available and
Sufficient‟ at a higher rate than MRS and MCB staff. While these differences may be local, an
alternate explanation might be that staff are unaware of services that are provided by or familiar
to the staff of other organizations.
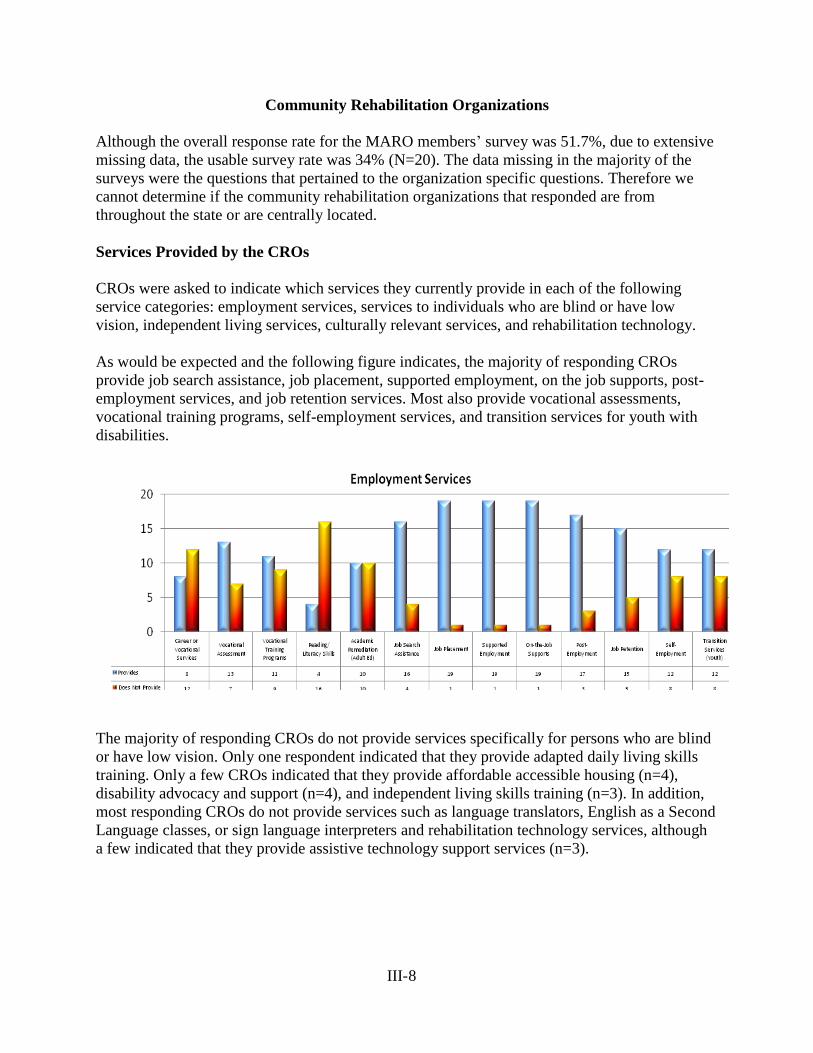
III-8
Community Rehabilitation Organizations
Although the overall response rate for the MARO members‟ survey was 51.7%, due to extensive
missing data, the usable survey rate was 34% (N=20). The data missing in the majority of the
surveys were the questions that pertained to the organization specific questions. Therefore we
cannot determine if the community rehabilitation organizations that responded are from
throughout the state or are centrally located.
Services Provided by the CROs
CROs were asked to indicate which services they currently provide in each of the following
service categories: employment services, services to individuals who are blind or have low
vision, independent living services, culturally relevant services, and rehabilitation technology.
As would be expected and the following figure indicates, the majority of responding CROs
provide job search assistance, job placement, supported employment, on the job supports, post-
employment services, and job retention services. Most also provide vocational assessments,
vocational training programs, self-employment services, and transition services for youth with
disabilities.
The majority of responding CROs do not provide services specifically for persons who are blind
or have low vision. Only one respondent indicated that they provide adapted daily living skills
training. Only a few CROs indicated that they provide affordable accessible housing (n=4),
disability advocacy and support (n=4), and independent living skills training (n=3). In addition,
most responding CROs do not provide services such as language translators, English as a Second
Language classes, or sign language interpreters and rehabilitation technology services, although
a few indicated that they provide assistive technology support services (n=3).
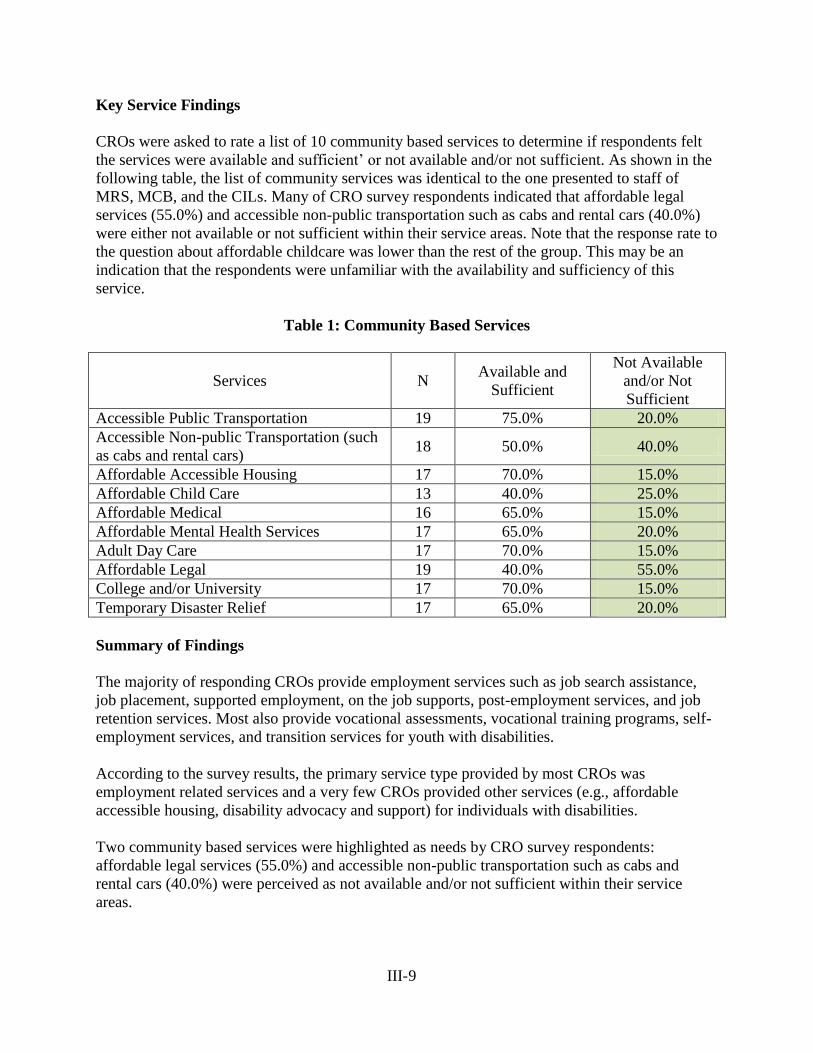
III-9
Key Service Findings
CROs were asked to rate a list of 10 community based services to determine if respondents felt
the services were available and sufficient‟ or not available and/or not sufficient. As shown in the
following table, the list of community services was identical to the one presented to staff of
MRS, MCB, and the CILs. Many of CRO survey respondents indicated that affordable legal
services (55.0%) and accessible non-public transportation such as cabs and rental cars (40.0%)
were either not available or not sufficient within their service areas. Note that the response rate to
the question about affordable childcare was lower than the rest of the group. This may be an
indication that the respondents were unfamiliar with the availability and sufficiency of this
service.
Table 1: Community Based Services
Services N Available and
Sufficient
Not Available
and/or Not
Sufficient
Accessible Public Transportation 19 75.0% 20.0%
Accessible Non-public Transportation (such
as cabs and rental cars) 18 50.0% 40.0%
Affordable Accessible Housing 17 70.0% 15.0%
Affordable Child Care 13 40.0% 25.0%
Affordable Medical 16 65.0% 15.0%
Affordable Mental Health Services 17 65.0% 20.0%
Adult Day Care 17 70.0% 15.0%
Affordable Legal 19 40.0% 55.0%
College and/or University 17 70.0% 15.0%
Temporary Disaster Relief 17 65.0% 20.0%
Summary of Findings
The majority of responding CROs provide employment services such as job search assistance,
job placement, supported employment, on the job supports, post-employment services, and job
retention services. Most also provide vocational assessments, vocational training programs, self-
employment services, and transition services for youth with disabilities.
According to the survey results, the primary service type provided by most CROs was
employment related services and a very few CROs provided other services (e.g., affordable
accessible housing, disability advocacy and support) for individuals with disabilities.
Two community based services were highlighted as needs by CRO survey respondents:
affordable legal services (55.0%) and accessible non-public transportation such as cabs and
rental cars (40.0%) were perceived as not available and/or not sufficient within their service
areas.
III-10
KEY FINDINGS FROM QUALITATIVE DATA
A total of 123 MRS staff, 22 CIL staff and 17 MCB staff provided comments regarding
populations of Michigan residents with disabilities who they believed to be underserved and the
services they believe are needed to improve the vocational rehabilitation and independent living
outcomes of the customers they serve.
Underserved Populations
Underserved Populations by Disability
The majority of the MRS and CIL staff comments were focused on the needs (external to MRS
and MSILC) of residents with mental illness, specifically those with moderate to severe
diagnoses and no medical insurance. Comments consistently described funding issues or
customers not qualifying for Community Mental Health (CMH) services as the main issues or
barriers to accessing needed services including supported employment services. The issue of
CMH eligibility also appear to have a considerable impact on current customers with
cognitive/intellectual impairments and individuals diagnosed with Autism Spectrum Disorders
(ASD). A significant number of staff from each agency reported that customers are being denied
CMH services because they are not Medicaid recipients and/or because their disability or
symptoms do not meet the qualifying criteria for CMH services (i.e., at risk for harm to self or
others). As a result, these customers are not receiving the supported employment and long-term
follow along services necessary to secure and maintain employment. MCB staff comments
echoed those of the other two agencies but the MCB staff identified older blind and low vision
Michigan residents as the primary underserved population. Finally, CIL and MCB staff reported
that individuals with TBI are underserved population in their agencies.
Transition Age Youth with Severe Disabilities
A considerable number of MRS staff and CIL staff identified transition age youth with severe
disabilities as a potentially (re)emerging underserved population. Staff indicated a great deal of
concern in terms of how the newly implemented Michigan Merit Curriculum will impact the
graduation rates, dropout rates and the employability of all students with disabilities, but
especially those with significant disabilities who, with accommodations and support, had been
able to complete high school with a diploma in the past.
Underserved Minority Populations
MRS, CIL and MCB staff working in the Southeast part of the state identified Arab and Arab
American residents as an underserved population. Staff from the Southwestern part of the state
reported that Hispanic/Latino residents with disabilities were underserved. MCB staff also
identified Somalian and Native American residents with disabilities as populations that are
underserved by their agency.
III-11
Michigan Residents with Disabilities and Felony Records
Individuals with disabilities and felony records were cited by MRS and CIL staff as being
underserved in relation to community re-entry and employment services. The comments
indicated that this population hasproblems finding and maintaining employment, securing low
cost housing and homelessness. An example comment stated:
“People who are released from prison who have had CSC charges are not allowed to
stay in missions. Therefore they are forced to live on the streets if they don't have
someone to stay with. Employment options for this group of people is almost non-
existent.”
Older Michigan Residents as an Emerging Underserved Population
CIL and MCB staff identified senior citizens transitioning home from nursing homes, those with
blindness and low vision acquired late in life and seniors with physical disabilities as an
emerging population as the baby boomer generation hits retirement age. They reported that
seniors lack personal attendant services, income, housing, and training in the use of assistive
technology. Example comments:
“Persons who have physical disabilities, (culture and race NOT a factor) who are in
thier 50's who are transitioning from nursing homes who do not have sufficient income
for housing and who do not qualify for senior living.” (CIL)
“There are not enough hours in the day to provide the adaptive training for seniors who
want to be more independent with their level of vision; we need more basic computer
training available for those who are somewhat familiar with computers but who now
cannot see to use it” (MCB)
Key Service Needs
CMH Services
Most comments from MRS and CIL staff clearly indicated that the limited CMH services
available are insufficient to meet the needs of Michigan residents with severe and moderate
mental illness. Example comments:
“More and more, people with mental illness are not able to access treatment that
includes stress reduction techniques, coping skills and how to move beyond areas of
trauma. Also, many 5 years ago would qualify for community mental health services and
today because of budget cutbacks, do not.” (MRS)
“Individuals with mental health issues are not receiving appropriate services, and are
not stable for employment, due to lack of mental health services.” (CIL)
III-12
“MCB consumers do not get support from CMH as other disabilities do.” (MCB)
Supported Employment Services and Transition Employment Sites
Staff from all three agencies identified supported employment as the second most critical need in
the state. A lack of funding for transition employment sites used for job skills training was the
third identified service related need. These gaps in services were noted to also be connected to
the availability of CMH services and to customers not qualifying for CMH services. Example
comments:
“Supported employment services are not sufficient in some areas of the state where cash-
match funds have never been established or are being cut.” (MRS)
“Our folks are rarely placed into jobs from the local SECT (Supported Employment
Community Team) and aren’t even considered for services if they aren’t receiving
Medicaid. This gap increases in our rural Gaylord area where individual job developers
are hired for most all MCB consumers- SE or not.” (MCB)
Accessible Public Transportation
A noteworthy number of staff across all three agencies indicated a need for better and more
accessible public transportation. In some rural areas, public transportation is simply not
available. A need for better curb-to-curb service for customers with physical limitations/mobility
barriers was mentioned. For example, one comment stated:
“Rural area individuals who use a wheelchair are having issues with the curb to curb
pick-up from the metro transit.”
Language interpreters
MRS staff indicated a need for language interpreter services in general, but specifically in terms
of Arabic interpreters in southeastern Michigan and colloquial Spanish in the southwestern part
of the state.
Job Development/Placement
Both CIL and MCB staff emphasized job development and placement as key service needs.
MCB also identifies need for job training and more employment opportunities.
“Deaf and Hard of Hearing job seekers get very little support as do people with TBI.”
(CIL)
“Job placement and job development services for blind persons is essentially non-
existent outside of MCB. Some agencies/programs claim to provide it and do a little bit
but it is woefully inadequate.” (MCB)
III-13
Housing
CIL staff identify housing as a key need for seniors, especially transitioning from nursing homes
to an apartment. They report difficulty in finding physically accessible housing and a lack of
low-income housing for seniors.
“My program helps transition folks who are in the nursing facilities and want to return to
the community to live independently, either in new apartments or return to their homes.
Amputees, usually from Diabetes, are not able to find barrier free apartments.”
SUMMARY OF FINDINGS
MRS, MCB and CIL staff jointly identified the following groups that they believe to be
underserved:
Michigan residents with mental illness, specifically those with moderate to severe
diagnoses and no medical insurance
Current customers with cognitive/intellectual impairments and individuals diagnosed
with Autism Spectrum Disorders (ASD) specifically in terms of those needing services
provided primarily by CMH
Arab and Arab American residents in Southeastern Michigan
Hispanic and Latino residents in Southwestern Michigan
In addition, MCB and CIL staff identified older blind and low vision Michigan residents and
Somalian and Native American residents with disabilities as populations they believe are
underserved by their agency. MRS staff and CIL staff identified individuals with disabilities and
felony records as an underserved population and transition youth with severe disabilities as a
potentially (re)emerging underserved population as a result of the newly implemented Michigan
Merit Curriculum. Senior citizens with disabilities were also identified as an emerging
underserved population, specifically in relation to the limited availability of community
resources for this population.
The staff from the three organizations also identified the key services that are currently needed:
Improved and expanded CMH Services
Supported Employment Services and Transition Employment Sites
Accessible Public Transportation
In addition:
MRS staff indicated a need for language interpreter services in general, but specifically in
terms of Arabic interpreters in southeastern Michigan and colloquial Spanish in the
southwestern part of the state
CIL and MCB staff emphasized job development and placement as key service needs
CIL staff identify housing as a key need for seniors

STATEWIDE COMPREHENSIVE
NEEDS ASSESSMENT
SECTION IV
KEY INFORMANT INTERVIEWS:
QUALITATIVE ANALYSES REPORT
PROJECT EXCELLENCE
MICHIGAN STATE UNIVERSITY
IV-1
TABLE OF CONTENTS
Introduction IV-2
Potentially Underserved Populations IV-3
Systemic Service Needs and Challenges that Cut Across Populations IV-7
Other Challenges to Effective Rehabilitation Service Delivery IV-9
Effective Strategies that Apply to Multiple Populations IV-11
Innovative Programs IV-12
Future Trends IV-13
Recommendations for Rehabilitation Service Providers IV-15
Summary of Findings IV-16
IV-2
KEY INFORMANT INTERVIEWS: QUALITATIVE ANALYSES REPORT
As one component of the Comprehensive Statewide Needs Assessment, semi-structured
telephone interviews were conducted with 34 individuals who represented a wide range of
rehabilitation and independent living-related constituencies. Potential key informants were
nominated by the Michigan Rehabilitation Services, Michigan Commission for the Blind, the
Michigan Statewide Independent Living Council and the Michigan Rehabilitation Council. They
included directors of state rehabilitation, special education, public health, aging, housing, and
transportation agencies, as well as large and small advocacy agencies, research projects and
institutes, and service providers.
Prior to initiating the project, each potential informant received a letter co-signed by the State
Directors of Michigan Rehabilitation Services and Michigan Commission for the Blind that
explained the purpose and importance of the federally mandated Comprehensive Statewide
Needs Assessment and requested their support and participation. A total of 41 agencies were
initially identified. Ten of the organizations chose not to participate and two nominations were
found to be redundant with others and so were dropped. In addition to the initial nominations,
five informants were added to the study at the recommendation of other key informants.
Data Collection Protocol
Each phone interview lasted approximately a half hour and covered the following questions:
1. What populations are not being served in Michigan or are not getting the level/amount of
service warranted? Who are they, and what do they need?
2. What are the emerging populations of people with disabilities in Michigan?
3. What has been your agency‟s experience with the populations cited in the previous
questions? What issues or barriers have you encountered in your efforts to provide
services, and what strategies have proven to be effective?
4. Are the needs that you have described particularly acute in certain areas, or do they exist
across the state?
5. To the extent that your agency has interfaced with Michigan Rehabilitation Services, the
Michigan Commission for the Blind, or Centers for Independent Living, what additional
steps might these organizations take to further strengthen their services?
6. What are the future trends in terms of service needs for people with disabilities in
Michigan?
Interviews were recorded, and detailed notes were made of each interview and checked for
accuracy against the recordings. Recordings were then deleted. A triangulation method was
utilized to analyze the data. Transcripts were coded using Atlas.ti software, and two other
researchers checked the accuracy of coding.
It should be noted that although data were obtained from a broadly representative sample of
individuals with expertise related to rehabilitation service needs, caution must be taken about
making general inferences with regard to the relative urgency of needs of one population versus
others. This report, therefore, summarizes the perspectives of the 34 informants, providing in-
IV-3
depth commentary as a supplement to the data collected from other sources. The opinions
expressed are those of the key informants and are not necessarily those of Project Excellence.
Potentially Underserved Populations
Listed below are the populations that were identified by one or more of the informants, together
with comments about specific needs and effective service strategies. As would be expected, key
informants who work with or advocate for specific population(s) tended to have a more narrow
focus than key informants who provide service(s) to Michigan residents with a broad range of
disabilities. Nonetheless, some populations were mentioned by several key informants; the order
populations are presented in the order that reflects their prevalence in informant comments.
Individuals with Mental Illness
Informants reported that there are significant gaps in the services and resources that are available
for people with mental illness. Several subgroups of people with mental illness were identified
as being underserved. One consists of the adult population that has insurance. Informants
indicated that although they can get medication, they rarely receive the supportive services that
complement medication (e.g., assertive community treatment, job search and maintenance,
mental health therapies, and services to maintain relationships). Further, individuals who are
“general fund clients” with CMH (not covered by Medicaid) were identified as receiving only
minimal services due to severe budget cuts over the last five years. Some informants suggested
that this has resulted in an increase in the number of people with mental illness becoming
involved with the criminal justice system
Transition age youth with emotional impairments were also identified as subgroup that is
potentially underserved. Informants reported that this group present unique challenges in that
although they may be experiencing early symptoms of mental illness, they may not be diagnosed
and/or not receiving special education services. As a result, they were likely to be disengaged
from school, continue for a fifth year, or fail to graduate.
Informants identified a small number of strategies for serving people with mental illness that
they believed were effective. These include:
Providing support and information to parents of children who are diagnosed with defiant
behavior, exhibiting symptoms of early mental illness or uncontrolled attention deficit
disorder.
For cultural groups reluctant to acknowledge mental illness, „stigma-busting‟ programs in
high schools can provide information about available supports and resources.
Transition Youth
Informants identified an array of characteristics among the population of transition age youth
that defines their level of risk and need: poverty, race/ethnicity, low socioeconomic status, aging
out of foster care, emotional impairments, learning disabilities, and other disabilities all were
reported by key informants as contributing to the equation. The impact of the Michigan Merit
IV-4
Curriculum on students who are unable to meet these new graduation requirements is a source of
significant concern for a number of informants. It was observed that students may miss out on
high school vocational experiences and be slotted into sheltered employment as a result.
Concern was also noted about youth exiting from special education at age 26 with no vocational
skills and a lack of work history that places them at a disadvantage vis-à-vis their peers who
graduated at age 18 and found jobs. Early involvement of MRS with the transition process was
the primary effective strategy identified for transition age youth.
Racial and Ethnic Populations
Informants felt that public vocational rehabilitation agencies do not serve people with disabilities
from Asian, Native American, Hispanic/Latino or Arab racial/ethnic groups in numbers
proportional to their presence in the population. Several key informants stated that although
African Americans come into the system in sufficient numbers, their outcomes are not
satisfactory overall. In terms of specific disability issues, several key informants noted that the
reluctance of some ethnic populations to recognize mental illness, discuss symptoms or seek
treatment was a major challenge in identifying need and providing services.
The informants also noted that there are specific health problems that are seen with greater
frequency in many of the racial and ethnic minority populations. In terms of the Native
American population, this includes untreated diabetes, injuries from car accidents (including
brain injury), and fetal alcohol effects, which are often hidden and undiagnosed. Establishing
personal relationships and maintaining an ongoing, visible presence in the community was
identified as a key component for effective service provision with all racial and ethnic minority
populations.
Individuals with Autism Spectrum Disorder (ASD)
Informant comments suggest that this subgroup is viewed as an emerging population that will not
significantly impact the adult service agencies for at least five years. It is interesting to note that
informants serving young populations spoke of this subgroup in present tense, while informants
serving solely adults discussed them in future tense. The challenge identified in serving this
population was that persons with Autism Spectrum Disorder (ASD) may be viewed as non-
compliant or defiant, leading to trouble with school, work, and possibly the criminal justice
system because they do not understand that their behavior is inappropriate. Key informants also
expressed concern that people with ASD are often determined ineligible for MRS or MCB
services due to the severity of their autistic traits. Other informants expressed frustration about
the challenge of finding and maintaining employment for this subgroup. Employers place
priority on good social skills, an area where individuals with ASD generally struggle.
It is noteworthy that informants, in recognizing the cognitive and interpersonal challenges
associated with ASD acknowledged that questions remain regarding how to accommodate and
work with this population. As one respondent noted, there is a critical need for more research on
best practices for improving outcomes for this population. The informants did identify a few
IV-5
recommendations and strategies for adult agencies that will soon be serving larger numbers of
people with ASD:
Train counselors about ASD and how to help persons with this disorder develop the soft
skills that are necessary to secure and maintain employment.
Place additional emphasis on using job coaches for people with ASD.
Provide additional services at transition such as those being offered by two current
programs, Statewide Autism Resources and Training (START) and Southwest Michigan
Autism Resources and Training (SMART).
Older Adults with Disabilities
Older adults with disabilities were mentioned by several key informants as an emerging
underserved population in Michigan. As one informant put it, people ages 50-65 are in “no-
persons-land” if they don‟t have insurance. Middle-aged adults who have been laid off, lost
insurance, etc. need assistance with a variety of services such as ramps, adaptive equipment,
home modification, and in-home assistance. Informants expressed concern that people with
disabilities are living longer and there is a lack of expertise regarding their medical and other
needs as they age. Informants also noted that service providers often lack skills to communicate
with older adults who have significant cognitive and psychiatric disabilities. One informant
suggested helping people self-advocate and working to improve communication between
medical services providers and older patients would be effective practices to address this issue.
Individuals with Developmental Disabilities
Many different needs were discussed under the broad category of developmental disabilities.
One informant stated that people with strong cognitive abilities still hit barriers to employment if
they have physical challenges. Informants also noted that the disability service system can be
confusing and adversarial, and the burden of proof for receiving services is often placed on
parents. Middle-aged people (ages 50-60) with developmental disabilities who have been living
at home and are now being seen at CMH centers for the first time were also identified as another
subgroup that may be in need of additional services.
In a general statement about effective strategies, one key informant stated that young people with
developmental disabilities need new models of rehabilitation services, citing that these young
adults have lived at home and have been in inclusive schools, and they won‟t want to be at a
sheltered workshop or group home post graduation. An informant also stated that more pilot
testing is needed with this population to find ways for improving services. Suggested effective
practices for individuals with developmental disabilities included the following:
More accommodated housing alternatives.
Alternative self-employment, micro-enterprises, etc.; “They need career paths, not dead-
end jobs.”
Peer mentoring and self-advocacy training for individuals and their families is needed.
Individuals who are Blind and Visually Impaired
IV-6
Multiple key informants mentioned unmet needs for this population, particularly in connection
with the aging population. Perspectives varied with regard to the needs of people who are blind
or visually impaired. One informant indicated that problems exist because MCB is mandated to
serve individuals who are legally blind and MRS is responsible for serving those with less severe
visual disabilities. Another individual faulted training centers for the blind for having an
insufficient vocational focus. Concern was also expressed that too many people with college
degrees are being closed as homemakers and not in paid employment positions.
A few effective strategies were mentioned for this population including:
More aggressive focus on job placement.
Offer outreach focused on promotion of services to individuals who experience decreased
vision in middle age and who don‟t have the adaptive skills of those with early onset
blindness.
Individuals who are Deaf and Hard of Hearing
Most references to people who are Deaf or hard of hearing were made by informants serving this
population. One informant pointed out that this population is unique in that many in the Deaf
community consider deafness to be a language barrier, not a disability. The informant felt that
this unique element influences who seeks services and makes access to services difficult. Others
stated that there is a shortage of sign language interpreters and insufficient funding for hearing
aid purchase and for other services. Another informant stated that mental health services are
unavailable in Michigan for Deaf people with co-occurring disabilities such as mental illness or
substance abuse. Informants believe that the number of people with hearing loss appears to be
growing; one informant stated that an estimated 40% of high school seniors are exhibiting signs
of early hearing loss.
Key informants provided a few effective strategies for this subgroup:
Increased use of technology to accommodate for the shortage of sign language
interpreters (e.g., MRS offices could be equipped with a video relay booth for in-house
interpretation services).
The provision of basic independent living skill training programs for this group (e.g., how
to use the 911 emergency system, budgeting, communication with their children, etc.)
Increased outreach and assistance with adaptation to hearing loss.
Additional Groups Identified as Potential Underserved Groups
Individuals with a substance abuse problem, specifically adolescents and adults over age
60.
People with the Most Severe and Complex Disabilities
Disabled Veterans
Adults with Learning Disabilities
Ex-Offenders
IV-7
Systemic Service Needs and Challenges that Cut Across Populations
Several categories of concern or barriers to services were identified that apply to multiple
customer populations and geographic areas. One major area involves gaps and discontinuities in
the service delivery systems. This area was discussed by many of the key informants and is
summarized here under the categories of funding, gaps in services, staffing concerns,
inadequately or poorly designed legislation, and failure of systems to work with families and
natural supports.
Funding
Michigan‟s economic decline, the state budget deficit crises and the resulting impact on the
availability of services for people with disabilities was a common thread through many of the
interviews. Most notably, key informants reported that with the depletion of the public mental
health system‟s general fund over recent years, qualification for Medicaid benefits often acts as
the unwritten criteria for provision of long-term services. For those who are not eligible for
Medicaid or hesitant to become a welfare recipient, reduction in the general fund results in
reduction in services, particularly long-term services such as supported employment and services
related to maintenance of disability. Informants also stated that CMH offices around the state
vary in the level of funding available for persons who are not on Medicaid as well as offices‟
attitudes toward pooling limited resources with other agencies toward shared goals. Informants
mentioned disappointment with the American Recovery and Reinvestment Act because it has not
lessened the strain experienced by those who do not qualify to receive system services.
Informants shared additional examples of how funding reductions have affected service
provision; these included:
Greater difficulty securing transportation grants to backfill funding cuts
Restricted ability of individuals to secure SSDI
A limitation on waivers for MIChoice funds that allow for support services to be
provided within the community rather than in nursing homes
Low wages for many disability related service jobs
Informants also voiced concerns about Medicaid services for those who qualify. Though dental,
vision, and podiatric services were recently restored after being cut from included Medicaid
services for a period of two years, one informant stated that only limited vision services have
been restored. There was also a concern among informants that low dollar reimbursements result
in reduced services for individuals on Medicaid. Informants also said that providing health
coverage through HMOs can limit the type of services provided for persons with disabilities
based on whether local providers are within the network of providers for a given plan. This
concern was mentioned specifically in regard to the more complicated service needs of those
dually diagnosed with mental illness and a history of substance abuse.
IV-8
Geographic Implications
It is apparent from interview responses that geographical location has important implications for
service provision and quality of those services. Although some responses emphasized the
positive, the majority highlighted geographical areas where they believe services are lacking or
non-existent. Concerns were expressed about the availability and/or quality of services in the
Detroit, Flint, and Saginaw metropolitan areas and as well as the more rural areas of the state
including the reservations and the surrounding areas. Concern was also expressed about the
availability of services in the northern part of the Lower Peninsula and the Upper Peninsula. One
informant suggested that service providers must be more strategic in their use of resources to
ensure equity in services throughout the state.
Gaps in Services
The gap that often exists between service systems was also identified as an area of concern. This
included gaps between special education and MRS as well as between MRS and long-term
supports, among others. Most notable were gaps in the transition between public education and
post-school service providers. In reference to this specific gap, informants mentioned that despite
the expectation for collaboration earlier in the process, conflict sometimes occurs over the post-
employment goals of students at or near the time of graduation. Informants indicated that they
believed these communication and collaboration issues often compromised student outcomes.
Informants also voiced concern about the gap between MRS and long-term support service
providers. Informants indicated that the complexity of obtaining long-term supports is sometimes
increased due to pressures for MRS to close cases post employment. Although they
acknowledged that consumers may re-enter the system after closure to secure long-term support,
they believe that this often does not occur.
Nearly all of the informants that identified gaps between service systems as an issue emphasized
the need for professionals to maintain a focus across systems as well as focus on their own
systems. It seems clear that persons with disabilities often have difficulty going from a system
that they are familiar with to an unfamiliar system, as well as with managing their care provided
simultaneously between multiple systems. In summary, there is work to be done in closing the
gaps between service providers to create a more efficient and effective service network.
Staffing concerns
Personnel shortages across agencies were attributed to high levels of turnover, a lack of qualified
providers, and low wages that make recruitment efforts difficult at times. Specific mention was
given to need for more sign-language interpreters and rehabilitation counselors. The key
informants believe that inadequate staffing is creating a significant strain on service systems and
having a negative effect on interagency collaboration as staff focus on keeping their own systems
afloat.
IV-9
Inadequate or poorly designed policy and legislation
Many informants from different systems mentioned policies and/or legislation that they
perceived as negatively affecting or limiting service provision. Legislation and policy were
commonly mentioned as disincentives to employment, primarily due to the difficult choice some
individuals are required to make between receiving health care benefits and striving for financial
independence. It was noted by one informant that CMH systems are uniquely positioned to
experience the inconsistency between different legislation and the strain that accompanies it. One
informant emphasized the difficulty of providing supported employment and long-term supports
under the same roof and stated that such strain can lead to inconsistencies in how policy is
interpreted across the state.
Some of the informants specifically referenced MRS regarding policies and legislation. Some
commented that the MRS focus on employment outcomes is too narrow. Concerns were also
raised that MRS measures of counselor success (e.g., employment outcomes) may lead
counselors to hold back placements once goals are met, a process known as “sandbagging.”
Finally, one informant voiced concern about the provision of informed choice in areas with high
unemployment. It was suggested that because counselors are under pressure to obtain
employment outcomes, persons with disabilities may be given only a few employment options.
Service systems and families/natural supports
Informants perceived the failure to involve family and/or other natural supports in disability
service systems as another systemic problem. Although informants reported that good examples
exist, they noted that inconsistencies in family involvement sometimes results in families being
entirely shut out from the process. Informants stated this to be true across all systems, including
those that providing services to children with disabilities. It was noted by informants that a
failure to involve families and natural supports may limit the network of resources that could be
utilized in service provision (e.g., using social network of natural supports to look for
employment opportunities).
Other Challenges to Effective Rehabilitation Service Delivery
Other types of barriers and challenges overlap to some degree with the concerns discussed
above, but involve more specific areas including economic issues, personnel shortages, needs for
additional training of counselors and other personnel, inadequate service provision, shortage of
opportunities for testing and assessment, customer readiness, and outreach. They are
summarized below with specific comments from key informants.
Economic issues
With high unemployment, fewer jobs available and more job seekers, employers are less
willing to take a chance on someone with poor work history. Baby boomers are staying
longer in their jobs, and competition among applicants continuously grows keener, so
placement of people with disabilities is more difficult.
IV-10
Jobs for people without advanced education and technology skills are disappearing.
States are attempting to deal with budget crises by cutting programs. An informant
suggested a range of tax reforms that could make a more sustainable revenue system to
support the public services that Michigan residents need. “In recent years there has been
a diminishment of resources and services to all populations, so none of the groups is
getting all that they need.”
Lack of housing and preventive care can lead to expensive treatment in hospitals and
emergency rooms.
Mentally ill people without insurance find it hard to get care or medications.
Service programs are being cut: e.g., Newsline for the Blind was shut off in November
for lack of funds. This is a problem, in part, because it provided job announcements.
Shortages in Community Resources and Services
There is a shortage of interpreters.
It is hard finding dentists who will provide services to people with developmental
disabilities or to people on Medicaid.
The shortage of psychiatrists requires them to rely increasingly on support personnel &
telemedicine.
There are not enough ACT teams.
There is a need for more community organizations to provide services to people with
visual impairment.
There is a need for more counselors and other service providers specifically trained to
work with people with various and complex disabilities (e.g., autism spectrum disorders).
Counselor training
Some key informants reported that counselors aren‟t adequately trained and sensitive
about the needs of individuals with certain types of disabilities. The disabilities
specifically mentioned the needs of customers with developmental disability & cognitive
impairment; people who are hard of hearing and don‟t know sign language; youth with
learning disabilities; people with severe mental illness; individuals who are blind, and
those with epilepsy.
Some counselors are not trained in rehabilitation counseling.
Many counselors are overburdened and burned out.
Sensitivity training for counselors and receptionists.
Inadequate services
It was reported that people who are blind are frustrated by getting written
communications they can‟t read.
Better housing options are needed that allow people with disabilities to feel part of the
community.
Finding any housing for ex-prisoners, especially those who use methamphetamines or
have a history of sexual criminal conduct is extremely difficult.
ACT teams are not always following proper procedures regarding medication
distribution.
IV-11
Lack of knowledge and information about technology on the part of both customers and
counselors.
There is still too much emphasis on what a person cannot do rather than on possibilities.
The focus needs to be on what people can do and translating that into employment
opportunity.
There is a need to let people with disabilities (epilepsy, in the case of this informant) and
employers know what accommodations might be available.
Services need to be culturally appropriate. For example, working by phone,
appointments, letters, etc. is not typical on the reservation.
Need for more assessment and training opportunities
More short-term training opportunities for those not academically inclined are needed.
People with learning disabilities need current testing to qualify for services, especially
training, and this is difficult to get.
There aren‟t places available to do assessment for people who are blind.
More adult education services are required, including basic learning services.
Teaching of adaptive skills and independent living are often not available to adults with
acquired visual disability.
Customer readiness
Economic circumstances impact rehabilitation options. Applicants are sometimes in
crisis, with acute need for housing, food, and clothing. They need support right now and
do not have time for ordinary agency procedures. They may be funneled into a stopgap
job rather than career.
Customers need better pre-service, work readiness, & social interaction skills.
Chronic unemployment makes employers less willing to take a chance on a candidate.
Lack of transportation, health insurance.
Side effects of medication for people with epilepsy or mental illness may present barriers
to employment.
Cognitive challenges, depression, lack of social skills.
Substance abuse, fetal alcohol effects.
Outreach
Key Informants also acknowledged that some groups of people with disabilities are hard
to engage: e.g., Native Americans, refugees, and immigrants.
Disability service organizations need to advertise the availability of services.
We need to do better outreach to veterans.
Effective Strategies that Apply to Multiple Populations
Providers must emphasize individualized ways to meet people‟s needs, e.g., supported
employment, starting a business, job carving, „place and train‟ employment model,
assistive technology.
IV-12
Increase the supply of well-trained individuals to do job development/job coaching, and
supported employment.
Utilize family networks. Include parents and families in planning.
Hold press conferences and distribute press releases to increase awareness of services.
Legislative advocacy.
Sensitivity to differences in the ways a culture values work and family supports.
Motivational interviewing approach at the time of application to ensure understanding of
customer needs and ensure that customer understands MRS so they can make an
appropriate judgment about whether they want to commit to the program.
We should learn to work more effectively with groups. Use the power of groups for peer
counseling, and peer support.
Use resources most effectively (e.g., community services rather than hospitalization for
mental illness).
Coordinate funding sources
Make good use of technology (iPod, cell phones, etc.)
Effective communication and collaboration between agencies.
Establish a triage unit to deal with critical needs at the time of application.
Create affirmative businesses that can provide wrap-around services to employees who
need them in order to function well at work.
Innovative Programs
A significant number of publicly and privately funded programs are underway in Michigan to
increase the effectiveness of rehabilitation programs for people with disabilities. Examples that
were described by one or more of the key informants include the following:
A Workforce Development program using ARRA (stimulus) funds is underway on an
Indian reservation. A counselor/coordinator was hired by the tribe to work proactively
with high-risk people who are in danger of losing their jobs or high-risk people who are
coming back to work. Customers include people from both Native and other
backgrounds.
SEARCH model has been used to place developmentally disabled students in private
sector internships during their last year of school, providing them with both job
experience and contacts to increase their likelihood of being hired after graduation.
Research by the NISH Institute and the BOND project led by Abt are seeking ways of
reducing SSI/SSDI disincentives so that people with severe disabilities can go back to
work, earn income, and retain assets. They are investigating improved incentives for
employers as well, such as a deviated wage based on an accurate assessment of
productivity, coupled with an earned income tax credit to offset the deviation. Another
approach would calculate payroll taxes only on actual productivity rather than on wages
paid.
Federal funding was received in 2005 to enhance the Medicaid Buy-In Program, which
emphasizes expansion of benefits planning, self-employment (micro-enterprises) and job
training in order to remove barriers to competitive employment.
SOAR project is aiming to assist homeless people to successfully apply for SSI/SSDI.
IV-13
Peckham Inc., a community based rehabilitation organization, provides services to large
groups of refugees as well as people with varied disabilities. They encourage peer
support and friendships among their workers through activities like community
gardening, and they have recently purchased a farm to increase those opportunities.
Their purposes include encouraging healthy eating of locally grown organic produce and
stimulating other innovative ideas. Peckham Foundation provides funding to support
education and citizenship efforts.
The Michigan Disability Rights Coalition has developed and pilot tested “Proud and
Powerful,” a retreat-style program for young women with disabilities.
A strategic alliance has been established between MRS offices and centers for
independent living in three Michigan areas in order to involve customers in collaborating
on achieving their goals.
Future Trends
When key informants were questioned about future trends in the service needs of persons with
disabilities a few common themes emerged. Some of these themes focus more on service barriers
than service needs, but all were included as future trends.
Reduction of Funding and Services
Unsurprisingly given continuing economic concerns and focus on the deficit, many informants
foresee diminished funding that leads to a reduction of services in the future. Concerns were
voiced over an already depleted general fund and funding for a number of public services. Worth
particular mention was the repeated worry that Medicaid shortfalls could lead to cuts of any
services that are not mandated (e.g., vision, dental, etc.). Many echoed a recent statement from
the Governor‟s staff, stating that the future of disability service provisions will require us to do
less with less. However, other informants suggested that what is needed in relation to disability
service provision is more not less during tough economic times.
Additional Service Needs
Some of the informants rationale for an increase of services or service funding included the
following: the rising costs of many medications that are needed by persons with disabilities and
current limitations in long-term care. Further, informants mentioned the need for additional
services for specific disability populations. For example, they discussed the need for increased or
more effective services for persons with autism spectrum disorder who are seeking to obtain or
maintain work. Additionally, mention of the need for more appropriate and integrated housing
opportunities was noted for young adults with developmental disabilities, homeless veterans, and
elderly populations who have disabilities such as visual impairment.
Training Needs
Related to increased service needs was the common call for more and more effective training for
persons with disabilities. This call was often voiced in connection with a changing labor market
IV-14
that is becoming more technical due to ongoing technological advancements. One informant
stated that even employment in fast food restaurants is becoming more technical, highlighting the
need for training in order to be competitive for entry-level jobs on up. Suggestions for improving
training ranged from an emphasis on early education to post-secondary institutions. A noted
trend was the recent interest shown by the federal government on persons with disabilities in
post-secondary education. In relation to secondary education, more than one informant felt that
the certificate of completion will result in a two-tiered education system with persons with
disabilities receiving lower-tier services.
A few informants emphasized that training for jobs that move persons with disabilities out of the
classification of the working poor should be emphasized. Yet, regardless of the type of training
received, the importance of technological competence seems appropriate across fields and of
greater importance for persons with disabilities who still do not have exposure or access to
learning advanced computer skills at the same rate as those who do not have a disability.
Although the majority of informants mentioned technology in relation to a changing labor
market, a few mentioned technology in relation to the way it as assisting and accommodating the
needs of persons with disabilities, both in training and employment. We next turn to employment
service needs.
Employment Service Needs
Sufficient focus was also placed on employment service needs to consider it separately. In this
area, the need to put more emphasis on self-employment or micro-enterprise was repeated by
multiple informants. Another theme within this area involved the concept of long-term
employment planning where emphasis is placed on career in addition to the need for an
immediate job. Mention was also made regarding the importance of meeting employer needs and
marketing to employers; and finally, one informant focused on the place of affirmative
businesses in the current labor market, as organizations where persons with disabilities can
receive necessary supports that other employers may be unwilling to provide (e.g., counseling,
education, skills training, etc.).
Integration of Persons with Disabilities and Service Providers
Overarching any particular service, informants mentioned a trend toward integration of services
and away from the traditional services that segregated persons with disabilities from their peers.
Similarly, informants posited that disability service providers are following suit by collaborating
in a more integrated fashion. In fact, one informant perceived the state of Michigan as moving
toward a super-agency idea, where public services were no longer separated based on target
population or by services provided. On the other hand, one informant provided a nuanced
assessment of integrated vs. specialized employment settings, stating that great diversity is
possible within affirmative business settings that provide targeted opportunities for populations
with special needs.
IV-15
Recommendations for Rehabilitation Service Providers
When asked to provide recommendations for improving services to MRS, MCB, and/or MSILC,
responses were varied and often stopped at critiquing what respondents perceived as working or
not working in these systems. It is apparent from size of agencies alone that MRS would be the
service system informants may be most familiar with and/or collaborate with; however, the
comments relating to this question addressed all three systems. Further, comments suggest that
experiences with each of these systems can vary greatly between regions, offices, and
individuals; this makes it difficult to define strengths and weaknesses at the system level. System
strengths from the perspective of one respondent were often perceived as weaknesses for another
respondent. Nevertheless, meaningful information about systems and recommendations for
systems were obtained. A description of this information follows.
MRS
The most common critique of MRS was that the generalist model resulted in an inability to
provide quality services to specific disability populations (i.e., visual impairment, autism
spectrum, and epilepsy). The recommendation was made that MRS staff focus on specialization
in such a way that each region possessed staff qualified to work effectively with various
disability populations. A potpourri of other recommendations were given, these included: 1)
focusing on the quality of vendor services, 2) add innovative programming for special
populations; 3) place an increased emphasis on small and micro-business enterprises; and 4)
resources be placed where they can result in the greatest impact for the customers they serve,
recognizing that current decisions may shape the entire system going into the future.
MCB
Fewer comments were made on this topic in relation to MCB. This is likely due to the relatively
narrow disability population focus of this system. It was recommended that MCB focus efforts
on making all forms of communication by MCB are accessible for persons who are blind or
visually impaired. Similarly, the recommendation was made that administration and leadership
become more sensitive to the needs of their customers and listen to customers in order to
improve the quality of service provision and service policy.
MSILC
Many positive perceptions towards independent living centers, their services and resources were
noted. A common recommendation was to extend service provision and resources to a broader
population than those with physical disabilities. As with many other areas for recommendation, it
was noted that the inclusion of those with developmental, cognitive, and intellectual disabilities,
and deaf or hard of hearing consumers varied between offices. Further, a recommendation for
targeting more ethnically diverse populations was provided with the critique that minority
populations are currently underrepresented in Michigan CILs. Two other recommendations
pertaining solely to CILs were 1) to expand their influence across the state. More specifically,
IV-16
recommendations were made to have satellite staff and to increase the number of staff and 2) to
increase the consistency of service provision between CILs across the state.
For All Service Providers
Healthy collaboration between agencies was often praised while inconsistent collaborations were
recognized as a problem. The most commonly cited recommendation for all systems was to
collaborate with other service agencies, and, in the case of CILS, to collaborate within their own
system. These recommendations sometimes emphasized collaborations at the administrative
level and sometimes at the service delivery level. Finally, it was recommended that all three
systems be proactive with customer complaints. It was noted that in situations the agencies
sought to address customer complaints promptly the outcomes were generally positive.
Summary of Findings
Interviews with the identified key informants were conducted to supplement other sources of
information and provide additional detail on gaps in services, and unserved and underserved
populations across the state. Interview protocol was consistent with the overall goals of the
Comprehensive Statewide Needs Assessment. Informants provided rich information with
examples from their every day work with persons with disabilities. Each informant had a unique
perspective, ranging from those who work in large state agencies across disability populations to
those who work for smaller organizations who focus on one particular group.
Several groups were highlighted as unserved or underserved, including specific disability
populations (e.g., persons with mental illness, persons with ASD), age groups (e.g., transition
aged youth, older adults), and persons of racial and ethnic minority groups (e.g.,. Native
American, Hispanic/Latino, Arab and Hmong.) Informants made recommendations on how to
improve services specifically for the groups they highlighted, often targeted at the special needs
of the population (e.g., communication strategies, accommodations), and increased staff training
to increase competence in working with these individuals. Additional, more general
recommendations were made that informants felt would improve services to all individuals with
disabilities.
Systemic challenges to providing services to persons with disabilities were the subject of many
comments from the informants. Themes emerged within this topic, including issues of funding,
specific challenges in particular geographic regions, service gaps, staffing concerns, legislation
and policy, and how family and other sources of natural supports are integrated into service
delivery. Additional challenges to service delivery were also highlighted, supported with
examples from informant experiences. Some of the innovative programs described by the
informants provide initial efforts to address shortfalls that have been identified. The progress and
results of these smaller scale initiatives will provide more information on the effectiveness of
alternative methods.
Recommendations were made to adult service agencies that are the focus of the Statewide
Comprehensive Needs Assessment. Universally applicable suggestions were to increase
IV-17
collaboration and communication with agencies, across agencies, as well as with other service
partners in the state, as well as to focus on prompt response to customer complaints with the
assistance of CAP. Additional recommendations by agency varied, but included long-term
strategic investment of resources, sensitivity to customer needs, and broadening of services to
include additional populations who might benefit from what already exists.
Information provided by key informants serve as a supplement to other methods for identifying
service gaps and unserved and underserved populations. The comments in this section of the
report provide additional detail including field-level examples of how these service gaps impact
persons with disabilities in the state. This information should be considered within the context of
the overall goals of the Comprehensive Statewide Needs Assessment.
In conclusion, a full consideration of systems problems for disability service systems must take
into account the reductions in funding that limit the service provision. It is a sad irony that
although increased collaboration and communication may help to minimize the effect of
monetary losses it can also become more difficult as added focus must be given to the basic
operation of each system individually. Finally, an opportunity to design service systems more
inclusive of families and other natural supports may exist as a means for meeting consumer
needs when internal resources are strained.
STATEWIDE COMPREHENSIVE
NEEDS ASSESSMENT
SECTION V
CUSTOMER SATISFACTION WITH SERVICES
(MRS & MiSILC)
PROJECT EXCELLENCE
MICHIGAN STATE UNIVERSITY
V-1
TABLE OF CONTENTS
MRS Customer Satisfaction Survey Results (FY 2009) V-2
Nine Satisfaction Questions V-2
Summary V-7
CIL Consumer Satisfaction Survey Results (FY 2010) V-8
Six Satisfaction Questions V-9
Summary V-12
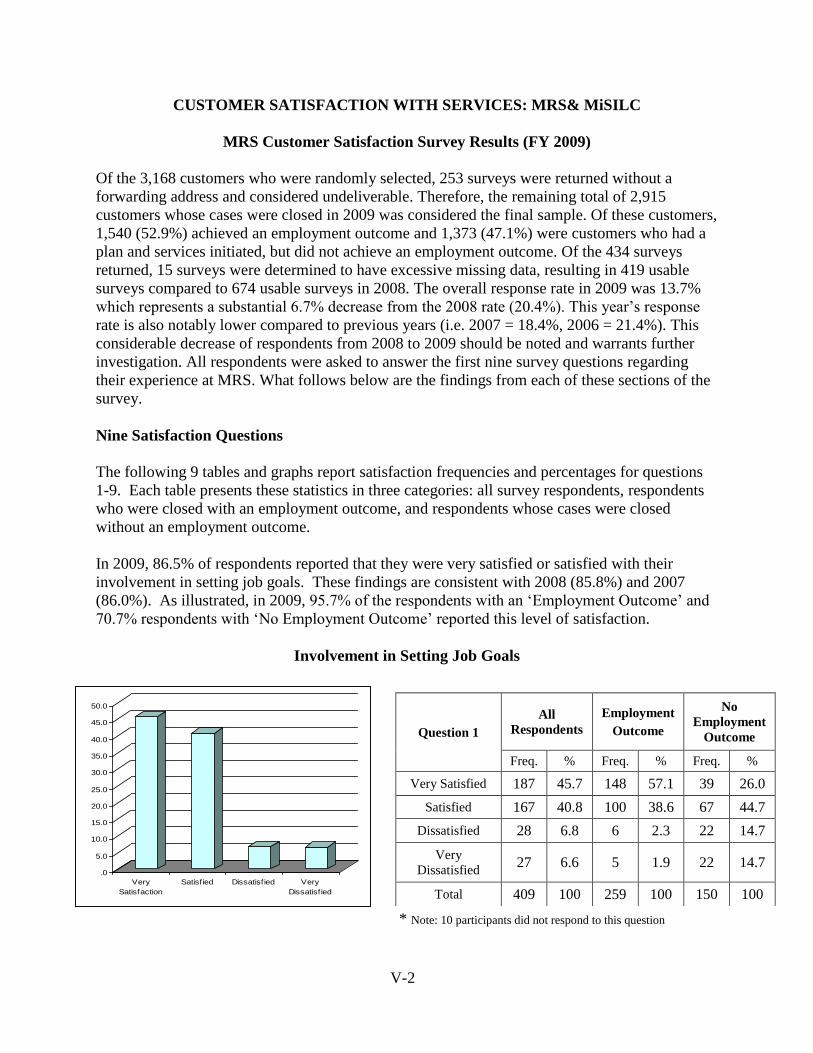
V-2
CUSTOMER SATISFACTION WITH SERVICES: MRS& MiSILC
MRS Customer Satisfaction Survey Results (FY 2009)
Of the 3,168 customers who were randomly selected, 253 surveys were returned without a
forwarding address and considered undeliverable. Therefore, the remaining total of 2,915
customers whose cases were closed in 2009 was considered the final sample. Of these customers,
1,540 (52.9%) achieved an employment outcome and 1,373 (47.1%) were customers who had a
plan and services initiated, but did not achieve an employment outcome. Of the 434 surveys
returned, 15 surveys were determined to have excessive missing data, resulting in 419 usable
surveys compared to 674 usable surveys in 2008. The overall response rate in 2009 was 13.7%
which represents a substantial 6.7% decrease from the 2008 rate (20.4%). This year‟s response
rate is also notably lower compared to previous years (i.e. 2007 = 18.4%, 2006 = 21.4%). This
considerable decrease of respondents from 2008 to 2009 should be noted and warrants further
investigation. All respondents were asked to answer the first nine survey questions regarding
their experience at MRS. What follows below are the findings from each of these sections of the
survey.
Nine Satisfaction Questions
The following 9 tables and graphs report satisfaction frequencies and percentages for questions
1-9. Each table presents these statistics in three categories: all survey respondents, respondents
who were closed with an employment outcome, and respondents whose cases were closed
without an employment outcome.
In 2009, 86.5% of respondents reported that they were very satisfied or satisfied with their
involvement in setting job goals. These findings are consistent with 2008 (85.8%) and 2007
(86.0%). As illustrated, in 2009, 95.7% of the respondents with an „Employment Outcome‟ and
70.7% respondents with „No Employment Outcome‟ reported this level of satisfaction.
Involvement in Setting Job Goals
.0
5.0
10.0
15.0
20.0
25.0
30.0
35.0
40.0
45.0
50.0
Very
Satisfaction
Satisfied Dissatisfied Very
Dissatisfied
* Note: 10 participants did not respond to this question
Question 1
All
Respondents
Employment
Outcome
No
Employment
Outcome
Freq. % Freq. % Freq. %
Very Satisfied 187 45.7 148 57.1 39 26.0
Satisfied 167 40.8 100 38.6 67 44.7
Dissatisfied 28 6.8 6 2.3 22 14.7
Very
Dissatisfied 27 6.6 5 1.9 22 14.7
Total 409 100 259 100 150 100
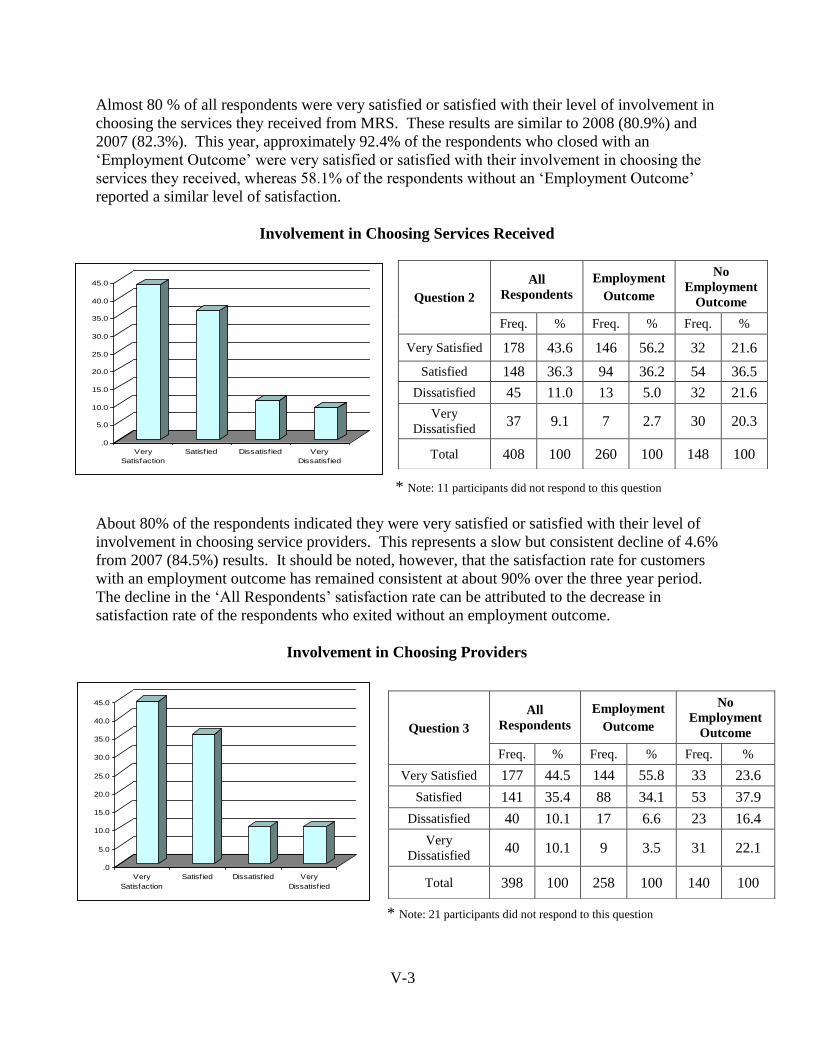
V-3
Almost 80 % of all respondents were very satisfied or satisfied with their level of involvement in
choosing the services they received from MRS. These results are similar to 2008 (80.9%) and
2007 (82.3%). This year, approximately 92.4% of the respondents who closed with an
„Employment Outcome‟ were very satisfied or satisfied with their involvement in choosing the
services they received, whereas 58.1% of the respondents without an „Employment Outcome‟
reported a similar level of satisfaction.
Involvement in Choosing Services Received
.0
5.0
10.0
15.0
20.0
25.0
30.0
35.0
40.0
45.0
Very
Satisfaction
Satisfied Dissatisfied Very
Dissatisfied
* Note: 11 participants did not respond to this question
About 80% of the respondents indicated they were very satisfied or satisfied with their level of
involvement in choosing service providers. This represents a slow but consistent decline of 4.6%
from 2007 (84.5%) results. It should be noted, however, that the satisfaction rate for customers
with an employment outcome has remained consistent at about 90% over the three year period.
The decline in the „All Respondents‟ satisfaction rate can be attributed to the decrease in
satisfaction rate of the respondents who exited without an employment outcome.
Involvement in Choosing Providers
.0
5.0
10.0
15.0
20.0
25.0
30.0
35.0
40.0
45.0
Very
Satisfaction
Satisfied Dissatisfied Very
Dissatisfied
* Note: 21 participants did not respond to this question
Question 2
All
Respondents
Employment
Outcome
No
Employment
Outcome
Freq. % Freq. % Freq. %
Very Satisfied 178 43.6 146 56.2 32 21.6
Satisfied 148 36.3 94 36.2 54 36.5
Dissatisfied 45 11.0 13 5.0 32 21.6
Very
Dissatisfied 37 9.1 7 2.7 30 20.3
Total 408 100 260 100 148 100
Question 3
All
Respondents
Employment
Outcome
No
Employment
Outcome
Freq. % Freq. % Freq. %
Very Satisfied 177 44.5 144 55.8 33 23.6
Satisfied 141 35.4 88 34.1 53 37.9
Dissatisfied 40 10.1 17 6.6 23 16.4
Very
Dissatisfied 40 10.1 9 3.5 31 22.1
Total 398 100 258 100 140 100
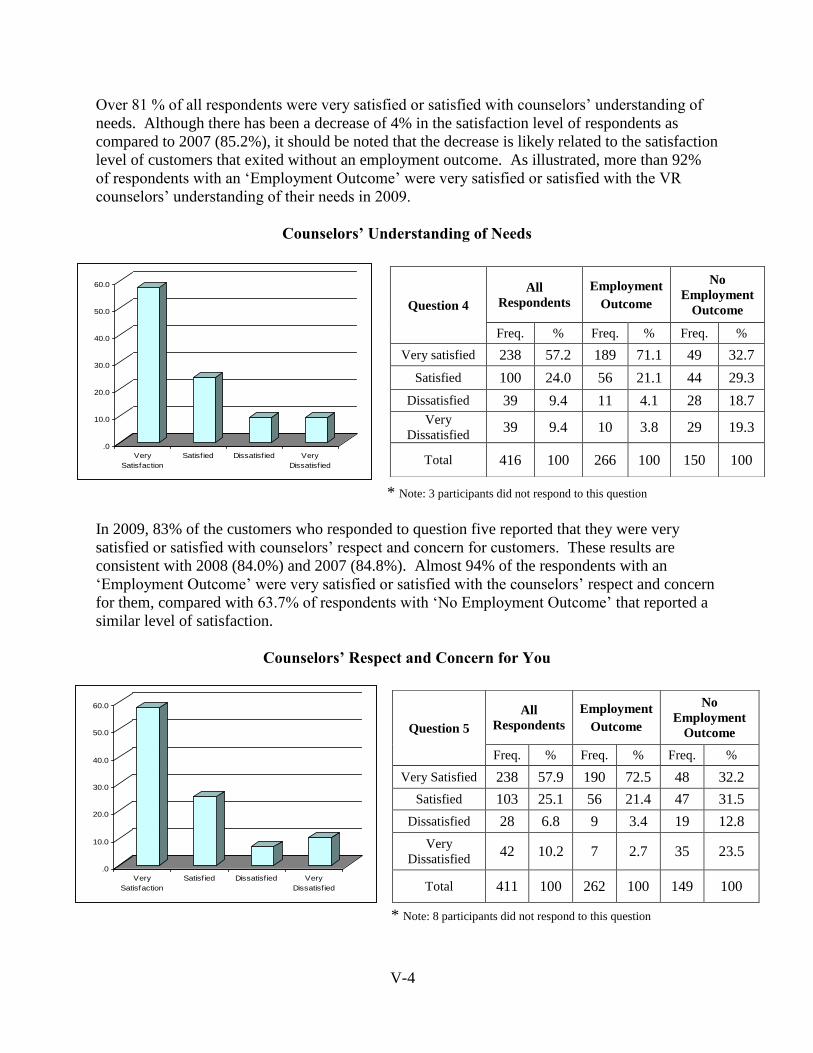
V-4
Over 81 % of all respondents were very satisfied or satisfied with counselors‟ understanding of
needs. Although there has been a decrease of 4% in the satisfaction level of respondents as
compared to 2007 (85.2%), it should be noted that the decrease is likely related to the satisfaction
level of customers that exited without an employment outcome. As illustrated, more than 92%
of respondents with an „Employment Outcome‟ were very satisfied or satisfied with the VR
counselors‟ understanding of their needs in 2009.
Counselors’ Understanding of Needs
.0
10.0
20.0
30.0
40.0
50.0
60.0
Very
Satisfaction
Satisfied Dissatisfied Very
Dissatisfied
* Note: 3 participants did not respond to this question
In 2009, 83% of the customers who responded to question five reported that they were very
satisfied or satisfied with counselors‟ respect and concern for customers. These results are
consistent with 2008 (84.0%) and 2007 (84.8%). Almost 94% of the respondents with an
„Employment Outcome‟ were very satisfied or satisfied with the counselors‟ respect and concern
for them, compared with 63.7% of respondents with „No Employment Outcome‟ that reported a
similar level of satisfaction.
Counselors’ Respect and Concern for You
.0
10.0
20.0
30.0
40.0
50.0
60.0
Very
Satisfaction
Satisfied Dissatisfied Very
Dissatisfied
* Note: 8 participants did not respond to this question
Question 4
All
Respondents
Employment
Outcome
No
Employment
Outcome
Freq. % Freq. % Freq. %
Very satisfied 238 57.2 189 71.1 49 32.7
Satisfied 100 24.0 56 21.1 44 29.3
Dissatisfied 39 9.4 11 4.1 28 18.7
Very
Dissatisfied 39 9.4 10 3.8 29 19.3
Total 416 100 266 100 150 100
Question 5
All
Respondents
Employment
Outcome
No
Employment
Outcome
Freq. % Freq. % Freq. %
Very Satisfied 238 57.9 190 72.5 48 32.2
Satisfied 103 25.1 56 21.4 47 31.5
Dissatisfied 28 6.8 9 3.4 19 12.8
Very
Dissatisfied 42 10.2 7 2.7 35 23.5
Total 411 100 262 100 149 100
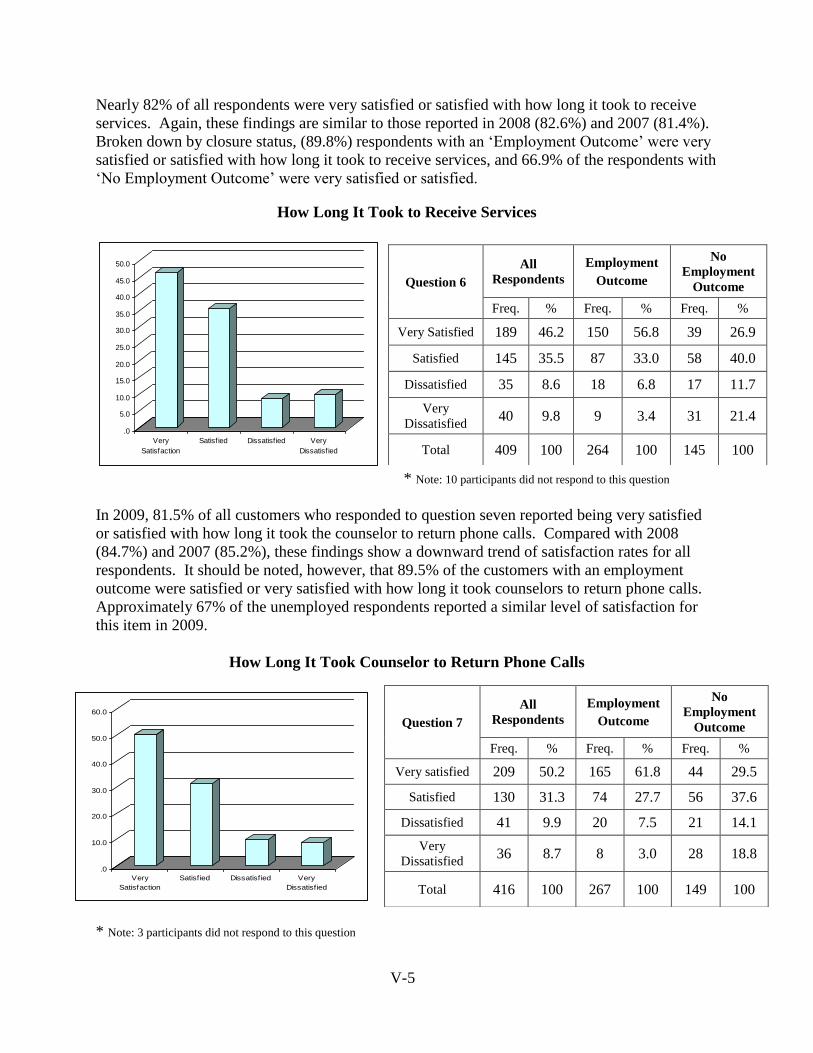
V-5
Nearly 82% of all respondents were very satisfied or satisfied with how long it took to receive
services. Again, these findings are similar to those reported in 2008 (82.6%) and 2007 (81.4%).
Broken down by closure status, (89.8%) respondents with an „Employment Outcome‟ were very
satisfied or satisfied with how long it took to receive services, and 66.9% of the respondents with
„No Employment Outcome‟ were very satisfied or satisfied.
How Long It Took to Receive Services
.0
5.0
10.0
15.0
20.0
25.0
30.0
35.0
40.0
45.0
50.0
Very
Satisfaction
Satisfied Dissatisfied Very
Dissatisfied
* Note: 10 participants did not respond to this question
In 2009, 81.5% of all customers who responded to question seven reported being very satisfied
or satisfied with how long it took the counselor to return phone calls. Compared with 2008
(84.7%) and 2007 (85.2%), these findings show a downward trend of satisfaction rates for all
respondents. It should be noted, however, that 89.5% of the customers with an employment
outcome were satisfied or very satisfied with how long it took counselors to return phone calls.
Approximately 67% of the unemployed respondents reported a similar level of satisfaction for
this item in 2009.
How Long It Took Counselor to Return Phone Calls
.0
10.0
20.0
30.0
40.0
50.0
60.0
Very
Satisfaction
Satisfied Dissatisfied Very
Dissatisfied
* Note: 3 participants did not respond to this question
Question 6
All
Respondents
Employment
Outcome
No
Employment
Outcome
Freq. % Freq. % Freq. %
Very Satisfied 189 46.2 150 56.8 39 26.9
Satisfied 145 35.5 87 33.0 58 40.0
Dissatisfied 35 8.6 18 6.8 17 11.7
Very
Dissatisfied 40 9.8 9 3.4 31 21.4
Total 409 100 264 100 145 100
Question 7
All
Respondents
Employment
Outcome
No
Employment
Outcome
Freq. % Freq. % Freq. %
Very satisfied 209 50.2 165 61.8 44 29.5
Satisfied 130 31.3 74 27.7 56 37.6
Dissatisfied 41 9.9 20 7.5 21 14.1
Very
Dissatisfied 36 8.7 8 3.0 28 18.8
Total 416 100 267 100 149 100
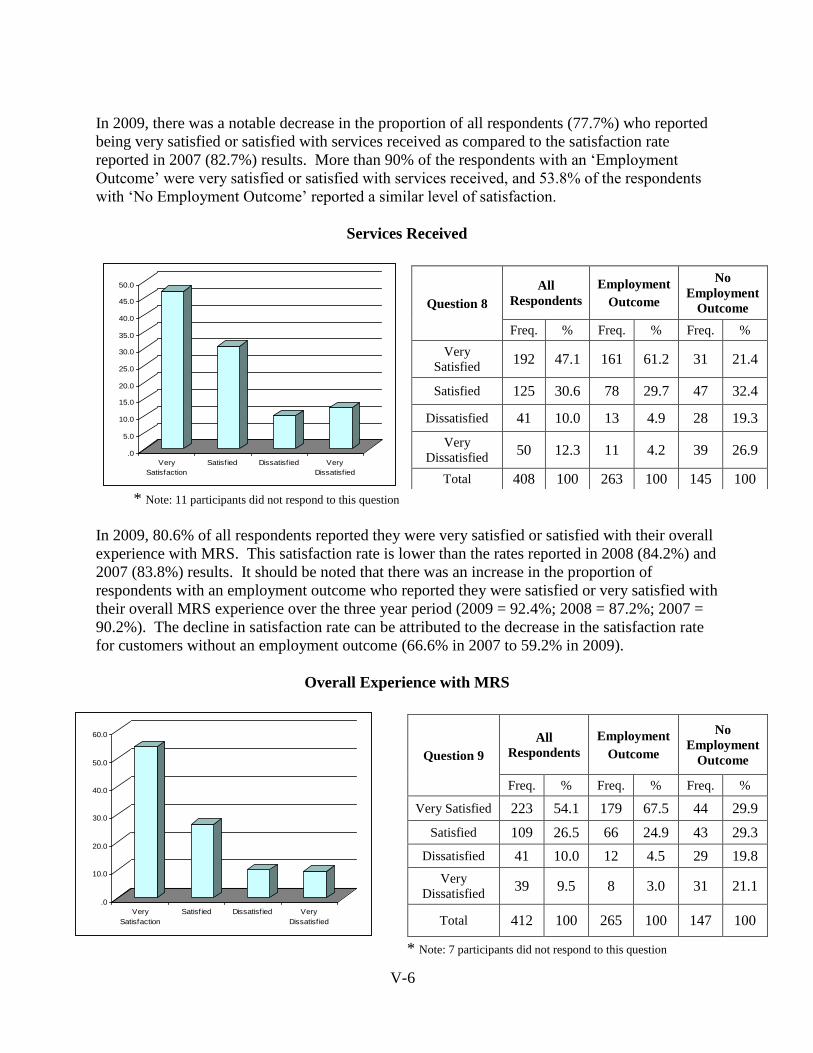
V-6
In 2009, there was a notable decrease in the proportion of all respondents (77.7%) who reported
being very satisfied or satisfied with services received as compared to the satisfaction rate
reported in 2007 (82.7%) results. More than 90% of the respondents with an „Employment
Outcome‟ were very satisfied or satisfied with services received, and 53.8% of the respondents
with „No Employment Outcome‟ reported a similar level of satisfaction.
Services Received
.0
5.0
10.0
15.0
20.0
25.0
30.0
35.0
40.0
45.0
50.0
Very
Satisfaction
Satisfied Dissatisfied Very
Dissatisfied
* Note: 11 participants did not respond to this question
In 2009, 80.6% of all respondents reported they were very satisfied or satisfied with their overall
experience with MRS. This satisfaction rate is lower than the rates reported in 2008 (84.2%) and
2007 (83.8%) results. It should be noted that there was an increase in the proportion of
respondents with an employment outcome who reported they were satisfied or very satisfied with
their overall MRS experience over the three year period (2009 = 92.4%; 2008 = 87.2%; 2007 =
90.2%). The decline in satisfaction rate can be attributed to the decrease in the satisfaction rate
for customers without an employment outcome (66.6% in 2007 to 59.2% in 2009).
Overall Experience with MRS
.0
10.0
20.0
30.0
40.0
50.0
60.0
Very
Satisfaction
Satisfied Dissatisfied Very
Dissatisfied
* Note: 7 participants did not respond to this question
Question 8
All
Respondents
Employment
Outcome
No
Employment
Outcome
Freq. % Freq. % Freq. %
Very
Satisfied 192 47.1 161 61.2 31 21.4
Satisfied 125 30.6 78 29.7 47 32.4
Dissatisfied 41 10.0 13 4.9 28 19.3
Very
Dissatisfied 50 12.3 11 4.2 39 26.9
Total 408 100 263 100 145 100
Question 9
All
Respondents
Employment
Outcome
No
Employment
Outcome
Freq. % Freq. % Freq. %
Very Satisfied 223 54.1 179 67.5 44 29.9
Satisfied 109 26.5 66 24.9 43 29.3
Dissatisfied 41 10.0 12 4.5 29 19.8
Very
Dissatisfied 39 9.5 8 3.0 31 21.1
Total 412 100 265 100 147 100
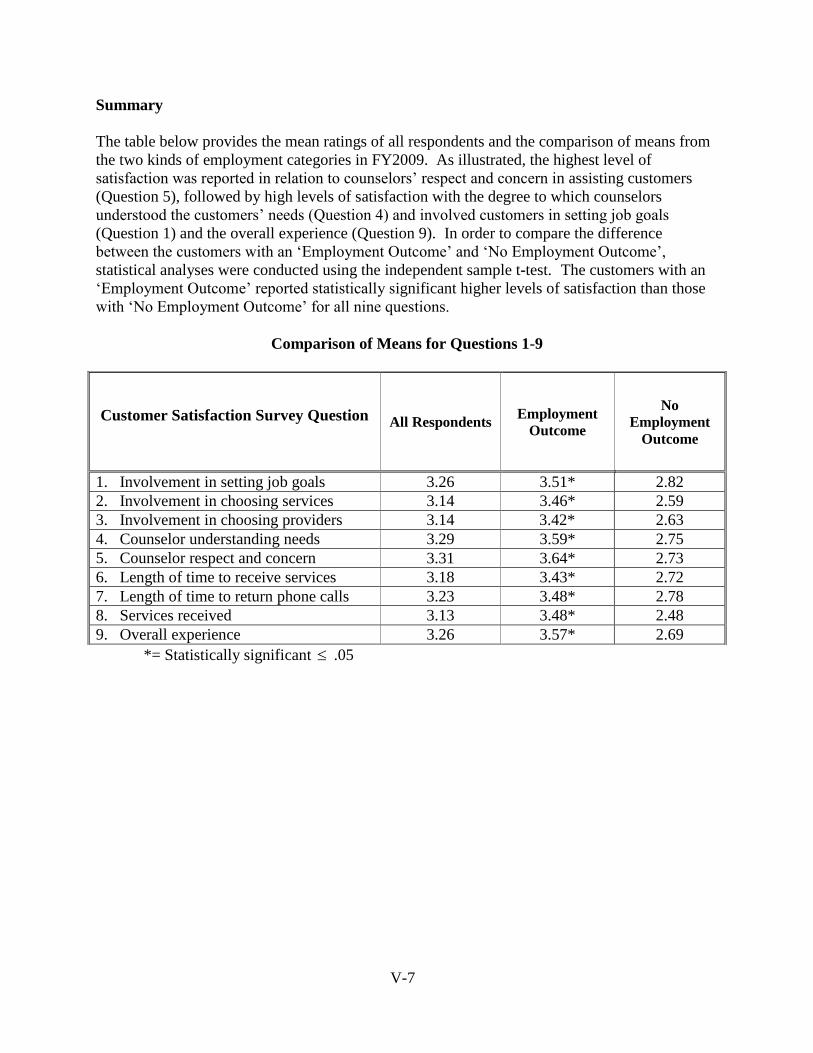
V-7
Summary
The table below provides the mean ratings of all respondents and the comparison of means from
the two kinds of employment categories in FY2009. As illustrated, the highest level of
satisfaction was reported in relation to counselors‟ respect and concern in assisting customers
(Question 5), followed by high levels of satisfaction with the degree to which counselors
understood the customers‟ needs (Question 4) and involved customers in setting job goals
(Question 1) and the overall experience (Question 9). In order to compare the difference
between the customers with an „Employment Outcome‟ and „No Employment Outcome‟,
statistical analyses were conducted using the independent sample t-test. The customers with an
„Employment Outcome‟ reported statistically significant higher levels of satisfaction than those
with „No Employment Outcome‟ for all nine questions.
Comparison of Means for Questions 1-9
*= Statistically significant .05
Customer Satisfaction Survey Question
All Respondents Employment
Outcome
No
Employment Outcome
1. Involvement in setting job goals 3.26 3.51* 2.82
2. Involvement in choosing services 3.14 3.46* 2.59
3. Involvement in choosing providers 3.14 3.42* 2.63
4. Counselor understanding needs 3.29 3.59* 2.75
5. Counselor respect and concern 3.31 3.64* 2.73
6. Length of time to receive services 3.18 3.43* 2.72
7. Length of time to return phone calls 3.23 3.48* 2.78
8. Services received 3.13 3.48* 2.48
9. Overall experience 3.26 3.57* 2.69
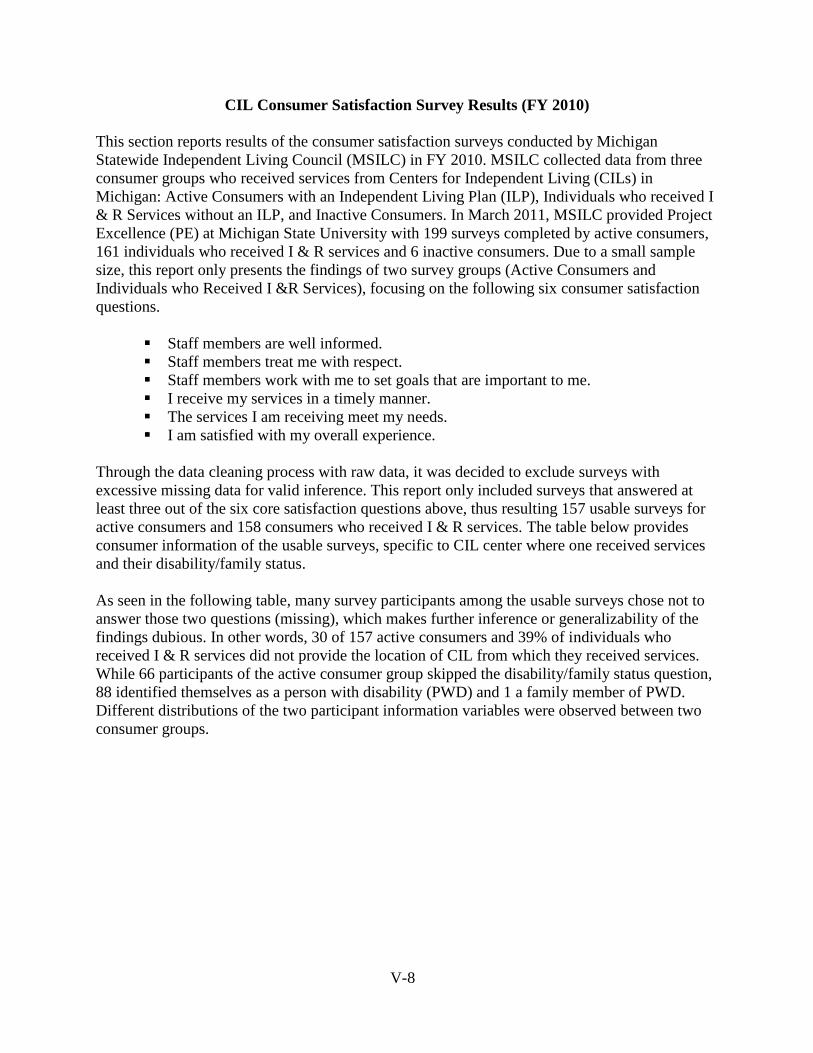
V-8
CIL Consumer Satisfaction Survey Results (FY 2010)
This section reports results of the consumer satisfaction surveys conducted by Michigan
Statewide Independent Living Council (MSILC) in FY 2010. MSILC collected data from three
consumer groups who received services from Centers for Independent Living (CILs) in
Michigan: Active Consumers with an Independent Living Plan (ILP), Individuals who received I
& R Services without an ILP, and Inactive Consumers. In March 2011, MSILC provided Project
Excellence (PE) at Michigan State University with 199 surveys completed by active consumers,
161 individuals who received I & R services and 6 inactive consumers. Due to a small sample
size, this report only presents the findings of two survey groups (Active Consumers and
Individuals who Received I &R Services), focusing on the following six consumer satisfaction
questions.
Staff members are well informed.
Staff members treat me with respect.
Staff members work with me to set goals that are important to me.
I receive my services in a timely manner.
The services I am receiving meet my needs.
I am satisfied with my overall experience.
Through the data cleaning process with raw data, it was decided to exclude surveys with
excessive missing data for valid inference. This report only included surveys that answered at
least three out of the six core satisfaction questions above, thus resulting 157 usable surveys for
active consumers and 158 consumers who received I & R services. The table below provides
consumer information of the usable surveys, specific to CIL center where one received services
and their disability/family status.
As seen in the following table, many survey participants among the usable surveys chose not to
answer those two questions (missing), which makes further inference or generalizability of the
findings dubious. In other words, 30 of 157 active consumers and 39% of individuals who
received I & R services did not provide the location of CIL from which they received services.
While 66 participants of the active consumer group skipped the disability/family status question,
88 identified themselves as a person with disability (PWD) and 1 a family member of PWD.
Different distributions of the two participant information variables were observed between two
consumer groups.
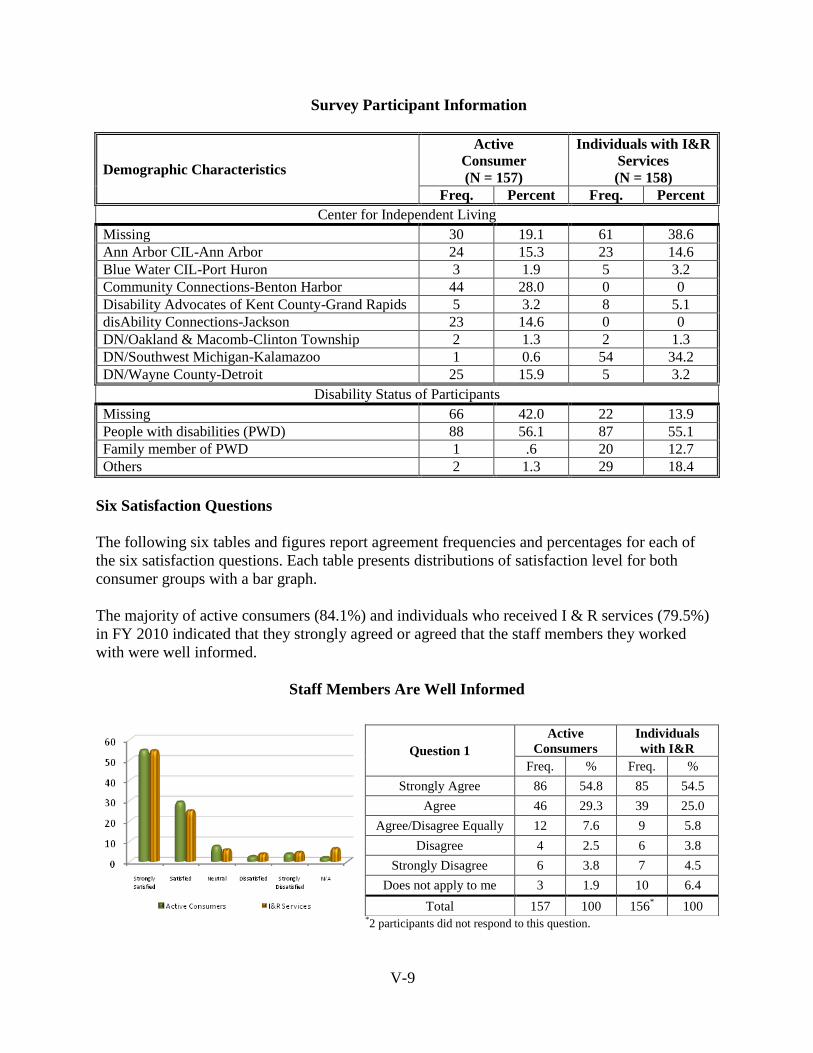
V-9
Survey Participant Information
Demographic Characteristics
Active Consumer (N = 157)
Individuals with I&R
Services (N = 158)
Freq. Percent Freq. Percent
Center for Independent Living
Missing 30 19.1 61 38.6 Ann Arbor CIL-Ann Arbor 24 15.3 23 14.6 Blue Water CIL-Port Huron 3 1.9 5 3.2 Community Connections-Benton Harbor 44 28.0 0 0 Disability Advocates of Kent County-Grand Rapids 5 3.2 8 5.1 disAbility Connections-Jackson 23 14.6 0 0 DN/Oakland & Macomb-Clinton Township 2 1.3 2 1.3 DN/Southwest Michigan-Kalamazoo 1 0.6 54 34.2 DN/Wayne County-Detroit 25 15.9 5 3.2
Disability Status of Participants
Missing 66 42.0 22 13.9 People with disabilities (PWD) 88 56.1 87 55.1 Family member of PWD 1 .6 20 12.7 Others 2 1.3 29 18.4
Six Satisfaction Questions
The following six tables and figures report agreement frequencies and percentages for each of
the six satisfaction questions. Each table presents distributions of satisfaction level for both
consumer groups with a bar graph.
The majority of active consumers (84.1%) and individuals who received I & R services (79.5%)
in FY 2010 indicated that they strongly agreed or agreed that the staff members they worked
with were well informed.
Staff Members Are Well Informed
*2 participants did not respond to this question.
Question 1
Active
Consumers
Individuals
with I&R
Freq. % Freq. %
Strongly Agree 86 54.8 85 54.5
Agree 46 29.3 39 25.0
Agree/Disagree Equally 12 7.6 9 5.8
Disagree 4 2.5 6 3.8
Strongly Disagree 6 3.8 7 4.5
Does not apply to me 3 1.9 10 6.4
Total 157 100 156* 100
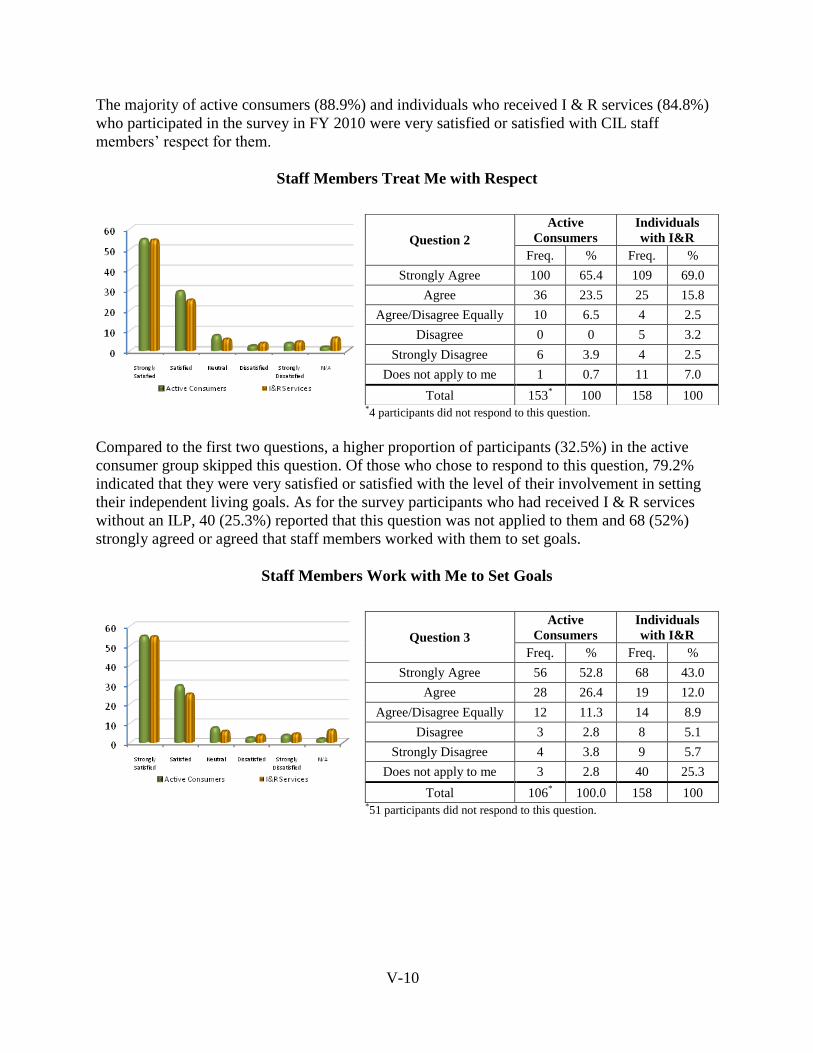
V-10
The majority of active consumers (88.9%) and individuals who received I & R services (84.8%)
who participated in the survey in FY 2010 were very satisfied or satisfied with CIL staff
members‟ respect for them.
Staff Members Treat Me with Respect
*4 participants did not respond to this question.
Compared to the first two questions, a higher proportion of participants (32.5%) in the active
consumer group skipped this question. Of those who chose to respond to this question, 79.2%
indicated that they were very satisfied or satisfied with the level of their involvement in setting
their independent living goals. As for the survey participants who had received I & R services
without an ILP, 40 (25.3%) reported that this question was not applied to them and 68 (52%)
strongly agreed or agreed that staff members worked with them to set goals.
Staff Members Work with Me to Set Goals
*51 participants did not respond to this question.
Question 2
Active
Consumers
Individuals
with I&R
Freq. % Freq. %
Strongly Agree 100 65.4 109 69.0
Agree 36 23.5 25 15.8
Agree/Disagree Equally 10 6.5 4 2.5
Disagree 0 0 5 3.2
Strongly Disagree 6 3.9 4 2.5
Does not apply to me 1 0.7 11 7.0
Total 153* 100 158 100
Question 3
Active
Consumers
Individuals
with I&R
Freq. % Freq. %
Strongly Agree 56 52.8 68 43.0
Agree 28 26.4 19 12.0
Agree/Disagree Equally 12 11.3 14 8.9
Disagree 3 2.8 8 5.1
Strongly Disagree 4 3.8 9 5.7
Does not apply to me 3 2.8 40 25.3
Total 106* 100.0 158 100
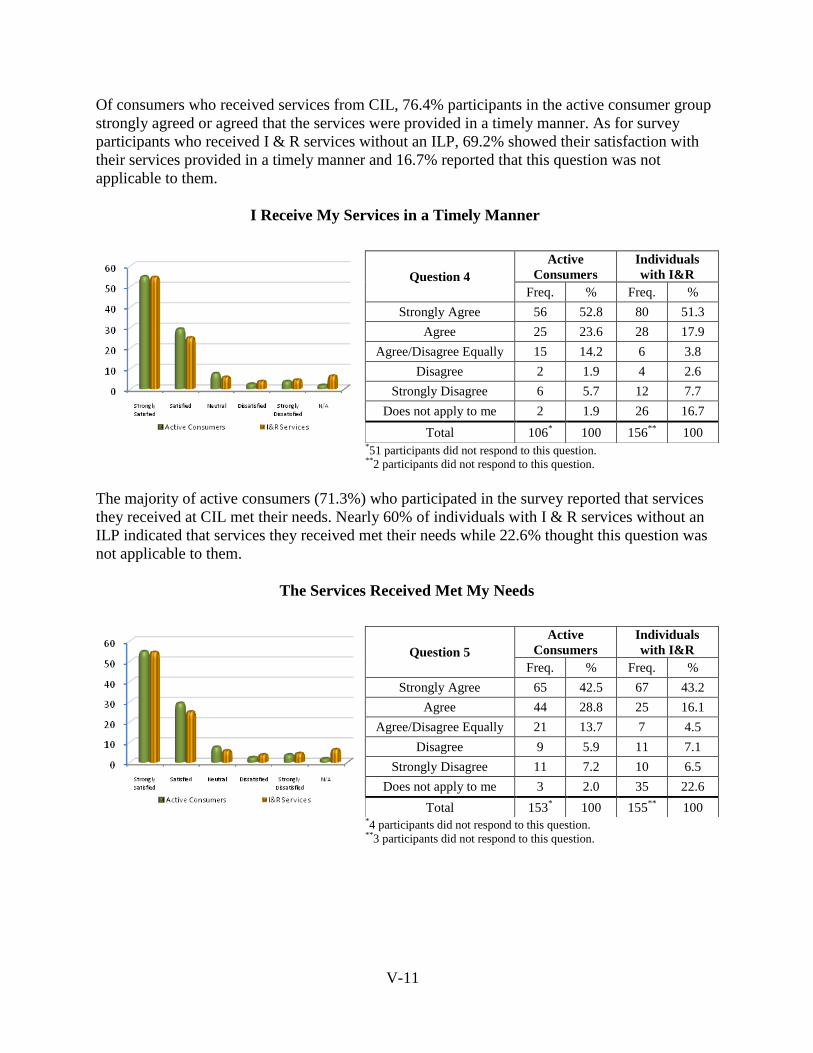
V-11
Of consumers who received services from CIL, 76.4% participants in the active consumer group
strongly agreed or agreed that the services were provided in a timely manner. As for survey
participants who received I & R services without an ILP, 69.2% showed their satisfaction with
their services provided in a timely manner and 16.7% reported that this question was not
applicable to them.
I Receive My Services in a Timely Manner
*51 participants did not respond to this question. **2 participants did not respond to this question.
The majority of active consumers (71.3%) who participated in the survey reported that services
they received at CIL met their needs. Nearly 60% of individuals with I & R services without an
ILP indicated that services they received met their needs while 22.6% thought this question was
not applicable to them.
The Services Received Met My Needs
*4 participants did not respond to this question. **3 participants did not respond to this question.
Question 4
Active
Consumers
Individuals
with I&R
Freq. % Freq. %
Strongly Agree 56 52.8 80 51.3
Agree 25 23.6 28 17.9
Agree/Disagree Equally 15 14.2 6 3.8
Disagree 2 1.9 4 2.6
Strongly Disagree 6 5.7 12 7.7
Does not apply to me 2 1.9 26 16.7
Total 106* 100 156
** 100
Question 5
Active
Consumers
Individuals
with I&R
Freq. % Freq. %
Strongly Agree 65 42.5 67 43.2
Agree 44 28.8 25 16.1
Agree/Disagree Equally 21 13.7 7 4.5
Disagree 9 5.9 11 7.1
Strongly Disagree 11 7.2 10 6.5
Does not apply to me 3 2.0 35 22.6
Total 153* 100 155
** 100
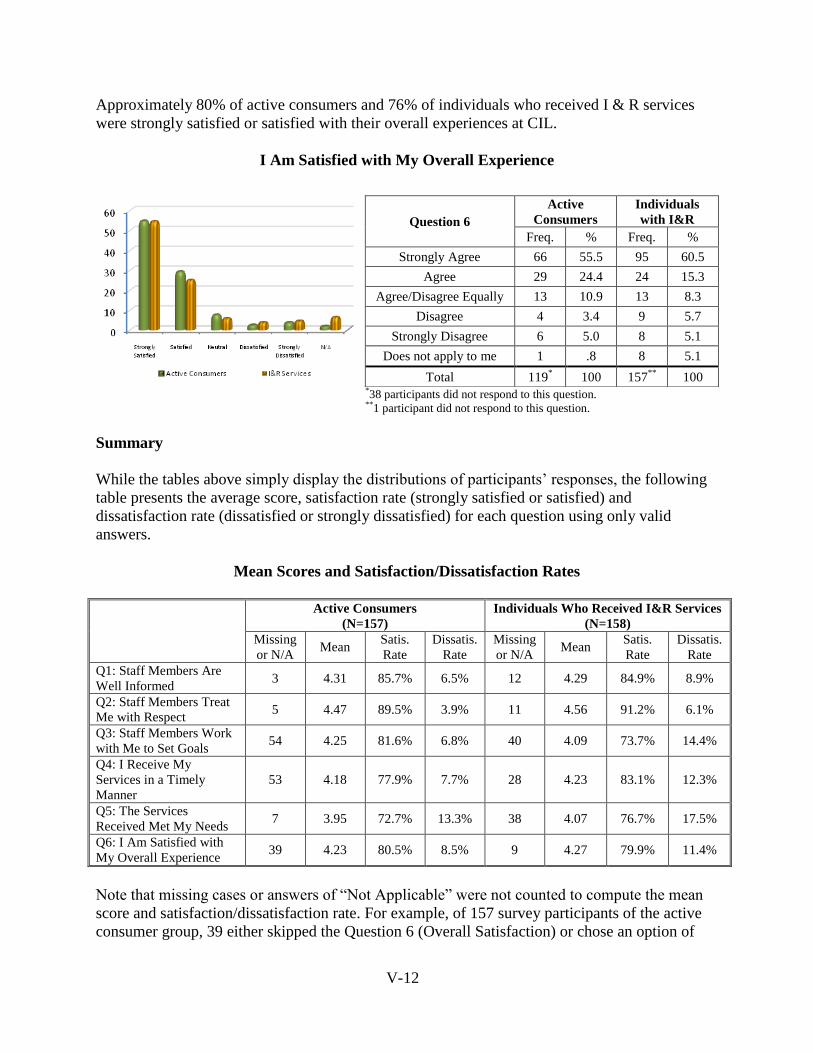
V-12
Approximately 80% of active consumers and 76% of individuals who received I & R services
were strongly satisfied or satisfied with their overall experiences at CIL.
I Am Satisfied with My Overall Experience
*38 participants did not respond to this question. **1 participant did not respond to this question.
Summary
While the tables above simply display the distributions of participants‟ responses, the following
table presents the average score, satisfaction rate (strongly satisfied or satisfied) and
dissatisfaction rate (dissatisfied or strongly dissatisfied) for each question using only valid
answers.
Mean Scores and Satisfaction/Dissatisfaction Rates
Active Consumers
(N=157)
Individuals Who Received I&R Services
(N=158)
Missing
or N/A Mean
Satis.
Rate
Dissatis.
Rate
Missing
or N/A Mean
Satis.
Rate
Dissatis.
Rate
Q1: Staff Members Are
Well Informed 3 4.31 85.7% 6.5% 12 4.29 84.9% 8.9%
Q2: Staff Members Treat
Me with Respect 5 4.47 89.5% 3.9% 11 4.56 91.2% 6.1%
Q3: Staff Members Work
with Me to Set Goals 54 4.25 81.6% 6.8% 40 4.09 73.7% 14.4%
Q4: I Receive My
Services in a Timely
Manner
53 4.18 77.9% 7.7% 28 4.23 83.1% 12.3%
Q5: The Services
Received Met My Needs 7 3.95 72.7% 13.3% 38 4.07 76.7% 17.5%
Q6: I Am Satisfied with
My Overall Experience 39 4.23 80.5% 8.5% 9 4.27 79.9% 11.4%
Note that missing cases or answers of “Not Applicable” were not counted to compute the mean
score and satisfaction/dissatisfaction rate. For example, of 157 survey participants of the active
consumer group, 39 either skipped the Question 6 (Overall Satisfaction) or chose an option of
Question 6
Active
Consumers
Individuals
with I&R
Freq. % Freq. %
Strongly Agree 66 55.5 95 60.5
Agree 29 24.4 24 15.3
Agree/Disagree Equally 13 10.9 13 8.3
Disagree 4 3.4 9 5.7
Strongly Disagree 6 5.0 8 5.1
Does not apply to me 1 .8 8 5.1
Total 119* 100 157
** 100
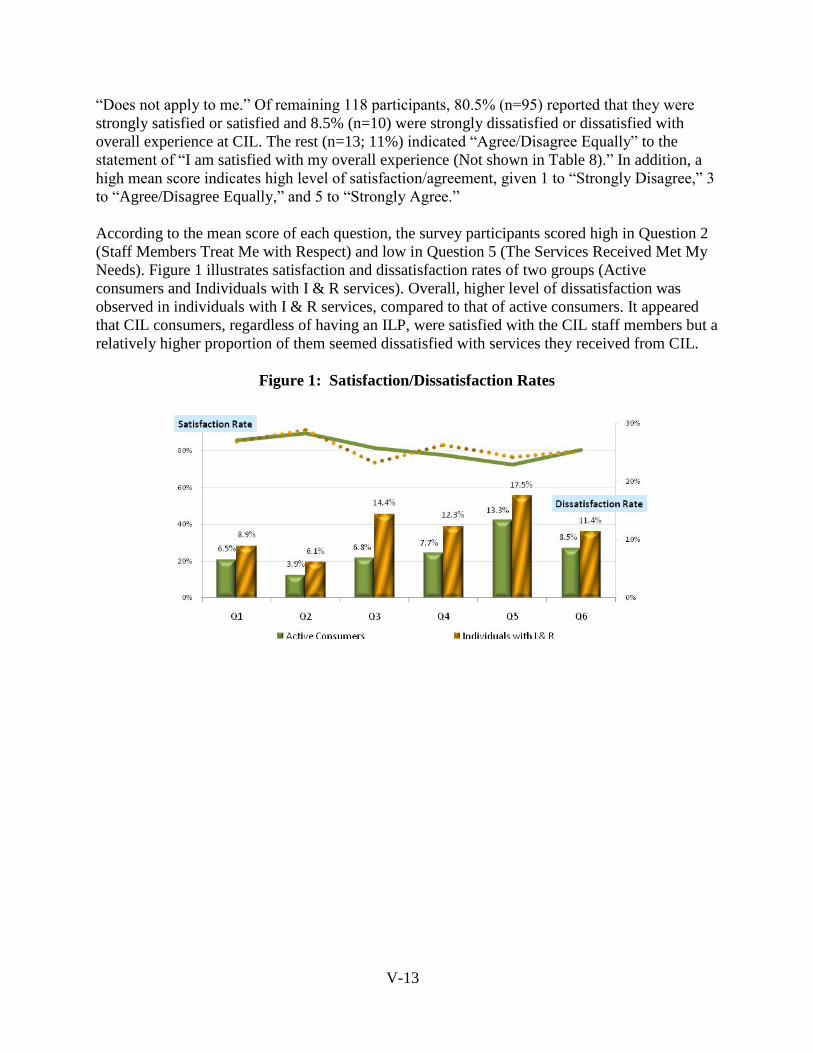
V-13
“Does not apply to me.” Of remaining 118 participants, 80.5% (n=95) reported that they were
strongly satisfied or satisfied and 8.5% (n=10) were strongly dissatisfied or dissatisfied with
overall experience at CIL. The rest (n=13; 11%) indicated “Agree/Disagree Equally” to the
statement of “I am satisfied with my overall experience (Not shown in Table 8).” In addition, a
high mean score indicates high level of satisfaction/agreement, given 1 to “Strongly Disagree,” 3
to “Agree/Disagree Equally,” and 5 to “Strongly Agree.”
According to the mean score of each question, the survey participants scored high in Question 2
(Staff Members Treat Me with Respect) and low in Question 5 (The Services Received Met My
Needs). Figure 1 illustrates satisfaction and dissatisfaction rates of two groups (Active
consumers and Individuals with I & R services). Overall, higher level of dissatisfaction was
observed in individuals with I & R services, compared to that of active consumers. It appeared
that CIL consumers, regardless of having an ILP, were satisfied with the CIL staff members but a
relatively higher proportion of them seemed dissatisfied with services they received from CIL.
Figure 1: Satisfaction/Dissatisfaction Rates
