michigan department of natural … michigan department of natural resources creel survey performance...
TRANSCRIPT

1
MICHIGAN DEPARTMENT OF NATURAL RESOURCES
CREEL SURVEY PERFORMANCE AND SUMMARY REPORT
LAC VIEUX DESERT
(Vilas County WI and Gogebic County MI)
2012 – 2013
Performance and Summary Report written by Tracy Kolb
Revised July 2014

2
INTRODUCTION
The U.S. Forest Service (USFS) and Michigan Department of Natural Resources (MDNR) are
obligatory partners as described in the “Lac Vieux Desert Wild Rice Enhancement Plan” with a
joint goal to restore wild rice on Lac Vieux Desert (LVD). As a requirement under the FERC
Order, a suite of monitoring goals is to be implemented including conducting a fish creel census
in 2012-2013. This data is a critical element to the FERC Order and mutually beneficial to U.S.
Forest Service and MDNR as well as the other partners.
Lac Vieux Desert is located four miles north of the town of Phelps in Vilas County, Wisconsin.
This lake is boundary water with the State of Michigan. Of the 4,300 total lake acres 1,520 are in
Michigan. It is also the headwater of the Wisconsin River. Water levels are regulated by a dam at
the outlet that is owned by the Wisconsin Valley Improvement Company.
GOAL
The goal of the project is to complete a creel census to determine the status of the fishery on Lac
Vieux Desert using estimates of harvest, catch and angler effort, during both the summer and
winter fishing seasons.
OBJECTIVES
A. Conduct creel census per MDNR protocol during designated dates.
B. Analyze collected data to determine harvest, catch, harvest rates, catch rates and angler
effort.
C. Develop a summary report of creel results.
U.S. FOREST SERVICE CONTRIBUTIONS
1. Provide a safely equipped boat with motor in which to conduct the open-water creel
survey.
2. Provide periodic oversight of the creel clerk and document presence on the lake.
3. Provide a snowmobile for conducting winter (frozen water) creel survey.
4. Provide a vehicle to travel to and from Lac Vieux Desert for the purpose of conducting
the survey.
5. Provide housing for the creel period.
6. Provide necessary safety training to operate vehicles such as watercraft and snowmobile.

3
MICHIGAN DNR CONTRIBUTIONS
1. Hire, train, and supervise a creel clerk as necessary to conduct the Lac Vieux Desert creel
survey.
2. Provide equipment necessary to conduct the creel survey other than vehicles as identified
above.
3. Invoice the USFS contact for expenditures as described in the Challenge Cost Share
Agreement.
4. Collect and analyze the creel census data, per standard MDNR/WDNR protocol.
5. Provide data to USFS upon completion of the creel census.

4
OBJECTIVE A - Conduct creel census per MDNR protocol during designated dates.
STATUS: COMPLETE
SURVEY PREPERATION
MDNR hired one clerk, Thomas Lima, to conduct the Lac Vieux Desert Creel Survey (Appendix
1). Prior to deployment, Lima was trained by MDNR creel personnel on proper protocol for
operating survey equipment, operating creel data-entry devices and conducting a creel survey.
The USFS provided Lima with housing, a vehicle, a boat and snowmobile. MDNR staff provided
Lima with survey gear, uniform components, schedules and a data-entry device. Tom used an
USFS fuel card to purchase gas for his vehicle, boat and sled and to purchase oil for the boat. All
invoicing of reimbursable expenses was done by MDNR staff and billed to the US Forest Service
monthly. In the case of boat, sled or vehicle break-down, US Forest Service provided field
support and replacement. In the case of lost or broken gear, MDNR provided support and
replacement. MDNR staff also provided all technical support (maintenance, upgrades, and
trouble shooting) for data-entry software.
Throughout the season, Lima was supervised by MDNR employee, Mark Mylchreest.
Mylchreest met with Lima at least once per month, in the field, to ensure Lima was performing
his job duties appropriately and to rectify any issues that arose with scheduling, equipment, etc.
If Lima was unable to report to work, Mylchreest scheduled another MDNR employee to fill the
shift so that no shifts were missed during the survey.
CONDUCTING THE SURVEY
The Lac Vieux Desert open-water creel survey ran from May 2 through October 31, 2012 and
the ice-fishing creel survey ran from December 1, 2012 through March 31, 2013.
The creel covered the entire lake which was subdivided into two sites (Figure 1). The survey
itself was a stratified design using three-stage sampling (i.e. the stages are days, shifts and count
times) within strata. Strata included site fished by month (Site 1 or Site 2), by day-type
(weekday-weekend/holiday), and by mode (method) of fishing. The mode sampled during the
open-water season was boat and the modes sampled during the ice fishery were open-ice and
shanty.
Both weekend days and three randomly selected weekdays were sampled each week (Appendix
2). The entire angling day from dawn to dusk was covered each month surveyed. This was
accomplished by breaking each day into two 8-hour work shifts, then randomly selecting one
shift to be worked. Monthly shift start and end times could vary due to varying length of daylight
among months, but generally the first shift began at daylight and ended in the afternoon; the

5
second shift began in mid-morning and ended at sunset. As daylight hours decreased in winter, it
was no longer necessary to have two shifts to cover all the daylight hours, so the clerk was
scheduled for only one shift, and as daylight increased again in the spring, the clerk transitioned
back to two shifts.
Figure 1: Map of Lac Vieux Desert – note the lake was subdivided into Site 1 and Site 2, to
obtain adequate daily creel coverage.
The clerk was instructed to interview all anglers or angling parties he encountered. An angler
party was defined as one or more anglers who fished together. The number of interviews varied
as a product of the amount of fishing effort taking place during each shift and site during the
season.
Date, time, location (site numbers where both the fishing and the interview took place), and
mode were recorded for all interviews. Anglers were queried as to how long they fished, what
species were targeted, the numbers (by species) of fish they caught and numbers kept, and the
number of fishing trips they made or intended to make that day. Additional data were collected
for one member of each party such as age and gender, zip code or county of residence, and the
types of angling method used (casting, still fishing, trolling, etc.). Fishing effort was determined
through counts of boats (open-ice anglers or shanties) made by the clerk as he navigated around
the lake at specified count times. Two counts were scheduled per day.
Site 1
Site 2

6
Lima also collected lengths from walleye, northern pike, yellow perch, bluegill, black crappie
and musky.
All data were recorded using a portable electronic device (PDA). In total, Tom sampled 125
days during the open-water season and 64 days during the winter season. Tom took a total of
1,158 interviews during the open-water season and 389 interviews during the winter season.

7
OBJECTIVE B - Analyze collected data to estimate catch, harvest, catch rates, harvest rates and
angler effort.
STATUS: COMPLETE
Data collected by Lima were sent monthly to MDNR personnel for review, error-checking and
analysis. Estimates were made for each site by month for all fish species observed in the harvest
and reported as released. Effort estimates were also made for each site by month. Two measures
of fishing effort were calculated: angler hours and angler trips. An angler trip was one completed
fishing excursion. Standard mathematical formulas for creel survey (Lockwood et al. 1997; Su
and Clapp 2013) were used to calculate all estimates. Uncertainty estimates for all catch and
effort estimates in this report are defined as two standard errors of their mean (2 times the square
root of the variance divided by the sample size for an estimate).

8
OBJECTIVE C - Develop summary report of creel results.
STATUS: COMPLETE
The following table and summary reports the results of the open-water creel survey. Two
standard errors are given in parentheses.
Species C/H May June July August Sept October Season HARVEST
Walleye 0.0036 369 87 0 0 29 0 485
(0.0020) (228) (121) (0) (0) (59) (0) (265)
Northern pike 0.0317 2,920 538 394 287 158 10 4,307
(0.0113) (1,379) (261) (249) (214) (136) (21) (1,447)
Largemouth bass 0.0021 0 38 53 99 82 9 282
(0.0016) (0) (45) (50) (155) (139) (19) (220)
Smallmouth bass 0.0001 0 0 0 14 0 0 14
(0.0002) (0) (0) (0) (29) (0) (0) (29)
Yellow Perch 0.1758 11,774 3,700 2,867 3,046 2,380 135 23,902
(0.0477) (4,557) (1,473) (1,524) (2,313) (1,618) (200) (5,768)
Bluegill 0.2555 11,136 10,088 6,492 5,765 1,254 0 34,736
(0.0642) (4,881) (4,045) (2,499) (3,151) (1,108) (0) (7,588)
Pumpkinseed 0.0602 1,610 2,846 1,147 1,918 657 0 8,178
(0.0246) (1,169) (2,571) (618) (1,204) (585) (0) (3,186)
Rock bass 0.0112 807 438 85 79 113 0 1,523
(0.0057) (602) (399) (67) (84) (179) (0) (752)
Black crappie 0.2253 24,913 3,184 745 979 580 227 30,627
(0.0770) (9,552) (1,631) (455) (805) (450) (464) (9,756)
TOTAL HARVEST 0.7654 53,529 20,920 11,783 12,187 5,254 381 104,054
(0.1405) (11,811) (5,296) (3,037) (4,178) (2,112) (506) (14,105)
RELEASED
Walleye 0.0018 141 57 0 14 14 21 246
(0.0014) (159) (70) (0) (29) (27) (43) (183)
Northern pike 0.2178 18,283 5,691 2,229 2,097 1,170 141 29,612
(0.0573) (6,328) (2,297) (851) (942) (588) (115) (6,877)
Largemouth bass 0.0281 1,269 882 402 934 314 18 3,818
(0.0108) (1,151) (520) (231) (494) (215) (22) (1,393)
Smallmouth bass 0.0072 19 60 184 344 376 0 983
(0.0049) (38) (66) (144) (463) (428) (0) (651)
Yellow Perch 0.6473 27,037 19,955 15,512 19,107 6,121 266 87,997
(0.1416) (9,562) (7,758) (5,151) (8,056) (2,951) (275) (15,869)
Bluegill 0.6750 21,761 23,228 18,691 23,131 4,895 55 91,761
(0.1656) (12,631) (8,143) (7,754) (9,045) (3,182) (95) (19,440)
Pumpkinseed 0.2041 3,176 8,327 6,058 8,190 1,992 5 27,748
(0.0534) (1,983) (3,957) (2,581) (3,560) (1,442) (9) (6,404)
Rock bass 0.0662 4,658 2,406 1,058 541 331 0 8,993
(0.0233) (2,289) (1,661) (747) (289) (379) (0) (2,964)
Black crappie 0.1074 6,242 1,492 1,864 2,973 1,817 218 14,604
(0.0374) (2,816) (882) (1,363) (2,490) (2,370) (446) (4,752)
Muskellunge 0.0087 277 194 149 315 125 120 1,181
(0.0034) (335) (165) (104) (175) (78) (86) (441)
TOTAL RELEASED 1.9636 82,862 62,292 46,147 57,646 17,153 843 266,944
(0.3158) (17,595) (12,299) (9,826) (12,924) (5,221) (553) (27,422)
TOTAL CATCH 2.7290 136,391 83,212 57,930 69,833 22,407 1,224 370,998
(0.4068) (21,192) (13,390) (10,284) (13,583) (5,632) (750) (30,837)
ANGLER HOURS 43,893 31,063 23,343 19,955 11,998 5,695 135,947
(12,459) (8,115) (4,576) (3,877) (4,417) (2,549) (16,825)
ANGLER TRIPS 9,916 8,234 7,132 5,943 3,475 1,380 36,080
(2,891) (2,323) (1,492) (1,275) (1,277) (653) (4,434)

9
The following table and summary reports the results of the winter creel survey. Two standard
errors are given in parentheses. NAN indicates not enough data to make an estimate.
Species C/H Dec. January February March Season HARVEST
Walleye 0.0039 5 109 68 0 181
(0.0031) (10) (124) (63) (0) (139)
Northern pike 0.1312 1,002 2,445 2,514 85 6,046
(0.0357) (714) (1,097) NAN (147) (1,317)
Largemouth bass 0.0002 8 0 0 0 8
(0.0003) (16) (0) (0) (0) (16)
Yellow Perch 0.0908 258 1,197 944 1,787 4,185
(0.0474) (252) (704) (1,103) (1,592) (2,076)
Bluegill 0.9609 2,844 17,091 11,885 12,452 44,272
(0.3418) (2,588) (10,853) (5,915) (6,016) (13,988)
Pumpkinseed 0.0155 15 330 82 288 716
(0.0088) (25) (317) (96) (200) (388)
Black crappie 0.1610 42 2,707 2,273 2,397 7,419
(0.0660) (50) (1,844) (1,387) (1,567) (2,790)
TOTAL HARVEST 1.3637 4,174 23,879 17,765 17,009 62,827
(0.3611) (2,697) (11,091) NAN (6,422) (13,097)
RELEASED
Walleye 0.0012 4 51 0 0 55
(0.0017) (8) (79) (0) (0) (79)
Northern pike 0.2173 1,346 5,972 2,411 281 10,010
(0.0844) (1,028) (3,030) (1,490) NAN (3,530)
Largemouth bass 0.0053 23 65 23 134 245
(0.0032) (25) (70) (36) (117) (143)
Yellow Perch 0.3721 1,251 5,740 3,102 7,050 17,142
(0.1040) (1,500) (3,586) NAN NAN (3,887)
Bluegill 1.3816 2,183 18,830 15,986 26,654 63,654
(0.4018) (2,138) (12,263) (8,927) NAN (15,318)
Pumpkinseed 0.0084 25 31 26 306 388
(0.0113) (46) (41) (62) (509) (517)
Rock bass 0.0006 0 0 0 29 29
(0.0008) (0) (0) (0) (36) (36)
Black crappie 0.2237 54 1,605 4,066 4,580 10,305
(0.0961) (100) (1,632) (2,948) (2,329) (4,097)
Muskellunge 0.0007 0 25 8 0 32
(0.0008) (0) (33) (16) (0) (36)
TOTAL RELEASED 2.2109 4,885 32,320 25,622 39,035 101,861
(0.4653) (2,809) (13,232) NAN NAN (13,527)
TOTAL CATCH 3.5746 9,059 56,199 43,387 56,044 164,689
(0.7125) (3,894) (17,266) NAN NAN (18,828)
ANGLER HOURS 4,077 16,716 17,211 8,068 46,072
(2,569) (7,071) NAN NAN (7,523)
ANGLER TRIPS 992 3,435 3,524 1,999 9,951
(641) (1,370) NAN NAN (1,513)
10
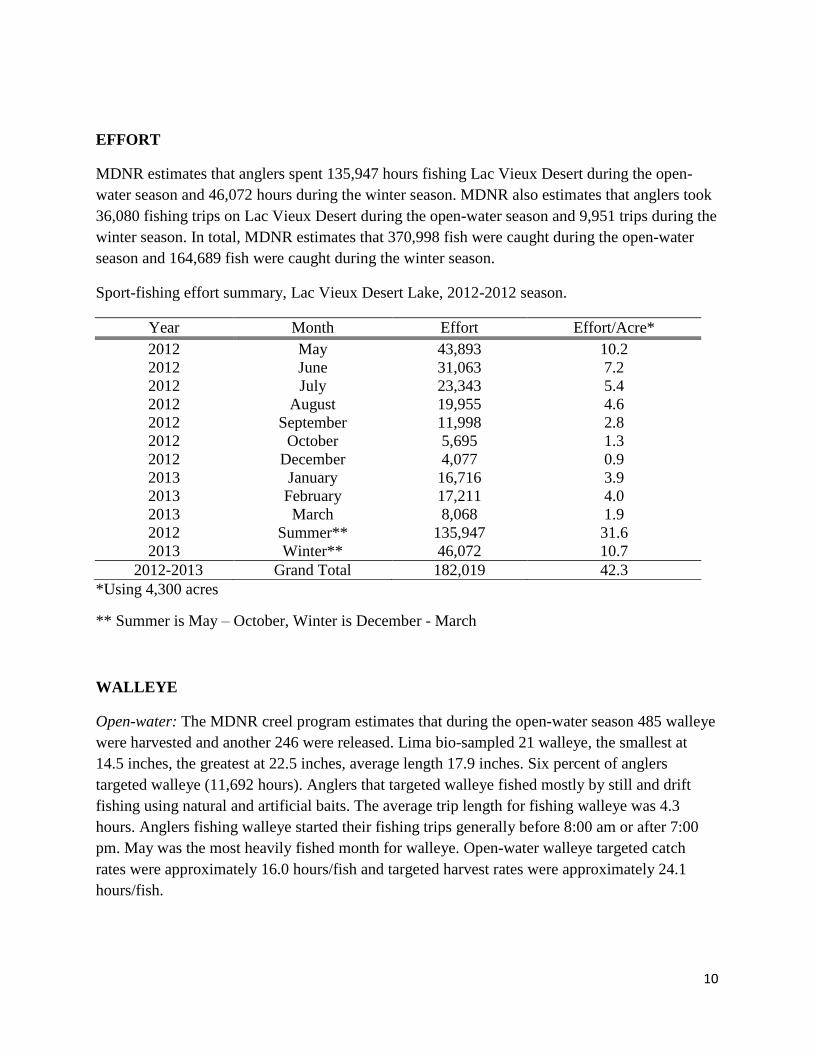
EFFORT
MDNR estimates that anglers spent 135,947 hours fishing Lac Vieux Desert during the open-
water season and 46,072 hours during the winter season. MDNR also estimates that anglers took
36,080 fishing trips on Lac Vieux Desert during the open-water season and 9,951 trips during the
winter season. In total, MDNR estimates that 370,998 fish were caught during the open-water
season and 164,689 fish were caught during the winter season.
Sport-fishing effort summary, Lac Vieux Desert Lake, 2012-2012 season.
Year Month Effort Effort/Acre*
2012 May 43,893 10.2
2012 June 31,063 7.2
2012 July 23,343 5.4
2012 August 19,955 4.6
2012 September 11,998 2.8
2012 October 5,695 1.3
2012 December 4,077 0.9
2013 January 16,716 3.9
2013 February 17,211 4.0
2013 March 8,068 1.9
2012 Summer** 135,947 31.6
2013 Winter** 46,072 10.7
2012-2013 Grand Total 182,019 42.3
*Using 4,300 acres
** Summer is May – October, Winter is December - March
WALLEYE
Open-water: The MDNR creel program estimates that during the open-water season 485 walleye
were harvested and another 246 were released. Lima bio-sampled 21 walleye, the smallest at
14.5 inches, the greatest at 22.5 inches, average length 17.9 inches. Six percent of anglers
targeted walleye (11,692 hours). Anglers that targeted walleye fished mostly by still and drift
fishing using natural and artificial baits. The average trip length for fishing walleye was 4.3
hours. Anglers fishing walleye started their fishing trips generally before 8:00 am or after 7:00
pm. May was the most heavily fished month for walleye. Open-water walleye targeted catch
rates were approximately 16.0 hours/fish and targeted harvest rates were approximately 24.1
hours/fish.

11
Open-water season walleye length frequency (y-axis) plotted against length (x-axis, in inches).
Winter: The MDNR creel program estimates that during the winter season 181 walleye were
harvested and another 55 were released. Lima bio-sampled 13 walleye, the smallest at 17.2
inches, the greatest at 26 inches, average length 22 inches. Two percent of anglers targeted
walleye (853 hours). Anglers that targeted walleye fished mostly by still fishing or jigging using
natural baits. The average trip length for fishing walleye was 4.3 hours. Anglers fishing walleye
started their fishing trips generally before 12 pm. January was the most heavily fished winter
month for walleye. Winter walleye targeted catch rates were approximately 3.6 hours/fish and
walleye targeted harvest rates were approximately 4.7 hours/fish.
Winter season walleye length frequency (y-axis) plotted against length (x-axis, in inches).
0
0.5
1
1.5
2
2.5
3
3.5
14.5 15.1 15.2 15.8 16 16.2 17 17.1 17.2 17.7 18.5 18.8 19 20.8 21 21.5 22.3 22.5
0
0.2
0.4
0.6
0.8
1
1.2
17.2 18.3 19.6 19.9 21.1 22.3 22.5 23 23.1 24 24.3 25 26

12
NORTHERN PIKE
Open-water: The MDNR creel program estimates that 4,307 northern pike were harvested during
the open-water season and another 29,612 were released. Lima sampled 145 northern pike, the
smallest at 13.5 inches and the greatest at 34 inches, average length 22.3 inches. Eight percent of
anglers targeted northern pike (15,412 hours). Anglers that targeted northern pike fished mostly
by still fishing and casting using artificial baits. The average trip length for fishing northern pike
was 3.3 hours. Anglers fishing northern pike started their fishing trips generally between 5:00
and 9:00 am. May and June were the most heavily fished months for northern pike. Northern
pike targeted catch rates were approximately 0.6 of an hour/fish and targeted harvest rates were
approximately 3.6 hours/fish.
Open-water season northern pike length frequency (y-axis) plotted against length (x-axis, in
inches).
Winter – The MDNR creel program estimates that 6,046 northern pike were harvested during the
winter season and another 10,010 were released. Lima sampled 131 northern pike, the smallest at
12.9 inches and the greatest at 30.1 inches, average length 21.5 inches. Eight percent of anglers
targeted northern pike (6,511 hours). Anglers that targeted northern pike fished mostly by still
fishing using natural baits. The average trip length for fishing northern pike was 4.6 hours.
Anglers fishing northern pike started their fishing trips generally before 12pm and January was
the most heavily fished month for northern pike. Winter Northern pike targeted catch rates were
approximately 0.4 of an hour/fish, and targeted harvest rates were approximately 1 hour/fish.
0
1
2
3
4
5
6
7
8
13
.5
16
.1 18
18
.6
19
.1
19
.5 20
20
.3
20
.8
21
.3
21
.8
22
.1
22
.4
22
.7
23
.1
23
.4
23
.9
24
.2
24
.5
24
.8
25
.3
26
.9
27
.3 30
34

13
Winter season northern pike length frequency (y-axis) plotted against length (x-axis, in inches).
BASS
Open-water: The MDNR creel program estimates that during the open-water season 296 bass
(smallmouth and largemouth) were harvested and another 4,801 were released. Lima sampled 25
bass, the smallest at 9.1 inches and the greatest at 21.1 inches, average length 15.7 inches). Less
than one percent of anglers targeted bass (1,270 hours). Anglers that targeted bass fished mostly
by casting using artificial baits. The average trip length for fishing bass was 3 hours. Anglers
fishing bass started their fishing trips evenly throughout the day. Anglers fished for bass in all
months. Bass targeted catch rates were approximately 0.2 of an hour/fish and targeted harvest
rates were approximately 4.3 hours/fish.
Open-water season bass length frequency (y-axis) plotted against length (x-axis, in inches).
0
0.5
1
1.5
2
2.5
3
3.5
4
4.51
2.9
14
.6
15
.7
16
.5
17
.1
17
.9
18
.2
18
.9
19
.4
19
.8
20
.1
20
.4
20
.8
21
.1
21
.4
21
.8
22
.1
22
.5
22
.8
23
.1
24
.1
24
.4
24
.8
25
.8
26
.3
26
.7
28
.1
28
.7
30
.1
0
0.5
1
1.5
2
2.5
9.1 10.614.414.615.215.515.715.815.916.116.316.416.516.617.117.317.517.918.218.7 20 21.1

14
Winter – The MDNR creel program estimates that during the winter season 8 bass (largemouth
only) were harvested and another 245 were released. Lima sampled 2 bass, (at 16.2 inches and
16.4 inches). No anglers indicated to the clerk that they targeted bass only.
BLUEGILL
Open-water: The MDNR creel program estimates that 34,736 bluegill were harvested during the
open-water season and another 91,761 were released. Lima sampled 196 bluegill, the smallest at
5.7 inches and the greatest at 11 inches, average length 7 inches. Thirty-nine percent of anglers
targeted panfish. Anglers that targeted panfish fished mostly by still fishing or casting using
natural baits. The average trip length for fishing panfish was under 3 hours. Anglers fishing
panfish started their fishing trips all throughout the day. Anglers fished for panfish in all months.
Open-water season bluegill length frequency (y-axis) plotted against length (x-axis, in inches).
Winter – The MDNR creel program estimates that 44,272 bluegill were harvested during the
winter season and another 63,654 were released. Lima sampled 56 harvested bluegill, the
smallest at 6.2 inches and the greatest at 9.1 inches, average length 7.3 inches. Thirty-two
percent of anglers targeted panfish. Anglers that targeted panfish fished mostly by jigging fishing
using natural baits. The average trip length for fishing panfish was 3.5 hours. Anglers fishing
panfish started generally fished between 10am and 12pm. Anglers fished for most frequently in
March.
0
5
10
15
20
5.7 6 6.1 6.2 6.3 6.4 6.5 6.6 6.7 6.8 6.9 7 7.1 7.2 7.3 7.4 7.5 7.6 7.7 7.8 7.9 8 8.1 8.2 8.3 9.6 11

15
Winter season bluegill length frequency (y-axis) plotted against length (x-axis, in inches).
BLACK CRAPPIE
Open-water: The MDNR creel program estimates that 30,627 black crappie were harvested
during the open-water season and another 14,604 were released. Lima sampled 130 harvested
black crappie, the smallest at 6.2 inches and the greatest at 12.6 inches, average length 9.7
inches. Thirty-nine percent of anglers targeted panfish. Anglers that targeted panfish fished
mostly by still fishing or casting using natural baits. The average trip length for fishing panfish
was under 3 hours. Anglers fishing panfish started their fishing trips all throughout the day.
Anglers fished for panfish in all months.
Open-water season black crappie length frequency (y-axis) plotted against length (x-axis, in
inches).
Winter – The MDNR creel program estimates that 7,419 black crappie were harvested during the
winter season and another 10,305 were released. Lima sampled 53 harvested black crappie, the
smallest at 6 inches and the greatest at 12.5 inches, average length 9.8 inches. Two percent of
0
1
2
3
4
5
6
7
8
6.2 6.3 6.4 6.5 6.6 6.7 6.8 6.9 7 7.1 7.2 7.3 7.4 7.5 7.6 7.7 7.8 7.9 8 8.1 8.2 8.3 8.8 9.1
0
2
4
6
8
10
12
6.2
7.8
8.2
8.5
8.7
8.9
9.1
9.3
9.5
9.7
9.9
10
.1
10
.3
10
.5
10
.7
10
.9
11
.1
11
.4
11
.9
12
.6

16
anglers targeted black crappie. Anglers that targeted black crappie fished mostly by jigging using
natural baits. The average trip length for fishing black crappie was 4.7 hours. Anglers fishing
black crappie started their fishing trips all at 10am. Anglers fished for black crappie most heavily
in March.
Winter season black crappie length frequency (y-axis) plotted against length (x-axis, in inches)
ROCK BASS
Open-water: The MDNR creel program estimates that 1,523 rock bass were harvested during the
open-water season and another 8,993 were released. Lima did not bio-sample rock bass. Thirty-
nine percent of anglers targeted panfish. Anglers that targeted panfish fished mostly by still
fishing or casting using natural baits. The average trip length for fishing panfish was under 3
hours. Anglers fishing panfish started their fishing trips all throughout the day. Anglers fished for
panfish in all months.
Winter - The MDNR creel program did not encounter a harvested rock bass so we estimate that
no rock bass were harvested during the winter season but that 29 were caught and released.
There were no biosamples of rock bass taken during the winter season. Thirty-two percent of
anglers targeted panfish. Anglers that targeted panfish fished mostly by jigging fishing using
natural baits. The average trip length for fishing panfish was 3.5 hours. Anglers fishing panfish
started generally fished between 10am and 12pm. Anglers fished for most frequently in March.
0
1
2
3
4
5
6
7
8
6
6.7
7.1
7.8
8.2
8.4
8.7
8.8
8.9 9
9.1
9.2
9.3
9.4
9.5
9.6
9.7
9.8
9.9 10
10
.1
10
.2
10
.3
10
.4
10
.5
10
.6
10
.8
10
.9
11
.3
11
.7
11
.8
11
.9
12
.5

17
PUMPKINSEED
Open-water: The MDNR creel program estimates that 8,178 pumpkinseed were harvested during
the open-water season and another 27,748 were released. Lima did not bio-sample pumpkinseed.
Thirty-nine percent of anglers targeted panfish. Anglers that targeted panfish fished mostly by
still fishing or casting using natural baits. The average trip length for fishing panfish was under 3
hours. Anglers fishing panfish started their fishing trips all throughout the day. Anglers fished for
panfish in all months.
Winter – The MDNR creel program estimates that 716 pumpkinseed were harvested during the
winter season and another 388 were released. Lima did not bio-sample pumpkinseed. Thirty-two
percent of anglers targeted panfish. Anglers that targeted panfish fished mostly by jigging fishing
using natural baits. The average trip length for fishing panfish was 3.5 hours. Anglers fishing
panfish started generally fished between 10am and 12pm. Anglers fished for most frequently in
March.
YELLOW PERCH
Open-water: The MDNR creel program estimates that 23,902 yellow perch were harvested
during the open-water season and another 87,997 were released. Lima sampled 228 harvested
yellow perch, the smallest at 5.4 inches and the greatest at 13 inches, average length 8.3 inches.
Six percent of anglers targeted yellow perch (9,330 hours). Anglers that targeted yellow perch
fished mostly by still fishing using natural baits. The average trip length for fishing yellow perch
was 3.5 hours. Anglers fishing yellow perch started their fishing trips all throughout the day.
Anglers fished for yellow perch most heavily in May. Anglers fished for bass in all months.
Yellow perch targeted catch rates were less than 0.1 of an hour/fish and targeted harvest rates
were approximately 0.4 hours/fish.
Open-water season yellow perch length frequency (y-axis) plotted against length (x-axis, in
inches).
0
2
4
6
8
10
12
14
5.4 6
6.3
6.5
6.8 7
7.2
7.4
7.6
7.8 8
8.2
8.4
8.6
8.8 9
9.2
9.4
9.6
9.8
10
.1
10
.3
10
.8 11
11
.2
11
.4
11
.9
12
.5

18
Winter – The MDNR creel program estimates that 4,185 yellow perch were harvested during the
winter season and another 17,142 were released. Lima sampled 27 harvested yellow perch, the
smallest at 5.5 inches and the greatest at 12 inches, average length 9.1 inches. Less than 1
percent of anglers targeted yellow perch (779 hours). Anglers that targeted yellow perch fished
mostly by jigging, using natural and artificial baits. The average trip length for fishing yellow
perch was 4 hours. Anglers fishing yellow perch generally started their fishing trips by 9am.
Anglers fished for yellow perch in all winter months. Winter yellow perch targeted catch rates
were less than 0.1 of an hour/fish and targeted harvest rates were approximately 0.2 hours/fish.
Winter season yellow perch length frequency (y-axis) plotted against length (x-axis, in inches).
MUSKY
Open-water: The MDNR creel program did not encounter a harvested musky so we estimate that
no musky were harvested during the open-water season, but that 1,181 were caught and released.
Lima sampled 53 released musky, the smallest at 22 inches and the greatest at 46 inches, average
length 35.3 inches. Thirty-one percent of anglers targeted musky. Anglers that targeted musky
fished mostly by drift fishing using artificial baits. The average trip length for fishing musky was
4.5 hours. Anglers fishing musky generally started their fishing trips before 8:00 am or after 7:00
pm. Anglers fished for musky in all months.
0
0.5
1
1.5
2
2.5
5.5 5.6 5.7 5.9 7.4 7.6 7.9 8.5 8.6 8.7 8.8 8.9 9 9.1 9.5 9.6 9.8 10 10.310.4 11 11.111.7 12

19
Open-water season musky length frequency (y-axis) plotted against length (x-axis, in inches).
Winter – The MDNR creel program did not encounter a harvested musky so we estimate that no
musky were harvested during the winter season but that 32 were caught and released. Lima
sampled 2 released muskies (30 and 31 inches). Five percent of anglers targeted musky. Anglers
that targeted musky fished mostly by spear fishing. The average trip length for fishing musky
was 7 hours. Anglers fishing musky generally started their fishing trips before 9am. Anglers
fished for musky most heavily in January.
ANGLER DEMOGRAPHY
Open-water: Ninety-four percent of anglers fishing Lac Vieux Desert were male. Seven percent
of anglers were under 21 years of age, 17% of anglers were between the ages of 22-39, 37% of
anglers were between the ages of 50-55 and 38% of anglers were over 55. Fifty-six percent of
anglers were residents of Wisconsin, 29% of anglers were residents of Illinois, 4% of anglers
were residents of Michigan and 2% each of anglers were residents of Indiana and Minnesota.
Anglers who were residents of other states hailed from Arizona, California, Colorado, Florida,
Georgia, Iowa, North Carolina, Ohio, Oregon and West Virginia.
Winter – Ninety-seven percent of anglers fishing Lac Vieux Desert in winter were male. Six
percent of anglers were under 21 years of age, 22% of anglers were between the ages of 22-39,
35% of anglers were between the ages of 50-55 and 37% of anglers were over 55. Seventy-six
percent of anglers were residents of Wisconsin, 2% of anglers were residents of Illinois, 18%
percent of anglers were residents of Michigan and 3% of anglers were residents of Indiana. We
did not collect zip codes from other states.
0
1
2
3
4
5
6
7
8
92
2.0
24
.5
25
.0
27
.0
29
.0
30
.0
31
.0
32
.0
33
.0
34
.0
34
.5
35
.0
36
.0
37
.0
38
.0
38
.5
39
.0
39
.5
39
.7
40
.0
40
.5
41
.2
42
.5
43
.0
43
.5
44
.0
46
.0

20
BAG LIMITS
In Michigan, the daily/possession limit for walleye, Northern pike, smallmouth bass, largemouth
bass, & flathead catfish is 5 total fish in any combination, but no more than 2 Northern pike. In
Wisconsin, the daily/possession limit is 2 walleye and 5 Northern pike.
In Michigan, the daily/possession limit for yellow perch, bluegill, pumpkinseed, black crappie,
and rock bass is 25 total in any combination. In Wisconsin, the daily/possession limit for yellow
perch, bluegill, pumpkinseed, and black crappie is 25 total in any combination and for rock bass
there is no daily/possession limit.
Open-water season percent of anglers reaching a range of daily/possession limits.
Species
Limit Walleye
Northern
Pike Mixed Panfish
2 0.4% 2.9% NA
3 0.0% 0.4% NA
4 0.0% 0.3% NA
5 0.0% 0.6% NA
25 NA NA 0.3%
Winter season percent of anglers reaching a range of daily/possession limits.
Species
Limit Walleye
Northern
Pike Mixed Panfish
2 0.0% 18.6% NA
3 0.0% 5.1% NA
4 0.0% 2.6% NA
5 0.0% 3.2% NA
25 NA NA 2.3%
Works Cited
Lockwood. R. 1997. Evaluation of Catch Rate Estimators from Michigan Access Point Angler
Surveys. North American Journal of Fisheries Management. 17:611-620.

21
Su, Z. and D. Clapp. 2013. Evaluation of Sample Design and Estimation Methods for Great
Lakes Angler Surveys. Transactions of the American Fisheries Society. 142(1)234-246.

22
APPENDIX 1 – Lac Vieux Desert Creel Clerk Announcement
Michigan Department of Natural Resources Seasonal Fisheries Position
Position: Non-career (Limited-term) Creel Clerk (Fisheries) located at Lac Vieux Desert,
Wage: $5,000 stipend and free housing (US Forestry Service cabin) on Lac Vieux Desert.
Duration: May – October 2012, if interested, also Dec – March (2012, 2013).
Duties: Conduct interviews of anglers fishing at Lac Vieux Desert. Make counts of boats or
anglers engaged in fishing according to random sampling work schedules. Identify anglers’
catch as to species of fish, and collect such pertinent biological information from fish that may
be required from time to time, such as, lengths, weights, fin clip, sex, state of maturity, and scale
samples. The objective of these duties is to enable the Michigan Fisheries Division to estimate
sport fishing catch and effort at Lac Vieux Desert.
Qualifications: Applicants should be self-starting, highly-motivated individuals interested in
performing fisheries-related fieldwork. Preference will be given to applicants with knowledge of
computers and experience operating boats. Work experience and other skills are also considered.
Civil Service rules require all employees to submit to and pass a pre-employment drug test and
criminal history check.
Housing: Housing will be available at Lac Vieux Desert and provided by the US Forest Service.
Closing date: Feb 15th
, 2012, we will conduct interviews late February/early March.
Application: Email cover letter, resume, and contact information for three references to Tracy
Kolb ([email protected]) 517-241-3623.

23
APPENDIX 2: LAC VIEUX DESERT DETAILED SAMPLING INFORMATION
Table 1: Summary of months and shifts
Month Shift A Shift B Number of daylight hours covered
May 6am - 1:45pm 1:45pm – 9:30pm 15.5
June 6am - 2pm 2:00pm – 10pm 16
July 6am - 2pm 2:00pm – 10pm 16
August 6am - 1:45pm 1:45pm – 9:30pm 15.5
September 7am -1:45pm 1:45pm – 8:30pm 13.3
October1 7am - 4pm 10:30am – 7pm 12
December2 7:30am – 5:30pm None 10
January2 7:30am – 5:30pm None 10
February3 7:00am – 5:00pm 8:30pm – 6:30pm 11.5
March 7:00am – 5:00pm 8:30pm – 6:30pm 11.5
1 Starting in October, due to decreased daylight, the clerk transitions from working five 8-hour days a week to four 10-hour days per
week.
2 Starting in December, due to decreased daylight, the clerk worked one shift rather than two shifts.
3 Starting in February, due to increased daylight, the clerk worked two shifts rather than one shift.

24
Table 2: MAY (Shift A: 6:00 AM~1:45 PM and Shift B: 1:45 PM~9:30 PM, times listed correspond to count times)
1 2
Shift: A
Site 2
(7:50 AM,
1:36 PM)
3 4
Shift: B
Site 1
(7:35 PM, 8:21
PM)
5
Shift: A
Site 2
(7:41 AM,
1:13 PM)
6
Shift: B
Site 1
(3:33 PM, 5:28
PM)
7 8 9
Shift: B
Site 2
(3:03 PM, 5:38
PM)
10
Shift: A
Site 1
(6:55 AM,
8:12 AM)
11
Shift: A
Site 1
(8:12 AM,
12:14 PM)
12
Shift: B
Site 1
(2:56 PM, 3:32
PM)
13
Shift: A
Site 2
(9:07 AM,
9:40 AM)
14
Shift: A
Site 2
(7:22 AM,
11:35 AM)
15 16 17
Shift: B
Site 1
(4:56 PM, 7:06
PM)
18
Shift: A
Site 2
(9:32 AM,
9:44 AM)
19
Shift: B
Site 1
(8:46 PM, 8:53
PM)
20
Shift: A
Site 2
(10:44 AM,
12:14 PM)
21 22
Shift: A
Site 1
(7:23 AM,
10:24 AM)
23
Shift: B
Site 2
(3:15 PM, 3:16
PM)
24
Shift: A
Site 2
(7:39 AM,
1:38 PM)
25 26
Shift: A
Site 2
(10:08 AM,
1:17 PM)
27
Shift: B
Site 1
(7:31 PM, 8:40
PM)
28
Memorial Day
29
Shift: B
Site 2
(4:21 PM, 4:33
PM)
30 31
25
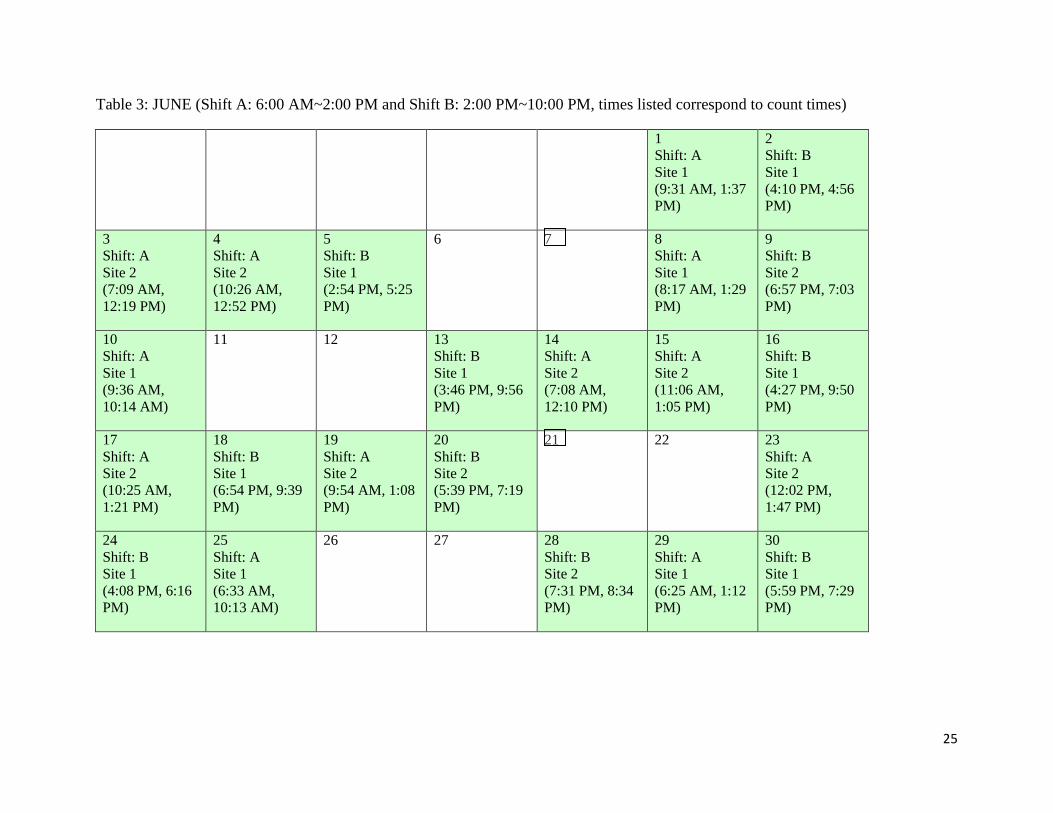
Table 3: JUNE (Shift A: 6:00 AM~2:00 PM and Shift B: 2:00 PM~10:00 PM, times listed correspond to count times)
1
Shift: A
Site 1
(9:31 AM, 1:37
PM)
2
Shift: B
Site 1
(4:10 PM, 4:56
PM)
3
Shift: A
Site 2
(7:09 AM,
12:19 PM)
4
Shift: A
Site 2
(10:26 AM,
12:52 PM)
5
Shift: B
Site 1
(2:54 PM, 5:25
PM)
6 7 8
Shift: A
Site 1
(8:17 AM, 1:29
PM)
9
Shift: B
Site 2
(6:57 PM, 7:03
PM)
10
Shift: A
Site 1
(9:36 AM,
10:14 AM)
11 12 13
Shift: B
Site 1
(3:46 PM, 9:56
PM)
14
Shift: A
Site 2
(7:08 AM,
12:10 PM)
15
Shift: A
Site 2
(11:06 AM,
1:05 PM)
16
Shift: B
Site 1
(4:27 PM, 9:50
PM)
17
Shift: A
Site 2
(10:25 AM,
1:21 PM)
18
Shift: B
Site 1
(6:54 PM, 9:39
PM)
19
Shift: A
Site 2
(9:54 AM, 1:08
PM)
20
Shift: B
Site 2
(5:39 PM, 7:19
PM)
21 22 23
Shift: A
Site 2
(12:02 PM,
1:47 PM)
24
Shift: B
Site 1
(4:08 PM, 6:16
PM)
25
Shift: A
Site 1
(6:33 AM,
10:13 AM)
26 27 28
Shift: B
Site 2
(7:31 PM, 8:34
PM)
29
Shift: A
Site 1
(6:25 AM, 1:12
PM)
30
Shift: B
Site 1
(5:59 PM, 7:29
PM)

26
Table 4: JULY (Shift A: 6:00 AM~2:00 PM and Shift B: 2:00 PM~10:00 PM, times listed correspond to count times)
1
Shift: A
Site 2
(6:11 AM, 8:38
AM)
2
Shift: B
Site 2
(4:20 PM, 6:10
PM)
3
Shift: A
Site 1
(8:50 AM, 8:55
AM)
4
Independence
Day
5 6 7
Shift: A
Site 2
(8:49 AM, 9:26
AM)
8
Shift: B
Site 1
(4:27 PM, 8:28
PM)
9
Shift: B
Site 2
(4:04 PM, 8:26
PM)
10 11 12
Shift: A
Site 1
(10:26 AM,
1:45 PM)
13
Shift: B
Site 2
(3:47 PM, 4:33
PM)
14
Shift: A
Site 2
(8:06 AM, 9:50
AM)
15
Shift: B
Site 1
(3:47 PM, 7:16
PM)
16 17
Shift: A
Site 1
(8:15 AM, 8:22
AM)
18
Shift: B
Site 2
(9:30 PM, 9:49
PM)
19
Shift: B
Site 2
(5:19 PM, 8:58
PM)
20 21
Shift: A
Site 1
(7:26 AM, 9:52
AM)
22
Shift: B
Site 2
(3:37 PM, 7:56
PM)
23 24 25
Shift: B
Site 2
(4:29 PM, 9:03
PM)
26
Shift: A
Site 1
(8:18 AM, 9:12
AM)
27
Shift: B
Site 1
(4:46 PM, 8:25
PM)
28
Shift: A
Site 2
(9:05 AM, 9:58
AM)
29
Shift: B
Site 1
(3:13 PM, 3:15
PM)
30
Shift: B
Site 1
(4:52 PM, 8:52
PM)
31
Shift: A
Site 2
(7:51 AM,
10:08 AM)

27
Table 5: AUGUST (Shift A: 6:00 AM~1:45 PM and Shift B: 1:45 PM~9:30 PM, times listed correspond to count times)
1
Shift: A
Site 2
(6:26 AM, 9:33
AM)
2 3 4
Shift: B
Site 1
(3:33 PM, 4:13
PM)
5
Shift: A
Site 2
(10:13 AM,
1:34 PM)
6
Shift: A
Site 2
(10:16 AM,
1:16 PM)
7
Shift: B
Site 1
(3:54 PM, 8:33
PM)
8 9 10
Shift: A
Site 2
(10:08 AM,
12:59 PM)
11
Shift: B
Site 2
(3:16 PM, 8:55
PM)
12
Shift: A
Site 1
(10:07 AM,
12:36 PM)
13
Shift: A
Site 1
(11:24 AM,
12:48 PM)
14
Shift: B
Site 2
(3:42 PM, 6:05
PM)
15
Shift: A
Site 2
(6:13 AM, 9:35
AM)
16 17 18
Shift: B
Site 1
(4:54 PM, 8:47
PM)
19
Shift: A
Site 2
(10:33 AM,
1:49 PM)
20
Shift: B
Site 1
(5:13 PM, 6:10
PM)
21 22 23
Shift: A
Site 2
(7:52 AM, 9:17
AM)
24
Shift: B
Site 1
(4:07 PM, 6:13
PM)
25
Shift: A
Site 2
(7:49 AM,
12:02 PM)
26
Shift: B
Site 1
(3:49 PM, 5:36
PM)
27 28
Shift: A
Site 2
(8:48 AM, 1:17
PM)
29
Shift: B
Site 1
(4:42 PM, 7:38
PM)
30
Shift: A
Site 1
(10:09 AM,
11:13 AM)
31

28
Table 6: SEPTEMBER (Shift A: 7:00 AM~1:45 PM and Shift B: 1:45 PM~8:30 PM, times listed correspond to count times)
1
Shift: B
Site 1
(2:00 PM, 5:12
PM)
2
Shift: A
Site 2
(7:16 AM,
10:54 AM)
3
Labor Day
4 5 6
Shift: B
Site 1
(3:16 PM, 6:16
PM)
7
Shift: A
Site 2
(8:25 AM,
10:28 AM)
8
Shift: A
Site 2
(7:11 AM,
10:47 AM)
9
Shift: B
Site 1
(5:49 PM, 7:21
PM)
10 11 12
Shift: A
Site 2
(12:02 PM,
1:09 PM)
13
Shift: B
Site 1
(4:07 PM, 5:18
PM)
14
Shift: B
Site 2
(4:11 PM, 6:25
PM)
15
Shift: B
Site 2
(3:26 PM, 6:16
PM)
16
Shift: A
Site 1
(9:08 AM,
11:18 AM)
17 18
Shift: B
Site 2
(2:26 PM, 7:37
PM)
19
Shift: A
Site 1
(8:56 AM,
11:37 AM)
20
Shift: B
Site 2
(2:15 PM, 7:02
PM)
21 22
Shift: A
Site 1
(7:53 AM, 9:27
AM)
23
Shift: B
Site 2
(6:12 PM, 7:53
PM)
24
Shift: B
Site 2
(2:46 PM, 5:05
PM)
25 26 27
Shift: A
Site 1
(10:37 AM,
12:40 PM)
28
Shift: A
Site 2
(8:17 AM,
12:45 PM)
29
Shift: B
Site 2
(2:29 PM, 5:13
PM)
30
Pass day

29
Table 7: *OCTOBER (Shift A: 7:30 AM~4:00 PM and Shift B: 10:30 AM~7:00 PM, times listed correspond to count times)
*Starting in October the clerk worked 4-10 hour shifts rather than 5-8 hour shifts.
1 2 3
Shift: A
Site 1
(8:01 AM,
11:17 AM)
4
Shift: B
Site 1
(2:35 PM, 4:38
PM)
5
Shift: B
Site 2
(3:48 PM, 4:44
PM)
6
Shift: B
Site 1
(2:21 PM, 5:48
PM)
7
Shift: A
Site 2
(10:02 AM,
12:21 PM)
8
Shift: B
Site 2
(4:14 PM, 5:40
PM)
9 10 11 12
Shift: A
Site 2
(8:54 AM, 1:33
PM)
13
Shift: B
Site 2
(1:27 PM, 3:19
PM)
14
Shift: A
Site 1
(10:14 AM,
12:09 PM)
15
Shift: B
Site 1
(1:57 PM, 3:55
PM)
16
Shift: A
Site 2
(9:58 AM,
12:25 PM)
17 18 19 20
Shift: B
Site 1
(4:50 PM, 5:24
PM)
21
Shift: A
Site 2
(7:58 AM,
10:39 AM)
22 23 24
Shift: B
Site 1
(2:07 PM, 5:13
PM)
25
Shift: B
Site 2
(5:05 PM, 6:48
PM)
26 27
Shift: A
Site 1
(8:58 AM,
10:06 AM)
28
Shift: B
Site 2
(1:16 PM, 6:42
PM)
29
Shift: A
Site 2
(12:38 PM,
3:30 PM)
30
Shift: B
Site 1
(1:08 PM, 2:15
PM)
31
Shift: A
Site 2
(9:15 AM,
10:30 AM)

30
Table 8: *DECEMBER (Shift A: 7:00 AM~5:30 PM, times listed correspond to count times)
*Starting in December, due to decreased daylight, the clerk worked one shift rather than two shifts.
1
Site 1
7:11 AM,
12:36 PM
2
Site 2
10:50 AM,
2:21 PM
3
Site 2
1:52 PM, 4:42
PM
4 5 6 7
Site 2
12:50 PM,
4:07 PM
8
Site 2
8:11 AM, 4:22
PM
9
Site 1
9:03 AM, 2:15
PM
10
Site 2
8:46 AM,
11:09 AM
11
Site 1
8:14 AM, 3:07
PM
12 13 14 15
Site 1
11:29 AM,
2:36 PM
16
Site 2
9:15 AM, 1:46
PM
17 18
Site 2
7:29 AM, 1:50
PM
19
Site 1
9:08 AM,
11:56 AM
20 21 22
Site 1
10:27 AM,
3:33 PM
23
Site 2
11:35 AM,
4:33 PM
24
Christmas
25
Christmas
26 27 28 29
Site 2
8:53 AM, 2:15
PM
30
Site 1
8:42 AM,
10:00 AM
31
New Year

31
Table 9: JANUARY (Shift A: 7:00 AM ~ 5:30 PM, times listed correspond to count times)
1
New Year
2 3 4 5
Site 1
8:52 AM, 3:48
PM
6
Site 2
9:20 AM, 1:17
PM
7
Site 2
1:16 PM, 3:10
PM
8
Site 1
8:09 AM,
12:24 PM
9 10 11 12
Site 1
9:09 AM,
12:49 PM
13
Site 2
1:04 PM, 4:42
PM
14 15 16 17
Site 2
10:55 AM,
3:15 PM
18
Site 1
1:26 PM, 3:05
PM
19
Site 2
9:04 AM,
10:51 AM
20
Site 1
11:23 AM,
2:50 PM
21
Martin
Luther
22
Site 1
9:11 AM,
12:55 PM
23 24 25 26
Site 2
1:22 PM, 2:51
PM
27
Site 1
2:52 PM, 3:43
PM
28 29 30
Site 2
10:39 AM,
3:06 PM
31

32
Table 10: *FEBRUARY (Shift A: 7:00 AM~5:00 PM and Shift B: 8:30 AM~6:30 PM, times listed correspond to count times)
*Starting in February, due to increased daylight, the clerk worked two shifts rather than one shift.
1
Shift: B
Site 2
2:41 PM, 5:59
PM
2
Shift: A
Site 2
8:31 AM, 10:48
AM
3
Shift: B
Site 1
2:53 PM, 4:53
PM
4
Shift: A
Site 1
10:55 AM, 12:26
PM
5 6
Shift: B
Site 1
1:19 PM, 5:31
PM
7 8 9
Shift: A
Site 1
8:44 AM, 11:57
AM
10
Shift: B
Site 2
2:39 PM, 4:59
PM
11 12
Shift: A
Site 2
12:03 PM, 3:46
PM
13 14
Shift: A
Site 2
9:25 AM, 11:36
AM
15 16
Shift: B
Site 1
3:00 PM, 4:21
PM
17
Shift: A
Site 1
7:10 AM, 10:18
AM
18
Presidents' Day
19
Shift: B
Site 1
1:21 PM, 4:20
PM
20 21 22 23
Shift: B
Site 2
3:34 PM, 5:34
PM
24
Shift: A
Site 2
8:44 AM, 12:29
PM
25 26 27
Shift: A
Site 1
7:00 AM, 9:15
AM
28

33
Table 11: MARCH (Shift A: 7:00 AM~5:00 PM and Shift B: 8:30 AM~6:30 PM, times listed correspond to count times)
1
Shift: B
Site 1
1:29 PM, 4:13 PM
2
Shift: B
Site 1
3:40 PM, 5:57 PM
3
Shift: A
Site 2
7:07 AM, 11:28
AM
4
Shift: A
Site 1
10:58 AM, 12:46
PM
5 6 7 8
Shift: A
Site 2
7:16 AM, 10:31
AM
9
Shift: B
Site 2
2:48 PM, 5:49 PM
10
Shift: A
Site 1
12:00 PM, 2:27
PM
11 12
Shift: B
Site 1
1:32 PM, 5:30 PM
13 14
Shift: B
Site 2
2:14 PM, 4:42 PM
15 16
Shift: B
Site 1
2:34 PM, 5:00 PM
17
Shift: A
Site 2
9:22 AM, 11:36
AM
18 19 20
Shift: A
Site 1
7:15 AM, 10:47
AM
21 22
Shift: A
Site 2
7:08 AM, 11:47
AM
23
Shift: A
Site 1
7:10 AM, 10:38
AM
24
Shift: B
Site 2
3:14 PM, 5:29 PM
25 26
Shift: B
Site 2
3:45 PM, 5:44 PM
27
Shift: B
Site 2
12:39 PM, 3:00
PM
28 29 30
Shift: A
Site 1
9:01 AM, 10:25
AM
31
Shift: B
Site 2
1:17 PM, 4:51 PM