micro, sono, photocatalytic degradation of eosin b … (co) which is one of the transition metal...
TRANSCRIPT

_____________________________________________________________________________________________________ *Corresponding author: E-mail: [email protected];
American Chemical Science Journal 13(3): 1-13, 2016, Article no.ACSJ.23648
ISSN: 2249-0205
SCIENCEDOMAIN international www.sciencedomain.org
Micro, Sono, Photocatalytic Degradation of Eosin B Using Ferric Oxide Doped with Cobalt
Abeer Sharfalddin1, Eman Alzahrani1 and Mohamad Alamoudi1*
1Department
of Chemistry, Faculty of Science, Taif University, Taif, Kingdom of Saudi Arabia.
Authors’ contributions
This work was carried out in collaboration between all authors. Author MA designed the study, wrote the protocol and wrote the first draft of the manuscript. Authors AS and EA managed the analyses of
the study, performed the statistical analysis, revised the manuscript and managed the literatures review. All authors read and approved the final manuscript.
Article Information
DOI: 10.9734/ACSJ/2016/23648
Editor(s):
(1) Yunjin Yao, School of Chemical Engineering, Hefei University of Technology, Tunxi, Hefei, Anhui, China.
Reviewers:
(1) Anonymous, Jawaharlal Nehru Technological University, Anantapur, India.
(2) Chih-Hung Tsai, National Dong Hwa University, Taiwan.
Complete Peer review History: http://sciencedomain.org/review-history/13662
Received 12th
December 2015 Accepted 12th February 2016
Published 13th
March 2016
ABSTRACT
Eosin B dye is usually used for staining in biology; the stain is harmful if swallowed, smelt, or absorbed through skin. Some researchers have tried to remove it by adsorption, but few have attempted for a complete degradation. In this study, cobalt doped iron oxide (Co-Fe2O3) powders were used to decompose eosin B in a solution. The nanoparticles of Co-Fe2O3 were successfully prepared using microwave-hydrothermal process and characterized using different techniques such as scanning electron microscopy (SEM), transmission electron microscopy (TEM), energy dispersive analysis of X-ray spectroscopy (EDAX), and X ray diffraction analysis (XRD). The images obtained from SEM and TEM analysis revealed that grain size is homogeneous and agglomeration with average size range of about 36.97 nm. A new peak was found in EDAX analysis, which confirmed the presence of Co atom with atomic percentage dopant of nearly 5.73%. The crystal size was 50 nm, calculated by XRD analysis data. The photocatalytic activity was evaluated by the degradation of eosin B under microwave, photocatalytic, soncatalytic, and sonophotocatalytic reactions. The degradation percentages were 78, 82, 83 and 87%, respectively. Thus, sonophotolysis was the optimum method to decompose the dye in solution by this method. In addition, the effects of the pH of solution were obviously examined, and it was found that low pH
Original Research Article

Sharfalddin et al.; ACSJ, 13(3): 1-13, 2016; Article no.ACSJ.23648
2
was a suitable pH for degradation eosin B. The photocatalyst could be reused three times without remarkable loss of its activity.
Keywords: Sonolysis; sonophtocatalysis; ferric oxide; doping with cobalt; microwave.
1. INTRODUCTION Today, many types of dyes have been assimilated into the handbook for dyes called the color index [1,2]. Soluble eosin dyes, for instance, have found increasing operation in ink production. In fact, all conventional red inks are dilute solutions of eosin. Any dye can be classified as cationic, anionic type depending on its structure and properties [3]. Anionic dye, which are called also acidic dyes or reactive dyes, are most problematic in water treatment because they pass through conventional treatment systems unaffected [4]. Eosin B is one of the acidic dyes, which has chemical formula (C20H6Br2N2Na2O9, MW 624.1 g mol
-1), Fig. 1. It used as model due
to it's high reactivity and remarkable risk. Moreover, it is an excellent model component for the characterization of a photocatalytic reactor due to its reactivity only in the presence of both the catalyst and irradiation source, and it is biologically not degradable [5].
O
N+
O-
O
Br Br
O O-
O
O-
N+
O-
O
Fig. 1. Chemical structure of eosin B
Photocatalysis using metal oxides has appeared as a novel destructive technology that can lead to the total decomposition of organic pollutants without harmful by-products at relatively lower costs [6]. Photocatalysts are generally divided into two types; namely, homogeneous catalysts and heterogeneous catalysts [7]. A catalyst is defined as homogeneous if it is present in the same phase as that of the reagents, which means the catalysts are present as solutes in a homogeneous catalytic reaction system. In contrast, a photocatalysts could be heterogeneous if it is present in a different phase than the reaction mixture. The advantages of heterogeneous catalysts are cheap, non-toxic, can be easily separated from the reaction
mixture, and can be reused [2]. An ideal photocatalyst should have good photoactivity, it must be biologically and chemically inert, suitable for absorbing visible or near UV light, it also must be stable to photocorrosion [8].
Among the conventional photocatalysts, iron oxide (Fe2O3) has been paid intensive attention due to its stability, eco-friendly, high efficiency, non-toxic, and inexpensive nature [9]. Fe2O3 has relatively small bandgap (~2.1 eV) that is appropriate for receiving visible light, corresponds well with the solar spectrum [10]. Due to the competition between electron-hole pair recombination, the metal doping is a perfect modification method to prevent that recombination and charge carrier trapping. Nevertheless, an efficient dopant could significantly improve the activity, selectivity, recycling and reproducibility of α-Fe2O3 photo catalyst [11]. Cobalt (Co) which is one of the transition metal ions, can be doped in catalyst resulting in a higher photocatalytic activity compared with undoped Fe2O3. Doping of Fe2O3 with Co can improve its optical activity by narrowing the energy band gap and extend the absorption to visible region [12]. As a result, the electron–hole recombination will be inhibited [13]. The atomic percentage of dopants was fixed based on literature [14,15]. Many methods have been reported for the synthesis of α-Fe2O3 including forced hydrolysis [16], combustion [17], anhydrous solvent [18], wet chemical synthesis [15], and spray pyrolysis [19]. Among them, microwave-hydrothermal method was used for preparation the Fe2O3 and Co-Fe2O3 nanoparticles, which is a combination of hydrothermal and microwave techniques. Introduction of microwaves into a reaction system can result in extremely rapid kinetics for synthesis. This increase in the reaction kinetics, up to two orders of magnitude, was due to the existence of super heating in the solution [20]. In addition, this method saves energy and time, and is environmentally friendly. In this study, the photocatalytic activity was evaluated on the basis of degradation of eosin B under different irradiation sources (microwave, solar, and ultrasound irradiation) in a nearly

Sharfalddin et al.; ACSJ, 13(3): 1-13, 2016; Article no.ACSJ.23648
3
neutral condition without adding any radical initiators and keeping the other parameters constant. Another scope of this project was to confirm the synergistic effect of coupling the both irradiation source (sonophotocatalysis) and set it as available treatment option in case of water purification and complete method to dye removal from the solution.
2. EXPERIMENTAL
2.1 Chemicals and Materials
Eosin B, hydrochloric acid (HCl), and sodium hydroxide (NaOH) were purchased from Acros organics (New Jersey, U.S.A). Nonhydrate ferric nitrate (Fe(NO3)3.9H2O), hexahydrate cobalt nitrate (Co(NO3)2.6H2O), and absolute ethanol (C2H5OH) were purchased from Sigma-Aldrich (Poole, UK). Hexamethylenetetramine (HMT). Distilled water was employed for preparing all the solutions.
2.2 Instrumentals
Sonolysis experiments were performed at ultrasound bath Elma type E 60 (Pforzheim, Germany) with continues wave mode. An UWave-1000 (Microwave, Ultrasonic, and Ultraviolet) was from Sineo Microwave Chemistry Technology Co., Ltd was used to generate microwave energy (Shanghai, China). Solar meter from CEM Corporation (North Carolina, U.S.A). A centrifuge from Hettich (Kirchlengern, Germany). A Scholar 171 magnetic stirrer plate from Corning stirrer (Tewksbury, U.S.A). An oven came from F.LLI GALLI company (Milano, Italy). The pH of the solution was adjusted by HCl solution and NaOH solution with EutECH instrument pH meter (Ayer Rajah Crescent-Singapore). The dye absorbance was collected by UV-Vis spectrophotometer came from Thermo Scientific™ GENESYS 10S (Toronto, Canada). The transmission electron microscopy (TEM) was from JEOL Ltd. (Welwyn Garden City, UK), and the scanning electron microscope (SEM) and energy dispersive analysis of X-ray spectroscopy (EDAX) were a Cambridge S360 from Cambridge Instruments (Cambridge, UK). An X-ray diffraction (XRD) using Co Kα radiation (XRD) equipment from Rigaku Ltd. (Ettlingen, Germany).
2.3 Preparation of Co-Fe2O3 Nano-particles
The nanoparticles were prepared by microwave-hydrothermal method using a typical procedure
described in our previous work [21]. Briefly, 4.05 g of Fe(NO3)3.9H2O and 1.2 g of hexamethylenetetramine (HMT) were dissolved in 30 mL of distilled water and ethanol mixture (1:1, v/v) with vigorous stirring (1100 rpm) until completely dissolved. Then, 2.32 g of Co (NO3)2.6H2O was added to the mixture with constant stirring. After 30 min, the mixture was transferred into a Teflon-lined stainless-steel autoclave. The autoclaves were placed in the a microwave (Mars), the oven temperature was increased to 160°C within 25 min and then the temperature was maintained for 90 min, the mixture was left to cool down to room temperature. The resulting precipitate was collected by centrifugation and washed with a solution of distilled water and ethanol. Finally, the prepared nanoparticles were dried in an oven at 60°C for 24h. The undoped Fe2O3 was prepared with same procedure to compare the characterization results. 2.4 Evaluation of Photocatalytic Activity Eosin B was used as a probe molecule to investigate the activity of Co-Fe2O3. All the degradation reactions were carried out according to the following procedure; 300 mg of Co-Fe2O3 was added to 250 mL of the dye aqueous solution (5×10⁻⁵M) that was placed in a cylindrical glass vessel. Before exposed to the solar-light or other irradiation, the suspension was magnetically stirred at 500 rpm for 30 min in the dark to get the adsorption-desorption equilibrium between photo catalyst and the dye. After that, the catalytic reaction was triggered by the irradiation source with constant magnetic stirring during the reaction process, 5 mL of the suspension was taken out from mixture solution at 20 min intervals, centrifuged (4000 rpm for 15 min) to remove the photocatalyst powder. The concentration of the residual dye was analyzed using a UV-Visible spectrophotometer at wavelength range of 350-800 nm.
The microwave experiment was carried out in the UWave-1000 device, the microwave radiation was discontinuous or intermittent to keep the working temperature (30°C) below the boiling points of either solvent or solute to avoid material loss and the thermal effect of microwave.
The sonolysis reactions were performed in a ultrasound bath (500 W) with continuous wave mode. The bath temperature (30°C) was maintained by adding ice and the bottom of the vessel was placed at the bottom of the bath. The

Sharfalddin et al.; ACSJ, 13(3): 1-13, 2016; Article no.ACSJ.23648
4
solar and sonophotocatalytic reactions were performed on a house roof in Taif between 11 a.m. to 1 p.m. The intensity of solar radiation was (1150 W m
-2) measured by solar meter. It
fluctuated during the reaction even under a clear sky. However, we kept the photocatalysis and sonophotocatalysis experiments under identical conditions by carrying out the experiments simultaneously, side by side, thus making it possible to compare the results of photodegradation. The degradation ratio of the dye (η) was calculated by the equation given below [22]:
� =�� − �
��× 100 =
�� − �
��× 100
where Co and C are the initial and any time concentration of the dye, respectively. The parameters Ao and A are the absorbance of eosin B solutions at 518 nm wavelength at initial and any time, respectively [23]. 3. RESULTS AND DISCUSSION 3.1 Characterization of Co-Fe2O3
3.1.1 SEM/ EDAX analysis Fig. 2 shows the scanning electron microscopy (SEM) images and the energy dispersive spectroscopy (EDAX) patterns for Fe2O3 and Co-Fe2O3 powder. The micrographs demonstrate that the grain size was homogeneous, polygonal, and agglomerates. The agglomeration is ascribed to the removal of nanostructure-stabilizing ions by washing with water [24]. Moreover, it simply represents that each grain was formed by aggregation of a number of nanocrystals. There was no differences in morphology can be observed by comparing the micrographs. The EDAX results confirm that iron and oxygen elements give strong signals, and there was a new peak in Co-Fe2O3 pattern which represents the Co. There was no trace of any other impurity that could be seen within the detection limit of the EDAX patterns. The Co atomic percentage dopants were nearly with 5.73%. 3.1.2 TEM analysis TEM analysis is another important analysis for the morphologies and microstructures of the fabricated materials, Fig. 3 shows the images
before (Fe2O3) and after doping (Co-Fe2O3). They show a cubic shaped particles with a sharp-edged square morphology and high disparity, uniformity, which were achieved by using this route. Fig. 3 (d) reveals that Co-Fe2O3 maintain the cubic particles structure of the undoped Fe2O3. The monodispersed particles had an average size range of about 33.3 nm for Fe2O3
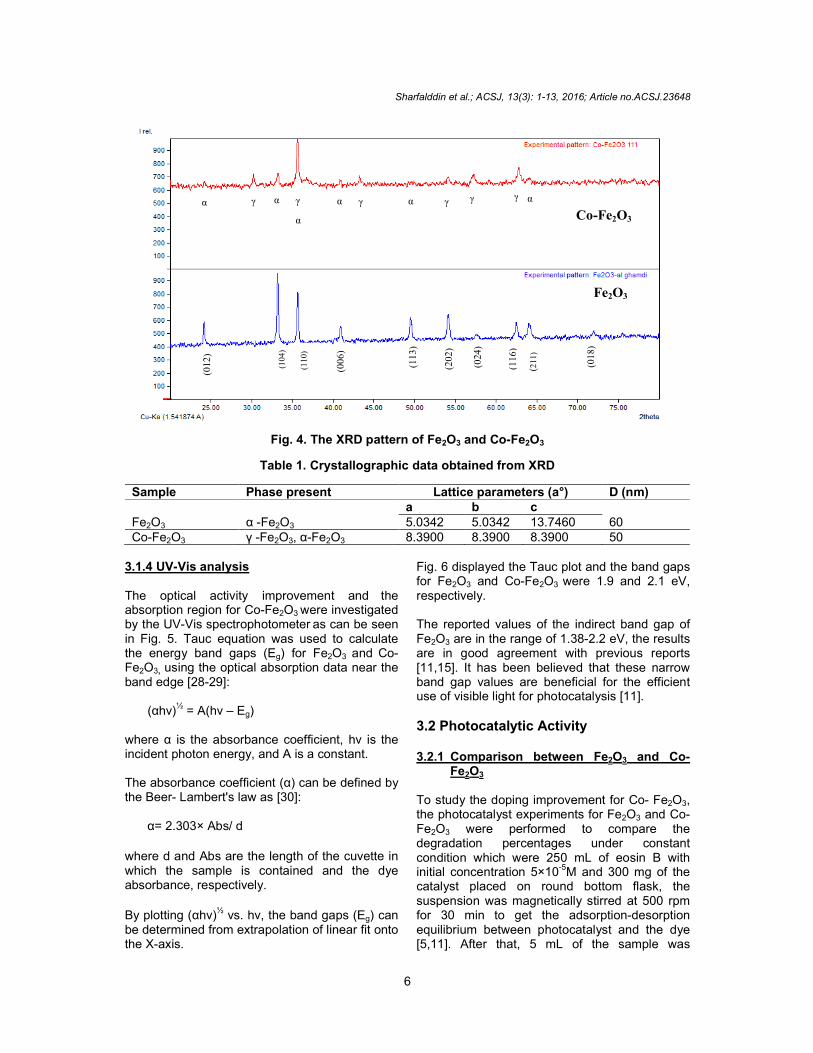
and 36.97 nm for Co-Fe2O3. The size increase is due to Co doping in the Fe2O3 lattice. The same results were obtained by Suresh et al., the Co-Fe2O3 nano spheres maintained the morphology of the pure α-Fe2O3 prepared by hydrolysis method with size range of 60-90 nm [14]. Moreover, the cubic Cu-doped Fe2O3 which was prepared hydrothermally by Sun et al. [25] maintained the shape of the cubic pure Fe2O3 was synthesized by that method. 3.1.3 XRD analysis X-ray diffraction measurements were taken in the range of 2θ = 20–80° for the photocatalysts Fe2O3, and Co–Fe2O3 synthesized by microwave-hydrothermal method and were shown in Fig. 4. For the undoped sample, all the diffraction peaks matched well with the standard ICSD code No. 066756 for pure α-Fe2O3 reflection, it revealed that the synthesized α-Fe2O3 has a rhombohedral structure with R ̄3c space group.
In the case of Co doped sample, it is clear to observe a coexistence of cubic maghemite (γ- Fe2O3) and hematite (α-Fe2O3) phases by the presence of diffraction peaks at 30.20° (corresponding to the (220) plane), 35.67° (311), 43.21° (400), 54.04°(422) and 57.19°(511) of the γ -phase and the diffraction peaks at 33.23° (104), 35.67°(110), 40.87°(113), 49.55°(024), and 64.04°(300) of the α-phase [26,27]. However, no phase containing Co additive was observed within the detection limit of the apparatus. The XRD peaks of pure α-Fe2O3 and Co-Fe2O3 were shown broadening indicating the ultrafine nature of the particles [14]. The average crystallite size of pure α-Fe2O3 and Co-doped Fe2O3 was calculated by Scherer's formula using the most intense diffraction peak [25,27] :
�=�.��
�cos θ
Where D is the crystallite size, λ is the wave length of the X-rays, β is the broadening of the diffraction peak and θ is the diffraction angle. The estimated crystallite size of pure α-Fe2O3 is 60 nm and that of Co-Fe2O3 is 50 nm. It can be

Sharfalddin et al.; ACSJ, 13(3): 1-13, 2016; Article no.ACSJ.23648
5
found that the crystallite size of the Co-Fe2O3 turns smaller, which means that the addition of Co2+ can effectively annihilate the α-Fe2O3 crystalline grain growth, this was a good
agreement with some works [14,25]. The values of lattice constants, phase present and crystallite size of Fe2O3 and Co-Fe2O3 were listed in Table 1.
Fig. 2. SEM images and EDAX spectra for Fe2O3 (A), and Co-Fe2O3 (B)
(A)
(B)
(C)
(D)
Fig. 3. TEM images of Fe2O3 (A, C), and TEM images of Co-Fe2O3 (B, D)
Sharfalddin et al.; ACSJ, 13(3): 1-13, 2016; Article no.ACSJ.23648
6
Fig. 4. The XRD pattern of Fe2O3 and Co-Fe2O3
Table 1. Crystallographic data obtained from XRD
Sample Phase present Lattice parameters (a°) D (nm)
Fe2O3 α -Fe2O3
a b c 60 5.0342 5.0342 13.7460
Co-Fe2O3 γ -Fe2O3, α-Fe2O3 8.3900 8.3900 8.3900 50
3.1.4 UV-Vis analysis The optical activity improvement and the
absorption region for Co-Fe2O3 were investigated
by the UV-Vis spectrophotometer as can be seen in Fig. 5. Tauc equation was used to calculate the energy band gaps (Eg) for Fe2O3 and Co-Fe2O3, using the optical absorption data near the band edge [28-29]:
(αhν)½ = A(hν – Eg)
where α is the absorbance coefficient, hν is the incident photon energy, and A is a constant. The absorbance coefficient (α) can be defined by the Beer- Lambert's law as [30]:
α= 2.303× Abs/ d
where d and Abs are the length of the cuvette in which the sample is contained and the dye absorbance, respectively. By plotting (αhν)½ vs. hν, the band gaps (Eg) can be determined from extrapolation of linear fit onto the X-axis.
Fig. 6 displayed the Tauc plot and the band gaps for Fe2O3 and Co-Fe2O3 were 1.9 and 2.1 eV, respectively. The reported values of the indirect band gap of Fe2O3 are in the range of 1.38-2.2 eV, the results are in good agreement with previous reports [11,15]. It has been believed that these narrow band gap values are beneficial for the efficient use of visible light for photocatalysis [11].
3.2 Photocatalytic Activity 3.2.1 Comparison between Fe2O3 and Co-
Fe2O3
To study the doping improvement for Co- Fe2O3, the photocatalyst experiments for Fe2O3 and Co-Fe2O3 were performed to compare the degradation percentages under constant condition which were 250 mL of eosin B with initial concentration 5×10⁻⁵M and 300 mg of the catalyst placed on round bottom flask, the suspension was magnetically stirred at 500 rpm for 30 min to get the adsorption-desorption equilibrium between photocatalyst and the dye [5,11]. After that, 5 mL of the sample was
γ γ γ α
α
γ γ α γ α α α
(006
)
(012
)
(104
)
(110
)
(116
)
(211
)
(018
)
(202
)
(024
)
(113
)
Co-Fe2O3
Fe2O3

Sharfalddin et al.; ACSJ, 13(3): 1-13, 2016; Article no.ACSJ.23648
7
taken out from the solution at 20 min intervals, and the absorbance of each sample was measured using UV-Vis spectrophotometer. Fig. 7 represents the comparison UV-Vis spectra of the photocatalysis reactions for Fe2O3 and Co-Fe2O3. It was found that the degradation
percentage were 20.5%, 82% for Fe2O3 and Co-Fe2O3, respectively. Clearly, they indicated that doping with Co2+ ion can improve the activity for Fe2O3 almost four times than undoped catalyst.
Fig. 5. The UV-Vis spectra for Fe2O3 (A) and Co–Fe2O3 (B)
Fig. 6. Tauc plots for Fe2O3 and Co-Fe2O3
Fig. 7. The UV-Vis spectra for photocatalysis reaction (A) Fe2O3, and (B) Co-Fe2O3
B A

Sharfalddin et al.; ACSJ, 13(3): 1-13, 2016; Article no.ACSJ.23648
8
3.2.2 Dark adsorption of Co-Fe2O3
Dark adsorption study was carried out to know how much adsorption was resulted by Co-Fe2O3 in absence of any irradiation. The reaction was carried out for 140 min by the same method mentioned above. Fig. 8 shows the removal percentage of eosin B in the dark. It was found that there was a decrease in the dye concentration in the presence of the catalyst, that decreasing in dye concentration was due to adsorption of the dye molecules on the catalyst surface. As soon as the catalyst was added, the dye in the solution was adsorbed on the surface of the catalyst and led to decrease of the dye concentration. After 80 min the removal percentage was mostly constant, this is because of the monolayer formation on the catalyst surface. After monolayer formation, there were no free active sites available for further adsorption so no more decreasing was observed in the UV-Vis spectra. A strong adsorption should favor the oxidation of the organic molecules. Hence, the amount of adsorbed eosin B is proportional to the active surface and its connection allows the electron transfer under irradiation. These results are in good agreement with many reports [5,31]. The concentration of eosin B adsorbed on the surface was calculated from the difference between the initial and equilibrium (no more decrease with time) concentrations [5], 78.8% of the dye was adsorbed in 180 min. 3.2.3 Evaluation of photocatalytic activity In order to investigate the photocatalytic activity of the Co-Fe2O3 powder, the experiments were conducted using the same method of photocatalytic activity that were used for dark adsorption, which were 250 mL of the dye solution (5×10⁻⁵M) and 300 mg of the catalyst. The experimental solutions were first exposed to microwave, solar, ultrasound, and coupled irradiation (solar and ultrasound), each experiment was done for 140 min separately, side by side under identical condition, thus making the results comparable. Fig. 9 exhibits the photocatalytic degradation percentages of eosin B in various processes. The degradation percentages through the process of microwave, soncatalytic, photocatalytic, and son photocatalytic reaction were 79, 83, 82, 87%, respectively. Clearly seen, sonophotocatalytic degradation exhibits the
highest photocatalytic degradation among the various irradiation sources under similar experimental conditions. It was known that microwave irradiation excites polar molecules to cause them to rotate and vibrate back and forth rapidly [32], the improvement of photocatalytic activity by microwave irradiation can be attributed to the polarization effect of the catalyst, that increases the transition probability of photon-generated electrons and the electron-hole recombination on the semiconductor surface [33,34]. Moreover, the effect of microwave radiation to enhance the photo oxidation for cracking molecular bonds is mainly attributed to nonthermal interactions with the Co-Fe2O3 particle surface [35]. Hence, it does not generate the active radicals as ·OH radicals, this can explain the low degradation percentage. Use of solar irradiation has improved the photocatalsis activity of Co-Fe2O3 and 82% of eosin B was removed comparing with Co-Fe2O3 synthesis by co-precipitation, 59.67% of AR-27 dye was degraded after 90 mins under visible irradiation [11], thus the photocatalyst had high effectivity. Both in photocatalysis and sonocatalysis, the dye was degraded mainly through the generation of ·OH radical. In sonocatalysis, active species such as ·OH can be generated by sonication of pure water under extreme conditions created by collision of cavitation bubbles. While photocatalysis process the ·OH radicals are generated by solar radiation by photo excite the catalyst. The combined effect in sonophotocatalysis increases the amount of reactive radical species thus activate oxidation of dye molecules [36]. The beneficial effect of coupling photocatalysis with sonolysis may be attributed to several reasons, namely increased production of hydroxyl radicals in the reaction mixture, and enhanced mass transfer of organics between the liquid phase and the catalyst surface [37]. In addition, catalyst excitation by ultrasound-induced luminescence, which has a wide wavelength range below 375 nm [38,39], and increased catalytic activity through decrease the size of the photocatalyst and the aggregation of particles due to the effect of sonication which leading to an increase in surface area and thus the catalytic performance.

Sharfalddin et al.; ACSJ, 13(3): 1-13, 2016; Article no.ACSJ.23648
9
Fig. 8. The removal percentage of eosin B in the dark
Fig. 9. The degradation percentages of eosin B under microwave, solar, Ultrasound, and sonophotocatalysis irradiation
The possible mechanisms of the dyes degradation by photocatalysis reaction can be explained by the following: The bottom of conduction band and the top of valence band (CB and VB) of Fe2O3 in aqueous solution were located at -4.78 and -6.98 eV, respectively based on the literature [40]. When the photo catalyst Co-Fe2O3 was exposed to light irradiation, the electrons can be promoted from VB to CB. At this juncture, the dopant Co
2+ ions
can function as a photo-generated hole and trap, inhibiting the recombination of hole–electron, as described by equations below:
Fe2O3 +hv → e- + h + (charge pair generation)
Co2+
+ e-
cb → Co+ (electron trap)
Co+ + O2(ads) → Co
2+ + O2
.- (electron release)
Co2+ + h +vb → Co3+ (hole trap)
Co3+ + OH- → Co2+ + .OH (hole release)
Co2+ ions react as electron holes and trap, which then form Co
+ and Co
3+, which are
relatively unstable as compared to Co2+ ions. These ions react with oxygen and hydroxyl ions adsorbed onto the catalytic surface to produce hydroxyl radicals and superoxide (O2
.-) radicals, which enhance the oxidation of the pollutant.
3.2.4 Effect of pH
Generally, the pH of solution is an practically important in waste water treatment and is a key factor affecting the photocatalytic degradation process of organic compounds [11]. Since it could change the surface charge of the catalyst, thus the adsorption performance of organic molecules on the catalyst surface could be changed. Moreover, the molecular structure of the organic dye can be influenced when pH solution changes and becomes easier to decompose.

Sharfalddin et al.; ACSJ, 13(3): 1-13, 2016; Article no.ACSJ.23648
10
To study the effect of pH of the solution on the photo degradation of the dye, the experiments were carried out in a range of pH (1, 3, 6, 9, and 12). The initial dye concentration was 5×10
-5M
and the catalyst concentration was 300 mg, which were kept constant. The photo degradation percentages are displayed in Fig. 10. Eosin B shows higher degradation percentage in acidic media (pH=1). This can be explained on the basis of zero point charge (pzc) of Fe2O3 [41]. Therefore, the surface of Fe2O3 is positively charged below the pzc and negatively charged above the pzc. From the experiments, it was found that the optimum pH solution to degrade eosin B was 1, this is due to the electrostatic attraction between the dye molecules and positive Co–Fe2O3 surface is very high. Hence, more molecules are adsorbed on the surface of the photocatalyst [5,11]. The decrease of photo degradation at high alkaline pH is due to the electrostatic repulsion between the negatively charged molecules and the photocatalyst. Moreover, due to the presence of high amounts of ·OH radicals, the radical–radical reactions take place at higher pH values. This deactivation phenomenon at higher pH values is also previously reported [42].
3.2.5 Photo degradation kinetics
The kinetics for degradation of eosin B was investigated under sonophotocatalysis conditions. The reaction rate for sonophotocatalytic reactions are independent of hydroxyl concentration [43]. Therefore, a pseudo first-order kinetic model was used to fit the experimental data:
��(�/��) = −��
In which Co and C are the dye concentrations at 0 and t time, respectively, and K is the expected pseudo-first-order rate constant. Fig. 11 shows the plot of –In [C/C0] vs. time. It was found that it is linear and the fairness of the fit is indicated by the fact that linear regression (R
2) values are
always greater than 0.890. Therefore, the model is in good agreement with the experimental data. The rate constant k (s-1) for eosin B and R2 under various irradiation sources were indicated in Table 2. The value of k for sonophotocatalytic was 0.754 S-1, it interpreted that sonophotocatalysis is the optimum method for eosin B degradation by Co-Fe2O3.
3.3 Catalyst Reuse Recycling experiments were conducted at photo catalyst conditions (300 mg of the catalyst, 250 mL of eosin B and using solar irradiation) to evaluate stability and reusability of the photo catalyst. After the completion of each cycle, the catalyst was collected, dried and then reused for the next cycle. The results are provided in Fig. 12. It was found that the photo degradation of eosin B reaches 60.7% after the third reuse, which is slightly lower than the first reuse (82%). This is due to loss of catalyst during washing and existence of Co
+2 ion on the
surface of the catalyst even after the completion of third cycles [11]. Thus, the photocatalyst is stable and effective for the degradation of dyes in water.
Fig. 10. Sonophotocatalytic degradation at pH (1, 3, 6, 9, and 12)

Sharfalddin et al.; ACSJ, 13(3): 1-13, 2016; Article no.ACSJ.23648
11
Fig. 11. Kinetics of eosin B sonophotodegradation
Table 2. Pseudo first order rate constant K(S-1
) and R2 values for Eosin B
The reaction Rate constant K (S-1) R2
Microwave 0.587 0.941 Sonocatalysis 0.433 0.987 Photocatalysis 0.601 0.943 Sonophotocatalysis 0.754 0.997
Fig. 12. Degradation of eosin B in three cycles
4. CONCLUSION It was found that doping by Co
+2 strongly
modified the photocatalytic property of Fe2O3 nanoparticles. Preliminary tests and characterizations shown that as-synthesized nanophotocatalysis had good photocatalytic activity in degradation. The effect of different irradiations source were indicated that sonphotolysis was the greatest method for eosin B degradation, almost (87%) of the dye had been degraded in 140 min in presence of Co-Fe2O3 under reaction experimental conditions. Moreover, it indicated that acidic solution (low pH) was favorable for eosin B degradation. The kinetic data fitted well with the pseudo first-order
model; the rate constant for sonophotocatalytic reaction was 0.75 s
-1, which represents good
efficiency.
COMPETING INTERESTS Authors have declared that no competing interests exist.
REFERENCES 1. Garg VK, et al. Basic dye (methylene blue)
removal from simulated wastewater by adsorption using Indian Rosewood sawdust: a timber industry waste. Dyes and Pigments. 2004;63(3):243-250.

Sharfalddin et al.; ACSJ, 13(3): 1-13, 2016; Article no.ACSJ.23648
12
2. Abe R, et al. Preparation of porous niobium oxides by soft-chemical process and their photocatalytic activity. Chemistry of Materials. 1997;9(10):2179-2184.
3. Mottaleb MA, Littlejohn D. Application of an HPLC-FTIR modified thermospray interface for analysis of dye samples. Analytical Sciences. 2001;17(3):429-434.
4. Moran C, Hall M, Howell R. Effects of sewage treatment on textile effluent. Journal of the Society of Dyers and Colourists. 1997;113(10):272-274.
5. Zhou S, Ray AK. Kinetic studies for photocatalytic degradation of eosin B on a thin film of titanium dioxide. Industrial & Engineering Chemistry Research. 2003; 42(24):6020-6033.
6. Oyama T, et al. Remediation of aquatic environments contaminated with hydro-philic and lipophilic pharmaceuticals by TiO2 photoassisted ozonation. Journal of Environmental Chemical Engineering. 2014;2(1):84-89.
7. Mishra M, Chun D-M. α-Fe2O3 as a photocatalytic material: A review. Applied Catalysis A: General. 2015;498(0):126-141.
8. Bhatkhande DS, Pangarkar VG, Beenackers AA. Photocatalytic degrada-tion for environmental applications– A review. Journal of Chemical Technology and Biotechnology. 2002;77(1):102-116.
9. Barroso M, et al. The role of cobalt phosphate in enhancing the photocatalytic activity of α-Fe2O3 toward water oxidation. Journal of the American Chemical Society. 2011;133(38):14868-14871.
10. Ke D, et al. CdS/regenerated cellulose nanocomposite films for highly efficient photocatalytic H2 production under visible light irradiation. The Journal of Physical Chemistry C. 2009;113(36):16021-16026.
11. Satheesh R, et al. Visible light responsive photocatalytic applications of transition metal (M = Cu, Ni and Co) doped α-Fe2O3 nanoparticles. Journal of Environmental Chemistry Engineering. 2014;2(4):1956-1968.
12. Chirita M, et al. Fe2O3 nanoparticles, physical properties and their photo-chemical and photoelectrochemical applications. Chem. Bull. 2009;54(1).
13. Pozan GS, Isleyen M, Gokcen S. Transition metal coated TiO2 nanoparticles: Synthesis, characterization and their photocatalytic activity. Applied Catalysis B: Environmental. 2013;140:537-545.
14. Suresh R, et al. Facile synthesis of cobalt doped hematite nanospheres: Magnetic and their electrochemical sensing properties. Materials Chemistry and Physics. 2012;134(2):590-596.
15. Chakrabarti S, Mandal S, Chaudhuri S. Cobalt doped γ-Fe2O3 nanoparticles: synthesis and magnetic properties. Nanotechnology. 2005;16(4):506.
16. Chen M, et al. Preparation of akaganeite nanorods and their transformation to sphere shape hematite. Journal of Nanoscience and Nano-technology. 2008; 8(8):3942-3948.
17. Hiremath VA, Venkataraman A. Dielectric, electrical and infrared studies of γ-Fe2O3 prepared by combustion method. Bulletin of Materials Science. 2003;26(4):391-396.
18. Houas A, et al. Photocatalytic degradation pathway of methylene blue in water. Applied Catalysis B: Environmental. 2001; 31(2):145-157.
19. Qian Y, et al. Preparation and characteri-zation of iron (III) oxide films by a novel spray pyrolysis method. Journal of Solid State Chemistry. 1991;92(1):208-212.
20. Sreeja V, Joy P. Microwave–hydrothermal synthesis of γ-Fe2O3 nanoparticles and their magnetic properties. Materials Research Bulletin. 2007;42(8):1570-1576.
21. Alzahrani E, Sharfalddin A, Alamodi M. Microwave-Hydrothermal synthesis of ferric oxide doped with cobalt. Advances in Nanoparticles. 2015;4(02):53.
22. Salehi M, Hashemipour H, Mirzaee M. Experimental study of influencing factors and kinetics in catalytic removal of methylene blue with TiO2 Nanopowder. American Journal of Environmental Engineering. 2012;2(1):1-7.
23. Horikoshi S, Serpone N. Coupled microwave/photoassisted methods for environmental remediation. Molecules. 2014;19(11):18102-18128.
24. Kaiwen Z, et al. Nanocrystalline LaFeO3 preparation and thermal process of precursor. Adv. Powder Technol. 2013;24: 359–367.
25. Sun P, et al. Cu-doped α-Fe2O3 hierar-chical microcubes: Synthesis and gas sensing properties. Sensors and Actua-tors B: Chemical. 2014;193:616-622.
26. Phu N, et al. Crystallization process and magnetic properties of amorphous iron oxide nanoparticles. Journal of Physics D: Applied Physics. 2011;44(34):345002.

Sharfalddin et al.; ACSJ, 13(3): 1-13, 2016; Article no.ACSJ.23648
13
27. Sahoo S, et al. Characterization of γ-and α-Fe2O3 nano powders synthesized by emulsion precipitation-calcination route and rheological behaviour of α-Fe2O3. International Journal of Engineering, Science and Technology. 2010;2(8).
28. Bhar SK, et al. Synthesis of nanocrystalline iron oxide ultrathin films by thermal decomposition of iron nitropruside: structural and optical properties. Materials Research Bulletin. 2010;45(12):1948-1953.
29. Diamandescu L, et al. Structural and photocatalytic properties of iron-and europium-doped TiO2 nanoparticles obtained under hydrothermal conditions. Materials Chemistry and Physics. 2008; 112(1):146-153.
30. Ghobadi N. Band gap determination using absorption spectrum fitting procedure. International Nano Letters. 2013;3(1):1-4.
31. Bellal B, Trari M, Afalfiz A. Synthesis and characterization of CdS/CuAl2O4 core–shell: Application to photocatalytic eosin degradation. Applied Nanoscience. 2014;1-8.
32. Park SH, et al. Assessment of microwave/UV/O3 in the photo-catalytic degradation of bromothymol blue in aqueous nano TiO2 particles dispersions. Nanoscale Research Letters. 2010;5(10): 1627-1632.
33. Horikoshi S, et al. Microwave-specific effects in various TiO2 specimens. Dielectric properties and degradation of 4-chlorophenol. The Journal of Physical Chemistry C. 2009;113(14):5649-5657.
34. Kataoka S, et al. Photocatalytic oxidation in the presence of microwave irradiation: Observations with ethylene and water. Journal of Photochemistry and Photo-biology A: Chemistry. 2002;148(1):323-330.
35. Jou C-JG, et al. Microwave-assisted photocatalytic degradation of
trichloroethylene using titanium dioxide. Environmental Engineering Science. 2008; 25(7):975-980.
36. Kaur S, Singh V. Visible light induced sonophotocatalytic degradation of Reactive Red dye 198 using dye sensitized TiO2. Ultrasonics Sonochemistry. 2007;14(5): 531-537.
37. Bali U. Application of Box–Wilson experi-mental design method for the photodegradation of textile dyestuff with UV/H2O2 process. Dyes and Pigments. 2004;60(3):187-195.
38. Shimizu N, et al. Sonocatalytic degradation of methylene blue with TiO2 pellets in water. Ultrasonics Sonochemistry. 2007;14(2): 184-190.
39. Wang J, et al. Sonocatalytic degradation of methyl parathion in the presence of nanometer and ordinary anatase titanium dioxide catalysts and comparison of their sonocatalytic abilities. Ultrasonics Sonochemistry. 2006;13(6):493-500.
40. Zhang H, et al. Preparation of Fe
2O3/SrTiO3 composite powders and their photocatalytic properties. Journal of Physics and Chemistry of Solids. 2007; 68(2):280-283.
41. Al-Qaradawi S, Salman SR. Photocatalytic degradation of methyl orange as a model compound. Journal of Photochemistry and Photobiology A: Chemistry. 2002;148(1): 161-168.
42. Ashraf SS, Rauf MA, Alhadrami S. Degradation of Methyl Red using Fenton's reagent and the effect of various salts. Dyes and Pigments. 2006;69(1):74-78.
43. Guettai N, Amar HA. Photocatalytic oxidation of methyl orange in presence of titanium dioxide in aqueous suspension. Part I: Parametric study. Desalination. 2005;185(1):427-437.
_________________________________________________________________________________ © 2016 Sharfalddin et al.; This is an Open Access article distributed under the terms of the Creative Commons Attribution License (http://creativecommons.org/licenses/by/4.0), which permits unrestricted use, distribution, and reproduction in any medium, provided the original work is properly cited.
Peer-review history:
The peer review history for this paper can be accessed here: http://sciencedomain.org/review-history/13662